Social Indicators Overview Making a difference... and knowing it.
39
Social Indicators Social Indicators Overview Overview Making a difference ... and knowing it
-
Upload
valeria-spack -
Category
Documents
-
view
216 -
download
1
Transcript of Social Indicators Overview Making a difference... and knowing it.
Social Indicators Social Indicators OverviewOverview
Making a difference ...and knowing it

Outline of conversation:
• What are indicators?
• Why should we care?
• What can they tell us?
• Who's part of the global movement?
• How can we make data more exciting?
• Where can we find out more?
• When will this guy stop talking?
“If we could first know where we are and whither we are tending, we could better judge what to do,
and how to do it …”
– Abraham Lincoln

“In some ways, the best news for Jacksonville is the [Quality of Life Progress] Report itself.
The very premise of the report, and of JCCI, is the belief in Jacksonville as a community where the problems of some are the responsibility of everyone.”
–The Florida Times-Union

“What gets measured, gets done.”
– Jacksonville Mayor John Peyton

What is an Indicator?
A number which describesdescribes a condition
A measurement that tells a tells a storystory
Data that inspire action

Understanding numbers• Bit = basic unit of measurement of information• Byte = Sequence of 8 bits• Kilobyte = 1,024 bytes• Megabyte = 1,024 kilobytes• Gigabyte = 1,024 megabytes• Terabyte = 1,024 gigabytes• Petabyte = 1,024 terabytes • Exabyte = 1,024 petabytes, or 185,620,362,241,702,000,000
bytes
We created 161 exabytes of data last year.
That’s more than the number of stars in 2 BILLION galaxies.


Planning councils Planning councils use indicators to:use indicators to:
• address community issues• assess community initiatives• shape policy and resource decisions• raise community awareness
The Social The Social Indicators Initiative Indicators Initiative
is designed to:is designed to:• provide tools to address issues• share impacts of initiatives• shape policy and resource decisions• raise national awareness

Social Indicators Social Indicators Initiative outcomes:Initiative outcomes:
• Forums and Conferences• 2002 “From the Bottom Up” report• www.socialindicators.com• 2005 Leading Social Indicators report• 2006 Social Indicators report update


•

FormatFormatNational trendline
State variancesLocal trend-bending initiatives
Data, links, and additional information
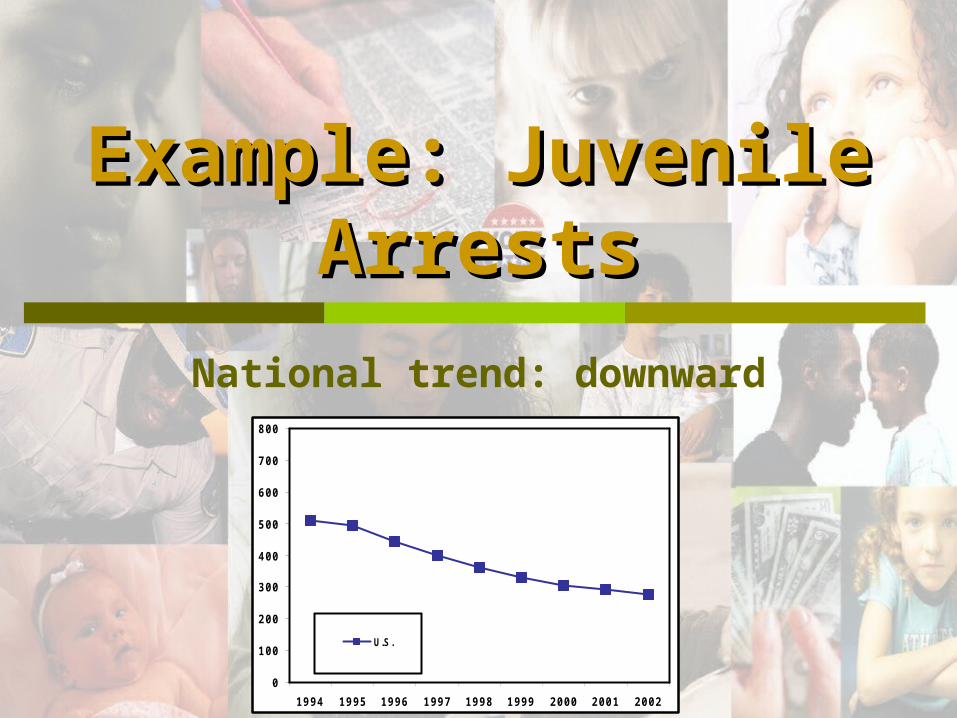
Example: Juvenile Example: Juvenile ArrestsArrests
National trend: downward
0
100
200
300
400
500
600
700
800
1994 1995 1996 1997 1998 1999 2000 2001 2002
U.S .

Story: Northern Story: Northern California Council for California Council for
the Communitythe CommunityKeeping Youth Safe: A Report on
Violence PreventionCommunity collaboration
Increased after-school programmingJob training
Community involvement

Story: Northern Story: Northern California Council for California Council for
the Communitythe Community
Local trend: downward, faster
0
100
200
300
400
500
600
700
800
1994 1995 1996 1997 1998 1999 2000 2001 2002
U.S .
Bay A re a

Story: Community Story: Community Council of Greater Council of Greater
DallasDallasDallas County Youth Development
ProgramCommunity Vision
85,000 hours after-school prevention services
Community involvement

Story: Community Story: Community Council of Greater Council of Greater
DallasDallasLocal trend: now below U.S. average
0
100
200
300
400
500
600
700
800
1994 1995 1996 1997 1998 1999 2000 2001 2002
U.S .
Bay A re a
DallasC o u n ty
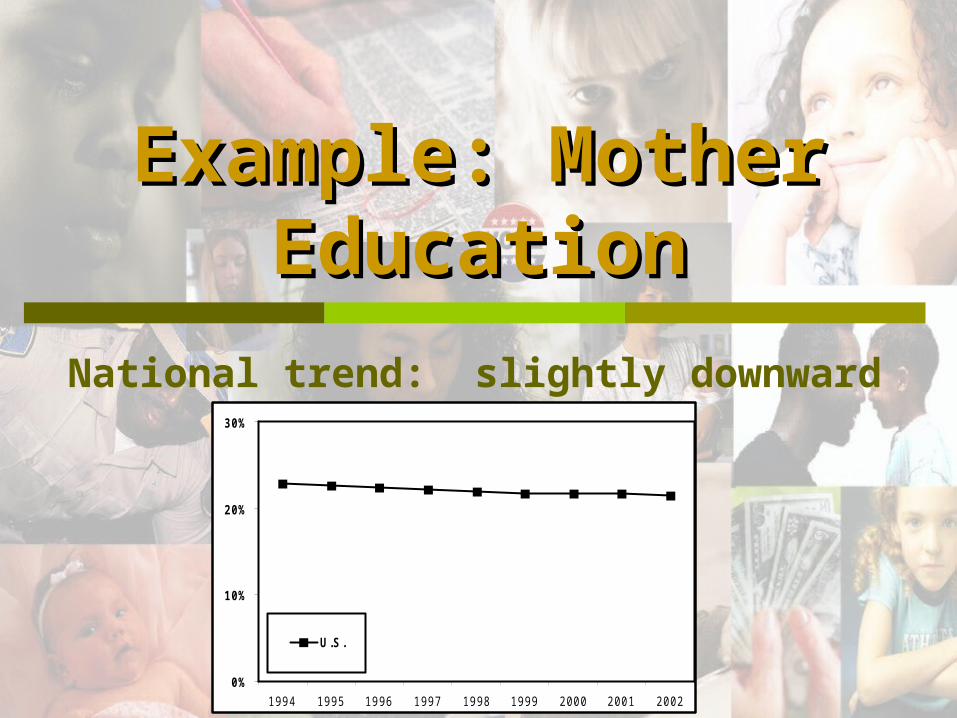
Example: Mother Example: Mother EducationEducation
National trend: slightly downward
0%
10%
20%
30%
1994 1995 1996 1997 1998 1999 2000 2001 2002
U .S .

Story: Community Story: Community Services Planning Services Planning
Council, Sacramento Council, Sacramento CaliforniaCalifornia
Teenage Pregnancy Community Health Plan
Teen Pregnancy Prevention Committee
Collaboration among high schools, teen parent programs, after school
program providers, hospitals, educators
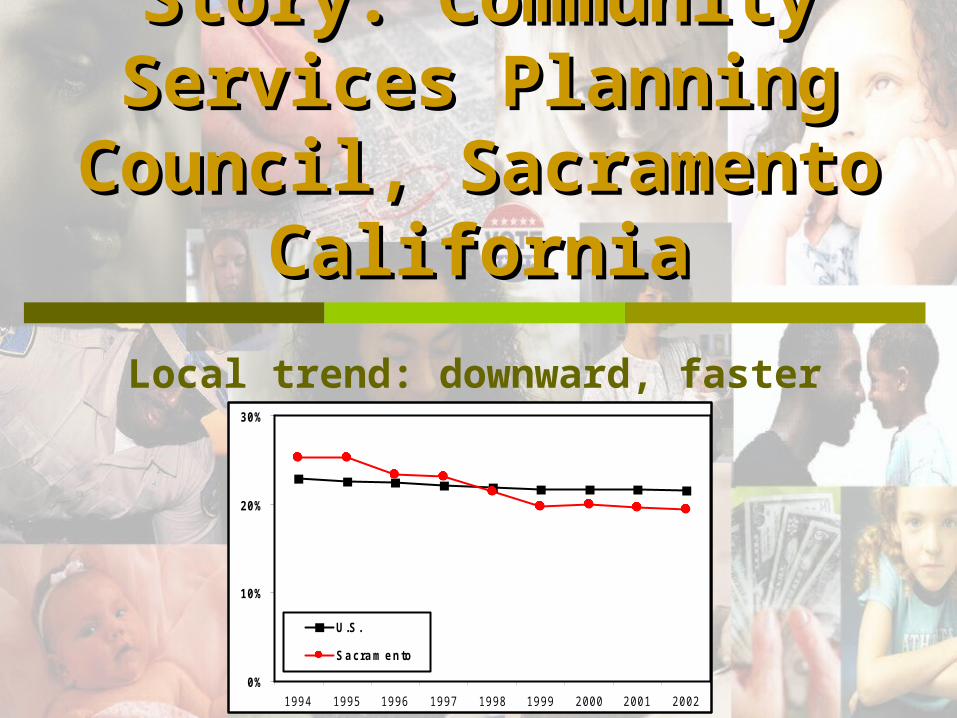
Story: Community Story: Community Services Planning Services Planning
Council, Sacramento Council, Sacramento CaliforniaCalifornia
Local trend: downward, faster
0%
10%
20%
30%
1994 1995 1996 1997 1998 1999 2000 2001 2002
U .S .
S a c ra m e nto

Story: Center for Story: Center for Community Solutions, Community Solutions,
Cleveland OhioCleveland Ohio
LEAP (Learning, Earning, and Parenting program)
DePaul Young Parent ProgramGRADS (Graduation, reality, and Dual-
Skills program)

Story: Center for Story: Center for Community Solutions, Community Solutions,
Cleveland OhioCleveland Ohio
Cleveland trend: Reverse trendline
0%
10%
20%
30%
40%
1994 1995 1996 1997 1998 1999 2000 2001 2002
U .S .S a c ra m e nto
C le ve la nd
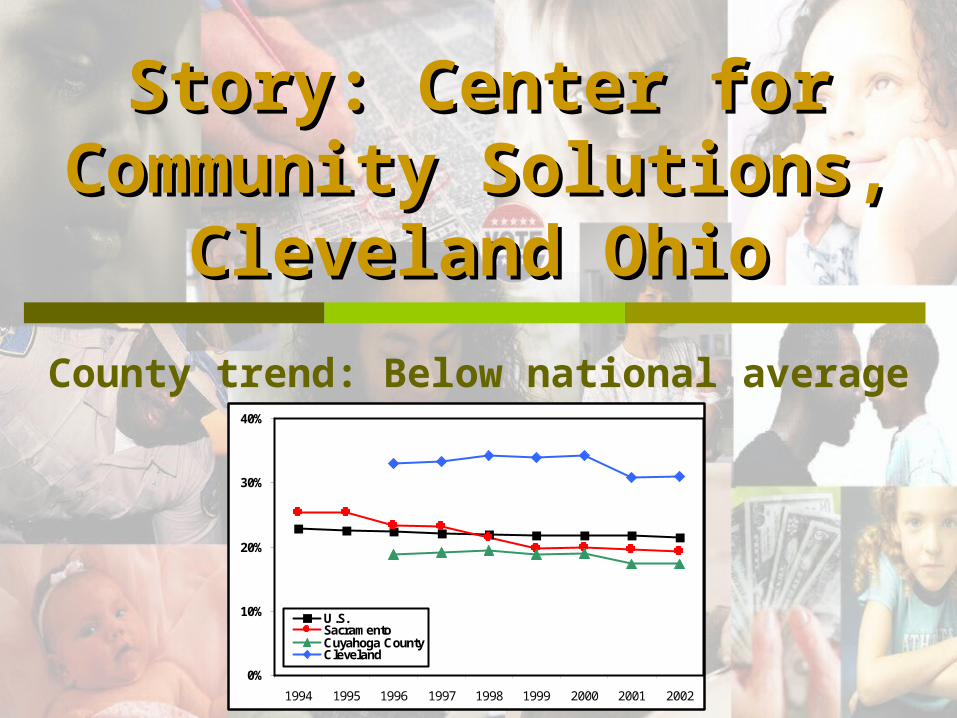
Story: Center for Story: Center for Community Solutions, Community Solutions,
Cleveland OhioCleveland Ohio
County trend: Below national average
0%
10%
20%
30%
40%
1994 1995 1996 1997 1998 1999 2000 2001 2002
U.S.SacramentoCuyahoga CountyCleveland
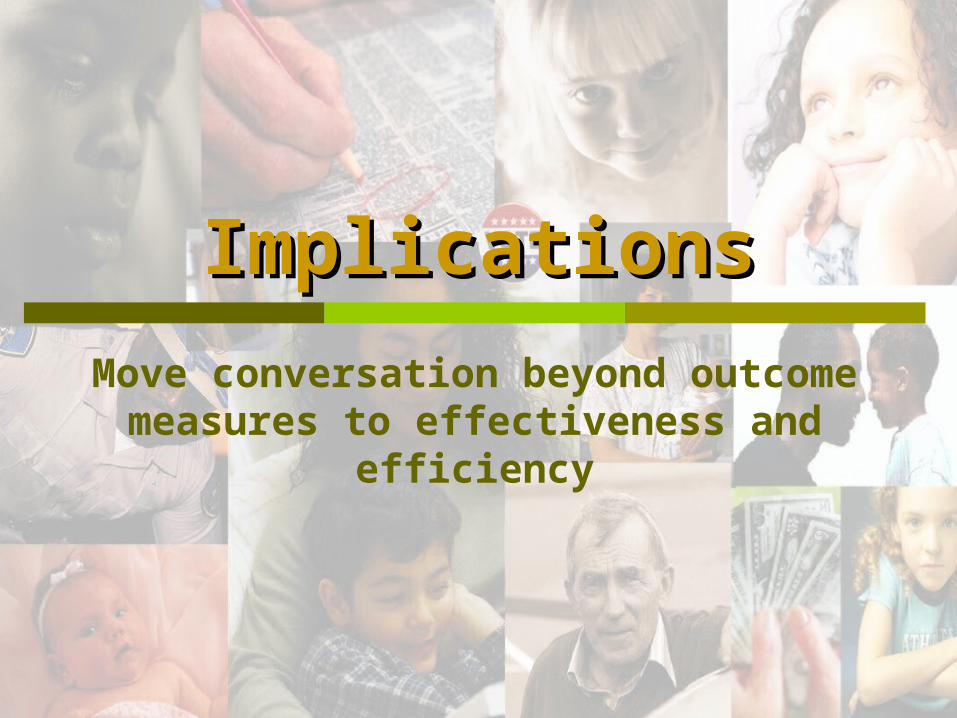
ImplicationsImplicationsMove conversation beyond outcome
measures to effectiveness and efficiency

Making data more exciting:
Housing prices

Making data more exciting:
Housing prices
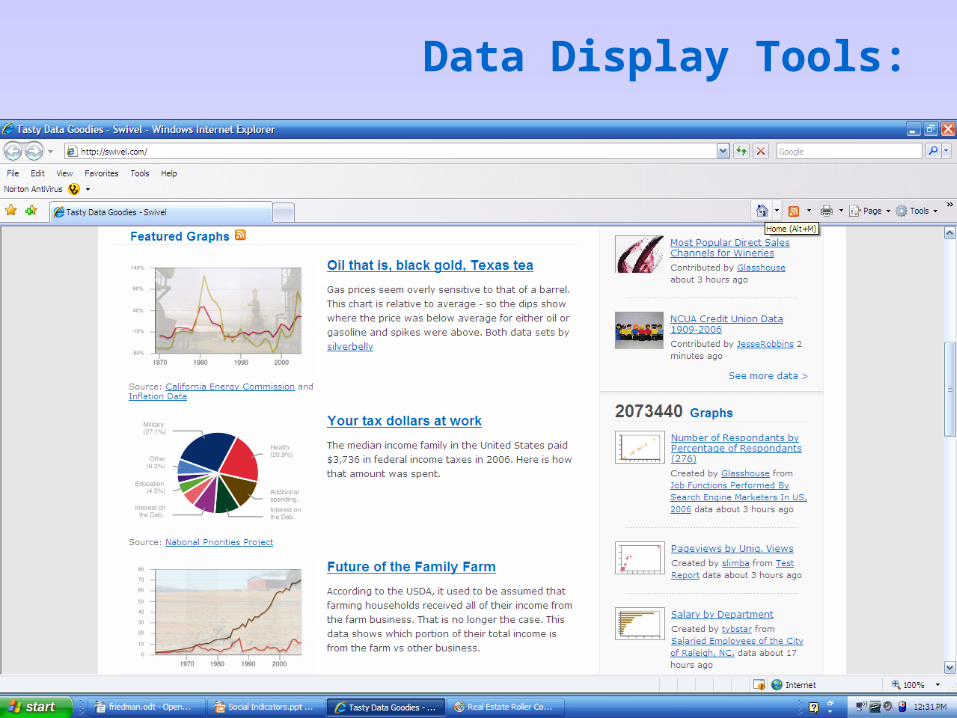
Data Display Tools:
Gapminder
Many Eyes
Swivel

Data Display Tools:
Gapminder
Many Eyes
Swivel

Data Display Tools:
Gapminder
Many Eyes
Swivel
Data Display Tools:
Gapminder
Many Eyes
Swivel
“Knowledge is in every country the surest basis of public happiness. In one in
which the measures of government receive their
impressions so immediately from the sense of the
community as in ours it is proportionably essential.”
-- George Washington
For the latest in indicators news, check
communityindicators.blogspot.com

Leading Social Leading Social IndicatorsIndicators
Measuring what’s importantMaking a difference
and knowing it
Thank you.www.socialindicators.com