Social housing in England: a survey - IFS housing in England: a survey. ... Economic rationales for...
29
Social housing in England: a survey Stuart Adam Daniel Chandler Andrew Hood Robert Joyce IFS Briefing Note BN178
Transcript of Social housing in England: a survey - IFS housing in England: a survey. ... Economic rationales for...

Social housing in England: a survey
Stuart Adam Daniel Chandler Andrew Hood Robert Joyce
IFS Briefing Note BN178

© Institute for Fiscal Studies, 2015 1
Social housing in England: a survey1
Stuart Adam, Daniel Chandler, Andrew Hood and Robert Joyce
Institute for Fiscal Studies
© The Institute for Fiscal Studies, November 2015 ISBN: 978-1-911102-00-7
1. Introduction
Social housing refers to rented housing provided by local authorities (LAs) and housing associations (HAs), typically at sub-market rents. LA housing is often referred to as ‘council housing’. HAs are not-for-profit bodies that provide low-cost housing. They are technically designated as private sector institutions but receive significant subsidy from the public sector, tied to new housing construction (see Box 1 later for a brief overview and history of HAs).
This briefing note provides an overview of the social housing system. Except where stated otherwise, it focuses on the system in operation in
1 The authors gratefully acknowledge funding from Trust for London and co-funding from the ESRC-funded Centre for the Microeconomic Analysis of Public Policy at the Institute for Fiscal Studies (grant number ES/M010147/1). Trust for London is a charitable organisation that exists to reduce poverty and inequality in London (more information is available at http://www.trustforlondon.org.uk).
The authors are very grateful for help and advice from their colleagues James Browne, Paul Johnson and Barra Roantree and for many helpful comments from Mubin Haq and Steve Kerr at Trust for London. They are also grateful to the project Advisory Group: Katy Baldwin, Hilary Burkitt, David Evans, Geoff Fimister, Mubin Haq, John Hills, Steve Kerr, Rachel Leeser, Sara Mahmoud, Neil McCall, Roderick Tate, Chris Tracey, Christine Whitehead and Miranda Worthington. Any errors and omissions are the responsibility of the authors.
Data from the Family Resources Survey (FRS) were made available by the Department for Work and Pensions (DWP), which bears no responsibility for the interpretation of the data in this briefing note. The Family Expenditure Survey (FES) is Crown copyright material and is reproduced with the permission of the Controller of HMSO and the Queen’s Printer for Scotland. It is available from the UK Data Service (http://ukdataservice.ac.uk/). The UK Data Service and the original owners of the data (DWP in the case of the FRS; the Office for National Statistics in the case of the FES) bear no responsibility for their further analysis or interpretation.

© Institute for Fiscal Studies, 2015
2
England: many of the institutional and policy details differ in the other nations of the UK, and a full treatment of those is beyond the scope of this survey. However, some of the basic facts about social housing can be provided at a Great Britain or UK level, and we do that where possible (making clear the distinction).
This note accompanies a detailed report analysing the choice over the level of rents charged to tenants in the social housing sector.2 Chapter 2 of that report, which provides some necessary policy and institutional background, is essentially just an abridged version of this briefing note.
We start with a summary of the three core functions of social housing (Section 2): subsidising rents for households deemed in sufficient need, subsidising or directly undertaking new housing construction, and allowing government to regulate and/or directly provide landlord services.
In subsequent sections, we look in turn at various aspects of the social housing system: how it is financed; how it is allocated to tenants and on what terms; the size of the sector; the characteristics of social tenants; rents within the sector; and the role of housing benefit for social tenants. We include a description of the current system and, in various places, a brief historical overview. We also comment on how things look set to evolve in the coming years.
2. The different functions of social housing
The social housing system in the UK combines at least three functions, which are typically justified in different ways and address distinct problems.3
The provision of housing at sub-market rents is one central purpose of social housing. Sub-market rents are one of two main ways in which the state provides support for the cost of rented housing, alongside housing 2 S. Adam, D. Chandler, A. Hood and R. Joyce, Social Rents Policy: Choices and Trade-Offs, Institute for Fiscal Studies, London, 2015, http://www.ifs.org.uk/publications/8036.
3 For a discussion of the economic rationale behind the different elements of social housing, see C. M. E. Whitehead, ‘The economics of social housing’, in T. O’Sullivan and K. Gibb (eds), Housing Economics and Public Policy, Wiley-Blackwell, Oxford, 2002.

© Institute for Fiscal Studies, 2015
3
benefit (HB). In other words, this role of social housing is most plausibly born out of distributional or equity concerns. A detailed report published alongside this briefing note looks specifically at this function of social housing and sets out the trade-offs associated with the choice of how much to subsidise renting in this way.4
In addition to providing a mechanism for delivering subsidised housing, social housing allows the state to act as landlord (in the case of LA housing) and to regulate the relationship between landlords and tenants in the HA sector. This ‘landlord’ function of social housing allows the state to control, for example, the terms of tenancies and the provision of maintenance and other services in a more direct way than in the private rented sector, or to overcome the need for regulation by direct provision. Economic rationales for government intervention in what landlords do might be based on the idea that there are asymmetries of information between landlords and tenants. In the absence of intervention, these could lead to inefficiency – for example, landlords maintaining properties less than they otherwise would, because some of the effects of that maintenance are not visible to prospective tenants and therefore cannot be priced into the rent. Alternatively, there may be a distributional motivation for intervention. For example, if it is costly for tenants to search for and/or move to a new property, this could give landlords ‘market power’: they may choose to neglect maintenance issues that arise mid-tenancy which they would otherwise have had to address. Preventing such neglect may effectively transfer resources (in this example, the cost of maintaining a property well) to tenants that would otherwise have been extracted by their landlords.5
Finally, the social housing sector is the primary route by which the state has subsidised new construction. Economic arguments for government intervention to increase investment in construction typically point to various reasons why, left alone, the private sector might invest less in 4 S. Adam, D. Chandler, A. Hood and R. Joyce, Social Rents Policy: Choices and Trade-Offs, Institute for Fiscal Studies, London, 2015, http://www.ifs.org.uk/publications/8036.
5 Alternatively, asymmetries of information and/or market power could favour tenants. For example, landlords might not be able to keep perfect track of how well tenants are maintaining their property and/or it can be costly or legally prohibited for landlords to change tenants.

© Institute for Fiscal Studies, 2015
4
housing than is desirable from a social perspective. For example, financial markets may be imperfect, and this might hold private investment in housing below its desired level. Or society may place a higher value than private individuals on benefits that lie far in the future – such as the benefits to future generations of having a high-quality housing stock. Investment in new social housing is one way of generating higher levels of investment.
The relative priority of these different roles has changed over time: in the 1950s and 1960s, improving the quantity and quality of the housing stock was a prominent objective of social housing policy, whereas improving the affordability of housing for those on low incomes now seems to take priority.
Although these distinct roles of social housing in the UK are typically bundled together, in principle they are separable. For example, the state could abdicate its role as builder while maintaining its role as landlord and rent-setter by purchasing private properties and letting them at sub-market rents. Alternatively, the state could continue subsidising rents without being a landlord or builder – as is largely the case in Germany, where sub-market rents are delivered through tax concessions and direct subsidies to private landlords, and as is currently done in the UK private rented sector through HB.6 Equally, the state could continue to build housing and to provide and/or regulate the activities of landlords, even if social rents were increased to market levels. Indeed, there are international examples of social housing at market, or even above-market, rents – notably from Sweden and the Netherlands.
Hence, in principle, one can think about the appropriate level of social rents, of government investment in construction and of regulation of landlord services as separate issues. In practice, though, the way that the institutions of social housing are structured in the UK means that there are important potential interactions between these factors that do need to be borne in mind. For example, the level of rents is an important determinant
6 Page 24 of J. Hills, Ends and Means: The Future Roles of Social Housing in England, CASEreport 34, 2007, http://eprints.lse.ac.uk/5568/1/Ends_and_Means_The_future_roles_of_social_housing_in_England_1.pdf.

© Institute for Fiscal Studies, 2015
5
of the income of social landlords and hence the extent of investment in new supply.
3. Social housing finance
Housing associations have to raise revenues, largely through rents, that are sufficient to cover their direct costs in terms of management, maintenance and debt servicing. HAs are non-profit organisations, so any revenues over and above these costs must be reinvested in social housing. The financial situation of LAs is similar, in that LAs’ housing budgets (known as the Housing Revenue Account, HRA) are ring-fenced from the rest of LAs’ budgets: the direct costs of providing social housing must be covered by revenues (largely rents) from within their housing budget, and LAs cannot transfer any surplus revenues out of their HRA.
Prior to 2012, the system of LA financing was different. LAs received an additional source of revenue in the form of a so-called ‘HRA subsidy’ from central government. This covered the difference between an LA’s assumed (rather than actual) costs and revenues, based on assumptions about things such as rent levels and the cost of servicing debt in that LA (in cases where assumed revenues exceeded assumed costs, LAs instead paid an amount back to the government, i.e. they received a ‘negative subsidy’). The HRA subsidy system was essentially a way of evening out the funds available to different LAs for spending on things other than debt servicing – for historical reasons, some LAs had larger debt servicing costs than others. The Localism Act 2011 effectively redistributed debts between LAs with the aim of removing the need for revenue subsidies. Hence, LAs are now ‘self-financing’ in terms of their day-to-day spending and revenues.
Social landlords are able to provide direct rent subsidies because their direct costs are typically much lower than the revenue they would get if they charged market rents. Key reasons for this are that (i) the state has a long history of providing grants for the construction of new social housing, resulting in lower debt servicing costs for social housing providers; (ii) rapid house price inflation since much of the debt was taken on has increased the gap between market rent levels and debt servicing costs; and (iii) much of the social housing stock is sufficiently old that debts have been paid off.

© Institute for Fiscal Studies, 2015
6
New investment for both LAs and HAs is typically funded through a combination of central government grants, loans from private sources, and surplus revenues. There has been a long-term shift – accelerated under the coalition government – away from central government grant funding and towards a combination of loans and revenue funding for new development. A key constraint on borrowing capacity is the ability to cover interest payments through (expected) income on future rents. As such, rent levels are important not just for day-to-day spending but also for the borrowing necessary to build new stock.7 LAs’ borrowing is, in addition, subject to centrally-imposed limits.8 This, combined with the fact that – until recently – LAs have not been eligible for grant funding, explains the precipitous decline in new construction by LAs in the 1980s and its (partial) replacement by construction led by HAs.
4. Allocation and security of tenure
For many people, being in social housing would be a more attractive option than renting or owner-occupying in the private sector – not least because it confers a large and potentially permanent rent subsidy (though there may be other reasons too, such as the security of tenure – see below). This means that local authorities and housing associations must decide who should be granted access to this scarce resource. The degree of rationing required is, of course, dependent on the balance of demand and supply, which varies significantly across the country.
Access is determined by social landlords primarily on the basis of applicants’ assessed need. Legislation requires that certain groups are given ‘reasonable preference’ by LAs, including the homeless, those living in overcrowded or unsanitary conditions, and those who need to move for medical reasons; and HAs must offer some lettings to LA-approved
7 See chapter 4 of P. Reeves, Affordable and Social Housing: Policy and Practice, Routledge, London, 2014.
8 These limits were loosened slightly following the introduction of local authority self-financing in 2012. See W. Wilson and A. Bate, ‘Local housing authorities – the self-financing regime: progress and issues’, House of Commons Library Standard Note SN/SP/6776, 2015.

© Institute for Fiscal Studies, 2015
7
applicants.9 Beyond these requirements, LAs and HAs have considerable freedom to determine who is qualified to apply for social housing and the relative priority given to different applicants.
Until 2012, there was a legal requirement to let most social housing on ‘the most secure form of tenure possible’. As a result, almost all current social tenancies are ‘secure tenancies’. Perhaps the most significant feature of secure tenancies is that they are lifetime tenancies: they are granted for an unlimited duration without any form of periodic review.
The Localism Act 2011 allowed social housing providers to offer fixed-term tenancies in England, typically for at least five years. Providers now have discretion over what type of tenancy to offer to whom. The rationale for fixed-term tenancies is that social housing is a scarce public resource that should be ‘focused on those who need it most, for as long as they need it’.10 Put another way, as social tenants’ circumstances change over time, so should their entitlement to the benefits of social housing. In 2013–14, 12% of new social tenancies in England were let on a fixed-term basis, taking the total number of fixed-term tenancy agreements made in 2012–13 and 2013–14 to around 2% of the total social housing stock.11 In the July 2015 Budget, the government announced plans to review, and ultimately limit, the use of lifetime tenancies.
5. The size of the social sector
The size and composition of the social housing sector have changed significantly over the past half-century. Large-scale public investment after
9 Legislation also prohibits LAs from considering certain applicants who are ineligible on account of their immigration status: see W. Wilson, ‘EEA migrants: access to social housing (England)’, House of Commons Library Briefing Paper 04737, 2015.
10 Department for Communities and Local Government, Local Decisions: A Fairer Future for Social Housing, 2010.
11 Source: Number of new lettings from table 1a and number of fixed-term tenancies from table 2b in Department for Communities and Local Government (DCLG), ‘CORE summary tables: 2013 to 2014’, https://www.gov.uk/government/statistics/social-housing-lettings-in-england-april-2013-to-march-2014. Total social housing dwelling stock in England at the end of 2013–14 (31 March 2014) from DCLG, ‘Dwelling stock estimates: 2014, England’, https://www.gov.uk/government/uploads/system/uploads/attachment_data/file/423249/Dwelling_Stock_Estimates_2014_England.pdf.
https://www.gov.uk/government/statistics/social-housing-lettings-in-england-april-2013-to-march-2014

© Institute for Fiscal Studies, 2015
8
Figure 1. Percentage of the population of Great Britain living in social housing
Note: Total population includes children. Years are calendar years to 1992 and financial years from 1993 onwards (where 1993 refers to the financial year 1993–94). Estimates are based on pooled three-year samples (e.g. the ‘1969’ data point is actually based on data from 1968, 1969 and 1970) up to and including 1993, and single years of data thereafter. Source: Family Expenditure Survey and Family Resources Survey, various years.
the Second World War saw a massive expansion of the sector, with the proportion of households living in social housing rising from around one in ten in 1939 to a peak of almost one in three by the early 1980s.12 As shown by Figure 1, which covers all of Great Britain, the size of the social rented sector has declined steadily since then. By 2011, the proportion of the population in the social sector stood at around 16%, less than half its peak of around one-third in the early 1980s.
There has also been a marked shift within the social housing sector away from local authority or ‘council’ housing, towards housing provided by housing associations. Starting from a very low base, HAs have come to house about half of social renters (and about 8% of the population). Box 1 contains a brief history of HAs and a discussion of the reasons behind their growth.
The decline in the overall size of the sector has been driven by two major factors. First, there has been a massive flow of properties out of the LA sector under the Right to Buy, which was introduced in 1980 and gave
12 DCLG live table 801, ‘Household characteristics: tenure trend’, https://www.gov.uk/government/uploads/system/uploads/attachment_data/file/11816/141491.xls.
0%
5%
10%
15%
20%
25%
30%
35%
40%
19
69
19
71
19
73
19
75
19
77
19
79
19
81
19
83
19
85
19
87
19
89
19
91
19
93
19
95
19
97
19
99
20
01
20
03
20
05
20
07
20
09
20
11
20
13
Per
cent
age
of
tota
l po
pula
tio
n
Local authority Housing association

© Institute for Fiscal Studies, 2015
9
Box 1. A brief overview and history of housing associations
Housing associations are private sector not-for-profit bodies that provide rental homes at sub-market rents, made possible by public subsidy on the cost of new homes.
The sector is heavily regulated. Central government effectively largely determines rent levels and mandates certain quality standards. Governance and financial viability are currently regulated by the Greater London Authority in London, the Homes and Communities Agency in the rest of England, the Scottish Government, the Welsh Government and the Northern Ireland Housing Executive.
HAs in some form have a long history stretching back to the almshouse movement, but they began to develop in a more recognisable form during the 19th century as charitable bodies providing housing for those in need. It was not until the 1980s, though, that they started to play a sizeable role in the overall provision of social housing.
The 1980s saw two changes that propelled the growth of HAs. First, HAs emerged as the preferred alternative to LA development of new social housing. Sharp cuts in government spending on housing and strict limits on the ability of LAs to borrow meant that new building by LAs declined rapidly. In contrast, from 1989 HAs were allowed to borrow outside of the public borrowing and accounting regime.
The second factor underlying the expansion of HAs was the Large Scale Voluntary Transfer (LSVT) programme (introduced via the 1985 Housing Act), which allowed for local authority housing stock to be transferred en masse to (typically newly-created) HAs. The LSVT programme had a number of aims, including bringing in private finance to tackle accumulated backlogs of repairs without increasing public borrowing, and bringing (presumed) private sector efficiencies into the sector. Since 1988, 1.3 million homes have been transferred to HAs in this way.a
a A. Heywood, ‘Investing in social housing: a guide to the development of the affordable housing sector’,
Housing Finance Corporation, 2013, http://www.thfcorp.com/investing/investing-in-social-housing.pdf.
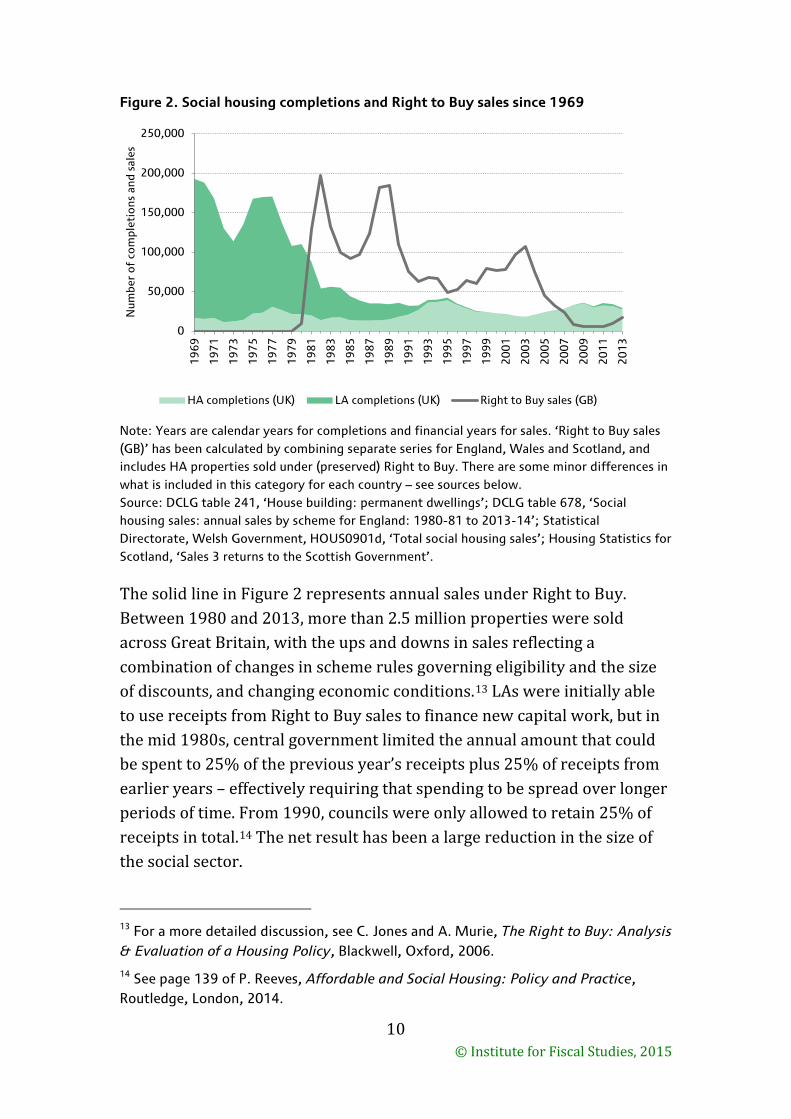
tenants in LA housing the right to purchase their home at a heavily discounted price. Second, over and above the fact that not all the proceeds from Right to Buy were used to replace the sold-off housing, there was a large decline in construction of new social housing relative to previous levels after large cuts to grants from central government.
Figure 2 illustrates the impact of these policies. The solid area represents construction of new social housing: construction by LAs had almost completely ceased by the early 1990s, to be replaced only very partially by more new construction by HAs. Completions of new social housing fell from almost 150,000 per year in the 1970s to around 33,000 per year in the 1990s and 25,000 per year in the 2000s.
© Institute for Fiscal Studies, 2015
10
Figure 2. Social housing completions and Right to Buy sales since 1969
Note: Years are calendar years for completions and financial years for sales. ‘Right to Buy sales (GB)’ has been calculated by combining separate series for England, Wales and Scotland, and includes HA properties sold under (preserved) Right to Buy. There are some minor differences in what is included in this category for each country – see sources below. Source: DCLG table 241, ‘House building: permanent dwellings’; DCLG table 678, ‘Social housing sales: annual sales by scheme for England: 1980-81 to 2013-14’; Statistical Directorate, Welsh Government, HOUS0901d, ‘Total social housing sales’; Housing Statistics for Scotland, ‘Sales 3 returns to the Scottish Government’.
The solid line in Figure 2 represents annual sales under Right to Buy. Between 1980 and 2013, more than 2.5 million properties were sold across Great Britain, with the ups and downs in sales reflecting a combination of changes in scheme rules governing eligibility and the size of discounts, and changing economic conditions.13 LAs were initially able to use receipts from Right to Buy sales to finance new capital work, but in the mid 1980s, central government limited the annual amount that could be spent to 25% of the previous year’s receipts plus 25% of receipts from earlier years – effectively requiring that spending to be spread over longer periods of time. From 1990, councils were only allowed to retain 25% of receipts in total.14 The net result has been a large reduction in the size of the social sector.
13 For a more detailed discussion, see C. Jones and A. Murie, The Right to Buy: Analysis & Evaluation of a Housing Policy, Blackwell, Oxford, 2006.
14 See page 139 of P. Reeves, Affordable and Social Housing: Policy and Practice, Routledge, London, 2014.
0
50,000
100,000
150,000
200,000
250,000
19
69
19
71
19
73
19
75
19
77
19
79
19
81
19
83
19
85
19
87
19
89
19
91
19
93
19
95
19
97
19
99
20
01
20
03
20
05
20
07
20
09
20
11
20
13
Num
ber
of
com
plet
ions
and
sal
es
HA completions (UK) LA completions (UK) Right to Buy sales (GB)

© Institute for Fiscal Studies, 2015
11
Recent policy developments are also likely to have implications for the future evolution of the size of the social housing sector. These are now briefly summarised.
Current developments: new supply
The previous (coalition) government significantly reduced capital investment in new social housing. Total capital funding in England between 2011–12 and 2014–15 was set at £4.7 billion, compared with £9.3 billion between 2008–09 and 2010–11 – a 63% real-terms reduction in average annual capital spending. The Spending Review 2013 announced plans to spend £3.2 billion (including proceeds from Right to Buy – see below) from 2015–16 to 2017–18 – a further reduction in annual spending of 7% in real terms.15 (All figures are given in 2015–16 prices.)
At the same time, the coalition introduced a new framework for allocating capital grants in England, known as the Affordable Homes Programme (AHP). This is set to continue under the new Conservative government. The AHP aims to increase the number of new homes that can be delivered for a given amount of government grant funding. The key feature of the scheme is that providers can let new properties, or vacant existing properties, under a new ‘Affordable Rent’ tenure, charging rents up to 80% of market rents (see discussion of Affordable Rents in Section 7). The idea is that providers can then secure additional borrowing to finance new construction from private sources in light of higher (expected future) rental income.
As a result, grant funding has fallen to £20,000 per new unit, from £60,000 per new unit under the previous National Affordable Housing Programme, which ran from 2008–09 to 2010–11.16 As a proportion of the total costs of
15 Source: Authors’ calculations using National Audit Office, Financial Viability of the Social Housing Sector: Introducing the Affordable Homes Programme, HC 465, 2012, https://www.nao.org.uk/wp-content/uploads/2012/07/1213465.pdf and HM Treasury, Investing in Britain’s Future, Cm 8669, 2013, https://www.gov.uk/government/uploads/system/uploads/attachment_data/file/209279/PU1524_IUK_new_template.pdf. All figures adjusted for inflation using the GDP deflator.
16 National Audit Office, Financial Viability of the Social Housing Sector: Introducing the Affordable Homes Programme, HC 465, 2012, https://www.nao.org.uk/wp-content/uploads/2012/07/1213465.pdf. These figures are in nominal terms: there is
© Institute for Fiscal Studies, 2015
12
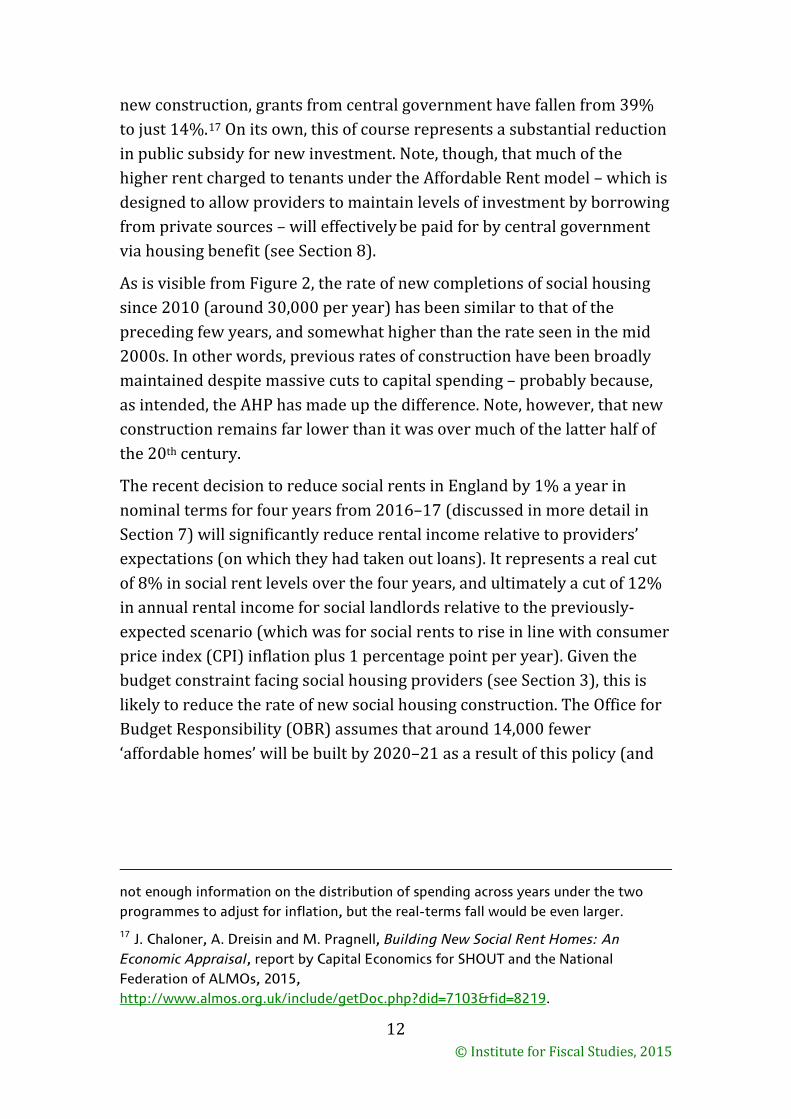
new construction, grants from central government have fallen from 39% to just 14%.17 On its own, this of course represents a substantial reduction in public subsidy for new investment. Note, though, that much of the higher rent charged to tenants under the Affordable Rent model – which is designed to allow providers to maintain levels of investment by borrowing from private sources – will effectively be paid for by central government via housing benefit (see Section 8).
As is visible from Figure 2, the rate of new completions of social housing since 2010 (around 30,000 per year) has been similar to that of the preceding few years, and somewhat higher than the rate seen in the mid 2000s. In other words, previous rates of construction have been broadly maintained despite massive cuts to capital spending – probably because, as intended, the AHP has made up the difference. Note, however, that new construction remains far lower than it was over much of the latter half of the 20th century.
The recent decision to reduce social rents in England by 1% a year in nominal terms for four years from 2016–17 (discussed in more detail in Section 7) will significantly reduce rental income relative to providers’ expectations (on which they had taken out loans). It represents a real cut of 8% in social rent levels over the four years, and ultimately a cut of 12% in annual rental income for social landlords relative to the previously-expected scenario (which was for social rents to rise in line with consumer price index (CPI) inflation plus 1 percentage point per year). Given the budget constraint facing social housing providers (see Section 3), this is likely to reduce the rate of new social housing construction. The Office for Budget Responsibility (OBR) assumes that around 14,000 fewer ‘affordable homes’ will be built by 2020–21 as a result of this policy (and
not enough information on the distribution of spending across years under the two programmes to adjust for inflation, but the real-terms fall would be even larger.
17 J. Chaloner, A. Dreisin and M. Pragnell, Building New Social Rent Homes: An Economic Appraisal, report by Capital Economics for SHOUT and the National Federation of ALMOs, 2015, http://www.almos.org.uk/include/getDoc.php?did=7103&fid=8219.

© Institute for Fiscal Studies, 2015
13
that this will not be offset by greater private sector construction ‘to any material degree’).18
Current developments: sales of social housing
A number of recent policies are likely to increase the rate at which social housing is sold to the private sector. Although both the coalition and new Conservative governments have made commitments to replace properties sold, there is uncertainty over whether these commitments will be met.
The coalition government sought to ‘reinvigorate’ Right to Buy sales in the LA sector (in England19) by increasing maximum discounts for social tenants on the purchase of their properties. These had ranged from £16,000 in most parts of London to £38,000 across much of the South East, but in 2012 were increased to £75,000, and raised further to £100,000 in London in 2013, after which they are set to rise in line with CPI inflation. The changes also reduced the qualifying period before social tenants become eligible for Right to Buy from five to three years.20 Figure 2 shows that there was an uptick in sales in recent years, though this could reflect changes in economic conditions as well as higher discounts.
The policy included a commitment to ‘one-for-one’ replacement of social properties sold under Right to Buy at a national level, but evidence to date suggests this commitment may not be met: between April 2012 and December 2014, 26,188 homes were sold under Right to Buy, but over the same period work had started on just 2,627 properties funded by the proceeds – a replacement rate of around one in ten.21 Of course, there may be more properties in the pipeline, but this gap is a large one.
18 Paragraph 3.84 of Office for Budget Responsibility, Economic and Fiscal Outlook – July 2015, 2015, http://cdn.budgetresponsibility.independent.gov.uk/July-2015-EFO-234224.pdf.
19 The Welsh government has maintained a maximum discount of £16,000, while the Scottish government has passed legislation abolishing the Right to Buy with effect from August 2016.
20 W. Wilson, ‘Incentivising the Right to Buy (RTB)’, House of Commons Library Standard Note SN/SP/6251, 2014.
21 For data, see https://www.gov.uk/government/uploads/system/uploads/attachment_data/file/406192/LT_691.xlsx and
© Institute for Fiscal Studies, 2015
14
The Conservative manifesto before the 2015 general election contained a commitment to go much further and extend the Right to Buy to tenants renting from HAs. This would have given around 500,000 HA tenants the right for the first time to purchase their home while also increasing the discounts available for a further 800,000 tenants who currently have a more limited ‘Right to Acquire’.22 However, the current plan agreed between the government and the National Housing Federation would see Right to Buy extended to HA tenants on a voluntary basis – there will be no legal requirement for HAs to allow tenants to purchase their property (or indeed any other property).23 The extent to which the scale of Right to Buy will increase is therefore somewhat unclear.
It is also worth noting that one plausible consequence of the recently-announced plan to make relatively high-income social tenants pay market rent levels (so-called ‘Pay to Stay’ – see discussion in Section 7) is to encourage more of them to take up their Right to Buy option. Removing a large and permanent rent subsidy could make owner-occupation substantially more attractive relative to being a social renter for this group.
At the same time, the government plans to require LAs to sell their most expensive properties as they become vacant.24 In part, the motivation for this policy is to fund compensation to HAs under the extended Right to Buy, as well as a new ‘Brownfield Regeneration Fund’ worth £1 billion over five years. In addition, though, the policy is motivated by a desire to require LAs to manage their housing assets ‘more efficiently’, in the sense that LAs could house more people in social housing if they cashed in the https://www.gov.uk/government/uploads/system/uploads/attachment_data/file/406195/LT_693.xlsx.
22 Under the Right to Acquire, maximum discounts were capped at between £9,000 and £16,000 (much lower than the Right to Buy discounts available to LA tenants).
23 For details of this voluntary agreement, see National Housing Federation, ‘An offer to extend Right to Buy discounts to housing association tenants’, http://nationalhousingfederation.newsweaver.com/icfiles/1/55885/161177/5359868/a266db71336fb8bfef6fbbf2/rtb%20offer%20final%20fed_2.pdf.
24 More specifically, LAs will be required to sell properties in the most expensive third of all properties with the same number of bedrooms in a given area (including private sector properties). A consultation is underway to determine whether this will apply to the most expensive properties at a regional or more local level.
© Institute for Fiscal Studies, 2015
15
value of their most expensive properties and used the proceeds to fund new construction in cheaper areas. To this end, LAs will be required to replace properties sold with cheaper properties of the same size. Whether this commitment can be met depends on whether there are sufficient funds remaining after compensating HAs and funding the Brownfield Regeneration Fund. The coalition government’s record on replacing Right to Buy properties provides reasonable grounds for scepticism. For a fuller discussion, see Chandler and Disney (2015).25
6. The characteristics of social tenants
Who lives in social housing?
Social housing is allocated broadly on the basis of an assessment of resources relative to need. It is therefore no surprise that social tenants have relatively low incomes compared with the population overall: in 2013–14, median net household income among social tenants (before housing costs, and adjusted for household size) was 66% of median income for the population overall.26
Most of the gap in terms of income between social tenants and the rest of the population is due to differences in earnings from employment. As Table 1 shows, social tenants are less likely to work, and have lower earnings if they are in work, than the population overall. In part, lower employment rates reflect the fact that just 60% of social tenants are of working age (16–64) compared with 64% in the population overall. More importantly, even among the working-age population, the employment rate among social tenants is less than 50%, compared with over 70% for the population overall. Median weekly wages for social tenants in paid work are less than 70% of median weekly wages for the population of workers overall.
25 D. Chandler and R. Disney, ‘Extending Right to Buy: risks and uncertainties’, IFS Briefing Note 171, 2015, http://www.ifs.org.uk/publications/7730.
26 Authors’ calculations using Family Resources Survey, 2013–14. Incomes adjusted for household size using the modified OECD equivalence scale.

© Institute for Fiscal Studies, 2015
16
Table 1. Characteristics of social tenants in Great Britain compared with those of the population overall (2013–14)
All social renters
All
Employment rate (aged 16–64) 49.2% 72.4%
Median weekly earnings (those in work aged 16–64) £276 £403
Age
<16 24.3% 18.4%
16–64 59.9% 64.4%
65+ 15.8% 17.1%
Has a degree (aged 25–64) 8.2% 29.0%
Receiving disability benefits (aged 16–64) 17.6% 6.1%
Household type
Single 13.4% 7.8%
Lone parent 8.1% 3.0%
Couple without children 7.4% 18.4%
Couple with children 17.4% 20.2%
Pensioner 21.2% 21.6%
More than one family 32.6% 29.1% Source: 2013–14 Family Resources Survey. Earnings uprated to 2015–16 levels in line with average earnings growth.
Social tenants also differ from the rest of the population in other ways, some of which help to explain these differences in income and earnings. For example, social tenants are much more likely to be in receipt of disability benefits, and much less likely to have a degree. They are also much more likely to be single, and more likely to have children.
The differences in economic outcomes between social tenants and the rest of the population have not always been this large. Figure 3 shows median household income, the employment rate and median wages among social tenants as a percentage of those of the population overall since 1979. What is striking is how small the gap between social tenants and the rest of the population was in 1979, and how this widened dramatically during the 1980s. This probably reflects the fact that better-off social tenants disproportionately left the sector by exercising their Right to Buy, while allocation of the remaining social housing – now scarcer – was increasingly targeted on those with lower incomes.

© Institute for Fiscal Studies, 2015
17
Figure 3. Ratio of social tenants’ employment rates, median earnings and median weekly net household income to those of the population overall (Great Britain)
Note: Median household income is the net equivalised household income of the median individual before housing costs. Employment rate is among 16- to 64-year-olds. Median weekly earnings are among earners aged 16–64. Years are calendar years to 1992 and financial years from 1993 onwards (where 1993 refers to the financial year 1993–94). Estimates are based on pooled three-year samples up to and including 1993, and single years of data thereafter. Source: Family Expenditure Survey and Family Resources Survey, various years.
Current developments
The key determinants of the characteristics of social tenants going forwards will be the kinds of people who are applying for social housing and the policies used by social landlords to prioritise between different applicants.
Although there are central constraints on allocation policies (see Section 4), there is also plenty of room for social landlords to use their discretion. There is some evidence that allocation policies may be changing, prompted by a number of changes to the statutory guidance, including guidelines encouraging LAs to prioritise those in work or making a community contribution, and to apply two-year residency tests as the default.27 However, in practice, the degree of local autonomy over allocation schemes makes it difficult to generalise about the criteria that LAs actually
27 A number of councils have adopted policies incorporating residency requirements, while others (such as Manchester and Barnet) have prioritised those working or making some other (e.g. voluntary) community contribution. See W. Wilson, ‘Allocating social housing (England)’, House of Commons Library Standard Note SN/SP/6397, 2014.
30%
40%
50%
60%
70%
80%
90%
100% 1
97
9
19
81
19
83
19
85
19
87
19
89
19
91
19
93
19
95
19
97
19
99
20
01
20
03
20
05
20
07
20
09
20
11
20
13
Median weekly earnings Employment rate Median household income

© Institute for Fiscal Studies, 2015
18
Table 2. Characteristics of tenants in new lettings in England, by type of letting, 2013–14
% with various characteristics Social rent (general needs)
Affordable Rent (general needs)
Economically active 54 57
Of which: Full-time 21 25
Part-time 11 16
Unemployed 23 17
Inactive or other 46 43
Age <25 21 21
Age 25–39 38 46
Age 40+ 41 33
Older people 10 5
Single adult, no children 36 21
Multi adult, no children 8 8
Single or multi adult, children 40 59
Other 6 7
Previously a private renter 18 23
Eligible for housing benefit 77 76
Memo: Affordable Rent as a % of lettings 9% Note: Older people are defined as any household where either the main occupier or their partner is aged 60 years or over. Source: DCLG, ‘Social housing lettings in England, 2013/14: Continuous Recording (CORE) data’.
use or how they may be changing over time, and – to our knowledge – there is no central register of the parameters of local schemes.28
One reason why we might expect to see changes in the profile of social housing tenants in England is the introduction of the new Affordable Rent tenure (see Sections 5 and 7). Table 2 compares the characteristics of traditional social rent tenants with Affordable Rent tenants in 2013–14. There are differences between Affordable Rent and traditional social tenants: for example, Affordable Rent tenants are more likely to be employed, to be aged between 25 and 39, to have children, and to have
28 The only recent evidence on allocation policies that we are aware of comes from a report commissioned by the DCLG, which examined allocation policies in 52 LAs in South West England and Yorkshire and the Humber via an online survey in early 2008. More than half (58%) said their policies accorded priority to certain groups over and above those stipulated by law, while half (52%) said that a household’s recorded income or savings could affect their housing priority. See H. Pawson, C. Brown and A. Jones, Exploring Local Authority Policy and Practice on Housing Allocations, Department for Communities and Local Government, London, 2009.
© Institute for Fiscal Studies, 2015
19
come from the private rented sector. However, for the most part, these differences are not very large. This, combined with the fact that Affordable Rent tenancies are still a minority of new tenancies, makes it unlikely that this policy will radically change the composition of the social rented sector in the short or medium term.
7. Social sector rents
Providing housing at rents below the market rate is central to the social housing sector in the UK, and indeed is a mandatory requirement. Rent levels across the social housing sector are constrained by central regulations.
In recent history, we have seen a period of significant ‘rent restructuring’ in the social sector in England, which has worked as follows. Since 2001, rent setting in social properties has been based on a ‘formula rent’. The formula was introduced with the aim of bringing an end to arbitrary differences in rent between similar properties within and between different localities, and in particular to achieve convergence between LA and HA rents. The formula is based on:
• relative local earnings levels; • the relative value of the property (where local earnings are given a
larger weight than relative property value, at a ratio of 70:30); • the number of bedrooms in the property (rents as a proportion of
market rents have traditionally been lower for larger social sector properties, and the formula explicitly retained this differential);
• the national (England) average rent for HA properties (since a key aim was to achieve convergence in rents between HAs and LAs).29
29 Precisely, the formula rent for 2001–02 was arrived at by computing a notional 2000–01 formula rent and uprating it by RPI inflation + 1% (4.3%). The notional 2000–01 formula rent was {(70% of average HA rent) x (relative county earnings) x (bedroom weight)} + {(30% of average HA rent) x (relative property value)}. For these purposes, ‘average HA rent’ was the mean rent in HA properties in England in April 2000; ‘relative county earnings’ meant earnings in the county where the property is located divided by the England average, where the earnings measure is average gross weekly earnings of full-time manual workers between 1997 and 1999, uprated to 1999 prices; ‘bedroom weights’ were a set of scaling factors, ranging from 0.8 for bedsits to 1.4 for properties with at least six bedrooms; and ‘relative property value’ meant the property’s capital value as a proportion of the England average for HA properties as of
© Institute for Fiscal Studies, 2015
20
LA rents used to be well below formula rents, so once formula rents were brought in, a period of gradual ‘rent convergence’ was undertaken: formula rents were uprated each year by retail price index (RPI) inflation + 0.5% but, for properties below formula rent, year-on-year rent increases were allowed to be (up to) £2 per week larger than that.30
Social landlords are free to set rents below the formula rent level or up to 5% above it (subject to the maximum annual increases and the constraint that, whatever the rent level, they must meet required quality standards). As they are effectively self-financing in terms of day-to-day revenues and spending (see Section 3), they have to absorb the consequences of choices over rent levels elsewhere in their housing budgets.31 For example, rents below the formula rent are likely to mean less spending on maintenance, management or new construction than rents at the formula level, all else equal.
Table 3 shows average (mean) rents in 2015–16 in the social and private sectors. Taking England as a whole, the mean social rent (£96 per week) is less than 60% of the mean rent in the private sector (£172 per week). Some of this difference is accounted for by the subsidy to rents in the social sector, but some other differences between the private and social sectors will be relevant too. For example, properties in the social sector may be in less desirable areas or of lower physical quality than properties in the private rented sector. The third column in Table 3 contains estimates of the mean rent that could be charged on the actual social January 1999. After 2001–02, the formula rent was simply increased by a uniform percentage across the country each year, which, until 2015–16, was RPI inflation + 0.5%. For more details, see Department for Communities and Local Government, ‘Guidance on rents for social housing’, 2014, https://www.gov.uk/government/uploads/system/uploads/attachment_data/file/313355/14-05-07_Guidance_on_Rents_for_Social_Housing__Final_.pdf, and in particular appendix A.
30 Although the process of ‘rent convergence’ is largely complete, in some cases limits on the rate at which social rents can be increased mean that social rents on some properties are still below their formula level.
31 This was also true before LAs became fully self-financing in 2012 (see Section 3). From 2002, the HRA subsidy that they received from central government was calculated using assumed rental income based on the formula rent, so the subsidy was insensitive to LAs’ actual rent setting, meaning that LAs faced the full financial consequences of deviating from the formula rent.

© Institute for Fiscal Studies, 2015
21
Table 3. Mean rent per week by rental sector and English region in 2015–16
Private rents
Social rents
Market rent on social
properties
Social rent subsidy
(£)
Social rent subsidy (% of market
rent) England £172 £96 £136 £40 29% North East £118 £81 £99 £18 18%
North West £120 £80 £98 £18 19%
Yorkshire and Humber £130 £86 £109 £23 21%
East Midlands £121 £82 £110 £27 25%
West Midlands £130 £89 £118 £29 24%
East £143 £91 £135 £44 33%
London £267 £123 £191 £68 36%
South East £177 £107 £166 £59 36%
South West £150 £95 £142 £47 33% Note: Private rents uprated to 2015–16 levels in line with average private rent growth. London private rents uprated by growth in average London private rents. Social rents uprated in line with rules governing formula rents. Source: Authors’ calculations using estimates of social rent subsidies in S. Wilcox, Review of Council Housing Finance: Analysis of Rents, Department for Communities and Local Government, 2008, http://webarchive.nationalarchives.gov.uk/20120919132719/http:/www.communities.gov.uk/documents/housing/pdf/1290130.pdf and Family Resources Survey, 2010–11 to 2013–14.
housing stock were it in the private rented sector (see Section 4.1 of the report accompanying this briefing note for details of how this is calculated32). This is lower than the mean rent on private properties – suggesting that social housing is indeed, on average, of lower quality (or in less desirable locations etc.) than private rented housing. Note that ‘quality’ here will incorporate the market value of other features of social tenancies that are different on average from private tenancies, such as management or maintenance services and security of tenure. But the market rents for social properties are also higher than actual social rent levels, highlighting the genuine economic subsidy for rents in the social sector. Across England as a whole, we estimate that rents in socially-rented properties are on average £40 per week lower than the market rent that would be chargeable on the same property. This implies an economic subsidy of about 30% of the market rent, on average. That subsidy is likely
32 S. Adam, D. Chandler, A. Hood and R. Joyce, Social Rents Policy: Choices and Trade-Offs, Institute for Fiscal Studies, London, 2015, http://www.ifs.org.uk/publications/8036.

© Institute for Fiscal Studies, 2015
22
to grow, given the 1% annual nominal cuts to social rents now planned for the next four years (see below).
In absolute terms, the average value of direct rent subsidies is largest in London, at £68, followed by the rest of the South East, while the average direct rent subsidy is smallest in the north of England, at just £18. A similar pattern holds if we look at the value of direct rent subsidies as a proportion of the market rent. London is again at the top end, together with the South East – both regions have average direct rent subsidies of almost 40%, compared with about 20% in the north.
Current developments: annual changes in social rents
Now that the period of rent restructuring described above is largely complete, the direct control that central government exerts over social rent levels in England comes largely through its stipulation of maximum annual increases. In the 2013 Budget, the Conservative–Liberal-Democrat coalition government announced that, from 2015–16, increases in social rents in England would be capped at CPI + 1% for a period of 10 years. At the time, it was claimed that this long-term commitment would provide certainty to providers over future revenues, enabling them to develop long-term business plans and to fund investment in new construction. However, this commitment was undermined after just one of the 10 years of supposed certainty: in the July 2015 Budget, the new Conservative government decided instead to reduce nominal rents in the social sector by 1% per year for a period of four years from 2016–17 (before reverting to the previously-announced policy of annual increases of up to CPI + 1%). Given current OBR forecasts for CPI inflation, the policy implies an 8% real (CPI-adjusted) reduction in social rents over the four years, and a 12% reduction in rents by 2019–20 relative to previous plans.
Current developments: ‘Affordable Rents’
In 2011, the coalition government introduced a new ‘Affordable Rent’ tenure in England: social housing with rents designed to fall somewhere between current market and social rents. Despite the name then, the key feature of this model is that rents are allowed to be more expensive than the traditional social rent model that they are partially replacing. Rents set under this new model, which can apply only to new properties or re-lets of existing vacant properties, must be at least equal to the formula rent and are allowed to be as high as 80% of the market rent for the property

© Institute for Fiscal Studies, 2015
23
(conditional on an agreement to use the additional rent for reinvestment in social housing – see below). As was shown in Table 3, this compares with an average of about 70% of market rents across the social sector in England currently (and closer to 60% on average in London and the South East).33
The introduction of Affordable Rents is closely tied to the Affordable Homes Programme – a new framework for allocating capital grants from central government between social housing providers, introduced by the previous (coalition) government and continued by the current Conservative government. A central aim of the AHP has been to shift the source of funding for new construction in the social sector away from capital grants (which have been heavily cut) and towards greater borrowing by social landlords. The idea is that higher rents increase providers’ expected future rental income and therefore their capacity to borrow (since the debt is typically secured against future revenue). For the most part, social landlords in England can only charge Affordable Rents as part of an agreement with the Homes and Communities Agency to use additional revenue to fund new supply.34
Properties let at Affordable Rents represent a small but growing proportion of the flow of new tenancies, increasing from fewer than 5,000 new lettings in 2011–12, the first year of the programme, to more than 37,000 in 2013–14, or 9% of all new lettings in England. With about 10% of the social housing stock re-let each year, it will take some time for Affordable Rents to become a substantial part of the sector overall: in 2013–14, they represented less than 2% of the total social housing stock in England.35
33 The national policy covering year-on-year rent changes also applies to properties let at Affordable Rents: rents will fall in nominal terms by 1% per year for four years from 2016–17, before reverting to the previously-announced policy of annual increases of up to CPI + 1%.
34 The vast majority of capital grants are made through the Affordable Homes Programme. Provision has also been made for providers to start charging Affordable Rents outside the AHP – see W. Wilson and A. Bate, ‘Affordable Rents (England)’, House of Commons Library Briefing Paper 05933, 2015.
35 Source: Table 1a at https://www.gov.uk/government/uploads/system/uploads/attachment_data/file/387420/CORE_Statistical_Release_2013-14.pdf for number of new lettings per year; table

© Institute for Fiscal Studies, 2015
24
The latest data suggest that Affordable Rents are, unsurprisingly, higher than traditional social rents. According to DCLG estimates, median social rents (including Affordable Rent properties) across England as a whole were 57% of median market rents in 2013–14, compared with 80% for Affordable Rent properties (note that neither figure adjusts for differences in property characteristics between Affordable Rent properties and other social properties).36 The fact that Affordable Rents are higher, on average, than social rents probably reflects – at least partly – the fact that providers are taking up the freedom to charge higher rents (up to 80% of the market rate) than they could if they let the same property at the formula rent – though it may also reflect differences in quality between the properties let at Affordable Rent and other social properties.
Current developments: ‘Pay to Stay’
The July 2015 Budget announced an important change to the way in which rents are set within the social sector. From 2017–18, social landlords will be required to charge market or ‘near market’ rents to tenants in England with a ‘household income’ of £30,000 or more (£40,000 in London).37 The government has yet to confirm precisely what it will count as ‘household income’ for these purposes. The policy, known as ‘Pay to Stay’, extends a reform introduced by the previous coalition government that allowed (but did not require) landlords to charge market rents to tenants with income in excess of £60,000.38 For that policy, the definition of income used was the total taxable income of the tenant and (if applicable) the partner with
100 at https://www.gov.uk/government/statistical-data-sets/live-tables-on-dwelling-stock-including-vacants for size of total social housing stock in England.
36 This does not mean that Affordable Rents are being set at the upper limit of 80% of the market rents. Unfortunately, there are no administrative data on how Affordable Rents compare with market rents on the same properties, and there are not enough data for us to estimate this using survey data as we do for social rents as a whole in Table 3. See tables 2c and 2d at https://www.gov.uk/government/statistics/social-housing-lettings-in-england-april-2013-to-march-2014.
37 HM Treasury, Summer Budget 2015, London, 2015, https://www.gov.uk/government/uploads/system/uploads/attachment_data/file/443232/50325_Summer_Budget_15_Web_Accessible.pdf.
38 For more details on this policy and the discussion around it, see W. Wilson, ‘Social housing: “pay to stay” at market rents’, House of Commons Library Briefing Paper SN06804, 2014.
https://www.gov.uk/government/statistics/social-housing-lettings-in-england-april-2013-to-march-2014

© Institute for Fiscal Studies, 2015
25
whom they live. Assuming that the same definition of income is used for the new extended Pay to Stay, we estimate that about 7% of social tenant households in England have an income above the relevant threshold (£40,000 in London or £30,000 elsewhere) and will therefore pay more rent as a result of the policy.39 Important details of this policy are yet to be announced, and some of the important choices are discussed and analysed in the report accompanying this briefing note.40
Although it will affect only a minority of tenants, Pay to Stay will represent a fundamental change to the way in which rents are set in the social sector: previously, social rents could depend on the characteristics of the property but by law could not depend on tenant characteristics; in future, they will also depend on tenants’ current incomes. This will have a number of effects. On the one hand, it will increase rents (and therefore reduce direct rent subsidies) for higher-income social tenants – thereby ensuring that support is targeted more on those with low current resources. On the other hand, it will create significant disincentives for tenants to increase their incomes above these thresholds, because an increase in income could lead to large increases in rents. It may also encourage greater take-up of the Right to Buy among affected (or potentially affected) tenants.
8. Housing benefit for social tenants
One cannot fully understand the operation of social housing in Great Britain without appreciating the significant interaction between social housing and housing benefit.
Housing benefit (HB) is a means-tested benefit available to tenants with low incomes and low financial assets to cover some or all of their rent. It exists in both the social and private rented sectors, but the rules governing entitlements differ between the sectors.41 Around two-thirds of social
39 Authors’ calculations using the IFS microsimulation tax and benefit model, TAXBEN, and the 2013–14 Family Resources Survey.
40 S. Adam, D. Chandler, A. Hood and R. Joyce, Social Rents Policy: Choices and Trade-Offs, Institute for Fiscal Studies, London, 2015, http://www.ifs.org.uk/publications/8036.
41 For a detailed description of the operation of housing benefit, see pages 30–34 of A. Hood and L. Oakley, ‘A survey of the GB benefit system’, IFS Briefing Note 13, 2014, http://www.ifs.org.uk/uploads/publications/bns/BN13_Benefits_Survey_2014.pdf.
© Institute for Fiscal Studies, 2015
26
tenants receive some HB.42 Slightly more are entitled to it, but about 12% of those social renters entitled do not take it up.43 Those social tenants with the lowest incomes and assets have traditionally been entitled to a rebate on their full rent through HB, though this is no longer always true in light of two recent reforms (see below). Once incomes (net of income tax and National Insurance contributions) exceed a certain threshold – which varies according to family circumstances – HB entitlement is reduced by 65p for every £1 of income above that threshold.
The evolution of housing benefit spending
Housing benefit in something close to its current form was first introduced in the early 1980s. The system replaced a complex set of schemes for supporting those on low incomes with the cost of housing which included rent rebates, rent allowances, and payments through the benefits system. The shift towards greater reliance on HB was part of a wider strategic shift away from subsidising ‘bricks and mortar’ via capital subsidies and towards subsidising ‘people’ with particular housing needs instead.
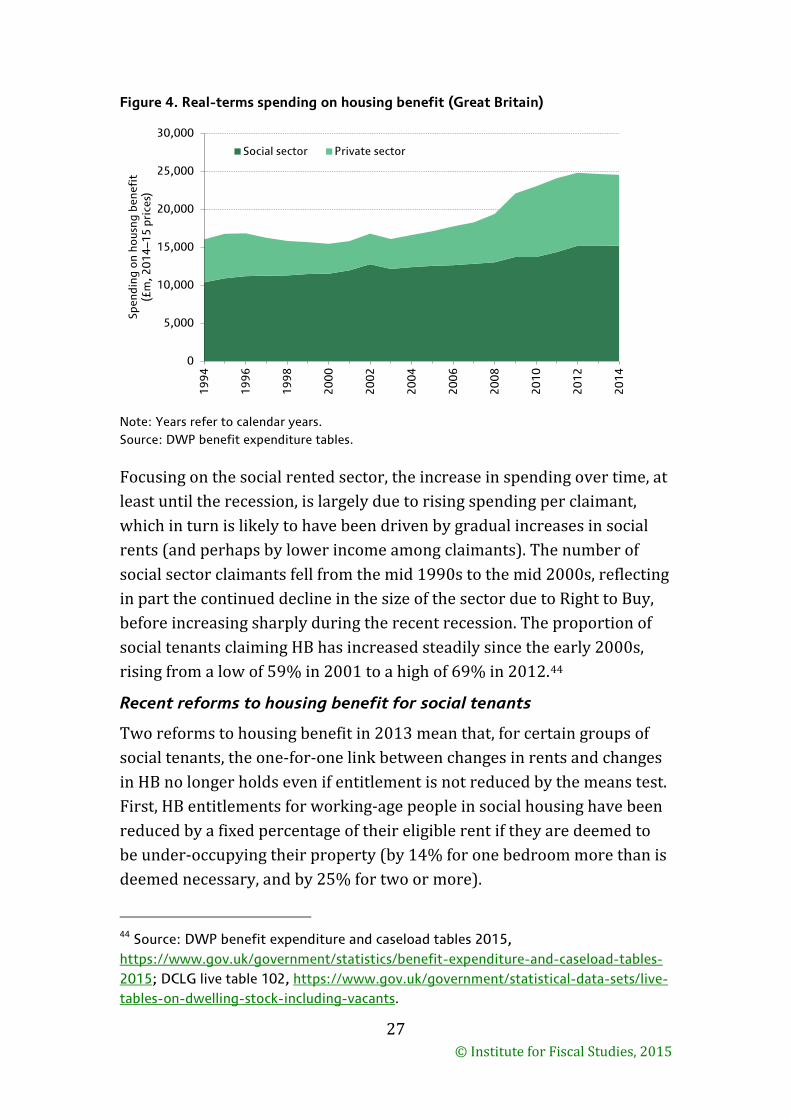
As Figure 4 shows, the overall cost of housing benefit has increased significantly over time, in both the private and social rented sectors (and because of an increase in the relative size of the higher-rent private sector). These changes are driven by a combination of changes in the number of claimants and changes in spending per claimant (which are related to changes in both rent levels and the generosity of HB). The late 1980s saw some large increases in spending, driven in part by the deregulation of the private rental sector leading to some rapid increases in private rents. The 2000s also saw significant growth in HB spending in the private rental sector. In part, this was driven by rising claimant numbers, which likely reflected the declining size of the social sector, though spending per person also increased until 2009.
42 Source: DWP benefit expenditure and caseload tables 2015, https://www.gov.uk/government/statistics/benefit-expenditure-and-caseload-tables-2015; DCLG live table 102, https://www.gov.uk/government/statistical-data-sets/live-tables-on-dwelling-stock-including-vacants.
43 Source: Department for Work and Pensions, ‘Income-related benefits: estimates of take-up: financial year 2013–14’, https://www.gov.uk/government/statistics/income-related-benefits-estimates-of-take-up-financial-year-201314.
© Institute for Fiscal Studies, 2015
27
Figure 4. Real-terms spending on housing benefit (Great Britain)
Note: Years refer to calendar years. Source: DWP benefit expenditure tables.
Focusing on the social rented sector, the increase in spending over time, at least until the recession, is largely due to rising spending per claimant, which in turn is likely to have been driven by gradual increases in social rents (and perhaps by lower income among claimants). The number of social sector claimants fell from the mid 1990s to the mid 2000s, reflecting in part the continued decline in the size of the sector due to Right to Buy, before increasing sharply during the recent recession. The proportion of social tenants claiming HB has increased steadily since the early 2000s, rising from a low of 59% in 2001 to a high of 69% in 2012.44
Recent reforms to housing benefit for social tenants
Two reforms to housing benefit in 2013 mean that, for certain groups of social tenants, the one-for-one link between changes in rents and changes in HB no longer holds even if entitlement is not reduced by the means test. First, HB entitlements for working-age people in social housing have been reduced by a fixed percentage of their eligible rent if they are deemed to be under-occupying their property (by 14% for one bedroom more than is deemed necessary, and by 25% for two or more).
44 Source: DWP benefit expenditure and caseload tables 2015, https://www.gov.uk/government/statistics/benefit-expenditure-and-caseload-tables-2015; DCLG live table 102, https://www.gov.uk/government/statistical-data-sets/live-tables-on-dwelling-stock-including-vacants.
0
5,000
10,000
15,000
20,000
25,000
30,000
19
94
19
96
19
98
20
00
20
02
20
04
20
06
20
08
20
10
20
12
20
14
Spen
ding
on
hous
ng b
enef
it
(£m
, 20
14
–15
pri
ces)
Social sector Private sector

© Institute for Fiscal Studies, 2015
28
Second, benefits for each non-working family of working age have been subject to an overall cap (except where specific exemptions apply, such as being in receipt of personal independence payment or disability living allowance). If total family weekly income from certain specified benefits exceeds the cap, then HB payments are reduced in order to bring family benefit income down to the cap level. For families at the cap, small changes in rent have no effect on benefit entitlement.
9. Conclusion
Although the social housing sector in the UK has declined substantially in size since the 1980s, it remains important – about one in six of the population still live in it today.
The nature of social housing has changed along with its prevalence: rationing has become increasingly important; social tenants are far poorer relative to the rest of the population than they used to be; and almost all new construction is now undertaken by housing associations, which were a barely-visible part of the overall social housing sector in the early 1980s.
Looking forward, the sector looks likely to be the subject of continued debate, given its cross-cutting relevance to crucial policy questions such as how to address the lack of housing supply and how best to spend the nation’s welfare budget.