AP World History Review Period 1: Technological and Environmental Transformations

ii
iii
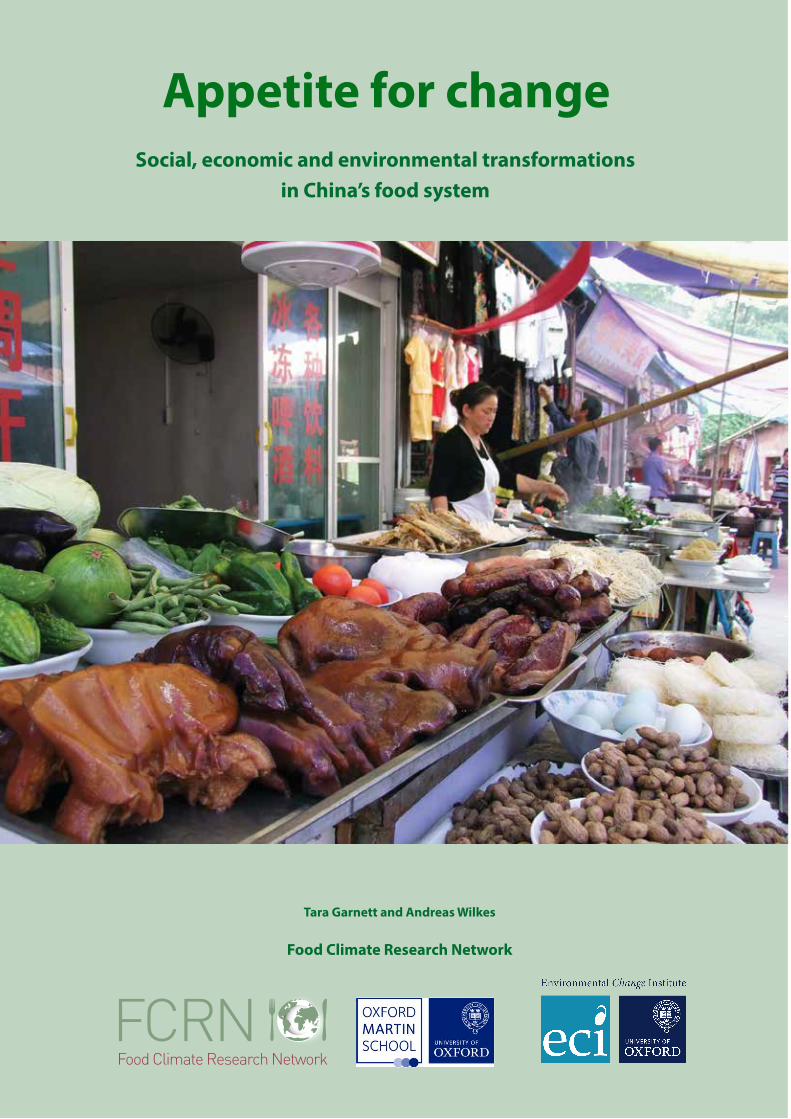
Appetite for changeSocial, economic and environmental
transformations in China’s food system
Tara Garnett and Andreas Wilkes
Food Climate Research Network
February 2014
iv
Table of contents
Acknowledgements viAcronyms, abbreviations and measurements viiSummary 1
Introduction 8 The context for this report 8 Report purpose and structure 9 Methods 11 Intended audience 12
1 Introduction to a food systems perspective 13
2 Overview of changes and drivers in China’s food system 19 2.1 China’s food system today: a snapshot 19 2.2 Overarching drivers of change 20 2.3 Future drivers of change 24
3 Supply chain transformations 26 3.1 Agricultural transformations 26 3.2 Future drivers of the agricultural system: focus on environmental change 36 3.3 Food processing, manufacturing and distribution 39 3.4 Wholesale and retail sectors 44 3.5 Catering and restaurants sector 46 3.6 Consumption patterns 47
4 Environmental transformations 50 4.1 Trends in environmental impacts 50 4.2 International and global environmental impacts 60 4.3 Policy and other stakeholder responses 65
5 Health transformations: nutrition and diet 71 5.1 Diets and dietary change in China 71 5.2 Nutrition-related health trends and impacts 76 5.3 Drivers and shaping influences 82 5.4 Future challenges 88
6 Socio-cultural transformations: attitudes and behaviours around consumption 91 6.1 Consumerism and food in China 91 6.2 Concerns about health, safety and quality 93 6.3 Environmental and other ethical concerns 95 6.4 Future trends 96
v
Focus on livestock 98 1. Growth in the livestock sector 98 2. Structure of production 99 3. Processing 100 4. Policy influences 101 5. Trade 102 6. Consumption 104 7. Animal welfare 105
Focus on dairy 114 1. Production overview 114 2. Processing and imports 118 3. Consumption 120 4. Drivers of growth in dairy production and consumption 121 5. Emerging issues for the dairy sector 126
Focus on aquaculture 128 1. Introduction 128 2. Aquaculture policies 128 3. Trends in the aquaculture sector 129 4. Systems of production and employment 132 5. Processing 133 6. Inputs to production 134 7. Trade 137 8. Consumption and markets 139 9. Environmental issues in the aquaculture and fisheries sector 140 10. Food safety 147
7 Summary, conclusions and implications 151 7.1 Past and future trends and issues 151 7.2 Narratives about the food system 156 7.3 Addressing policy challenges and the role of research 163
vi
Acknowledgements
Research for this report was funded by grants from the Department for Environment, Food and Rural Affairs (DEFRA) and Department of Business, Innovation and Skills (BIS) of the UK government, the Rockefeller Brothers Fund (RBF) and the World Society for the Protection of Animals (WSPA). It builds on discussions held at workshops in Beijing in 2011 and 2012 with financial support from WSPA and Oxfam (Hong Kong).
The report has benefited from insights provided by a number of collaborators and colleagues. Reports commissioned as background studies for this report were written by Ashleigh Bright (animal welfare), James Keeley (changes in the supply chain), Ma Lin (food waste), Wei Qin (water use), Zhang Wenbo (aquaculture), and Xu Chenjia (socio-cultural changes). Other valuable insights, comments and input were gratefully received from Fang Jing, Tim Wheeler, Joe Millward, Dave Stirling, Francis Murray and Jakob Klein. We are particularly grateful to David Norse, Lu Yuelai and Bai Junfei for formally reviewing an earlier draft of this report, to Marie Persson for general assistance, to Huw Pohlner for copyediting and to Dharma R. Maharjan for desktop publishing.
FCRN would also like to acknowledge the assistance of Jennifer Holdaway of the Social Science Research Council, who read the whole report several times and offered detailed comments. She provided particular input into the implications of the analysis for integrated policy in the China context and for future research. The Beijing-based Forum on Health, Environment and Development, of which Holdaway is a co-Director, has recently produced a report, Food Safety in China: Problems, Governance and Research, on which the analysis in this report also draws. This is available at www.forhead.org.
vii
Acronyms, abbreviations and measurements
ARB antibiotic resistant bacteriaASEAN Association of Southeast Asian NationsAQSIQ Administration of Quality Supervision, Inspection and QuarantineBMI body mass indexBOD biological oxygen demandCAFO confined animal feeding operationCd cadmiumCDC Centre for Disease ControlCFDA China Food and Drug Safety AdministrationCH4 methaneCHNS China Health and Nutrition SurveyCIQ customs, immigration and quarantineCNY Chinese YuanCO2 carbon dioxideCO2e carbon dioxide equivalentCOD chemical oxygen demandCOFCO China National Cereals, Oils and Foodstuffs CorporationCSA community supported agricultureCu2+ cupric copperDDT dichloro-diphenyl-trichloroethaneEU European UnionFAO Food and Agriculture Organisation of the United NationsFDI foreign direct investmentFSRAC Food Safety Risk Assessment Centreg gramGDP gross domestic productGECAFS Global Environmental Change and Food SecurityGHG greenhouse gasGM genetically modifiedha hectareHACCP hazard analysis and critical control pointsHCH hexachlorocyclohexaneICAMA Institute for the Control of Agrochemicals of the Ministry of AgricultureIPCC Intergovernmental Panel on Climate ChangeIPM integrated pest managementI-O input-outputIOF International Osteoporosis FoundationISO International Standards OrganisationK potassium
Appetite for Change: Social, economic and environmental transformations in China’s food system
viii
kcal kilocalorieskg kilogramkm kilometrekWh kilowatt hourLCA life cycle analysism metreMEP Ministry of Environmental Protectionmg milligramMIIT Ministry of Industry and Information TechnologyMOA Ministry of AgricultureMOFCOM Ministry of CommerceMOH Ministry of HealthMt million tonnesmu unit of area measurement, 15 mu = 1 hectareN nitrogenN2O nitrous oxideNDRC National Development and Reform CommissionNGO non-government organisationNH3 ammoniaNSB National Statistical BureauNUE nitrogen use efficiencyOCP organochlorine pesticidesOIE World Organisation for Animal HealthP phosphorusPOP persistent organic pollutantsPUE phosphorus use efficiencyR&D research and developmentSAIC State Administration for Industry and CommerceSFDA State Food and Drug Administrationt metric tonnesTDS Total Diet StudyTFP total factor productivityUHT ultra high temperatureUK United KingdomUN United NationsUS United States of AmericaUS$ United States DollarWHO World Health OrganisationWSPA World Society for the Protection of AnimalsWTO World Trade OrganisationWTP willingness to pay
Note: In 2013, US$ 1 ≈ CNY 6.2; CNY 1 ≈ US$ 0.16.
Summary
1
Sum
mar
y
Summary
This report examines how China’s food system is changing and why, and explores the implications of these changes for food security, public health, environmental sustainability and other issues of current and future concern to Chinese and international stakeholders. The report adopts a food systems approach, analysing trends, drivers and issues from agricultural production through each stage in the supply chain to consumption and its impacts. The analysis shows how many issues occurring at different stages of food supply chains – from pollution of the agricultural environment to trends in nutrition, health and food safety – are interlinked and driven by changes at other stages in the food system, as well as by policies and broader changes in China’s economy and society. The report identifies the knowledge gaps that need to be filled to more effectively address China’s food system challenges and makes suggestions for policy-oriented research, highlighting in particular the scope for international collaboration in this area.
Trends and driversChina’s rapid economic growth and transformation over the last 35 years is well documented. Changes in China’s food system have been no less dramatic, touching not only the lives of hundreds of millions of China’s farmers, but also more than a billion consumers, and a host of individuals and firms in the increasingly globalised supply chain between the farm and the table.
Food production has increased substantially and there is now both more food and a greater variety of food available. Increasing yields have mainly been due to overarching economic reforms and supportive agricultural policies, as well as technological change and higher inputs. The structure of agricultural output has changed, as the value of horticultural cash crops (e.g., fruit and vegetables), aquaculture, and livestock products have grown much faster than other crops. Livestock now contributes about a third of agricultural output value, and the area sown to grain crops has fallen by a third since 1980 as the area of higher value cash crops has increased. As livestock feed demand has grown, an increasing proportion of grain production is in coarse grains used for feed. Although agriculture is still a source of livelihoods for about 200 million farmers, changes in agricultural production are increasingly shaped by other changes in food supply chains. Many agricultural subsectors are experiencing a process of ‘scaling up’, but these changes are playing out in different ways. The livestock sector is achieving growth through a shift towards fewer, larger, more intensive farms. The horticulture sector, however, is still dominated by small-scale producers, but contract farming and other forms of cooperation with leading enterprises are becoming more common.
Food supply chains are lengthening. The food processing sector makes a significant contribution to employment and the economy, and although most processors are micro-enterprises, the number of large-scale food processing firms is increasing, along with various forms of vertical integration that blur the boundaries between agricultural production and post-harvest processing. Consumers are served by a diversity of marketing formats. In urban areas, the market share of supermarkets is increasing, although traditional wet markets continue to meet consumers’ preference for many fresh products. Further development of supermarkets in rural areas is
Appetite for Change: Social, economic and environmental transformations in China’s food system
2
projected. Eating out in an increasingly varied catering sector has become a major driver of change in urban consumption habits. Supply chains now extend beyond China, with growing import and export trades, growing Chinese investment in land and businesses overseas, and the emergence of China as an important market for international food companies.
Trends in consumption have been an important driver of changes throughout the supply chain. For the most part, people are no longer hungry – although there are important and persistent exceptions. Both rural and urban consumers have access not only to sufficient calories but also to more diverse foods. In particular, consumption of grains has fallen for both urban and rural residents, while consumption of meat, dairy and aquatic products, vegetable oils, processed foods, sugars and fruits has grown. Meat, eggs and dairy products are contributing an increasing proportion of total energy and protein intake. The trend towards eating out in restaurants and other catering establishments outside of the home is a significant driver of increasing meat consumption. Total energy intakes have decreased, as people in urban areas in particular lead more sedentary lifestyles. However, the decline in consumption is less than the decline in energy requirements, and obesity levels are increasing.
Although China’s food system is still dominated by small players – 200 million farmers and countless individual and small-scale enterprises in food processing, transport, wholesale and retail – ongoing changes in food supply chains are significant. Many of these changes are driven by a common set of overarching drivers. Broader economic growth has led to shifts in the number of people employed in agriculture, in the methods and scale of production, and in food industry developments further along the supply chain (logistics, manufacturing, retailing and catering); along with urbanisation and rising incomes, it has contributed to changes in the types of food that people aspire to consume.
China’s urban population has increased steadily over the last 30 years, from 191 million in 1980, to 636 million in 2010, and the United Nations projects that it will be over a billion by 2050. Urbanisation has had a profound impact on labour force availability for agricultural production, the consumption drivers influencing production, and people’s physical requirements for food. Urbanisation has also given rise to new supply chain requirements and challenges, including the need for transport and refrigeration infrastructure and food waste management. Urbanisation has increased people’s exposure to marketing and has helped generate demand for new food products. Many changes have also been driven by government policies in agriculture and other sectors related to the food system. Food security policy has focused on self-sufficiency in basic food crops. Policies to support agricultural production have played key roles in ensuring productivity growth, and more recently have promoted increasing the scale of production in the livestock sector and vertical integration in a number of food supply chains.
Impacts and issuesGrowth in agricultural output, changes in the structure of production and consumption, and transformations in supply chains have had impacts on the environment, health and nutrition, and public perceptions of food safety.
Environmental impacts of China’s food system: With just 8% of global arable land and per capita water availability at about 10% of the global average, maintaining and making efficient
Summary
3
Sum
mar
y
use of land and water resources are increasingly recognised as priorities for sustainable national development. Yet agriculture is also a major source of environmental pollutants. Increasing application of inorganic fertilisers has driven increasing agricultural productivity. Fertilisers are now a major cause of soil acidification, a source of soil and water pollution, and account for about a quarter of greenhouse gas (GHG) emissions from China’s food system as a whole. Growth in the livestock sector has been rapid and production is spatially concentrated in particular regions and in peri-urban areas. Animal production is resource-intensive, livestock waste is a leading source of water and soil pollution, and the sector now contributes about half of China’s agricultural GHG emissions, or an even higher proportion if emissions embodied in imported feeds are included. Livestock feed accounts for an increasing proportion of crop use, and thus drives an increasing proportion of crop-related environmental impacts both in China and internationally. Beyond the production stage, food waste has been increasing rapidly. Some waste is caused by inadequate supply chain infrastructure (e.g., storage and refrigeration) but increasing waste at the consumption stage is also a consequence of changing attitudes and behaviours around food.
China’s food system also generates international and global environmental impacts. Production of commodities for export to China uses natural resources, such as water, and may drive environmental change on other continents. The environmental impacts of soy and palm oil production – commodities with rapidly growing Chinese imports – have begun to attract attention. The land area under management by Chinese companies overseas is growing, though the environmental impacts of Chinese firms’ overseas investments and operations are not clear. China’s food system also contributes to global GHG emissions. In 2005, agricultural production in China contributed around 11% of China’s GHG emissions, or 1.8% of global emissions. However, when post-harvest GHG emissions are included, China’s food system contributes in the order of 20-25% of national emissions or 4-5% of global emissions. Increasing demand for livestock products is likely to dominate the future trajectory of China’s agricultural GHG emissions and its overseas impacts. Efforts to reduce GHG emissions from agricultural production have clear synergies with China’s efforts to address environmental impacts, such as non-point pollution of water sources and air pollution. Encouraging a shift toward less resource-intensive dietary patterns would also be consistent with efforts to address the nutritional health impacts of dietary transition.
Health impacts of China’s food system: Diseases and conditions associated with insufficient food are far less prevalent than 30 or 40 years ago. Rising incomes, urbanisation and population ageing are driving changes in diet and diet-related health problems. Conditions such as heart disease, stroke and diabetes – diseases of wealth and abundance – are increasingly common. These conditions are associated with changing dietary patterns, in particular the shift towards higher consumption of energy- and fat-rich foods such as meat, vegetable oils and processed products. Risk-prone dietary patterns are compounded by increasingly sedentary lifestyles, other unhealthy behaviours such as smoking, and population ageing. These are problems experienced not only by rich citizens but also by the urban and rural poor.
Between a quarter and a third of adults in rural and urban areas of China are either overweight or obese. About 10% of China’s population (ca. 92 million people) suffers from diabetes and a further 148 million people are prediabetic. While diabetes is more prevalent in urban areas, prediabetic indicators are more common in rural areas. The majority of people with diabetes are undiagnosed. The effects of changing diets on children are a particular concern. About 13% of 7-18 year olds
Appetite for Change: Social, economic and environmental transformations in China’s food system
4
are overweight or obese, and nearly 15% show at least one indicator of a prediabetic condition. As China’s population ages and urbanisation changes lifestyles, bone health among the elderly is a rising concern. Osteoporosis affects about a third of women, and hip fractures are increasing rapidly. While urbanisation, lifestyle changes, and an ageing population affect the dietary patterns most likely related to the incidence of these conditions, these conditions are also related to other changes in the food system, such as increased production and consumption of processed foods, and food advertising.
Food safety and the transformation of China’s food system: Food safety has become an issue of enormous public concern in China in recent years, with problems affecting many stages of food supply chains from production and processing to transport, storage and retail. The risks involved stem from sources including environmental pollution; the excessive or inappropriate use of fertilisers, pesticides, veterinary drugs and growth promoters; food additives; unsanitary storage and handling; and the sale of fake or out of date products. Food safety is affected by many of the same factors that are driving other changes in the food system including rapidly expanding and more intensive production and dietary change resulting from rising incomes and urban lifestyles. In this report, food safety is discussed in the context of other health and environmental impacts of changes in China’s food system, with particular focus on the livestock, dairy and aquaculture sectors.1
Livestock as a focal arena: Transformations in the livestock sector encapsulate in many ways the various changes are taking place in China’s food system, and analysis of the production and consumption of animal products can illuminate the ways in which economic, environmental, health and ethical concerns intersect. The environmental impacts of growth in livestock production are felt at both the local and global levels. Within China, poorly managed manure surpluses pollute soils and water, while overgrazing in pastoral regions contributes to land degradation. As livestock production grows, water requirements are increasing, further straining China’s already scarce resources. At the same time, the sector makes a growing contribution to global climate change, both through direct GHG emissions and indirect emissions embodied in domestically produced and imported feeds. China’s dependence on imported feeds also contributes to land use change and deforestation in other parts of the world.
The changing role of animal products in the diet illustrates the shift in China’s health challenges associated with economic growth and higher living standards. Increasing meat and dairy consumption have made positive contributions to significant decreases in malnutrition and micronutrient deficiencies. But although these problems persist in some areas, as incomes rise, concern is shifting to the role of higher meat intakes in the growth in obesity and chronic diseases associated with affluence, such as heart conditions, strokes and diabetes. The livestock sector also presents a complex set of challenges for food safety. Some problems, such as food contamination, adulteration and the sale of fake products are common to other product groups and should respond to similar regulatory measures. But the excessive use of antibiotics and other veterinary drugs presents serious, long term concerns for public health. This issue is receiving growing attention both in China and internationally.
1 Readers interested in an interdisciplinary analysis of food safety in China are referred to FORHEAD (2014). Food Safety in China: Problems, Governance and Policy. www.forhead.org
Summary
5
Sum
mar
y
In terms of policy responses and public debates, the livestock sector also highlights some of the key challenges China faces in managing rapid change in the food system. Specific policies have been introduced to address pollution from the livestock sector as well as inappropriate use of veterinary drugs and feed additives, but implementation remains problematic. More broadly, increasing the scale of livestock farms, slaughterhouses and processing facilities has been seen as a way to address environmental impacts as well as food safety risks in the livestock sector. Fewer, larger, and generally confined systems of production may be easier to regulate and monitor, allow better control or utilisation of waste effluents, and facilitate management of animal health and zoonotic diseases. However, larger-scale production also brings its own environmental impacts and potential health risks, animal welfare challenges and more spatially concentrated environmental emissions. And if not effectively controlled, zoonoses can also affect much larger animal populations. The livestock sector is thus emerging as a domain in which many of the challenges of China’s food system transformation will need to be understood and addressed.
Policy challengesThe report identifies a number of policy challenges related to the interconnections between issues such as nutrition, environment, food safety and economic development. It also identifies several challenges related to the specific context of policy development and implementation in China. Interdisciplinary research and international collaboration can contribute to addressing these challenges.2
Insights from a whole food chain approach: A whole food chain approach shows that each stage of the food supply chain has potential environmental impacts and implications for public health. Life cycle analysis (LCA) can be particularly useful for understanding environmental and health impacts across the food system. It can help to identify products with high environmental impacts; compare the implications of different production methods for environmental impacts, food safety and nutritional quality; identify trade-offs between different types of emission and nutritional values; and assess the environmental and health implications of whole diets. This report shows that more attention needs to be paid to the role of post-harvest stages of the food supply chain. In particular, changes in consumption stand out as key drivers of environmental and health impacts, because they determine how much and what kinds of foods are produced. In China, as in other countries, meat consumption consumption of meat is a concern for both environmental and health reasons. A life-cycle approach also draws attention to the growing environmental impacts caused by waste along the food chain.
Identifying linkages, synergies and tradeoffs to support connected policies: A food systems perspective shows how different issues such as nutrition, environment, food safety, economic development and animal welfare are connected, and can identify where policies made with one particular objective in mind may undermine or support other policy objectives. In some cases, opportunities exist for achieving synergies among objectives across diverse policy domains. For example, improvements in animal health and welfare can assist firms in improving product quality and can reduce food safety risks; and measures to address excessive fertiliser use are consistent with maintaining yields while reducing GHG emissions and nitrate leaching as well as farmers’ production costs. Policies can benefit from exploiting such synergies if they can garner more ‘buy-
2 An extensive discussion of policy challenges in the China context and implications for research can be found in FORHEAD (2014). Food Safety in China: Problems, Governance and Research. www.forhead.org.
Appetite for Change: Social, economic and environmental transformations in China’s food system
6
in’ from stakeholders because of their multiple benefits. A systems approach can also indicate where trade-offs exist among multiple policy objectives that need be managed, for example when costs associated with higher quality or environmental standards increase the price of certain foods, making them unaffordable for low income groups. Trade-offs between short- and longer-term objectives will also need to be considered, for example, if climate change adaptation options ‘lock’ producers into production practices that restrict adaptation options in the future.
Thinking about change and imagining possible futures: China’s food system is undergoing rapid change, and policy must not only address issues that are already pressing but also understand the future implications of trends in production and consumption. A scenarios development approach can be useful in exploring these. For example, analysis of a range of production and consumption scenarios relating to key products could help policy makers identify how current trends might evolve in the future and what the potential benefits and costs for health, the environment and society might be. It can also clarify where tensions exist between short and longer term goals, and how policy can reduce the adverse impacts of future trends.
Scaling effectively for sustainability: Current agricultural policies support increasing scale of production to deliver economic and environmental efficiencies and reduce food safety risks. However, the relationship between scale and safety and environmental impacts is not straightforward, and scaling up has its own environmental and societal risks. The challenge for policy makers is to manage changes in production scale and methods in ways that optimise the potential benefits and minimise the downsides. The relationship between scale and impact requires further investigation. In particular, it is necessary to understand what conditions must be in place for larger-scale operations to realise their potential benefits, and to better understand trade-offs between environmental, health and equity outcomes at different scales.
New policies for new problems: Two challenges stand out as requiring innovative policy responses. Firstly, while Chinese health policy has started to address the growth in diet-related chronic diseases, only ‘soft’ measures have been adopted, such as education and awareness raising. Yet the experience in developed countries suggests that such measures have been of limited use. Stronger mechanisms, such as fiscal measures and public procurement standards, may need to be considered if China is to stem the rise in diet-related disease. The second major challenge is addressing the environmental impacts of food production, including resource use, environmental degradation, and climate change. This will require innovative policy mechanisms, including market-based mechanisms to supplement regulatory and technology-based approaches. Both of these are challenges that policy makers and stakeholders are grappling with in other countries too, and international collaboration may offer important insights.
The need for differentiated and targeted policies: The diversity of China’s agro-ecosystems and its uneven economic development mean that any national policy will inevitably have differing impacts across regions and populations. Capacities to implement policies also vary widely across the country and at different administrative levels. Differentiated policies are therefore necessary that take into consideration the specific challenges, needs, resources and capacities of different regions, producers and consumers. In the international context, China might look at the experience of other large, internally differentiated countries and regions like the US or the EU, where uniform policies are not adopted or implemented in each state.
Summary
7
Sum
mar
y
Cross-sectoral coordination: Food is a cross-sectoral issue, and in some respects Chinese policy making has been exemplary in seeking to involve multiple ministries in policy making. However, coordination at the national level does not mean that integration will take place at lower levels of administration, and poor coordination between agencies has been a major obstacle to effective policy implementation. The reasons for this need to be better understood and addressed. In several fields, China may be able to learn from the way in which policy coordination is organised in other countries, including both the advantages and disadvantages of different institutional arrangements. Where coordination has been successful, detailed studies of the ways in which it was achieved, and how obstacles were overcome are needed in addition to descriptions of the ‘finished product’.
Addressing barriers to effective policy implementation: Designing effective and equitable policies to address the challenges in China’s food system requires greater understanding of the diverse factors that influence people’s behaviour and of how interventions might be designed to reorient current practices. While considerable research has been conducted on technical solutions to various problems throughout the food system, research on the socio-economic drivers that affect technology adoption and policy implementation is much more limited and has focused mostly on small scale producers in certain sectors. Little is known about the factors affecting practice change among other supply chain actors such as large scale enterprises and investors, or about consumer attitudes and behaviour, which are crucial drivers of demand and key to the effective implementation of policy. Local development priorities interact in diverse ways with policies that focus on environmental protection and health goals. The incentives and capacities of local governments and different line agencies is also an area that requires greater in-depth analysis to inform policy design.
Multi-stakeholder partnerships to address new challenges: Effectively managing the environmental and health impacts of changes in China’s food system will require not only integrated policy measures but also the engagement of multiple actors beyond government. NGOs, the media, industry and consumers are all playing important roles in exploring new practices that address challenges and promote sustainability in the food system. Research that engages industry, consumers and other stakeholders can increase the relevance and applicability of food system research.
Appetite for Change: Social, economic and environmental transformations in China’s food system
8
Introduction
The context for this reportThe ‘food question’ is the focus of substantial debate and anxiety among policy makers and other stakeholders all over the world – and with good reason. A convergence of demand and supply side factors indicates that the task of feeding the world’s population effectively in coming decades will prove increasingly challenging. On the demand side, the world’s population is growing and changing. The next forty years are likely to see the population grow by 2-3 billion to reach 9-10 billion by 2050. Most of these people will, on average, be living in urban areas, be net consumers rather than producers of food, and be wealthier than people today. Current demand trajectories suggest that the future population will demand not only more food but more varied and more resource-intensive food. On the supply side, we are faced with the reality of finite land, water and other resources. At the same time, climatic and other forms of environmental change – largely negative in many parts of the world – are making food production increasingly difficult or unpredictable. Our current food production systems not only undermine important ecosystem functions upon which we ultimately depend, such as biodiversity and water quality, but also exacerbate zoonotic diseases and other risks that directly affect our health. Changes in the structure of production – in who produces food, how, where and for whom – add new elements of change, upheaval and uncertainty. Most strikingly, inequities and distortions in how inputs to and outputs from food production are distributed have given rise to a paradoxical situation in which 1.4 billion adults worldwide are overweight or obese, while 842 million people are chronically hungry.3
The challenge to policy makers is clear: it is necessary to refashion the food system to deliver better nutritional outcomes at lower environmental cost. However, the routes to achieving these goals are difficult and are the subject of considerable political, and indeed ideological, disagreement.
China is often cited as an outstanding example of a developing country that has achieved growth in food production, food availability and access to food through a mix of policy reforms, technological innovation and trade.4 Yet, in many respects the changes in China’s food system in the last 35 years encapsulate and represent in concentrated form the dramatic changes and concerns that are played out at the global level. Given the size and reach of China, the changes taking place within China impact not only on the wellbeing of Chinese citizens, but also on the future direction of the food system globally.
Many aspects of China’s food system have been well documented. At one end, there has been significant focus on agricultural production and supply side issues around food security and its environmental impacts.5 At the other, the effects of changing dietary patterns and their health
3 WHO. (2011). Global Status Report on Noncommunicable Diseases 2010. Geneva: World Health Organisation; FAO. (2013). The State of Food Insecurity in the World 2013. Rome: Food and Agriculture Organisation.4 World Bank. (2008). World Development Report 2008: Agriculture for Development. Washington D.C.: World Bank.5 Norse D, Lu Y and Huang J. (2014). China’s food security: Is it a national, regional or global issue? In K Brown (ed). China and the EU in Context. London: Palgrave; Norse D, Lu Y and Tang H. (2010). The future of food and farming: Foresight Report’s implications for China. London: Government Office for Science.
Introduction
9
Intr
o.
implications have become increasingly clear.6 However, the stages between the two ends of the supply chain – food processing, distribution, retailing – and changing relations among supply chain actors have received less focus, and the interconnections between supply chain transformations and the impacts of the food system on health and the environment have rarely been examined in an integrated fashion. This report looks not only at agriculture but at the food system as a whole, highlighting linkages between trends and issues across different parts of the food system, and the system’s impacts on issues beyond food.
Box 1: Food: the global context and challenges
A number of recently published high profile reports assess global challenges around food issues. The UK Government’s Foresight report, The Future of Food and Farming,7 explored the increasing pressures on the global food system between now and 2050, and identified some decisions that policy makers need to make today and in the coming years to ensure that the world’s global population of 9-10 billion can be fed sustainably and equitably. The report drew on consultations with around 400 leading experts and stakeholders from 35 countries across the world, as well as the insights of over 100 peer-reviewed commissioned evidence papers. A subsequent report, which examines the implications specifically for China, is also available.8 The French Government’s Agrimonde study adopted a similar approach,9 as does the United Nations Department for Economic and Social Affairs study on the future of sustainability for food and agriculture.10
These reports highlight the following key challenges facing the food system: � A growing, urbanising and on average wealthier population, which increasingly demands more
resource-intensive foods; � Resource scarcity, and competition for resources; � Changes in the structures, systems and governance of food production and distribution,
including increasing globalisation and trade coexisting with smallholder and subsistence production;
� Environmental degradation and climatic change, which make food production increasingly difficult in many regions;
� A changing burden of nutrition-related disease, with hunger persisting in some regions and growing problems related to overconsumption;
� Changing attitudes and expectations, which may evolve in unpredictable ways in coming years.
Report purpose and structure The purpose of this report is to look at how China’s food system is changing and why, and what the implications of these changes might be in the coming years. Given the diversity and rapidity of these changes, and the multiple scales at which they take place, it is impossible to catalogue
6 Zhai F, Wang H, Du S, He Y, Wang Z, Ge K and Popkin B. (2009). Prospective study on nutrition transition in China. Nutrition Reviews, (67)Suppl. 1: S56-S61.7 Foresight. (2011). The Future of Food and Farming. Final Project Report. London: Government Office for Science.8 Norse D, Lu Y and Tang H. (2010). The future of food and farming: Foresight Report’s implications for China. London: Government Office for Science. 9 Paillard S, Treyer S and Dorin B. (2010). Agrimonde: Scenarios and Challenges for Feeding the World in 2050. Versailles: Editions Quae. 10 UN. (2012). Food and Agriculture: the future of sustainability. A strategic input to the Sustainable Development in the 21st Century (SD21) project. New York: United Nations Department of Economic and Social Affairs, Division for Sustainable Development.
Appetite for Change: Social, economic and environmental transformations in China’s food system
10
and assess all the changes that are occurring. Our purpose in this report is to describe the main changes that are taking place and their consequences, to identify driving forces and debates among stakeholders both within China and beyond, and to highlight key issues and perspectives as China’s food system continues to evolve.
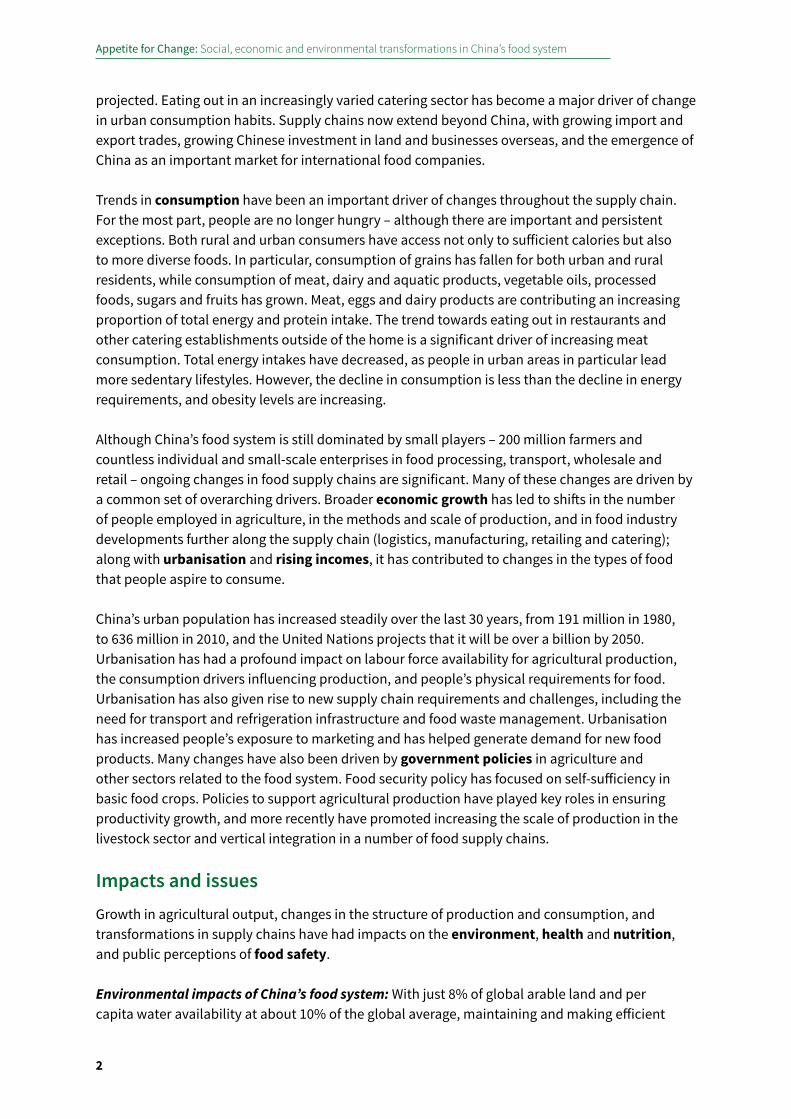
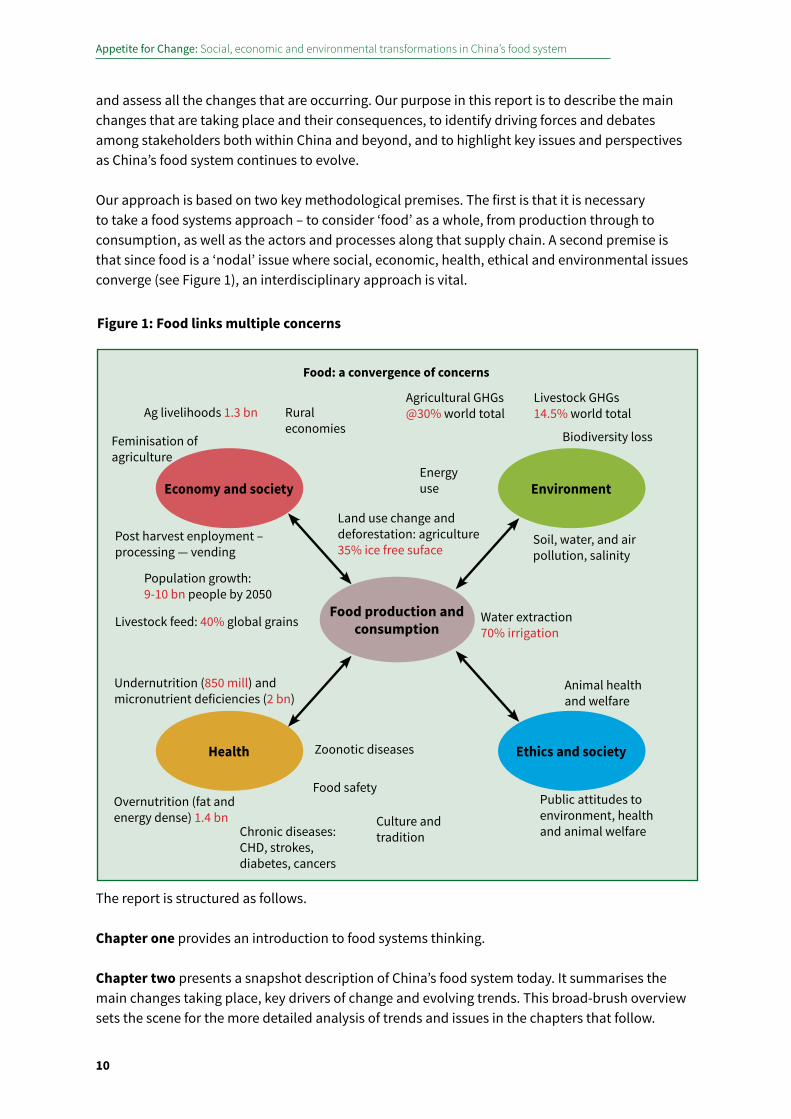
Our approach is based on two key methodological premises. The first is that it is necessary to take a food systems approach – to consider ‘food’ as a whole, from production through to consumption, as well as the actors and processes along that supply chain. A second premise is that since food is a ‘nodal’ issue where social, economic, health, ethical and environmental issues converge (see Figure 1), an interdisciplinary approach is vital.
The report is structured as follows.
Chapter one provides an introduction to food systems thinking.
Chapter two presents a snapshot description of China’s food system today. It summarises the main changes taking place, key drivers of change and evolving trends. This broad-brush overview sets the scene for the more detailed analysis of trends and issues in the chapters that follow.
Environment
Ethics and society
Food production and consumption
Health
Economy and society
Ag livelihoods 1.3 bn
Feminisation of agriculture
Post harvest enployment – processing — vending
Livestock feed: 40% global grains
Undernutrition (850 mill) andmicronutrient deficiencies (2 bn)
Overnutrition (fat and energy dense) 1.4 bn
Population growth: 9-10 bn people by 2050
Rural economies
Land use change and deforestation: agriculture35% ice free suface
Agricultural GHGs @30% world total
Biodiversity loss
Soil, water, and air pollution, salinity
Animal health and welfare
Public attitudes to environment, health and animal welfare
Zoonotic diseases
Food safety
Culture and traditionChronic diseases:
CHD, strokes, diabetes, cancers
Water extraction70% irrigation
Energy use
Food: a convergence of concerns
Figure 1: Food links multiple concerns
Livestock GHGs 14.5% world total
Introduction
11
Intr
o.
Chapter three, taking a supply chain ‘plough to plate’ approach, considers transformation in the structures and processes of food production, distribution, retail and consumption.
Chapter four examines the environmental impacts of those changes, highlighting key concerns both for China and the rest of the world.
Chapter five describes changes in the nutritional health status of China’s population, the successes that have been achieved and some of the emerging challenges.
Chapter six explores socio-cultural dimensions of change, looking at how societal attitudes to consumption are evolving in response to the other transformations taking place, and considers their role in influencing future change.
Intersecting with chapters 2-6 are three ‘Focus-on’ sections (A-C) that examine in-depth trends, drivers and issues in production and consumption in the livestock, dairy and aquaculture subsectors. These three subsectors are experiencing particularly dynamic growth and change. Taking a sectoral rather than thematic approach enables an examination of how growth in these sectors intersects with the socio-economic, health, environmental and cultural transformations that are described in the thematic chapters.
Chapter seven attempts to provide some coherence to the multiple and sometimes contradictory trends in China’s food system. It frames discussions about China’s food system in terms of three main narrative themes, each of which captures a set of objectives, stakeholder concerns and areas of divergence among stakeholders. The first is the narrative of ‘sufficient food’, an approach that has so often been the focus of the question, “Can China feed itself?”. The second narrative focuses on ‘quality food’, which relates both to nutritional adequacy and food safety. The third narrative – ‘abundant food’ – explores the links between wealth and plenty, including both the gains and new problems that these bring. Each of these narratives provides a useful perspective on China’s food system, though different stakeholders place differing emphasis on each and the links between them. When viewed together, these narratives address one key question: what, for China, is a sustainable food system? This report does not attempt to answer that question, but concludes by outlining some key challenges and opportunities for policy and research.
While food safety issues are discussed at various points in this report, they are not considered in detail since a comprehensive analysis can be found elsewhere. In particular, interested readers are referred to Food Safety in China: Problems, Governance and Research produced by the Beijing-based Forum on Health, Environment and Development (FORHEAD).
Methods The analysis presented in this report is based on the findings of seven commissioned studies and extensive reviews of the English and Chinese language literature. Reports were commissioned to summarise the state of knowledge on changes in supply chain, food waste, water use, aquaculture, animal welfare, and socio-cultural issues.
Literature sources include peer reviewed journals, grey literature (such as reports produced by the food industry or non-governmental organisations (NGOs)) and news articles and websites.
Appetite for Change: Social, economic and environmental transformations in China’s food system
12
The latter are used for citing business data (particularly where the original data are only available in commercially priced reports), for documenting recent initiatives and issues that have yet to be reflected in formal publications, and when discussing media coverage of, and responses to, key issues.
Intended audienceThis report is aimed at three key audiences. First, it is offered to policy makers and policy advisors within China. This report examines the multiple and complex challenges that China is facing viewed through a food system ‘lens’. Food systems thinking has had much to offer policy makers in many European countries, and we believe that this approach is also valuable when understanding trends and issues in China’s food system. Our second audience is the wider global food policy community. This includes both the UK Government, which helped fund this report, as well as wider stakeholders, including UN organisations, NGOs and the food industry. Changes in China increasingly affect everyone. There is a need for policy makers to have insight into what is happening in China as a prerequisite for constructive engagement on these issues of global concern. The report showcases the immense successes that China has achieved in the past few decades, and provides an integrated assessment of key challenges in the coming years. Our third audience is the donor and charitable foundation sector, some of whom have also supported the production of this report. It is hoped that this analysis of the current situation and major trends will help foundations and their partners to identify key priorities and leverage points for future work.
Introduction to a food systems perspective
13
1
1 Introduction to a food systems perspective
This chapter introduces the food systems approach that provides the conceptual framework for the analysis presented in this report. Production, processing, distribution and consumption of food involve both biophysical and social processes. Bringing together insights from the physical and social sciences is a key feature of a ‘food systems’ approach. Describing the dynamics of change in various aspects of the food system from different disciplinary perspectives can highlight the interrelations between causes and consequences that might not always be apparent when viewed from the perspective of any single discipline.
While food systems approaches have been defined and interpreted in various ways,11 food systems approaches often examine the dynamics of social, economic and biophysical interactions across the following dimensions:
� The physical flow of goods from agriculture through to consumption and waste disposal; � The social, economic, environmental, cultural and other forces that influence and shape this
flow; � The social, economic, environmental, cultural and other consequences that result from this
flow of goods and configuration of forces; and � The interactions between consequences and drivers, that is, the way in which the dynamics
affecting the food system can shape its future direction.
In reality, there is no single ‘food system’ but rather multiple ‘food systems’ operating at different spatial or social scales, which interact with one another to varying degrees. But a food systems approach recognises that diverse social, economic and environmental outcomes often have common causes. For example, policies that seek to influence one particular outcome – such as agricultural greenhouse gas emissions – without considering its relationship with another – such as food consumption patterns – may lead to undesirable consequences in other areas.
Three concepts or ways of thinking about food have been particularly influential in shaping the food systems approach as it is commonly deployed:
� environmental life cycle analysis; � the concept of food security; and � the concept of global environmental change.
In addition, this report draws upon a fourth mode of analysis: � discourses around sustainable consumption.
11 Ericksen P. (2008). Conceptualizing food systems for global environmental change research. Global Environmental Change, (18): 234-245; Ingram J. (2011). A food systems approach to researching food security and its interactions with global environmental change. Food Security, (3)4: 417–431.
Appetite for Change: Social, economic and environmental transformations in China’s food system
14
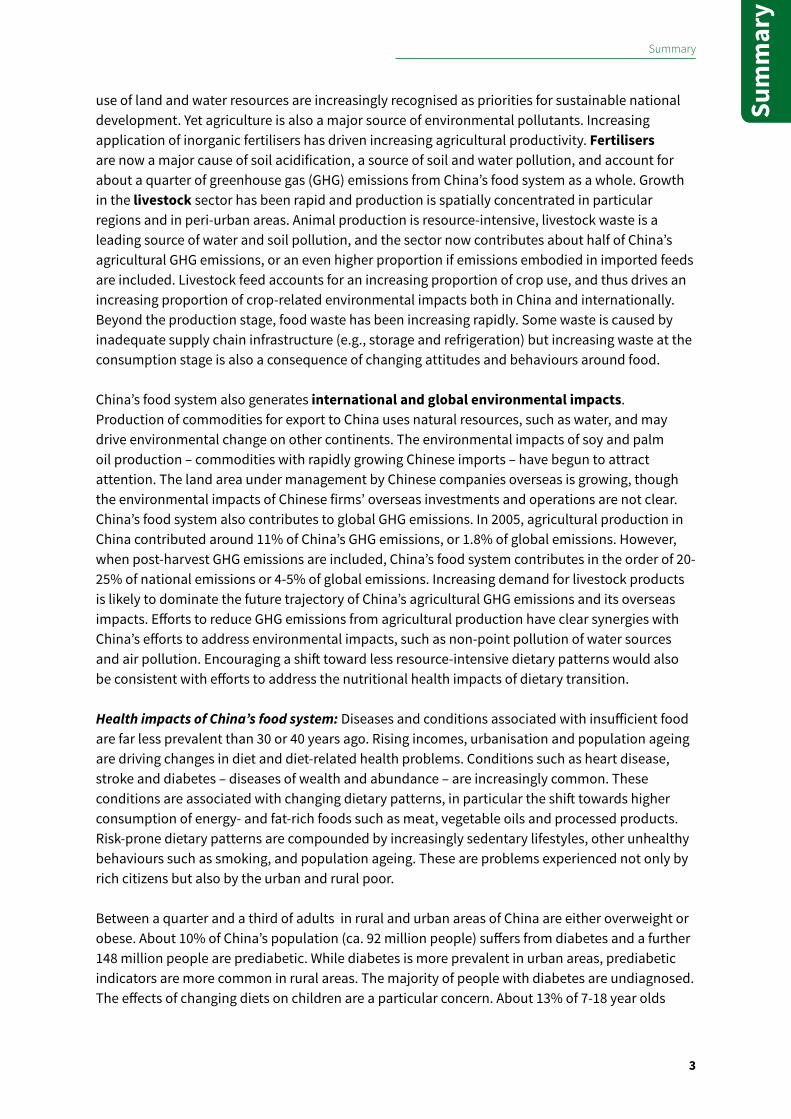
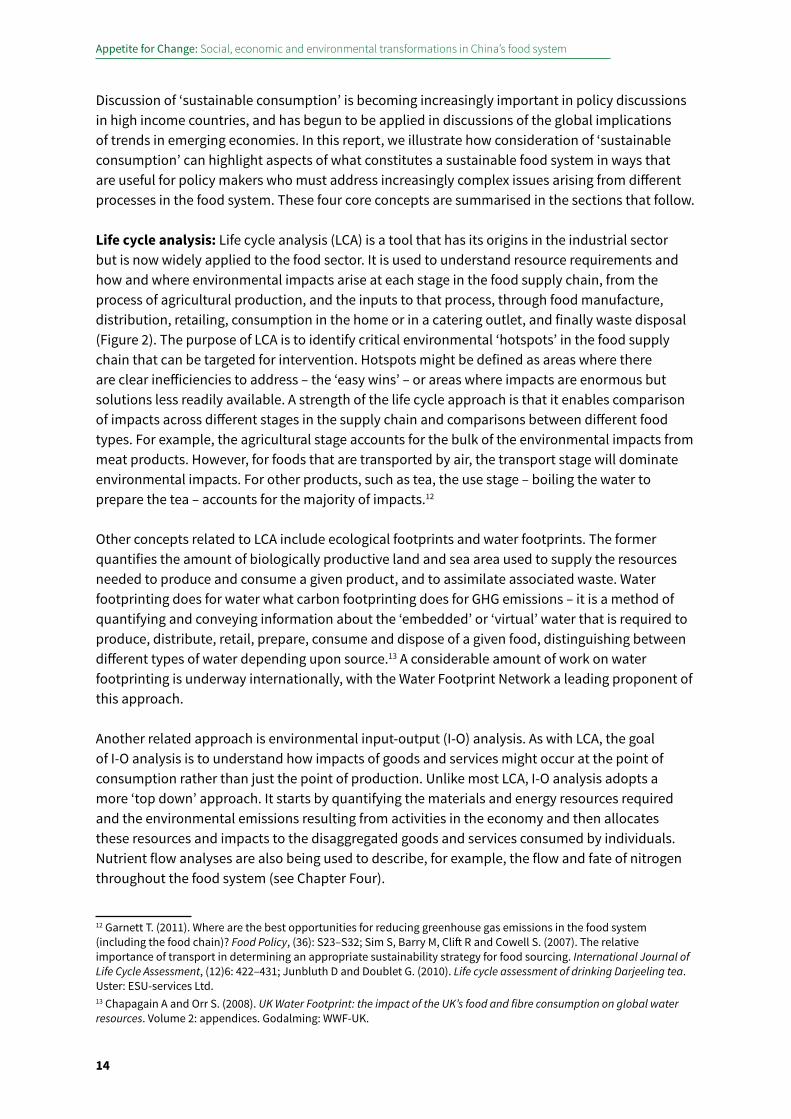
Discussion of ‘sustainable consumption’ is becoming increasingly important in policy discussions in high income countries, and has begun to be applied in discussions of the global implications of trends in emerging economies. In this report, we illustrate how consideration of ‘sustainable consumption’ can highlight aspects of what constitutes a sustainable food system in ways that are useful for policy makers who must address increasingly complex issues arising from different processes in the food system. These four core concepts are summarised in the sections that follow. Life cycle analysis: Life cycle analysis (LCA) is a tool that has its origins in the industrial sector but is now widely applied to the food sector. It is used to understand resource requirements and how and where environmental impacts arise at each stage in the food supply chain, from the process of agricultural production, and the inputs to that process, through food manufacture, distribution, retailing, consumption in the home or in a catering outlet, and finally waste disposal (Figure 2). The purpose of LCA is to identify critical environmental ‘hotspots’ in the food supply chain that can be targeted for intervention. Hotspots might be defined as areas where there are clear inefficiencies to address – the ‘easy wins’ – or areas where impacts are enormous but solutions less readily available. A strength of the life cycle approach is that it enables comparison of impacts across different stages in the supply chain and comparisons between different food types. For example, the agricultural stage accounts for the bulk of the environmental impacts from meat products. However, for foods that are transported by air, the transport stage will dominate environmental impacts. For other products, such as tea, the use stage – boiling the water to prepare the tea – accounts for the majority of impacts.12
Other concepts related to LCA include ecological footprints and water footprints. The former quantifies the amount of biologically productive land and sea area used to supply the resources needed to produce and consume a given product, and to assimilate associated waste. Water footprinting does for water what carbon footprinting does for GHG emissions – it is a method of quantifying and conveying information about the ‘embedded’ or ‘virtual’ water that is required to produce, distribute, retail, prepare, consume and dispose of a given food, distinguishing between different types of water depending upon source.13 A considerable amount of work on water footprinting is underway internationally, with the Water Footprint Network a leading proponent of this approach.
Another related approach is environmental input-output (I-O) analysis. As with LCA, the goal of I-O analysis is to understand how impacts of goods and services might occur at the point of consumption rather than just the point of production. Unlike most LCA, I-O analysis adopts a more ‘top down’ approach. It starts by quantifying the materials and energy resources required and the environmental emissions resulting from activities in the economy and then allocates these resources and impacts to the disaggregated goods and services consumed by individuals. Nutrient flow analyses are also being used to describe, for example, the flow and fate of nitrogen throughout the food system (see Chapter Four).
12 Garnett T. (2011). Where are the best opportunities for reducing greenhouse gas emissions in the food system (including the food chain)? Food Policy, (36): S23–S32; Sim S, Barry M, Clift R and Cowell S. (2007). The relative importance of transport in determining an appropriate sustainability strategy for food sourcing. International Journal of Life Cycle Assessment, (12)6: 422–431; Junbluth D and Doublet G. (2010). Life cycle assessment of drinking Darjeeling tea. Uster: ESU-services Ltd.13 Chapagain A and Orr S. (2008). UK Water Footprint: the impact of the UK’s food and fibre consumption on global water resources. Volume 2: appendices. Godalming: WWF-UK.
Introduction to a food systems perspective
15
1
Taken together these related approaches to environmental analysis yield three important insights: � Production and consumption practices are interlinked. Changes in food demand influence what
kinds of food are produced, and where and when. These production patterns in turn have social, economic and environmental implications.
� The food system is not defined or limited by national borders. In a globalised world, consumption choices made in one country have knock-on environmental and social impacts in other countries.
� While the food system as a whole is a major contributor to environmental impacts, growth in production and consumption of animal products is cause for particular concern.
LCA informs much of the analysis in this report of the environmental impacts of China’s food system, and highlights linkages between different stages in food supply chains, which increasingly link China and the rest of the world.
Food security and livelihoods: The Food and Agriculture Organisation of the UN (FAO) defines food security as existing “when all people, at all times, have physical and economic access to sufficient, safe and nutritious food to meet their dietary needs and food preferences for an active
Figure 2: Simplified diagram of a life cycle analysis approach
Agriculture
Packaging Packaging inputs
Distribution centre
Catering Retail
Home food storage, cooking, dishwashing, etc.
Consumption
Waste disposalTransport stages
Food processing / manufacturing
Agricultural inputs, including imported feed, fertiliser, pesticides, seed production, etc.
Source: Garnett T. (2008). Cooking up a Storm: Food, Greenhouse Gas Emissions and our Changing Climate. Guildford: Food Climate Research Network, University of Surrey.
Appetite for Change: Social, economic and environmental transformations in China’s food system
16
and healthy life”.14 This definition explicitly recognises that food security does not depend on food production alone. The nutritional quality of food is also important. Moreover, the social and economic dynamics influencing the distribution and utilisation of food, from the point of production through to consumption, also need to be taken into account.
A range of social, economic, physical and cultural conditions influence whether individuals in society are able to access and utilise sufficient, safe and nutritious food. Economic and physical access to food is influenced by production, marketing and distribution systems as well as food prices, household incomes and expenditure, and government policies. Food utilisation is influenced by changes in food processing and retail, intra-household food distribution, cultural acceptability and an individual’s health status (which influences their body’s ability to absorb and utilise food nutrients). The stability of access and utilisation of sufficient, safe and nutritious food is affected by the interactions of these processes and influencing factors over time.15 In order to understand the dynamics of food security at the household level, rather than focus on food in isolation, it can be helpful to consider factors affecting food security from the perspective of people’s ‘livelihoods’, a concept that is widely applied in the international development community.16 This requires an understanding of the natural, social and economic resources or ‘capital’ available to people, and the ways in which formal or informal social institutions enable them to use these resources in order to secure a living and meet their food security needs.
In practice, many stakeholders conceive of ‘food security’ in terms of the production and supply of food. This approach assumes that the ‘solution’ to food insecurity is to increase the production of key commodity crops. Addressing other aspects of food security is a more complex policy issue, and it is here that the food systems approach can assist policy makers to identify issues and options beyond the production stage.
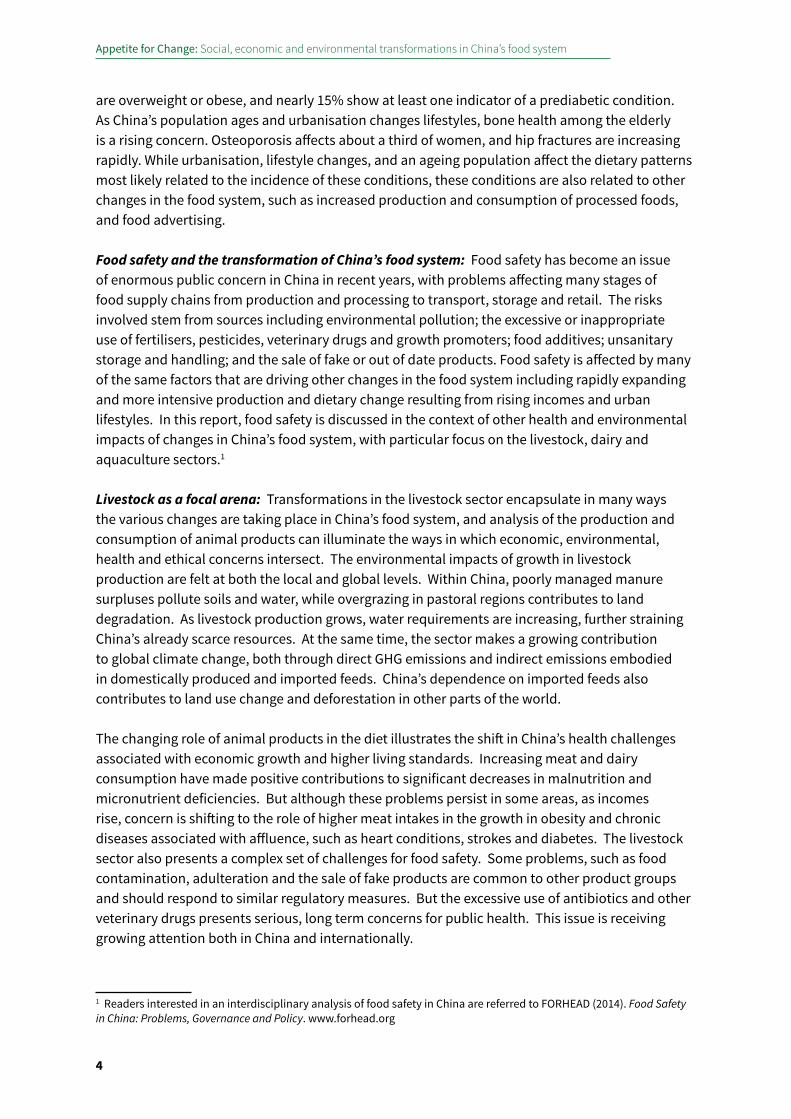
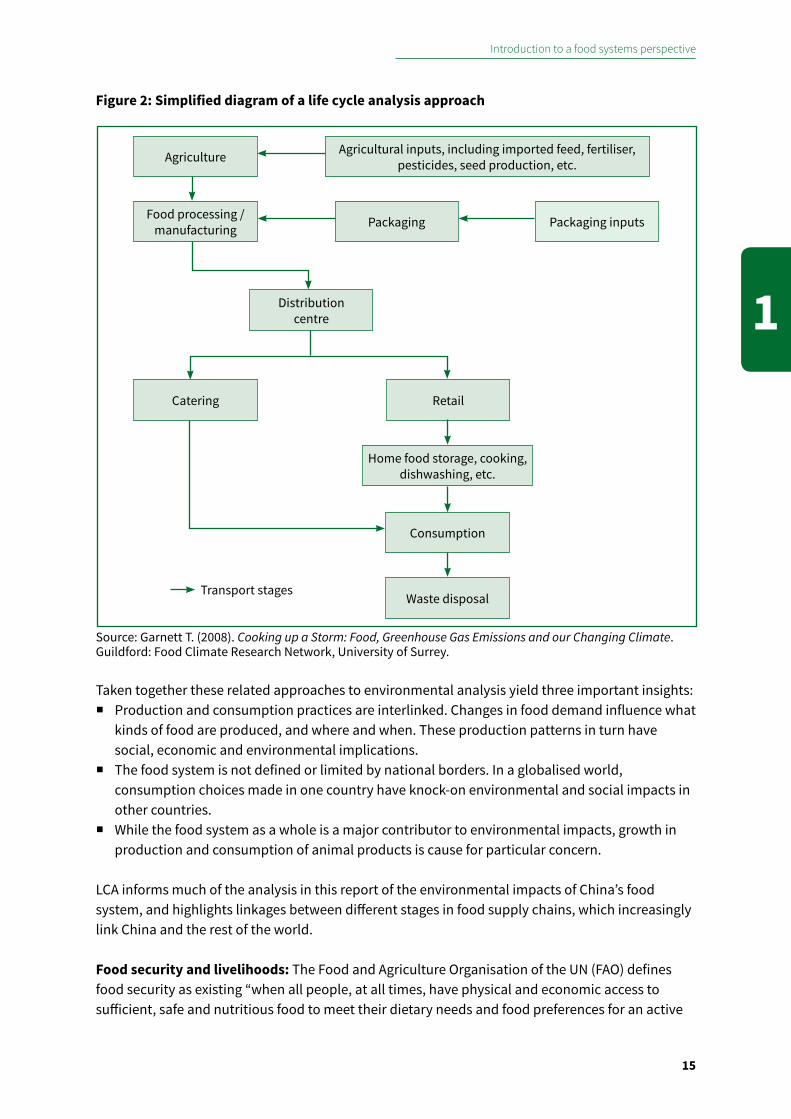
Global environmental change: The interaction between global environmental change and food security was the subject of a major 10-year international, interdisciplinary Global Environmental Change and Food Security project (GECAFS), which concluded in March 2011.17 An important conceptual output of the GECAFS project was the realisation that global environmental change – including, but not limited to, climate change – has a huge influence on food security, and that environmental sustainability affects all four dimensions of food security (availability, access, stability, and utilisation). Furthermore, these impacts arise not just from the direct biophysical impacts of environmental change but also through the dynamic interactions between biophysical change and the drivers of environmental and socio-economic change (Figure 3).
The concept of global environmental change also makes clear the interconnected nature of these changes. For example, China is connected through trading relations to regions that are affected in diverse ways by climatic and other environmental changes. The changes that are caused by or that affect the food system in one country will have impacts upon the availability, affordability or quality of food in another.
14 FAO. (1996). Rome Declaration on World Food Security and World Food Summit Plan of Action. World Food Summit, 13-17 November. Rome: FAO.15 FAO. (2008). An introduction to the basic concepts of food security. EC-FAO Food Security Programme. Rome: FAO.16 Ashley C and Carney D. (1999). Sustainable livelihoods: Lessons from early experience. London: UK Department for International Development.17 GECAFS. Global environmental change and food systems, http://www.gecafs.org/about/index.html
Introduction to a food systems perspective
17
1
The growing recognition that the food security of a population is intrinsically linked with environmental sustainability is starting to influence the further evolution of ‘food security’ as a concept. The FAO, for example, is now promoting ‘sustainable healthy’ diets.18 This is a new, evolving and as yet not fully articulated agenda that requires considerable further intellectual development. However, interest from the FAO and World Health Organisation (WHO) in this concept echoes emerging work taking place in a number of developed countries (see Chapter Five), and highlights the growing interest in bringing ideas about sustainable consumption into debates about food.
Sustainable consumption: Consumption and consumerism carry different connotations in different contexts. In the UK, for example, these concepts are frequently linked in people’s minds to a range of social ills, from the apparently rampant materialism of our youth, to childhood obesity, and to the causes of the recent economic recession. These criticisms have led to calls for more ‘sustainable’ consumption, the argument being that we need to consume more ‘sustainably’ if we are to reduce the environmental damage our lifestyles cause. ‘Sustainable consumption’ has also come onto the policy agenda in Europe; the European Union (EU) has produced an action plan on the topic, set up a Roundtable, and in 2013 issued a Communication on Sustainable Food.19
18 FAO. (2012). Diets must become sustainable say FAO and Biodiversity. 8 August, http://www.fao.org/news/story/en/item/153694/ 19 European Commission. Sustainable food, http://ec.europa.eu/environment/eussd/food.htm
Food System ACTIvITIESProducing food
Processing and packaging foodDistributing and retailing food
Consuming food
Food System OuTCOMESContributing to:
Social welfare
Environ welfare
Food Security
Food utilisation
Food access
Foodavailability
GEC DRIvERSChanges in:
Land cover and soils, Atmospheric composition, climate
variability and means, water availability and quality, nutrient
availability and cycling, biodiversity, sea currents and
salinity, sea level
SocioeconomicDRIvERS
Changes in:Demographics, economics,
socio-political context, cultural context, science and
technology
DRIvERInteractions
‘Natural’ DRIvERS
e.g. Volcanoes solar cycles
Environmental feedbackse.g. water quality, GHGs
Socioeconomic feedbackse.g. livelihoods, social cohesion
Figure 3: The GECAFS model linking food security and global environmental change
Source: Ingram J, Ericksen, P and Liverman D (eds). (2010). Food Security and Global Environmental Change. London: Earthscan.
Appetite for Change: Social, economic and environmental transformations in China’s food system
18
But what ‘sustainable consumption’ actually means or looks like is debated. For some, sustainable consumption might mean ‘smarter consumption’, being resource efficient, and avoiding food waste. For others it might denote ‘better food’ – for example, buying food that has been certified in some way or that adheres to particular animal welfare standards. For others, sustainable consumption may mean not consuming a particular kind of food, for example by choosing to be vegetarian. In other words, sustainable consumption has many possible meanings, ranging from consuming ‘smarter’ or ‘better’, to consuming ‘less’, and considering a spectrum of socio-ethical and environmental dimensions. How different individuals and societies define ‘sustainable consumption’ will vary depending on their particular values as well as their socio-economic status. In a country such as the UK, where foods are abundant, and where per capita carbon footprints are very high, there is certainly scope to consider definitions that encompass the notion of ‘less’. This may also be true among wealthy, high-consuming individuals in China. However, for those who are emerging from a situation of food scarcity and insecurity, notions of ‘smarter’ or ‘better’ consumption may be more appropriate and acceptable.
Addressing these issues also requires an understanding of how and why people consume in particular ways.20 On this basis, policies and measures may be devised to encourage different groups to consume in more sustainable ways. In the UK, there is growing interest in exploring options such as social marketing strategies, labelling and awareness raising, as well as harder measures such as changes in food pricing or public procurement standards for catering in public institutions (e.g., schools and hospitals).21 The relevance of ‘sustainable consumption’ to a rapidly transforming country such as China is sure to differ from the application of the concept in developed countries, but our analysis of narratives around food in China suggests that the concept is increasingly relevant as different stakeholders work to address issues affecting several aspects of China’s food system.
Examples from around the world show that food sustainability challenges are increasingly being viewed through a food system lens by a diverse range of stakeholders. Important progress has been made in recent years in viewing food as a multifaceted problem and in recognising the need for solutions that do not address issues in isolation. At the same time, food system issues can be highly contested. There are therefore no simple solutions to the challenges we face in the food system, and addressing these issues will require collaboration among a diverse range of actors. The implications of a food system perspective for addressing challenges faced in China’s food system are explored in the final chapter (Chapter Seven).
20 Jackson T. (2005). Motivating Sustainable Consumption: a review of evidence on consumer behaviour and behavioural change. Guildford: Centre for Environmental Strategy, University of Surrey.21 Garnett T. (2012). Climate change and agriculture: can market governance mechanisms reduce emissions from the food system fairly and effectively? London: International Institute for Environment and Development.
Overview of changes and drivers in China’s food system
19
2
2 Overview of changes and drivers in China’s food system
This chapter provides a broad-brush description of the main characteristics of China’s food system today and how it is has changed over the last 35 years. This snapshot provides the general background that informs more detailed examination of trends, drivers and issues in the specific chapters on supply chain transformations, environment, health and food safety that follow.
2.1 China’s food system today: a snapshotThe substantial increase in production of agricultural commodities in China since the early 1980s is well documented.22 Output has increased largely as a result of increased production per unit of land area. While the volume and value of agricultural output has increased, its contribution to overall GDP and to employment has fallen. Significant migration from rural areas to towns and cities and increased off-farm employment in rural areas have reduced the proportion of the population employed in agriculture from close to 70% in 1980 to under 40% today. The productivity of agricultural labour has therefore increased. The structure of production has shifted from one dominated by staple grains towards increased production of higher value horticultural and animal products (livestock and aquaculture), both of which have seen substantial growth. China is virtually self-sufficient in key commodities, the exception being oilseeds, which it increasingly imports to feed its burgeoning livestock sector. It is also an important exporter of foods, particularly horticultural and aquaculture products.
There have been significant changes beyond the food production stage too. Food supply chains are becoming longer, more complex, more industrialised and increasingly focused on providing ‘higher value’ or ‘value-added’ products. China’s food system is also increasingly international in its reach: commodities and food products are both exported and imported. International food companies – which were virtually absent 35 years ago – play a significant role in production, food processing and manufacture, retailing and catering. Consumers can now access a more diverse range of foods through a variety of retail and catering outlets; this greater diversity, in combination with higher incomes and changing lifestyles, expectations and cultures, has led to substantial changes in what people eat. Consumption of grains has fallen while intakes of animal products (meat of all kinds as well as eggs, milk, fish and other aquaculture products), vegetable oils, sugar, processed foods, confectionery and alcohol have substantially increased.
This somewhat simplistic representation requires qualification. For example, while the proportion of the population engaged in agriculture has fallen, in absolute numbers, more people than ever 22 Fan S. (1991). Effects of technological change and institutional reform on production growth in Chinese agriculture. American Journal of Agricultural Economics (73): 266-275; Lin J. (1992). Rural reforms and agricultural growth in China. American Economic Review (82)1: 34-51; Norse D, Lu Y and Huang J. (2014). China’s food security: Is it a national, regional or global issue? In K Brown (ed). China and the EU in Context. London: Palgrave.
Appetite for Change: Social, economic and environmental transformations in China’s food system
20
before are farmers (a natural feature of overall population growth). Additionally, while recent years have seen the rapid rise of large manufacturers, supermarkets – both indigenous and foreign – and Western-style fast food outlets, these ‘modern’ formats cater to distinctly Chinese demands for food products and also coexist with traditional wet markets and traditional eating-out establishments. Consolidation, vertical integration and concentration in some supply chains – particularly in the livestock sector – coexist with smallholder production, particularly in the horticultural, cropping and aquaculture sectors. The ‘modern’ and the ‘traditional’ sectors are by no means distinct, as small-scale vegetable producers supply large-scale, modern supermarkets. There are also variations on these general themes: food provisioning patterns differ substantially by region, between urban and rural areas, and among people of different age, education and economic status.
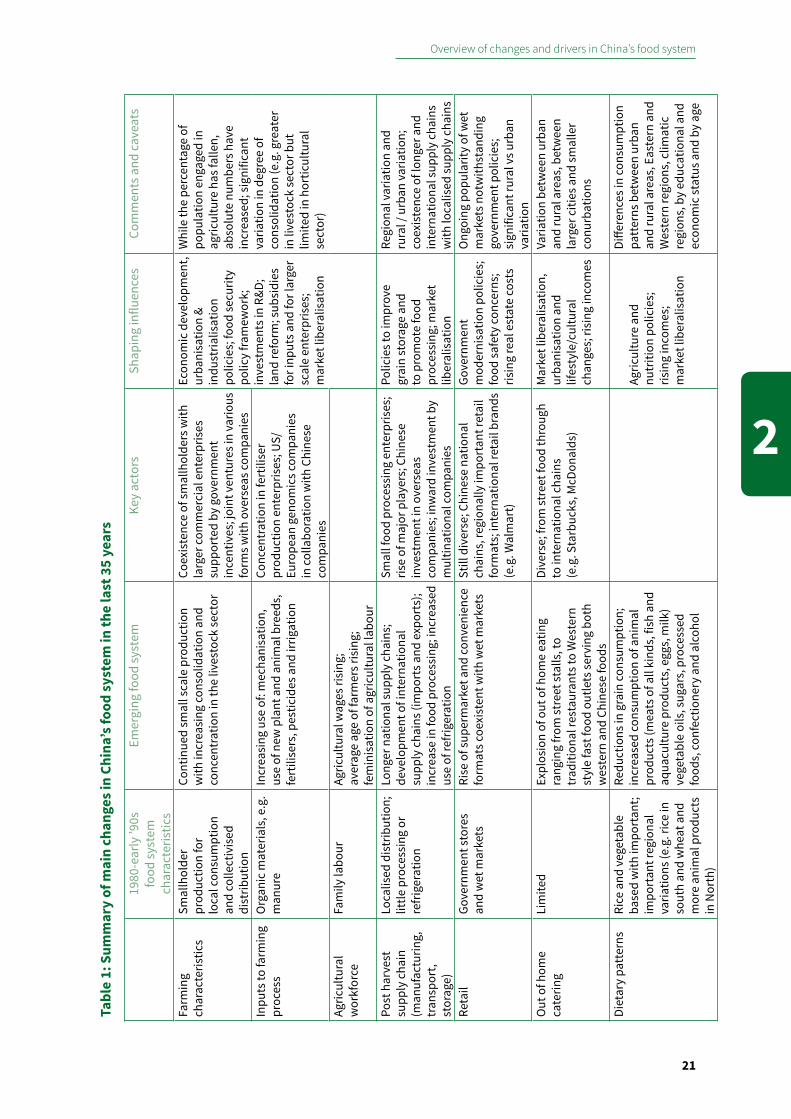
Table 1 summarises some of the changes that have taken place in the food system in the last 35 years, alongside the shaping influences. Specific trends affecting key aspects of China’s food system are described in more detail in the following chapters.
2.2 Overarching drivers of change Each subsector in agricultural production and each process in China’s food system is undergoing various changes affected by a number of specific factors. Furthermore, the changes that are occurring within the supply chain are in turn influencing other aspects of the food system. Among this complexity, however, there are a few overarching influences on the food system that cut across all parts of the system. These include economic growth, demographic change (including population growth, rural-urban migration and declining fertility), government policies, and environmental change. A summary of these driving forces is provided here as a background to the more detailed examination provided in subsequent chapters.
2.2.1 Economic growth
The most significant driver of change in China has been its rapid economic growth. This is a story often told, well known and therefore not discussed in detail here.23 One key point to highlight is the critical role that agricultural growth has played in driving growth in other sectors of the economy. Agricultural growth and increases in agricultural productivity have made significant contributions to overall economic growth in China.24 Likewise, economic growth and its associated transformations in the economy as a whole have been major drivers of change in agriculture: economic growth has led to shifts in the number of people employed in agriculture, in the methods and scale of production, and in food industry developments further along the supply chain (logistics, manufacturing, retailing and catering). Along with urbanisation and rising incomes, it has also contributed to changes in the types of food that people aspire to consume.
Rising prosperity for individuals has also had a huge impact on the evolution of the food system and its impacts. Consumers can now afford more food and also demand more varied diets. With
23 Findlay C, Martin W and Watson A. (1993). Policy reform, economic growth and China’s agriculture. Paris: OECD; Chow G. (2002). China’s Economic Transformation. Oxford: Blackwell; IMF. (2013). China’s Economy in Transition. Washington D.C.: IMF.24 Huang J, Otsuka K and Rozelle S. (2007). The role of agriculture in China’s development: past failures; present successes, and future challenges. In L Brandt and T Rawski (eds). China’s Economic Transition: Origins, Mechanisms, and Consequences. Cambridge: Cambridge University Press. pp. 467-505.
Overview of changes and drivers in China’s food system
21
2
Tabl
e 1:
Sum
mar
y of
mai
n ch
ange
s in
Chin
a’s f
ood
syst
em in
the
last
35
year
s
1980
-ear
ly ’9
0s
food
syst
em
char
acte
ristic
s
Emer
ging
food
syst
emKe
y ac
tors
Shap
ing
influ
ence
sCo
mm
ents
and
cav
eats
Farm
ing
char
acte
ristic
s Sm
allh
olde
r pr
oduc
tion
for
loca
l con
sum
ptio
n an
d co
llect
ivis
ed
dist
ribut
ion
Cont
inue
d sm
all s
cale
pro
duct
ion
with
incr
easi
ng co
nsol
idat
ion
and
conc
entr
atio
n in
the
lives
tock
sect
or
Coex
iste
nce
of sm
allh
olde
rs w
ith
larg
er co
mm
erci
al e
nter
pris
es
supp
orte
d by
gov
ernm
ent
ince
ntiv
es; j
oint
ven
ture
s in
vario
us
form
s with
ove
rsea
s com
pani
es
Econ
omic
dev
elop
men
t, ur
bani
satio
n &
indu
stria
lisat
ion
polic
ies;
food
secu
rity
polic
y fra
mew
ork;
in
vest
men
ts in
R&D
; la
nd re
form
; sub
sidi
es
for i
nput
s and
for l
arge
r sc
ale
ente
rpris
es;
mar
ket l
iber
alis
atio
n
Whi
le th
e pe
rcen
tage
of
popu
latio
n en
gage
d in
ag
ricul
ture
has
falle
n,
abso
lute
num
bers
hav
e in
crea
sed;
sign
ifica
nt
varia
tion
in d
egre
e of
co
nsol
idat
ion
(e.g
. gre
ater
in
live
stoc
k se
ctor
but
lim
ited
in h
ortic
ultu
ral
sect
or)
Inpu
ts to
farm
ing
proc
ess
Org
anic
mat
eria
ls, e
.g.
man
ure
Incr
easi
ng u
se o
f: m
echa
nisa
tion,
us
e of
new
pla
nt a
nd a
nim
al b
reed
s,
fert
ilise
rs, p
estic
ides
and
irrig
atio
n
Conc
entr
atio
n in
fert
ilise
r pr
oduc
tion
ente
rpris
es; U
S/Eu
rope
an g
enom
ics c
ompa
nies
in
colla
bora
tion
with
Chi
nese
co
mpa
nies
Agric
ultu
ral
wor
kfor
ceFa
mily
labo
urAg
ricul
tura
l wag
es ri
sing
; av
erag
e ag
e of
farm
ers r
isin
g;
fem
inis
atio
n of
agr
icul
tura
l lab
our
Post
har
vest
su
pply
cha
in
(man
ufac
turin
g,
tran
spor
t, st
orag
e)
Loca
lised
dis
trib
utio
n;
little
pro
cess
ing
or
refr
iger
atio
n
Long
er n
atio
nal s
uppl
y ch
ains
; de
velo
pmen
t of i
nter
natio
nal
supp
ly c
hain
s (im
port
s and
exp
orts
); in
crea
se in
food
pro
cess
ing;
incr
ease
d us
e of
refr
iger
atio
n
Smal
l foo
d pr
oces
sing
ent
erpr
ises
; ris
e of
maj
or p
laye
rs; C
hine
se
inve
stm
ent i
n ov
erse
as
com
pani
es; i
nwar
d in
vest
men
t by
mul
tinat
iona
l com
pani
es
Polic
ies t
o im
prov
e gr
ain
stor
age
and
to p
rom
ote
food
pr
oces
sing
; mar
ket
liber
alis
atio
n
Regi
onal
var
iatio
n an
d ru
ral /
urb
an v
aria
tion;
co
exis
tenc
e of
long
er a
nd
inte
rnat
iona
l sup
ply
chai
ns
with
loca
lised
supp
ly c
hain
sRe
tail
Gove
rnm
ent s
tore
s an
d w
et m
arke
tsRi
se o
f sup
erm
arke
t and
conv
enie
nce
form
ats c
oexi
sten
t with
wet
mar
kets
Still
div
erse
; Chi
nese
nat
iona
l ch
ains
, reg
iona
lly im
port
ant r
etai
l fo
rmat
s; in
tern
atio
nal r
etai
l bra
nds
(e.g
. Wal
mar
t)
Gove
rnm
ent
mod
erni
satio
n po
licie
s;
food
safe
ty co
ncer
ns;
risin
g re
al e
stat
e co
sts
Ong
oing
pop
ular
ity o
f wet
m
arke
ts n
otw
ithst
andi
ng
gove
rnm
ent p
olic
ies;
si
gnifi
cant
rura
l vs u
rban
va
riatio
nO
ut o
f hom
e ca
terin
gLi
mite
dEx
plos
ion
of o
ut o
f hom
e ea
ting
rang
ing
from
stre
et st
alls
, to
trad
ition
al re
stau
rant
s to
Wes
tern
st
yle
fast
food
out
lets
serv
ing
both
w
este
rn a
nd C
hine
se fo
ods
Dive
rse;
from
stre
et fo
od th
roug
h to
inte
rnat
iona
l cha
ins
(e.g
. Sta
rbuc
ks, M
cDon
alds
)
Mar
ket l
iber
alis
atio
n,
urba
nisa
tion
and
lifes
tyle
/cul
tura
l ch
ange
s; ri
sing
inco
mes
Varia
tion
betw
een
urba
n an
d ru
ral a
reas
, bet
wee
n la
rger
citi
es a
nd sm
alle
r co
nurb
atio
ns
Diet
ary
patt
erns
Rice
and
veg
etab
le
base
d w
ith im
port
ant;
impo
rtan
t reg
iona
l va
riatio
ns (e
.g. r
ice
in
sout
h an
d w
heat
and
m
ore
anim
al p
rodu
cts
in N
orth
)
Redu
ctio
ns in
gra
in co
nsum
ptio
n;
incr
ease
d co
nsum
ptio
n of
ani
mal
pr
oduc
ts (m
eats
of a
ll ki
nds,
fish
and
aq
uacu
lture
pro
duct
s, e
ggs,
milk
) ve
geta
ble
oils
, sug
ars,
pro
cess
ed
food
s, co
nfec
tione
ry a
nd a
lcoh
ol
Agric
ultu
re a
nd
nutr
ition
pol
icie
s;
risin
g in
com
es;
mar
ket l
iber
alis
atio
n
Diffe
renc
es in
cons
umpt
ion
patt
erns
bet
wee
n ur
ban
and
rura
l are
as, E
aste
rn a
nd
Wes
tern
regi
ons,
clim
atic
re
gion
s, b
y ed
ucat
iona
l and
ec
onom
ic st
atus
and
by
age
Appetite for Change: Social, economic and environmental transformations in China’s food system
22
the growth in consumer spending power has come an increase in demand for animal products, sugars, and processed foods, as well as changes in how and where food is consumed – often in restaurants, of both the traditional and Western fast-food variety. Prosperity has also influenced people’s values and expectations about food. Conspicuous consumption of food has become a social concern and, among some social groups, worries about health, the environment and animal welfare are on the rise. These are discussed further in Chapters Four and Five and in the Focus on Livestock chapter.
2.2.2 Food security policies
Ensuring food security for China’s population is a fundamental pillar of government policy. At its core is an emphasis on achieving self-sufficiency in basic protein-energy-providing grain crops. Policies to support agricultural production have played a key role in ensuring that output has grown faster than population growth, and that changing demand for food products has been met. Interestingly, while English language discussions about food security often continue to focus on production and supply of food commodities25 – reflecting the narrower definition of food security – the approach to food security adopted in related Chinese policy processes goes beyond a simple focus on protein-energy sufficiency.
Food policies in China reflect a broader range of concerns, including accessibility and affordability, quality (nutritious, safe, culturally appropriate food), utilisation (adequate sanitation, storage and cooking facilities) and stability (the presence of these conditions over time). Policy efforts to achieve food security in this wider sense include a suite of food and nutrition policies that are explicitly linked with agricultural production policies (see Chapter Five) and that focus particularly on rural areas and vulnerable groups. Although earlier policies generally focused on food production, more recent policy documents also emphasise nutrition, development of the food processing industry, and food safety. Most recently, there has been some relaxation of the basic food sufficiency target, indicating increased awareness of the role of international trade in China’s overall food security. In part because of the strong fiscal ability of the government to guide and support changes throughout the food system, many policies and programmes have directly impacted ways in which food are produced, processed and distributed. Some policies have also had adverse unintended consequences, some of which are explored in the chapters on environment and health.
2.2.3 Changing population structure
The need to feed China’s growing population has been an important factor in guiding agriculture and food supply policies (see Chapter Three). The sheer size of China’s population means that this will continue to be a driving consideration in related policy areas, but the success of the one child policy has meant that population growth per se is no longer a consideration. Indeed, China’s current population of 1.34 billion is anticipated to peak at about 1.4 billion by 2030 and then decline to about 1.25 billion by 2050.26 Other aspects of demographic change, however, are emerging as potentially significant drivers of change in coming years, notably urbanisation and population ageing. 25 Norse D, Lu Y and Huang J. (2014). China’s food security: Is it a national, regional or global issue? In K Brown (ed). China and the EU in Context. London: Palgrave.26 UN DESA. (2010). World Population Prospects: The 2010 Revision. New York: UN DESA; UN DESA. (2011). World Urbanization Prospects: The 2011 Revision, http://esa.un.org/unpd/wpp/country-profiles/country-profiles_1.htm.
Overview of changes and drivers in China’s food system
23
2
China’s population is increasingly urbanised, partly as a consequence of government policies actively promoting migration to urban centres, and partly as an inevitable consequence of the process of industrialisation. China’s urban population has increased steadily over the last 30 years, from 191 million in 1980, to 636 million in 2010, and the United Nations projects that it will be over a billion by 2050.27 The urbanisation rate passed 51% in 2011, up from 19% in 1979, and is projected to exceed 77% by 2050.28 The total number of cities in China grew from 193 in 1978 to 655 in 2008, and the number with more than one million people from 13 to 58. Urban built-up area increased five-fold from 1981-2008.29 Recent government policies focus on promoting urbanisation particularly in smaller cities, while also continuing measures to support rural development. The size of the migrant population in urban areas is also considerable. Official statistics report that there were 211 million rural-urban migrants in 2009, and this is expected to rise to 350 million in 2050.30
Urbanisation – both permanent and temporary – has had a profound impact not only on the labour force available for agricultural production, but also on the consumption drivers influencing production and on people’s physical requirements for food. The migration of able-bodied workers to the cities has reduced the workforce in rural areas, and in some areas there is now a shortage of agricultural labour (see Chapter Three). Urbanisation has also given rise to new supply chain requirements and challenges. These include the need for transport and refrigeration infrastructure and finding ways of managing large amounts of municipal waste. Urbanisation has increased people’s exposure to marketing and outside influences and has helped generate new demand for food. Moreover, urbanisation not only influences the development of new dietary patterns and food demands, but also changes bodily metabolic and nutrient requirements as urban lifestyles become less active, giving rise to a number of health problems (see Chapter Five). The migrant population living in urban areas may also have an influence on consumption patterns in rural areas, both by increasing spending power in rural areas through remittances but also by introducing new dietary expectations and consumption patterns.
Urbanisation has also generated environmental pressures. Despite official policies to safeguard key arable land resources, the land required for urban and industrial development places pressure on agricultural land. There are also significant environmental health risks associated with the influence of urban and industrial pollution on agricultural land and vice versa. These issues are discussed further in Chapter Four.
Meeting the needs of an ageing population is a challenge that China shares with many developed countries. An older average age structure will impact on the agricultural labour force and give rise to new health requirements. Fewer people will be able to engage in physically demanding agricultural activities. This is likely to give further impetus to efforts to consolidate land and mechanise the agricultural sector. An elderly population will give rise to new nutritional (and overall health) needs, and may also incentivise the development of new food products and retailing systems catering to less mobile populations.
27 UN DESA. (2010). World Population Prospects: The 2010 Revision. New York: UN DESA.28 National Bureau of Statistics. (2011). China Statistical Yearbook 2011. Beijing: China Statistics Press; UN DESA. (2011). World Urbanization Prospects: The 2011 Revision, http://esa.un.org/unpd/wpp/country-profiles/country-profiles_1.htm. An urbanised area is defined in China’s 2000 census as one with more than 1500 people per km², and the criterion for urban residence is a minimum of six months’ residence.29 Yeh A, Xu J and Liu K. (2011). China’s Post-Reform Urbanization: Retrospect, Policies and Trends. London: IIED.30 Yeh A, Xu J and Liu K. (2011). China’s Post-Reform Urbanization: Retrospect, Policies and Trends. London: IIED.
Appetite for Change: Social, economic and environmental transformations in China’s food system
24
2.3 Future drivers of change As China’s food system evolves, a number of shaping forces are likely to have an increasing influence on its future direction. Incomes are projected to continue growing, and an increasing proportion of the future population is certain to live in urban areas. These factors will continue to be major drivers of increasing demand, and a changing structure of demand. As China’s population ages, and if the trends towards increasingly sedentary lifestyles in combination with overconsumption continue, then the consequent growing burden of chronic diseases within China’s population may trigger more robust government action.
Government policies and industry trends will continue to promote increased productivity and increasing value of output. Efforts to address food safety concerns are likely to continue to support increased scale of production in agriculture as well as vertical integration of supply chains and the development of large-scale processing firms. Whether land consolidation measures are introduced or not, land policies will be a major determinant of livelihood options for rural inhabitants. Contract farming, land leasing and other forms of vertical coordination within supply chains may become more common modes of managing supply chain relationships. Approaches to addressing food safety, such as traceability systems and other market entry requirements, may also promote changes in supply chain relationships.
Environmental constraints may also have profound effects on China’s food system, particularly in the longer term. These include the decline in land availability and quality within China, resulting in part from the negative environmental consequences of current production systems. The impacts of climate change both within China and on regions on which China’s imports depend are also likely to influence the food system, in biophysical terms and as influences on future policy. China’s growing engagement in international trade may also require action to overcome non-trade barriers, in the areas of food safety, animal health and welfare, and the environment. Finally, the attitudes of Chinese citizens to the food system itself will influence future policy. These include attitudes that can be characterised as materialistic – the desire for more novel, luxurious or aspirational foods – as well as those that signal greater concern for public goods, such as food safety, the environment, or animal welfare.
The sometimes contradictory relationships between these themes are captured in the narratives on the future shape of China’s food system presented in Chapter 7. Figure 4 summarises the key historical and current trends, their drivers, and the main issues facing China’s food system in the future.

Overview of changes and drivers in China’s food system
25
2
1. D
rive
rs4.
Nar
rativ
e th
emes
3. T
rend
s and
out
com
es2.
Cha
nges
Hea
lth
tran
sfor
mat
ions
Issu
es:
less
mal
nutr
ition
; m
ore
obes
ity;
food
safe
ty
Envi
ronm
enta
l tr
ansf
orm
atio
nsIs
sues
: GH
Gsw
ater
ava
ilabi
lity
& po
llutio
n
Food
na
rrat
ives
:
Tow
ards
food
su
stai
nabi
lity?
Supp
ly c
hain
tr
ansf
orm
atio
nsIs
sues
: Ch
angi
ng la
bour
mar
kets
; m
igra
tion;
ch
angi
ng b
usin
ess
stru
ctur
es;
cons
umer
cho
ice;
ne
w g
over
nanc
e ch
alle
nges
Agri
cult
ural
cha
nges
Prod
uctiv
ity
incr
ease
sTe
chni
cal i
nnov
atio
nIn
crea
sed
use
agro
-inpu
tsFe
ed im
port
sIn
crea
sing
im
port
ance
of
lives
tock
pro
duct
ion
Rura
l-urb
an
mig
ratio
n Po
st h
arve
st
chan
ges
Chan
ging
reta
il st
ruct
ures
Conc
entr
atio
n &
vert
ical
inte
grat
ion
Inw
ard
inve
stm
ent
Logi
stic
s in
frast
ruct
ure
Adve
rtis
ing
Mor
e w
aste
Cons
umpt
ion
chan
ges
Mor
e m
eat,
dairy
&
aqua
cultu
re, f
ruit
and
vege
tabl
e oi
lsfe
wer
veg
etab
les,
ce
real
s and
legu
mes
Food
ab
unda
nce:
‘d
iver
se a
nd
plea
sura
ble
food
’
Food
suffi
cien
cy:
‘eno
ugh
food
’
Food
qua
lity:
‘s
afe
food
’
Glob
al
influ
ence
s
WTO
Ove
rsea
s tra
de
stan
dard
s
Ope
n m
arke
ts
Biop
hysi
cal
influ
ence
sGl
obal
en
viro
nmen
tal
chan
ge
Reso
urce
co
nstr
aint
s (la
nd, w
ater
, en
ergy
)
Cons
umpt
ion
driv
ers
Risi
ng in
com
esDe
mog
raph
ic c
hang
eO
ne c
hild
fam
ilyEd
ucat
ion
Urb
anis
atio
n Ch
angi
ng e
xpec
tatio
ns,
pref
eren
ces &
val
ues
Polic
y dr
iver
sM
arke
t lib
eral
isat
ion
Bios
ecur
ity p
olic
ies
Anim
al w
elfa
re p
olic
ies
Nut
ritio
n po
licie
sFo
od se
curit
y po
licie
sRe
sour
ce p
ress
ures
Food
safe
ty p
olic
ies
Urb
anis
atio
n po
licie
sBi
oene
rgy
polic
ies
Figu
re 4
: Su
mm
ary
of tr
ends
and
cha
nges
, dri
vers
and
issu
es in
Chi
na’s
food
syst
em
Appetite for Change: Social, economic and environmental transformations in China’s food system
26
3 Supply chain transformations
This chapter is structured as follows. Section 3.1 looks at transformations in the agricultural sector, describing the key changes that have occurred and the drivers underpinning them. Section 3.2 considers climate change and land degradation, two emerging drivers of future change in the agricultural system. Subsequent sections focus on the post-harvest stages in the supply chain that are less well documented in the academic and policy literatures: Section 3.3 considers changes in the food processing and transport sectors, Section 3.4 looks at retailing, and Section 3.5 at the catering sectors. Section 3.6 considers changing consumption patterns.
3.1 Agricultural transformationsSix key transformations characterise changes in China’s agricultural supply chains:
� Changing contribution of agriculture to livelihoods and the economy; � Substantial increases in food output; � A shift towards higher value food production; � Greater interaction between China’s food supply chain and the rest of the world; � Transformations in the structure, scale and locality of production within China; and � Changes in the market and in demand.
These key transformations are discussed in turn.
3.1.1 Changing contribution of agriculture to livelihoods and the economy
In the 1970s, agriculture made a significant contribution to China’s economy, accounting for 40% of GDP in 1970. By 2007 its share had fallen to 11%. Similarly, while 80% of the workforce was engaged in agriculture in 1970, by 2009 this had fallen to 38%, a figure that also includes those working part time in agriculture.31 This decline in the contribution of agriculture is reflected in an increase in the contribution of off-farm income sources – especially wage labour – to rural livelihoods. Off-farm incomes now contribute about half of all rural incomes (Figure 5).
However the relative decline in agriculture’s contribution to the economy and employment masks two important points. First, there has been an absolute increase in the economic value of agriculture, due not only to growth in overall output but also to shifts towards higher value production (see 3.1.2 below). Second, although many agricultural workers actually derive a substantial proportion of their income from non-farm activities, and the absolute number of people engaged in agriculture has gradually declined, an estimated 200 million smallholders continue to engage in farming.
31 Carter C A, Zhong F and Zhu J. (2012). Advances in Chinese agriculture and its global implications. Applied Economic Perspectives and Policy, (34): 1-36.
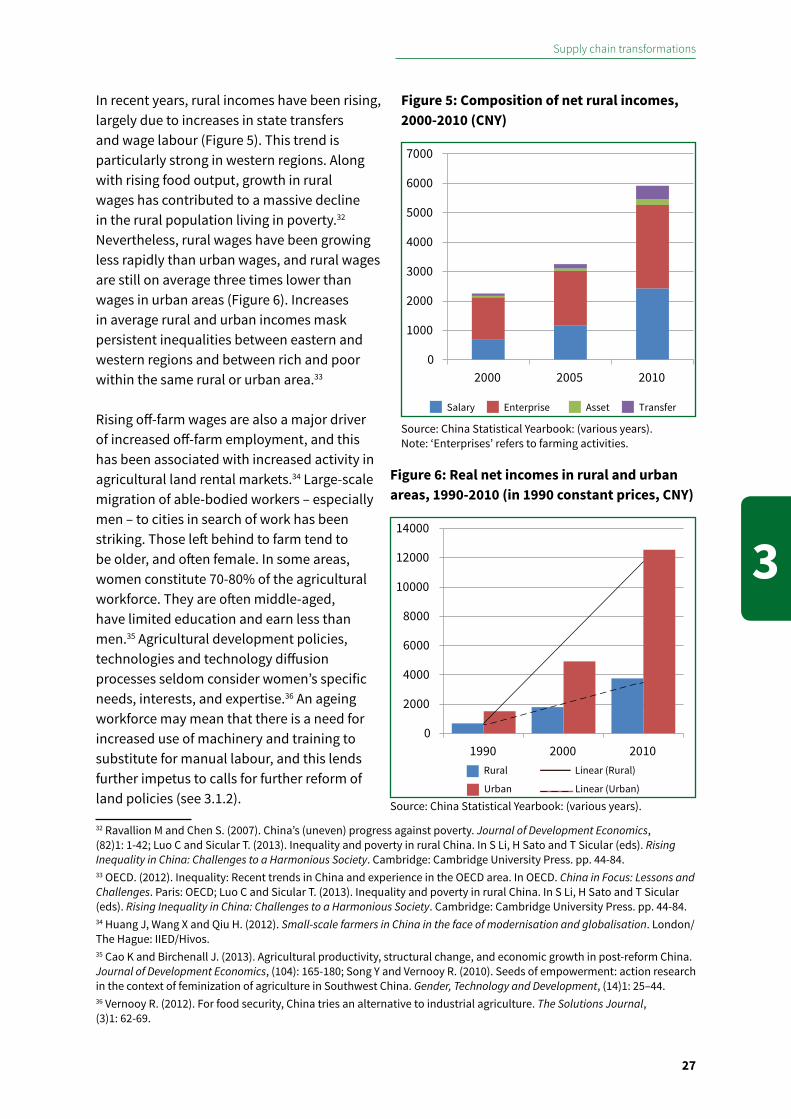
Supply chain transformations
27
3
In recent years, rural incomes have been rising, largely due to increases in state transfers and wage labour (Figure 5). This trend is particularly strong in western regions. Along with rising food output, growth in rural wages has contributed to a massive decline in the rural population living in poverty.32 Nevertheless, rural wages have been growing less rapidly than urban wages, and rural wages are still on average three times lower than wages in urban areas (Figure 6). Increases in average rural and urban incomes mask persistent inequalities between eastern and western regions and between rich and poor within the same rural or urban area.33
Rising off-farm wages are also a major driver of increased off-farm employment, and this has been associated with increased activity in agricultural land rental markets.34 Large-scale migration of able-bodied workers – especially men – to cities in search of work has been striking. Those left behind to farm tend to be older, and often female. In some areas, women constitute 70-80% of the agricultural workforce. They are often middle-aged, have limited education and earn less than men.35 Agricultural development policies, technologies and technology diffusion processes seldom consider women’s specific needs, interests, and expertise.36 An ageing workforce may mean that there is a need for increased use of machinery and training to substitute for manual labour, and this lends further impetus to calls for further reform of land policies (see 3.1.2).
32 Ravallion M and Chen S. (2007). China’s (uneven) progress against poverty. Journal of Development Economics, (82)1: 1-42; Luo C and Sicular T. (2013). Inequality and poverty in rural China. In S Li, H Sato and T Sicular (eds). Rising Inequality in China: Challenges to a Harmonious Society. Cambridge: Cambridge University Press. pp. 44-84.33 OECD. (2012). Inequality: Recent trends in China and experience in the OECD area. In OECD. China in Focus: Lessons and Challenges. Paris: OECD; Luo C and Sicular T. (2013). Inequality and poverty in rural China. In S Li, H Sato and T Sicular (eds). Rising Inequality in China: Challenges to a Harmonious Society. Cambridge: Cambridge University Press. pp. 44-84.34 Huang J, Wang X and Qiu H. (2012). Small-scale farmers in China in the face of modernisation and globalisation. London/The Hague: IIED/Hivos.35 Cao K and Birchenall J. (2013). Agricultural productivity, structural change, and economic growth in post-reform China. Journal of Development Economics, (104): 165-180; Song Y and Vernooy R. (2010). Seeds of empowerment: action research in the context of feminization of agriculture in Southwest China. Gender, Technology and Development, (14)1: 25–44.36 Vernooy R. (2012). For food security, China tries an alternative to industrial agriculture. The Solutions Journal, (3)1: 62-69.
0
1000
2000
3000
4000
5000
6000
7000
2000 2005 2010
Salary Enterprise Asset Transfer
Figure 5: Composition of net rural incomes, 2000-2010 (CNY)
Source: China Statistical Yearbook: (various years).Note: ‘Enterprises’ refers to farming activities.
0
2000
4000
6000
8000
10000
12000
14000
1990 2000 2010Rural
Urban
Linear (Rural)
Linear (Urban)
Source: China Statistical Yearbook: (various years).
Figure 6: Real net incomes in rural and urban areas, 1990-2010 (in 1990 constant prices, CNY)

Appetite for Change: Social, economic and environmental transformations in China’s food system
28
3.1.2 Substantial increases in food output
Despite the declining contribution of agriculture to the economy, growth in total food output has been strong. Cereal production increased by a quarter, or more than 1% per year, from 1990-2011 (Figure 7). Growth in vegetable and fruit production has also been significant, and increases in crop productivity and output have enabled rapid growth in livestock production (see Focus on Livestock chapter).
Early in China’s economic reform process, changes in land tenure and marketing policies had a substantial impact on agricultural productivity. Introduction of the Household Responsibility System in the early 1980s gave farmers greater freedom to decide what to grow and the ability to sell surpluses on the free market. Incomes rose, production (as well as the range of foods produced) increased, rural labourers were freed to take more profitable off-farm work, new enterprises were set up to process food, and new goods were produced.37 However, tenure policy change and marketing liberalisation do not provide sustained benefits for productivity, and land tenure policy is again under discussion. Land holdings are small and fragmented, but current agricultural land policies constrain farmers’ rights to lease or buy and sell land. The average farm has 0.6 hectares (ha) of land, and this is broken down further into plots averaging less than 0.1 ha. The last decade of the 20th century actually saw a reduction in average farm size, although with the evolution of land rental markets, average farm size is starting to increase again.38 Many argue that to improve the efficiency of agricultural land use and increase productivity, land consolidation
37 Huang J and Rozelle S. (2009). Agricultural Development and Nutrition: The Policies Behind China’s Success. Rome: World Food Programme.38 Huang J, Wang X and Qiu H. (2012). Small-scale farmers in China in the face of modernisation and globalisation. London/The Hague: IIED/Hivos; Jia X, Huang J and Xu Z. (2012). Marketing of farmer professional cooperatives in the wave of transformed agricultural markets in China. China Economic Review, (23): 665-674; Huang J and Rozelle S. (2009). Agricultural Development and Nutrition: The Policies Behind China’s Success. Rome: World Food Programme; Carter C, Zhong F and Zhu J. (2012). Advances in Chinese agriculture and its global implications. Applied Economic Perspectives and Policy, (34): 1-36.
0
200
400
600
800
1000
1200
1400
1600
1990
1991
1992
1993
1994
1995
1996
1997
1998
1999
2000
2001
2002
2003
2004
2005
2006
2007
2008
2009
2010
2011
mill
ion
tonn
es
Cereals Fruit Oilcrops Tubers Vegetables
Figure 7: Total output of main agricultural crops, 1990-2010
Source: FAOSTAT.
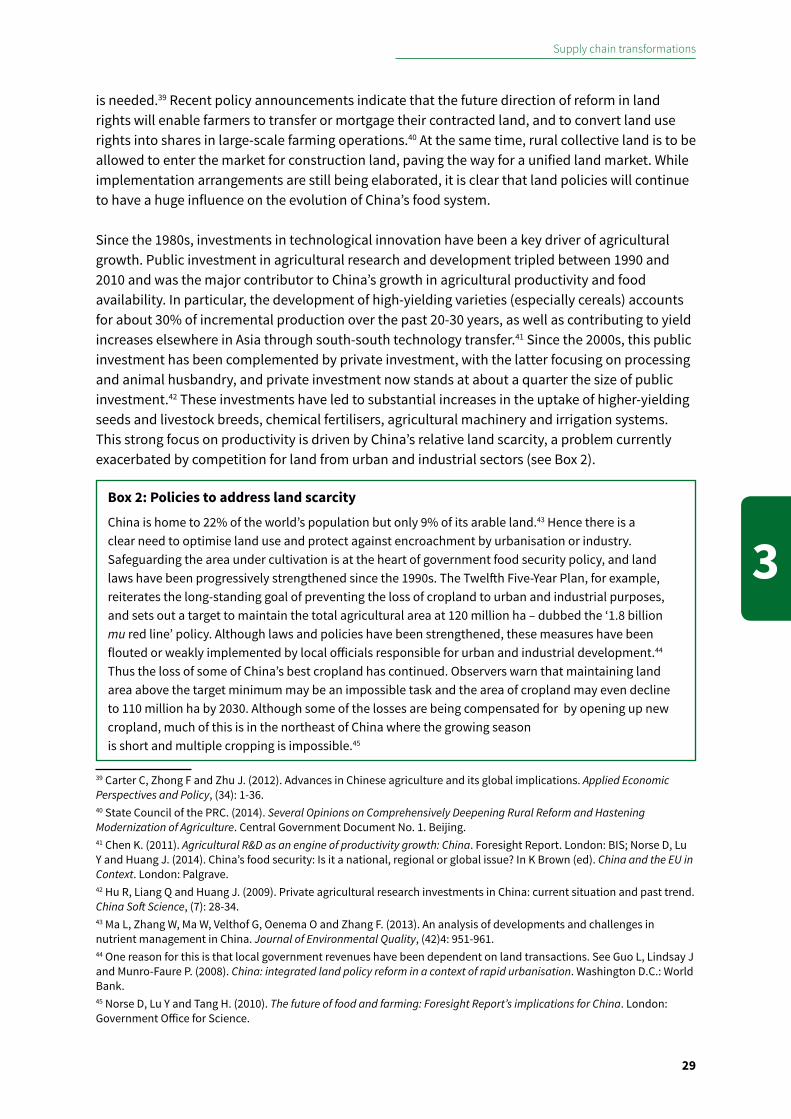
Supply chain transformations
29
3
is needed.39 Recent policy announcements indicate that the future direction of reform in land rights will enable farmers to transfer or mortgage their contracted land, and to convert land use rights into shares in large-scale farming operations.40 At the same time, rural collective land is to be allowed to enter the market for construction land, paving the way for a unified land market. While implementation arrangements are still being elaborated, it is clear that land policies will continue to have a huge influence on the evolution of China’s food system.
Since the 1980s, investments in technological innovation have been a key driver of agricultural growth. Public investment in agricultural research and development tripled between 1990 and 2010 and was the major contributor to China’s growth in agricultural productivity and food availability. In particular, the development of high-yielding varieties (especially cereals) accounts for about 30% of incremental production over the past 20-30 years, as well as contributing to yield increases elsewhere in Asia through south-south technology transfer.41 Since the 2000s, this public investment has been complemented by private investment, with the latter focusing on processing and animal husbandry, and private investment now stands at about a quarter the size of public investment.42 These investments have led to substantial increases in the uptake of higher-yielding seeds and livestock breeds, chemical fertilisers, agricultural machinery and irrigation systems. This strong focus on productivity is driven by China’s relative land scarcity, a problem currently exacerbated by competition for land from urban and industrial sectors (see Box 2).
Box 2: Policies to address land scarcity
China is home to 22% of the world’s population but only 9% of its arable land.43 Hence there is a clear need to optimise land use and protect against encroachment by urbanisation or industry. Safeguarding the area under cultivation is at the heart of government food security policy, and land laws have been progressively strengthened since the 1990s. The Twelfth Five-Year Plan, for example, reiterates the long-standing goal of preventing the loss of cropland to urban and industrial purposes, and sets out a target to maintain the total agricultural area at 120 million ha – dubbed the ‘1.8 billion mu red line’ policy. Although laws and policies have been strengthened, these measures have been flouted or weakly implemented by local officials responsible for urban and industrial development.44 Thus the loss of some of China’s best cropland has continued. Observers warn that maintaining land area above the target minimum may be an impossible task and the area of cropland may even decline to 110 million ha by 2030. Although some of the losses are being compensated for by opening up new cropland, much of this is in the northeast of China where the growing season is short and multiple cropping is impossible.45
39 Carter C, Zhong F and Zhu J. (2012). Advances in Chinese agriculture and its global implications. Applied Economic Perspectives and Policy, (34): 1-36.40 State Council of the PRC. (2014). Several Opinions on Comprehensively Deepening Rural Reform and Hastening Modernization of Agriculture. Central Government Document No. 1. Beijing.41 Chen K. (2011). Agricultural R&D as an engine of productivity growth: China. Foresight Report. London: BIS; Norse D, Lu Y and Huang J. (2014). China’s food security: Is it a national, regional or global issue? In K Brown (ed). China and the EU in Context. London: Palgrave.42 Hu R, Liang Q and Huang J. (2009). Private agricultural research investments in China: current situation and past trend. China Soft Science, (7): 28-34.43 Ma L, Zhang W, Ma W, Velthof G, Oenema O and Zhang F. (2013). An analysis of developments and challenges in nutrient management in China. Journal of Environmental Quality, (42)4: 951-961.44 One reason for this is that local government revenues have been dependent on land transactions. See Guo L, Lindsay J and Munro-Faure P. (2008). China: integrated land policy reform in a context of rapid urbanisation. Washington D.C.: World Bank.45 Norse D, Lu Y and Tang H. (2010). The future of food and farming: Foresight Report’s implications for China. London: Government Office for Science.
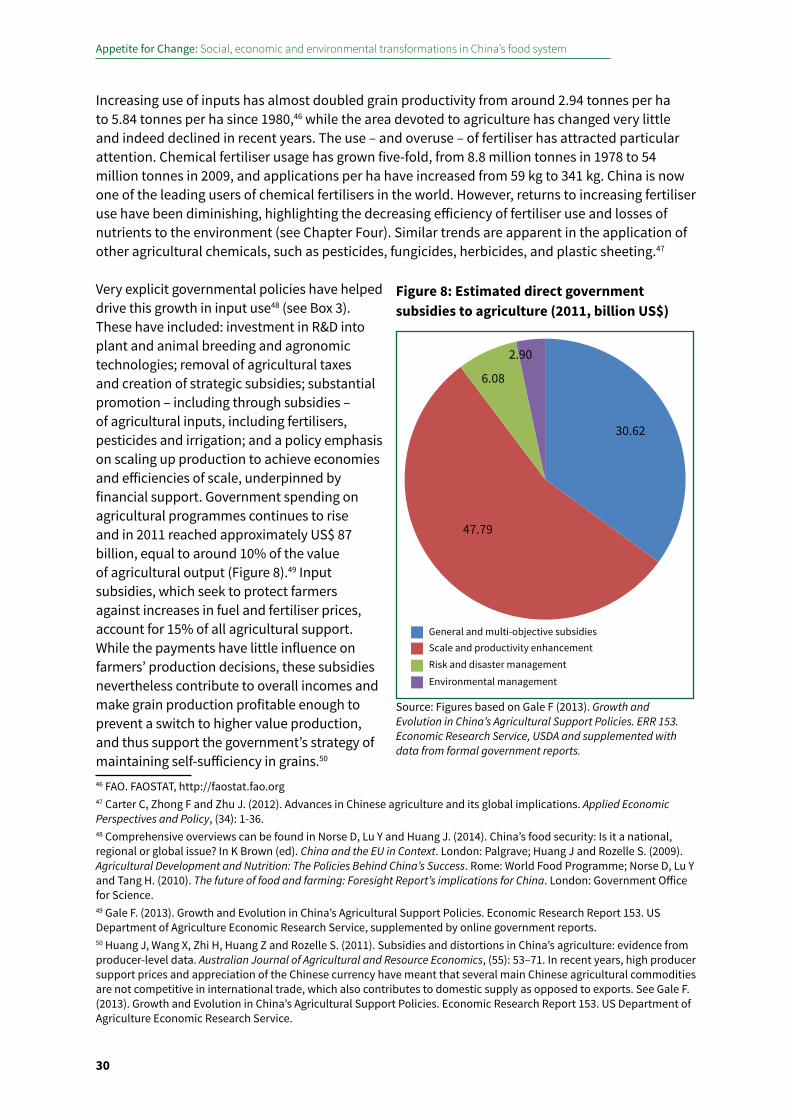
Appetite for Change: Social, economic and environmental transformations in China’s food system
30
Increasing use of inputs has almost doubled grain productivity from around 2.94 tonnes per ha to 5.84 tonnes per ha since 1980,46 while the area devoted to agriculture has changed very little and indeed declined in recent years. The use – and overuse – of fertiliser has attracted particular attention. Chemical fertiliser usage has grown five-fold, from 8.8 million tonnes in 1978 to 54 million tonnes in 2009, and applications per ha have increased from 59 kg to 341 kg. China is now one of the leading users of chemical fertilisers in the world. However, returns to increasing fertiliser use have been diminishing, highlighting the decreasing efficiency of fertiliser use and losses of nutrients to the environment (see Chapter Four). Similar trends are apparent in the application of other agricultural chemicals, such as pesticides, fungicides, herbicides, and plastic sheeting.47
Very explicit governmental policies have helped drive this growth in input use48 (see Box 3). These have included: investment in R&D into plant and animal breeding and agronomic technologies; removal of agricultural taxes and creation of strategic subsidies; substantial promotion – including through subsidies – of agricultural inputs, including fertilisers, pesticides and irrigation; and a policy emphasis on scaling up production to achieve economies and efficiencies of scale, underpinned by financial support. Government spending on agricultural programmes continues to rise and in 2011 reached approximately US$ 87 billion, equal to around 10% of the value of agricultural output (Figure 8).49 Input subsidies, which seek to protect farmers against increases in fuel and fertiliser prices, account for 15% of all agricultural support. While the payments have little influence on farmers’ production decisions, these subsidies nevertheless contribute to overall incomes and make grain production profitable enough to prevent a switch to higher value production, and thus support the government’s strategy of maintaining self-sufficiency in grains.50
46 FAO. FAOSTAT, http://faostat.fao.org 47 Carter C, Zhong F and Zhu J. (2012). Advances in Chinese agriculture and its global implications. Applied Economic Perspectives and Policy, (34): 1-36.48 Comprehensive overviews can be found in Norse D, Lu Y and Huang J. (2014). China’s food security: Is it a national, regional or global issue? In K Brown (ed). China and the EU in Context. London: Palgrave; Huang J and Rozelle S. (2009). Agricultural Development and Nutrition: The Policies Behind China’s Success. Rome: World Food Programme; Norse D, Lu Y and Tang H. (2010). The future of food and farming: Foresight Report’s implications for China. London: Government Office for Science.49 Gale F. (2013). Growth and Evolution in China’s Agricultural Support Policies. Economic Research Report 153. US Department of Agriculture Economic Research Service, supplemented by online government reports.50 Huang J, Wang X, Zhi H, Huang Z and Rozelle S. (2011). Subsidies and distortions in China’s agriculture: evidence from producer-level data. Australian Journal of Agricultural and Resource Economics, (55): 53–71. In recent years, high producer support prices and appreciation of the Chinese currency have meant that several main Chinese agricultural commodities are not competitive in international trade, which also contributes to domestic supply as opposed to exports. See Gale F. (2013). Growth and Evolution in China’s Agricultural Support Policies. Economic Research Report 153. US Department of Agriculture Economic Research Service.
30.62
47.79
6.08 2.90
General and multi-objective subsidiesScale and productivity enhancementRisk and disaster management
Environmental management
Figure 8: Estimated direct government subsidies to agriculture (2011, billion uS$)
Source: Figures based on Gale F (2013). Growth and Evolution in China’s Agricultural Support Policies. ERR 153. Economic Research Service, USDA and supplemented with data from formal government reports.
Supply chain transformations
31
3
Box 3: China’s food security policy
The foundation of agricultural policies has been government’s strong focus on achieving food self-sufficiency. The specific policy objective is to ensure almost total self-sufficiency in wheat and rice, with ‘basic’ self sufficiency for maize, livestock and aquaculture products.51 Self-sufficiency in these key protein-energy-providing foods is seen as a prerequisite for achieving food security. The government has recognised for some time that food security itself is broader than food supply (see Chapters Five and Six). While the goal of 100% self-sufficiency in essential grains was maintained until the 1990s, the target has been reduced to 95% since 1996, and it is widely accepted that full self-sufficiency is impractical.52 For example, around 80% of soy used in China is imported.53 A key driver of this shift in policy has been the rapid growth in the livestock sector, with the concomitant recognition that China’s land resources cannot themselves support the associated increase in demand for feedstuffs, particularly soy.
While most of the policy focus on ensuring food security – measured in terms of calorie supply – has been on increasing agricultural production, complementary approaches have also been taken to safeguard current production against losses and waste, and to promote stability of supply. Measures have been put in place to ensure sufficient grain stocks to meet six months’ worth of supply (150–200 million tonnes). Exports of synthetic fertilisers are controlled so that there are no shortages, and efforts have been taken to diversify the sources of food imports, particularly oilseeds. Steps have also been taken to reduce losses and waste at the storage stage and to improve food processing efficiency. The issue of consumer food waste – another threat to food availability – is also moving up the policy agenda and is discussed in more detail in Chapter Four.
3.1.3 Shift towards higher value food production
Significant changes have been occurring in the structure of agricultural production, with increases in the production of higher value livestock, aquaculture and fisheries products, and of horticultural produce. Over a thirty-year period, the gross output value added of crop production grew at 2.9% per annum. Yet this already significant figure was dwarfed by the annual growth of 6.8% in the aquatic and fisheries sector (see Focus on Aquaculture) and of 5.9% in livestock products (see Focus on Livestock and Focus on Dairy).54 The area sown to vegetables and fruits has also been increasing rapidly, as has the value of horticultural output. The crop sector’s share of total agricultural value has fallen from 76% in 1980 to 55% today, and livestock now account for nearly a third of total agricultural value (Figure 9).
A number of factors have driven this shift. Productivity increases have helped secure grain sufficiency, thereby freeing up land and resources for more resource-intensive foods. At the same time, while labour costs have risen in China they are still lower than in other countries, so China has a comparative advantage in producing labour-intensive foods that on the face of it are not highly land-intensive, although land demands overseas are substantial. Rising income has also
51 State Council of the PRC. (2008). National Mid- and Long-term Food Security Outline Plan. Beijing.52 Information Office of the State Council of the PRC. (1996). White Paper: The Grain Issue in China. Beijing.53 FAPRI-ISU. (2012). World Agricultural Outlook. Ames: Food and Agriculture Policy Research Institute, http://www.fapri.iastate.edu/outlook/2012/54 Carter C, Zhong F and Zhu J. (2012). Advances in Chinese agriculture and its global implications. Applied Economic Perspectives and Policy, (34): 1-36.
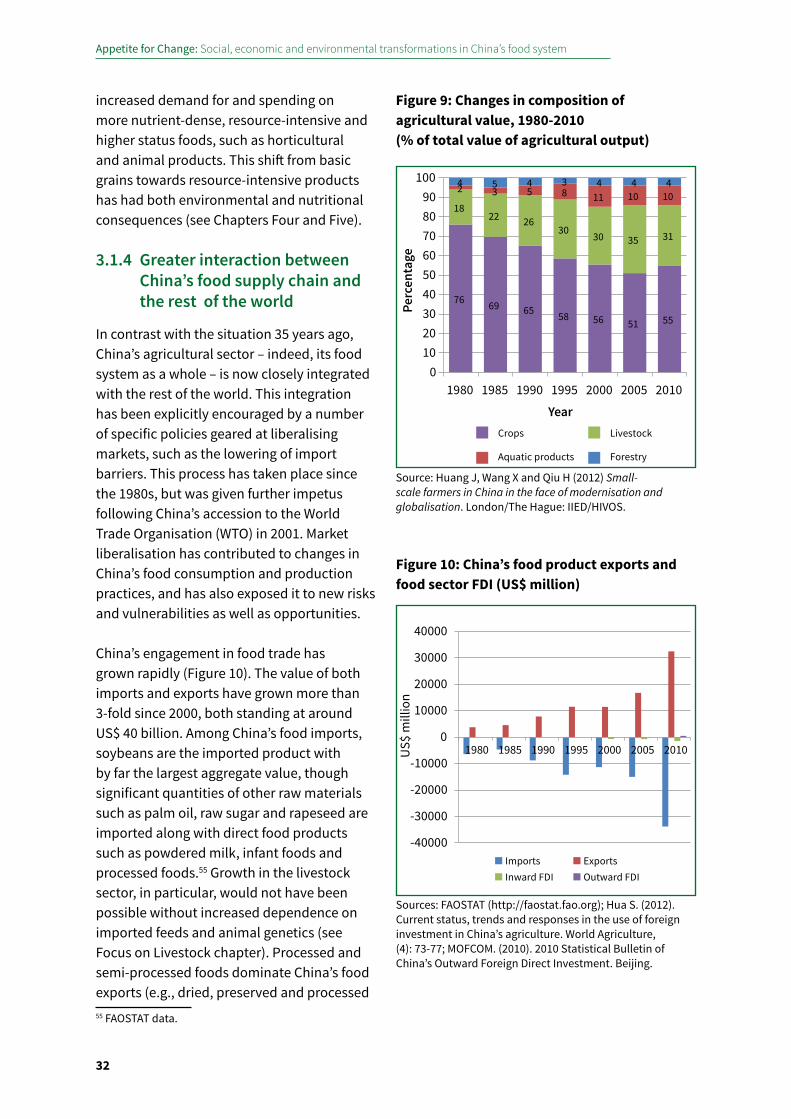
Appetite for Change: Social, economic and environmental transformations in China’s food system
32
increased demand for and spending on more nutrient-dense, resource-intensive and higher status foods, such as horticultural and animal products. This shift from basic grains towards resource-intensive products has had both environmental and nutritional consequences (see Chapters Four and Five).
3.1.4 Greater interaction between China’s food supply chain and the rest of the world
In contrast with the situation 35 years ago, China’s agricultural sector – indeed, its food system as a whole – is now closely integrated with the rest of the world. This integration has been explicitly encouraged by a number of specific policies geared at liberalising markets, such as the lowering of import barriers. This process has taken place since the 1980s, but was given further impetus following China’s accession to the World Trade Organisation (WTO) in 2001. Market liberalisation has contributed to changes in China’s food consumption and production practices, and has also exposed it to new risks and vulnerabilities as well as opportunities.
China’s engagement in food trade has grown rapidly (Figure 10). The value of both imports and exports have grown more than 3-fold since 2000, both standing at around US$ 40 billion. Among China’s food imports, soybeans are the imported product with by far the largest aggregate value, though significant quantities of other raw materials such as palm oil, raw sugar and rapeseed are imported along with direct food products such as powdered milk, infant foods and processed foods.55 Growth in the livestock sector, in particular, would not have been possible without increased dependence on imported feeds and animal genetics (see Focus on Livestock chapter). Processed and semi-processed foods dominate China’s food exports (e.g., dried, preserved and processed 55 FAOSTAT data.
76 69 65 58 56 51 55
18 22 26
30 30 35 31
4 5 4 3 4 4 4 2 3 5 8 11 10 10
0102030405060708090
100
1980 1985 1990 1995 2000 2005 2010
Crops Livestock
Aquatic products Forestry
Perc
enta
geYear
Source: Huang J, Wang X and Qiu H (2012) Small-scale farmers in China in the face of modernisation and globalisation. London/The Hague: IIED/HIVOS.
Figure 9: Changes in composition of agricultural value, 1980-2010 (% of total value of agricultural output)
Figure 10: China’s food product exports and food sector FDI (uS$ million)
Sources: FAOSTAT (http://faostat.fao.org); Hua S. (2012). Current status, trends and responses in the use of foreign investment in China’s agriculture. World Agriculture, (4): 73-77; MOFCOM. (2010). 2010 Statistical Bulletin of China’s Outward Foreign Direct Investment. Beijing.
-40000
-30000
-20000
-10000
0
10000
20000
30000
40000
1980 1985 1990 1995 2000 2005 2010US$
mill
ion
Imports ExportsInward FDI Outward FDI
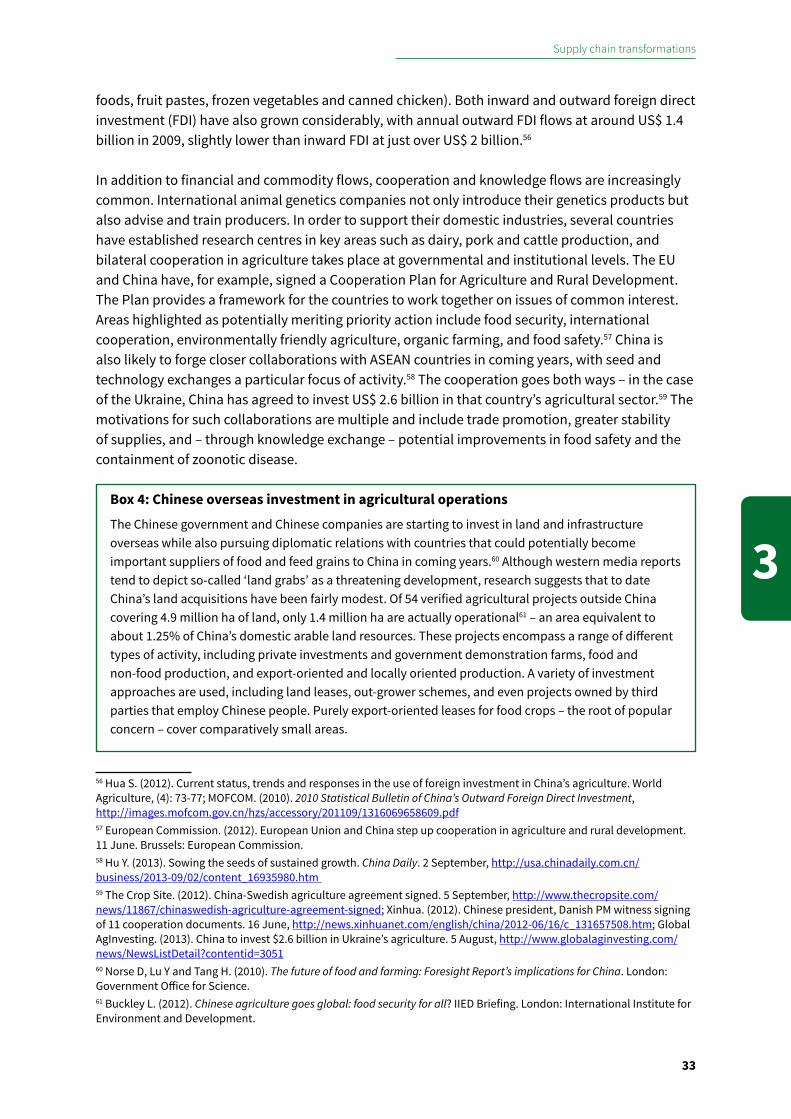
Supply chain transformations
33
3
foods, fruit pastes, frozen vegetables and canned chicken). Both inward and outward foreign direct investment (FDI) have also grown considerably, with annual outward FDI flows at around US$ 1.4 billion in 2009, slightly lower than inward FDI at just over US$ 2 billion.56
In addition to financial and commodity flows, cooperation and knowledge flows are increasingly common. International animal genetics companies not only introduce their genetics products but also advise and train producers. In order to support their domestic industries, several countries have established research centres in key areas such as dairy, pork and cattle production, and bilateral cooperation in agriculture takes place at governmental and institutional levels. The EU and China have, for example, signed a Cooperation Plan for Agriculture and Rural Development. The Plan provides a framework for the countries to work together on issues of common interest. Areas highlighted as potentially meriting priority action include food security, international cooperation, environmentally friendly agriculture, organic farming, and food safety.57 China is also likely to forge closer collaborations with ASEAN countries in coming years, with seed and technology exchanges a particular focus of activity.58 The cooperation goes both ways – in the case of the Ukraine, China has agreed to invest US$ 2.6 billion in that country’s agricultural sector.59 The motivations for such collaborations are multiple and include trade promotion, greater stability of supplies, and – through knowledge exchange – potential improvements in food safety and the containment of zoonotic disease.
Box 4: Chinese overseas investment in agricultural operations
The Chinese government and Chinese companies are starting to invest in land and infrastructure overseas while also pursuing diplomatic relations with countries that could potentially become important suppliers of food and feed grains to China in coming years.60 Although western media reports tend to depict so-called ‘land grabs’ as a threatening development, research suggests that to date China’s land acquisitions have been fairly modest. Of 54 verified agricultural projects outside China covering 4.9 million ha of land, only 1.4 million ha are actually operational61 – an area equivalent to about 1.25% of China’s domestic arable land resources. These projects encompass a range of different types of activity, including private investments and government demonstration farms, food and non-food production, and export-oriented and locally oriented production. A variety of investment approaches are used, including land leases, out-grower schemes, and even projects owned by third parties that employ Chinese people. Purely export-oriented leases for food crops – the root of popular concern – cover comparatively small areas.
56 Hua S. (2012). Current status, trends and responses in the use of foreign investment in China’s agriculture. World Agriculture, (4): 73-77; MOFCOM. (2010). 2010 Statistical Bulletin of China’s Outward Foreign Direct Investment, http://images.mofcom.gov.cn/hzs/accessory/201109/1316069658609.pdf57 European Commission. (2012). European Union and China step up cooperation in agriculture and rural development. 11 June. Brussels: European Commission.58 Hu Y. (2013). Sowing the seeds of sustained growth. China Daily. 2 September, http://usa.chinadaily.com.cn/business/2013-09/02/content_16935980.htm 59 The Crop Site. (2012). China-Swedish agriculture agreement signed. 5 September, http://www.thecropsite.com/news/11867/chinaswedish-agriculture-agreement-signed; Xinhua. (2012). Chinese president, Danish PM witness signing of 11 cooperation documents. 16 June, http://news.xinhuanet.com/english/china/2012-06/16/c_131657508.htm; Global AgInvesting. (2013). China to invest $2.6 billion in Ukraine’s agriculture. 5 August, http://www.globalaginvesting.com/news/NewsListDetail?contentid=305160 Norse D, Lu Y and Tang H. (2010). The future of food and farming: Foresight Report’s implications for China. London: Government Office for Science.61 Buckley L. (2012). Chinese agriculture goes global: food security for all? IIED Briefing. London: International Institute for Environment and Development.
Appetite for Change: Social, economic and environmental transformations in China’s food system
34
3.1.5 Changes in the structure, locality and control of production
Changes in the volume, value and type of food produced have been accompanied and driven by changes in how and where farming is practiced, and in who controls the process of production. On the one hand, China’s food system has vastly expanded its geographical reach, since the system now has a global footprint. Within China, greater specialisation in agricultural subsectors has developed in some regions. For example, rice and maize production are shifting to eastern regions, particularly to the northeast. Pork and poultry are tending to concentrate in the more industrialised southeast, close to markets, thereby reducing transport costs.62 Dairy production is concentrated in the grasslands of northern China, and in Inner Mongolia in particular – reflecting among other things more favourable environmental conditions. Wheat shows a more varied picture.63 This process of specialisation has environmental implications: the decline in mixed crop-livestock systems means that nutrient surpluses from livestock do not have sufficient surrounding agricultural land to absorb and benefit from them, while crop production is no longer able to benefit from manure application.
Many agricultural subsectors are experiencing a process of ‘scaling up’, but these changes are playing out in different ways. It is interesting to compare and contrast four very rapidly growing agricultural subsectors: livestock, aquaculture, dairy and horticulture. All four have seen dramatic growth in output and productivity in the last 35 years. All four are linked to global markets. All four are, on the one hand, resource-intensive, and on the other, produce nutrient dense foods. However, there are also important differences. The livestock sector is generally achieving greater outputs through a shift towards fewer, larger, more consolidated units of production. The horticulture sector, however, is still dominated by small-scale producers who participate in contract farming arrangements or may be linked to ‘dragon-head’ enterprises through contracts or marketing arrangements. More detailed exploration of the evolution of each of these sectors is given in Box 5 and in the Focus on Livestock, Dairy and Aquaculture chapters.
This massive growth in output has not been achieved through an increase in the scale of individual farmers’ or companies’ operations, but by smallholders who continue to farm very small plots of land. Rather than scaling up production, the focus of government policies has been on promoting
Box 5: China’s horticulture sector
The fruit and vegetable sector provides an interesting contrast with the livestock sector. Production is very much dominated by smallholders. Moreover, while the livestock sector relies on ‘hidden’ imports in the form of feed, horticultural production does not, and is actually producing for export. Output of fruits grew almost 30-fold in 31 years, or 11.7% per year. The vegetable sown area increased from 3.3 million ha to 18.4 million ha (4.6 times, or 5.7% per year) over the same time period, growing amounts of which are exported (Figure 11).64
62 Huang J, Wang X and Qiu H. (2012). Small-scale farmers in China in the face of modernisation and globalisation. London/The Hague: IIED/Hivos.63 Huang J, Wang X and Qiu H. (2012). Small-scale farmers in China in the face of modernisation and globalisation. London/The Hague: IIED/Hivos; Carter C A, Zhong F and Zhu J. (2012). Advances in Chinese agriculture and its global implications. Applied Economic Perspectives and Policy, (34): 1-36.64 Carter C A, Zhong F and Zhu J. (2012). Advances in Chinese agriculture and its global implications. Applied Economic Perspectives and Policy, (34): 1-36.
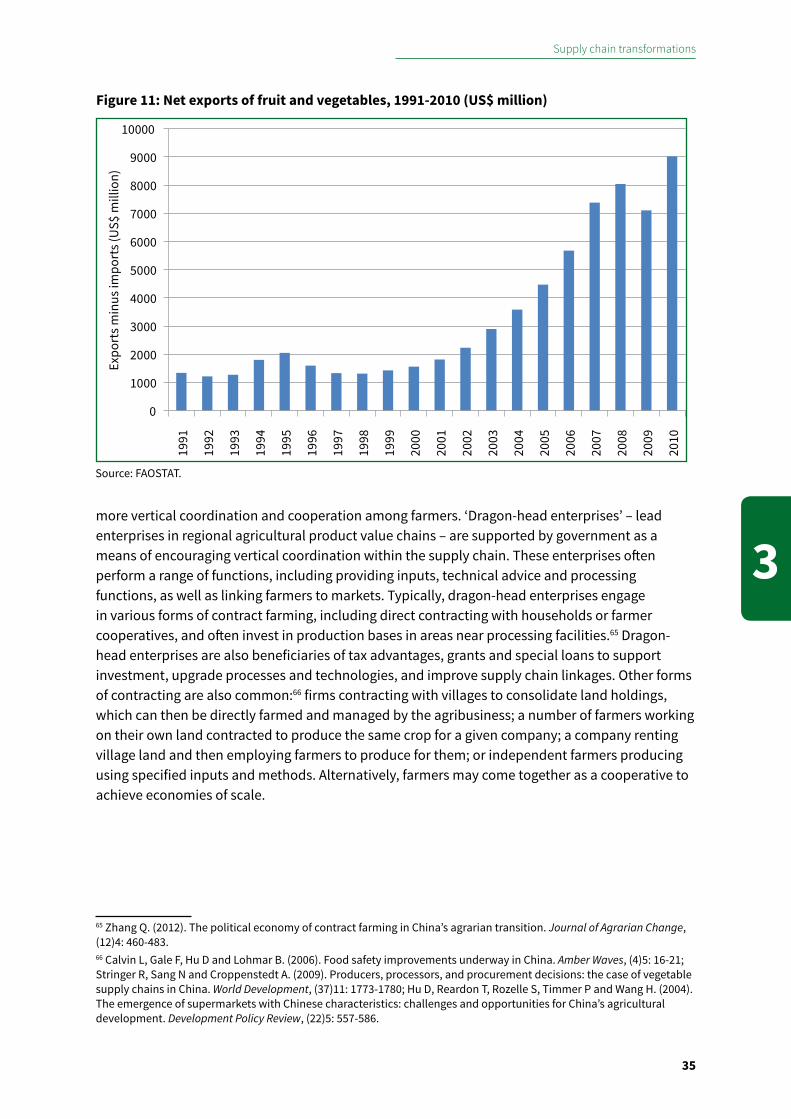
Supply chain transformations
35
3more vertical coordination and cooperation among farmers. ‘Dragon-head enterprises’ – lead enterprises in regional agricultural product value chains – are supported by government as a means of encouraging vertical coordination within the supply chain. These enterprises often perform a range of functions, including providing inputs, technical advice and processing functions, as well as linking farmers to markets. Typically, dragon-head enterprises engage in various forms of contract farming, including direct contracting with households or farmer cooperatives, and often invest in production bases in areas near processing facilities.65 Dragon-head enterprises are also beneficiaries of tax advantages, grants and special loans to support investment, upgrade processes and technologies, and improve supply chain linkages. Other forms of contracting are also common:66 firms contracting with villages to consolidate land holdings, which can then be directly farmed and managed by the agribusiness; a number of farmers working on their own land contracted to produce the same crop for a given company; a company renting village land and then employing farmers to produce for them; or independent farmers producing using specified inputs and methods. Alternatively, farmers may come together as a cooperative to achieve economies of scale.
65 Zhang Q. (2012). The political economy of contract farming in China’s agrarian transition. Journal of Agrarian Change, (12)4: 460-483.66 Calvin L, Gale F, Hu D and Lohmar B. (2006). Food safety improvements underway in China. Amber Waves, (4)5: 16-21; Stringer R, Sang N and Croppenstedt A. (2009). Producers, processors, and procurement decisions: the case of vegetable supply chains in China. World Development, (37)11: 1773-1780; Hu D, Reardon T, Rozelle S, Timmer P and Wang H. (2004). The emergence of supermarkets with Chinese characteristics: challenges and opportunities for China’s agricultural development. Development Policy Review, (22)5: 557-586.
Figure 11: Net exports of fruit and vegetables, 1991-2010 (uS$ million)
0
1000
2000
3000
4000
5000
6000
7000
8000
9000
10000
1991
1992
1993
1994
1995
1996
1997
1998
1999
2000
2001
2002
2003
2004
2005
2006
2007
2008
2009
2010
Expo
rts m
inus
impo
rts (
US$
mill
ion)
Source: FAOSTAT.
Appetite for Change: Social, economic and environmental transformations in China’s food system
36
3.2 Future drivers of the agricultural system: focus on environmental change
The food system as a whole is a major driver of environmental change in China, as elsewhere. However, it is also influenced by and vulnerable to changes in the environment, including those to which it has itself contributed. The focus here is on two aspects of environmental change with potentially profound implications for China’s food system. The first is climate change, a problem with global dimensions. The second – constraints on the quality and quantity of available land for food production within China – might be characterised as a more local problem, but in so far as land scarcity undermines China’s capacity for self sufficiency, the knock-on implications for land use overseas may have global reverberations. Other aspects of environmental change are discussed in Chapter Four.
3.2.1 Climate change Under different scenarios of greenhouse gas emissions and their effects, by the end of this century China’s average atmospheric temperature may rise by between 2 and 6 degrees Celsius above the average for 1961-1990.67 Warming has already started to have an impact on agricultural production in China. The suitability zones for various crops are changing, with a general northwards shift as temperatures rise and growing seasons lengthen. The broader implications of these changes on the sector as a whole are still not fully understood, but will include both new opportunities and risks,68 with producers in some regions benefitting from climate change and others losing out. Water is a critical issue and the main constraining factor in many regions. Trends in precipitation and the occurrence of extreme events will have a strong impact on agricultural production. Some areas may become wetter and more prone to flooding while others may become drier and more drought-prone.
There have been many model-based studies projecting the impacts of climate change on the yields of various crops, with and without the CO2 fertilisation effect and with and without assumed adaptations. These studies generally show that without adaptation, yields of major crops such as maize, rice, and (unless CO2 fertilisation effects are assumed) wheat may decline towards the middle of this century.69 Adaptation measures may mitigate these effects.70 Adaptation will require the development of new crop varieties and agronomic techniques, and an effective knowledge extension service.71 67 McSweeney C, New M and Lizcano G. (2009). Climate Change Country Profiles - China. Oxford: Oxford University School of Geography and Environment; Tyndall Centre for Climate Change Research.68 Wang J, Huang J, and Rozelle S. (2010). Climate Change and China’s Agricultural Sector: An Overview of Impacts, Adaptation and Mitigation. Issue Brief No.5. ICTSD–IPC Platform on Climate Change, Agriculture and Trade. Geneva: International Centre for Trade and Sustainable Development; Washington D.C.: International Food & Agricultural Trade Policy Council.69 Tao F and Zhang Z. (2011). Impacts of climate change as a function of global mean temperature: maize productivity and water use in China. Climatic Change, (105): 409–432; Tao F and Zhang Z. (2013). Climate change, high-temperature stress, rice productivity, and water use in eastern China: a new superensemble-based probabilistic projection. Journal of Applied Meteorology and Climatology, (52): 531–551; Liu Y and Tao F. (2013). Probabilistic change of wheat productivity and water use in China for global mean temperature changes of 1, 2, and 3°C. Journal of Applied Meteorology and Climatology, (52): 114–129; Piao S, Ciais P, Huang Y, Shen Z, Peng S, Li J, Zhou L, Liu H, Ma Y, Ding Y, Friedlingstein P, Liu C, Tan K, Yu Y, Zhang T and Fang J. (2010). The impacts of climate change on water resources and agriculture in China. Nature, (467): 43-51. 70 Tao F and Zhang Z. (2010). Adaptation of maize production to climate change in North China Plain: Quantify the relative contributions of adaptation options. European Journal of Agronomy, (33): 103–116.71 SAIN. (2013). How do farmers respond to climate change risk? SAIN policy brief No. 7. Norwich: Sustainable Agriculture Innovation Network.
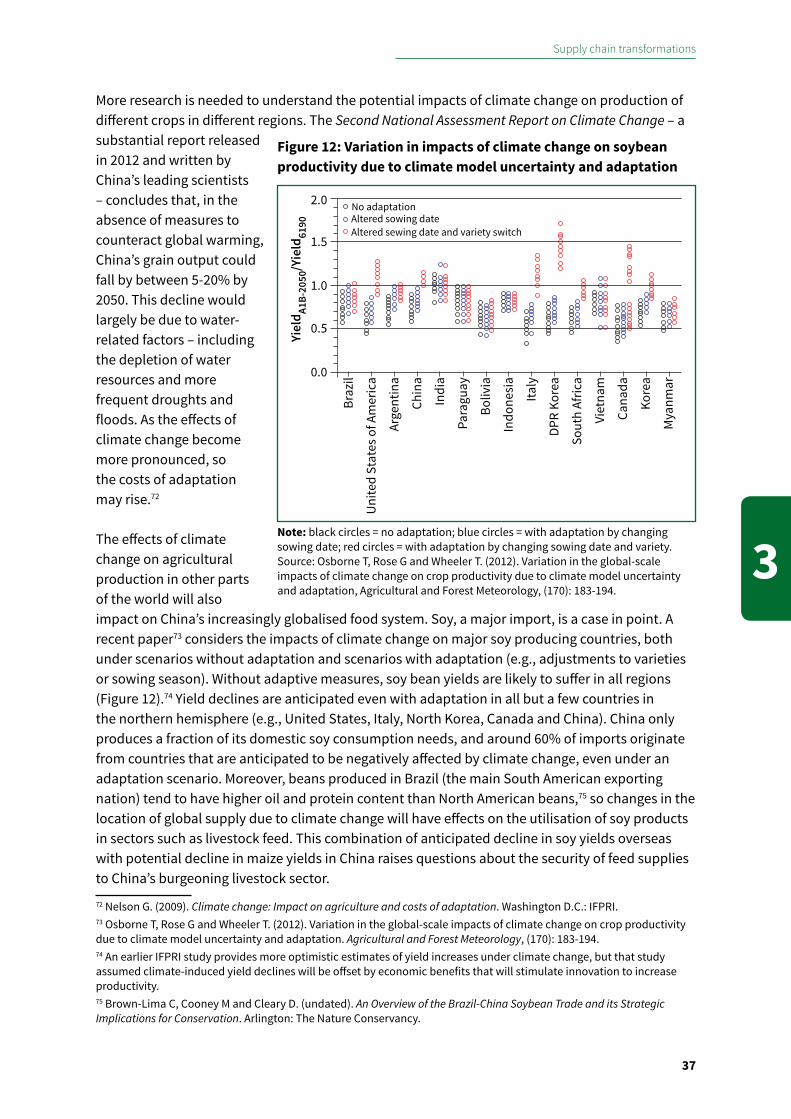
Supply chain transformations
37
3
More research is needed to understand the potential impacts of climate change on production of different crops in different regions. The Second National Assessment Report on Climate Change – a substantial report released in 2012 and written by China’s leading scientists – concludes that, in the absence of measures to counteract global warming, China’s grain output could fall by between 5-20% by 2050. This decline would largely be due to water-related factors – including the depletion of water resources and more frequent droughts and floods. As the effects of climate change become more pronounced, so the costs of adaptation may rise.72
The effects of climate change on agricultural production in other parts of the world will also impact on China’s increasingly globalised food system. Soy, a major import, is a case in point. A recent paper73 considers the impacts of climate change on major soy producing countries, both under scenarios without adaptation and scenarios with adaptation (e.g., adjustments to varieties or sowing season). Without adaptive measures, soy bean yields are likely to suffer in all regions (Figure 12).74 Yield declines are anticipated even with adaptation in all but a few countries in the northern hemisphere (e.g., United States, Italy, North Korea, Canada and China). China only produces a fraction of its domestic soy consumption needs, and around 60% of imports originate from countries that are anticipated to be negatively affected by climate change, even under an adaptation scenario. Moreover, beans produced in Brazil (the main South American exporting nation) tend to have higher oil and protein content than North American beans,75 so changes in the location of global supply due to climate change will have effects on the utilisation of soy products in sectors such as livestock feed. This combination of anticipated decline in soy yields overseas with potential decline in maize yields in China raises questions about the security of feed supplies to China’s burgeoning livestock sector.
72 Nelson G. (2009). Climate change: Impact on agriculture and costs of adaptation. Washington D.C.: IFPRI.73 Osborne T, Rose G and Wheeler T. (2012). Variation in the global-scale impacts of climate change on crop productivity due to climate model uncertainty and adaptation. Agricultural and Forest Meteorology, (170): 183-194.74 An earlier IFPRI study provides more optimistic estimates of yield increases under climate change, but that study assumed climate-induced yield declines will be offset by economic benefits that will stimulate innovation to increase productivity.75 Brown-Lima C, Cooney M and Cleary D. (undated). An Overview of the Brazil-China Soybean Trade and its Strategic Implications for Conservation. Arlington: The Nature Conservancy.
Figure 12: variation in impacts of climate change on soybean productivity due to climate model uncertainty and adaptation
Note: black circles = no adaptation; blue circles = with adaptation by changing sowing date; red circles = with adaptation by changing sowing date and variety. Source: Osborne T, Rose G and Wheeler T. (2012). Variation in the global-scale impacts of climate change on crop productivity due to climate model uncertainty and adaptation, Agricultural and Forest Meteorology, (170): 183-194.
Braz
il
Uni
ted
Stat
es o
f Am
eric
a
Arge
ntin
a
Para
guay
Boliv
ia
Indo
nesi
a
Italy
DPR
Kore
a
Sout
h Af
rica
Viet
nam
Cana
da
Kore
a
Mya
nmar
Chin
a
Indi
a0.0
0.5
Yiel
d A1B-
2050
/Yie
ld61
901.0
1.5
2.0 No adaptationAltered sowing dateAltered sewing date and variety switch
Appetite for Change: Social, economic and environmental transformations in China’s food system
38
Climate change is also likely to have impacts on food that go beyond agricultural production. A warmer climate is likely to increase post-harvest food safety risks and hence the need for food refrigeration (itself an energy demanding activity, with feedback impacts on climate). Severe events may disrupt transport and logistics infrastructure. Climatic changes are likely to change the relative prices of commodities supplied from different parts of the world, increasing the competitiveness of some of China’s exports and of imports from other countries. Climatic changes may also prompt changes in demand for certain types of food.
3.2.2 Constraints in land quality and availability
A key driver of change in the agricultural sector, which has important environmental implications, is the constrained availability of land. As noted elsewhere in this report, per capita arable land availability in China is far lower than the global average – about 0.08 ha per person.76 Various government sources report different figures for arable land area, leading some observers to suspect a decline in its availability. The Medium and Long Term Plan for China’s Food Security77 cited survey data showing that the arable land area fell from 130 million ha in 1996 to 121.7 million ha in 2007, a 6.4% drop in 11 years, despite regulations to limit the transfer of land to other purposes. Some analysts argue that the area is already below 120 million ha or, if not, soon will be.78 The latest land census suggests that at the end of 2009 there was more than 135 million ha of arable land.79 Whatever the true figure, growing demand for land for other activities continues to put pressure on arable land. While the greatest ‘remover’ of agricultural land has in fact been the ecological restoration programme, ‘Grain for Green’ – accounting for over half of all land taken out of agricultural production (see Chapter Four) – encroachment by urban and industrial developments poses a far greater challenge to China’s self-sufficiency goals. This is because, unlike ecological restoration programmes focusing on marginal land, urban and industrial developments tend to be situated in areas where arable land quality is good, implying a loss of the most productive land. Urbanisation and industrialisation have contributed to deterioration in agricultural land quality in other ways too: air and water pollution from these new sources can inhibit plant growth and reduce yields. These external pollutants compound the problems caused by the agricultural sector itself – inappropriate land management in many regions has reduced the productivity of land. Two-thirds of arable land is now classified as medium- or low-yielding land, and coastal areas have seen particularly large losses of agricultural area.80
Agriculture can also cause problems in urban areas. For example, pesticides and fertilisers used for agriculture can leach into groundwater, which then enters the water supply of nearby populations. Some peri-urban areas have particularly high concentrations of water and soil pollution. Untreated discharges of industrial and municipal refuse, inappropriate use of agrochemicals and urban waste, and irrigation of sewage and polluted water are major causes of soil pollution.81 Due to ease of market access, more developed infrastructure and higher capital availability, high
76 World Bank. (2008-2012). Arable land (hectares per person), http://data.worldbank.org/indicator/AG.LND.ARBL.HA.PC 77 National Development and Reform Commission. (2008). Medium and Long Term Plan for China’s Food Security. Beijing.78 Ye L. (2011). Simulated Effects of Climate Change on Food Security in China toward 2050. Presentation at International Conference on Climate Change and Food Security (ICCCFS). November 6-8. Beijing.79 Ministry of Land Resources and National Statistical Bureau. (2013). Report on the main quantitative results of the Second National Land Survey, http://www.mlr.gov.cn/zwgk/zytz/201312/t20131230_1298865.htm80 Carter C, Zhong F and Zhu J. (2012). Advances in Chinese agriculture and its global implications. Applied Economic Perspectives and Policy, (34): 1-36.81 Chen J. (2007). Rapid urbanization in China: A real challenge to soil protection and food security. Catena, (69): 1–15.
Supply chain transformations
39
3
value agricultural production may be concentrated in these areas. On the one hand, limited land resources have driven investments in productivity-enhancing technologies. On the other hand, this input-heavy pathway to agricultural growth is reducing the long-term productive capacity of such land as is available. Competition and interaction between agriculture and other land uses in and around urban areas has potentially profound implications for food security and sustainability in the long term, particularly in the more developed eastern regions.82
3.3 Food processing, manufacturing and distributionChanges in the structure of agricultural production are mirrored by transformations beyond the farm gate. As with changes in agricultural production, these have been heavily promoted by government through support for development of leading firms and technical modernisation of supply chain functions, including processing and manufacturing.83 The total processed food market is growing rapidly. It was valued at US$ 140.4 billion in 2011, with dairy registering the highest retail sales at US$ 28.0 billion (see Focus on Dairy chapter), followed by bakery (US$ 19.3 billion) and dried processed foods (US$ 15.2 billion).84 Some observers suggest that by 2015, Chinese consumers could consume more packaged food than consumers in the US. Although per capita intakes in China will still be only a quarter of those in the US, and the value of the sector will still be only two thirds of that in the US, this would nevertheless represent an increase of 66% since 2008.85
As China’s food system develops and larger players enter the scene, two trends are emerging. First, food processing is growing as an important employer and contributor to GDP its own right. Second, the process of vertical integration is starting to blur the boundaries between the agricultural and post-harvest stages (see Focus on Livestock and Focus on Dairy chapters for sector-specific discussions). Here, we examine developments in the domestic food processing sector (3.3.1) before considering Chinese companies’ involvement in markets overseas (3.3.2) and inward investment in China by multinational companies (3.3.3).
3.3.1 The domestic food processing sector
Chinese, rather than foreign, companies dominate the processed food market in China. Domestic production started to grow at double digit rates in the early 2000s and has continued to grow since then.86 In recent years, the number of enterprises engaged in food processing and manufacture has not increased greatly – in part due to government policies to support development of large, leading brands – but the value of production in these sectors has grown significantly (Figure 13). Growth has been particularly strong in the rice processing, wheat flour, dairy processing and canned foods sectors (Figure 14). Slower growth in meat and aquaculture processing reflects strong consumer preferences for unprocessed foods of these types, although this is starting to change (see Focus on Livestock and Focus on Aquaculture).
82 Chen J. (2007). Rapid urbanization in China: A real challenge to soil protection and food security. Catena, (69): 1–15.83 According to industry experts, there is no clear distinction between processing and manufacturing and the two terms are used interchangeably here.84 Bradbury J. (2012). China and Hong Kong: Food Opportunities for Maine. Portland: Maine International Trade Center. 85 Kuo L. (2013). By 2015, China will be the world’s largest consumer of processed food. September 23, http://qz.com/127235/by-2015-china-will-be-the-worlds-largest-consumer-of-processed-food/ 86 Hawkes C. (2008). Agro-food industry growth and obesity in China: what role for regulating food advertising and promotion and nutrition labelling? Obesity Reviews, (9)suppl.1: 151–161; Bradbury J. (2012). China and Hong Kong: Food Opportunities for Maine. Portland: Maine International Trade Center.
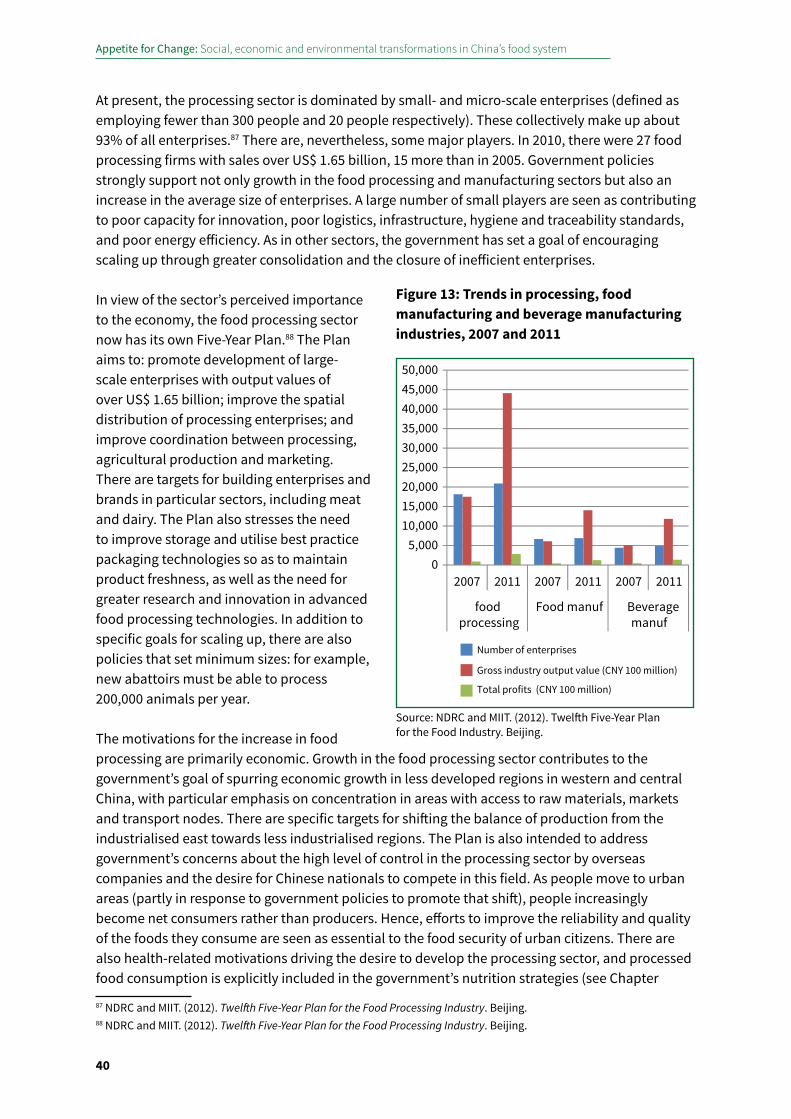
Appetite for Change: Social, economic and environmental transformations in China’s food system
40
At present, the processing sector is dominated by small- and micro-scale enterprises (defined as employing fewer than 300 people and 20 people respectively). These collectively make up about 93% of all enterprises.87 There are, nevertheless, some major players. In 2010, there were 27 food processing firms with sales over US$ 1.65 billion, 15 more than in 2005. Government policies strongly support not only growth in the food processing and manufacturing sectors but also an increase in the average size of enterprises. A large number of small players are seen as contributing to poor capacity for innovation, poor logistics, infrastructure, hygiene and traceability standards, and poor energy efficiency. As in other sectors, the government has set a goal of encouraging scaling up through greater consolidation and the closure of inefficient enterprises.
In view of the sector’s perceived importance to the economy, the food processing sector now has its own Five-Year Plan.88 The Plan aims to: promote development of large-scale enterprises with output values of over US$ 1.65 billion; improve the spatial distribution of processing enterprises; and improve coordination between processing, agricultural production and marketing. There are targets for building enterprises and brands in particular sectors, including meat and dairy. The Plan also stresses the need to improve storage and utilise best practice packaging technologies so as to maintain product freshness, as well as the need for greater research and innovation in advanced food processing technologies. In addition to specific goals for scaling up, there are also policies that set minimum sizes: for example, new abattoirs must be able to process 200,000 animals per year.
The motivations for the increase in food processing are primarily economic. Growth in the food processing sector contributes to the government’s goal of spurring economic growth in less developed regions in western and central China, with particular emphasis on concentration in areas with access to raw materials, markets and transport nodes. There are specific targets for shifting the balance of production from the industrialised east towards less industrialised regions. The Plan is also intended to address government’s concerns about the high level of control in the processing sector by overseas companies and the desire for Chinese nationals to compete in this field. As people move to urban areas (partly in response to government policies to promote that shift), people increasingly become net consumers rather than producers. Hence, efforts to improve the reliability and quality of the foods they consume are seen as essential to the food security of urban citizens. There are also health-related motivations driving the desire to develop the processing sector, and processed food consumption is explicitly included in the government’s nutrition strategies (see Chapter
87 NDRC and MIIT. (2012). Twelfth Five-Year Plan for the Food Processing Industry. Beijing.88 NDRC and MIIT. (2012). Twelfth Five-Year Plan for the Food Processing Industry. Beijing.
05,000
10,00015,00020,00025,00030,00035,00040,00045,00050,000
2007 2011 2007 2011 2007 2011
foodprocessing
Food manuf Beveragemanuf
Number of enterprises
Gross industry output value (CNY 100 million)
Total profits (CNY 100 million)
Figure 13: Trends in processing, food manufacturing and beverage manufacturing industries, 2007 and 2011
Source: NDRC and MIIT. (2012). Twelfth Five-Year Plan for the Food Industry. Beijing.
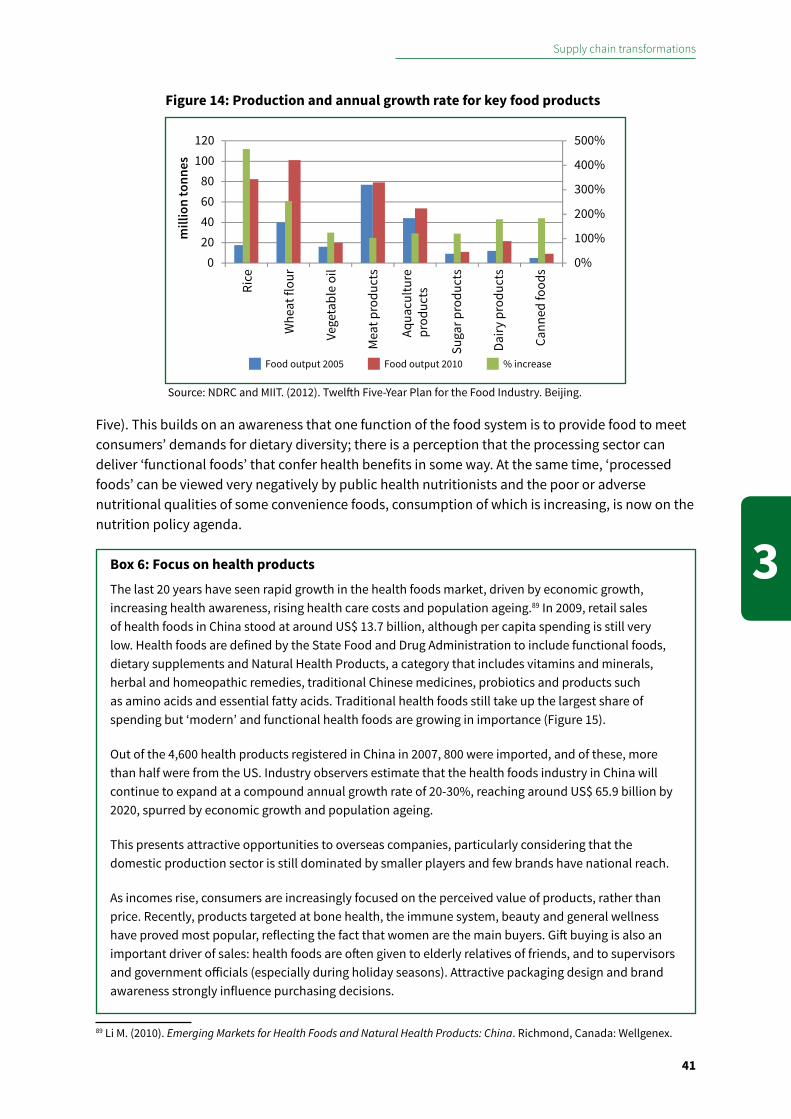
Supply chain transformations
41
3
Five). This builds on an awareness that one function of the food system is to provide food to meet consumers’ demands for dietary diversity; there is a perception that the processing sector can deliver ‘functional foods’ that confer health benefits in some way. At the same time, ‘processed foods’ can be viewed very negatively by public health nutritionists and the poor or adverse nutritional qualities of some convenience foods, consumption of which is increasing, is now on the nutrition policy agenda.
Box 6: Focus on health products
The last 20 years have seen rapid growth in the health foods market, driven by economic growth, increasing health awareness, rising health care costs and population ageing.89 In 2009, retail sales of health foods in China stood at around US$ 13.7 billion, although per capita spending is still very low. Health foods are defined by the State Food and Drug Administration to include functional foods, dietary supplements and Natural Health Products, a category that includes vitamins and minerals, herbal and homeopathic remedies, traditional Chinese medicines, probiotics and products such as amino acids and essential fatty acids. Traditional health foods still take up the largest share of spending but ‘modern’ and functional health foods are growing in importance (Figure 15).
Out of the 4,600 health products registered in China in 2007, 800 were imported, and of these, more than half were from the US. Industry observers estimate that the health foods industry in China will continue to expand at a compound annual growth rate of 20-30%, reaching around US$ 65.9 billion by 2020, spurred by economic growth and population ageing.
This presents attractive opportunities to overseas companies, particularly considering that the domestic production sector is still dominated by smaller players and few brands have national reach.
As incomes rise, consumers are increasingly focused on the perceived value of products, rather than price. Recently, products targeted at bone health, the immune system, beauty and general wellness have proved most popular, reflecting the fact that women are the main buyers. Gift buying is also an important driver of sales: health foods are often given to elderly relatives of friends, and to supervisors and government officials (especially during holiday seasons). Attractive packaging design and brand awareness strongly influence purchasing decisions.
89 Li M. (2010). Emerging Markets for Health Foods and Natural Health Products: China. Richmond, Canada: Wellgenex.
0%
100%
200%
300%
400%
500%
020406080
100120
mill
ion
tonn
es
Food output 2005 Food output 2010 % increase
Rice
Whe
at fl
our
Vege
tabl
e oi
l
Mea
t pro
duct
s
Aqua
cultu
repr
oduc
ts
Suga
r pro
duct
s
Dairy
pro
duct
s
Cann
ed fo
ods
Figure 14: Production and annual growth rate for key food products
Source: NDRC and MIIT. (2012). Twelfth Five-Year Plan for the Food Industry. Beijing.
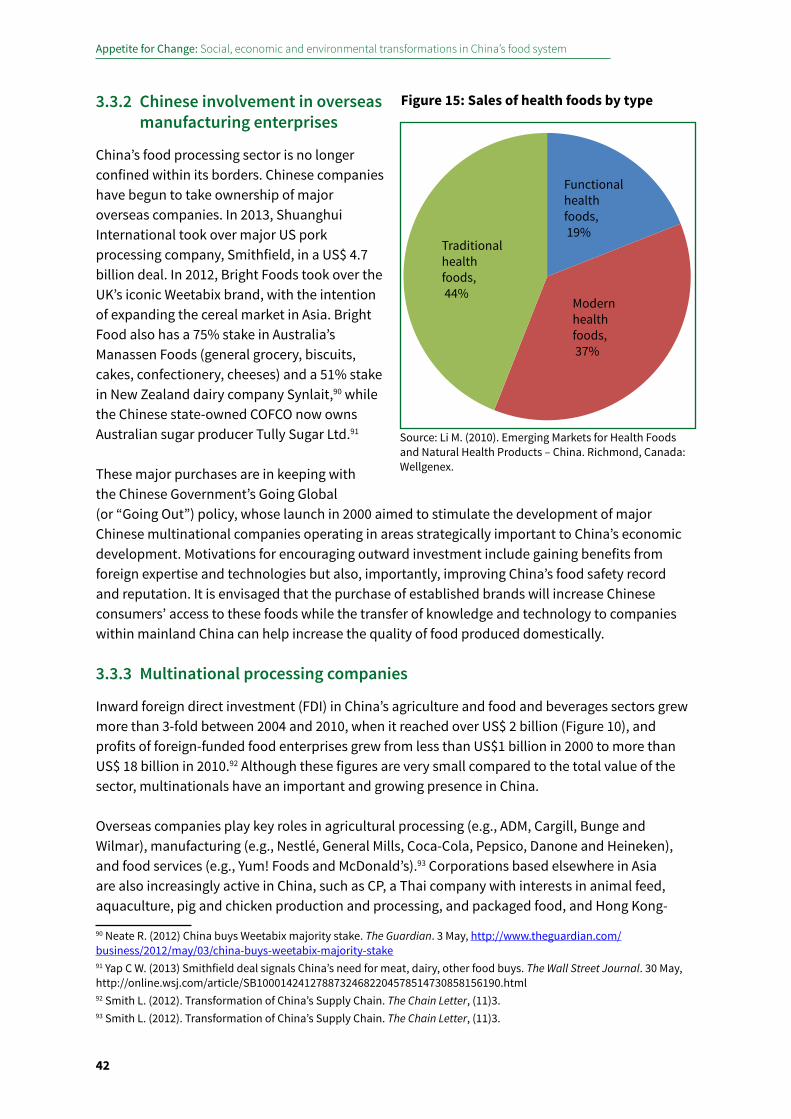
Appetite for Change: Social, economic and environmental transformations in China’s food system
42
3.3.2 Chinese involvement in overseas manufacturing enterprises
China’s food processing sector is no longer confined within its borders. Chinese companies have begun to take ownership of major overseas companies. In 2013, Shuanghui International took over major US pork processing company, Smithfield, in a US$ 4.7 billion deal. In 2012, Bright Foods took over the UK’s iconic Weetabix brand, with the intention of expanding the cereal market in Asia. Bright Food also has a 75% stake in Australia’s Manassen Foods (general grocery, biscuits, cakes, confectionery, cheeses) and a 51% stake in New Zealand dairy company Synlait,90 while the Chinese state-owned COFCO now owns Australian sugar producer Tully Sugar Ltd.91
These major purchases are in keeping with the Chinese Government’s Going Global (or “Going Out”) policy, whose launch in 2000 aimed to stimulate the development of major Chinese multinational companies operating in areas strategically important to China’s economic development. Motivations for encouraging outward investment include gaining benefits from foreign expertise and technologies but also, importantly, improving China’s food safety record and reputation. It is envisaged that the purchase of established brands will increase Chinese consumers’ access to these foods while the transfer of knowledge and technology to companies within mainland China can help increase the quality of food produced domestically.
3.3.3 Multinational processing companies
Inward foreign direct investment (FDI) in China’s agriculture and food and beverages sectors grew more than 3-fold between 2004 and 2010, when it reached over US$ 2 billion (Figure 10), and profits of foreign-funded food enterprises grew from less than US$1 billion in 2000 to more than US$ 18 billion in 2010.92 Although these figures are very small compared to the total value of the sector, multinationals have an important and growing presence in China.
Overseas companies play key roles in agricultural processing (e.g., ADM, Cargill, Bunge and Wilmar), manufacturing (e.g., Nestlé, General Mills, Coca-Cola, Pepsico, Danone and Heineken), and food services (e.g., Yum! Foods and McDonald’s).93 Corporations based elsewhere in Asia are also increasingly active in China, such as CP, a Thai company with interests in animal feed, aquaculture, pig and chicken production and processing, and packaged food, and Hong Kong-
90 Neate R. (2012) China buys Weetabix majority stake. The Guardian. 3 May, http://www.theguardian.com/business/2012/may/03/china-buys-weetabix-majority-stake91 Yap C W. (2013) Smithfield deal signals China’s need for meat, dairy, other food buys. The Wall Street Journal. 30 May, http://online.wsj.com/article/SB10001424127887324682204578514730858156190.html 92 Smith L. (2012). Transformation of China’s Supply Chain. The Chain Letter, (11)3.93 Smith L. (2012). Transformation of China’s Supply Chain. The Chain Letter, (11)3.
Traditional health foods, 44%
Functional health foods, 19%
Modern health foods, 37%
Figure 15: Sales of health foods by type
Source: Li M. (2010). Emerging Markets for Health Foods and Natural Health Products – China. Richmond, Canada: Wellgenex.
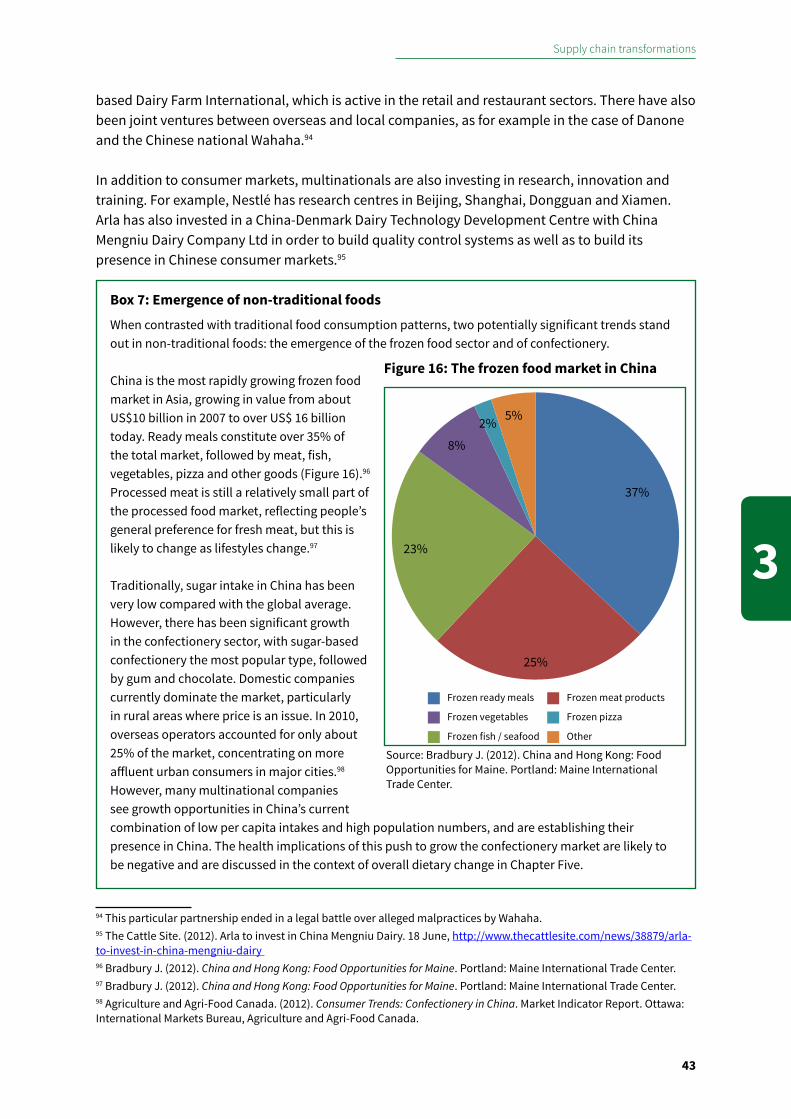
Supply chain transformations
43
3
based Dairy Farm International, which is active in the retail and restaurant sectors. There have also been joint ventures between overseas and local companies, as for example in the case of Danone and the Chinese national Wahaha.94
In addition to consumer markets, multinationals are also investing in research, innovation and training. For example, Nestlé has research centres in Beijing, Shanghai, Dongguan and Xiamen. Arla has also invested in a China-Denmark Dairy Technology Development Centre with China Mengniu Dairy Company Ltd in order to build quality control systems as well as to build its presence in Chinese consumer markets.95
Box 7: Emergence of non-traditional foods
When contrasted with traditional food consumption patterns, two potentially significant trends stand out in non-traditional foods: the emergence of the frozen food sector and of confectionery.
China is the most rapidly growing frozen food market in Asia, growing in value from about US$10 billion in 2007 to over US$ 16 billion today. Ready meals constitute over 35% of the total market, followed by meat, fish, vegetables, pizza and other goods (Figure 16).96 Processed meat is still a relatively small part of the processed food market, reflecting people’s general preference for fresh meat, but this is likely to change as lifestyles change.97
Traditionally, sugar intake in China has been very low compared with the global average. However, there has been significant growth in the confectionery sector, with sugar-based confectionery the most popular type, followed by gum and chocolate. Domestic companies currently dominate the market, particularly in rural areas where price is an issue. In 2010, overseas operators accounted for only about 25% of the market, concentrating on more affluent urban consumers in major cities.98 However, many multinational companies see growth opportunities in China’s current combination of low per capita intakes and high population numbers, and are establishing their presence in China. The health implications of this push to grow the confectionery market are likely to be negative and are discussed in the context of overall dietary change in Chapter Five.
94 This particular partnership ended in a legal battle over alleged malpractices by Wahaha. 95 The Cattle Site. (2012). Arla to invest in China Mengniu Dairy. 18 June, http://www.thecattlesite.com/news/38879/arla-to-invest-in-china-mengniu-dairy 96 Bradbury J. (2012). China and Hong Kong: Food Opportunities for Maine. Portland: Maine International Trade Center.97 Bradbury J. (2012). China and Hong Kong: Food Opportunities for Maine. Portland: Maine International Trade Center. 98 Agriculture and Agri-Food Canada. (2012). Consumer Trends: Confectionery in China. Market Indicator Report. Ottawa: International Markets Bureau, Agriculture and Agri-Food Canada.
37%
25%
23%
8% 2% 5%
Frozen ready meals Frozen meat products
Frozen fish / seafood
Frozen vegetables Frozen pizza
Other
Figure 16: The frozen food market in China
Source: Bradbury J. (2012). China and Hong Kong: Food Opportunities for Maine. Portland: Maine International Trade Center.
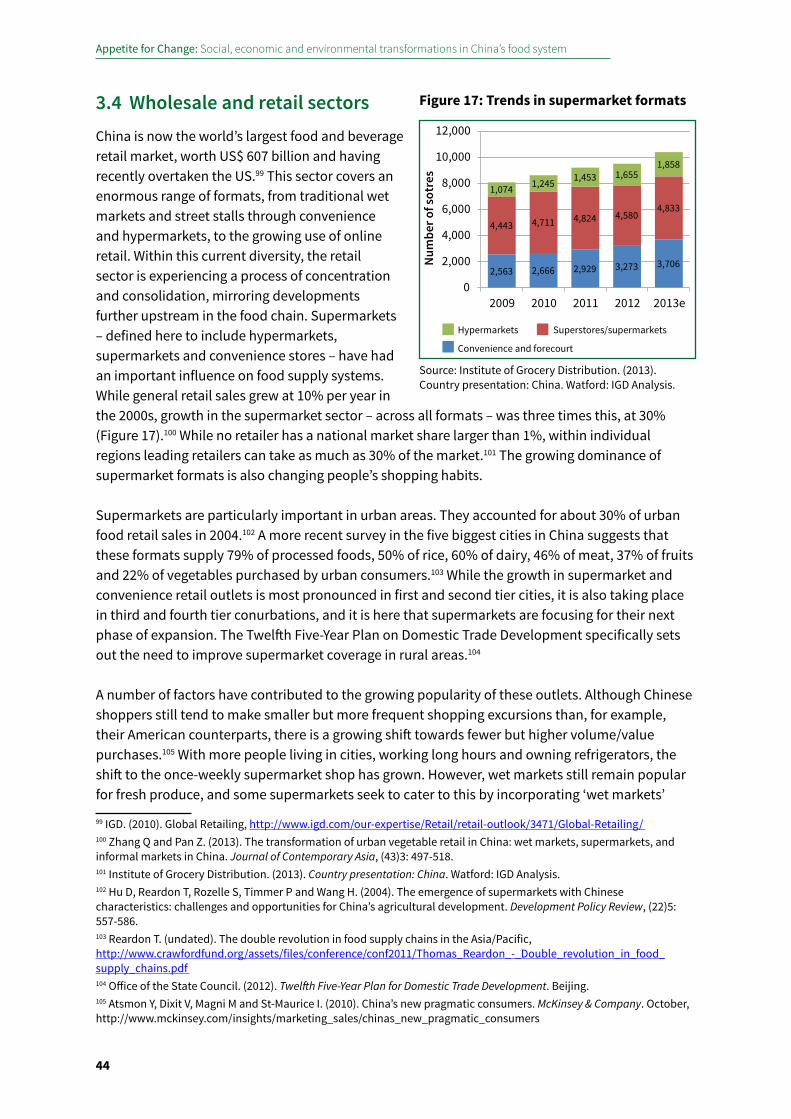
Appetite for Change: Social, economic and environmental transformations in China’s food system
44
3.4 Wholesale and retail sectorsChina is now the world’s largest food and beverage retail market, worth US$ 607 billion and having recently overtaken the US.99 This sector covers an enormous range of formats, from traditional wet markets and street stalls through convenience and hypermarkets, to the growing use of online retail. Within this current diversity, the retail sector is experiencing a process of concentration and consolidation, mirroring developments further upstream in the food chain. Supermarkets – defined here to include hypermarkets, supermarkets and convenience stores – have had an important influence on food supply systems. While general retail sales grew at 10% per year in the 2000s, growth in the supermarket sector – across all formats – was three times this, at 30% (Figure 17).100 While no retailer has a national market share larger than 1%, within individual regions leading retailers can take as much as 30% of the market.101 The growing dominance of supermarket formats is also changing people’s shopping habits.
Supermarkets are particularly important in urban areas. They accounted for about 30% of urban food retail sales in 2004.102 A more recent survey in the five biggest cities in China suggests that these formats supply 79% of processed foods, 50% of rice, 60% of dairy, 46% of meat, 37% of fruits and 22% of vegetables purchased by urban consumers.103 While the growth in supermarket and convenience retail outlets is most pronounced in first and second tier cities, it is also taking place in third and fourth tier conurbations, and it is here that supermarkets are focusing for their next phase of expansion. The Twelfth Five-Year Plan on Domestic Trade Development specifically sets out the need to improve supermarket coverage in rural areas.104
A number of factors have contributed to the growing popularity of these outlets. Although Chinese shoppers still tend to make smaller but more frequent shopping excursions than, for example, their American counterparts, there is a growing shift towards fewer but higher volume/value purchases.105 With more people living in cities, working long hours and owning refrigerators, the shift to the once-weekly supermarket shop has grown. However, wet markets still remain popular for fresh produce, and some supermarkets seek to cater to this by incorporating ‘wet markets’
99 IGD. (2010). Global Retailing, http://www.igd.com/our-expertise/Retail/retail-outlook/3471/Global-Retailing/ 100 Zhang Q and Pan Z. (2013). The transformation of urban vegetable retail in China: wet markets, supermarkets, and informal markets in China. Journal of Contemporary Asia, (43)3: 497-518. 101 Institute of Grocery Distribution. (2013). Country presentation: China. Watford: IGD Analysis.102 Hu D, Reardon T, Rozelle S, Timmer P and Wang H. (2004). The emergence of supermarkets with Chinese characteristics: challenges and opportunities for China’s agricultural development. Development Policy Review, (22)5: 557-586.103 Reardon T. (undated). The double revolution in food supply chains in the Asia/Pacific, http://www.crawfordfund.org/assets/files/conference/conf2011/Thomas_Reardon_-_Double_revolution_in_food_supply_chains.pdf 104 Office of the State Council. (2012). Twelfth Five-Year Plan for Domestic Trade Development. Beijing.105 Atsmon Y, Dixit V, Magni M and St-Maurice I. (2010). China’s new pragmatic consumers. McKinsey & Company. October, http://www.mckinsey.com/insights/marketing_sales/chinas_new_pragmatic_consumers
2,563 2,666 2,929 3,273 3,706
4,443 4,711 4,824 4,580 4,833
1,074 1,245 1,453 1,655 1,858
0
2,000
4,000
6,000
8,000
10,000
12,000
2009 2010 2011 2012 2013e
Hypermarkets Superstores/supermarkets
Convenience and forecourt
Num
ber o
f sot
res
Figure 17: Trends in supermarket formats
Source: Institute of Grocery Distribution. (2013). Country presentation: China. Watford: IGD Analysis.
Supply chain transformations
45
3
within their stores. The sector has also been boosted substantially by active government support, including the ‘nonggaichao’ campaign (i.e., ‘wet market reform to supermarket’), initiated in the 2000s, which aimed to replace wet markets with supermarkets. This policy was driven by the desire to improve standards of hygiene, ventilation, and waste management, but economic motivations also played a part: the high cost of land in urban areas has increased pressure to use the land for more profitable, tax revenue-generating purposes, and supermarkets generate higher profits than the traditional markets they replace. However, wet markets persist and although they can be subject to zoning and other regulations, many people continue to prefer them on the grounds of price and freshness.106
Although the divide between ‘traditional’ wet markets and ‘modern’ supermarkets appears very clear-cut, in practice their supply chains can be closely interwoven. The horticultural sector is still dominated by multiple small producers and there is currently little opportunity for supermarkets to enter into direct production contracts with large-scale suppliers. As a result, supermarkets still purchase from wholesalers which are in turn fed by a large number of small suppliers. This is one of the reasons why supermarkets are often seen as less attractive propositions than wet markets for fresh produce. Transaction costs and delivery schedules mean they cannot compete with the latter either on price or freshness.
The fragmentation of the wholesale sector is therefore a target for policy-driven modernisation. A key element of government’s plans to achieve this, set out in its Twelfth Five-Year Plan for Agriculture and Rural Development, is to invest heavily in improved grading, distribution, cold storage and packaging. Linked to this, the ‘Agricultural Products Core Circulation Network Construction Project’ set out in the Twelfth Five-Year Plan for Domestic Trade107 intends to link 100 chain supermarkets with direct relationships to agricultural bases, through standardised purchasing contracts. At provincial city level and in high-quality agricultural production areas, 100 core wholesale markets will be set up. For prefectural level cities 500 wholesale markets will be created and at county and township levels 6,000 agricultural trade markets. These markets will be supported by cold storage logistic facilities, distribution centres and electronic accounting systems. The plan also promotes the ‘transporting vegetables from south to north China’ initiative as an example of a modern agricultural trade logistics pilot.
Box 8: The role of multinational retailers in China
China’s leading retailers are made up of both Chinese and multinational brands. The top retailer, Auchan, is actually operating as a brand under a joint partnership between Auchan and the Taiwan-based Sun Art Group (Figure 18).
Despite the strong presence of overseas companies, this is not a story of untrammelled growth. Recent years have seen somewhat patchy progress by some of the international retailers, which have not been helped by an overall slowdown in the retail sector. Poor performance by Tesco, for example, is leading the company to seek revival through a joint venture with China Resources Enterprise.108 While the major multinational retailers have enormous experience in running supermarket operations, they are less knowledgeable about local markets, tastes and preferences, which is where Chinese companies have the edge.
106 Herring L, Hui D, Morgan P and Tufft C. (2012). Inside China’s hypermarkets: Past and prospects. McKinsey & Company. May, http://csi.mckinsey.com/Knowledge_by_region/Asia/China/Inside_Chinas_hypermarkets107 Office of the State Council. (2012). Twelfth Five-Year Plan for Domestic Trade Development. Beijing.108 Neville S. (2013). Tesco set to withdraw brand from China in new joint venture. The Guardian. 9 August,http://www.theguardian.com/business/2013/aug/09/tesco-withdraws-brand-china-joint-venture?INTCMP=SRCH
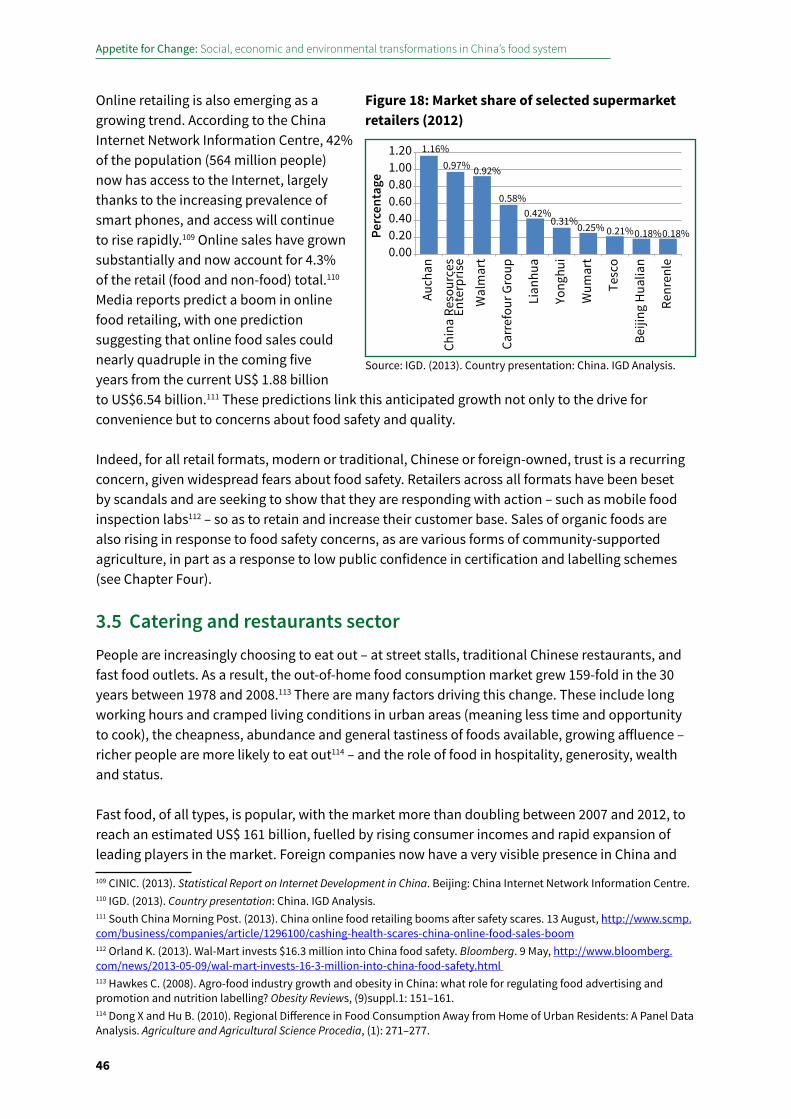
Appetite for Change: Social, economic and environmental transformations in China’s food system
46
Online retailing is also emerging as a growing trend. According to the China Internet Network Information Centre, 42% of the population (564 million people) now has access to the Internet, largely thanks to the increasing prevalence of smart phones, and access will continue to rise rapidly.109 Online sales have grown substantially and now account for 4.3% of the retail (food and non-food) total.110 Media reports predict a boom in online food retailing, with one prediction suggesting that online food sales could nearly quadruple in the coming five years from the current US$ 1.88 billion to US$6.54 billion.111 These predictions link this anticipated growth not only to the drive for convenience but to concerns about food safety and quality.
Indeed, for all retail formats, modern or traditional, Chinese or foreign-owned, trust is a recurring concern, given widespread fears about food safety. Retailers across all formats have been beset by scandals and are seeking to show that they are responding with action – such as mobile food inspection labs112 – so as to retain and increase their customer base. Sales of organic foods are also rising in response to food safety concerns, as are various forms of community-supported agriculture, in part as a response to low public confidence in certification and labelling schemes (see Chapter Four).
3.5 Catering and restaurants sectorPeople are increasingly choosing to eat out – at street stalls, traditional Chinese restaurants, and fast food outlets. As a result, the out-of-home food consumption market grew 159-fold in the 30 years between 1978 and 2008.113 There are many factors driving this change. These include long working hours and cramped living conditions in urban areas (meaning less time and opportunity to cook), the cheapness, abundance and general tastiness of foods available, growing affluence – richer people are more likely to eat out114 – and the role of food in hospitality, generosity, wealth and status.
Fast food, of all types, is popular, with the market more than doubling between 2007 and 2012, to reach an estimated US$ 161 billion, fuelled by rising consumer incomes and rapid expansion of leading players in the market. Foreign companies now have a very visible presence in China and
109 CINIC. (2013). Statistical Report on Internet Development in China. Beijing: China Internet Network Information Centre.110 IGD. (2013). Country presentation: China. IGD Analysis.111 South China Morning Post. (2013). China online food retailing booms after safety scares. 13 August, http://www.scmp.com/business/companies/article/1296100/cashing-health-scares-china-online-food-sales-boom112 Orland K. (2013). Wal-Mart invests $16.3 million into China food safety. Bloomberg. 9 May, http://www.bloomberg.com/news/2013-05-09/wal-mart-invests-16-3-million-into-china-food-safety.html 113 Hawkes C. (2008). Agro-food industry growth and obesity in China: what role for regulating food advertising and promotion and nutrition labelling? Obesity Reviews, (9)suppl.1: 151–161.114 Dong X and Hu B. (2010). Regional Difference in Food Consumption Away from Home of Urban Residents: A Panel Data Analysis. Agriculture and Agricultural Science Procedia, (1): 271–277.
1.16%0.97% 0.92%
0.58%
0.42% 0.31%0.25% 0.21% 0.18% 0.18%
0.000.200.400.600.801.001.20
Auch
an
Chin
a Re
sour
ces
Ente
rpris
e
Wal
mar
t
Carr
efou
r Gro
up
Lian
hua
Yong
hui
Wum
art
Tesc
o
Beiji
ng H
ualia
n
Renr
enle
Perc
enta
ge
Figure 18: Market share of selected supermarket retailers (2012)
Source: IGD. (2013). Country presentation: China. IGD Analysis.
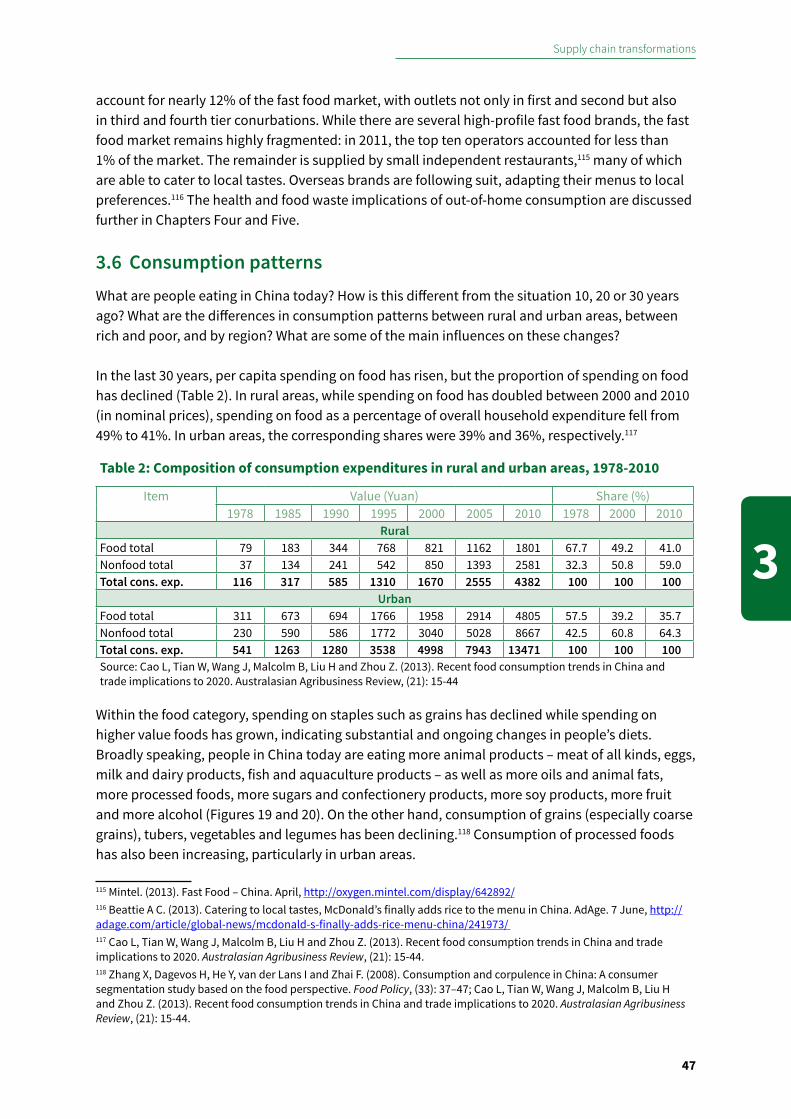
Supply chain transformations
47
3
account for nearly 12% of the fast food market, with outlets not only in first and second but also in third and fourth tier conurbations. While there are several high-profile fast food brands, the fast food market remains highly fragmented: in 2011, the top ten operators accounted for less than 1% of the market. The remainder is supplied by small independent restaurants,115 many of which are able to cater to local tastes. Overseas brands are following suit, adapting their menus to local preferences.116 The health and food waste implications of out-of-home consumption are discussed further in Chapters Four and Five.
3.6 Consumption patternsWhat are people eating in China today? How is this different from the situation 10, 20 or 30 years ago? What are the differences in consumption patterns between rural and urban areas, between rich and poor, and by region? What are some of the main influences on these changes?
In the last 30 years, per capita spending on food has risen, but the proportion of spending on food has declined (Table 2). In rural areas, while spending on food has doubled between 2000 and 2010 (in nominal prices), spending on food as a percentage of overall household expenditure fell from 49% to 41%. In urban areas, the corresponding shares were 39% and 36%, respectively.117
Within the food category, spending on staples such as grains has declined while spending on higher value foods has grown, indicating substantial and ongoing changes in people’s diets. Broadly speaking, people in China today are eating more animal products – meat of all kinds, eggs, milk and dairy products, fish and aquaculture products – as well as more oils and animal fats, more processed foods, more sugars and confectionery products, more soy products, more fruit and more alcohol (Figures 19 and 20). On the other hand, consumption of grains (especially coarse grains), tubers, vegetables and legumes has been declining.118 Consumption of processed foods has also been increasing, particularly in urban areas.
115 Mintel. (2013). Fast Food – China. April, http://oxygen.mintel.com/display/642892/116 Beattie A C. (2013). Catering to local tastes, McDonald’s finally adds rice to the menu in China. AdAge. 7 June, http://adage.com/article/global-news/mcdonald-s-finally-adds-rice-menu-china/241973/ 117 Cao L, Tian W, Wang J, Malcolm B, Liu H and Zhou Z. (2013). Recent food consumption trends in China and trade implications to 2020. Australasian Agribusiness Review, (21): 15-44.118 Zhang X, Dagevos H, He Y, van der Lans I and Zhai F. (2008). Consumption and corpulence in China: A consumer segmentation study based on the food perspective. Food Policy, (33): 37–47; Cao L, Tian W, Wang J, Malcolm B, Liu H and Zhou Z. (2013). Recent food consumption trends in China and trade implications to 2020. Australasian Agribusiness Review, (21): 15-44.
Table 2: Composition of consumption expenditures in rural and urban areas, 1978-2010
Item Value (Yuan) Share (%)1978 1985 1990 1995 2000 2005 2010 1978 2000 2010
RuralFood total 79 183 344 768 821 1162 1801 67.7 49.2 41.0Nonfood total 37 134 241 542 850 1393 2581 32.3 50.8 59.0Total cons. exp. 116 317 585 1310 1670 2555 4382 100 100 100
UrbanFood total 311 673 694 1766 1958 2914 4805 57.5 39.2 35.7Nonfood total 230 590 586 1772 3040 5028 8667 42.5 60.8 64.3Total cons. exp. 541 1263 1280 3538 4998 7943 13471 100 100 100Source: Cao L, Tian W, Wang J, Malcolm B, Liu H and Zhou Z. (2013). Recent food consumption trends in China and trade implications to 2020. Australasian Agribusiness Review, (21): 15-44
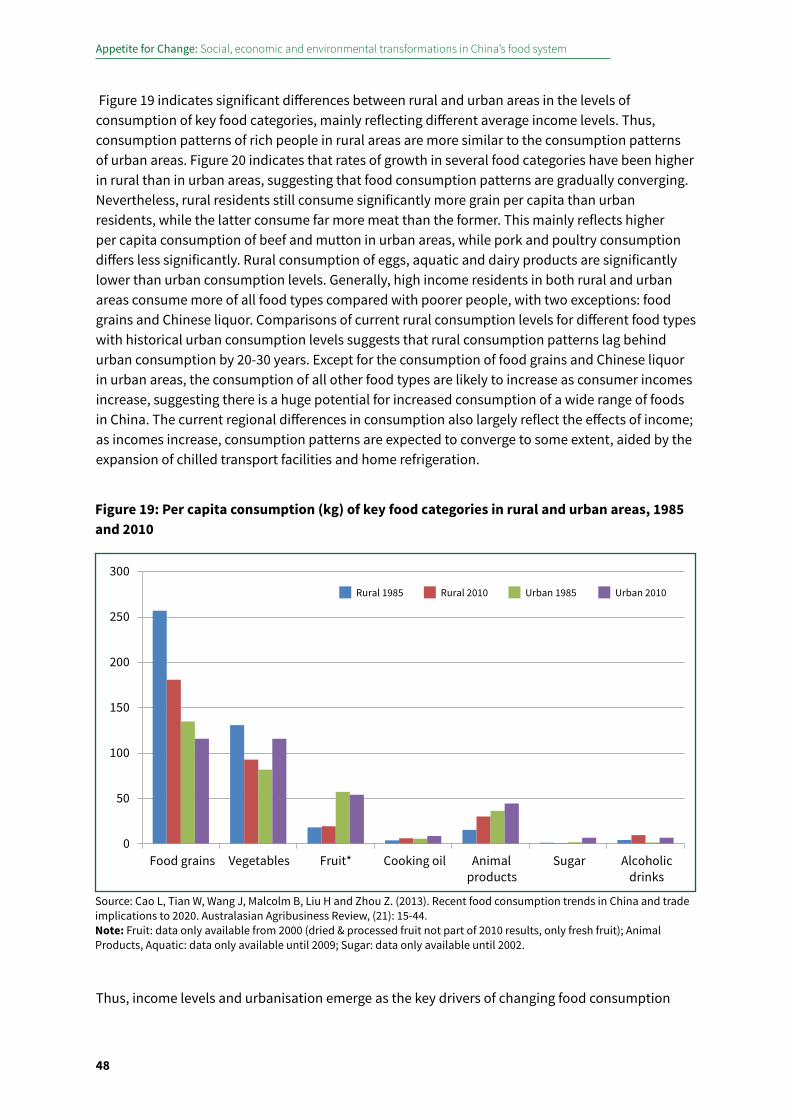
Appetite for Change: Social, economic and environmental transformations in China’s food system
48
Figure 19 indicates significant differences between rural and urban areas in the levels of consumption of key food categories, mainly reflecting different average income levels. Thus, consumption patterns of rich people in rural areas are more similar to the consumption patterns of urban areas. Figure 20 indicates that rates of growth in several food categories have been higher in rural than in urban areas, suggesting that food consumption patterns are gradually converging. Nevertheless, rural residents still consume significantly more grain per capita than urban residents, while the latter consume far more meat than the former. This mainly reflects higher per capita consumption of beef and mutton in urban areas, while pork and poultry consumption differs less significantly. Rural consumption of eggs, aquatic and dairy products are significantly lower than urban consumption levels. Generally, high income residents in both rural and urban areas consume more of all food types compared with poorer people, with two exceptions: food grains and Chinese liquor. Comparisons of current rural consumption levels for different food types with historical urban consumption levels suggests that rural consumption patterns lag behind urban consumption by 20-30 years. Except for the consumption of food grains and Chinese liquor in urban areas, the consumption of all other food types are likely to increase as consumer incomes increase, suggesting there is a huge potential for increased consumption of a wide range of foods in China. The current regional differences in consumption also largely reflect the effects of income; as incomes increase, consumption patterns are expected to converge to some extent, aided by the expansion of chilled transport facilities and home refrigeration.
Thus, income levels and urbanisation emerge as the key drivers of changing food consumption
Figure 19: Per capita consumption (kg) of key food categories in rural and urban areas, 1985 and 2010
0
50
100
150
200
250
300
Food grains Vegetables Fruit* Cooking oil Animalproducts
Sugar Alcoholicdrinks
Rural 1985 Rural 2010 Urban 1985 Urban 2010
Source: Cao L, Tian W, Wang J, Malcolm B, Liu H and Zhou Z. (2013). Recent food consumption trends in China and trade implications to 2020. Australasian Agribusiness Review, (21): 15-44.Note: Fruit: data only available from 2000 (dried & processed fruit not part of 2010 results, only fresh fruit); Animal Products, Aquatic: data only available until 2009; Sugar: data only available until 2002.

Supply chain transformations
49
3
patterns.119 Other driving factors include: changes in lifestyle that place a premium on convenience; the availability of new cooking and storage methods (from refrigeration to the microwave); exposure to new foods and ideas about food through globalisation processes; the development of more technologically sophisticated food production and marketing systems; and changes in population structure (including the one child family and ageing). The environmental and health implications of these transformations are explored in the following chapters.
119 Cao L, Tian W, Wang J, Malcolm B, Liu H and Zhou Z. (2013). Recent food consumption trends in China and trade implications to 2020. Australasian Agribusiness Review, (21): 15-44.
-100
0
100
200
300
400
500
Food
gra
ins
Vege
tabl
es
Frui
t
Cook
ing
oil
Mea
ts
Poul
try
Poul
try
eggs
Aqua
tic p
rodu
cts
Suga
r
Alco
holic
drin
ks
Milk
and
dai
ry
% Growth urban % Growth rural
Figure 20: Growth rate (%) in rural and urban purchases of key food categories, 1985-2010
Source: Cao L, Tian W, Wang J, Malcolm B, Liu H and Zhou Z. (2013). Recent food consumption trends in China and trade implications to 2020. Australasian Agribusiness Review, (21): 15-44
Note: Fruit: data only available from 2000 (dried & processed fruit not part of 2010 results, only fresh fruit); Animal Products, Aquatic: data only available until 2009; Milk and dairy products: data only available from 1995; Sugar: data only available until 2002.
Appetite for Change: Social, economic and environmental transformations in China’s food system
50
4 Environmental transformations
This chapter addresses environmental issues associated with China’s food system. These include resource constraints and challenges to the efficiency with which limited resources are used, as well as the impacts of production and consumption on environmental resources within China. Specifically, in Section 4.1.1 we focus on impacts within China on land resources, water resources, nutrient and mineral pollution, and food waste. Beyond China’s borders, the food system has impacts on greenhouse gases (4.2.1) as well as natural resources such as forests and peatlands in other countries (4.2.2). Several environmental issues have been directly addressed by government policies, and these initiatives are reviewed in Section 4.3.
4.1 Trends in environmental impactsThis section looks at the environmental impacts of China’s food system from two perspectives – domestic concerns and international concerns – and explores linkages between the two.
4.1.1 Domestic environmental impacts
i) Land resources
China has long faced the dual challenges of safeguarding its total area of productive agricultural land and maintaining or improving the quality of that land (see Box 2 and Section 3.2.2). Per capita arable land resources are very limited – around 0.1 ha – and a large proportion of soils are of relatively poor quality; average soil organic matter in topsoil in China is 10 g/kg compared to 25-40 g/kg in Europe and the US.120 Poor soil and crop management practices over centuries have contributed to significant soil erosion in some parts of the country, such as the Loess Plateau. In recent years, however, large scale programmes to address soil erosion from cultivation of marginal lands have had significant impacts on controlling soil erosion (see Box 9).121 Overall, soil organic matter has been increasing in much of China’s arable lands over the last 20 years, especially in the south and east.122 Land degradation in China’s 400 million ha of rangelands, however, became progressively more severe in the last 20 years of the last century and remains a major issue today.
120 Fan M, Shen J, Yuan L, Jiang R, Chen X, Davies W and Zhang F. (2012). Improving crop productivity and resource use efficiency to ensure food security and environmental quality in China. Journal of Experimental Botany, (63)1: 13-24.121 Deng L, Shangguan Z and Li R. (2012). Effects of the grain-for-green program on soil erosion in China. International Journal of Sediment Research, (27)1: 120-127.122 Xie Z, Zhu J, Liu G, Cadisch G, Hasegawa T, Chen C, Sun H, Tang H and Zeng Q. (2007). Soil organic carbon stocks in China and changes from 1980s to 2000s. Global Change Biology, (13)9: 1989-2007.
Environmental transformations
51
4
Box 9: The Grain for Green programme
In 1999, following severe flooding in the Yangtze River basin in 1998, China began to implement the ‘Grain for Green’ programme, one of the largest ecological restoration programmes in the world. The programme pays farmers subsidies to convert marginal arable land (e.g., land on slopes >25°) to forest or grassland, and has afforested large areas of degraded and abandoned cropland. As of 2008, 26.7 million ha were enrolled in the programme, including 9.3 million ha of afforested arable land and 15.8 million ha of afforested wasteland.
Assessments of the programme’s environmental impacts are favourable, with positive effects on ecological restoration, carbon sequestration, water retention and reduced soil erosion. However, the programme’s impacts on rural incomes and income distribution as well as local food production have been varied.123 In general, farmers have avoided adverse impacts on incomes by increasing their participation in off-farm work. But not all households have been able to benefit to the same extent, and the risk that converted lands are recultivated remains. Since 2007, the programme has been in a ‘consolidation’ phase aimed at ensuring the programme’s goals are met in existing target areas, rather than expanding the area covered by the programme.124
ii) Water resources
With just under 20% of the world’s population, China has only 5.3% of its total renewable water resources.125 Water resources are unevenly distributed: 70% of China’s groundwater resources are in southern China, while the dryland areas of northern China, with only 30% of resources, produce around 40% of total crop output.126 Climate change may also further limit water availability, with the national assessment report warning that China’s grain output could fall by 5-20% by 2050 in the absence of adaptation measures.127
Although industrial and urban residential water use has been increasing rapidly, agriculture is still the largest user of water resources, accounting for more than 60% of water use.128 Qin et al (2012)129 calculated water flows for the whole of China’s food system, focusing on its four main subsectors: crop production, animal production, food processing and household food consumption, and taking account of water imports and exports (Figure 21). Crop production used 746 km3 of water, of which 22% was from irrigation water (blue water). Of total crop water use, 60% (453 km3) was for feed production and only 40% (293 km3) was for direct human food production. However, most of the water used for animal feed is likely to be green water, since more than half of the major animal feed crop – maize – is produced under rainfed conditions, particularly in the south.130
123 Liu C and Wu B. (2010). Grain for Green Programme in China: Policy making and implementation? Nottingham: China Policy Institute, University of Nottingham; Liang Y, Li S, Feldman M and Daily G. (2012). Does household composition matter? The impact of the Grain for Green Program on rural livelihoods in China. Ecological Economics, (75): 152–160.124 State Council of the PRC. (2007). Notification from the State Council on Improving Sloped Farmland Conversion Policy. Beijing.125 FAO. Aquastat, http://www.fao.org/nr/water/aquastat/main/index.stm126 Wang J, Huang J, Rozelle S, Huang Q and Blanke A. (2007). Agriculture and groundwater development in northern China: trends, institutional responses, and policy options. Water Policy, (9)S1: 61-74.127 China Economic Review. (2012). Chinese report spells out climate change threat. 19 January, http://www.chinaeconomicreview.com/content/chinese-report-spells-out-climate-change-threat128 Ministry of Water Resources. (2011). Water Resources Bulletin. Beijing.129 Qin W, Ma L, Zhang F and Oenema O. (2012). Urbanization affects water and nitrogen use in the food chain in China. Conference paper. Agro Environ 2012. Wageningen. http://edepot.wur.nl/218156130 Huang Q, Rozelle S, Lohmar B, Huang J and Wang J. (2006). Irrigation, agricultural performance and poverty reduction in China. Food Policy, (31)1: 30-52.
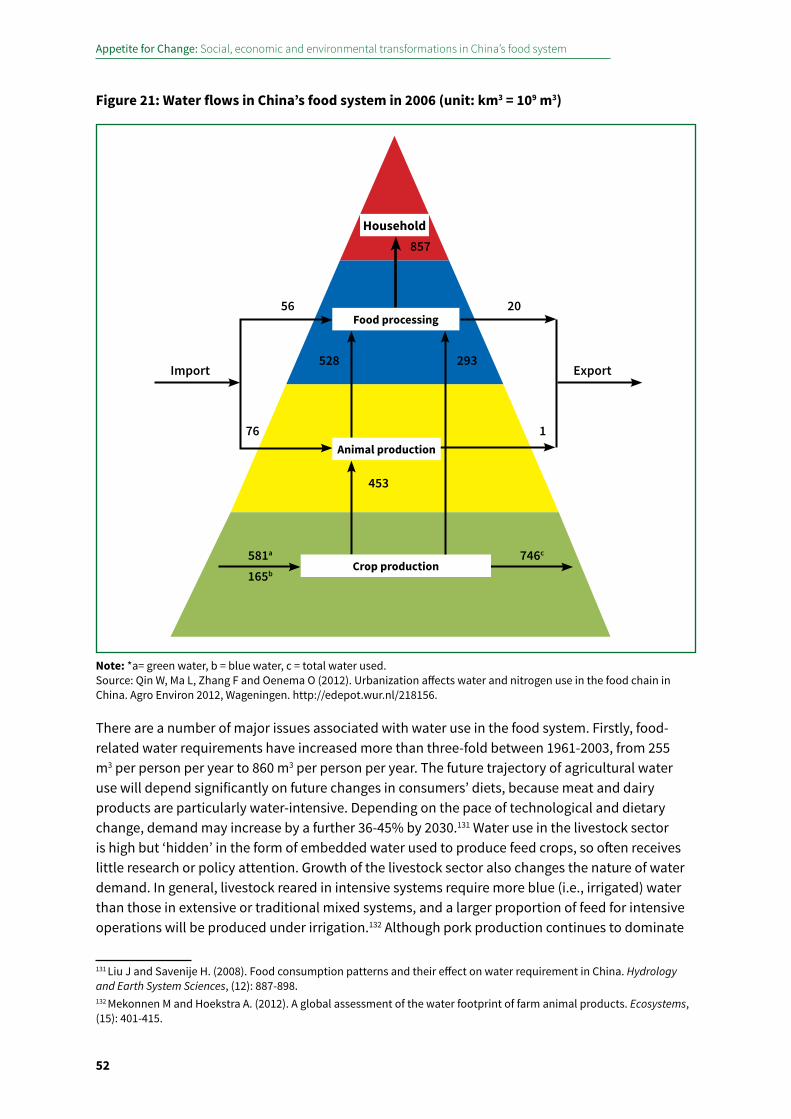
Appetite for Change: Social, economic and environmental transformations in China’s food system
52
There are a number of major issues associated with water use in the food system. Firstly, food-related water requirements have increased more than three-fold between 1961-2003, from 255 m3 per person per year to 860 m3 per person per year. The future trajectory of agricultural water use will depend significantly on future changes in consumers’ diets, because meat and dairy products are particularly water-intensive. Depending on the pace of technological and dietary change, demand may increase by a further 36-45% by 2030.131 Water use in the livestock sector is high but ‘hidden’ in the form of embedded water used to produce feed crops, so often receives little research or policy attention. Growth of the livestock sector also changes the nature of water demand. In general, livestock reared in intensive systems require more blue (i.e., irrigated) water than those in extensive or traditional mixed systems, and a larger proportion of feed for intensive operations will be produced under irrigation.132 Although pork production continues to dominate
131 Liu J and Savenije H. (2008). Food consumption patterns and their effect on water requirement in China. Hydrology and Earth System Sciences, (12): 887-898.132 Mekonnen M and Hoekstra A. (2012). A global assessment of the water footprint of farm animal products. Ecosystems, (15): 401-415.
Household
Import
56 20
76 1
857
528 293
453
581a 746c
165b
Export
Food processing
Animal production
Crop production
Figure 21: Water flows in China’s food system in 2006 (unit: km3 = 109 m3)
Note: *a= green water, b = blue water, c = total water used. Source: Qin W, Ma L, Zhang F and Oenema O (2012). Urbanization affects water and nitrogen use in the food chain in China. Agro Environ 2012, Wageningen. http://edepot.wur.nl/218156.

Environmental transformations
53
4
China’s livestock sector, intensive poultry production is increasing rapidly. Poultry production tends to have a smaller blue and grey water footprint per ton of product than pork or cattle products due to its higher feed conversion efficiency.
Secondly, water use efficiency is low. More than half of pumped irrigation water never reaches the fields, being lost either to leaks in channels or to evaporation. Large-scale investments in channel lining, field levelling and more efficient irrigation systems have helped to decrease the water use intensity of Chinese agriculture,133 but further improvements are needed and seen as a national policy priority. Adoption of more efficient irrigation methods can also reduce the energy intensity of irrigation. Competition for water resources from industrial and urban water demand is rising. The economic productivity of water use in non-agricultural sectors is generally higher than in agriculture, but allocation of water between sectors needs to consider food security imperatives. Innovative systems, such as inter-sectoral water rights transfer schemes are being piloted, through which industry invests in improving agricultural water use efficiency in return for the rights to use the water saved.134
Thirdly, water resources are being exploited at an unsustainable rate. Groundwater abstraction in China has increased ten-fold since the 1950s, and roughly 70% of the irrigated area in northern China is now groundwater-fed. Between 1978 and 2003, the number of groundwater tube wells across China more than doubled.135 Groundwater over-exploitation is already lowering the water table,136 which has further impacts on soil salinity, and the ecology of rivers, wetlands and lakes. Groundwater extraction requires energy, and greenhouse gas (GHG) emissions from this process have been estimated at 33.1 Mt CO2e, just over half a per cent of the national total, or 3% of total agricultural emissions.137
Pollution of freshwater resources further reduces the availability of safe water for agricultural production. More than 40% of China’s rivers are severely polluted, more than 80% of its lakes suffer from eutrophication, and about 300 million rural residents lack access to safe drinking water.138 Wastewater, which is sometimes used in agricultural irrigation, may have high concentrations of heavy metals, posing both environmental and health risks.139
133 Wu P, Jin J and Zhao X. (2010). Impact of climate change and irrigation technology advancement on agricultural water use in China. Climate Change, (100): 797–805.134 Cenacchi N, Xue Y, Fu X and Ringler C. (2010). Water rights and water rights trading: option for the Yellow River Basin? Washington D.C.: IFPRI.135 Wang J, Huang J, Rozelle S, Huang Q and Blanke A. (2007). Agriculture and groundwater development in northern China: trends, institutional responses, and policy options. Water Policy, (9)S1: 61-74.136 Liu C, Yu J and Kendy E. (2001). Groundwater exploitation and its impact on the environment in the North China Plain. Water International, (26): 265-272; Yuan Z and Shen Y. (2013). Estimation of agricultural water consumption from meteorological and yield data: a case study of Hebei, North China. Plos One, (8): e58685.137 Wang J, Rothausen G, Conway D, Zhang L, Xiong W, Holman I and Li Y. (2012). China’s water–energy nexus: greenhouse-gas emissions from groundwater use for agriculture. Environmental Research Letters, (7): 014035.138 Chinese Academy of Sciences. (2007). China Sustainable Development Strategy Report: Water Governance and Innovation. Beijing: Science Press (cited in Liu J and Yang W. (2012). Water sustainability for China and beyond. Science, (337)6095: 649-650).139 Khan S, Cao Q, Zheng Y, Huang Y and Zhu Y. (2008). Health risks of heavy metals in contaminated soils and food crops irrigated with wastewater in Beijing, China. Environmental Pollution, (152)3: 686-692; FORHEAD (2014). Food Safety in China: Problems, Governance and Research. www.forhead.org.
Appetite for Change: Social, economic and environmental transformations in China’s food system
54
The importance of many of these issues for agricultural production has been recognised in recent government policies, which are reviewed in Section 4.3. Another response – both intentional and unintentional – has been to ‘import’ water in the form of ‘virtual water’ embodied in imported feed and other commodities (see Section 4.2.2).
iii) Nutrient and mineral pollution
Agriculture has been regularly highlighted as a major source of water pollutants since the publication of the State of the Environment Report 2002,140 which noted that most large livestock farms did not have appropriate facilities for waste treatment. Wastewater Chemical Oxygen Demand (COD) exceeded national industrial COD emissions. Subsequent surveys (e.g., the First National Pollution Sources Census) found substantial emissions of COD, N, P and heavy metals including copper and zinc, with livestock waste being a major contributor to all of these.141 Livestock waste was identified as the source of one third of national emissions of COD, and together fertiliser and livestock waste were estimated to cause losses of 2.6 million tonnes of nitrogen and 27 million tonnes of phosphorus, as well as several thousand tonnes of copper and zinc.142 Here we consider the implications of fertiliser use and manure management for nitrogen and phosphorus flows.
Materials flows analysis can estimate the flows, use efficiencies and emissions of N (nitrogen) and P (phosphorus) in the food chain from harvest through to consumption. An analysis for wheat, rice and maize, which account for 80% of total grain production in China, has been conducted.143
Overall, nutrient use efficiencies in China are significantly lower than in developed countries. To deliver 1 kg of protein N to a household consuming an average Chinese diet, around 11 kg of N is used throughout the supply chain – meaning that 10 kg is lost to soil, water and air. Similarly, to deliver 1 kg of P, 13 kg of P are used, implying a loss of 12 kg.144 By comparison, in developed countries, the estimated N cost of delivering 1 kg of food N is typically between 4-7 kg, while the world average for P is 9 kg per kg of delivered P.145 The nitrogen lost can enter the atmosphere (in the form of N2O or NH3), accumulate in soils, or enter waterways. Total mean N loss via ammonia (NH3) emissions was 117 kg per ha in China in 2005. Losses via nitrous oxide (N2O) emissions and N leaching (including runoff, erosion and direct discharges) were 4 and 116 kg per ha, respectively. Total P losses via leaching, runoff, erosion and direct discharges were 21 kg per ha in 2005. Between 1980 and 2005, losses of N and P to surface waters increased more than losses to air and groundwater. Livestock manure is a major source, responsible for 38% and 56% of the total N and P discharges into surface waters, respectively.
140 State Environment Protection Agency. (2002). State of the Environment Report 2002. Beijing.141 Ministry of Environmental Protection. (2010). First National Pollution Sources Census. Beijing142 For discussion of heavy metal contamination, see FORHEAD (2014). Food Safety in China: Problems, Governance and Research. www.forhead.org.143 Ma L, Velthof G, Wang F, Qin W, Zhang W, Liu Z, Zhang Y, Wei J, Lesschen J, Ma W, Oenema O and Zhang F. (2012). Nitrogen and phosphorus use efficiencies and losses in the food chain in China at regional scales in 1980 and 2005. Science of the Total Environment, (434): 51-61.144 Ma L, Ma W, Velthof G, Wang F, Qin W, Zhang F and Oenema O. (2010). Modeling nutrient flows in the food chain of China. Journal of Environmental Quality, (39)4: 1279-1289.145 Ma L. (2013). Literature review on food waste issues in relation to China’s food system: drivers, trends and emerging issues. Unpublished report to Food Climate Research Network, University of Oxford.
Environmental transformations
55
4
Nitrogen use efficiency (NUE) and phosphorus use efficiency (PUE) have been decreasing over time, such that the N and P costs of food production and consumption almost doubled between 1980 and 2005. The NUE and PUE of the food processing sector decreased from about 75% to 50%, largely because of food waste. The NUE and PUE of crop production decreased dramatically, reflecting greater fertiliser use per unit output. However, the NUE and PUE of livestock production increased, reflecting productivity increases in the sector.146 Despite this increase in NUE and PUE in livestock production, from a food system perspective, diets high in animal protein suffer greater nutrient inefficiencies and losses than those that are mainly plant-based. This is because plant N is first converted to animal N (with losses in the process) and since livestock also emit N in the form of urine and faeces, only a fraction of the original N is retained in the animal protein that is eventually consumed. Although typical Chinese diets still contain far lower levels of animal protein than those of North Americans and Europeans, increasing demand for meat and dairy products suggests that the inherently lower efficiency of animal-based diets will compound the problem of inefficient agricultural production.
Several factors influence N and P efficiency in agricultural production. Overuse of fertiliser is common.147 This has been encouraged by large subsidies for energy use in fertiliser production and for fertiliser distribution.148 Small and fragmented land holdings, and movement of rural labour to non-farm and urban occupations, are also associated in some areas with higher nutrient application intensities and, coupled with weak extension services, hinder efforts to promote more efficient applications.149 Effective policies to improve fertiliser use remain a challenge (see Section 4.2.1).
Nutrient use efficiency is also affected by manure management.150 In 2010, 3060 million tonnes (fresh weight) of livestock manure were generated in China. Around 20% of manure is wasted and not applied to land, with likely implications for water quality. Of the remaining 80%, about a quarter was composted and 8% used for biogas generation prior to spreading. The remainder (approximately 66%) is spread direct to land often in ways that contribute to environmental problems, for example where applied excessively or at the wrong time. Anticipated increases in meat consumption could generate an additional ca. 1,000 million tonnes of livestock manure per year by 2030 (i.e., a 30% increase over today’s levels). Most of these additional manure nutrients are likely to be generated in CAFOs in peri-urban areas and, if poorly managed, constitute a major environmental problem.
146 Ma L, Velthof G, Wang F, Qin W, Zhang W, Liu Z, Zhang Y, Wei J, Lesschen J, Ma W, Oenema O and Zhang F. (2012). Nitrogen and phosphorus use efficiencies and losses in the food chain in China at regional scales in 1980 and 2005. Science of the Total Environment, (434): 51-61.147 Li Y, Kahrl F, Pan J, Roland-Holst D, Su Y, Wilkes A and Xu J. (2012). Fertiliser use patterns in Yunnan Province, China: Implications for agricultural and environmental policy. Agricultural Systems, (110): 78-89.148 Norse D, Lu Y and Huang J. (2014). China’s food security: Is it a national, regional or global issue? In K Brown (ed). China and the EU in Context. London: Palgrave.149 Tan S, Heerink N, Kruseman G and Qu F. (2008). Do fragmented land holdings have higher productions costs? Evidence from rice farmers in Northeastern Jiangxi Province, P.R. China. China Economic Review, (19): 347-358. 146 SAIN. (2012). Policies and technologies to overcome excessive and inefficient use of nitrogen fertiliser: delivering multiple benefits. SAIN policy brief no. 5. Norwich: Sustainable Agriculture Innovation Network; Zhang W et al. (2013). New technologies reduce greenhouse gas emissions from nitrogenous fertiliser in China. Proceedings of the National Academy of Sciences, (110)21: 8375-8380; Feng S, Heerink N, Ruben R, and Qu F. (2010). Land rental market, off-farm employment and agricultural production in Southeast China: A plot-level case study. China Economic Review, (21): 598-606.150 Chadwick D, Chen Q, Tong Y, Yang G and Shen Q. (2012). Improving manure nutrient management: towards sustainable intensification in China. SAIN policy brief no. 6. Norwich: Sustainable Agriculture Innovation Network.

Appetite for Change: Social, economic and environmental transformations in China’s food system
56
Box 10: Focus on phosphorus
Unlike nitrogen, phosphorus is a finite mineral resource. Overuse contributes to both pollution and resource depletion.151 Urbanisation has had an important influence on the utilisation and recycling of P. All P eaten in food is excreted. While in the past nutrient flows from food via human excreta were typically recycled in a closed loop, nowadays they more often end up in waterways via wastewater from urban centres or as sludge in landfills.152 Material flow analysis in Beijing and Tianjin reveals that the P content in the urban sewage sludge land-filled in these cities was equivalent to 65% and 11% of the nutrients in chemical P fertilisers respectively, indicating the huge potential available for resource efficiency via reuse.153 P flows in uncollected sewage are also a growing environmental concern because of their contribution to eutrophication.
There are problems as well as benefits arising from the use of sewage sludge on agricultural soils. Poorly treated sludge causes environmental pollution and also poses health risks due to the pathogens and toxic substances present.154 While it is possible to address these problems, additional sewage treatment plants are required in China, especially in peri-urban areas, and more active techniques must be adopted to increase the disposal rates of nutrients in sewage sludge. Anaerobic digestion already receives mainstream policy support in China.
iv) Post-harvest environmental impacts
China’s food system is changing from one based on local production for local consumption, to one in which food supply chains are lengthening (indeed globalising), becoming more complex, and where processing is undertaken commercially as well as in the home. ‘Traditional’ supply chains coexist with more modern systems. This combination of traditional and modern poses particular challenges for sustainability. On the one hand, small operators may not be able to afford the latest clean technology, so their emissions per unit of product are likely to be higher than in modern systems. On the other hand, larger enterprises are integrated into modern supply chains, which are often more inherently energy dependent.
Modernisation of the food industry, including investments in improved storage, refrigeration and logistics, as well as further development of retail and catering sectors, implies increased economic activity, all of which also has environmental impacts. Box 12 on the link between refrigeration and waste illustrates the potential implications of supply chain transformations for the environment.
Food waste is perhaps the most significant issue associated with post-harvest environmental impacts. Decomposing food is a source of methane emissions, while wasted food represents a waste of the scarce resources (e.g., water, fertiliser, energy etc.) used to produce it, and a source of unnecessary GHG emissions. Food waste also represents a threat to food security, both through the loss of food and income. Reductions in food waste can therefore enhance food security, reduce
151 Qiao M, Zheng Y and Zhu Y. (2011). Material flow analysis of phosphorus through food consumption in two megacities in northern China. Chemosphere, (84)6: 773-778.152 Qiao M, Zheng Y and Zhu Y. (2011). Material flow analysis of phosphorus through food consumption in two megacities in northern China. Chemosphere, (84)6: 773-778; Li K and Ho M. (2006). Biogas China. Institute of Science in Society report. 2 October, http://www.i-sis.org.uk/BiogasChina.php153 Qiao M, Zheng Y and Zhu Y. (2011). Material flow analysis of phosphorus through food consumption in two megacities in northern China. Chemosphere, (84)6: 773-778.154 Wang C, Hu X, Chen M and Wu Y. (2005). Total concentrations and fractions of Cd, Cr, Pb, Cu, Ni and Zn in sewage sludge from municipal and industrial wastewater treatment plants. Journal of Hazardous Materials, (119)1: 245-249.
Environmental transformations
57
4
negative environmental and health impacts and deliver economic benefits. Waste has potential to occur throughout the supply chain, from the field (where losses arise due to pests and diseases) through to the point of consumption.155
Box 11: Environmental impacts of crop and livestock production in different scale operations and in different systems
There is a strong consensus within Chinese policy circles that increasing the scale of production can help in addressing environmental impacts. It is argued that concentrating nutrient management in larger-scale farm operations not only allows the application of precision management techniques and investment in waste facilities (e.g., manure management systems), but also facilitates inspection and regulation by reducing the number of emission sources. There is, however, only limited evidence that larger-scale land holdings result in improved nutrient use efficiency and that larger-scale livestock operations have lower emissions per unit of output.
In the cropping sector – where smallholder production continues to dominate – several studies indicate that small-scale farms may have higher environmental impacts. Small-scale rice cultivation in the Poyang Lake area has a higher GHG emission intensity than larger scale operations.156 Smaller, more fragmented plots may also experience lower soil organic carbon.157 Mechanised operations, often associated with larger land holdings, can reduce grain losses in sowing and harvesting operations.158 However, growing rental markets for mechanised services may mean that mechanisation does not require larger landholdings,159 and the potential for mechanisation may be limited where the structure of crop production shifts from grains to horticultural crops.160
The evidence basis for increasing the scale of livestock production also requires further research. Larger pig farms with standard waste treatment facilities have lower emissions than smaller household enterprises.161 However, most livestock operations in China are either small or medium-sized specialised operations, and some research shows that specialised households may be more likely to dispose of pig manure by abandonment than small, backyard operations.162 Specialisation and scale are not the same, and it may be possible to be both specialised and small-scale, or to operate mixed crop-livestock systems at a large scale. More research is required to understand the environmental impacts of production at different scales and in different management systems.
155 Gustavsson J, Cederberg C, Sonesson U, van Otterdijk R and Meybeck A. (2011). Global food losses and food waste. Rome: FAO.156 Pan G. (2012). Environmental impacts of crop production. Presentation at FCRN-SSRC Food System Mapping Study workshop. Beijing, March 2012.157 Feng S, Tan S, Zhang A, Zhang Q, Pan G, Qu F, Smith P, Li L and Zhang X. (2011). Effect of household land management on cropland topsoil organic carbon storage at plot scale in a red earth soil area of South China. Journal of Agricultural Science, (149)5: 557–566.158 Xu S. (2005). Analysis on food consumption and waste of China. Food and Nutrient in China, (11): 4-8 (Chinese with English abstract).159 Yang J, Huang Z, Zhang X and Reardon T. (2013). The rapid rise of cross-regional agricultural mechanisation services in China. American Journal of Agricultural Economics, (95)5: 1245-1251.160 v.d. Berg M, Hengsdijk H, Wolf J, v. Ittsersum M, Wang G and Reotter R. (2007). The impact of increasing farm size and mechanisation on rural income and rice production in Zhejiang province, China. Agricultural Systems, (94)3: 841-850.161 Li Z, Xuan H and Hu S. (2012). Waste emission reduction accounting from scale livestock production zones replacing dispersed livestock keepers. Environment and Sustainable Development, (2012)6: 56-59.162 Zhang X, Liu Y and Wang L. (2012). An empirical study on non-point pollution of livestock and poultry raising in western rural areas. Ecological Economy, (2009)7: 98-100, 173.
Appetite for Change: Social, economic and environmental transformations in China’s food system
58
Box 12: Refrigeration and waste
Adequate cold storage along the whole supply chain can play an important role in reducing food losses and waste, but the relationship between food waste and refrigeration is not entirely straightforward. In developed countries, refrigeration is ubiquitous throughout the supply chain, yet household food waste levels are high. Widespread availability of low-cost refrigerated food may even increase our ability to waste food. The reason why food is wasted today has more to do with lifestyles, the low cost of food relative to household incomes and attitudes to food, than it does with the physical capacity to store food safely.163
Refrigeration is, moreover, not a stand-alone technology; its use is linked with a complex of other energy-using technologies in the transport, manufacturing and information technology sectors. The availability of refrigeration has also helped foster a shift towards the marketing and consumption of foods that are inherently dependent on refrigeration – and which, despite refrigeration, may then end up being wasted. These shifts also have implications for energy use throughout the food system. More products require more space to display them, hence bigger stores with more lighting, heating and refrigeration, and larger refrigerators in the home. The commercial imperative to produce many different varieties of the same product (e.g., different flavours of yoghurt), reduces the efficiency of the production plant as equipment needs to be shut and washed down in preparation for the next line. Greater choice can lead to over-purchasing,164 which in turn generates waste.
In China, the availability of food refrigeration is changing behaviour. Meat purchasing patterns are a case in point. While meat in rural markets is mostly not refrigerated, increasing volumes of frozen and chilled fresh meat are bought in urban areas. In major cities, such as Beijing and Shanghai, chilled fresh meat accounts for about 30% of total meat sales; while medium cities lag behind at 10%, the trends are clear.165 China is now the most rapidly growing frozen food market in Asia. In 2007 the Chinese market was valued at US$9.9 billion, representing the second largest market in the Asia-Pacific region, and was forecast to grow by 63% by 2012.166 Frozen meat accounts for 25% of the frozen food market, and seafood products a further 23%. While the processing and freezing of carcasses holds huge potential for waste avoidance, the additional energy demand is worth consideration.167 Refrigeration technologies in China are becoming progressively more efficient, but the scale of changes in demand still implies large increases in absolute energy use and other environmental impacts.168
There have been several estimates of the proportion of food produced in China that is wasted. One picture to emerge from these studies is that – unlike developed countries where most waste is at the consumption stage – most food losses in China are in the supply chain. One study suggests, for
163 Garnett T. (2007). Food refrigeration: What is the contribution to greenhouse gas emissions and how might emissions be reduced? Food Climate Research Network working paper, www.fcrn.org.uk 164 Kahn B and Wansink B. (2004). The influence of assortment structure on perceived variety and consumption quantities. Journal of Consumer Research, (30)4: 519-530.165 Zhou G, Zhang W and Xu X. (2012). China’s meat industry revolution: Challenges and opportunities for the future. Meat Science, (92): 188–196.166 Bradbury J. (2012). China and Hong Kong: Food Opportunities for Maine. Portland: Maine International Trade Center.167 Garnett T. (2007). Food refrigeration: What is the contribution to greenhouse gas emissions and how might emissions be reduced? Food Climate Research Network working paper, www.fcrn.org.uk168 China Refrigerator Project. (undated). Transformation of the refrigerator market in China, http://www.un.org/esa/sustdev/publications/energy_casestudies/section1.pdf; Fridley D, Zheng N, Zhou N, Aden N, Lin J, Cheng J and Sakamoto T. (2008). China Refrigerator Information Label: Specification Development and Potential Impact. Berkeley: Ernest Orlando Lawrence Berkeley National Laboratory.
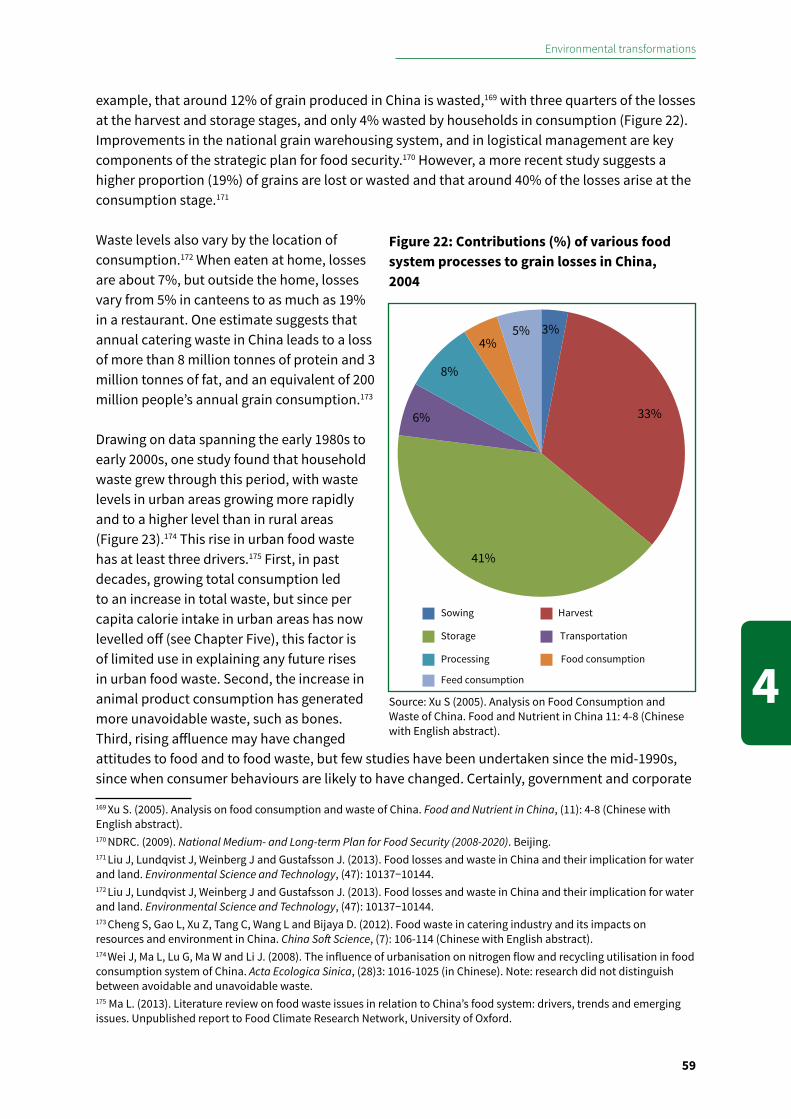
Environmental transformations
59
4
example, that around 12% of grain produced in China is wasted,169 with three quarters of the losses at the harvest and storage stages, and only 4% wasted by households in consumption (Figure 22). Improvements in the national grain warehousing system, and in logistical management are key components of the strategic plan for food security.170 However, a more recent study suggests a higher proportion (19%) of grains are lost or wasted and that around 40% of the losses arise at the consumption stage.171
Waste levels also vary by the location of consumption.172 When eaten at home, losses are about 7%, but outside the home, losses vary from 5% in canteens to as much as 19% in a restaurant. One estimate suggests that annual catering waste in China leads to a loss of more than 8 million tonnes of protein and 3 million tonnes of fat, and an equivalent of 200 million people’s annual grain consumption.173
Drawing on data spanning the early 1980s to early 2000s, one study found that household waste grew through this period, with waste levels in urban areas growing more rapidly and to a higher level than in rural areas (Figure 23).174 This rise in urban food waste has at least three drivers.175 First, in past decades, growing total consumption led to an increase in total waste, but since per capita calorie intake in urban areas has now levelled off (see Chapter Five), this factor is of limited use in explaining any future rises in urban food waste. Second, the increase in animal product consumption has generated more unavoidable waste, such as bones. Third, rising affluence may have changed attitudes to food and to food waste, but few studies have been undertaken since the mid-1990s, since when consumer behaviours are likely to have changed. Certainly, government and corporate
169 Xu S. (2005). Analysis on food consumption and waste of China. Food and Nutrient in China, (11): 4-8 (Chinese with English abstract).170 NDRC. (2009). National Medium- and Long-term Plan for Food Security (2008-2020). Beijing.171 Liu J, Lundqvist J, Weinberg J and Gustafsson J. (2013). Food losses and waste in China and their implication for water and land. Environmental Science and Technology, (47): 10137−10144. 172 Liu J, Lundqvist J, Weinberg J and Gustafsson J. (2013). Food losses and waste in China and their implication for water and land. Environmental Science and Technology, (47): 10137−10144.173 Cheng S, Gao L, Xu Z, Tang C, Wang L and Bijaya D. (2012). Food waste in catering industry and its impacts on resources and environment in China. China Soft Science, (7): 106-114 (Chinese with English abstract).174 Wei J, Ma L, Lu G, Ma W and Li J. (2008). The influence of urbanisation on nitrogen flow and recycling utilisation in food consumption system of China. Acta Ecologica Sinica, (28)3: 1016-1025 (in Chinese). Note: research did not distinguish between avoidable and unavoidable waste.175 Ma L. (2013). Literature review on food waste issues in relation to China’s food system: drivers, trends and emerging issues. Unpublished report to Food Climate Research Network, University of Oxford.
Figure 22: Contributions (%) of various food system processes to grain losses in China, 2004
3%
33%
41%
6%
8%
4% 5%
Sowing Harvest
Storage Transportation
Processing Food consumption
Feed consumption
Source: Xu S (2005). Analysis on Food Consumption and Waste of China. Food and Nutrient in China 11: 4-8 (Chinese with English abstract).
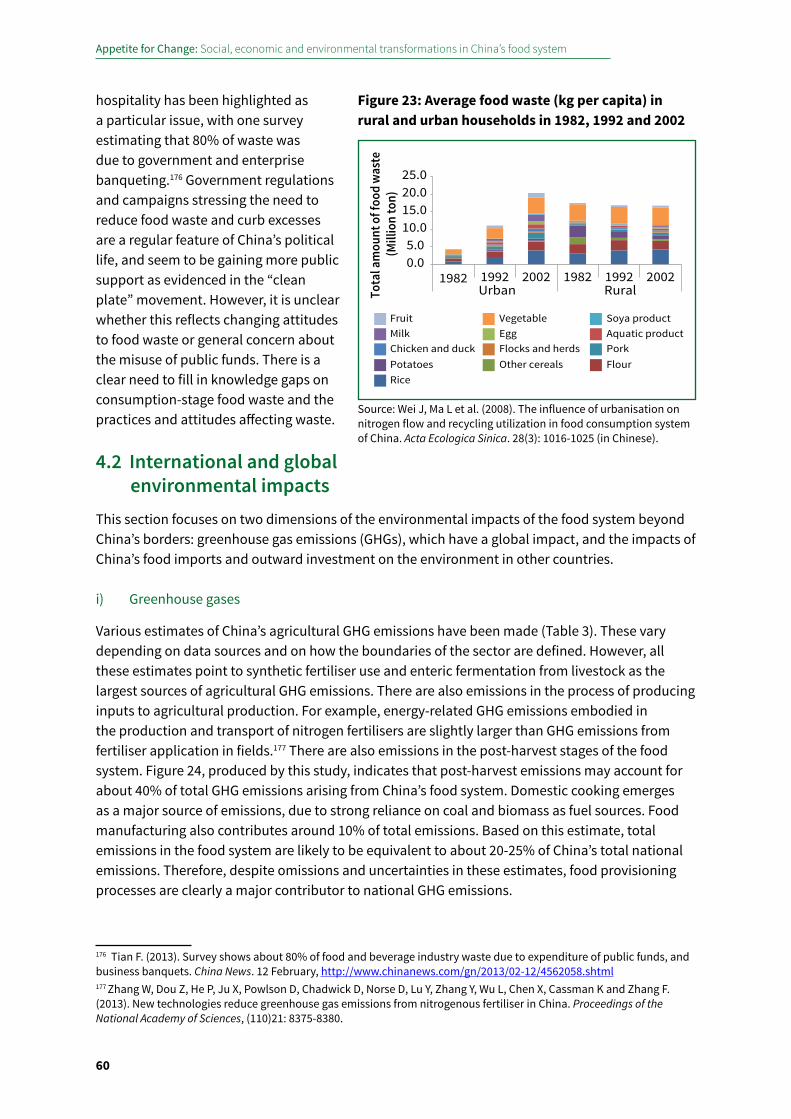
Appetite for Change: Social, economic and environmental transformations in China’s food system
60
hospitality has been highlighted as a particular issue, with one survey estimating that 80% of waste was due to government and enterprise banqueting.176 Government regulations and campaigns stressing the need to reduce food waste and curb excesses are a regular feature of China’s political life, and seem to be gaining more public support as evidenced in the “clean plate” movement. However, it is unclear whether this reflects changing attitudes to food waste or general concern about the misuse of public funds. There is a clear need to fill in knowledge gaps on consumption-stage food waste and the practices and attitudes affecting waste.
4.2 International and global environmental impacts
This section focuses on two dimensions of the environmental impacts of the food system beyond China’s borders: greenhouse gas emissions (GHGs), which have a global impact, and the impacts of China’s food imports and outward investment on the environment in other countries. i) Greenhouse gases
Various estimates of China’s agricultural GHG emissions have been made (Table 3). These vary depending on data sources and on how the boundaries of the sector are defined. However, all these estimates point to synthetic fertiliser use and enteric fermentation from livestock as the largest sources of agricultural GHG emissions. There are also emissions in the process of producing inputs to agricultural production. For example, energy-related GHG emissions embodied in the production and transport of nitrogen fertilisers are slightly larger than GHG emissions from fertiliser application in fields.177 There are also emissions in the post-harvest stages of the food system. Figure 24, produced by this study, indicates that post-harvest emissions may account for about 40% of total GHG emissions arising from China’s food system. Domestic cooking emerges as a major source of emissions, due to strong reliance on coal and biomass as fuel sources. Food manufacturing also contributes around 10% of total emissions. Based on this estimate, total emissions in the food system are likely to be equivalent to about 20-25% of China’s total national emissions. Therefore, despite omissions and uncertainties in these estimates, food provisioning processes are clearly a major contributor to national GHG emissions.
176 Tian F. (2013). Survey shows about 80% of food and beverage industry waste due to expenditure of public funds, and business banquets. China News. 12 February, http://www.chinanews.com/gn/2013/02-12/4562058.shtml177 Zhang W, Dou Z, He P, Ju X, Powlson D, Chadwick D, Norse D, Lu Y, Zhang Y, Wu L, Chen X, Cassman K and Zhang F. (2013). New technologies reduce greenhouse gas emissions from nitrogenous fertiliser in China. Proceedings of the National Academy of Sciences, (110)21: 8375-8380.
0.05.0
10.015.020.025.0
1982 1992 2002 1982 1992 2002Urban Rural
Fruit Vegetable Soya productMilk Egg Aquatic productChicken and duck Flocks and herds PorkPotatoes Other cereals FlourRice
Tota
l am
ount
of f
ood
was
te (M
illio
n to
n)
Figure 23: Average food waste (kg per capita) in rural and urban households in 1982, 1992 and 2002
Source: Wei J, Ma L et al. (2008). The influence of urbanisation on nitrogen flow and recycling utilization in food consumption system of China. Acta Ecologica Sinica. 28(3): 1016-1025 (in Chinese).
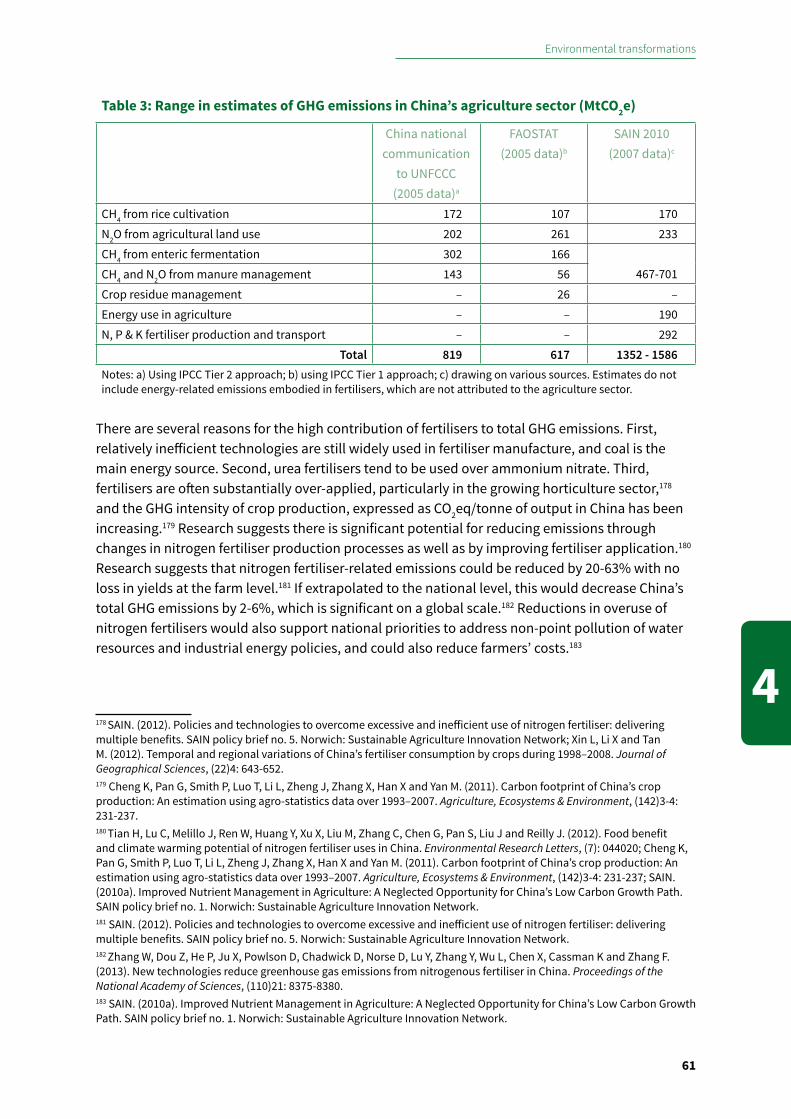
Environmental transformations
61
4
There are several reasons for the high contribution of fertilisers to total GHG emissions. First, relatively inefficient technologies are still widely used in fertiliser manufacture, and coal is the main energy source. Second, urea fertilisers tend to be used over ammonium nitrate. Third, fertilisers are often substantially over-applied, particularly in the growing horticulture sector,178 and the GHG intensity of crop production, expressed as CO2eq/tonne of output in China has been increasing.179 Research suggests there is significant potential for reducing emissions through changes in nitrogen fertiliser production processes as well as by improving fertiliser application.180 Research suggests that nitrogen fertiliser-related emissions could be reduced by 20-63% with no loss in yields at the farm level.181 If extrapolated to the national level, this would decrease China’s total GHG emissions by 2-6%, which is significant on a global scale.182 Reductions in overuse of nitrogen fertilisers would also support national priorities to address non-point pollution of water resources and industrial energy policies, and could also reduce farmers’ costs.183
178 SAIN. (2012). Policies and technologies to overcome excessive and inefficient use of nitrogen fertiliser: delivering multiple benefits. SAIN policy brief no. 5. Norwich: Sustainable Agriculture Innovation Network; Xin L, Li X and Tan M. (2012). Temporal and regional variations of China’s fertiliser consumption by crops during 1998–2008. Journal of Geographical Sciences, (22)4: 643-652.179 Cheng K, Pan G, Smith P, Luo T, Li L, Zheng J, Zhang X, Han X and Yan M. (2011). Carbon footprint of China’s crop production: An estimation using agro-statistics data over 1993–2007. Agriculture, Ecosystems & Environment, (142)3-4: 231-237.180 Tian H, Lu C, Melillo J, Ren W, Huang Y, Xu X, Liu M, Zhang C, Chen G, Pan S, Liu J and Reilly J. (2012). Food benefit and climate warming potential of nitrogen fertiliser uses in China. Environmental Research Letters, (7): 044020; Cheng K, Pan G, Smith P, Luo T, Li L, Zheng J, Zhang X, Han X and Yan M. (2011). Carbon footprint of China’s crop production: An estimation using agro-statistics data over 1993–2007. Agriculture, Ecosystems & Environment, (142)3-4: 231-237; SAIN. (2010a). Improved Nutrient Management in Agriculture: A Neglected Opportunity for China’s Low Carbon Growth Path. SAIN policy brief no. 1. Norwich: Sustainable Agriculture Innovation Network.181 SAIN. (2012). Policies and technologies to overcome excessive and inefficient use of nitrogen fertiliser: delivering multiple benefits. SAIN policy brief no. 5. Norwich: Sustainable Agriculture Innovation Network.182 Zhang W, Dou Z, He P, Ju X, Powlson D, Chadwick D, Norse D, Lu Y, Zhang Y, Wu L, Chen X, Cassman K and Zhang F. (2013). New technologies reduce greenhouse gas emissions from nitrogenous fertiliser in China. Proceedings of the National Academy of Sciences, (110)21: 8375-8380.183 SAIN. (2010a). Improved Nutrient Management in Agriculture: A Neglected Opportunity for China’s Low Carbon Growth Path. SAIN policy brief no. 1. Norwich: Sustainable Agriculture Innovation Network.
Table 3: Range in estimates of GHG emissions in China’s agriculture sector (MtCO2e)
China national communication
to UNFCCC (2005 data)a
FAOSTAT (2005 data)b
SAIN 2010 (2007 data)c
CH4 from rice cultivation 172 107 170N2O from agricultural land use 202 261 233CH4 from enteric fermentation 302 166
467-701CH4 and N2O from manure management 143 56Crop residue management – 26 –Energy use in agriculture – – 190N, P & K fertiliser production and transport – – 292
Total 819 617 1352 - 1586Notes: a) Using IPCC Tier 2 approach; b) using IPCC Tier 1 approach; c) drawing on various sources. Estimates do not include energy-related emissions embodied in fertilisers, which are not attributed to the agriculture sector.
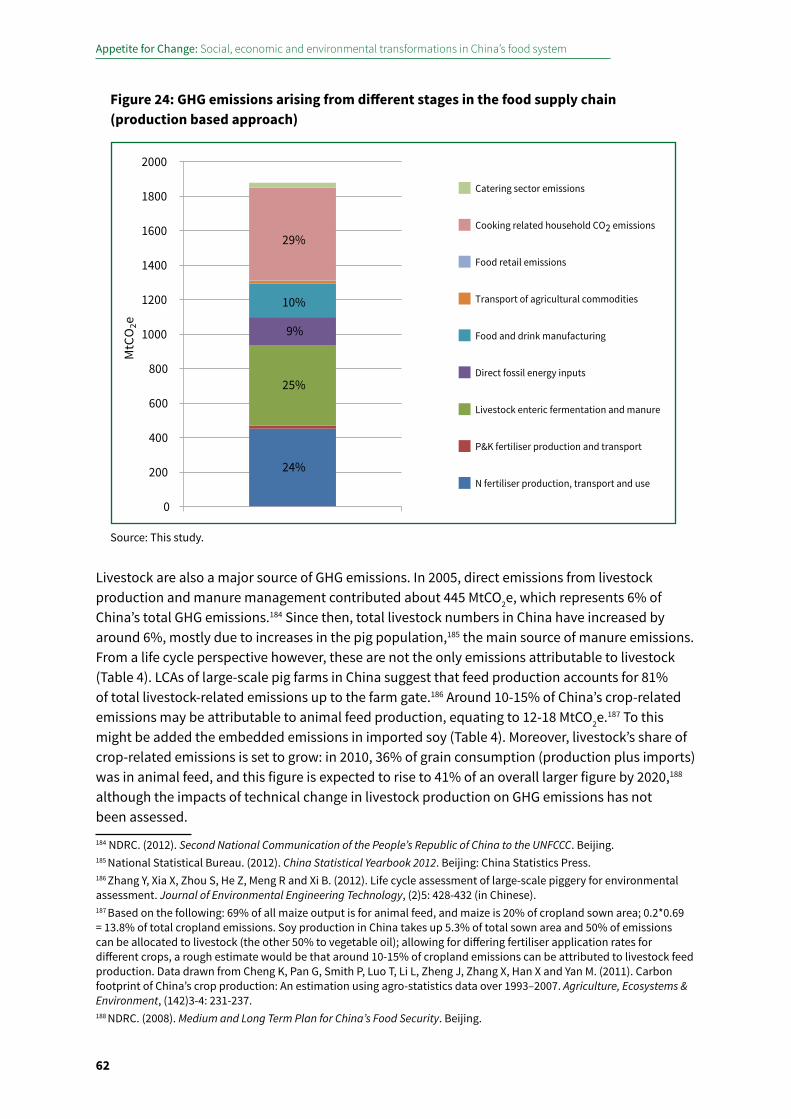
Appetite for Change: Social, economic and environmental transformations in China’s food system
62
Livestock are also a major source of GHG emissions. In 2005, direct emissions from livestock production and manure management contributed about 445 MtCO2e, which represents 6% of China’s total GHG emissions.184 Since then, total livestock numbers in China have increased by around 6%, mostly due to increases in the pig population,185 the main source of manure emissions. From a life cycle perspective however, these are not the only emissions attributable to livestock (Table 4). LCAs of large-scale pig farms in China suggest that feed production accounts for 81% of total livestock-related emissions up to the farm gate.186 Around 10-15% of China’s crop-related emissions may be attributable to animal feed production, equating to 12-18 MtCO2e.187 To this might be added the embedded emissions in imported soy (Table 4). Moreover, livestock’s share of crop-related emissions is set to grow: in 2010, 36% of grain consumption (production plus imports) was in animal feed, and this figure is expected to rise to 41% of an overall larger figure by 2020,188 although the impacts of technical change in livestock production on GHG emissions has not been assessed. 184 NDRC. (2012). Second National Communication of the People’s Republic of China to the UNFCCC. Beijing.185 National Statistical Bureau. (2012). China Statistical Yearbook 2012. Beijing: China Statistics Press.186 Zhang Y, Xia X, Zhou S, He Z, Meng R and Xi B. (2012). Life cycle assessment of large-scale piggery for environmental assessment. Journal of Environmental Engineering Technology, (2)5: 428-432 (in Chinese).187 Based on the following: 69% of all maize output is for animal feed, and maize is 20% of cropland sown area; 0.2*0.69 = 13.8% of total cropland emissions. Soy production in China takes up 5.3% of total sown area and 50% of emissions can be allocated to livestock (the other 50% to vegetable oil); allowing for differing fertiliser application rates for different crops, a rough estimate would be that around 10-15% of cropland emissions can be attributed to livestock feed production. Data drawn from Cheng K, Pan G, Smith P, Luo T, Li L, Zheng J, Zhang X, Han X and Yan M. (2011). Carbon footprint of China’s crop production: An estimation using agro-statistics data over 1993–2007. Agriculture, Ecosystems & Environment, (142)3-4: 231-237.188 NDRC. (2008). Medium and Long Term Plan for China’s Food Security. Beijing.
0
200
400
600
800
1000
1200
1400
1600
1800
2000
MtC
O2e
Catering sector emissions
Cooking related household CO2 emissions
Food retail emissions
Transport of agricultural commodities
Food and drink manufacturing
Direct fossil energy inputs
Livestock enteric fermentation and manure
P&K fertiliser production and transport
N fertiliser production, transport and use
29%
10%
24%
25%
9%
Figure 24: GHG emissions arising from different stages in the food supply chain (production based approach)
Source: This study.
Environmental transformations
63
4
Analysis of the GHG mitigation potential in agricultural production suggests that the sector offers a maximum technical potential of 412 MtCO2e by 2020.189 A reduction of 131 MtCO2e is potentially available at zero or negative cost (i.e., a cost saving), and 346 MtCO2e (approximately 29% of the total) can be achieved at a carbon price of less than US$ 60 per tonne CO2e. Measures to achieve this include improved fertiliser management, conservation tillage and biogas – measures that often face a range of barriers to adoption – as well as adoption of more productive livestock breeds and feed additives, including antibiotics. Antibiotics, which are regulated in China, are a contributory factor in the spread of resistance in humans through food-borne illness and other routes of infection,190 and may present a food safety risk.191 Furthermore, while antibiotics can play a part in reducing the incidence of health disorders common in confined feedlot situations, animal welfare may better be served by avoiding health disorders in the first place through better diet, housing and breed selection practices (see Focus on Livestock chapter).192
ii) Overseas impacts of crop imports
China’s imports of some commodities (e.g., soy bean and palm oil) have been rapidly increasing in recent years, driven largely by domestic demand for livestock feed and plant-based oil products, and necessitated by the scarcity of available land for domestic production (see Chapter Three and Focus On Livestock chapter). China has been a net importer of virtual land resources since 1987, mainly in the form of soy bean and rapeseed.193 China’s total net virtual water imports have also increased significantly in recent years, reaching a level in 2004 equivalent to 11% of the total water requirement for domestic crop production.194 This is not necessarily environmentally problematic:
189 Wang W, Moran D, Koslowski F, Nayak D R, Saetnan E, Smith P, Clare A, Lin E, Guo L, Newbold J, Pan G, Cheng K, Yan X and Cardenas L. (2013). Economic Potential of Greenhouse Gas Mitigation Measures in Chinese Agriculture. SAIN policy brief no. 8. Norwich: Sustainable Agriculture Innovation Network.190 WHO. (2013). Antimicrobial resistance: conserving life-saving medicines takes everyone’s help. Geneva: World Health Organisation. September, http://www.who.int/features/2013/amr_conserving_medicines/en/ 191 FORHEAD (2014). Food Safety in China: Problems, Governance and Research. www.forhead.org.192 Dr Mike Appleby, World Society for the Protection of Animals, and Dr Ashleigh Bright, Farm Animal Initiative, pers. comm., October 2013.193 Qiang W, Liu A, Cheng S, Kastner T and Xie G. (2013). Agricultural trade and virtual land use: the case of china’s crop trade. Land Use Policy, (33): 141-150.194 Liu J, Zehnder A J B and Yang H. (2007). Historical Trends in China’s Virtual Water Trade. Water International, (32)1: 78-90.
Table 4: Main sources of GHG emissions related to livestock production
Low MtCO2e
Contribution to livestock
total %High MtCO2e
Contribution to livestock
total %Direct livestock emissions 467.00 83.99 701.00 76.26
Domestic feed grain production 52.50 9.44 104.25 11.34
Imported feeds 36.50 6.56 114.00 12.40
Total 556.00 100.00 919.25 100.00Note: Livestock related energy use either on-farm for housing, or for feed grain processing and meat processing and distribution are not calculated.
Sources: SAIN (2010a) Improved Nutrient Management in Agriculture: A Neglected Opportunity for China’s Low Carbon Growth Path. SAIN policy brief no. 1. Norwich: Sustainable Agriculture Innovation Network; Williams A, Audsley E, and Sandars D. (2006). Final report to Defra on project IS0205: Determining the environmental burdens and resource use in the production of agricultural and horticultural commodities. London: DEFRA.
Appetite for Change: Social, economic and environmental transformations in China’s food system
64
making use of other countries’ comparative advantages in water and land through international trade can contribute to global savings in these resources. However, some commodities have been identified as potential causes for concern.
Commercial production of agricultural crops and livestock products has been identified as a primary driver of deforestation in several parts of the world, notably in Latin America.195 Since the main actors in commodity supply chains are not always Chinese, identifying China’s impact on agricultural production overseas is not always straightforward. One study has identified specific links between trends in exports of commodities (e.g., soy beans) to China and changes in deforestation rates in areas of the Brazilian Amazon.196 Further analysis is needed to verify this connection. Similar analysis is also needed for oil palm, another crop with major impacts on forest cover in Southeast Asia.197 In 2011, China was the world’s second largest importer of palm oil, second only to India, and Southeast Asia (particularly Malaysia and Indonesia) is the major source of palm oil supply.198
An important influence on the future evolution of China’s food system is the extent to which trade becomes regulated by higher environmental, ethical and food safety standards. Some observers have pointed out that China’s status as the main global importer of some commodity crops has been associated with a decline in environmental standards in exporting countries.199 For example, China has displaced the EU as the main destination for Brazilian soybean exports. In recent years, national interpretations of responsible soy standards have been produced in several Latin American countries, including Brazil. However, growing Chinese demand, where many purchasers do not impose sustainability requirements, could reduce the incentives for producers in these countries to implement sustainability standards.200 While some Chinese firms have begun to engage with global crop sustainability initiatives,201 other sustainability strategies that do not involve certification may be necessary to address the potential impacts of final demand in China, where domestic firms are more sensitive to price than to environmental issues.
Domestic land use regulatory frameworks in commodity-producing countries will also need to be strengthened.202 There are, moreover, commercial pressures in favour of higher standards: multinationals involved in trade with China may be concerned with reputational risks and be thereby motivated to enforce standards in their supply chains. With national policies stressing the importance of international trade and cooperation for securing China’s future supplies of key commodities, overseas impacts of China’s trade and outward investment are likely to become increasingly scrutinised.195 Kissinger G, Herold M, de Sy V. (2012). Drivers of Deforestation and Forest Degradation: A Synthesis Report for REDD+ Policymakers. Vancouver: Lexeme Consulting.196 Fearnside P, Figueiredo A and Bonjour S. (2013). Amazonian forest loss and the long reach of China’s influence. Environment, Development and Sustainability, (15)2: 325-338.197 Kissinger G, Herold M, de Sy V. (2012). Drivers of Deforestation and Forest Degradation: A Synthesis Report for REDD+ Policymakers. Vancouver: Lexeme Consulting.198 FAO. (2011). Imports: Commodities by country, http://faostat.fao.org/site/342/default.aspx 199 Kaplinsky R, Terheggen A and Tijaja J. (2011). China as a final market: The Gabon timber and Thai cassava value chains. World Development, (39)7: 1177-1190.200 Blackmore E, Li D and Casallas S. (2013). Sustainability standards in China–Latin America trade and investment: A discussion. London: International Institute for Environment and Development.201 See, for example, Round Table on Responsible Soy Association, http://www.responsiblesoy.org/202 Brown-Lima C, Cooney M and Cleary D. (undated). An Overview of the Brazil-China Soybean Trade and its Strategic Implications for Conservation. Arlington: The Nature Conservancy.
Environmental transformations
65
4
4.3 Policy and other stakeholder responsesThe analysis above highlights a number of key issues: over-application of fertiliser, which generates economic as well as environmental costs; the efficiency of water use in a context of growing agricultural (particularly livestock) and non-agricultural demand; growth in livestock production and its various environmental impacts; and food waste, which represents an inefficient use of agricultural resources as well as direct environmental impacts.
This section summarises policy responses to these challenges, while Box 13 describes the state of food certifications as a means of addressing environmental concerns.
Box 13: Mainstreaming environmental considerations in food production
Certification of production processes is one way in which China has sought to mainstream environmental considerations in food production. Common certifications with environmental criteria include Green Food, organic and hazard free certifications.
‘Green Food’ certification, which began in the early 1990s, requires certified foods to meet standards for the use of pesticides, production methods and residue testing. Green Foods may achieve a price premium of around 12% compared to conventional produce.203 In 2006 the value of Green Food certified foods stood at US$ 20.7 billion, with an export value of US$ 2 billion.
Organic certification began in China in the late 1980s. As of 2010, 26 agencies (private companies, NGOs and others) were authorised to certify organic products in China.204 Around 2 million hectares of farmland are certified organic in China, the sixth largest area in the world.205 In 2009, total organic production in China was valued at about US$ 2.4 billion, of which US$ 500 million went for export and the rest was sold domestically. Organic imports were estimated at US$ 3-8 million per year, but reached US$ 20 million in 2009.206 To put this in perspective, the value of the overall Chinese food and beverage retail market stands at around $607 billion,207 and China has around 130 million ha of cropland. Hence, the organic sector is tiny in terms of the overall food market and land area.
Hazard Free certification was introduced in 2001, in response to concerns over health incidents and contaminated food. It focuses on controlling illegal use of highly toxic agricultural chemicals and violations of pesticide residue standards.208 Around 21 million hectares are farmed to hazard-free standards.209
203 Paull J. (2008). The Greening of China’s Food - Green Food, Organic Food, and Eco-labelling. Sustainable Consumption and Alternative Agri-Food Systems Conference. 27-30 May. Liege University, Arlon, Belgium.204 Pryor L, Reker E, Shimizu H and Thayer C. (2010). Achieving sustainable growth in the Chinese organic industry: A SMART Program Case Study. Ithaca, N.Y.: Cornell International Institute for Food, Agriculture and Development, Cornell University.205 FiBL and IFOAM. (2012). The world of organic agriculture: Statistics & emerging trends 2012. Research Institute of Organic Agriculture (FiBL) and International Federation of Organic Agriculture Movements (IFOAM). Note that imported organic products include not only specialty food and beverages (wine, for instance) but also non-food products such as cosmetics and textile products. 206 FiBL and IFOAM. (2012). The world of organic agriculture: Statistics & emerging trends 2012. Research Institute of Organic Agriculture (FiBL) and International Federation of Organic Agriculture Movements (IFOAM).207 IGD. (2010). Global Retailing, http://www.igd.com/our-expertise/Retail/retail-outlook/3471/Global-Retailing/208 Taylor D. (2008). Recovering the Good Earth: China’s Growing Organic Market. Environmental Health Perspectives, (116)8: A346–A349. 209 Paull J. (2008). The Greening of China’s Food - Green Food, Organic Food, and Eco-labelling. Sustainable Consumption and Alternative Agri-Food Systems Conference. 27-30 May. Liege University, Arlon, Belgium.
Appetite for Change: Social, economic and environmental transformations in China’s food system
66
Certifications are increasingly important for access to export markets. Around 90% of China’s agricultural exports carry some form of eco-food label, either hazard free, Green or organic.210 However, trust in these certifications is a major issue both domestically and in international markets. Domestic media reports of inappropriately labelled products are common, and reports of poor enforcement of standards abound. For organics, government has responded to the public lack of trust by revising standards and certification management rules to make all organic food products traceable to the producer. Mirroring the lack of trust within China, there is often suspicion overseas of the safety of Chinese foods and the credibility of Chinese organic certification.211 Some western food manufacturers have positioned China as a cheap source of organic ingredients for composite foods (such as baby foods), where the country of origin identity of food constituents is lost. However, this system is potentially vulnerable to consumer suspicion, and may not be viable if country of origin labelling requirements are tightened.
Within China, some urban middle class consumers are turning to alternative short food supply chains, such as Community Supported Agriculture (CSA), as an alternative to mainstream environmental certifications. CSA schemes use direct links between producers and consumer – such as weekend farm visits – to build trust, making third party certification unnecessary. Other initiatives include: agricultural production in urban areas; forms of direct selling between producers and consumers, both face-to-face and internet-based; and creative solutions using trucks contracted to source directly from producers and directly supplying periodic small-scale markets operated in urban public spaces.212 Direct farm-restaurant and farm-school supply chains are also common. The total scale of such initiatives is unknown. Such schemes are popular with young middle class people motivated to support ‘sustainable’ agriculture, and concerned with food safety and environmental conservation (see Chapter Six).213
4.3.1 Fertiliser management policies
Improving fertiliser use is the mandate of the Ministry of Agriculture. The main initiative addressing fertiliser use is the National Soil Testing and Fertiliser Program. This involves testing soil properties and crop fertiliser needs to make location- and crop-specific fertiliser recommendations. Appropriate fertiliser formulations are then produced by 100 participating fertiliser firms and supplied with guidance to farmers. From 2005 to 2011, around US$ 0.9 billion was invested in rolling out the programme in 2500 counties nationwide, but as with many other government programmes, there has been little formal evaluation of its impacts. Some research suggests that in regions where participation rates are high, significant reductions in N fertiliser use have been achieved.214 With different models of implementation in different localities, more research is needed to identify effective practices.
210 Paull J. (2008). The Greening of China’s Food - Green Food, Organic Food, and Eco-labelling. Sustainable Consumption and Alternative Agri-Food Systems Conference. 27-30 May. Liege University, Arlon, Belgium.211 Paull J. (2008). The Greening of China’s Food - Green Food, Organic Food, and Eco-labelling. Sustainable Consumption and Alternative Agri-Food Systems Conference. 27-30 May. Liege University, Arlon, Belgium; Su Y. (2013). Is ‘organic’ food in China actually organic? Shanghaiist. 11 March, http://shanghaiist.com/2013/03/11/questions_raised_about_whether_organic_food_in_china_actually_organic.php212 FORHEAD (2014). Food Safety in China: Problems, Governance and Research. www.forhead.org.213 Shi Y, Cheng C, Lei P, Wen T and Merrifield C. (2011). Safe food, green food, good food: Chinese Community Supported Agriculture and the rising middle class. International Journal of Agricultural Sustainability, (9):4: 551-558.214 Sun W and Huang Y. (2012). Synthetic fertiliser management for China’s cereal crops has reduced N2O emissions since the early 2000s. Environmental Pollution, (160): 24-27.

Environmental transformations
67
4
Addressing emissions in fertiliser production falls within the scope of the ministries responsible for industry and energy use. Prior to 1998, fertiliser production was a state monopoly sector, and eradicating inefficient small-scale production was politically difficult. In 2000, 30% of N-fertiliser output was still produced from more than 1,000 small-scale plants.215 Throughout the 2000s, fertiliser sector policy has focused on eliminating high energy consuming, polluting and economically inefficient small-scale plants by converting these enterprises into other agricultural input businesses or closing the plants down. The average scale of fertiliser producers has increased, and by 2010 large- and medium-scale enterprises accounted for over 70% of production. The Twelfth Five-Year Plan for the Fertiliser Industry aims to continue this trend. Coal gasification, polygeneration and other clean production technologies are being promoted, and there is a specific target for the energy intensity of ammonia synthesis. China’s largest fertiliser manufacturers are also enrolled in the ‘Ten Thousand Enterprises Energy Conservation and Emission Reduction’ programme, in which each enterprise has been set an energy use target and preferential credit and subsidies are available to support adoption of new technologies to achieve these targets. Media reports suggest that cost and financing difficulties continue to present challenges to technology upgrading.216
4.3.2 Water management policies
Over-extraction, low efficiency and poor water quality are recognised by the government as major challenges. In 2010, the government issued its ‘three red lines’ policy, which sets out targets for total water consumption (less than 700 billion m3 per year), irrigation use efficiency (60% by 2030, and reducing water use per CNY 10,000 of GDP to 40 m3), and water quality (95% of key hydrological zones to exceed minimum standards).217 In 2011, the central government committed to double state investment in water infrastructure in the coming ten years to address multiple water-related issues, including climate change adaptation, drought and flood management, and food security. Investment in small-scale irrigation facilities has amounted to US$ 49.5 billion per year since the policy announcement,218 with further investments in rural reservoirs and drinking water supplies. Water use rights transfer and water pricing policy reforms are other mechanisms widely promoted to improve the efficiency of irrigation water use. Although most analysis suggests that these reforms may have some benefits, they have often proven to be insufficient to solve the challenges in irrigation water management.219
Addressing water quality is a more significant challenge. The government’s main approach has been to strengthen regulations, monitoring and enforcement. The 2008 Water Pollution Law introduced harsher penalties for enterprises polluting water resources, and national water quality standards have been updated to include a wider range of pollutants. The Ministry of
215 Wang M and Wang H. (undated). Research on China’s Fertiliser Industry, http://www.chemdevelop.com/Expert/Reports%5Cexpert_51.asp?id=51216 Mo S. (2013). What are the problems of ammonia emission reduction? 6 March, http://xmecc.xmsme.gov.cn/2013-3/20133691743.htm217 State Council of the PRC. (2012). Opinions of the State Council on Implementing the Strictest Water Resources Management System, http://www.gov.cn/zwgk/2012-02/16/content_2067664.htm218 Li Y. (2012). Speed of irrigation system construction: Investment this winter and next spring expected to exceed CNY 336.4 billion. Xinhua. 20 November, http://news.xinhuanet.com/fortune/2012-11/20/c_123974410.htm219 Lohmar B, Lei B, Huang Q and Gao Z. (2007). Water pricing policies and recent reforms in China: the conflict between conservation and other policy goals. In F Molle and J Berkoff (eds). Irrigation water pricing: the gap between theory and practice. pp. 227-294; Liao Y, Giordano M and de Fraiture C. (2007). An empirical analysis of the impacts of irrigation pricing reforms in China. Water Policy, (9): 45-60.
Appetite for Change: Social, economic and environmental transformations in China’s food system
68
Environmental Protection has established Regional Supervision Centres to improve monitoring of enterprise discharges, and the Ministry of Water Resources has established water quality agencies in the main river basins. More than 10,000 monitoring stations have been established nationwide. However, enforcement remains a challenge. Local environment bureaus are accountable to local governments, rather than the ministry, and local governments face pressures to keep polluting enterprises operational for economic purposes, so environmental targets often take second priority. Some high profile non-government initiatives, such as the pollution mapping and advocacy activities conducted by the Institute of Public and Environmental Affairs, have exposed polluting enterprises, raised public awareness of the issue, and pressured government to enforce regulations. However, other sources of water pollution, such as livestock waste, have not received the same level of media attention, although they are arguably no less pressing.
4.3.3 Livestock sector policies
The increasing scale of intensive livestock operations, and their concentration in key watersheds and peri-urban areas, are a major cause of water and soil pollution. The contribution of livestock waste to water pollution is monitored and reported by the Ministry of Environmental Protection (MEP).220 Since the mid-2000s, a number of national standards have been issued to regulate the physical infrastructure required in large-scale livestock operations, and to establish farm-level limits for livestock waste emissions. In 2013, Guangdong province even issued standards for emissions that are higher than the national standard.221 Government subsidies for large-scale livestock operations explicitly require that waste treatment facilities must be constructed.
The MEP’s monitoring reports indicate some success at the national level in limiting polluting emissions from large-scale livestock farms. The 2011 State of the Environment Report states that 5171 large-scale livestock farms (zones) had waste treatment facilities, and that COD emissions were reduced by 2% and ammonia emissions by 1.5% compared to the year before, while the 2012 report identified 8630 farms (zones) with installed waste treatment facilities, and reported significant increases in COD and ammonia removal rates.222 However, trade magazines report a number of challenges in establishing large-scale farms that meet the national standards.223 Often farms are located where there is no on-farm fodder supply. This not only increases operation costs, but also presents challenges for waste utilisation, as there is no land on which treated waste can be used. The operation cost of waste treatment facilities is also high, and while full treatment is technically possible, the levels of waste available on individual farms are often insufficient to make daily treatment economically feasible. Similarly, although large-scale deployment of household biogas has been promoted for many years, adoption rates have not always been high, due in part to requirements for farmers to first invest and then seek reimbursement, and also to labour constraints.224
220 MEP. (2010). First National Pollution Sources Census. Beijing.221 Nong600. (2013). Guangdong’s ‘emissions standards for livestock and poultry breeding’ to be implemented in August. 27 May, http://www.nong600.com/xumufagui/138050.htm222 MEP. (2011). State of the Environment Report 2011. Beijing; MEP. (2012). State of the Environment Report 2012. Beijing.223 Li S, Yao K, Yang D, Cao Z, Liu Y, Zhang W, Xie Z, Gao M, Sun F, Li Z, Jia C, He H, Gu Y and Zhang X. (2013). Current status and development of standardized large-scale dairy production. China Animal Husbandry Journal, (9): http://www.cav.net.cn/magzine/zhuanti/201309/ 224 Hallding K, Li Y, Wang L and Chen Y. (2012). Learning from previous failures: scaling up biogas production in the Chinese countryside. Climate and Development, (4)3: 199-209.
Environmental transformations
69
4
These reports suggest that there is some way to go before nationwide compliance with standards is achieved, although inclusion of livestock waste emissions in the national targets for energy saving and emissions reduction has strengthened administrative focus on the issue. Some provincial and local governments (e.g., in Guangdong) have developed specific plans to achieve emissions reduction targets for COD and ammonia, proposing strengthened planning and approval procedures for new large-scale, intensive livestock operations, as well as clarifying the responsibilities of different departments in monitoring and enforcement.225
Box 14: Focus on grasslands and livestock
Promoting grassland-based livestock husbandry is one way to reduce reliance on feed grains.226 However, animal husbandry in China’s grasslands (which cover 40% of the land area) is challenged by grassland degradation and low economic returns that limit the scope for adopting sustainable grazing practices. To address grassland degradation, between 2003–2011, the government invested CNY 15.57 billion in the Grassland Retirement Programme (tuimu huancao), which placed 26 million ha under a grazing ban and prohibited grazing during environmentally sensitive seasons on 28 million ha. More than 900,000 households are enrolled in the programme.227 The scheme makes incentive payments to households and provides subsidies for livestock stall construction and other infrastructure. However, transforming extensive grazing systems to productive semi-grazing systems requires support on a range of technical, institutional and marketing issues, which has often not been provided. Subsidies often do not even cover the direct and opportunity costs of participation in the programme for householders. A new incentive programme – the Grassland Ecology Subsidy and Reward Mechanism – was initiated in 2011 with annual funding of US$ 2.21 billion, which makes payments to herders who achieve a balance between forage resources and livestock on their contracted grasslands. Given the limited opportunities for forage cultivation in grassland areas, there is an urgent need for integrated approaches to livestock development in grassland areas that balance environmental and economic objectives.228
4.3.4 Food waste policies
The significance of food waste for national food security and resource use has been recognised in national policies since the early 1990s. More recently, in 2010, the State Council issued a Notification on Strengthening Grain Saving and Opposing Waste.229 The Notification promotes improvements in agronomic measures at the field level, mechanised harvesting, improved grain storage, more efficient grain processing facilities and improvements in grain logistics. Current plans aim to reduce household level grain losses to 2%. Subsidies are provided for the purchase of agricultural machinery and the construction of improved grain storage and logistics systems. Improved grain processing technologies are also a major focus of the Twelfth Five-Year Plan for the Grain Industry (2011-2015).230
225 E.g., Shanwei City Environmental Protection Bureau. (2013). Implementation Plan for Reduced Emission of Agricultural Pollutants during the Twelfth five Year Plan in Shanwei City, http://www.swhbj.gov.cn/154832.html (in Chinese).226 Ministry of Agriculture. (2011). National Grain-saving Animal Husbandry Development Plan (2011-2020). Beijing.227 Ministry of Agriculture. (2011). The Significant Effectiveness of the Grazing Retirement Program in China’s Western Region. Beijing.228 Squires V, Hua L, Michalk D, Zhang D and Li G. (2010). Towards Sustainable Use of Rangelands in Northwest China. London: Springer Verlag; Kemp D and Michalk D. (2011). Development of Sustainable Livestock Systems on Grasslands in North-western China. Canberra: Australian Centre for International Agricultural Research.229 State Council of the PRC. (2010). Notice concerning the State Council’s work on further strengthening food conversation and waste reduction. 22 January, http://www.gov.cn/zwgk/2010-01/22/content_1517138.htm230 NDRC and National Food Authority. (2011). NDRC and National Food Authority notice on ‘Food industry 12th Five-Year Plan development plan outline’, http://www.chinagrain.gov.cn/n16/n1077/n1617/n4725522/n4726812.files/n4726811.pdf
Appetite for Change: Social, economic and environmental transformations in China’s food system
70
Addressing waste in the catering industry was also highlighted in the 2010 policy. One key measure highlighted was to restrict the use of public funds for lavish banquets. The current government has subsequently enforced these restrictions, apparently with significant success: 2013 saw the largest fall in the growth rate of the catering industry since 1991.231 Food waste is also a public concern, as reflected in the space devoted to the issue in online media and by civic activists. In early 2013, one individual used social media to launch the ‘Clean Your Plate Campaign’232 calling on citizens and restaurants alike to cut down on food waste. Reportedly, as part of the drive, 750 Beijing restaurants are now offering smaller dishes to help reduce the amount of food wasted. These measures, while encouraging, are unlikely to do address the full scale of the problem, and further efforts to deliver waste reductions systematically through the food chain will be needed.
231 Caixun. (2013). Catering industry falters on cuts in public expenditures. 28 August, http://economy.caixun.com/wkp/20130828-CX03c2g2.html232 People’s Daily. (2013). ‘Clean your plate’ movement receives warm response. People’s Daily. 25 January, http://paper.people.com.cn/rmrb/html/2013-01/25/nw.D110000renmrb_20130125_7-01.htm

Health transformations: nutrition and diet
71
5
5 Health transformations: nutrition and diet
The health of China’s population has improved enormously over the past two decades. Life expectancy, at 76, is above the global average. There have been substantial reductions in child mortality and declines in infectious diseases such as tuberculosis and lower respiratory infections. At the same time, however, China is starting to experience some of the health problems common in the West, as seen in the growing prevalence of non-communicable diseases associated with changing lifestyles and behaviours around diet, physical activity and tobacco use.233 The food system is by no means the only source of health concerns in China, but in many ways the issues relating consumption behaviours to health outcomes embody the process of transition from a poor rural society to an increasingly affluent urbanised society.
This chapter begins by looking in detail at how diets have changed over time (5.1) and examines the impacts of these dietary patterns on a range of health outcomes, including their variation by socio-economic status and region (5.2). Subsequent sections identify the key drivers of recent trends in nutrition and diet-related health outcomes (5.3), and highlight the future challenges and opportunities (5.4).
5.1 Diets and dietary change in ChinaChina’s changing consumption patterns have been extensively monitored through a major, long term longitudinal survey, the China Health and Nutrition Survey (CHNS). This survey has been running since 1989, allowing changes in lifestyles and health outcomes to be tracked over time (see Box 15). Comprehensive analysis of the 2004 survey has been published in English, and data from the 2009 and 2011 surveys are now beginning to be published in Chinese.
5.1.1 Food consumption patterns
Chapter Three described the significant increase over the last 35 years in per capita consumption of animal products (i.e., meat of all kinds, eggs, milk and dairy products, fish and aquaculture products), oils and animal fats, sugars, processed foods, soy products and fruit. There has been a corresponding decline in per capita consumption of grains (especially coarse grains), tubers, vegetables and legumes.234
233 IHME. (2013). Global Burden of Disease 2010: China country profile. Seattle: Institute for Health Metrics and Evaluation, http://www.healthmetricsandevaluation.org/sites/default/files/country-profiles/GBD%20Country%20Report%20-%20China.pdf; Liu Y, Yang G, Zeng Y, Horton R and Chen L. (2013). Policy dialogue on China’s changing burden of disease. The Lancet, (381)9882: 1961-1962.234 Zhang X, Dagevos H, He Y, van der Lans I and Zhai F. (2008). Consumption and corpulence in China: A consumer segmentation study based on the food perspective. Food Policy, (33): 37–47.
Appetite for Change: Social, economic and environmental transformations in China’s food system
72
Box 15: Data sources on food consumption in China
The China Health and Nutrition Survey (CHNS) is a collaborative undertaking between the Chinese National Institute of Nutrition and Food Safety, the Chinese Centre for Disease Control and Prevention (CDC) and the University of North Carolina at Chapel Hill in the US. The survey has been undertaken at intervals since 1989. Published analysis of the survey results report what foods are consumed (and how this varies by factors such as gender, age, socio-economic status and region) and the nutritional composition of these foods. This enables analysis over time of changes in the quantity and proportions of energy, protein, fats, minerals and vitamins in diets consumed, and of correlations between these changes and the prevalence of various health outcomes, such as stunting and wasting and the incidence of obesity, diabetes and other chronic diseases. The findings of the surveys have been extensively analysed and reported on and are publicly available at www.cpc.unc.edu.235
The CHNS survey asks respondents to report what they actually consume. China’s National Statistical Bureau (NSB) also reports changing food consumption patterns, but its data is based on surveys of household food purchases. Consumption and purchases are not the same. The CHNS provides a representation of what people put into their mouths after variations in intra-household distribution and net of food losses and waste are taken into account. This includes food that is eaten out of the home, which is not included in the NSB household food purchase data.
This means that on the one hand the NSB data underestimates what people eat, since it does not capture food eaten outside the home (e.g., at restaurants), while on the other hand, it may overestimate consumption, since a proportion of food purchased may be wasted. Each data set has its own strengths and weaknesses. The NSB data is perhaps more relevant from an environmental perspective because environmental impacts arise as a result of food production regardless of how much of that food people eat. However, in order to ascertain the relationship between a particular food or dietary pattern and a particular health outcome, actual intakes as reflected in the CHNS rather than food purchases are more relevant.
Certain food groups merit particular attention. Demand for dairy products is growing very rapidly, albeit from a low base, and is expected to double within the next ten years236 (see Focus on Dairy). Meat consumption is rising across all meat types. Although meat consumption has had an important role in reducing the incidence of micronutrient deficiencies there are concerns that these foods, being energy and fat rich, are also contributing to rising obesity and associated chronic diseases and exacerbating environmental problems (see Chapter Four). Pork remains the most commonly consumed type of meat and intakes continue to increase. However, the rate of growth is levelling off among high meat consumers. Poultry consumption is increasing far more rapidly,237 and the rise in popularity of aquaculture products is more dramatic still (see Focus on Aquaculture chapter).
235 See publications list here: http://www.cpc.unc.edu/projects/china/publications 236 Fonterra. (undated). Fonterra in China, http://www.fonterra.com/cn/en/About/Our+Locations/China 237 Zhou Z, Tian W, Wang J, Liu H and Cao L. (2012). Food Consumption Trends in China. Report submitted to the Australian Government Department of Agriculture, Fisheries and Forestry; Rabobank. (2013). Press release: Rabobank Report: Can China’s poultry move out of pork’s shadow? 8 March, https://www.rabobank.com/en/press/search/2013/RabobankReportCanChinaspoultrymoveoutofporksshadow.html
Health transformations: nutrition and diet
73
5
Consumption of animal products tends to fluctuate in response to price changes (see Box 16) and to food safety concerns, such as outbreaks of zoonotic diseases, or adulteration scandals238 (see Chapter on Food Safety). Such outbreaks can also cause people to switch between animal product categories: an incident affecting pork, for instance, can lead to an increase in aquaculture product consumption, or vice versa. Egg consumption appears to be levelling off in urban areas. As regards horticultural products, the dramatic growth in production has led to increases in exports rather than in domestic consumption. Intakes are still below recommended levels and are even falling in the case of vegetables.
Box 16: The effects of changing food prices and government responses
Since the 1990s, domestic food prices in China have increased, with more variation in food price inflation rates in recent years. Overall, food prices have risen less than incomes, but in some years price increases for particular food types have exceeded increases in incomes. In addition to supply and demand, factors affecting food prices over the longer term include market reforms and trade liberalisation, as well as changes in infrastructure.239 Some long-term trends in relative prices have been shown to have effects on health and nutrition. For example, over the 1990s to early 2000s, the price of vegetable oils fell relative to the prices of grains, vegetables and pork, a trend strongly associated with increased levels of obesity.240
Short-term price volatility may also have effects on consumption and nutrition, but research conducted before and during the global food price surge of the mid-2000s suggests that impacts on most rural and urban consumers have been limited.241 Households were able to shift food expenditure to cheaper food products, and impacts on total calorific intake were generally limited. However, while most rural grain producers may even have benefited from higher grain prices, the rural poor typically are less market-oriented and may have been less well placed to benefit from price increases. Strong government response to rising prices also limited the impacts on consumers. These responses included sales of grain reserves, disincentives for export of grain and fertilisers, subsidies for grain producers and social welfare payments for low income groups.242 The pork price – which has considerable impact on the consumer price index – is also highly volatile because of pork production cycles and disease outbreaks. Since 2009, government has put in place a system to monitor pork prices and use pork purchases and reserves and producer subsidies as tools to respond to price rises, though the effectiveness of these measures is unclear.243
238 Zhou Z, Tian W, Wang J, Liu H and Cao L. (2012). Food Consumption Trends in China. Report submitted to the Australian Government Department of Agriculture, Fisheries and Forestry.239 Huang J, Jun Y, Xu Z, Rozelle S and Li N. (2007). Agricultural trade liberalization and poverty in China. China Economic Review, (18): 244-265; Liu B, Keyzer M, van den Boom B and Zikhali P. (2012). How connected are Chinese farmers to retail markets? New evidence of price transmission. China Economic Review, (23)1: 34-46.240 Lu Y and Goldman D. (2010). The effects of relative food prices on obesity: Evidence from China 1991-2006. NBER Working Paper 15720. Cambridge, MA: National Bureau of Economic Research.241 Jensen R and Miller N. (2008). The impact of food price increases on caloric intake in China. Agricultural Economics, (39)1: 465-476; Lu K and Yu B. (2011). The impact of high food prices on poverty in China. Development in Practice, (21)4-5: 679-690.242 Yang J, Qiu H, Huang J and Rozelle S. (2008). Fighting global food price rises in the developing world: the response of China and its effect on domestic and world markets. Agricultural Economics, (39): 453-464; Lu K and Yu B. (2011). The impact of high food prices on poverty in China. Development in Practice, (21)4-5: 679-690.243 Gale F, Marti D and Hu D. (2012). China’s Volatile Pork Industry. Washington D.C.: USDA Economic Research Service.
Appetite for Change: Social, economic and environmental transformations in China’s food system
74
At the moment, confectionery intakes are still low: the Chinese purchase less than 1.2 kg of confectionery per person per year (compared to a global average of 2.1 kg), and buy mainly during festive seasons, rather than year round. However, the confectionery industry sees these low levels of consumption as an opportunity for future growth and the sector is now marketing its products aggressively in China.244 There is also a trend towards more snacking, compounded by a shifting preference towards snacks in a fried rather than boiled or steamed form.245
Comparing rural and urban populations, with the exception of grains, wealthier urban populations consume more of everything – animal products, oils, vegetables, fruits, soy products, alcohol, sugar, and processed foods. While these dietary transitions are most extreme and apparent in urban areas, and among higher socio-economic groups and in wealthier areas in eastern China, they are also evident in rural areas and among poorer sections of the population – and this is where growth in consumption is expected to occur in the coming years. There are also regional variations to consider, based on geography and food tradition. For example, beef is consumed much more widely in north and northwest China than in southern and eastern regions. Coastal regions naturally consume more aquatic products. Wheat and maize are consumed more in the north; rice more in the south.
Out-of-home consumption accounts for an increasing share of total meat intakes, particularly in urban areas. Meat eating at home appears to be levelling off among high income groups, but consumption of meat in restaurants and other catering outlets shows different patterns. Households consisting of wealthier, middle aged people with fewer children, and where both women and men work, are the most likely to eat out. Underestimating out-of-home meat consumption is a major cause of the underestimates founds in some data sources.246 The rise in out-of-home consumption has implications for health, because of the food types consumed. Eating out may be a risk factor for higher energy and fat intake and lower micronutrient intake.247
5.1.2 Nutrient intakes
Overall energy intakes have declined.248 This mirrors trends that have already taken place in developed countries, and reflects the fact that the processes of urbanisation and industrialisation have given rise to more sedentary lifestyles and thus to lower energy requirements. However, the decline in consumption is less significant than the decline in people’s energy requirements, and obesity levels are nevertheless increasing.
244 Rabobank. (2012). Are Brands too late to go into China? 20 November, http://rabobank-food-agribusiness-research.pressdoc.com/34791-rabobank-are-brands-too-late-to-go-into-china 245 Wang Z, Zhai F, Du S and Popkin B. (2008). Dynamic shifts in Chinese eating behaviours. Asia Pacific Journal of Clinical Nutrition, (17)1: 123-130.246 Ma H, Huang J, Fuller F and Rozelle S. (2006). Getting rich and eating out: consumption of food away from home in urban China. Canadian Journal of Agricultural Economics, (54): 101–119; Bai J, Seale J, Lohmar B and Wahl T. (2012). Meat Demand In Urban Chinese Households. GAIN Report 1.6.2012. Washington D.C.: USDA; Bai J, Wahl T I, Lohmar B T and Huang J. (2010). Food away from home in Beijing: effects of wealth, time and “free” meals. China Economic Review, (21): 432–441.247 Lachat C, Nago E, Verstraeten R, Roberfroid D, Van Camp J and Kolsteren P. (2012). Eating out of home and its association with dietary intake: a systematic review of the evidence. Obesity Reviews, (13): 329–346; Wang Z, Zhai F, Du S and Popkin B. (2008). Dynamic shifts in Chinese eating behaviours. Asia Pacific Journal of Clinical Nutrition, (17)1: 123-130.248 Zhang B, Wang H, Du W, Zhang J, Chang S and Zhai F. (2011). The trends of nutrients intake of Chinese residents in nine provinces from 1989 to 2009. Acta Nutrimenta Sinica, (33)3 (in Chinese).
Health transformations: nutrition and diet
75
5
Of total energy consumed, the percentage derived from animal-based sources has grown: animal foods now account for 13.5-19.9% of energy intakes.249 This figure is higher among higher income consumers, particularly in urban areas. Animal products now account for more than 30% of protein intakes on average, and over 20% for low income groups.250 In 2009, over 62% of urban residents derived more than 30% of their energy from fat, and the proportion was over 45% for rural citizens.251 This fat comes both from animal and plant sources, as the rise in animal fat intakes (due to increased meat consumption) is also linked to a rise in vegetable oil intakes. Increased meat availability is underpinned by the growing use of oilseeds as an animal feed. Vegetables oils are a co-product of the oil crushing process and so growth in livestock feed use is leading to increases in the availability of vegetable fats.
Protein as a percentage of energy intake has also increased, largely driven by the rise in animal product consumption. Although absolute protein intakes have fallen from 1989-2009 (from 72.3 to 66.7 grams per person per day), with the greatest decrease among women, since overall energy intakes have also fallen, the contribution of protein to overall energy intakes has actually increased slightly.252 In particular, the share of ‘high quality’ (i.e., meat- and soybean-derived) protein as a percentage of protein intakes has risen substantially accounting for nearly half (48.6%) of total protein intakes in urban areas, and 44.5%, 39% and 29.1% of intakes in suburbs, towns and rural areas respectively. Since there has been no significant change in legume-derived protein consumption, the increase in ‘high quality protein’ intakes essentially reflects higher consumption of animal products.
Other nutrients and minerals are also essential to a balanced diet. Calcium intakes have increased to around 400 mg per day for men and 353 mg per day for women. However these are still below the Chinese recommended intake levels of 800-1,000 mg per day.253 Indeed, between 72-88% of Chinese citizens consumed less than half these recommended intakes. Calcium is particularly important for older consumers. The main sources of dietary calcium for elderly Chinese are vegetables, legumes, and cereals, accounting for more than 70% of average daily intakes. Milk accounts for only 3% of intakes on average.254
249 Zhang B, Wang H, Du W, Zhang J, Chang S and Zhai F. (2011). The trends of nutrients intake of Chinese residents in nine provinces from 1989 to 2009. Acta Nutrimenta Sinica, (33)3 (in Chinese).250 Zhang B, Wang H, Wang Z, Zhang J, Du W, Su C, Zhang J and Zhai F. (2011). Adult dietary protein intake trends and impacts on hypertension in China. Chinese Health Standards Management, (2)4 (in Chinese).251 Zhai F. (2011). Meat and dairy consumption transition and nutrition transition in China. Presentation at FCRN-SAIN workshop. June. 252 Wang Z, Zhang B, Wang H, Zhang J, Du W, Chang S, Zhang J and Zhai F. (2012). Dynamic changing trend in dietary protein intake among Chinese adults aged 18 to 45 years in 1989-2009. Chinese Preventive Medicine, (13)11 (in Chinese).253 China Nutrition Society. (2006). Recommended Dietary Nutrition Intake Levels for Residents of China. Beijing: China Nutrition Society.254 Liu A, Zhang B, Wang H, Du W, Chang S and Zhai F. (2012). The nutrients intake trend of Chinese population in nine provinces from 1991 to 2009: Calcium intake trend in Chinese adults aged 18-49 years. Journal of Nutrition, (34)1: 16-20.
Appetite for Change: Social, economic and environmental transformations in China’s food system
76
Box 17: Focus on children
Studies on consumption patterns, diet-related conditions and risk factors among Chinese children suggest that the next generation may face increasing health challenges.
Consumption patterns: Data from the CHNS show that between 1991-2009, children’s daily energy intakes steadily declined (consistent with the shift towards more sedentary lifestyles), as did both carbohydrate intakes and the proportion of total energy that came from carbohydrates. However, daily fat intakes increased and the proportion of children consuming a diet with more than the maximum recommended 30% of energy from fat increased from 20% to nearly 50%. Strikingly, increases in fat intakes were highest among low-income urban groups and high-income rural groups.255 The proportion of energy from protein increased only slightly from around 12% to 13%, with declines in vegetable protein likely to have been compensated for by increases in animal protein. Other studies find that although urban children still consume more meat, poultry and eggs than rural children, consumption of these foods is increasing for both groups, and the urban–rural gap is decreasing over time.256 These trends signal the beginnings of a shift towards western-style correlations between socio-economic status and health, whereby obesity is no longer a consequence of wealth, but can be expected to become more prevalent among deprived communities.
Obesity and diabetes: Childhood obesity is becoming a major problem even as the problems of stunting and wasting (discussed below) persist. This high prevalence of childhood obesity has important implications for the development of chronic diseases in adulthood. In 2009, around 13% of 7-18 year olds were overweight or obese. Between 1993-2009, the prevalence of abdominal obesity (a stronger indicator of risk of cardiovascular diseases than body mass index [BMI]) increased by nearly 200% (from 3.9% to 11.4%) for boys and by over 100% (from 5.9% to 12.1%) for girls.257 The problem is particularly acute in the northern metropolitan areas of China, where in 2005 32.5% of boys and 17.6% of girls aged 7-18 years old were overweight or obese.258 Around 1% of Chinese children aged 7-17 years may be diabetic and nearly 15% are prediabetic.259 Over one third of children in this age group have high levels of at least one cardiometabolic risk factor (i.e., indicators of diabetes, high cholesterol or high blood sugars).
5.2 Nutrition-related health trends and impactsThis section looks at three categories of nutrition-related health status: undernutrition and micronutrient deficiencies (5.2.1); overweight and obesity (5.2.2); and bone health (5.2.3). While the focus here is on the nutritional link to these health outcomes it is important to emphasise that there are other contributing causes. Box 18 summarises some of the broader influences on an individual’s nutrition-related health status, some of which are explored in the sections below.
255 Cui Z and Dibley M. (2012). Trends in dietary energy, fat, carbohydrate and protein intake in Chinese children and adolescents from 1991 to 2009. British Journal of Nutrition, (108)7: 1292-1299.256 Liu H, Fang H and Zhao Z. (2012). Urban–rural disparities of child health and nutritional status in China from 1989 to 2006. Economics and Human Biology, (11)3: 294-309.257 Liang Y, Xi B, Song A, Liu J and Mi J. (2012). Trends in general and abdominal obesity among Chinese children and adolescents 1993-2009. Pediatric Obesity, (7)5: 355-364.258 Hu F, Liu Y and Willett W. (2011). Preventing chronic diseases by promoting healthy diet and lifestyle: public policy implications for China. Obesity Reviews, (12): 552–559.259 Yan L, Li J, Li S, Zhang B, Du S, Gordon-Larsen P, Adair L and Popkin B. (2012). The expanding burden of cardiometabolic risk in China: the China Health and Nutrition Survey. Obesity Reviews, (13)9: 810-821.
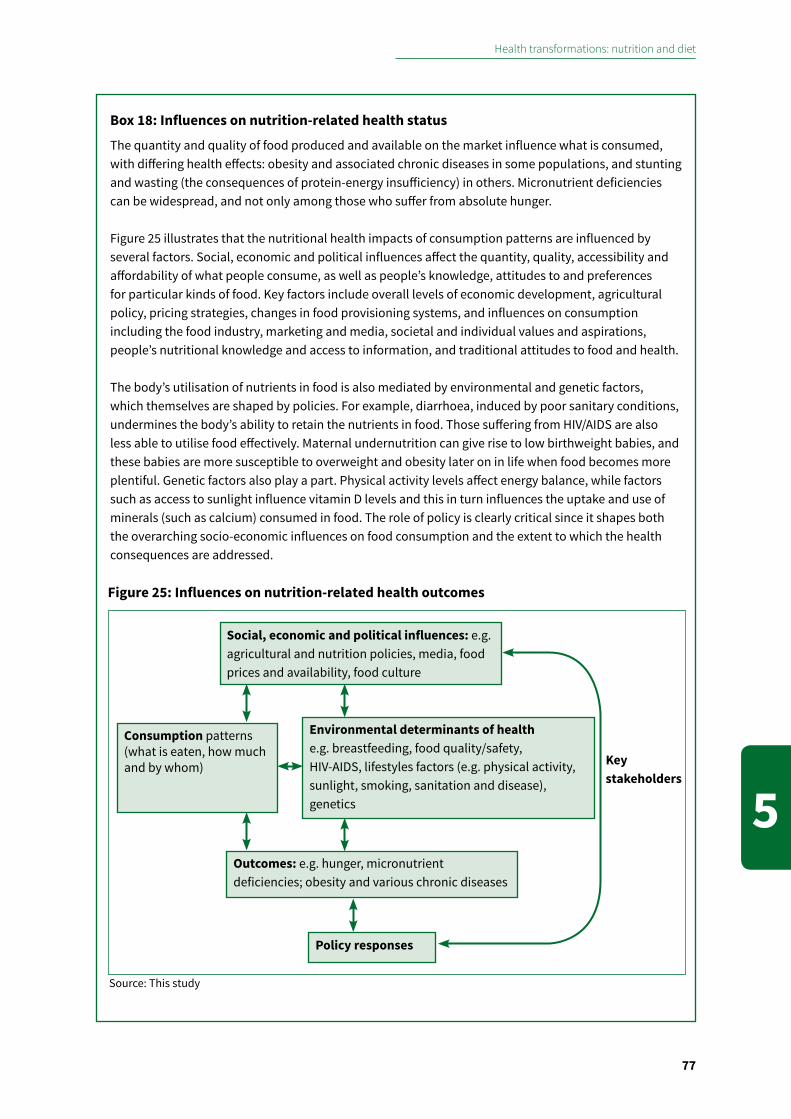
Health transformations: nutrition and diet
77
5
Box 18: Influences on nutrition-related health status
The quantity and quality of food produced and available on the market influence what is consumed, with differing health effects: obesity and associated chronic diseases in some populations, and stunting and wasting (the consequences of protein-energy insufficiency) in others. Micronutrient deficiencies can be widespread, and not only among those who suffer from absolute hunger.
Figure 25 illustrates that the nutritional health impacts of consumption patterns are influenced by several factors. Social, economic and political influences affect the quantity, quality, accessibility and affordability of what people consume, as well as people’s knowledge, attitudes to and preferences for particular kinds of food. Key factors include overall levels of economic development, agricultural policy, pricing strategies, changes in food provisioning systems, and influences on consumption including the food industry, marketing and media, societal and individual values and aspirations, people’s nutritional knowledge and access to information, and traditional attitudes to food and health.
The body’s utilisation of nutrients in food is also mediated by environmental and genetic factors, which themselves are shaped by policies. For example, diarrhoea, induced by poor sanitary conditions, undermines the body’s ability to retain the nutrients in food. Those suffering from HIV/AIDS are also less able to utilise food effectively. Maternal undernutrition can give rise to low birthweight babies, and these babies are more susceptible to overweight and obesity later on in life when food becomes more plentiful. Genetic factors also play a part. Physical activity levels affect energy balance, while factors such as access to sunlight influence vitamin D levels and this in turn influences the uptake and use of minerals (such as calcium) consumed in food. The role of policy is clearly critical since it shapes both the overarching socio-economic influences on food consumption and the extent to which the health consequences are addressed.
Social, economic and political influences: e.g. agricultural and nutrition policies, media, food prices and availability, food culture
Outcomes: e.g. hunger, micronutrient deficiencies; obesity and various chronic diseases
Consumption patterns (what is eaten, how much and by whom)
Policy responses
Key stakeholders
Environmental determinants of health e.g. breastfeeding, food quality/safety, HIV-AIDS, lifestyles factors (e.g. physical activity, sunlight, smoking, sanitation and disease), genetics
Figure 25: Influences on nutrition-related health outcomes
Source: This study
Appetite for Change: Social, economic and environmental transformations in China’s food system
78
5.2.1 Hunger and malnutritionLarge-scale reductions in hunger and malnutrition in recent decades have been among the most significant outcomes of China’s development pathway, aided by specific nutritional policies. Today, hunger-related malnutrition persists among some groups, mainly in poorer, rural areas. Between 90-130 million people in China’s poorest counties are still vulnerable to food insecurity – around 6-8% of the country’s population.260 Most live in the mountainous regions of the northwest and southwest, areas characterised by poor agricultural conditions and underdeveloped infrastructure and services. About 150 million people still live under a poverty line of US$ 1.25 per day, and 474 million live on less than US$ 2 per day.261
Deficiencies in micronutrients such as iron and vitamin A are widespread, especially in poor rural areas. Incidence of neural tube defects, often caused by a lack of folic acid, is among the highest in the world.262 Childhood stunting and wasting persist. Both are the result of insufficient food intakes, either in terms of nutrient quality or energy quantity. While wasting is caused by acute episodes of food deprivation, stunting – where a child may not be underweight for their height, but are short for age – reflects chronic food insufficiencies and is therefore an indicator of the nutritional situation in an area over time. Stunting also has worrying consequences for cognitive development. Stunting rates have declined dramatically in the last 20 years – from around 33% in 1990 to 10% in 2010 – but recent data suggest that the global economic crisis has caused numbers to rise again. One study finds that in poor areas of rural China the stunting prevalence among under-fives rose from 19% in 2008 to around 20% in 2010, and nearly doubled among infants. An estimated 6.5 million children under age five in China are stunted.263 Anaemia levels among poor children can be very high and impact on physical and cognitive wellbeing.264 One study found that nearly 25% of 11 and 12 year old school-aged children in Qinghai province and Ningxia Hui Autonomous Region were anaemic, and those with the condition scored worse in tests.
Box 19: Focus on food fortification: addressing iron deficiencyThe groups most vulnerable to anaemia include women of childbearing age and children, particularly in rural areas. In addition to promoting animal source foods, which can be a rich source of iron, the government has also sought to address the problem through fortification. Following a National Food Fortification Conference in 1997, where soy sauce was selected as the vehicle for fortification, policy efforts were directed at promoting the development of a fortified soy sauce. In 2004, the Ministry initiated a fortification action programme in several provinces, which was subsequently (2007) extended nationally. Today more than 60 million people in China consume iron fortified soy sauce.265 Data collected from 21 health clinics showed that anaemia in women and children dropped by approximately one third after fortified soy sauce became available.266 The fortification programme was undertaken in partnership with, and partly supported by, the Global Alliance for Improved Nutrition.
260 Huang J and Rozelle S. (2009). Agricultural Development and Nutrition: The Policies behind China’s Success. Occasional Paper 19. Rome: World Food Programme; UNDP. (2011). Policy Study on the Challenges and Responses to Poverty Reduction in China’s New Stage. Beijing: UNDP in China, International Poverty Reduction Centre in China.261 UNDP. (2011). Policy Study on the Challenges and Responses to Poverty Reduction in China’s New Stage. Beijing: UNDP in China, International Poverty Reduction Centre in China.262 Huang J and Rozelle S. (2009). Agricultural Development and Nutrition: The Policies behind China’s Success. Occasional Paper 19. Rome: World Food Programme.263 Stone R. (2012). Despite gains, malnutrition among China’s rural poor sparks concern. Science, (336)6080: 402.264 Luo R, Zhang L, Liu C, Zhao Q, Shi Y, Miller G, Yu E, Sharbono B, Medina A, Rozelle S and Martorell R. (2011). Anaemia among students of rural China’s elementary schools: prevalence and correlates in Ningxia and Qinghai’s poor counties. Journal of Health, Population and Nutrition, (29)5: 471-485.265 Zhang J G, Zhang B, Wang H, Du W, Su C, Wang Z, Liu A, Zhang J, Zhou R, Huang H and Zhai F. (2012). Improvement effect on nutrition status of food fortification strategy in China. Chinese Journal of Health Education, (28)12: 1053-1058.266 GAIN. (undated). China soy sauce fortification project, http://www.gainhealth.org/project/china-soy-sauce-fortification-project
Health transformations: nutrition and diet
79
5
5.2.2 Obesity and chronic diseases
Chronic diseases are linked to poor diets and, independently, to obesity – that is, a poor diet can be a risk factor for chronic diseases even if one is not overweight, while a high body weight can be a risk factor for chronic diseases even if the quality of the diet is good. In 2010, cerebrovascular disease and ischaemic heart disease were the highest ranking causes of death in China. Diet is strongly linked to both diseases, and as in other emerging economies, dietary risks are the leading risk factor for premature death in China.267 The growing problems of overweight, obesity and associated chronic diseases in China are now well documented.
One study of trends in overweight/obesity from a sample of over 50,000 Chinese adults from 1993 to 2009 found that the prevalence of overweight increased from 8% to 17.1% among men and from 10.7% to 14.4% among women.268 The incidence of male obesity grew from 2.9% to 11.4% and from 5.0% to 10.1% for women. This means that 28.5% of men and 25.5% of women in China today are considered to be either overweight or obese. Another study draws a similar conclusion, putting the percentage at about 30%.269 Abdominal obesity is a particular concern since it is associated with higher cardiovascular risk. Its prevalence increased from 8.5 to 27.8% among men and from 27.8 to 45.9% among women. These trends were found in nearly all age groups and regions. Notably, the prevalence of abdominal obesity increased more rapidly among those living in rural regions, suggesting that dietary risks in a period of rapid change are not limited to wealthy urban populations. However, there are also regional differences in average BMI levels and in the prevalence of overweight and underweight – variations that are not simply explainable by differences in economic status.270 Generally, people in northern regions tend to have higher BMI and are more likely to be overweight than the national average, particularly in the Bohai coastal regions. Those in southern regions, including some provinces with relatively higher per capita GDP such as Guangdong and Fujian, tend to have lower BMI and levels of overweight, and a higher prevalence of underweight (Figure 26).
However, while dietary changes and reductions in physical activity are clearly major contributing causes, it is also worth noting that the historical legacy of hunger and famine experienced by older Chinese generations has also left its metabolic mark. Evidence suggests that people who were infants or in-utero during the time of the famine of the late 1950s-early 1960s are today more at risk from diseases such as diabetes, obesity and hypertension when energy and fat rich foods become more available – what is known as the ‘thin-fat’ syndrome.271
267 IHME. (2010). Global Burden of Disease Country Profiles. Seattle: Institute for Health Metrics and Evaluation, http://www.healthmetricsandevaluation.org/gbd/country-profiles268 Xi B, Liang Y, He T, Reilly K H, Hu Y, Wang Q, Yan Y and Mi J. (2012). Secular trends in the prevalence of general and abdominal obesity among Chinese adults, 1993–2009. Obesity Reviews, (13)3: 287–296.269 Yan L, Li J, Li S, Zhang B, Du S, Gordon-Larsen P, Adair L and Popkin B. (2012). The expanding burden of cardiometabolic risk in China: the China Health and Nutrition Survey. Obesity Reviews, (13)9: 810-821.270 Zhuo Q, Wang Z, Piao J, Ma G, Zhai F, He Y and Yang X. (2009). Geographic variation in the prevalence of overweight and economic status in Chinese adults. British Journal of Nutrition, (102): 413–418.271 Li Y, He Y, Qi L, Jaddoe V, Feskens E, Yang X, Ma G and Hu F. (2010). Exposure to the Chinese famine in early life and the risk of hyperglycemia and type 2 diabetes in adulthood. Diabetes, (59)10: 2400–2406; Wang P, Wang J, Lei Y, Xiao L and Luo Z. (2012). Impact of fetal and infant exposure to the Chinese Great Famine on the risk of hypertension in adulthood. Plos One, (7)11: e49720; Yang Z, Zhao W, Zhang X, Mu R, Zhai Y, Kong L and Chen C. (2008). Impact of famine during pregnancy and infancy on health in adulthood. Obesity Reviews, (9):95–99.
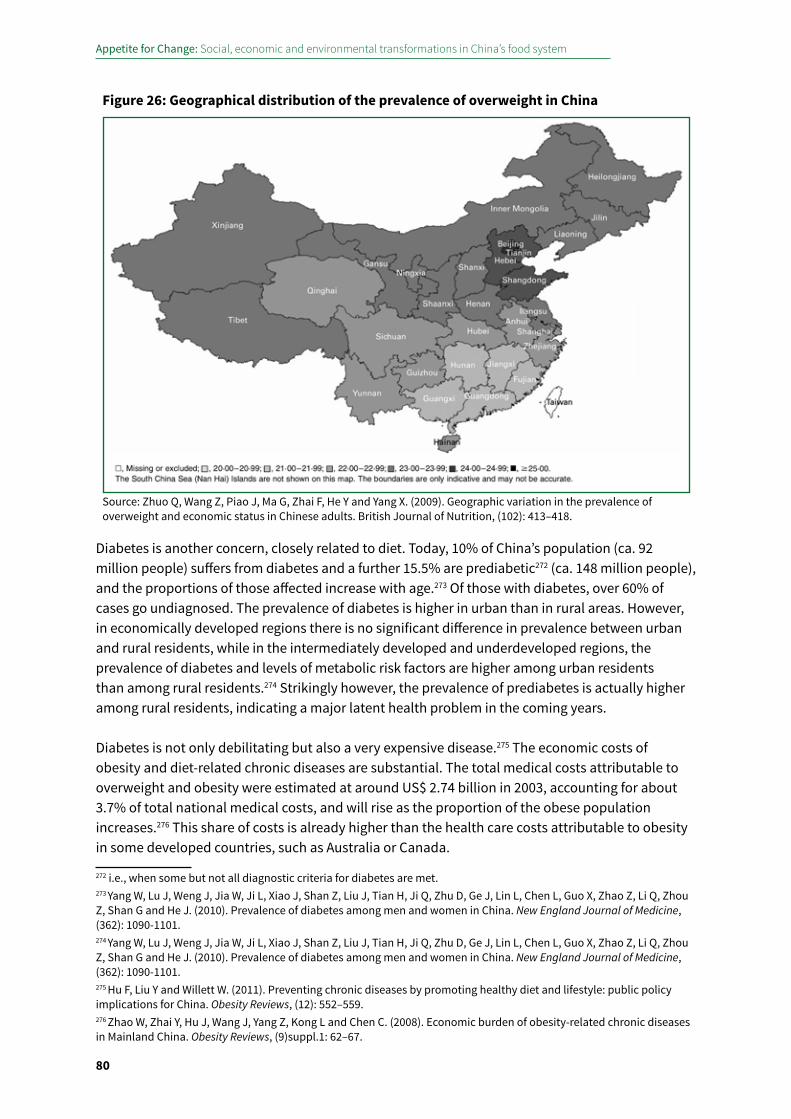
Appetite for Change: Social, economic and environmental transformations in China’s food system
80
Diabetes is another concern, closely related to diet. Today, 10% of China’s population (ca. 92 million people) suffers from diabetes and a further 15.5% are prediabetic272 (ca. 148 million people), and the proportions of those affected increase with age.273 Of those with diabetes, over 60% of cases go undiagnosed. The prevalence of diabetes is higher in urban than in rural areas. However, in economically developed regions there is no significant difference in prevalence between urban and rural residents, while in the intermediately developed and underdeveloped regions, the prevalence of diabetes and levels of metabolic risk factors are higher among urban residents than among rural residents.274 Strikingly however, the prevalence of prediabetes is actually higher among rural residents, indicating a major latent health problem in the coming years.
Diabetes is not only debilitating but also a very expensive disease.275 The economic costs of obesity and diet-related chronic diseases are substantial. The total medical costs attributable to overweight and obesity were estimated at around US$ 2.74 billion in 2003, accounting for about 3.7% of total national medical costs, and will rise as the proportion of the obese population increases.276 This share of costs is already higher than the health care costs attributable to obesity in some developed countries, such as Australia or Canada.
272 i.e., when some but not all diagnostic criteria for diabetes are met.273 Yang W, Lu J, Weng J, Jia W, Ji L, Xiao J, Shan Z, Liu J, Tian H, Ji Q, Zhu D, Ge J, Lin L, Chen L, Guo X, Zhao Z, Li Q, Zhou Z, Shan G and He J. (2010). Prevalence of diabetes among men and women in China. New England Journal of Medicine, (362): 1090-1101.274 Yang W, Lu J, Weng J, Jia W, Ji L, Xiao J, Shan Z, Liu J, Tian H, Ji Q, Zhu D, Ge J, Lin L, Chen L, Guo X, Zhao Z, Li Q, Zhou Z, Shan G and He J. (2010). Prevalence of diabetes among men and women in China. New England Journal of Medicine, (362): 1090-1101.275 Hu F, Liu Y and Willett W. (2011). Preventing chronic diseases by promoting healthy diet and lifestyle: public policy implications for China. Obesity Reviews, (12): 552–559.276 Zhao W, Zhai Y, Hu J, Wang J, Yang Z, Kong L and Chen C. (2008). Economic burden of obesity-related chronic diseases in Mainland China. Obesity Reviews, (9)suppl.1: 62–67.
Figure 26: Geographical distribution of the prevalence of overweight in China
Source: Zhuo Q, Wang Z, Piao J, Ma G, Zhai F, He Y and Yang X. (2009). Geographic variation in the prevalence of overweight and economic status in Chinese adults. British Journal of Nutrition, (102): 413–418.
Health transformations: nutrition and diet
81
5
5.2.3 Bone health
Bone-related diseases such as osteoporosis emerge as people age. In a healthy individual, the body tends to build bone at a faster rate than it destroys it up to the age of 30, but beyond that age, the body loses bone density. Post-menopausal women are particularly at risk, for reasons that are still not fully understood. The weight of an individual is important too, with those who are underweight more at risk. Other critical factors include dietary calcium intakes, vitamin D intakes (from food sources and sunlight), weight-bearing physical activity levels and genetics.
Osteoporosis is now known to affect more than 69.4 million Chinese over age 50, and causes some 687,000 hip fractures in China each year. Ministry of Health data for 2006 shows prevalence for women over 50 is 30.8%, and for men, 8.8%.277 Vertebral fractures are also on the rise, with the number of patients expected to reach 36.7 million in 2020. One study reports that between 1990-2006 the incidence of hip fractures for those over 50 increased 2.76-fold.278 Among those over 70 the increase was even higher, at 3.37-fold for women and 2-fold for men. As the population ages, it is anticipated that the number of Chinese with osteoporosis and osteopenia will increase to 286.6 million in 2020 and 533.3 in 2050, posing a major health challenge in the coming decades. In Hong Kong the incidence of hip fracture had increased by 300% from the 1960s to the 1990s and mainland China shows signs of following similar trends. Indeed the risk of fractures today is similar in China to that in Western countries.279 Osteoporosis remains severely under-diagnosed in even the most high-risk patients who have already fractured. Osteoporosis is, moreover, expensive: the cost of hip fractures is high in comparison to all other major diseases such as heart disease, breast cancer, prostate cancer and ovarian cancer.280 Osteoporosis is gradually being recognised in policy circles as a potentially major health problem, although health sector NGOs such as the China Health Promotion Foundation and the International Osteoporosis Foundation (IOF) have been more active on the issue than government has.
Awareness of osteoporosis among the urban population is fairly high: one study found that about 66% of middle- and old-aged citizens in urban Hangzhou had heard of the disease, and that between one and two thirds of urban residents surveyed take steps to increase their intake of calcium rich foods, such as dairy products, beans and legume products, or calcium supplements.281 As evidence grows that many Chinese people are at risk of osteoporosis and associated bone fractures, attention has turned to the lack of dairy products in the Chinese diet, and this has given impetus to government policies to increase intakes, policy objectives that have been supported by vigorous marketing on the part of the dairy industry. However, countries where dairy intakes are typically very high also have very high incidence of bone fracture; at an international level, there is no consistent relationship between dairy intakes and
277 International Osteoporosis Foundation. (undated). Asian Regional Audit – China, http://www.iofbonehealth.org/sites/default/files/PDFs/Audit%20Asia/Asian_regional_audit_China.pdf278 Xia W, He S, Xu L, Liu A, Jian Y, Li M, Wang O, Xing X, Sun Y and Cummings S. (2012). Rapidly increasing rates of hip fracture in Beijing, China. Journal of Bone and Mineral Research, (27)1: 125–129.279 International Osteoporosis Foundation. (2009). The Asian Audit: Epidemiology, costs and burden of osteoporosis in Asia 2009. Switzerland: International Osteoporosis Foundation; Bow C, Cheung E, Cheung C, Xiao S, Loong C, Soong C, Tan K, Luckey M, Cauley J, Fujiwara S and Kung A. (2012). Ethnic difference of clinical vertebral fracture risk. Osteoporosis International, (23)3: 879-85.280 International Osteoporosis Foundation. (2009). The Asian Audit: Epidemiology, costs and burden of osteoporosis in Asia 2009. Switzerland: International Osteoporosis Foundation.281 Zhou Y and Hong M. (2013). The investigation of the osteoporosis knowledge and its related behaviour in middle-aged and elderly residents in Hangzhou community. Chinese Journal of Geriatrics, (32)5: 564-566 (in Chinese).

Appetite for Change: Social, economic and environmental transformations in China’s food system
82
osteoporosis. Changing lifestyles associated with urbanisation may be a more significant factor than consumption of high-calcium foods and supplements in driving changes in bone-related conditions.282 Physical activity is strongly protective, but elderly urbanites are less likely to walk and cycle than in the past. And as people have moved from single-unit housing with outdoor courtyards to multi-storey buildings, a decrease in sun exposure might have increased vitamin D deficiency. The historical legacy of poor nutrition for those who were children or young adults during the time of the Great Famine may also increase susceptibility to the illness among today’s elderly.283 Other factors, however, such as a trend towards increased BMI, may be associated with higher bone density and thus may be protective against osteoporosis,284 though obese people tend to be less active. Some groups, including wealthier and better educated women, tend to have lower BMI,285 so rising wealth and educational attainment levels as well as changing cultural attitudes to the body may serve to counter the trend towards higher body weights.
5.3 Drivers and shaping influencesThe transformations in China’s economy, and the impacts of those transformations for the production, distribution, affordability and availability of foods, have had a huge effect on what people eat and – as shown above – on health outcomes. As described in Box 17, there are multiple and interrelated influences on nutrition-related health outcomes. Within the context of the overall drivers of change described in Chapter Two, specific factors may also influence nutrition-related health outcomes. These include: effects of urbanisation on physical activity levels; effects of changing population structure on health risk factors; attitudes to health and food; and changes in food supply chains and the food industry, which make available and promote consumption of different types of food.
5.3.1 Urbanisation and sedentary lifestyles
Just over 50% of China’s population now lives in an urban area and the proportion is anticipated to be over 77% by 2050.286 Urbanisation not only influences consumption patterns but also effects bodily metabolic requirements, and thus the amount of food that people need to consume. Urban dwellers tend to be more sedentary and need less food. Per capita intakes have fallen as urbanisation has progressed, although clearly they have not fallen sufficiently – hence the rise in obesity. The CHNS reveals that average weekly physical activity among Chinese adults declined by 32% between 1991 and 2006. Most physical activity in China is undertaken for work not pleasure and rates of exercise for leisure are very low: less than 25% of Chinese adults aged 35–74 years engage in 30 minutes or more of daily moderate or vigorous exercise. The figure drops to 7.9% of
282 Xia W, He S, Xu L, Liu A, Jian Y, Li M, Wang O, Xing X, Sun Y and Cummings S. (2012). Rapidly increasing rates of hip fracture in Beijing, China. Journal of Bone and Mineral Research, (27)1: 125–129.283 Recent trends in bone health may also be a result of past nutritional status. Those now in their 70s would have been in their 20s during the 1950s, a time when food quantity and diversity were generally limited. They also would have lived through the Great Famine of 1958-61. Since the period of life up until the age of 30 is particularly important to bone formation, nutritional deprivation during that time could well have increased the risk of bone fractures in later life.284 Chan R, Woo J, Lau W, Leung J, Xu L, Zhao X, Yu W, Lau E and Pocock N. (2009). Effects of lifestyle and diet on bone health in young adult Chinese women living in Hong Kong and Beijing. Food and Nutrition Bulletin, (30)4: 370-8.285 Wang H, Wang J, Liu M, Wang D, Liu Y, Zhao Y, Huang M, Liu Y, Sun J and Dong G. (2012). Epidemiology of general obesity, abdominal obesity and related risk factors in urban adults from 33 communities of Northeast China: the CHPSNE study. BMC Public Health, (12)1: 967.286 UN DESA. (2010). World Population Prospects: The 2010 Revision. New York: UN DESA; UN DESA. (2011). World Urbanization Prospects: The 2011 Revision. New York: UN DESA.
Health transformations: nutrition and diet
83
5
adults in urban areas.287 Time spent watching television is linked to an increased risk of weight gain and obesity in both children and adults,288 and in China in 2012 there were on average 1.3 colour televisions per household in urban areas and 1.1 per household in rural areas.289 Less physical activity and more indoor living increase risks of some health conditions, such as osteoporosis, requiring a dietary response (e.g., calcium and vitamin D rich foods) to compensate. Growth in the demand for health foods is discussed in Box 6.
5.3.2 Changing population structure and health risks
China’s ageing population is likely to have an influence on food consumption and health outcomes. Elderly people tend to be less physically active and overall food requirements are lower (though protein requirements increase as a proportion of overall intakes)290, and overconsumption may give rise to obesity and other chronic disease problems. Bone-related disease risks increase; rising awareness of this is increasing the importance of calcium rich foods, such as dairy products, which in turn will have environmental implications. For the health sector, ageing is likely to require greater investment in systems to prevent and treat non-communicable diseases, many of which are caused by diet, smoking, alcohol and other lifestyle behaviours. The vulnerability of elderly people to food safety risks (e.g., zoonotic diseases, pesticide contamination etc.) is uncertain and may vary by type of risk. Finally, as people age their attitudes to food and health also change in ways that are not clear, and that are mediated by income, education and other factors.
Changing family structures may also influence health risks, as the one child family planning policy appears to have specific impacts on children’s eating habits.291 Having only one child to feed potentially means that more food is available for the child and that intra-household competition for food is reduced. The ‘Little Emperor’ hypothesis takes this argument further, arguing that the one-child policy has given rise to a generation of spoiled, indulged and overfed children. Other studies find, however, that factors such as the age of children, parental BMI, level of maternal education, socio-economic status, urban residency and province/region effects are more strongly associated with childhood obesity than the fact of being an only child.292 The effects of migration on household structure may also influence children’s food consumption if, for example, the attitudes of grandparents playing the main carer role influence the type and volume of food consumed.293 In some situations, this may increase their exposure to food safety risks, as exemplified by the disproportionate impact of melamine contaminated milk powder on poorer, rural families.294
287 Hu F, Liu Y and Willett W. (2011). Preventing chronic diseases by promoting healthy diet and lifestyle: public policy implications for China. Obesity Reviews, (12): 552–559.288 Hu F, Liu Y and Willett W. (2011). Preventing chronic diseases by promoting healthy diet and lifestyle: public policy implications for China. Obesity Reviews, (12): 552–559.289 National Bureau of Statistics. (2013). China Statistical Yearbook 2013. Beijing: China Statistics Press.290 Millward D and Garnett T. (2010). Food and the planet: nutritional dilemmas of greenhouse gas emission reductions through reduced intakes of meat and dairy foods. Proceedings of the Nutrition Society, (69): 103–118.291 Jing J (ed). (2000). Feeding China’s Little Emperors: Food, Children and Social Change. Stanford: Stanford University Press; French P and Crabbe M. (2010). Fat China: How Expanding Waistlines Are Changing a Nation, New York: Anthem Press. 292 Yang J. (2007). China’s one-child policy and overweight children in the 1990s. Social Science and Medicine, (64)10: 2043-2057.293 Jiang J, Rosenqvist U, Wang H, Greiner T, Lian G and Sarkadi A. (2007). Influence of grandparents on eating behaviors of young children in Chinese three-generation families. Appetite, (48): 377–383; Luo J, Peng X, Zong R, Yao K, Hu R, Du Q, Fang J and Zhu M. (2008). The status of care and nutrition of 774 left-behind children in rural areas in China. Public Health Reports, (123)3: 382.294 FORHEAD (2014). Food Safety in China: Problems, Governance and Research. www.forhead.org.
Appetite for Change: Social, economic and environmental transformations in China’s food system
84
5.3.3 Attitudes to food and health
Evidence on the link between attitudes, consumption behaviour and health-related outcomes is limited and more speculative (see Chapter Six). Some evidence suggests that higher body weights are more highly valued among lower income and elderly population groups in China,295 perhaps a result of hunger and deprivation in earlier decades. Among other social groups, greater weight is not highly valued, particularly among young women,296 and educated women.297 Regarding childhood obesity, evidence suggests that in China, as is common all over the world, mothers consistently tend to underestimate their children’s weight,298 while other studies have found relationships between greater weight and lower levels of dietary knowledge.299 Alcohol consumption is also increasing in China, and alcohol-related conditions are on the rise.300
5.3.4 The role of supply chain transformations
Many of the supply chain influences on food provisioning were described in Chapter Three. Government policies to support agricultural production and developments throughout supply chains have increased the availability of a wide variety of foods. Development of a rapidly growing food processing sector, including inward investment by international food companies, has increased the availability of new foods and – through changes in retail and catering outlets as well as advertising – increased people’s demand for those foods.
Food advertising has had an important influence on consumption patterns; in 2006 China was the fourth largest advertising market for food.301 Studies on the effects of food marketing on children in developing countries, including China, show that children are heavily exposed to food advertising that promotes high-salt, -sugar and -fat products, that they recall and like this advertising, and that they use it to prompt their own and their parents’ purchase decisions.302 Television advertising is particularly influential,303 and is dominated in China (as elsewhere) by high-energy, low-nutrition
295 Zhang X, van der Lans I and Dagevos H. (2011). Impacts of fast food and the food retail environment on overweight and obesity in China: a multilevel latent class cluster approach. Public Health Nutrition, (15)1: 88–96.296 Xie B, Chou C, Spruijt-Metz D, Reynolds K, Clark F, Palmer P, Gallager P, Sun P, Guo Q and Johnson C. (2006). Weight perception and weight-related sociocultural and behavioral factors in Chinese adolescents. Preventive Medicine, (42)3: 229-234.297 Wang H, Wang J, Liu M, Wang D, Liu Y, Zhao Y, Huang M, Liu Y, Sun J and Dong G. (2012). Epidemiology of general obesity, abdominal obesity and related risk factors in urban adults from 33 communities of Northeast China: the CHPSNE study. BMC Public Health, (12)3: 967.298 Penn State News. (2012). Mothers, children underestimate obesity in China. 8 August, http://news.psu.edu/story/147622/2012/08/08/mothers-children-underestimate-obesity-china299 Zhang X, van der Lans I and Dagevos H. (2011). Impacts of fast food and the food retail environment on overweight and obesity in China: a multilevel latent class cluster approach. Public Health Nutrition, (15)1: 88–96.300 Tang Y, Xiang X, Wang X, Cubells J, Babor T and Hao W. (2013). Alcohol and alcohol-related harm in China: policy changes needed. Bulletin of the World Health Organisation, (91)4: 270-276.301 Hawkes C. (2008). Agro-food industry growth and obesity in China: what role for regulating food advertising and promotion and nutrition labelling? Obesity Reviews, (9)suppl.1: 151–161.302 Hastings G, McDermott L, Angus K, Stead M and Thompson S. (2006). The Extent, Nature and Effects of Food Promotion to children: a review of the evidence. WHO Technical Paper. Geneva: World Health Organization; Baillie K. (2008). Health implications of transition from a planned to a free-market economy – an overview. Obesity Reviews, (9)suppl.1: 146–150.303 Kelly B, Halford J C G, Boyland E J, Chapman K, Bautista-Castaño I, Berg C, Caroli M, Cook B, Coutinho J G, Effertz T, Grammatikaki E, Keller K, Leung R, Manios Y, Monteiro R, Pedley C, Prell H, Raine K, Recine E, Serra-Majem L, Singh S and Sumerbell C. (2010). Television food advertising to children: A global perspective. American Journal of Public Health, (100): 1730–1736.
Health transformations: nutrition and diet
85
5
foods.304 Television industry structure and policies may exacerbate this, as government policies have encouraged broadcasters to launch more children’s channels in order to stimulate national competition, and enabled companies to form strategic partnerships with the advertising and media sectors.305 Parents in China, as elsewhere in the world, are concerned about the influence of children’s advertising,306 and regulation of child-targeted television advertising has begun to be discussed in online and other media.
5.3.5 Nutrition policies
China’s nutrition policies have also had an influence on the food system at all stages, from production and distribution through to consumption patterns. Initial policies, such as the Food Structure Reform and Development Masterplan for the 1990s (1993),307 had a significant focus on securing ‘enough’ food, defined in terms of basic protein-energy sufficiency, as well as improving dietary diversity and combating micronutrient deficiencies, for example by increasing the availability of animal products. Strong emphasis was placed on increasing production of animal products. ‘Grain saving’ animals – in particular ruminants because they make use of grassland rather than grains – were preferred, as was poultry, due to their better feed conversion ratio than pork. Particular groups, such as school children, were targeted through a National Soybean Action Plan (1995), which included efforts to increase the supply of soy milk and soy products to primary and middle school students, and a subsequent national Student Nutritious Meal Plan.308 The 1997 China Nutrition Improvement Action Plan309 also focused on addressing hunger and micronutrient deficiencies among vulnerable groups such as pregnant women, infants and the elderly, and set targets for addressing iron deficiency anaemia and vitamin A deficiency.
In subsequent plans, greater stress was placed on providing ‘quality’ food, with quality connoting improved nutrition and food safety. The 2001-2010 China Food and Nutrition Development Plan (2001)310 set specific targets for nutrient intakes among rural and urban men and women (Table 5), and developed agricultural production targets based on population and nutritional requirements. The latest policies continue this emphasis on the quality and safety of food, but also reflect growing awareness of newly emerging problems. The Twelfth Five-Year Plan for Control of Chronic Disease (2012) is the first time that chronic diseases have been explicitly addressed in a sub-sector national plan. The Plan sets out targets for raising awareness of chronic diseases, implementation of healthy lifestyle campaigns and staffing of chronic disease specialists. Thus, in contrast to the focus of the 1990s, the release of this most recent plan indicates that Chinese health policy is starting to grapple with the health consequences of overly ‘abundant’ food. Targets are set for
304 Xinhua. (2011). Chinese Academy of Social Sciences: Urgent need to limit junk food advertising. 25 February, http://news.xinhuanet.com/legal/2011-02/25/c_121120934.htm305 Hawkes C. (2008). Agro-food industry growth and obesity in China: what role for regulating food advertising and promotion and nutrition labelling? Obesity Reviews, (9)suppl.1: 151–161.306 Chan K and McNeal J. (2003). Parental concern about television viewing and children’s advertising in China. International Journal of Public Opinion Research, (15): 151–166.307 State Council of the PRC. (1993). State Council notice regarding ‘Food Structure Reform and Development Masterplan for the 1990s’, http://www.chinabaike.com/law/zy/xz/gwy/1332921_5.html308 Ministry of Agriculture, Ministry of Health, State Education Commission and China Light Industry Association. (1996). National Soybean Action Plan. Beijing.309 State Council of the PRC. (1997). China Nutrition Improvement Action Plan, http://www.chinafc.org.cn/index.php?option=com_flexicontent&view=items&cid=51:2010-11-14-03-47-18&id=632:2010-11-16-23-14-11&Itemid=52 310 Ministry of Agriculture. (2001). 2001-2010 China Food and Nutrition Development Plan, http://www.china.com.cn/chinese/2002/Nov/234275.htm
Appetite for Change: Social, economic and environmental transformations in China’s food system
86
dietary intake of salt and for health outcomes such as the prevalence of adult and child obesity. These are set at 12% and 8%, respectively, which China has almost reached, so the policy ambition is to moderate the rate of increase rather than achieve absolute reductions. As in developed countries, the focus with respect to chronic disease control is on ‘soft measures’, such as health education via the media, unions, NGOs, health promotion and nutrition labelling.
There are certain common themes linking these policies. First is the recognition that production, consumption and supply chain policies need to be integrated – that is, production should be geared towards meeting nutritional requirements, while facilitating conditions, such as adequate transport, storage and processing facilities, need to be in place. A second very strong theme is the focus on hunger and micronutrient deficiencies which, until recently, were the key nutritional problems affecting the vast majority of Chinese citizens, particularly those living in rural and remote regions, women, young children and the elderly. Taken together these two underpinning policy perspectives have had a strong influence on the development of agricultural policy (including the focus on increasing livestock production) and policy support for growth in processed foods. Policy support for processed foods appears somewhat paradoxical. On the one hand, the policy motivation is to meet increasing demand for diverse foods and to ensure that nutritional needs are met, such as through ‘functional foods’ – foods with added vitamins or other nutrients. However, the rise in processed food consumption is likely also associated with growth in levels of obesity and chronic diseases. A nutritional policy to address the rising challenges of ‘abundant’ food and emerging consumption patterns has yet to be developed.
Box 20: Nutritional guidance
The China Nutrition Society, a government supported NGO, provides nutritional advice to consumers through its development and promotion of the ‘Food Guide Pagoda’, a set of food based dietary guidelines (Figure 27). The first Pagoda was launched in 1997 and was revised in 2007. The main difference between the two versions was that the recommendation for dairy consumption has increased from 100g to 300g per day and there is now advice to drink 1200 ml of water daily.311 The Pagoda guidelines were released at a meeting convened by the Ministry of Health, indicating official support.
There has been considerable interest over the last few years in the UK and other European countries in examining the relationship between nutritional and environmental objectives, identifying synergies and trade-offs, and providing dietary advice that integrates health and environmental goals. Examples include the Italian Barilla Center’s ‘Double Pyramid’ advice312 and WWF’s ‘Livewell plate’. The Livewell plate is based on commissioned research that adopts a linear programming-based climate optimisation approach to define the components of a nutritionally balanced, culturally appropriate, affordable diet at less GHG ‘cost’; diets have been generated using this method both for the UK and for other European countries.313 Other approaches include attempts to integrate nutrient density indices with environmental life cycle assessment methods, with a view to developing integrated methods for
311 Ge K. (2011). The transition of Chinese dietary guidelines and the food guide pagoda. Asia Pacific Journal of Clinical Nutrition, (20)3: 439-446.312 Barilla Center. (2010). Double Pyramid: Healthy food for people, sustainable food for the planet. Parma: Barilla Center for Food and Nutrition.313 Macdiarmid J, Kyle J, Horgan G, Loe L, Fyfe C, Johnston A and McNeill G. (2011). Livewell - a balance of healthy and sustainable food choices. Godalming: WWF-UK; WWF. (2013). A balance of healthy and sustainable food choices for France, Spain and Sweden: healthy people, healthy planet. WWF; Macdiarmid J. (2013). Is a healthy diet an environmentally sustainable diet? Proceedings of the Nutrition Society, (1): 13-20.
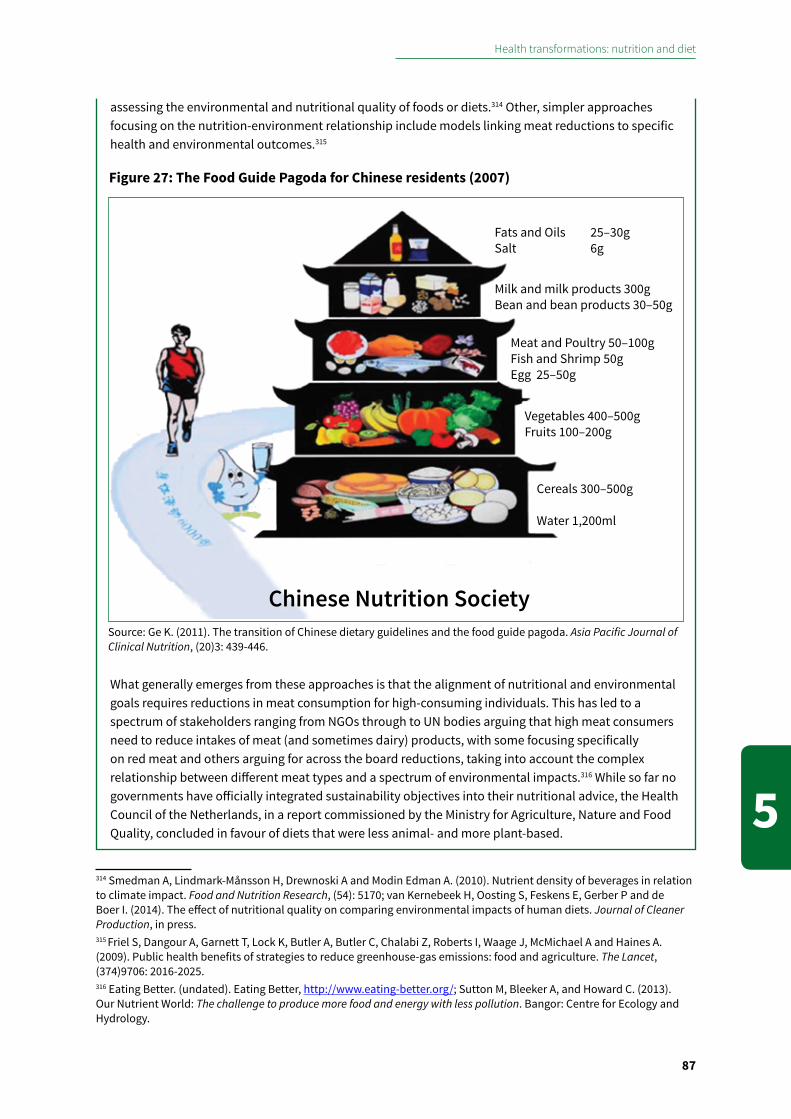
Health transformations: nutrition and diet
87
5
assessing the environmental and nutritional quality of foods or diets.314 Other, simpler approaches focusing on the nutrition-environment relationship include models linking meat reductions to specific health and environmental outcomes.315
What generally emerges from these approaches is that the alignment of nutritional and environmental goals requires reductions in meat consumption for high-consuming individuals. This has led to a spectrum of stakeholders ranging from NGOs through to UN bodies arguing that high meat consumers need to reduce intakes of meat (and sometimes dairy) products, with some focusing specifically on red meat and others arguing for across the board reductions, taking into account the complex relationship between different meat types and a spectrum of environmental impacts.316 While so far no governments have officially integrated sustainability objectives into their nutritional advice, the Health Council of the Netherlands, in a report commissioned by the Ministry for Agriculture, Nature and Food Quality, concluded in favour of diets that were less animal- and more plant-based.
314 Smedman A, Lindmark-Månsson H, Drewnoski A and Modin Edman A. (2010). Nutrient density of beverages in relation to climate impact. Food and Nutrition Research, (54): 5170; van Kernebeek H, Oosting S, Feskens E, Gerber P and de Boer I. (2014). The effect of nutritional quality on comparing environmental impacts of human diets. Journal of Cleaner Production, in press.315 Friel S, Dangour A, Garnett T, Lock K, Butler A, Butler C, Chalabi Z, Roberts I, Waage J, McMichael A and Haines A. (2009). Public health benefits of strategies to reduce greenhouse-gas emissions: food and agriculture. The Lancet, (374)9706: 2016-2025.316 Eating Better. (undated). Eating Better, http://www.eating-better.org/; Sutton M, Bleeker A, and Howard C. (2013). Our Nutrient World: The challenge to produce more food and energy with less pollution. Bangor: Centre for Ecology and Hydrology.
Fats and Oils 25–30g Salt 6g
Milk and milk products 300gBean and bean products 30–50g
Meat and Poultry 50–100gFish and Shrimp 50gEgg 25–50g
Vegetables 400–500gFruits 100–200g
Cereals 300–500g
Water 1,200ml
Chinese Nutrition Society
Figure 27: The Food Guide Pagoda for Chinese residents (2007)
Source: Ge K. (2011). The transition of Chinese dietary guidelines and the food guide pagoda. Asia Pacific Journal of Clinical Nutrition, (20)3: 439-446.
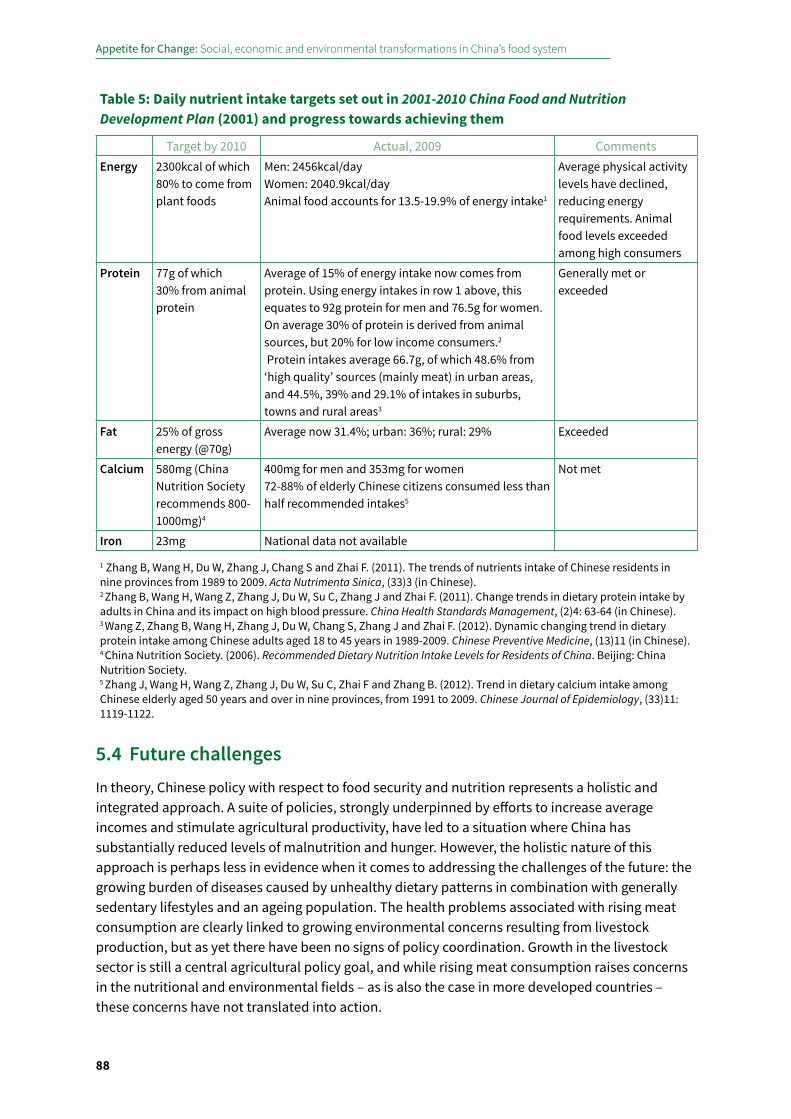
Appetite for Change: Social, economic and environmental transformations in China’s food system
88
5.4 Future challengesIn theory, Chinese policy with respect to food security and nutrition represents a holistic and integrated approach. A suite of policies, strongly underpinned by efforts to increase average incomes and stimulate agricultural productivity, have led to a situation where China has substantially reduced levels of malnutrition and hunger. However, the holistic nature of this approach is perhaps less in evidence when it comes to addressing the challenges of the future: the growing burden of diseases caused by unhealthy dietary patterns in combination with generally sedentary lifestyles and an ageing population. The health problems associated with rising meat consumption are clearly linked to growing environmental concerns resulting from livestock production, but as yet there have been no signs of policy coordination. Growth in the livestock sector is still a central agricultural policy goal, and while rising meat consumption raises concerns in the nutritional and environmental fields – as is also the case in more developed countries – these concerns have not translated into action.
Table 5: Daily nutrient intake targets set out in 2001-2010 China Food and Nutrition Development Plan (2001) and progress towards achieving them
Target by 2010 Actual, 2009 Comments Energy 2300kcal of which
80% to come from plant foods
Men: 2456kcal/day Women: 2040.9kcal/dayAnimal food accounts for 13.5-19.9% of energy intake1
Average physical activity levels have declined, reducing energy requirements. Animal food levels exceeded among high consumers
Protein 77g of which 30% from animal protein
Average of 15% of energy intake now comes from protein. Using energy intakes in row 1 above, this equates to 92g protein for men and 76.5g for women.On average 30% of protein is derived from animal sources, but 20% for low income consumers.2
Protein intakes average 66.7g, of which 48.6% from ‘high quality’ sources (mainly meat) in urban areas, and 44.5%, 39% and 29.1% of intakes in suburbs, towns and rural areas3
Generally met or exceeded
Fat 25% of gross energy (@70g)
Average now 31.4%; urban: 36%; rural: 29% Exceeded
Calcium 580mg (China Nutrition Society recommends 800-1000mg)4
400mg for men and 353mg for women72-88% of elderly Chinese citizens consumed less than half recommended intakes5
Not met
Iron 23mg National data not available
1 Zhang B, Wang H, Du W, Zhang J, Chang S and Zhai F. (2011). The trends of nutrients intake of Chinese residents in nine provinces from 1989 to 2009. Acta Nutrimenta Sinica, (33)3 (in Chinese).2 Zhang B, Wang H, Wang Z, Zhang J, Du W, Su C, Zhang J and Zhai F. (2011). Change trends in dietary protein intake by adults in China and its impact on high blood pressure. China Health Standards Management, (2)4: 63-64 (in Chinese).3 Wang Z, Zhang B, Wang H, Zhang J, Du W, Chang S, Zhang J and Zhai F. (2012). Dynamic changing trend in dietary protein intake among Chinese adults aged 18 to 45 years in 1989-2009. Chinese Preventive Medicine, (13)11 (in Chinese).4 China Nutrition Society. (2006). Recommended Dietary Nutrition Intake Levels for Residents of China. Beijing: China Nutrition Society.5 Zhang J, Wang H, Wang Z, Zhang J, Du W, Su C, Zhai F and Zhang B. (2012). Trend in dietary calcium intake among Chinese elderly aged 50 years and over in nine provinces, from 1991 to 2009. Chinese Journal of Epidemiology, (33)11: 1119-1122.

Health transformations: nutrition and diet
89
5
It is perhaps easier to develop policies to produce ‘more’ and ‘more diverse’ food than it is to rein in excessive or counterproductive consumption patterns. The ‘more food’ approach has largely been a success because it aligns with objectives around economic growth, and with the general human desire for richer and more diverse diets. ‘More’ and ‘better’ food approaches also lend themselves well to relatively simple technological approaches, such as fortification. In short, it is easier to add than it is to take away. Thus, compared to successes in combating ill health caused by insufficient or poor quality nutrition, it will be a greater challenge to address problems created by the abundance of food. Unfortunately, developed countries may not provide much guidance in effective approaches. Most countries have relied on voluntary approaches and measures to enable personal responsibility (e.g., labelling). Harder approaches, such as standards, regulations or taxation may be needed in China, and elsewhere.
A second observation to emerge from the analysis presented above is that China faces a dual challenge of addressing the growing demands for ‘more’ and ‘better’ food from part of the population while simultaneously addressing the problems of overconsumption among another part of the population. This conflict is perhaps most evident in the role of processed foods in nutritional policy. On the one hand, the core rationale for promoting these foods is partly based on concerns over dietary diversity and the nutritional desirability of processed foods, and partly based on economic motivations. Processed foods are a significant source of value-added in the food sector, and convenience foods are better able to meet the needs of a workforce that works long hours and may not have time to cook. On the other hand, many processed foods are rich in sugar, refined carbohydrates and fat, and can be detrimental to health.
The challenge for coming years is two-fold: on the one hand, continuing to address the need for more and better food for those who still lack it, and on the other hand, to address the effects of over- and imbalanced consumption. In addition, since consumption and production are linked, policies to address consumption will have effects on producers, many of whom need to see further improvements in their standards of living. On the positive side, however, China already has a nutrition policy framework that links consumption and production, and a tradition of making policies that consider long-term as well as short-term objectives. Moreover, in 2013 the Ministry of Agriculture established an Institute of Food and Nutrition Development to provide research-based policy advice in this field.317
Box 21: Agri-food and health linkages
The influence of the food system on health goes beyond nutrition and food safety, and agriculture influences health in several ways (Table 6). In addition to the impacts of food production on food security and nutrition, by altering the environment, agriculture affects water and air quality, biodiversity (which, for example influences the spread of vector borne diseases) and the climate (which impacts upon health in multiple ways). Agriculture can also exacerbate the spread of infectious zoonotic and vector borne diseases through livestock production (e.g., Avian Influenza and Swine Flu) and the use of irrigation water that provides a breeding ground for vectors. For example, changes in rice cultivation practices can reduce exposure to malaria vectors.318 The agricultural sector is also associated with high rates of occupational injury, and injuries related to machines and pesticides are
317 http://www.ifnd.org.cn/ (in Chinese).318 Liu Q, Xin K, Chao C, Feng S, Li Y, He R, Zhang Z, Gibson G and Kang W. (2004). New irrigation methods sustain malaria control in Sichuan Province, China. Acta Tropica, (89): 241–247.
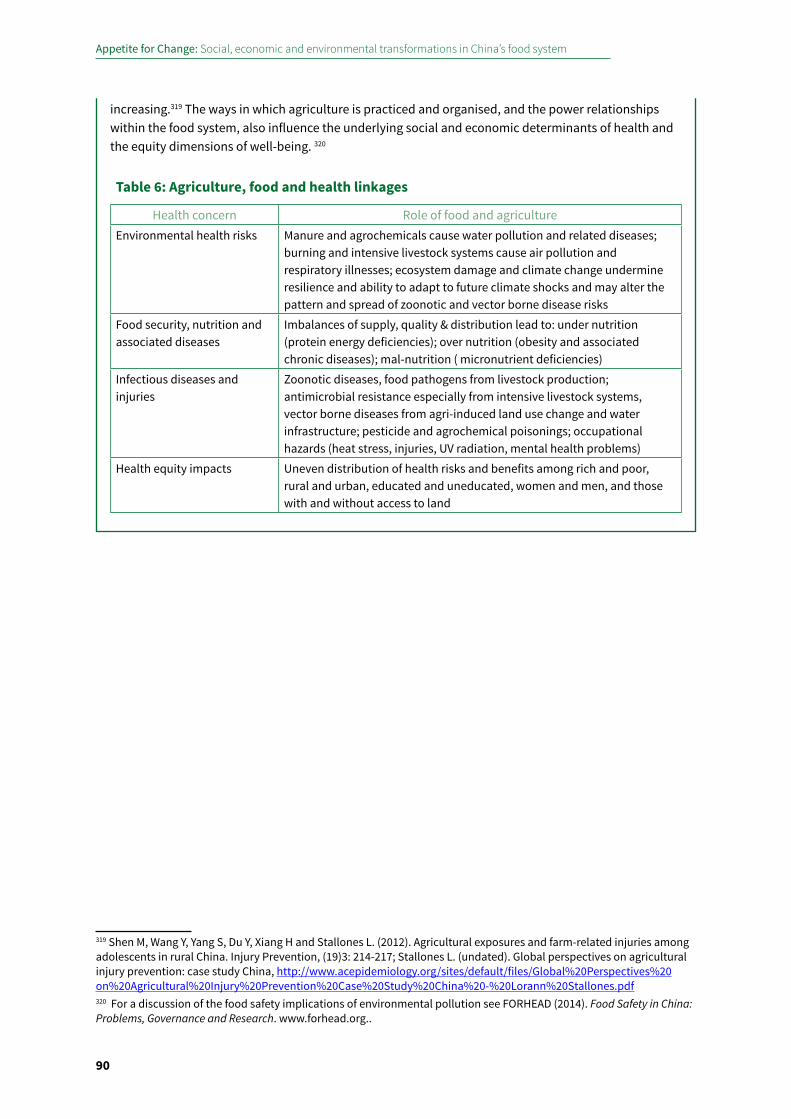
Appetite for Change: Social, economic and environmental transformations in China’s food system
90
increasing.319 The ways in which agriculture is practiced and organised, and the power relationships within the food system, also influence the underlying social and economic determinants of health and the equity dimensions of well-being. 320
319 Shen M, Wang Y, Yang S, Du Y, Xiang H and Stallones L. (2012). Agricultural exposures and farm-related injuries among adolescents in rural China. Injury Prevention, (19)3: 214-217; Stallones L. (undated). Global perspectives on agricultural injury prevention: case study China, http://www.acepidemiology.org/sites/default/files/Global%20Perspectives%20on%20Agricultural%20Injury%20Prevention%20Case%20Study%20China%20-%20Lorann%20Stallones.pdf320 For a discussion of the food safety implications of environmental pollution see FORHEAD (2014). Food Safety in China: Problems, Governance and Research. www.forhead.org..
Table 6: Agriculture, food and health linkages
Health concern Role of food and agricultureEnvironmental health risks Manure and agrochemicals cause water pollution and related diseases;
burning and intensive livestock systems cause air pollution and respiratory illnesses; ecosystem damage and climate change undermine resilience and ability to adapt to future climate shocks and may alter the pattern and spread of zoonotic and vector borne disease risks
Food security, nutrition and associated diseases
Imbalances of supply, quality & distribution lead to: under nutrition (protein energy deficiencies); over nutrition (obesity and associated chronic diseases); mal-nutrition ( micronutrient deficiencies)
Infectious diseases and injuries
Zoonotic diseases, food pathogens from livestock production; antimicrobial resistance especially from intensive livestock systems, vector borne diseases from agri-induced land use change and water infrastructure; pesticide and agrochemical poisonings; occupational hazards (heat stress, injuries, UV radiation, mental health problems)
Health equity impacts Uneven distribution of health risks and benefits among rich and poor, rural and urban, educated and uneducated, women and men, and those with and without access to land
Socio-cultural transformations: attitudes and behaviours around consumption
91
6
6 Socio-cultural transformations: attitudes and behaviours around consumption
Earlier sections of this report highlighted a number of interconnecting influences on people’s consumption patterns. So far this report has paid less attention to the attitudes and values that people bring to their food purchasing and consumption patterns, and to the ways in which rising wealth and abundance and changes in the food system have in turn influenced people’s beliefs a nd expectations about food. The further evolution of these attitudes is likely to influence the food system in coming years.
This section considers some of these values and attitudes and considers how they may change. It describes three main underlying attitudinal trends that are likely to shape the food system’s future direction: attitudes towards consumption (Section 7.1); growing concerns with health and food safety (Section 7.2); and concerns about the environment and animal welfare (Section 7.3).
Focusing on the limited available evidence regarding attitudes and values of Chinese consumers, the analysis in this chapter is more speculative than in other chapters of this report. Firstly, the links between expressed attitudes (i.e., what people say), values (i.e., what people say they believe) and behaviour (i.e., what people do) have long been contested in social science research. Survey responses may be affected by the timing and framing of questions. Researchers’ interpretation of survey findings may also be influenced by analytical framings. Secondly, some of the available evidence comes from international surveys and comparisons between countries have to be treated carefully, as the same reported preference in one context may not have the same implications as in another context. Comparisons over time among the same population may be more informative, but few longitudinal studies on attitudes relating to various aspects of the food system have been conducted. Thirdly, consumer attitude surveys have mostly been conducted in urban contexts and with small samples may be biased to certain sections of the population. With these caveats in mind, the purpose of this chapter is to explore the ways in which changing values and attitudes may influence future changes in China’s food system.
6.1 Consumerism and food in ChinaMcKinsey, a business consultancy firm, segments Chinese urban consumers into four main categories. Around four fifths of people are classed as ‘mass consumers’. With annual incomes of about US$ 6,000 to US$ 16,000, they are able to afford basic commodities and some consumer durables, but not much more. The poor, with incomes below US$ 6,000 are now a minority, accounting for 10% of the population. Near the top of the spending ladder are those whom McKinsey calls the ‘new mainstream’, with annual incomes between US$16,000 and US$ 34,000. Above them are the affluent, with even higher incomes. New mainstream consumers currently account for only about 6% of the population, but McKinsey predicts that this group will constitute
Appetite for Change: Social, economic and environmental transformations in China’s food system
92
over half of China’s population by 2020 (Figure 28). This will have a huge influence on the evolution of the food market.
People are spending more on food in absolute terms, but less as a proportion of overall expenditures. Those on lower incomes may simply buy the products they normally buy in larger quantities, or more frequently. However, higher income groups may trade up to more expensive, branded version of products they already buy, while the wealthiest sections of the population will be able to afford to experiment with novel products. One study found that 83% of Chinese consumers felt that it was important to find more excitement and sensations in life, compared to a global average of 64%. Forty four percent of Chinese consumers surveyed had tried food and drinks with new and exotic flavours within the six months leading up to the study, compared to 30% of global consumers.321 A number of food sectors are experiencing rapid demand, such as ready meals,322 confectionery, dairy products and imported alcohol. As consumer motivations change, brands are becoming increasingly important. Whereas previously people would buy whatever was cheapest or on special, people are now staying with brands that they perceive to be better in some way. The proportion of customers tending to purchase the same brand in the food and beverage category is rapidly increasing.323
Much has been made of the rise of consumerism in China. Sustained rapid increase in per capita incomes has enabled more and more people not only to meet their basic needs but also to go beyond these and begin to spend for pleasure or to meet other aspirations. Surveys, such as the Greendex survey (an international survey with a sample of just 1,000 respondents, mostly in urban China), suggest that consumers in China – as in some other rapidly emerging economies – are more likely to value wealth, material possessions and conspicuous consumption than their counterparts in developed economies, even as they express more willingness to buy resuable and repairable goods, and to pay premiums for environmentally friendly goods, than many developed country consumers do.324 More recently, government policies have seen support for consumption spending as essential to changing the structure of China’s economy and an increasingly important
321 AAFC. (2010). The urban Chinese consumer: Behaviour, attitudes and perceptions toward food products. ISSN Market Analysis Report. AAFC no. 11202E. Ottawa: Agriculture and Agri-Food Canada.322 IMAP. (2010). Food and Beverage Industry Global Report, http://www.imap.com/imap/media/resources/IMAP_Food__Beverage_Report_WEB_AD6498A02CAF4.pdf323 Atsmon Y, Magni M and Li L. (2012). From Mass to Mainstream: Keeping Pace With China’s Rapidly Changing Consumers: 2012 Annual Chinese Consumer Report. McKinsey.324 Podoshen J S, Li L and Zhang J. (2011). Materialism and conspicuous consumption in China: a cross-cultural examination. International Journal of Consumer Studies, (35): 17–25; AAFC. (2010). The urban Chinese consumer: Behaviour, attitudes and perceptions toward food products. ISSN Market Analysis Report. AAFC no. 11202E. Ottawa: Agriculture and Agri-Food Canada.
0
50
100
150
200
250
300
350
2000 2010 2020
A�luent New mainstream
Mass consumers PoorM
illio
n ho
useh
olds
Figure 28: Projection of urban households by consumer type, 2000-2020
Source: Atsmon Y, Magni M and Li L. (2012). From Mass to Mainstream: Keeping Pace With China’s Rapidly Changing Consumers: 2012 Annual Chinese Consumer Report. McKinsey.
Socio-cultural transformations: attitudes and behaviours around consumption
93
6
driver of growth.325 With regard to food, attitudes to consumption underlie not only changes in the amounts of food consumed and wasted, but also in the range of foods people demand.
The implications of ‘materialistic’ or ‘environmentally friendly’ consumer attitudes for the food system and its environmental and other impacts are far from clear. Consumers may purchase luxury, grass-fed milk products that have higher emissions intensities than cheaper products. Demand for some natural health food products drives environmental degradation and social conflict in some producing areas. The link between attitudes to local environmental issues and consumer behaviour may be very different from attitudes to global sustainability issues and related consumption practices. Some have argued that consumer attitudes could be influenced to orient consumer behaviour towards more sustainable outcomes, such as low energy domestic goods, or the adoption of less meat-intensive diets or less wasteful food patterns. Others have pointed out that promotion of ‘smart consumption’ of this type may not be sufficient to bring about the behavioural change required to address large-scale sustainability issues.326
6.2 Concerns about health, safety and qualityAs consumers become more sophisticated, attitudes to food consumption are changing, and some consumer segments are becoming more discerning in ways that have particular implications for the impacts of the food system. Recent years have seen rapid growth in concerns around the quality of the food that people buy, with quality defined both in terms of nutritional value and safety. The emphasis on safety is largely in response to very real concerns, though public perception is influenced by a number of factors in a context of partial information.327 Surveys show that food safety concerns rank very high on ordinary people’s list of public concerns.328 People respond to these concerns in a variety of ways, depending on their incomes and circumstances: they may choose to buy only from trusted vendors, or only buy brands that they trust. Preference for buying imported food brands often reflects concerns about the safety of domestically produced goods rather than rising materialism (see Focus on Dairy). The generally higher levels of trust in imported foods enables global brand owners to exploit new market opportunities.329 Chinese consumers may also, if they can afford it, buy foods carrying ‘Green’ or ‘organic’ certification, or buy from Community Supported Agriculture schemes (see Box 12).
Concerns about food safety vary by socio-economic group, by gender and by location.330 Women are particularly likely to be concerned about food safety. Those who are more educated, the elderly, and married couples tend to express more concern than single or younger people,
325 Atsmon Y, Magni M and Li L. (2012). From Mass to Mainstream: Keeping Pace With China’s Rapidly Changing Consumers: 2012 Annual Chinese Consumer Report. McKinsey.326 Crompton T. (2008). Weathercocks and signposts: The environmental movement at a crossroads. Godalming: WWF-UK.327 See FORHEAD (2014). Food Safety in China: Problems, Research and Governance. www.forhead.org328 National Geographic. (2012). Greendex 2012: Consumer Choice and the Environment – A Worldwide Tracking Survey, http://images.nationalgeographic.com/wpf/media-content/file/NGS_2012_Final_Global_report_Jul20-cb1343059672.pdf; Wang H. (2013). Food safety tops public’s concerns. China Daily. 21 August, http://usa.chinadaily.com.cn/china/2013-08/21/content_16909023.htm; Pew Research Center. (2013). Environmental concerns on the rise in China. 19 September, http://www.pewglobal.org/2013/09/19/environmental-concerns-on-the-rise-in-china/329 Rabobank. (2012). Are Brands too late to go into China? 20 November, http://rabobank-food-agribusiness-research.pressdoc.com/34791-rabobank-are-brands-too-late-to-go-into-china330 Xu C. (2013). Literature review on cultural aspects of food in China. Unpublished report to Food Climate Research Network, University of Oxford. See also FORHEAD (2014). Food Safety in China: Problems, Research and Governance. www.forhead.org.
Appetite for Change: Social, economic and environmental transformations in China’s food system
94
reflecting a greater propensity to read about the issues, greater vulnerability to safety outbreaks (in the case of the elderly) and increased importance placed on child rearing and the family. Public concern about food safety is at the forefront of people’s minds and policy makers are well aware of this. Consumer-led responses to the problem such as the ‘throw out the window’ campaign (a website that allows people to post details of food safety alerts in their area) have received official government backing.331 The problem is already having a strong influence on the direction of the food system in China, partly through the development of specific legislation that seeks to address it, and partly because the issue adds force to government’s perception that scaling up is the way forward for the food system. Fewer, larger enterprises – whether at the farm, or processing or retailing stage – are seen as easier to monitor and regulate than multitudinous smaller and more informal enterprises.
Box 24: Public attitudes to new technologies: focus on GM
Research conducted in the early 2000s found that most consumers were not opposed to GM technology in food and non-food crop production.332 Since then, China has been beset by a number of food safety scandals, NGOs have conducted a number of anti-GM campaigns, and awareness and knowledge of GM foods has increased. One 2007 survey by Greenpeace – an anti-GM NGO – found that 65% of Chinese consumers familiar with GM crops were not in favour,333 and a more recent survey found that 69% of mainland Chinese consumers were opposed to GM rice.334 Academic surveys, on the other hand, tend to find that between one and two thirds of respondents do not know about GM, or have heard the term without knowing what it is. Among those who have heard of GM, acceptance rates are typically between 30-40%, but the largest group responds that they have no opinion, and only a minority (10-30%) are not willing to buy GM foods. Many consumers do not know whether they have bought GM foods, and confusing product labelling appears to limit consumers’ ability to engage with the topic at the point of consumption.335 These findings indicate the need for much more public education and consumer guidance on the topic before informed discussions that involve a wider section of the population can be held.
331 Astley M. (2012). China officials back ‘throw out the window’ food safety site. Food Quality News. 18 May, http://www.foodqualitynews.com/Public-Concerns/China-officials-back-throw-out-the-window-food-safety-site/?utm_source=newsletter_daily&utm_medium=email&utm_campaign=GIN_DRd&c=jrkd9eKIEpMc4%252BwQF7gMeg%253D%253D 332 Zhang X, Huang J, Qiu H and Huang Z. (2010). A consumer segmentation study with regards to genetically modified food in urban China. Food Policy, (35)5: 456–462.333 Chakraborty K. (2011). Consumers’ attitude and product labeling for GM food in China and hormone induced milk in the United States. International Journal of Economics and Finance, (3): 3-11.334 Greenpeace. (2011). Chinese people say ‘no’ to GE rice. 23 February, http://www.greenpeace.org/eastasia/news/stories/food-agriculture/2011/Chinese-GE-rice-survey/ 335 Fan L, Wei W and Zhu Z. (2010). Survey and cognitive situation on consumers towards genetically modified food. Chinese Agricultural Science Bulletin, (26)20: 80-85 (in Chinese); Yang J, He Y, Wang M, Wu B, Deng L, Liang Q and Huang X. (2012). The survey and analysis on the public knowledge of genetically modified food in Guangxi. Chinese Agricultural Science Bulletin, (28)36: 306-311; Zhang X and Zhang X. (2012). Urban residents’ perception of GM foods and consumption: survey in Shandong. Reform, (7): 020; Liu Z. (2013). Analysis of factors influencing consumers’ willingness to buy GM foods. Modern Business Trade Industry, (25)11: 78-79; Wang R, Wang J, Zhou M and Yang F. (2010). Consumers’ perception and acceptance of GM foods: case study of Wuhan city. Tianjin Agricultural Sciences Journal, (2): 44-48.
Socio-cultural transformations: attitudes and behaviours around consumption
95
6
As regards nutritional wellbeing, diet has long been considered crucial both to the maintenance of good health and to the curing of disease. The blurred boundary between food and medicine, as suggested by the sayings ‘medicine and food share common origins’ (yao shi tong yuan) and ‘illness enters through the mouth’ (bing cong kou ru), also reveals an understanding of the importance of diet for health. While the rise in incomes and living standards, greater availability of more diverse, richer and novel foods, and the influence of international food enterprises selling western-style fast and convenience food, may have subsumed these more traditional concerns for some, there are signs that health is once again reasserting itself as an important influence on people’s consumption habits (see Box 6).
Some of the factors influencing this growing preoccupation include government campaigns around school meals and school milk, advertising (both by the food industry and government) that seeks to encourage, for example, milk drinking for bone health, and rising concerns about the growth in obesity and associated chronic diseases (see Chapter Five). Demographic changes, including an ageing population and changes in household structure due to the one child family planning policy, suggest that concerns about nutrition may grow in importance.
6.3 Environmental and other ethical concerns The preoccupation with health is also linked to a rise in concerns about the environment and animal welfare. Two international comparative surveys find that the environmental motivations of Chinese consumers are quite high. In one survey, 44% of Chinese respondents said they were willing to pay more for products that are good for the environment, a greater percentage than in the US or UK.336 National Geographic’s annual Greendex survey (with a small, urban-biased sample), which assesses the sustainability of individuals’ behaviour in housing, transport, food and goods, ranked the small sample of Chinese respondents second overall, and third in sustainable food practices. They are also the third most likely to express guilt about the impact they are having on the environment.337 As for food, the Greendex score ranks populations by what it considers to be pro-environmental food behaviours; these are defined to include buying locally sourced or home grown foods, and fruit and vegetable consumption, while beef eating, seafood consumption and bottled water consumption are not included. Chinese respondents were ranked third behind India and Sweden.338 Of the small samples in all the countries surveyed, those in China were most likely to be concerned about air and water pollution and the spread of infectious diseases. Sixty nine percent of those surveyed believed that environmental problems were undermining their health. In the case of food, agricultural systems that use fewer or no chemical inputs, such as those based on ‘green’ or organic approaches, are seen as safer than those which may rely very heavily on such inputs.
336 Atsmon Y, Magni M and Li L. (2012). From Mass to Mainstream: Keeping Pace With China’s Rapidly Changing Consumers: 2012 Annual Chinese Consumer Report. McKinsey.337 National Geographic. (2012). Greendex 2012: Consumer Choice and the Environment – A Worldwide Tracking Survey, http://images.nationalgeographic.com/wpf/media-content/file/NGS_2012_Final_Global_report_Jul20-cb1343059672.pdf. Note that this survey is based on a small (1000) sample. For reasons that are unclear, the Chinese sample is more skewed than any other in the Greendex survey toward high income urban residents. Analysis of responses to specific questions is not weighted for this bias.338 National Geographic. (2012). Greendex 2012: Consumer Choice and the Environment – A Worldwide Tracking Survey, http://images.nationalgeographic.com/wpf/media-content/file/NGS_2012_Final_Global_report_Jul20-cb1343059672.pdf
Appetite for Change: Social, economic and environmental transformations in China’s food system
96
Box 25: Rising vegetarian catering
In contrast to the overall trend towards higher consumption of meat and other animal products, the last ten years has witnessed the rapid development of vegetarian restaurants in Chinese cities. In 2012, Beijing, Shanghai and Guangzhou each had around 50 vegetarian restaurants listed on dianping.com, China’s most popular restaurant website. Most were Buddhist restaurants, but some were ‘organic’ restaurants with an emphasis on health, while others were Western-style eateries. The dominance of Buddhist restaurants suggests a link to a wider resurgence of Buddhism and other religions,339 but the interest in vegetarian diets might also be a consumer response to concerns about the safety of meat and the growth in obesity and chronic diseases. For many, consumption in vegetarian restaurants may simply be another opportunity to explore new tastes and types of consumption. Some observers speak of the emergence of a ‘new vegetarianism’ among the young, urban elite. For these people, vegetarianism is a holistic response to a nexus of concerns about human health, the environment, animal welfare and the wastefulness of feeding grains to animals.340
6.4 Future trendsChanging attitudes to food are not only a consequence of changes in the food system but are likely to help shape its future direction. Public opinion has already been shown to have a strong influence on the food system; for example, food safety concerns have prompted substantial policy action, and changes in consumer behaviour. How these attitudes evolve in coming years remains to be seen and will be affected not only by income levels and cultural factors but also by the availability of information about the health and environmental impacts of various foods and government policies and corporate marketing strategies that attempt to shape attitudes and behaviour in convergent or divergent directions.
While higher incomes are associated with trends towards increasing consumption in China as in other countries, the environmental and health impacts of this are not straightforward. Although China is moving rapidly towards a largely urbanised, middle income status, the percentage of the population that has yet to purchase many consumer durables seen as necessities in developed countries is still large in absolute terms, as is the population for whom the cost of food is an important concern. For such people, considerations about price will sometimes come into conflict with concerns about environmental and health impacts.
Currently, not much is known about the relationship between price and environmental or health standards with regard to the purchasing options available to low and lower middle income consumers. Most international comparisons (e.g., the McKinsey and Greendex surveys) focus on middle and high income consumers. Enabling people with low incomes to make sustainable choices about food (and other purchases) would seem to be a priority if policy is to contribute to preventing the widespread adoption of the unsustainable consumption practices that took root in most developed nations during the processes of urbanisation and industrialisation. The surveys show nations clustering by level of development rather than by culture (in terms of both attitudes and behaviour). At the moment, urbanites in emerging economies generally exhibit more environmentally friendly attitudes and behaviours than their developed world counterparts. An
339 Overmeyer D (ed). (2003). Special Issue: Religion in China Today. The China Quarterly, (174).340 Guo G. (2003). Reasons for vegetarianism as an environmentalist. Digest,. (12): 64-67 (in Chinese).
Socio-cultural transformations: attitudes and behaviours around consumption
97
6
important question is therefore whether greater awareness of health and environmental impacts both domestically and on a global scale will be sustained as China develops, and if so whether these attitudes will be reflected in less excessive and environmentally damaging consumption.
The demography of consumption patterns in China is highly complex and rapidly changing. In addition to income levels and education, different age cohorts will also reflect the impact of particular life experiences (for example, the experience of hunger among the current elderly) and also family structure (e.g., the now modified one child policy). Born in the era of market liberalisation, and potentially indulged as the first generation of single children, this generation may grow up with different attitudes and habits from their parents and grandparents, or attitudes may converge with those of older generations as they age. Further analysis not only of standard variables that affect consumption patterns but also of these China-specific factors awaits more systematic research.
Appetite for Change: Social, economic and environmental transformations in China’s food system
98
Focus on livestock
The livestock sector accounts for nearly a third of the agricultural economy by value, or about 3.5% of GDP and is an important source of livelihoods. However, it is also a leading source of water and soil pollution, and contributes to a growing proportion of agricultural greenhouse gas emissions. Livestock feed accounts for an increasing share of crop use, and thus drives an increasing proportion of crop-related environmental impacts both within China and overseas through its rising demand for soy and maize. Growth in meat consumption has also been linked with the rising prevalence of obesity and chronic diseases, while recent years have seen a suite of food safety outbreaks – from contamination through to zoonotic diseases – with origins in the livestock sector.
This chapter looks at how the livestock sector has grown and changed over time. We show that the rapid pace of growth in production, processing, consumption and trade, has been driven by substantial changes in the structure of production, supported by explicit government policies (Sections 1-6). This chapter also pays particular attention to another concern that has only recently gained industry and policy attention: animal welfare (Section 7). It considers how the animal welfare landscape in China is changing and highlights why this is an important issue meriting further attention. While the dairy sector is covered separately in its Focus chapter, many of the animal welfare issues discussed below will be relevant to dairy farming too.
1. Growth in the livestock sectorChapter Three looks in some detail at how the agricultural sector has changed in the last 35 years. Perhaps the most striking aspect of its development has been the rise of the livestock sector, which has seen an average annual growth rate of 5.9% over the thirty-year period. This increase in the relative importance of livestock has been accompanied by changes in its structure, most notably the shift towards larger-scale, more commercialised production units.
Within the livestock sector, while pork still dominates production, the annual rate of growth in poultry output has increased more rapidly, at 5.3% compared with 3.7% for the sum of pork, beef, and mutton during the 13 years from 1996 to 2009 (Figure 29). Future trends suggest that demand for pork will begin to slow, meaning that poultry will continue to take a greater share of the overall livestock market. China now produces some 17 million tonnes of poultry annually, or 18% of global production, and China is now the second largest producer in the world, after the US.341 This more rapid growth partly reflects the poultry sector’s relatively greater profitability, thanks to its high feed conversion efficiency and good market prices as well as to changing tastes and demands.342 The rapidly growing fast food sector is currently the driving force for poultry demand in China, although in the coming years, growth in frozen or other forms of processed food for home consumption will likely be a stronger influence. The meat processing sector is still a minor player, reflecting Chinese people’s preference for fresh meat, but the situation in coming years is
341 Rabobank. (2013). Press release: Rabobank Report: Can China’s poultry move out of pork’s shadow? 8 March, https://www.rabobank.com/en/press/search/2013/RabobankReportCanChinaspoultrymoveoutofporksshadow.html342 Carter C, Zhong F and Zhu J. (2012). Advances in Chinese agriculture and its global implications. Applied Economic Perspectives and Policy, (34): 1-36.
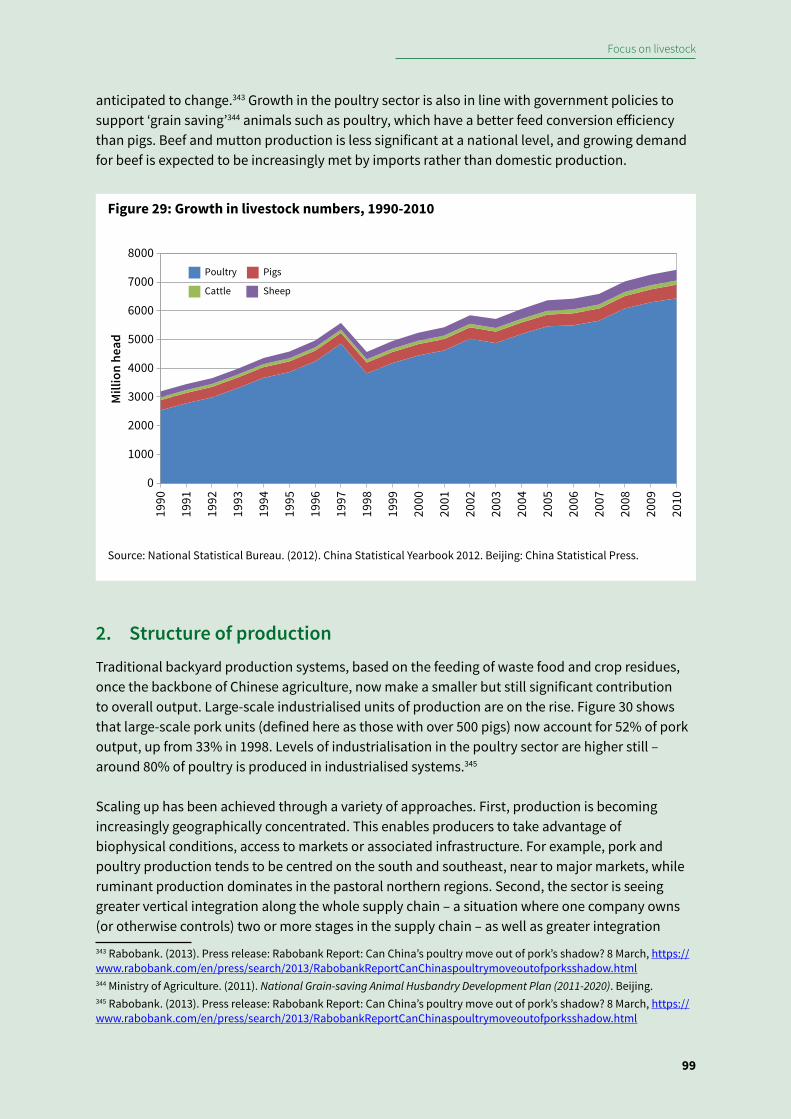
Focus on livestock
99
anticipated to change.343 Growth in the poultry sector is also in line with government policies to support ‘grain saving’344 animals such as poultry, which have a better feed conversion efficiency than pigs. Beef and mutton production is less significant at a national level, and growing demand for beef is expected to be increasingly met by imports rather than domestic production.
2. Structure of productionTraditional backyard production systems, based on the feeding of waste food and crop residues, once the backbone of Chinese agriculture, now make a smaller but still significant contribution to overall output. Large-scale industrialised units of production are on the rise. Figure 30 shows that large-scale pork units (defined here as those with over 500 pigs) now account for 52% of pork output, up from 33% in 1998. Levels of industrialisation in the poultry sector are higher still – around 80% of poultry is produced in industrialised systems.345
Scaling up has been achieved through a variety of approaches. First, production is becoming increasingly geographically concentrated. This enables producers to take advantage of biophysical conditions, access to markets or associated infrastructure. For example, pork and poultry production tends to be centred on the south and southeast, near to major markets, while ruminant production dominates in the pastoral northern regions. Second, the sector is seeing greater vertical integration along the whole supply chain – a situation where one company owns (or otherwise controls) two or more stages in the supply chain – as well as greater integration 343 Rabobank. (2013). Press release: Rabobank Report: Can China’s poultry move out of pork’s shadow? 8 March, https://www.rabobank.com/en/press/search/2013/RabobankReportCanChinaspoultrymoveoutofporksshadow.html344 Ministry of Agriculture. (2011). National Grain-saving Animal Husbandry Development Plan (2011-2020). Beijing.345 Rabobank. (2013). Press release: Rabobank Report: Can China’s poultry move out of pork’s shadow? 8 March, https://www.rabobank.com/en/press/search/2013/RabobankReportCanChinaspoultrymoveoutofporksshadow.html
0
1000
2000
3000
4000
5000
6000
7000
8000
1990
1991
1992
1993
1994
1995
1996
1997
1998
1999
2000
2001
2002
2003
2004
2005
2006
2007
2008
2009
2010
Poultry Pigs
Cattle Sheep
Mill
ion
head
Figure 29: Growth in livestock numbers, 1990-2010
Source: National Statistical Bureau. (2012). China Statistical Yearbook 2012. Beijing: China Statistical Press.
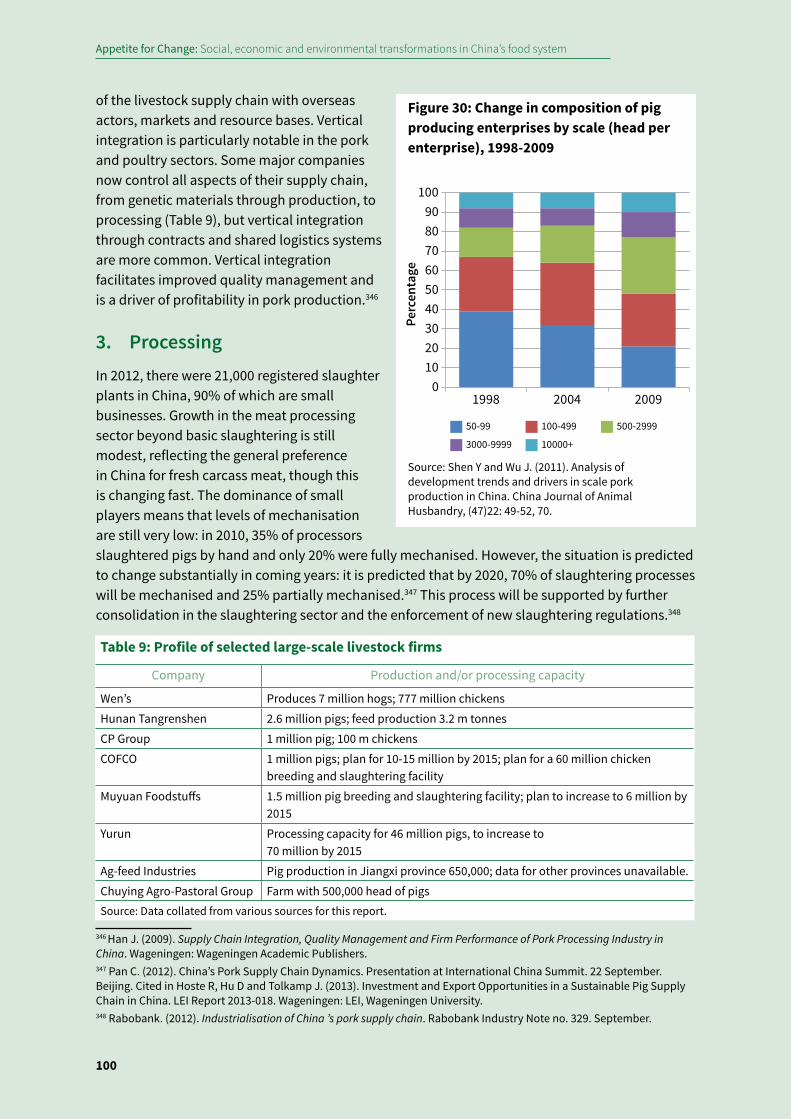
Appetite for Change: Social, economic and environmental transformations in China’s food system
100
of the livestock supply chain with overseas actors, markets and resource bases. Vertical integration is particularly notable in the pork and poultry sectors. Some major companies now control all aspects of their supply chain, from genetic materials through production, to processing (Table 9), but vertical integration through contracts and shared logistics systems are more common. Vertical integration facilitates improved quality management and is a driver of profitability in pork production.346
3. ProcessingIn 2012, there were 21,000 registered slaughter plants in China, 90% of which are small businesses. Growth in the meat processing sector beyond basic slaughtering is still modest, reflecting the general preference in China for fresh carcass meat, though this is changing fast. The dominance of small players means that levels of mechanisation are still very low: in 2010, 35% of processors slaughtered pigs by hand and only 20% were fully mechanised. However, the situation is predicted to change substantially in coming years: it is predicted that by 2020, 70% of slaughtering processes will be mechanised and 25% partially mechanised.347 This process will be supported by further consolidation in the slaughtering sector and the enforcement of new slaughtering regulations.348
346 Han J. (2009). Supply Chain Integration, Quality Management and Firm Performance of Pork Processing Industry in China. Wageningen: Wageningen Academic Publishers.347 Pan C. (2012). China’s Pork Supply Chain Dynamics. Presentation at International China Summit. 22 September. Beijing. Cited in Hoste R, Hu D and Tolkamp J. (2013). Investment and Export Opportunities in a Sustainable Pig Supply Chain in China. LEI Report 2013-018. Wageningen: LEI, Wageningen University.348 Rabobank. (2012). Industrialisation of China ’s pork supply chain. Rabobank Industry Note no. 329. September.
0102030405060708090
100
1998 2004 2009
50-99 100-499 500-2999
3000-9999 10000+
Perc
enta
ge
Figure 30: Change in composition of pig producing enterprises by scale (head per enterprise), 1998-2009
Source: Shen Y and Wu J. (2011). Analysis of development trends and drivers in scale pork production in China. China Journal of Animal Husbandry, (47)22: 49-52, 70.
Table 9: Profile of selected large-scale livestock firms
Company Production and/or processing capacity
Wen’s Produces 7 million hogs; 777 million chickensHunan Tangrenshen 2.6 million pigs; feed production 3.2 m tonnesCP Group 1 million pig; 100 m chickensCOFCO 1 million pigs; plan for 10-15 million by 2015; plan for a 60 million chicken
breeding and slaughtering facility Muyuan Foodstuffs 1.5 million pig breeding and slaughtering facility; plan to increase to 6 million by
2015Yurun Processing capacity for 46 million pigs, to increase to
70 million by 2015 Ag-feed Industries Pig production in Jiangxi province 650,000; data for other provinces unavailable. Chuying Agro-Pastoral Group Farm with 500,000 head of pigsSource: Data collated from various sources for this report.
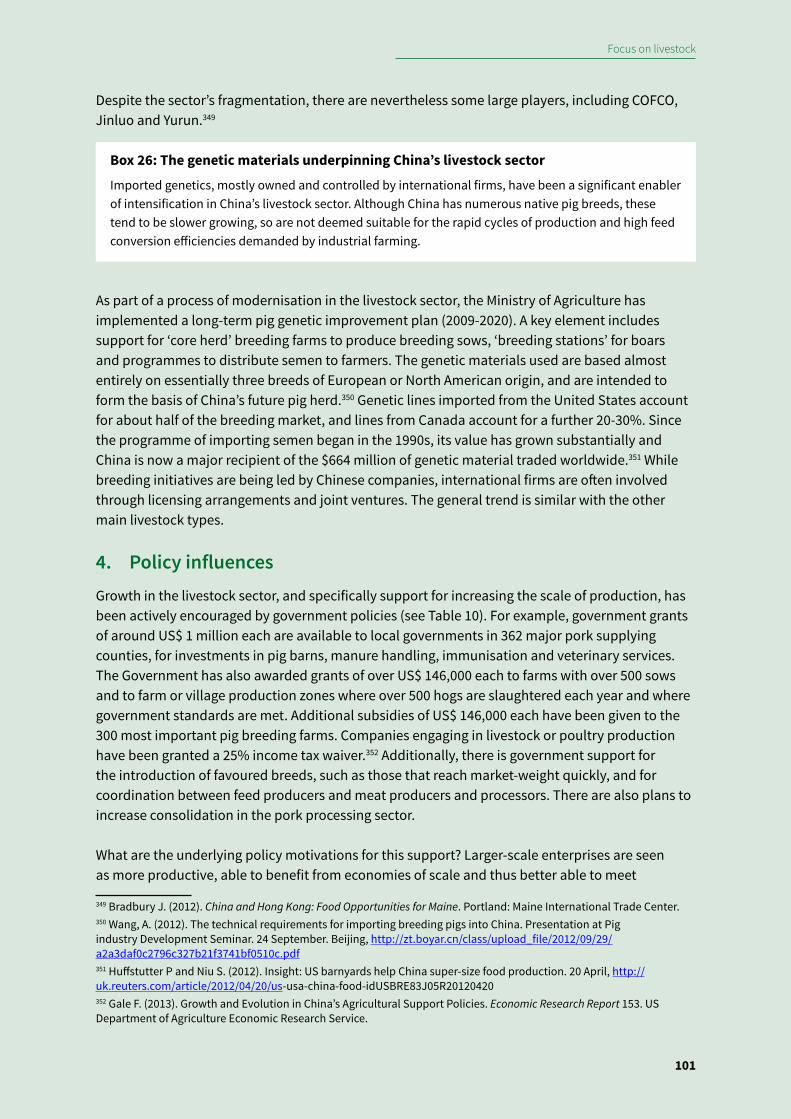
Focus on livestock
101
Despite the sector’s fragmentation, there are nevertheless some large players, including COFCO, Jinluo and Yurun.349
Box 26: The genetic materials underpinning China’s livestock sector
Imported genetics, mostly owned and controlled by international firms, have been a significant enabler of intensification in China’s livestock sector. Although China has numerous native pig breeds, these tend to be slower growing, so are not deemed suitable for the rapid cycles of production and high feed conversion efficiencies demanded by industrial farming.
As part of a process of modernisation in the livestock sector, the Ministry of Agriculture has implemented a long-term pig genetic improvement plan (2009-2020). A key element includes support for ‘core herd’ breeding farms to produce breeding sows, ‘breeding stations’ for boars and programmes to distribute semen to farmers. The genetic materials used are based almost entirely on essentially three breeds of European or North American origin, and are intended to form the basis of China’s future pig herd.350 Genetic lines imported from the United States account for about half of the breeding market, and lines from Canada account for a further 20-30%. Since the programme of importing semen began in the 1990s, its value has grown substantially and China is now a major recipient of the $664 million of genetic material traded worldwide.351 While breeding initiatives are being led by Chinese companies, international firms are often involved through licensing arrangements and joint ventures. The general trend is similar with the other main livestock types.
4. Policy influences Growth in the livestock sector, and specifically support for increasing the scale of production, has been actively encouraged by government policies (see Table 10). For example, government grants of around US$ 1 million each are available to local governments in 362 major pork supplying counties, for investments in pig barns, manure handling, immunisation and veterinary services. The Government has also awarded grants of over US$ 146,000 each to farms with over 500 sows and to farm or village production zones where over 500 hogs are slaughtered each year and where government standards are met. Additional subsidies of US$ 146,000 each have been given to the 300 most important pig breeding farms. Companies engaging in livestock or poultry production have been granted a 25% income tax waiver.352 Additionally, there is government support for the introduction of favoured breeds, such as those that reach market-weight quickly, and for coordination between feed producers and meat producers and processors. There are also plans to increase consolidation in the pork processing sector.
What are the underlying policy motivations for this support? Larger-scale enterprises are seen as more productive, able to benefit from economies of scale and thus better able to meet
349 Bradbury J. (2012). China and Hong Kong: Food Opportunities for Maine. Portland: Maine International Trade Center. 350 Wang, A. (2012). The technical requirements for importing breeding pigs into China. Presentation at Pig industry Development Seminar. 24 September. Beijing, http://zt.boyar.cn/class/upload_file/2012/09/29/a2a3daf0c2796c327b21f3741bf0510c.pdf351 Huffstutter P and Niu S. (2012). Insight: US barnyards help China super-size food production. 20 April, http://uk.reuters.com/article/2012/04/20/us-usa-china-food-idUSBRE83J05R20120420352 Gale F. (2013). Growth and Evolution in China’s Agricultural Support Policies. Economic Research Report 153. US Department of Agriculture Economic Research Service.
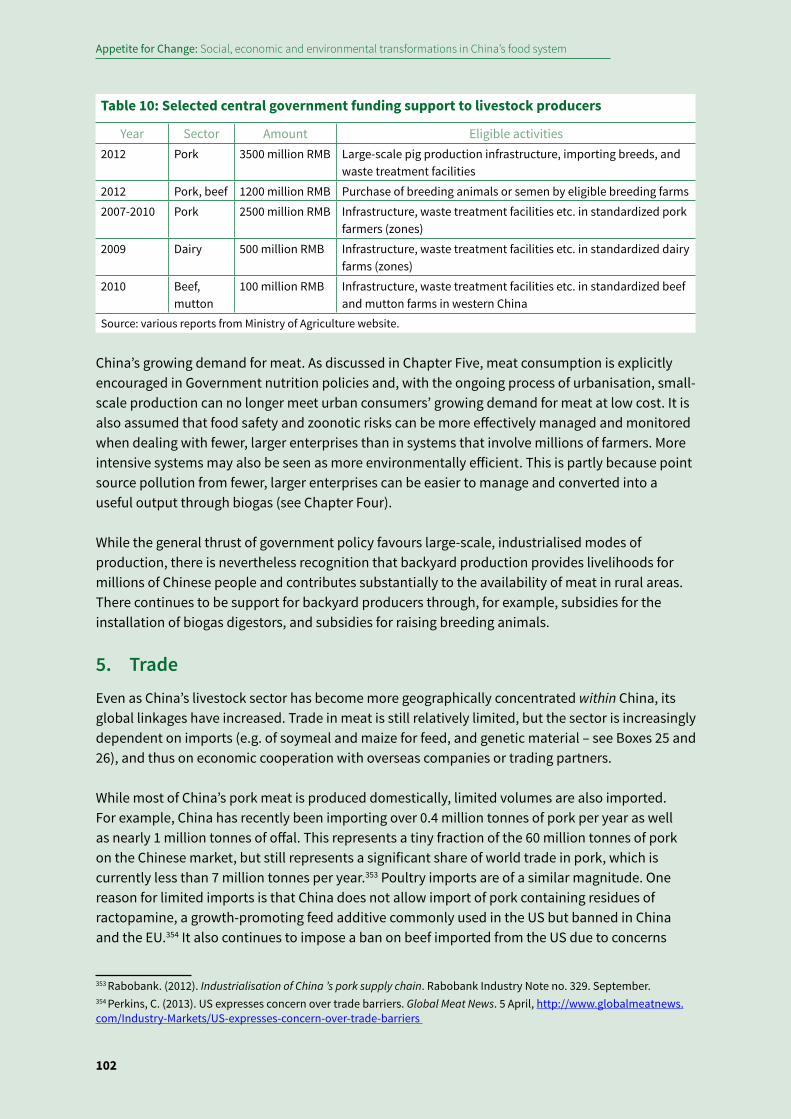
Appetite for Change: Social, economic and environmental transformations in China’s food system
102
China’s growing demand for meat. As discussed in Chapter Five, meat consumption is explicitly encouraged in Government nutrition policies and, with the ongoing process of urbanisation, small-scale production can no longer meet urban consumers’ growing demand for meat at low cost. It is also assumed that food safety and zoonotic risks can be more effectively managed and monitored when dealing with fewer, larger enterprises than in systems that involve millions of farmers. More intensive systems may also be seen as more environmentally efficient. This is partly because point source pollution from fewer, larger enterprises can be easier to manage and converted into a useful output through biogas (see Chapter Four).
While the general thrust of government policy favours large-scale, industrialised modes of production, there is nevertheless recognition that backyard production provides livelihoods for millions of Chinese people and contributes substantially to the availability of meat in rural areas. There continues to be support for backyard producers through, for example, subsidies for the installation of biogas digestors, and subsidies for raising breeding animals.
5. TradeEven as China’s livestock sector has become more geographically concentrated within China, its global linkages have increased. Trade in meat is still relatively limited, but the sector is increasingly dependent on imports (e.g. of soymeal and maize for feed, and genetic material – see Boxes 25 and 26), and thus on economic cooperation with overseas companies or trading partners.
While most of China’s pork meat is produced domestically, limited volumes are also imported. For example, China has recently been importing over 0.4 million tonnes of pork per year as well as nearly 1 million tonnes of offal. This represents a tiny fraction of the 60 million tonnes of pork on the Chinese market, but still represents a significant share of world trade in pork, which is currently less than 7 million tonnes per year.353 Poultry imports are of a similar magnitude. One reason for limited imports is that China does not allow import of pork containing residues of ractopamine, a growth-promoting feed additive commonly used in the US but banned in China and the EU.354 It also continues to impose a ban on beef imported from the US due to concerns
353 Rabobank. (2012). Industrialisation of China ’s pork supply chain. Rabobank Industry Note no. 329. September. 354 Perkins, C. (2013). US expresses concern over trade barriers. Global Meat News. 5 April, http://www.globalmeatnews.com/Industry-Markets/US-expresses-concern-over-trade-barriers
Table 10: Selected central government funding support to livestock producers
Year Sector Amount Eligible activities2012 Pork 3500 million RMB Large-scale pig production infrastructure, importing breeds, and
waste treatment facilities2012 Pork, beef 1200 million RMB Purchase of breeding animals or semen by eligible breeding farms2007-2010 Pork 2500 million RMB Infrastructure, waste treatment facilities etc. in standardized pork
farmers (zones)2009 Dairy 500 million RMB Infrastructure, waste treatment facilities etc. in standardized dairy
farms (zones)2010 Beef,
mutton100 million RMB Infrastructure, waste treatment facilities etc. in standardized beef
and mutton farms in western ChinaSource: various reports from Ministry of Agriculture website.
Focus on livestock
103
about bovine spongiform encephalitis.355 Meat exports from China are minimal, largely because domestic demand is more than sufficient to absorb domestic supply, but Chinese exports to some countries are also constrained by non-tariff barriers around food safety.356 Despite a recent high profile takeover of a major US pork producer by a Chinese meat processing firm,357 in general analysis concurs that China’s net trade in meat is not likely to change in the foreseeable future,358 because there is room for improving productivity in the domestic pork sector and because consumers mostly prefer fresh rather than frozen meat.
The offal market is interesting in relation to China. In western Europe consumption of offal has been steadily declining, so markets overseas are sought. China is a major importer of products such as chicken feet and wings, and the UK government has recently secured an US$ 82 million deal to supply pork to China, mainly in the form of offal, ears, tails and other by-products. Other European countries also export these parts to China: Germany, Spain and France each send about US$ 108-122 million of pork a year and, Denmark, the largest exporter, sends US$ 257m worth.359
One exception to the current prevalence of general self-sufficiency in the meat sector is beef. While the beef sector is minor as compared with pork and poultry – production is about 6.5 million tonnes as compared with pork’s 60 million360 – demand is growing. Imports are mainly of high-end beef products.361 Production within China has remained static due to high input costs, disease risks and the long production cycle,362 although there has been some investment in large-scale, vertically integrated production.363
Box 27: Livestock and feed inputs: focus on soy and maize
The view that China is more or less self-sufficient in meat is a misperception, since the feed inputs on which it depends rely to a significant extent on land and production overseas. A growing share of this animal feed is already imported, and demand for feed grain in China is set to grow from 36% of total grain use to 41% of an overall larger share by 2020 (Figure 31).
Soy: In the 1990s, soy imports were negligible, but by 2012 imports accounted for 80% of China’s soy consumption. Around 60 million tonnes were imported, accounting for about one third of animal feed
355 Lively T. (2013). Technical Trade Barriers Facing U.S. Meat Exports. Choices: The magazine of food, farm and resource issues. First Quarter, http://www.choicesmagazine.org/choices-magazine/theme-articles/emerging-issues-in-global-animal-product-trade/technical-trade-barriers-facing-us-meat-exports 356 Stuart B W and Fritz R G. (2013). China’s Impact on U.S. Poultry and Livestock Sectors. Choices: The magazine of food, farm and resource issues. First Quarter, http://www.choicesmagazine.org/choices-magazine/theme-articles/emerging-issues-in-global-animal-product-trade/theme-overview-emerging-issues-in-global-animal-product-trade 357 Thomas D and Oran O. (2013). China’s appetite for pork spurs $4.7 billion Smithfield deal. Reuters. 29 May, http://www.reuters.com/article/2013/05/29/us-shuanghui-idUSBRE94S0K920130529358 OECD and FAO. (2011). OECD-FAO Agricultural Outlook 2011-2020. Paris: OECD Publishing and FAO.359 Kollewe J. (2012). Selling porkies: Boost for UK exports as Chinese pig out. The Guardian. 18 May, http://www.theguardian.com/business/2012/may/18/uk-pork-deal-china 360 Wang M. (2013). Inside China’s beef and sheep market. Institute of Agricultural Economics and Development, Chinese Academy of Agricultural Sciences presentation. 19 June. York, England.361 Rabobank. (2012). Beef Quarterly. Q4, http://www.rabobank.com.au/Research/Documents/Reports/Rabobank_Beef_Quarterly_Q4_2012.pdf 362 Wang M. (2013). Inside China’s beef and sheep market. Institute of Agricultural Economics and Development, Chinese Academy of Agricultural Sciences presentation. 19 June. York, England.363 Rabobank. (2012). Beef Quarterly. Q4, http://www.rabobank.com.au/Research/Documents/Reports/Rabobank_Beef_Quarterly_Q4_2012.pdf
Appetite for Change: Social, economic and environmental transformations in China’s food system
104
consumed in China.364 China now accounts for 63% of all soybean trade, being the major destination for US, Brazilian and Argentinean exports, and China’s share of global soybean trade is likely to rise to more than 70% by 2020.365 This may increase the vulnerability of China’s feed industry to the effects of climate change in a number of supplying countries (see Section 3.2.1 in Chapter Three). Increasing use of soybeans in feed also increases the availability of vegetable oil, which is increasingly used in processed foods and has health implications discussed in Chapter Five.
Maize: Maize is another major input into the livestock sector. If current trends in China’s pork production and industrialisation continue, maize imports could approach 20 million tonnes per year in the coming five years.366 The extent to which China becomes a major maize importer will depend on four main factors: relative prices and subsidies; increases in Chinese domestic maize yields; improvements in the feed conversion efficiency of China’s livestock sector (and the extent to which consumption switches to more feed-efficient poultry and aquaculture products); and the level at which demand for meat peaks.
6. ConsumptionChapters Three and Five looked at historical trends in demand for animal products, as well as other foods, and highlighted the pace of growth in demand. One key question is the level at which demand for meat in China will peak. Several projections have been made (Figure 32), drawing on different data sets and modelling assumptions. Based on a baseline urban-rural average of 46.3 kg meat per person per year in 2010, projections by 2020 range between 57 kg367 and 78 kg per person.368 The different projections relate to differences in:
� The definition of meat (sometimes only pork and ruminant meat are modelled, sometimes poultry and eggs are included)
� Views on the extent to which demand for meat is slowing among affluent urban consumers � Views on the pace at which rural consumption will catch up with urban levels � The use of production- (carcass weight) or consumption-based figures.
364 FAPRI. (2012). World Agricultural Outlook 2012. Ames: Food and Agriculture Policy Research Institute, http://www.fapri.iastate.edu/outlook/2012/; USDA. (2013). Oilseeds: World markets and trade. USDA Foreign Agricultural Service. Circular Series FOP 08- 13.365 Brown-Lima C, Cooney M and Cleary D. (undated). An Overview of the Brazil-China Soybean Trade and its Strategic Implications for Conservation. Arlington: The Nature Conservancy.366 Rabobank. (2012). Industrialisation of China ’s pork supply chain. Rabobank Industry Note no. 329. September.367 OECD and FAO. (2013). OECD-FAO Agricultural Outlook 2013-2022. Paris: OECD Publishing and FAO.368 Masuda T and Goldsmith P. (2010). China’s meat consumption: an income elasticity analysis and long-term projections. Poster presented at Agricultural & Applied Economics Association Annual Meeting. 25-27 July. Colorado.
79 92
187 236
258 248
0
100
200
300
400
500
600
700
2010 2020
Food grains Feed grain Other uses
Mill
ion
tonn
es
Figure 31: Projected composition of grain use in China, 2010 and 2020
Source: National Development and Reform Commission. (2008). Medium and Long Term Plan for China’s Food Security. Beijing.
Focus on livestock
105
Milk and dairy products are excluded from all the projections, although beef is an important economic product for dairy enterprises.
The range of projections in demand for meat, milk and eggs creates uncertainties as to total future feed demand and associated import requirements for soy and maize,369 which will also be determined by future gains in feed conversion efficiency of the livestock sector. Past improvements have been modest, which may indicate significant room for improvement, or may signify the presence of major obstacles in the sector. The Twelfth Five-Year Plans for livestock development and feed industry development both mention improving feed resource use efficiency, indicating that the importance of the topic has been recognised.
7. Animal welfare7.1 Overview
To date, animal welfare has not received much attention within China. The general thrust of public and policy opinion sees animals as entities to be used to meet human needs and goals. This stance in turn reflects the major problems of poverty and hunger that China has experienced in recent decades, and the subsequent heavy emphasis on rapid industrialisation, economic growth and agricultural productivity as routes to achieving human development. However, as in the case of the environment, there are strands within the public and policy discourse indicating that the situation is changing, although slowly. This section considers how and why animal welfare concerns may start to grow in prominence. The discussion that follows begins with a broad overview of the welfare situation in China today (7.1), how this varies by farm system (7.2) and a summary of the key challenges (7.3). It then considers the policy landscape (7.4) as well as the actions taken by the food industry itself (7.5), and concludes with a discussion of influences that might push welfare considerations up the policy agenda in the coming years (7.6).
Box 28: Definitions of animal welfare
Definitions of welfare generally include the requirement not only that animals are in good health, but also that they are somehow experiencing a ‘life worth living’. Achieving this two-fold health-plus-wellbeing definition of welfare requires that: (i) animals are healthy; (ii) unpleasant affective states such as fear, pain and frustration are avoided or minimised; and (iii) animals can live in ways that suit their natural adaptations, including being able to carry out types of behaviour that they are strongly motivated to perform. These elements are present, for example, in the “Five Freedoms” of
369 Norse D, Lu Y and Huang J. (2014). China’s food security: Is it a national, regional or global issue? In K Brown (ed). China and the EU in Context. London: Palgrave.
31% 49%
79%
0
20
40
60
80
100
120
2010
(NBS
)
2020
(OEC
D-FA
O 2
013)
2020
(CCA
P)
2020
(Mas
uda
&Go
ldsm
ith, 2
010)
mill
ion
tonn
es
Figure 32: Projections of total meat consumption in China in 2020 compared to 2010 consumption data (and % change)
Source: figure based on data reviewed in Norse D, Lu Y and Huang J. (2014). China’s food security: Is it a national, regional or global issue? In K Brown (ed). China and the EU in Context. London: Palgrave; OECD and FAO. (2013). OEC-FAO Agricultural Outlook 2013-2022. Paris: OECD Publishing and FAO.
Appetite for Change: Social, economic and environmental transformations in China’s food system
106
the United Kingdom’s Farm Animal Welfare Council,370 and in the definition of animal welfare of the World Organisation for Animal Health.371 Disagreements about animal welfare often arise because different people emphasise these different elements to different degrees. For example, farmers who keep hens in small cages may emphasise the hygiene and control of parasites that cages allow (good health), while critics may point to the frustration that arises because the cages severely limit the birds’ behaviour (wellbeing).
The ‘good health’ aspect of animal welfare is generally uncontested since there is a clear economic case to be made for keeping animals healthy: healthy animals are more productive. However the arguments for ensuring ‘quality of life’ go beyond the instrumental – they are partly normative and therefore subject to more disagreement. In high income countries, the principle that animal welfare is desirable and a good in itself is fairly prevalent; this is much less evident in low income or rapidly industrialising countries where, importantly, good welfare for humans has not yet been achieved. In these contexts a better standard of human living is considered to be the priority, with greater access to affordable animal-source foods an important component of this. Animal welfare may often be dismissed as a rich world luxury, although this sometimes reflects lack of awareness of the benefits that better welfare in animals can bring to humans.
In China, the attitudes of consumers, farmers, and politicians to animal welfare are culturally different from the western view.372 There is a sense, among those concerned about welfare in China, that China needs to develop its own conceptualisation of what constitutes good welfare, one that achieves an acceptable balance between human development and the wellbeing of animals.
Source: Garnett T and Godfray C. (2012). Sustainable intensification in agriculture Navigating a course through competing food system priorities. Oxford: Food Climate Research Network and the Oxford Martin Programme on the Future of Food, University of Oxford.
7.2 Animal welfare in different farm systems in China
While no comprehensive overview exists on the current status of farm animal welfare in China, Bright (2013) observes that the welfare of farm animals in China is highly variable and largely dependent on the system that is being operated, the genetics being used and the level of husbandry or management.373
Pastoral systems: The welfare challenges of grassland-based livestock systems are primarily related to health management. Pastoral areas are some of the poorest parts of China and access to veterinary knowledge and medicines can be limited.374 Land degradation (see Box 14) leads to poor yields, and adequate feed for livestock can be an issue. While the majority of livestock breeds tend to be well adapted to their environment, it has become increasingly common in recent years to introduce commercial breeds of beef and dairy cattle.375 Because these animals require large amounts of feed to meet their energy requirements, and usually more careful management in
370 Farm Animal Welfare Council. (2009). Five Freedoms, http://www.fawc.org.uk/freedoms.htm371 OIE. (2011). Article 7.1.2. in ‘Introduction to the recommendations for animal welfare’, Chapter 7.1 in Terrestrial Animal Health Code, http://www.oie.int/index.php?id=169&L=0&htmfile=chapitre_1.7.1.htm372 Nielsen B L and Zhao R. (2012). Farm animal welfare across borders: A vision for the future. Animal Frontiers, (2)3: 46-50.373 Bright A. (2013). Animal welfare in China. Report for FCRN produced by FAI.374 Bright A. (2013). Animal welfare in China. Report for FCRN produced by FAI.375 Bright A. (2013). Animal welfare in China. Report for FCRN produced by FAI.
Focus on livestock
107
comparison with local breeds, the animals may be malnourished and under-productive relative to their genetic potential, meaning poorer welfare for the animal and sub-optimal profits for the farmer.
Backyard production: Backyard farming systems are characterised by feeding of food scraps and other agricultural by-products. In general, animals are kept without confinement or mutilations (tail docking or beak trimming) and have adequate space to perform species-specific behaviours. Primarily because of the mode of feeding, the breeds tend to be traditional or local (pigs or chicken) or dual purpose (cattle or chicken) and well adapted to the local environment. The welfare challenges in these systems are mainly related to health and disease control, either because veterinary services are lacking or because smallholders cannot afford to pay for them.376 Failure to control diseases has implications not only for the welfare of animals but also for farmer livelihoods and public health. Diseases reduce farm animal productivity – thereby reducing farmer incomes – and may also be transferred to human populations, causing diseases at a local or indeed global epidemic level, as has been seen in the recent past.
Small-medium family farms: These farms typically house between 10-200 pigs (or sheep or cattle) or 50-2,000 poultry plus cropping. Family farms are characterised by use of family labour, low cost buildings, and feed predominantly sourced from crops grown on farm or from nearby villages. The density of animals is usually low, although confinement in sow crates, farrowing crates or cages can be common, as are mutilations such as tail docking and teeth clipping. A wide range of breeds are used in these farms, from traditional/local and dual purpose through to standard commercial breeds. The latter can pose welfare concerns, because the types and amounts of feed typical for traditional breeds are often not sufficient for fast-growing/high-yielding commercial varieties. Health and disease control are also an issue for small-medium family farms, although this depends on the location of the village and the veterinary expertise in the area. The largest variation in welfare, buildings and equipment is seen on family farms.377
Large-scale or intensive farms: These are characterised by their species specificity, high cost buildings and relatively small site land base, which requires large amounts of bought-in feed. These operations tend to follow the western model in terms of breeds, nutrition, feed delivery, high density housing (i.e., cages for laying hens, and slats and crates for pigs) and resulting management and husbandry practices such as beak trimming for laying hens and tail docking for pigs. Welfare challenges in these systems largely relate to the restriction of space and mutilations. Mortality can also be an issue because individual care is more difficult with large numbers of animals. However, basic health care tends to be better than in backyard or family farms because there is often a veterinarian dedicated to the site. Logistically, it is also easier to manage vaccination protocols and biosecurity, although observers note a general lack of understanding as to the potential disease implications of having large numbers of animals in one place.378
Large-scale, intensive farms are set to increasingly dominate livestock production in coming years. From a welfare perspective, this development brings both potential benefits and risks. On the one hand, with large numbers of animals owned by the same company and potentially entering the
376 Bright A. (2013). Animal welfare in China. Report for FCRN produced by FAI.377 Bright A. (2013). Animal welfare in China. Report for FCRN produced by FAI.378 Bright A. (2013). Animal welfare in China. Report for FCRN produced by FAI.
Appetite for Change: Social, economic and environmental transformations in China’s food system
108
same retail chain, there is scope for engaging with individual companies in ways that can drive major improvements in their welfare practices during transport and slaughter. Large-scale farms that supply large retailers and food businesses tend to have better standards for transport and slaughter than those of backyard and family farms. On the other hand, where there are welfare failures, the impact of that poor welfare has implications for a large number of animals. This is also the case for disease outbreaks where the effects can have global repercussions.
Box 29: Large-scale or small-scale?: implications for disease risks
As China’s livestock sector shifts towards larger, more intensive production units, two questions arise: Do larger-scale, more intensive livestock units increase or reduce the risk of zoonotic disease transmission? And how do these diseases impact upon human health?
Epidemic diseases tend to grab media headlines, and well known outbreaks in recent years include HPAI H5N1 (avian influenza) and swine flu. Diseases can be passed from one livestock system to another, and the greatest risks of disease outbreak are likely to occur in situations where smallholders and commercial units coexist. For example, it has been suggested that intensive broiler poultry systems may have played a major role in the ‘seeding’ of avian influenza. This virus probably originated from close contact with poultry reared domestically and in small farms in Asia. However, for the disease to spread and affect large numbers, more sizeable holdings needed to be infected, with the considerable movement of people, live animals and feed between small commercial-scale holdings promoting the secondary spread of infection.379 In large-scale Chinese livestock units, the combination of inadequate management and veterinary care, high livestock densities and suboptimal animal health and welfare, together with the increasingly long distances that livestock travel, suggests that the scaling up of livestock production in China may increase the risk of zoonotic disease transmission in the foreseeable future.
The heavy use of antimicrobials is a common response to the high-density conditions under which animals are raised: the higher the animal numbers and the closer their proximity to one another, the greater the risk that diseases will spread from one animal to another. However, there is already evidence that the heavy use of antimicrobials in Chinese livestock production is leading to the development of antimicrobial-resistant strains of salmonella and E. coli in poultry and pork products,380 with concomitant health risks.381
In addition to epidemic zoonosis, endemic diseases can arise in both small- and large-scale operations. As well as directly affecting animals – and farmer livelihoods –, the resulting human health impacts can be a significant burden, particularly in poor areas, where farmers often live in close contact with livestock.
379 Slingenbergh J, Gilbert M, Balogh K de and Wint W. (2004). Ecological sources of zoonotic diseases. Revue scientifique et technique-Office international des épizooties, (23)2: 467-484.380 Lu L, Dai L, Wang Y, Wu C, Chen X, Li L, Qi Y, Xia L and Shen J. (2010). Characterization of antimicrobial resistance and integrons among Escherichia coli isolated from animal farms in Eastern China. Acta Tropica, (113)1: 20-25; He Y, Lin L, Jahangir M, Shinoda S, Miyoshi S and Lei S. (2010). Prevalence and antimicrobial resistance of Salmonella in retail foods in northern China. International Journal of Food Microbiology, (143)3: 230-234; Jian H, Lu D, Chen Z, Wang X, Chen J, Liu Y, Liao X, Liu J and Zeng Z. (2011). High prevalence and widespread distribution of multi-resistant Escherichia coli isolates in pigs and poultry in China. The Veterinary Journal, (187)1: 99-103.381 See FORHEAD (2014). Food Safety in China: Problems, Research and Governance. www.forhead.org.

Focus on livestock
109
7.3 Key welfare challenges
As China’s livestock sector develops, four main sets of problems are likely to dominate. First, the pace of growth in the livestock sector outstrips the availability of veterinary services. There are 700,000 vets and paravets in China, equating to 1 vet per km2, as compared with, for example, 8.3 vets per km2 in the Netherlands.382 There are also about 645,000 village-based animal disease prevention workers paid by the government. Only about 10% of university vet graduates actually work as vets because the pay is poor and most make higher incomes from the sale of drugs or feed. Thus, despite the high levels of higher training, the supply of vets is not in keeping with the need on the ground. While most large farms employ a dedicated vet (often contracted from overseas), smaller farms are reliant on public vets.383 The insufficiency of veterinary care not only impacts animal health and welfare, but also productivity. Lack of veterinary expertise is compounded by poor access to medicines and the use of cheaper counterfeit or diluted medicines.
A second set of welfare problems arises from a mismatch between the genetics of the farm animal and the environment provided. Where imported high-yielding breeds are used in large-scale production systems, these need to be accompanied by good nutrition management and good husbandry. Animal welfare commentators are concerned, however, that implementation in both respects can be poor, leading to productivity losses as well as heightened disease risks. Often imported western breeds are raised on feeds and in housing conditions that, due to lack of resources, are of a lower quality than those generally found in Europe and the US. These animals therefore tend to be sub-optimally productive (undermining both cost and environmental goals) and have poor welfare. On the other hand, native Chinese breeds are often raised using nutrition standards developed in the US, and their genetic selection is based on criteria developed for fast-growing western breeds. This again causes a mismatch between the genotype and its environment and, ultimately, the irreversible change of the breed characteristics of the native Chinese breeds, with eventual loss of genetic resources.384
Third, the shift towards large-scale, confined systems based on the use of highly productive breeds presents a set of welfare challenges. Conventional cages, sow crates, farrowing crates and high stocking densities are all increasingly common. This shift towards confined systems is promoted at all governmental levels, since it is seen as a key route to achieving rapid growth in production and resource use efficiency, and improving governance of the sector. However, these systems can have negative impacts on both the ‘health’ and ‘wellbeing’ sides of the welfare equation – both of which can actually undermine productivity – particularly when, as is often the case, the quality of management is poor. Experience from developed countries shows that genetic selection for very high productivity can reduce health in a number of ways (e.g., increasing risk of osteoporosis in
382 Kouba V. (2005). Public service veterinarians worldwide: a quantitative analysis. Acta Veterinaria Brno 74: 455-461.383 Hoste R, Hu D and Tolkamp J. (2013). Investment and export opportunities in a sustainable pig supply chain in China. LEI report 2013-018. Wageningen: Wageningen University.384 Nielsen B L and Zhao R. (2012). Farm animal welfare across borders: A vision for the future. Animal Frontiers, (2)3: 46-50.
Appetite for Change: Social, economic and environmental transformations in China’s food system
110
hens385 and metabolic disorders in dairy cows).386 Keeping animals in restricted spaces in order to cut costs can also be detrimental to basic health.387 Taken together, these health problems can undermine productivity and shorten life span. Moving from ‘health’ to ‘wellbeing’, confinement often involves severe restriction of movement and behaviour, and this can lead to stress responses and frustration.388 Mutilations such as trimmed beaks, docked tails and clipped teeth are painful operations and also impede animals’ ability to perform natural behaviours.
A fourth set of welfare concerns arise beyond the farm gate. Consumers have a preference for fresh rather than frozen meat. This eating preference has led to the transport of live animal to markets. Transport, market housing facilities and slaughter are the major welfare concerns in these instances. While some standards and requirements concerning these conditions – technical standards specified by the World Organisation for Animal Health (OIE), for example – have been adopted, enforcement is lacking. Animals raised in backyard, small to medium family farms and pastoral farming systems may be transported for many hours, while a truck collects animals from multiple villages, without protection from the environment. These animals are also more likely to be slaughtered at local abattoirs where facilities can be rudimentary and slaughtering is carried out without prior stunning.389
7.4 Policy activity on animal welfare
The key policy influencing animal welfare – if unintentionally – is the explicit government emphasis on scaling up and modernising the livestock sector. While these policy goals are not designed with welfare in mind, they have substantial implications for welfare – both negative and (potentially) positive. Large-scale production per se is not incompatible with good welfare, and indeed in well managed systems livestock can benefit from specialist care and knowledge. However, the current way in which scaling up is occurring today – through a combination of productive breeds, very confined conditions, and the practice of mutilations and sometimes inappropriate feeding regimes – is causing a number of welfare problems. Food safety, by contrast, ranks orders of magnitude higher on the scale of policy concerns, and welfare is unlikely to be considered a priority concern until food safety issues are addressed. Given the synergies between food safety and decent welfare, there is significant scope for improving both at the same time.
385 Whitehead C. (2004). Overview of bone biology in the egg-laying hen. Poultry Science, (83): 193-199; Webster A. (2004). Welfare implications of avian osteoporosis. Poultry Science, (83): 184-192; Lay D, Fulton M, Hester P, Karcher D, Kjaer J, Mench J, Mullens B, Newberry R, Nicol C, O’Sullivan N and Porter R. (2011). Hen welfare in different housing systems. Poultry Science, (90): 278-294.386 Erb H, Smith R, Oltenacu P, Guard C, Hillman R, Powers P, Smith M and White M. (1985). Path model of reproductive disorders and performance, milk fever, mastitis, milk yield and culling in Holstein cows. Journal of Dairy Science, (68): 3337–3349; Stengärde L, Hultgren J, Tråvén M, Holtenius K and Emanuelson U. (2011). Risk factors for displaced abomasum or ketosis in Swedish dairy herds. Preventive Veterinary Medicine, (99): 136–147.387 Adams A and Craig J. (1985). Effect of crowding and cage shape on productivity and profitability of caged layers: A survey. Poultry Science, (64): 238-242.388 Duncan I. (1970). Frustration in the fowl. In B Freeman and R Gordon (eds). Aspects of Poultry Behaviour. Edinburgh: British Poultry Science. pp. 15-31; Dawkins M. (2008). The science of animal suffering. Ethology, (114): 937-945; Fraser D. (2008). Understanding Animal Welfare: The Science in its Cultural Context. Oxford: Wiley-Blackwell.389 Bright A. (2013). Animal welfare in China. Report for FCRN produced by FAI.

Focus on livestock
111
The current low priority accorded to animal welfare is reflected in a lack of relevant regulation. Li (2006)390 identifies around 70 laws and government ordinances that relate in some way to animal welfare, but notes that most only touch on the issue or are expressed in very vague terms. Few of these laws cover farm animals, focusing instead on endangered wild species or laboratory animals. While existing laws may prohibit the killing of certain animals (for instance, in the case of illegal hunting), they have nothing to say about cruelty.
In 2009 a group of legal experts developed a draft Animal Welfare Law in response to this gap. The draft law mainly outlines guidelines for disease prevention and medical care for animals across the spectrum – wildlife, farm, companion, lab, and work animals. In its original form, the draft law outlawed the eating of cats and dogs, criminalised the torture and indiscriminate killing of animals, the feeding of zoo animals with live poultry, and some circus acts. The culling of dogs in periodic government-sponsored campaigns to eradicate rabies would also be outlawed. However, the draft was subsequently watered down in 2010 after public objections, which centred around the issue of dog and cat consumption, while views were also expressed that human welfare should take precedence over that of animals.391 At present the law remains a draft, and there is no indication of what the next steps might be.
In the absence of legislation, some ‘General Principles of Animal Welfare Assessment’ are due to come into effect in the near future. Launched by the Ministry of Agriculture and drafted by a panel of veterinarians, academics and meat and dairy industry experts, these non-compulsory guidelines represent a first step in introducing animal welfare into industry standards. They are largely targeted at the treatment and assessment of livestock.392 Government has also been directing more funding at improving welfare. These funds tend to support highly technical and technology-dependent approaches,393 a tendency prevalent not only in government but among those working within the livestock sector as a whole, including those working on animal welfare. By contrast, the EU favours outcomes-based indicators of welfare – that is, the emphasis is less on stipulating what techniques should be adopted and more on the desirable outcomes that should be sought, in the domains of housing, health and appropriate behaviour.394
7.5 Industry activities
Although legislation in animal welfare is largely weak or absent, observers note that some of the larger meat processors and retailers are starting to pay attention to animal welfare considerations. For example, the food industry is involved in developing voluntary standards in processing and transport in which there is some inclusion of welfare considerations. Some slaughterhouses
390 Li P. (2006). The evolving animal rights and welfare debate in China: political and social impact analysis. In J Turner and J D’Silva (eds). Animals, ethics and trade – The challenge of animal sentience. London: Earthscan. pp. 112-128.391 Unknown. (2010). Proposed animal welfare law watered down. 26 January, http://www.china.org.cn/china/2010-01/26/content_19309286.htm; Wedderburn P. (2009). China unveils first ever animal cruelty legislation. 18 September, http://blogs.telegraph.co.uk/news/peterwedderburn/100010449/china-unveils-first-ever-animal-cruelty-legislation/392 China Daily. (2012). Rules promote livestock rights. 20 November, http://www.china.org.cn/china/2012-11/20/content_27168863.htm 393 Gu X and Hao Y. (2011). Presentation at FCRN China UK livestock seminar. July.394 Welfare Quality. (undated). Factsheets: Principles and criteria of good Animal Welfare; Towards a Welfare Quality® Assessment System; The Overall On-farm Animal Welfare Score, http://www.welfarequality.net/everyone/41858/5/0/22
Appetite for Change: Social, economic and environmental transformations in China’s food system
112
operating under retailer specifications (e.g., for supermarkets such as Carrefour) are required to meet standards similar to those found in the US and Europe.
Auditing of these standards is rare, however, and reality does not necessarily match up to theory. Nevertheless progress is being made in some quarters. For example, individual processors such as Yurun have taken active steps to improve welfare conditions at slaughter: the company has received training on humane slaughter by the international animal welfare NGO, the World Society for Protection of Animals (WSPA). One benefit of this has been reported improvements in meat quality as a result of the training.395
These actions may be motivated by a number of considerations. For example, companies may have an eye to export markets, to particular domestic value chains with higher requirements (e.g., organic or free range product value chains), or to the future evolution of domestic opinion. Humane slaughtering methods generally produce more tender, better quality meat, an advantage that links quality with welfare. Some retailers are also starting to recognise the links between food safety and good welfare, and see welfare improvements as part of a risk-proofing strategy.
7.6 Influences on the evolution of the welfare agenda in China
This section examines potential influences on future attitudes to animal welfare. The issue of food safety emerges, interestingly, as both a hindrance and an aide to progress on welfare.
Food safety: In contrast to animal welfare, food safety is a widespread issue that receives significant attention from consumers and a range of other stakeholders. Food safety concerns are likely to override all other considerations at present, including those that pertain to the environment or animal welfare. Yet, food safety, animal health and animal wellbeing are closely connected. For example, better welfare can reduce stress-induced immunosuppression, and reduce the incidence of infectious disease on farms and the shedding of human pathogens by farm animals. These benefits can reduce the need for antibiotics, which in turn lowers the risk of antibiotic resistance.396 Poor welfare can lead to increased risks to consumers from common food-borne infections like salmonella, campylobacter and E. coli.397 Poor handling and high stress levels can also reduce meat quality.398 Most importantly, better recognition of these links by the food industry is likely to see welfare viewed as compatible with long-term profitability, rather than as an additional or unnecessary financial burden.
Development of supply chains: Driven in part by food safety concerns, and partly by economic imperatives, changes in livestock supply chain relationships are increasingly driven by quality management considerations.399 Firms that have quality management systems in place tend to be
395 FAI. (2013). Pig production in China: An overview of changes and opportunities to introduce higher animal welfare. Oxford: FAI Farms Ltd, UK.396 De Passillé A and Rushen J. (2005). Food safety and environmental issues in animal welfare. Revue scientifique et technique-Office international des épizooties, (24)2: 757-766.397 European Food Safety Authority. (undated). Animal welfare, http://www.efsa.europa.eu/en/topics/topic/animalwelfare.htm398 Voogd E. (2009). Does animal welfare affect food safety? Food Safety Magazine. February-March, http://www.foodsafetymagazine.com/magazine-archive1/februarymarch-2009/does-animal-welfare-affect-food-safety/ 399 Han J. (2009). Supply Chain Integration, Quality Management and Firm Performance in the Pork Processing Industry in China. Wageningen: Wageningen Academic Publishers.
Focus on dairy
113
more profitable than those that do not. These relationships suggest that firms seeking to build profitability and growth on product quality may be among the first to recognise the relationships between animal welfare, product quality and production costs. Lead firms, such as Yurun, are in a position to support changes in animal welfare practices further down their supply chains. In export-oriented firms, overseas requirements regarding animal welfare are likely to act as an incentive for firms to improve welfare in their own supply chains.
Public opinion and NGO activity: Animal welfare has not historically been a major concern for consumers in China. While active abuse is frowned upon, some observers note that ‘welfare’ is mostly conceived of as an ‘absence of cruelty’ rather than as a more encompassing concept that includes good health and quality of life.400 However, there are signs of change. Several opinion surveys indicate that Chinese citizens are becoming increasingly interested in animal welfare for reasons that go beyond self interest. Recent years have also seen a growth in the number of animal welfare-related organisations in China.
Most domestic NGOs tend to focus on wild animals, pets and laboratory animals, or on issues such as dog-meat eating. However, the focus of concern may broaden for a number of reasons, including rising wealth, and external influences – including the activities of international NGOs. Some of these are now working with domestic NGOs to raise the profile of farm animal welfare, organising international conferences in China, as well as working with individual companies on welfare training programmes. The World Society for the Protection of Animals (WSPA), for example, has signed an agreement with the Animal Health and Welfare Branch of the Chinese Veterinary Medical Association. Among other things, WSPA will help to develop animal welfare textbook material for Chinese veterinary students and practitioners and work with them to establish a comprehensive animal welfare education system. There is now a China Farm Animal website – a communication platform for relevant institutes, providing companies with free technical support and solutions from an animal welfare perspective. These initiatives are sowing the seeds for Chinese stakeholders to develop a concept of animal welfare that is meaningful in the Chinese context, and an accompanying road map that facilitates broader goals around food safety, improved nutrition, environmental sustainability and economic development.
400 Bright A. (2013). Animal welfare in China. Report for FCRN produced by FAI.
Appetite for Change: Social, economic and environmental transformations in China’s food system
114
Focus on dairy
China is the third largest dairy producer in the world, after the United States and India.401 Dairy foods are not traditionally consumed in most parts of China and yet their production and consumption are growing rapidly, spurred on by a combination of factors, including active government support and strong investment in and marketing of the sector by the industry. The evolution of the dairy industry encapsulates many of the intersecting changes that are taking place within China’s food system.
This Focus section looks at changes in both the production and consumption of dairy foods. It takes a look at the drivers underpinning the growth in dairy production and touches upon their implications for environment, the economy, health and society – issues that are addressed more fully in other chapters in this report. Section 1 provides an overview of trends in the volume and structure of production. Section 2 considers changes in the processing and import of dairy products, while Section 3 examines changes in consumption. Section 4 explores some of the drivers influencing all these changes, while the concluding section, 5, considers emerging issues for the sector.
1. Production overview1.1 Trends in output
Milk production in China now stands at between 33-42 million tonnes. In 1980 production was only 3-4% of that figure, at 1.36 million metric tonnes.402 Growth in milk output was very gradual between 1980 and the late 1990s; the pace of growth only started to escalate in the last 12-15 years (Figure 33). While growth has slowed slightly in recent years – due to the melamine crisis and the ensuing process of consolidation and restructuring in the industry – production and consumption continue to grow at rapid rates.403
Domestic producers are responsible for most of the milk and dairy supply in China; exports are negligible while imports (in the form of milk powder, yoghurt, cheese and other dairy products) stand at just less than 5.5 million tonnes,404 but can be significant for particular types of dairy product. Milk powder is the largest category of imports (Figure 34). In 2011 milk powder imports stood at 320 million tonnes compared with domestic production of 1100 million tonnes, contributing about 23% of domestic supply.405 Moreover, the volume of imports is likely to grow substantially in the short term, in part because domestic production is not able to keep pace with demand and in part reflecting public fears about the safety of Chinese dairy products.406
401 Qian G, Guo X, Guo J and Wu J. (2011). China’s dairy crisis: impacts, causes and policy implications for a sustainable dairy industry. International Journal of Sustainable Development and World Ecology, (18)5: 434-441.402 USDA. (2011). China: Dairy and Products Annual. GAIN report no. CH11048. Washington D.C.: USDA; FAO. (2011). FAOSTAT 2011, http://faostat.fao.org/site/569/DesktopDefault.aspx?PageID=569#ancor; Wang Q, Parsons R and Zhang G. (2010). China’s dairy markets: trends, disparities, and implications for trade. China Agricultural Economic Review, (2)3: 356-371.403 OECD and FAO. (2013). OECD-FAO Agricultural Outlook 2013-2022. Paris: OECD Publishing and FAO.404 FAOSTAT.405 USDA. (2012). Dairy and products Semi Annual. GAIN report no. CH12034. Washington D.C.: USDA.406 Rabobank. (2013). Dairy imports set to grow to meet Chinese appetite for milk. 14 October, https://www.rabobank.com/en/press/search/2013/20131014_Rabobank_Report_Dairy_imports_set_to_grow_to_meet_Chinese_appetite_for_milk.html
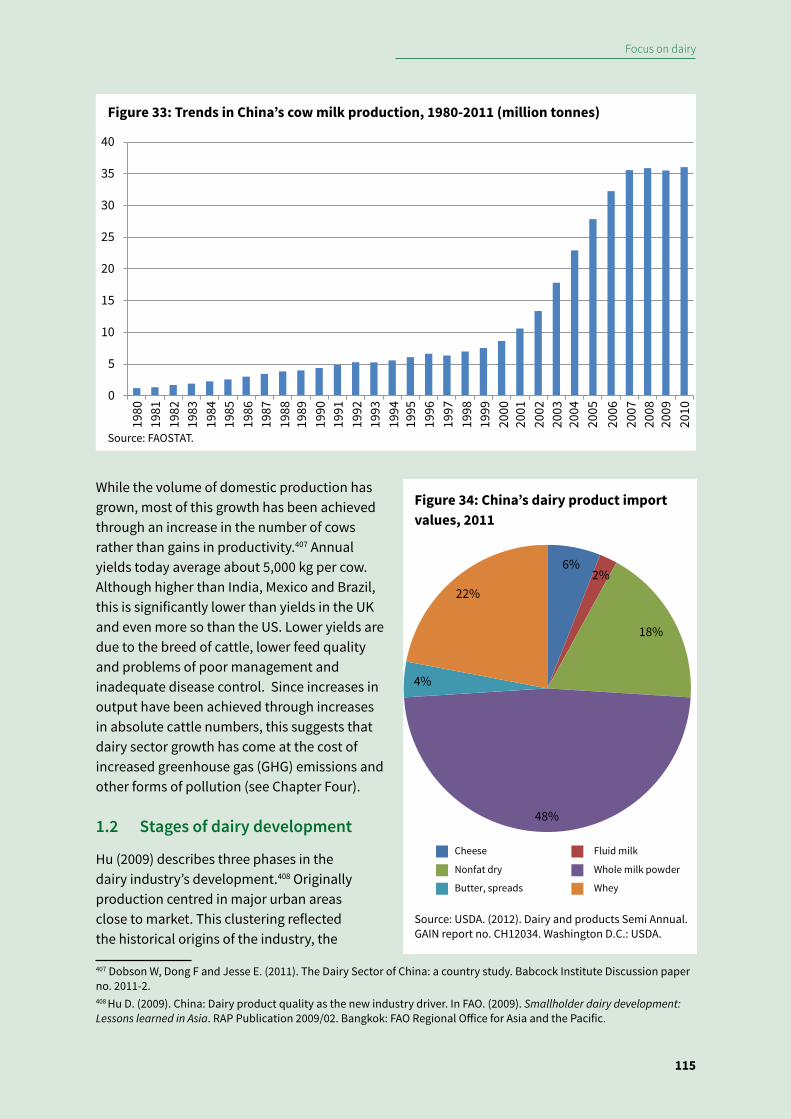
Focus on dairy
115
While the volume of domestic production has grown, most of this growth has been achieved through an increase in the number of cows rather than gains in productivity.407 Annual yields today average about 5,000 kg per cow. Although higher than India, Mexico and Brazil, this is significantly lower than yields in the UK and even more so than the US. Lower yields are due to the breed of cattle, lower feed quality and problems of poor management and inadequate disease control. Since increases in output have been achieved through increases in absolute cattle numbers, this suggests that dairy sector growth has come at the cost of increased greenhouse gas (GHG) emissions and other forms of pollution (see Chapter Four).
1.2 Stages of dairy development
Hu (2009) describes three phases in the dairy industry’s development.408 Originally production centred in major urban areas close to market. This clustering reflected the historical origins of the industry, the
407 Dobson W, Dong F and Jesse E. (2011). The Dairy Sector of China: a country study. Babcock Institute Discussion paper no. 2011-2.408 Hu D. (2009). China: Dairy product quality as the new industry driver. In FAO. (2009). Smallholder dairy development: Lessons learned in Asia. RAP Publication 2009/02. Bangkok: FAO Regional Office for Asia and the Pacific.
0
5
10
15
20
25
30
35
4019
8119
80
1982
1983
1984
1985
1986
1987
1988
1989
1990
1991
1992
1993
1994
1995
1996
1997
1998
1999
2000
2001
2002
2003
2004
2005
2006
2007
2008
2009
2010
Figure 33: Trends in China’s cow milk production, 1980-2011 (million tonnes)
Source: FAOSTAT.
6% 2%
18%
48%
4%
22%
Cheese Fluid milk
Nonfat dry Whole milk powder
Butter, spreads Whey
Figure 34: China’s dairy product import values, 2011
Source: USDA. (2012). Dairy and products Semi Annual. GAIN report no. CH12034. Washington D.C.: USDA.
Appetite for Change: Social, economic and environmental transformations in China’s food system
116
need to keep transport costs down and the lack of refrigeration infrastructure. However, as the market expanded in the 1980s, urban and peri-urban production proved insufficient to meet growing demand and the centre of production started to shift to northern China. Land in these areas was relatively more abundant, climatic conditions were more favourable, wages were low and government efforts were put in place to capitalise on these advantages through support for necessary infrastructure. Inner Mongolia is now the largest dairy producing region in China. However, this relocation posed logistical difficulties, chief of which was the question of how to get liquid milk to markets which were located in other regions (mainly in the more populous south east) in the absence of adequate refrigeration. Originally liquid milk was processed into milk powder but this product was perceived as being less healthful than fresh milk and was less popular. The problem was solved through investment in UHT processing equipment: UHT milk was seen as superior to powdered milk yet did not need refrigeration.
From the turn of the millennium, China’s dairy industry entered its third phase of development. This has been marked by a process of consolidation and scaling up, albeit from a continuing fragmented and small-scale base, as well as product diversification. China’s accession to the WTO and the lowering of tariff barriers brought in overseas companies keen to market their products in China, stimulating demand. Explicit policies have been in place since the mid-2000s to encourage these structural changes in the dairy sector, driven by goals to increase output and efficiency, reverse falling profitability, address price and supply volatility and improve quality, while also addressing some of the environmental problems caused by dairy production. Standardised dairy zones have been established with funding in place to construct roads and waste treatment facilities, and with criteria for manure management and emissions to water (see also Chapter Four).409
1.3 Systems of production
There are five official key dairy-producing regions in China. The largest cattle numbers are located in the grazing lands of the northeast, with Inner Mongolia alone producing 26% of milk output,410
although yields per cow are likely to be higher in the more industrialised systems that are located near large cities.
China’s dairy production sector has historically been dominated by small-scale producers, whether those rearing one or two cows in the backyard, or pastoralists in regions such as Inner Mongolia. This continues today but the situation is changing quite rapidly; in 2004, 57% of all cow numbers were reared in farms which kept 10 or fewer cows, but by 2008 that percentage had fallen to 43%. Although only 10% of all cows are reared in large farms of 500 head or more today, this nevertheless represents a doubling of the situation in 2004.411 Put another way, in 2008, 35% of 409 Hu D. (2009). China: Dairy product quality as the new industry driver. In FAO. (2009). Smallholder dairy development: Lessons learned in Asia. RAP Publication 2009/02. Bangkok: FAO Regional Office for Asia and the Pacific; State Council of the PRC. (2007). Opinion of the State Council on promoting the sustainable and healthy development of the dairy industry. 29 September, http://www.gov.cn/zwgk/2007-09/29/content_764942.htm. According to media reports, in 2010 CNY 3 billion was disbursed by central government for construction of standardised dairy zones and waste treatment in pig farms: Unknown. (2010). State invests 3 billion yuan to expand the scale of dairy cow and pig breeding zones. 22 March, http://www.52swine.com/xinwen/201011/10499.html; Ministry of Agriculture. (2008). Ministry of Agriculture issues notice on ‘Technical procedures for raw milk production (trial)’. 5 November, http://www.gov.cn/gzdt/2008-11/05/content_1140409.htm410 Dobson W, Dong F and Jesse E. (2011). The Dairy Sector of China: a country study. Babcock Institute Discussion paper no. 2011-2.411 Ma H, Liu W and Oxley L. (2012). Productivity growth and policy implications for china’s dairy farms, China Economic Policy Review, (1)1: 1250004. Data taken from China Dairy Statistical Yearbook 2005-2009.
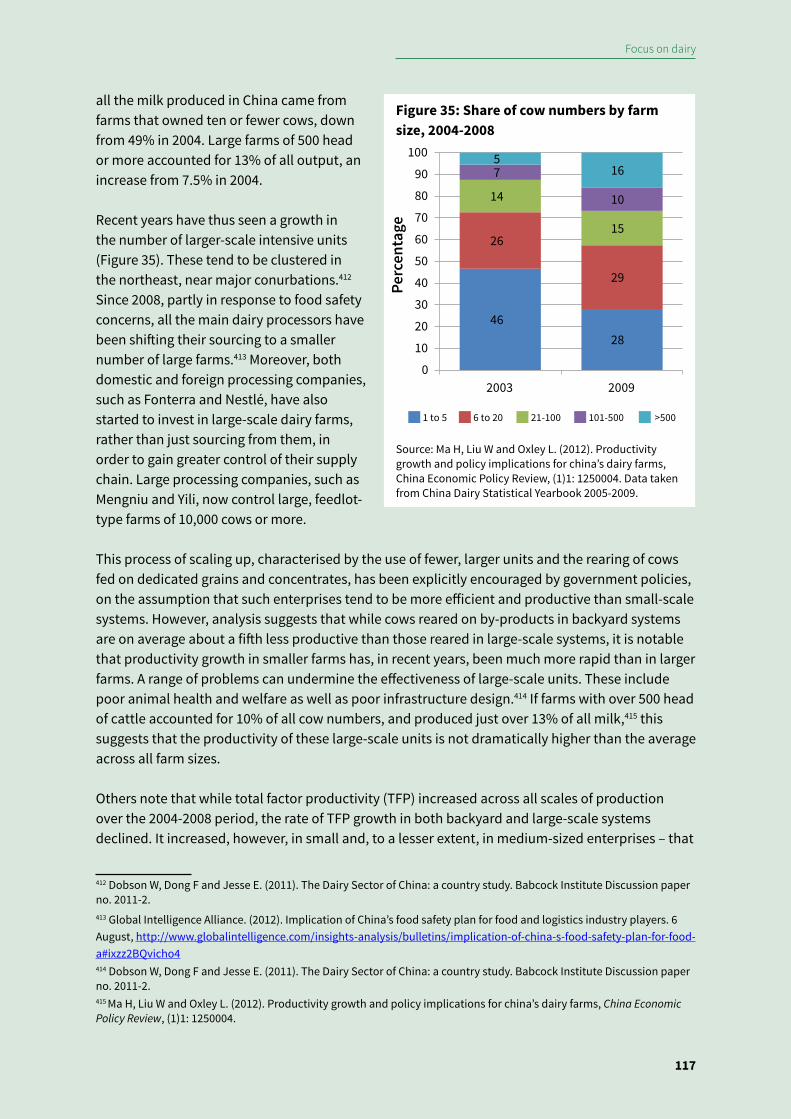
Focus on dairy
117
all the milk produced in China came from farms that owned ten or fewer cows, down from 49% in 2004. Large farms of 500 head or more accounted for 13% of all output, an increase from 7.5% in 2004.
Recent years have thus seen a growth in the number of larger-scale intensive units (Figure 35). These tend to be clustered in the northeast, near major conurbations.412 Since 2008, partly in response to food safety concerns, all the main dairy processors have been shifting their sourcing to a smaller number of large farms.413 Moreover, both domestic and foreign processing companies, such as Fonterra and Nestlé, have also started to invest in large-scale dairy farms, rather than just sourcing from them, in order to gain greater control of their supply chain. Large processing companies, such as Mengniu and Yili, now control large, feedlot-type farms of 10,000 cows or more.
This process of scaling up, characterised by the use of fewer, larger units and the rearing of cows fed on dedicated grains and concentrates, has been explicitly encouraged by government policies, on the assumption that such enterprises tend to be more efficient and productive than small-scale systems. However, analysis suggests that while cows reared on by-products in backyard systems are on average about a fifth less productive than those reared in large-scale systems, it is notable that productivity growth in smaller farms has, in recent years, been much more rapid than in larger farms. A range of problems can undermine the effectiveness of large-scale units. These include poor animal health and welfare as well as poor infrastructure design.414 If farms with over 500 head of cattle accounted for 10% of all cow numbers, and produced just over 13% of all milk,415 this suggests that the productivity of these large-scale units is not dramatically higher than the average across all farm sizes.
Others note that while total factor productivity (TFP) increased across all scales of production over the 2004-2008 period, the rate of TFP growth in both backyard and large-scale systems declined. It increased, however, in small and, to a lesser extent, in medium-sized enterprises – that
412 Dobson W, Dong F and Jesse E. (2011). The Dairy Sector of China: a country study. Babcock Institute Discussion paper no. 2011-2.413 Global Intelligence Alliance. (2012). Implication of China’s food safety plan for food and logistics industry players. 6 August, http://www.globalintelligence.com/insights-analysis/bulletins/implication-of-china-s-food-safety-plan-for-food-a#ixzz2BQvicho4414 Dobson W, Dong F and Jesse E. (2011). The Dairy Sector of China: a country study. Babcock Institute Discussion paper no. 2011-2.415 Ma H, Liu W and Oxley L. (2012). Productivity growth and policy implications for china’s dairy farms, China Economic Policy Review, (1)1: 1250004.
46 28
26
29
14
15
7
10
5 16
0
10
20
30
40
50
60
70
80
90
100
2003 2009
1 to 5 6 to 20 21-100 101-500 >500
Perc
enta
ge
Figure 35: Share of cow numbers by farm size, 2004-2008
Source: Ma H, Liu W and Oxley L. (2012). Productivity growth and policy implications for china’s dairy farms, China Economic Policy Review, (1)1: 1250004. Data taken from China Dairy Statistical Yearbook 2005-2009.
Appetite for Change: Social, economic and environmental transformations in China’s food system
118
is, commercial set-ups with herds of between 10-50 and 50-500 head of cattle respectively.416 In other words, small and medium enterprises have been learning at a faster rate to utilise inputs of capital, labour and other inputs more efficiently than either very small domestic farmers or large-scale units. While improvements in technology may have driven productivity increases in the later 1990s,417 since 2003, productivity growth has been primarily due to more efficient use of resources within existing technical regimes.418
While the general thrust of government dairy policy is to encourage larger-scale production, it would be overly simplistic to conclude that government is therefore ‘anti-smallholder.’ Rather, government has put in place various approaches geared at encouraging smallholders to improve the quantity and quality of their output, including loans to buy cows, encouraging large processing companies to construct milking stations where individual farmers can bring their cows to be milked, and the promotion of cooperative models whereby the cooperative invests in milking facilities419 – somewhat along the lines of the ‘dragon-head’ enterprise approach seen in the horticulture sector (see Box 5). The dairy production zones (see below) are in principle, if not in practice, scale neutral. Despite these efforts, the figures continue to show a decline in smallholder production due to a number of reasons, perhaps the chief of which are the difficulties of producing cost effectively in the context of high production costs and low wages, and of meeting quality standards for raw milk.
2 Processing and importsUnlike the production sector, the dairy processing sector in China is highly concentrated. The top ten processors in China took 71.4% of the liquid milk market.420 These companies are large not only on the domestic stage but globally too – Yili and Mengniu now rank in the top 20 of the world’s largest milk companies.421 As in the case of primary production, the sector is dominated by domestic players. Only one non-Chinese company, Nestlé, is in the top 10 by retail value, accounting for only 1.5% of the market (Table 11).
China is also a major market for several international dairy firms. Dairy imports, generally of non-liquid dairy products, have more than doubled in the past five years, reaching over US$ 1.9 billion in 2010, and China is the biggest overseas market for several of these firms. While most liquid milk supply in China is domestically produced, more than a third of infant milk formula sold is imported (Table 12). This reflects both consumer concern with the quality and safety of domestic milk formula products in the wake of the melamine scandal, and logistics, since powdered milk lends itself much better to transport from further afield.
416 Ma H, Liu W and Oxley L. (2012). Productivity growth and policy implications for china’s dairy farms, China Economic Policy Review, (1)1: 1250004. 417 Rae A, Ma H, Huang J and Rozelle S. (2006). Livestock in China: commodity-specific total factor productivity decomposition using new panel data. American Journal of Agricultural Economics, (88)3: 680-695.418 Ma H, Oxley L, Rae A, Fan C, Huang J and Rozelle S. (2012). The evolution of productivity performance on China’s dairy farms in the new millennium. Journal of Dairy Science, (95)12: 7074-7085.419 Hu D. (2009). China: Dairy product quality as the new industry driver. In FAO. (2009). Smallholder dairy development: Lessons learned in Asia. RAP Publication 2009/02. Bangkok: FAO Regional Office for Asia and the Pacific.420 IMB. (2012). The market for dairy products in China. Market Indicator Report. Ottawa: International Markets Bureau, Agriculture and Agri-Foods Canada, http://www.ats-sea.agr.gc.ca/asi/pdf/6077-eng.pdf421 Rabobank. (2013). Rabobank Global Dairy Top-20 Survey. 9 September,http://rabobank-food-agribusiness-research.pressdoc.com/58597-rabobank-global-dairy-top-20-survey
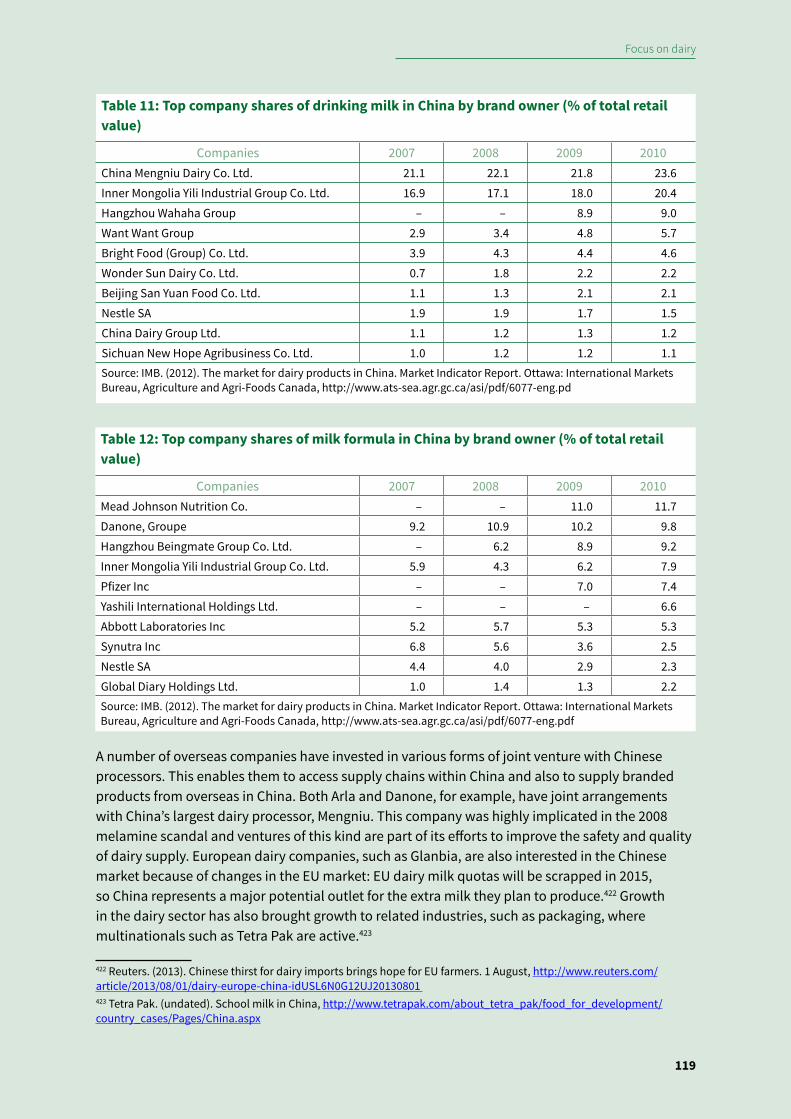
Focus on dairy
119
A number of overseas companies have invested in various forms of joint venture with Chinese processors. This enables them to access supply chains within China and also to supply branded products from overseas in China. Both Arla and Danone, for example, have joint arrangements with China’s largest dairy processor, Mengniu. This company was highly implicated in the 2008 melamine scandal and ventures of this kind are part of its efforts to improve the safety and quality of dairy supply. European dairy companies, such as Glanbia, are also interested in the Chinese market because of changes in the EU market: EU dairy milk quotas will be scrapped in 2015, so China represents a major potential outlet for the extra milk they plan to produce.422 Growth in the dairy sector has also brought growth to related industries, such as packaging, where multinationals such as Tetra Pak are active.423
422 Reuters. (2013). Chinese thirst for dairy imports brings hope for EU farmers. 1 August, http://www.reuters.com/article/2013/08/01/dairy-europe-china-idUSL6N0G12UJ20130801 423 Tetra Pak. (undated). School milk in China, http://www.tetrapak.com/about_tetra_pak/food_for_development/country_cases/Pages/China.aspx
Table 11: Top company shares of drinking milk in China by brand owner (% of total retail value)
Companies 2007 2008 2009 2010China Mengniu Dairy Co. Ltd. 21.1 22.1 21.8 23.6Inner Mongolia Yili Industrial Group Co. Ltd. 16.9 17.1 18.0 20.4Hangzhou Wahaha Group – – 8.9 9.0Want Want Group 2.9 3.4 4.8 5.7Bright Food (Group) Co. Ltd. 3.9 4.3 4.4 4.6Wonder Sun Dairy Co. Ltd. 0.7 1.8 2.2 2.2Beijing San Yuan Food Co. Ltd. 1.1 1.3 2.1 2.1Nestle SA 1.9 1.9 1.7 1.5China Dairy Group Ltd. 1.1 1.2 1.3 1.2Sichuan New Hope Agribusiness Co. Ltd. 1.0 1.2 1.2 1.1Source: IMB. (2012). The market for dairy products in China. Market Indicator Report. Ottawa: International Markets Bureau, Agriculture and Agri-Foods Canada, http://www.ats-sea.agr.gc.ca/asi/pdf/6077-eng.pd
Table 12: Top company shares of milk formula in China by brand owner (% of total retail value)
Companies 2007 2008 2009 2010Mead Johnson Nutrition Co. – – 11.0 11.7Danone, Groupe 9.2 10.9 10.2 9.8Hangzhou Beingmate Group Co. Ltd. – 6.2 8.9 9.2Inner Mongolia Yili Industrial Group Co. Ltd. 5.9 4.3 6.2 7.9Pfizer Inc – – 7.0 7.4Yashili International Holdings Ltd. – – – 6.6Abbott Laboratories Inc 5.2 5.7 5.3 5.3Synutra Inc 6.8 5.6 3.6 2.5Nestle SA 4.4 4.0 2.9 2.3Global Diary Holdings Ltd. 1.0 1.4 1.3 2.2Source: IMB. (2012). The market for dairy products in China. Market Indicator Report. Ottawa: International Markets Bureau, Agriculture and Agri-Foods Canada, http://www.ats-sea.agr.gc.ca/asi/pdf/6077-eng.pdf
Appetite for Change: Social, economic and environmental transformations in China’s food system
120
Chinese companies, for their part, have been exploring opportunities for investing in processing facilities in overseas regions, such as the EU,424 partly to improve security of supply and partly because of the less scandal-tainted reputation enjoyed by overseas producers. Assuming that China’s imports of dried milk and formula products continue to increase, the environmental footprint of China’s demand for dairy products will continue to extend beyond its immediate borders.
China is not only increasing its imports of finished dairy products, but also its imports of ingredients necessary for production, such as semen and breeding cattle.425 Indeed, since 2009, China has become the world’s most important buyer of dairy cows, driving up prices for calves world-wide and putting pressure on other markets such as alfalfa and bull semen. China has imported nearly 250,000 live heifers since 2009. It has been reported that in 2011 China spent more than $250 million on 100,000 foreign heifers, or about 25 ships’ worth.426
3. ConsumptionConsumption of dairy products, of all types, has grown dramatically. The dairy retail sector is now worth about US$ 36.6 billion and its value is expected to increase by a further 80.3% from 2011 to 2016. Sales of dairy in the foodservice sector added a further US$ 4.7 billion, making the total industry worth over US$ 41 million,427 more than any other processed food, and about a quarter of the value of total meat sales in China.428
Dairy product consumption has risen sharply in recent years. Between 1995 and 2010, it quadrupled in urban areas to just over 18 kg per person per year, while in rural areas it grew five-fold to 3.5kg per person per year.429 While these figures are still low in comparison to both global and developing world averages, the rate of growth is significant. A wide range of dairy products are now sold in China – including drinking milk (both UHT and pasteurised), yoghurt and drinking yoghurt, ice cream, coffee whitener, condensed milk, cheese and butter (Figure 36). Most drinking milk is UHT milk, which does not require refrigeration and is perceived to be of higher quality than powdered milk. The share of fresh pasteurised milk is likely to increase as refrigeration ownership grows. Recent years have seen particularly strong growth in the infant formula and cheese sectors and these are likely to see the highest rates of growth in the immediate future. In the case of cheese, this is starting from a very low base, but the growing popularity of pizza and
424 Reuters. (2013). Chinese thirst for dairy imports brings hope for EU farmers. 1 August, http://www.reuters.com/article/2013/08/01/dairy-europe-china-idUSL6N0G12UJ20130801 425 IMB. (2012). The market for dairy products in China. Market Indicator Report. Ottawa: International Markets Bureau, Agriculture and Agri-Foods Canada, http://www.ats-sea.agr.gc.ca/asi/pdf/6077-eng.pdf426 Frangos A. (2012). China Grows Its Dairy Farms With a Global Cattle Drive. The Wall Street Journal. 23 April, http://online.wsj.com/article/SB10001424052702303863404577281302732745814.html 427 IMB. (2012). The market for dairy products in China. Market Indicator Report. Ottawa: International Markets Bureau, Agriculture and Agri-Foods Canada, http://www.ats-sea.agr.gc.ca/asi/pdf/6077-eng.pdf428 China Meat. (2009). 2009 China Meat and Egg Product Market Report. http://wenku.baidu.com/view/4e230cdba58da0116c174908.html429 Zhou Z, Tian W, Wang J, Liu H and Cao L. (2012). Food Consumption Trends in China. Report submitted to the Australian Government Department of Agriculture, Fisheries and Forestry.
Focus on dairy
121
of western-style fast foods is likely to increase uptake.430 While consumption of dairy products dipped in 2009 following the melamine scandal, industry forecasts predict a growth of about 80% between 2011 and 2016. At the same time, dairy product prices are on the rise, as more high-end health and ‘wellness’ products enter the market to address consumers’ concerns in the wake of the melamine scandal. Dairy consumers tend to be wealthier, more educated urban dwellers. Consumption of dairy products in China is expected to continue to increase due to higher disposable incomes, increasing health consciousness, the increasing availability of cold chain logistics and milk products in retail outlets, increasing prevalence of refrigerators in the home, and rising interest in Western-style foods in both retail and foodservice.
4. Drivers of growth in dairy production and consumption
Considering the small role that dairy products play in most traditional Chinese cuisines, and the high prevalence of lactose intolerance in China, the reasons underlying the rapid growth in dairy production and consumption merit some exploration.431 The growth in the dairy sector reflects a series of very deliberate interventions on the part of Chinese policy makers, for whom greater dairy consumption is seen to meet very explicit goals. The opening words of the Government’s national dairy plan are: “Dairy is an important component of modern agriculture. Promoting healthy sustainable development of dairy meets the needs of optimising agricultural structure, increasing farmers’ incomes, improving residents’ nutrition and strengthening citizen’s physical status”.432 Former Premier Wen Jiabao is quoted as saying: “I have a dream and my dream is that each Chinese person, and especially the children, can afford to buy one jin [500 g] of milk to drink every day”.433 What are the motivations underpinning this drive for growth? Three main, interacting explanations can be identified:
430 IMB. (2012). The market for dairy products in China. Market Indicator Report. Ottawa: International Markets Bureau, Agriculture and Agri-Foods Canada, http://www.ats-sea.agr.gc.ca/asi/pdf/6077-eng.pdf; Whitehead R J. (2013). Fonterra: Asia behind global foodservice growth. DairyReporter. 17 October, http://www.dairyreporter.com/Markets/Fonterra-Asia-behind-global-foodservice-growth/?utm_source=newsletter_daily&utm_medium=email&utm_campaign=Newsletter%2BDaily&c=jrkd9eKIEpM4FpaGEGnfrg%3D%3D431 It is worth noting, however, that dairy cows were introduced to China before the 1870s, and dairy products were available in some coastal cities on a commercial scale in the 1930s. Yeh W. (1997). Shanghai Modernity: Commerce and Culture in a Republican City. The China Quarterly, (150): 375-394. 432 Ministry of Agriculture. (2010). National Dairy Development Plan (2009-2013). Beijing.433 Quoted in Hu D. (2009). China: Dairy product quality as the new industry driver. In FAO. (2009). Smallholder dairy development: Lessons learned in Asia. RAP Publication 2009/02. Bangkok: FAO Regional Office for Asia and the Pacific.
55%
20%
13%
11%
1%
Cheese, 0% Butter, 0%
Drinking milk products Baby/infant milk formula
Yoghurt Ice cream
Co�ee whitener, condensed milk
Cheese
Butter
Figure 36: Share of total retail value by dairy product type, 2011
Source: Euromonitor. (2011). Cited in IMB. (2012). The market for dairy products in China. Market Indicator Report. Ottawa: International Markets Bureau, Agriculture and Agri-Foods Canada, http://www.ats-sea.agr.gc.ca/asi/pdf/6077-eng.pdf. Note: Total retail value was US$ 36.6 billion.
Appetite for Change: Social, economic and environmental transformations in China’s food system
122
� Government desire to promote dairy as a driver of economic growth; � Government desire to improve the nutritional status of its populations, interwoven with
notions of modernity and keeping up with the (American) Joneses; and � Investment by domestic dairy firms, and support from both overseas companies and
governments.
In addition to government policies seeking to increase the size of the dairy sector, government has also: (4) been forced to develop policies in response to the food safety scandals affecting the sector as well as a range of environmental concerns. These four influences are discussed below.
4.1 Policies to promote dairy production as a driver of economic growth
Active promotion of the dairy sector began in the 1980s as part of a government project to improve the nutritional status of its populations.434 Particular efforts were made to target production in northern China. This was traditionally an impoverished region but a convergence of factors made the north suitable for dairy investment: favourable environmental conditions (climate and availability of pasture and crops); access to markets in northern cities; and some existing processing infrastructure clustered near the coast for historic reasons. Targeted interventions included investments in new dairy and forage, and in the necessary infrastructure. A shift away from lower value crop production towards higher value commodities such as dairy foods is also part of the government’s drive to exploit its comparative advantage in labour and to use agriculture to act as an engine of rural economic growth. Explicit targets for increased milk output were put in place. Interestingly, the ostensibly ambitious target of achieving 17 million tonnes of output by 2010 was in fact surpassed by 2003, and by 2008 production was more than twice this goal at nearly 38 million tonnes.435 Strategic subsidies and other interventions to increase output, geared both at increasing herd numbers and their productivity, started to pay off towards the end of the 1990s, leading to a dramatic increase in output (Figure 32).
4.2 Policies to promote dairy consumption for reasons of health and modernity
The growth in output has been matched by an increase in demand. While the rapid growth in dairy consumption seen in the late 1990s may have been aided by rising per capita incomes, wealth alone is not a sufficient explanation.436 Rising incomes may explain the growth in consumption of meats, fruits and vegetable oils – all foods that are part of the traditional Chinese diet – but the increase in dairy product demand is a consequence of deliberate government policies that sought to stimulate demand for these foods. Government made substantial promotional efforts through the state health care sector and schools to convince China’s consumers that milk is important for all people – working adults as well as children, the elderly, and the infirm.
Government nutrition policy objectives are targeted not only at ensuring basic per capita calorie sufficiency but also micronutrient adequacy for the Chinese population (see Chapter Five), and
434 Wang Q, Parsons R and Zhang G. (2010). China’s dairy markets: trends, disparities, and implications for trade. China Agricultural Economic Review, (2)3: 356-371.435 Hu D. (2009). China: Dairy product quality as the new industry driver. In FAO. (2009). Smallholder dairy development: Lessons learned in Asia. RAP Publication 2009/02. Bangkok: FAO Regional Office for Asia and the Pacific.436 Fuller F, Huang J, Ma H and Rozelle S. (2005). The Rapid Rise of China’s Dairy Sector: Factors Behind the Growth in Demand and Supply. Working paper 05-WP 394. Ames: Center for Agricultural and Rural Development, Iowa State University.

Focus on dairy
123
milk is seen as a micronutrient-rich food that can help reduce the prevalence of micronutrient deficiencies. The 2007 Food Advice developed by the China Nutrition Society and published by the Ministry of Health, highlights dairy as a specific category of foods to be consumed and recommends a daily intake of 300 g of milk, with higher recommendations for teenagers, children, pregnant women and the elderly.437 The average recommendation is approximately 6 and 30 times more than current average consumption levels among rural and urban consumers, respectively (see Chapter Five). While these efforts are consistent with China’s public health promotion agenda, observers have also suggested that the government’s desire to build the sector has been closely bound up in ideological beliefs about modernity and progress.438 State-owned dairy industries have promoted milk drinking as an almost patriotic duty, with slogans such as “one cup of milk can strengthen a nation”. Promotion of milk drinking is, in short, part of a nation building strategy to improve population ‘quality’.
These promotional activities have impacted on peoples’ daily practices. Parents are very keen for their children to drink milk, although they are worried about food safety.439 Some parents feed milk to their children hoping to ‘introduce them to things foreign and equip them to live in an industrialised, technologically advanced, cosmopolitan world’,440 while some people consume milk as a means of associating themselves with ‘Western’ or ‘modern’ lifestyles – in line with government messaging.441
In particular, government has promoted milk consumption through a nationwide school milk programme. The scheme was set up in 2000 to provide pupils in primary and junior middle schools with milk (and soy milk) at subsidised prices. The scheme has grown considerably since then and by 2011 covered more than 10,000 schools and kindergartens in over 170 localities. Around five million children are included in the initiative.442 While the scheme has been successful in increasing school children’s consumption of milk,443 it has been beset by scandals involving contaminated milk, as well as media reports of inflated milk prices that are passed onto parents and improper collaboration between local government departments and dairy firms.
Government efforts to promote milk consumption were facilitated by the development of cold storage infrastructure along the whole supply chain (itself a focus of government policy – see Chapter Three) and more widespread ownership of refrigerators. Changes in lifestyle, marked in part by a greater demand for ready-to-eat foods, also provided an opening for dairy companies to market their foods not just on the basis of nutrition but also convenience.
437 Ge K. (2011). The transition of Chinese dietary guidelines and the food guide pagoda. Asia Pacific Journal of Clinical Nutrition, (20)3: 439-446.438 Wiley A. (2011). Milk for “Growth”: Global and Local Meanings of Milk Consumption in China, India, and the United States. Food and Foodways: Explorations in the History and Culture of Human Nourishment, (19):1-2: 11-33.439 Li C, Yuan C and Li H. (2009). Knowledge, attitudes and practice of primary and middle school students and parents in prefecture level cities of central China to students drinking milk. Chinese Journal of School Health, (30)12: 1062-1064 (in Chinese).440 Gillette M. (2005). Children’s food and Islamic dietary restrictions in Xi’an. In J L Watson and M L Caldwell (eds). The Cultural Politics of Food and Eating. Malden, MA: Blackwell Publishing. pp. 106–121.441 Wiley A. (2011). Milk for “Growth”: Global and Local Meanings of Milk Consumption in China, India, and the United States. Food and Foodways: Explorations in the History and Culture of Human Nourishment, (19):1-2: 11-33.442 School Milk of China. (undated). School Milk of China, http://www.schoolmilk.gov.cn/; Sina. (2011). National School Milk Scheme ushers in a new decade. 2 March, http://finance.sina.com.cn/roll/20110302/11589457357.shtml443 School Milk of China. (undated). School Milk of China, http://www.schoolmilk.gov.cn/; Li J. (2006). The Development of School Milk Programme in China. Presentation at Fourth International School Milk Conference, South Africa.
Appetite for Change: Social, economic and environmental transformations in China’s food system
124
4.3 Role of overseas companies and governments
Government promotion of dairy products has been given further impetus by the food industry itself. Domestic firms are high-profile advertisers of their products, with much of the marketing focus on the health-enhancing properties of milk both for children and for pregnant and breastfeeding women. This has also been a major growth area for overseas firms, since their products are seen as safer and of a higher quality. Non-Chinese brands account for the majority of baby milk sales in China, and sales in China can contribute significantly to the revenues of overseas firms.444
The rapid growth in formula (and imported formula) consumption has been facilitated by very low breastfeeding rates in China. These are themselves driven by high rates of Caesarean sections, and the fairly aggressive promotion of milk formula in the health care sector (including in maternity wards) as well as long average working hours and limited maternity leave. Very few provinces meet the Chinese government’s target that 80% of babies should be exclusively breastfed at 4 months, although the situation has improved since the 1980s.445 In some regions, only about 10-20% of babies at four months of age are exclusively breastfed. It is striking that much of the media attention surrounding baby milk contamination scandals focuses on accountability and governance within the dairy industry, but low rates of breastfeeding – a safe and cheap alternative to the use of formula – has received only moderate attention in official and online media.446
Not all milk formula marketing in China is aimed at the breastfeeding stage. A considerable proportion is marketed to older infants and toddlers as ‘follow on’ milk, despite the World Health Organisation statement on follow on milk as not only “unnecessary …[but also]… unsuitable when used as a breast-milk replacement from six months of age onwards”.447 Recent years have also seen strong promotional emphasis on the value of milk for China’s increasingly ageing demographic, with a focus on women and the role of calcium in preventing osteoporosis (see Chapter Five). For example, Fonterra is marketing its high calcium milk, Anlene, on the grounds of bone health for ageing populations,448 while its Anmum brand is promoted to pregnant and breastfeeding mothers.449
Other companies have also invested in the dairy sector in China or supported it in less direct ways. Dupont (which owns probiotics company Danisco) provides support to the school milk programme, while global packaging company Tetra Pak provides packaging for the milk at agreed low prices. The acquisition of British cereal manufacturer Weetabix by China’s Bright Foods may lead to an expansion of the breakfast cereals market in Asia, which is likely to go hand in hand with greater use of milk,though there are also ‘dry’ formulations such breakfast bars to consider. Other
444 Danone. (2011). Danone 11: Danone at a Glance, http://danone11.danone.com/static/2012/06/06/Danone_AR2011_RESULTS&ACTIVITIES.pdf?o-1y1GCm-ftuMl85nO7_gA:hR99JS2-c_4MwQRfdLoZnQ:7akx0gZTIcR1iUhKgavppw 445 Xu F, Qiu L, Binns C W and Liu X. (2009). Breastfeeding in China: a review. International Breastfeeding Journal, (4): 6.446 Andreas Wilkes, pers. obs., November 2013.447 World Health Organisation. (2013). Information concerning the use and marketing of follow-up formula. 17 July, http://www.who.int/nutrition/topics/WHO_brief_fufandcode_post_17July.pdf; Koletzko B, von Kries R, Closa R, Escirbano J, Scaglioni S, Gionvannini M, Beyer J, Demmelmair H, Gruszfeld D, Dobrzanska A, Sengier A, Langhendries J-P, Rolland Cahera M-F and Grote V. (2013). Lower protein in infant formula is associated with lower weight up to age 2 y: a randomized clinical trial 1–4. American Journal of Clinical Nutrition, (89): 1836–45.448 Fonterra. (undated). Fonterra, http://www.fonterra.com/global/en449 Fonterra. (undated). Fonterra, http://www.fonterra.com/global/en
Focus on dairy
125
influences on dairy consumption include Starbucks and the general rise in popularity of coffee culture. Food companies such as McDonald’s, KFC, and Pizza Hut are also likely to help increase the market for dairy products, particularly cheese, ice cream and milk-based drinks.
Since the 1980s, several western governments have also supported the development of China’s dairy industry, mostly through technical assistance projects in dairy production, but also by building institutional capacity for various aspects of dairy research. For example, the EU provided aid to China to purchase dairy cows and upgrade dairy processing plants in Gansu Province in the 1990s, and a Sino-US Dairy Development Research Centre was established in 2004.450
4.4 Responsive policies
The 2008 melamine scandal has served to reinforce government’s current focus on consolidation in the dairy sector, and also forced government to put in place additional measures to improve food safety standards and rebuild consumer trust. The by now extensively analysed melamine incident, which led to several deaths and affected some 300,000 people, was in part a consequence of rising production costs and falling procurement prices. Falling profit margins motivated some farmers and milk processors to adulterate diluted milk with the nitrogen-containing compound melamine. This enabled diluted milk to pass the standard crude protein content test.
Government responded to the crisis by closing down the key processing facilities implicated in the scandal which caused, among other things, the exit of many small producers from the sector since they now had no market for their milk. It also sought to address the problem through a two-fold approach: first by introducing a suite of marketing management policies, and, second, by incentivising the establishment of large production zones (yangzhi xiaoqu), either private or state-owned, sometimes dubbed ‘cow hotels’. The new policies included a suite of new inspection requirements for dairy processing, implemented by China’s General Administration of Quality Supervision, Inspection and Quarantine (AQSIQ) in 2011, and subsidies to larger-scale units to install equipment that would meet safety standards and allow for easier monitoring. Many smaller processors failed to obtain production licenses, causing them to exit the sector.
Through the ‘cow hotels’, smallholders were encouraged to accommodate their cows in production zones, where better technical facilities were made available and standardised management practices were enforced. In some cases, farmers also stayed at these complexes. While in principle accessible to all farmers whatever their size of production, one study found that large farmers were more likely to use these facilities and benefit from them. While some small farmers did join the complexes, most continued to use traditional backyard production,451 either because of the incompatibility of smallholder farming with staying at a cow hotel, or because of the burden of the costs of living in the hotels. Larger producers were also more likely to benefit from the suite of milk marketing policies and incentives in place, which explicitly sought to promote larger-scale production.
450 Liu R and Wang W. (2005). Sino-US dairy research centre established. Sina. 16 March, http://news.sina.com.cn/o/2005-03-16/13555375384s.shtml451 Mo D, Huang J, Jia X, Luan H, Rozelle S and Swinnen J. (2012). Checking into China’s cow hotels: have post milk-scandal policies changed the structure of the dairy sector? Journal of Dairy Science, (95): 2282–2298.
Appetite for Change: Social, economic and environmental transformations in China’s food system
126
A subsequent national plan to develop the dairy industry,452 issued in 2010 and covering the period 2009-2013, sought to eliminate substandard producers and revitalise a sector in which consumers had lost confidence. Small-scale producers were identified as a constraint because of their lower productivity and the difficulties associated with monitoring safety standards in a fragmented sector. Also part of the plan was a target to increase the national cow herd to 15 million head and increase output to 48 million tonnes. Thirty five percent of this output would be met by farms with over 100 head of cattle. Specific measures to achieve these goals include subsidies for establishing standardised production zones. The policy document also had a specific section on environmental protection which placed emphasis on: (1) avoiding environmentally sensitive areas when selecting dairy production zones and ensuring the environmental load is suited to the surrounding area, (2) meeting the relevant environmental impact assessment requirements, and (3) promoting use of clean production technologies, such as composting and biogas. The government also introduced a dairy cow genetic improvement support fund which provides subsidies for genetics for certain dairy cattle breeds.
5. Emerging issues for the dairy sectorThe rapid growth in the dairy sector raises a number of concerns, related to the environment, food safety, animal health and welfare, and public health.
Environmental impacts: To date, the increase in production has largely been achieved through greater cow numbers. This has led to an increase in greenhouse gas emissions from dairy production, and to manure surpluses, which potentially have implications for soil and water pollution (see Chapter Four). While efforts to improve the environmental efficiency of livestock production by scaling up production and investing in infrastructure have led to some improvements – for example, more waste treatment facilities have been installed and reductions in ammonia and COD emissions are recorded at the national level453 – nutrient surpluses continue to pose substantial problems. Reports suggest that the siting of dairy farms often pays little attention to the ability of surrounding cropland to absorb the nutrients from the waste, and costs of operating waste treatment facilities are often high.454
Food safety: Milk quality testing – which played a key role in the melamine scandal – remains in the hands of the milk processing enterprises with no third party monitoring of quality. This not only means that the system remains open to abuse but also that processors are able to set the prices they offer to farmers, based on their statement of quality. The consequence is that farmers have little say in the prices they receive, potentially reducing their profit margins further and forcing smaller, less powerful farmers out of the sector. As noted, many dairy processors are engaging in joint ventures with non-Chinese manufacturers and/or seeking to invest in production facilities overseas as a way of addressing reputational damage and consumer perceptions of risk, but it remains to be seen whether this leads to improvements in food safety management.
452 Ministry of Agriculture. (2010). Notice on the issuance of the ‘National Dairy Industry Development Plan (2009-2013)’. 11 June, http://www.moa.gov.cn/zwllm/ghjh/201008/t20100805_1613197.htm453 Ministry of Environmental Protection. (2012). State of China’s Environment Report 2012. Beijing. 454 Li S, Yao K, Yang D, Cao Z, Liu Y, Zhang W, Xie Z, Gao M, Sun F, Li Z, Jia C, He H, Gu Y and Zhang X. (2013). Current status and development of standardized large-scale dairy production. China Animal Husbandry Journal, (9): http://www.cav.net.cn/magzine/zhuanti/201309/
Focus on dairy
127
Animal health and welfare: The transition from smallholder backyard production to large-scale, intensive and confined operations will change the nature of animal health and welfare risks in the dairy sector. While animals reared in backyard systems may enjoy relatively more freedom of movement and the ability to perform natural behaviours, they are often vulnerable to disease and poor nutrition, made worse by inadequate knowledge and veterinary care. Larger-scale facilities are in principle better able to invest in improved hygiene and veterinary input, but intensive systems also face particular challenges. Larger numbers of confined animals increases risks of disease outbreaks, especially if health management is weak. There is also often a mismatch between breeds and the feed inputs provided. Very high-yielding breeds may be fed local forages, which may not provide the level of nutrition required, the consequence being that the animals are undernourished. Alternatively, traditional breeds may be fed ‘modern’ formulations which are unsuited to their needs. It is anticipated that in coming years welfare concerns are likely to rise up the policy agenda, particularly in response to enterprise profitability and food safety requirements.
Public health: The implications of rising dairy demand for obesity are unclear at this stage (see Chapter Five). Milk is a nutrient-rich food but can be energy dense when consumed in the form of cheese, butter or ice cream. In China, many dairy products, such as flavoured milks, yoghurts, ice cream and even cheese, are formulated with added sugar or are consumed as an ingredient in energy dense foods, such as pizzas. The health effects of trends in follow-on formula milk consumption have not been systematically researched. Thus, the forms in which dairy foods are marketed and consumed may be linked to future trends in chronic diseases.
Appetite for Change: Social, economic and environmental transformations in China’s food system
128
Focus on aquaculture
1. IntroductionChina is the world’s largest producer and consumer of aquatic products – a term that includes products derived from both the wild capture and cultured sectors. In 2010, China accounted for 35% of world fisheries production and more than 60% of world aquaculture production. It is now the world’s third largest importer of aquatic products and its largest exporter.455 While the capture fisheries sector has remained static, reflecting increasing scarcity of resources and government policies to control its growth, growth in aquaculture continues.
This Focus section456 begins with a brief overview of the policy influences on China’s aquatic sector (2). Next, Section 3 looks at the size and compass of the sector before examining trends in the structure and process of production. It then (4) considers aquaculture trade before looking at trends in the volume and nature of aquatic consumption (5). Finally, issues relating to environment, food safety and human nutrition (6, 7 and 8) are summarised.
2. Aquaculture policiesRecords of inland aquaculture in China date back more than 2,000 years, while marine fish and shellfish culture is only slightly more recent.457 Modern aquaculture and large-scale production, however, only began after the founding of the People’s Republic of China in 1949, increasing rapidly after the reforms of the 1980s, and became one of the fastest growing food production sectors. Aquaculture was promoted by the government on the basis of an “eight word” set of principles dealing with water, seed, feed, density, polyculture, alternate culture, disease prevention and management.
The decline in wild fish stocks, which became increasingly apparent in the 1970s, spurred government efforts to promote aquaculture in both freshwater and marine waters, while also actively developing mid-water and deep-sea fisheries.458 By 1985, production from aquaculture had surpassed that of capture fisheries. In 2011, Chinese aquaculture production exceeded 40 million tonnes, accounting for 71.8% of total Chinese fisheries production.459 This growth in output has had a huge impact on the global aquaculture sector, with Chinese farmed aquaculture accounting for a quarter of global aquatic food production.460
455 FAO Fisheries and Aquaculture Department. (2012). State of the World’s Fisheries and Aquaculture 2012. Rome: FAO. 456 This Focus Section is based on a longer report: Zhang W, Garnett T, Murray F J, Edwards P and Little D C. (2013). General overview of China’s aquaculture and fisheries sector. Stirling: Stirling University.457 FAO. (2005). National Aquaculture Sector Overview: China. National Aquaculture Sector Overview Fact Sheets, http://www.fao.org/fishery/countrysector/naso_china/en#tcN9003E458 Wang W. (2000). Culture and Enhancement of Fishes. Shanghai: China Agriculture Press.459 Fisheries Bureau of the Ministry of Agriculture. (2012). China Fisheries Statistical Yearbook 2012. Beijing: China Agriculture Press.460 Costa-Pierce B. (2010). Sustainable Ecological Aquaculture Systems: The Need for a New Social Contract for Aquaculture Development. Marine Technology Society Journal, (44)3: 88–112.
Focus on aquaculture
129
The new millennium saw a continued focus on aquaculture development. From 2004 to 2011, central government policy documents focused on rural reform and agricultural development, all of which included aquaculture. The Eleventh Five-Year Plan for National Economic and Social Development, published in 2006, also put emphasis on aquaculture and processing development. In more recent years there has been a strong focus on providing opportunities for rural employment and on increasing fishers’ incomes. As in the case of terrestrial livestock, the most important policy influences on the sector’s growth have been price deregulation, market liberalisation and land reform.461
In the wild fisheries sector, there is an explicit target to transition away from reliance on capture fisheries, as embodied in government’s ‘zero growth’ and ‘negative growth’ policy for capture fisheries in inland and inshore waters. Significant government support has been directed at encouraging fishing households to shift to aquaculture, promoting artificial propagation of key species and reducing the number of fishing vessels, replacing them instead with fewer, larger vessels suited to deep water fisheries. The latter has met with limited success, and the fisheries sector continues to face a number of challenges, with the depletion of fish stocks and high energy intensity two particular concerns.
The aquatic sector is overseen by the Bureau of Fisheries under the Ministry of Agriculture, with fisheries departments present at all levels of government, from provincial to district to county. The basic law for aquaculture is the Fisheries Law, and the emphasis on aquaculture in the Fisheries Law was believed to be a major driver of aquaculture development.462 Governance and regulation of the sector has led to the development of elaborate legislation and corresponding administration systems, encompassing land and water issues, environmental protection, the movement of live aquatic species, control of animal disease, and feed and chemical use and food safety.463 This has led to a highly complex administrative system. Management of coastal areas alone involves around twenty ministries and agencies responsible for agriculture, construction, flood control, environmental protection, transport, and natural resources exploitation.464 Fragmentation of responsibilities has had implications for management of the environment and food safety, two key areas impacting the sector.
3. Trends in the aquaculture sector3.1 Production and growth
In 2011, China produced 56 million tonnes of aquatic products, of which around 72% was from aquaculture and 28% from capture fisheries (including seaweeds). Growth in the capture fisheries sector has stagnated, while aquaculture production continues to grow (Figures 37 and 38). Capture fishing mostly takes place in marine waters and aquaculture in fresh or brackish waters,
461 Li L and Huang J. (2005). China’s Accession To the WTO and Its Implications for the Fishery and Aquaculture Sector. Aquaculture Economics & Management, (9)1-2: 195–215.462 Chen L. (2007). Current situation and prospects of the domestic aquaculture product market in China. Global trade conference on aquaculture: 29-31 May 2007, Qingdao, China:[proceedings], (9): 189–195: Li J. (2007). Developing sustainable aquaculture industry and building a harmonious international trade order. Global trade conference on aquaculture: 29-31 May 2007, Qingdao, China:[proceedings], (9): 29–31.463 FAO. (2004). Fishery And Aquaculture Country Profiles - China. FAO Fisheries and Aquaculture Department, http://www.fao.org/fishery/countrysector/FI-CP_CN/en464 Cao W and Wong M. (2007). Current status of coastal zone issues and management in China: a review. Environment International, (33)7: 985–92.
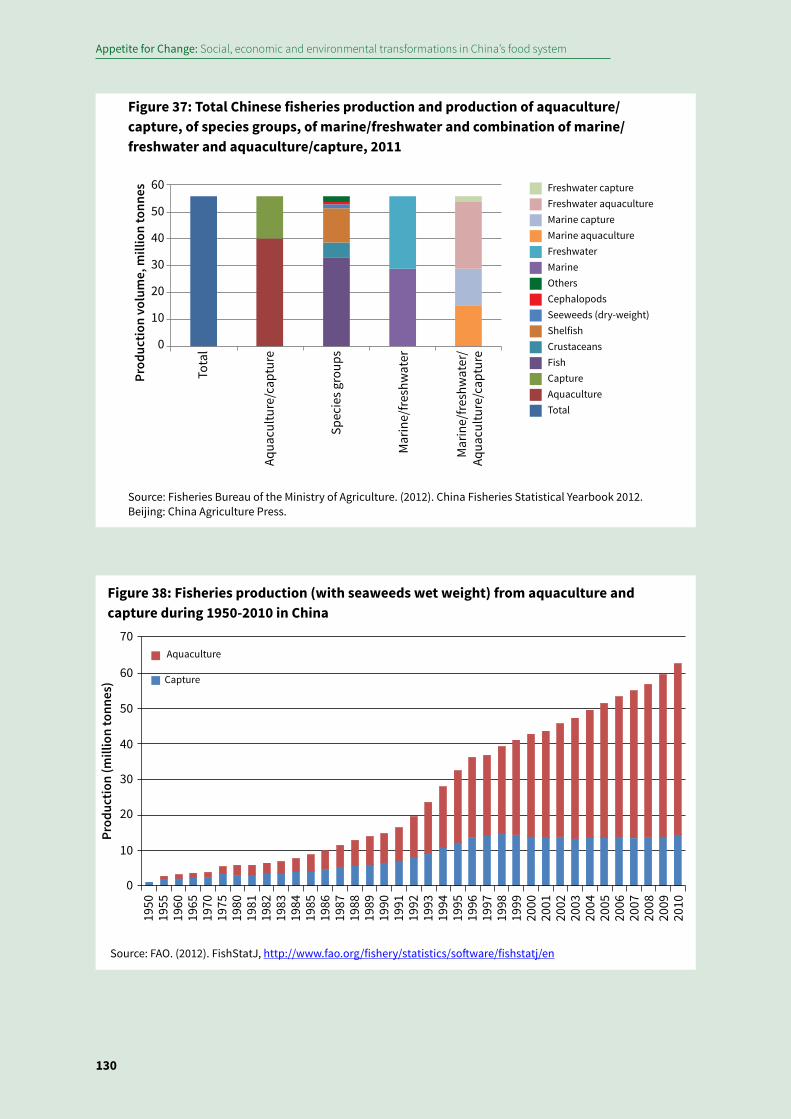
Appetite for Change: Social, economic and environmental transformations in China’s food system
130
Prod
uctio
n vo
lum
e, m
illio
n to
nnes
Tota
l
Aqua
cultu
re/c
aptu
re
Spec
ies g
roup
s
Mar
ine/
fresh
wat
er
Mar
ine/
fresh
wat
er/
Aqua
cultu
re/c
aptu
re
OthersMarineFreshwaterMarine aquacultureMarine captureFreshwater aquacultureFreshwater capture
TotalAquacultureCaptureFishCrustaceansShelfishSeeweeds (dry-weight)Cephalopods
60
50
40
30
20
10
0
Figure 37: Total Chinese fisheries production and production of aquaculture/capture, of species groups, of marine/freshwater and combination of marine/freshwater and aquaculture/capture, 2011
Source: Fisheries Bureau of the Ministry of Agriculture. (2012). China Fisheries Statistical Yearbook 2012. Beijing: China Agriculture Press.
1955
1950
1960
1965
1970
1975
1980
1981
1982
1983
1984
1985
1986
1987
1988
1989
1990
1991
1992
1993
1994
1995
1996
1997
1998
1999
2000
2001
2002
2003
2004
2005
2006
2007
2008
2009
2010
Aquaculture
Prod
uctio
n (m
illio
n to
nnes
) Capture
0
10
20
30
40
50
60
70
Figure 38: Fisheries production (with seaweeds wet weight) from aquaculture and capture during 1950-2010 in China
Source: FAO. (2012). FishStatJ, http://www.fao.org/fishery/statistics/software/fishstatj/en
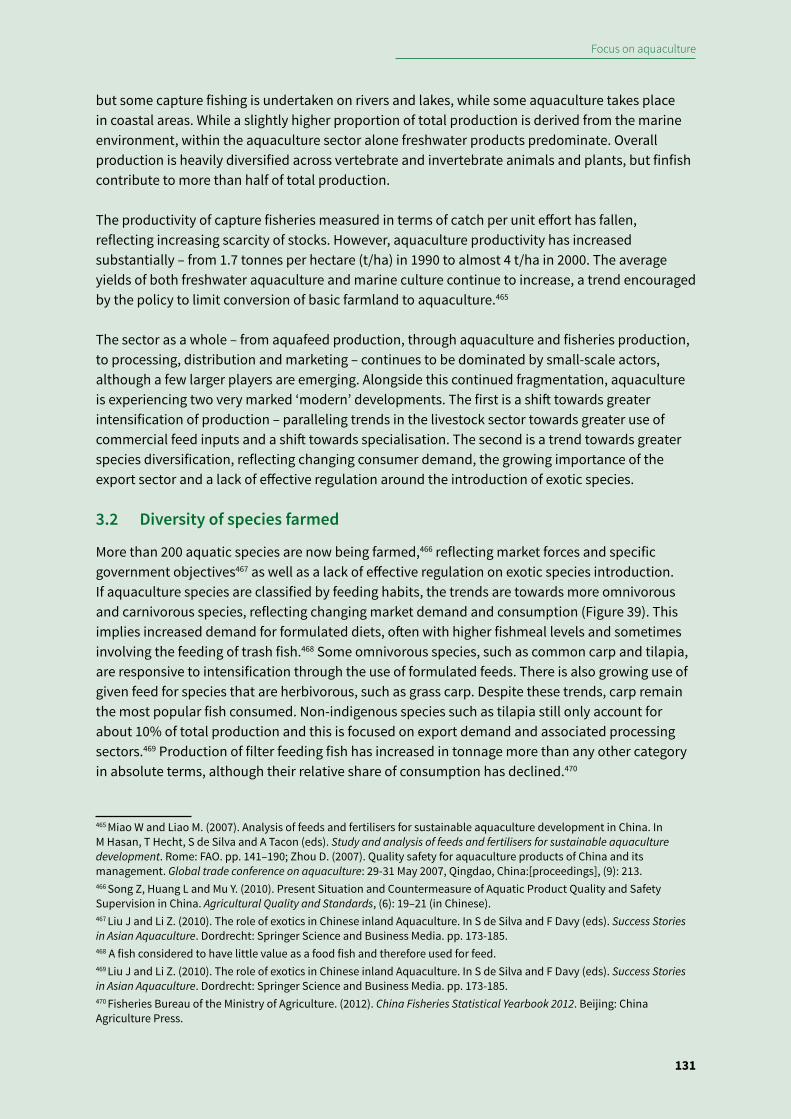
Focus on aquaculture
131
but some capture fishing is undertaken on rivers and lakes, while some aquaculture takes place in coastal areas. While a slightly higher proportion of total production is derived from the marine environment, within the aquaculture sector alone freshwater products predominate. Overall production is heavily diversified across vertebrate and invertebrate animals and plants, but finfish contribute to more than half of total production.
The productivity of capture fisheries measured in terms of catch per unit effort has fallen, reflecting increasing scarcity of stocks. However, aquaculture productivity has increased substantially – from 1.7 tonnes per hectare (t/ha) in 1990 to almost 4 t/ha in 2000. The average yields of both freshwater aquaculture and marine culture continue to increase, a trend encouraged by the policy to limit conversion of basic farmland to aquaculture.465
The sector as a whole – from aquafeed production, through aquaculture and fisheries production, to processing, distribution and marketing – continues to be dominated by small-scale actors, although a few larger players are emerging. Alongside this continued fragmentation, aquaculture is experiencing two very marked ‘modern’ developments. The first is a shift towards greater intensification of production – paralleling trends in the livestock sector towards greater use of commercial feed inputs and a shift towards specialisation. The second is a trend towards greater species diversification, reflecting changing consumer demand, the growing importance of the export sector and a lack of effective regulation around the introduction of exotic species.
3.2 Diversity of species farmed
More than 200 aquatic species are now being farmed,466 reflecting market forces and specific government objectives467 as well as a lack of effective regulation on exotic species introduction. If aquaculture species are classified by feeding habits, the trends are towards more omnivorous and carnivorous species, reflecting changing market demand and consumption (Figure 39). This implies increased demand for formulated diets, often with higher fishmeal levels and sometimes involving the feeding of trash fish.468 Some omnivorous species, such as common carp and tilapia, are responsive to intensification through the use of formulated feeds. There is also growing use of given feed for species that are herbivorous, such as grass carp. Despite these trends, carp remain the most popular fish consumed. Non-indigenous species such as tilapia still only account for about 10% of total production and this is focused on export demand and associated processing sectors.469 Production of filter feeding fish has increased in tonnage more than any other category in absolute terms, although their relative share of consumption has declined.470
465 Miao W and Liao M. (2007). Analysis of feeds and fertilisers for sustainable aquaculture development in China. In M Hasan, T Hecht, S de Silva and A Tacon (eds). Study and analysis of feeds and fertilisers for sustainable aquaculture development. Rome: FAO. pp. 141–190; Zhou D. (2007). Quality safety for aquaculture products of China and its management. Global trade conference on aquaculture: 29-31 May 2007, Qingdao, China:[proceedings], (9): 213.466 Song Z, Huang L and Mu Y. (2010). Present Situation and Countermeasure of Aquatic Product Quality and Safety Supervision in China. Agricultural Quality and Standards, (6): 19–21 (in Chinese). 467 Liu J and Li Z. (2010). The role of exotics in Chinese inland Aquaculture. In S de Silva and F Davy (eds). Success Stories in Asian Aquaculture. Dordrecht: Springer Science and Business Media. pp. 173-185.468 A fish considered to have little value as a food fish and therefore used for feed.469 Liu J and Li Z. (2010). The role of exotics in Chinese inland Aquaculture. In S de Silva and F Davy (eds). Success Stories in Asian Aquaculture. Dordrecht: Springer Science and Business Media. pp. 173-185.470 Fisheries Bureau of the Ministry of Agriculture. (2012). China Fisheries Statistical Yearbook 2012. Beijing: China Agriculture Press.
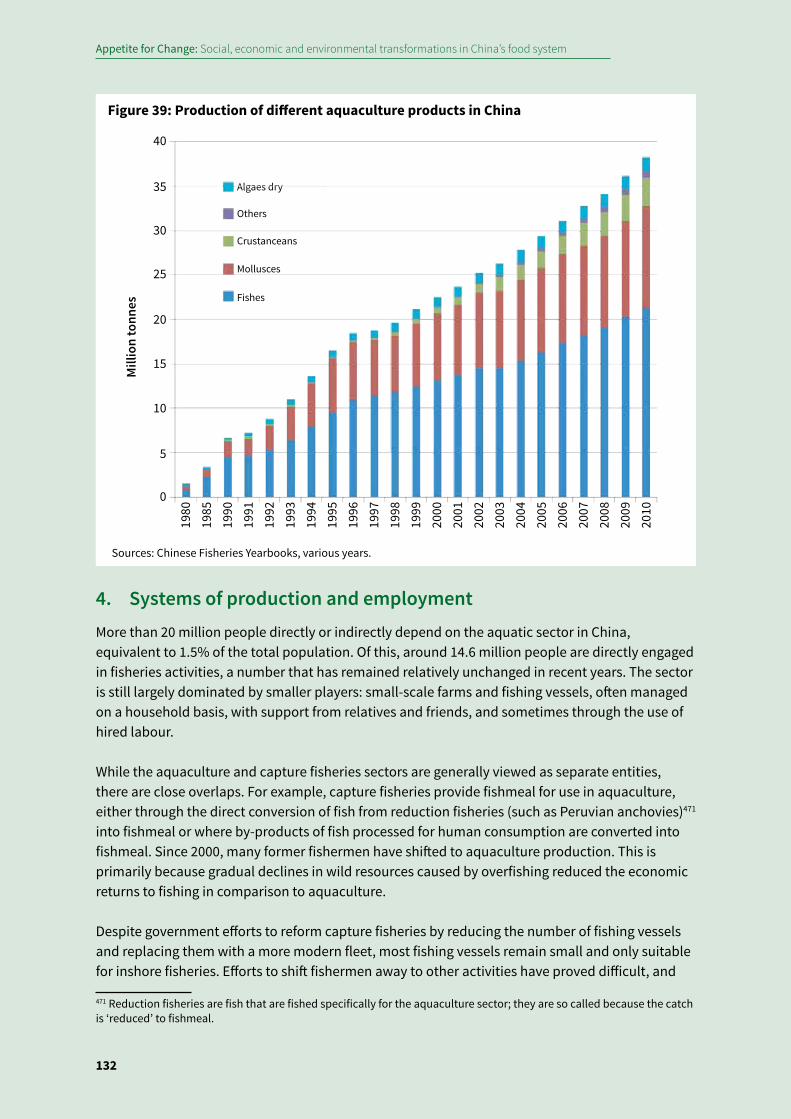
Appetite for Change: Social, economic and environmental transformations in China’s food system
132
4. Systems of production and employmentMore than 20 million people directly or indirectly depend on the aquatic sector in China, equivalent to 1.5% of the total population. Of this, around 14.6 million people are directly engaged in fisheries activities, a number that has remained relatively unchanged in recent years. The sector is still largely dominated by smaller players: small-scale farms and fishing vessels, often managed on a household basis, with support from relatives and friends, and sometimes through the use of hired labour.
While the aquaculture and capture fisheries sectors are generally viewed as separate entities, there are close overlaps. For example, capture fisheries provide fishmeal for use in aquaculture, either through the direct conversion of fish from reduction fisheries (such as Peruvian anchovies)471 into fishmeal or where by-products of fish processed for human consumption are converted into fishmeal. Since 2000, many former fishermen have shifted to aquaculture production. This is primarily because gradual declines in wild resources caused by overfishing reduced the economic returns to fishing in comparison to aquaculture.
Despite government efforts to reform capture fisheries by reducing the number of fishing vessels and replacing them with a more modern fleet, most fishing vessels remain small and only suitable for inshore fisheries. Efforts to shift fishermen away to other activities have proved difficult, and
471 Reduction fisheries are fish that are fished specifically for the aquaculture sector; they are so called because the catch is ‘reduced’ to fishmeal.
1980
1985
1990
1991
1992
1993
1994
1995
1996
1997
1998
1999
2000
2001
2002
2003
2004
2005
2006
2007
2008
2009
2010
Mill
ion
tonn
es
5
0
10
15
20
25
30
35
40
Algaes dry
Others
Crustanceans
Mollusces
Fishes
Figure 39: Production of different aquaculture products in China
Sources: Chinese Fisheries Yearbooks, various years.
Focus on aquaculture
133
both the number of fishermen and size of the fishing fleet remains stable despite these efforts.472
The slow pace of change in China’s land property rights that prevent farmers selling or buying land or ponds have also probably restricted aquaculture development. In particular, Chinese laws do not define aquaculturists’ rights clearly, meaning that they are less able to obtain long term investment or prevent harmful trespass and water pollution from external sources.473
On average, aquaculture farmers are older than other agricultural workers: more than 80% are between 41-60 years old.474 Younger people appear to be unwilling to work in the sector, due to relatively low incomes, hard physical work, lack of advancement opportunities, and the higher standards of living in urban areas. However, aquaculture sector wages have been rising, particularly in the processing sector, and labour costs are projected to rise significantly in the coming years.475
5. Processing Processing plants are mainly distributed along the coastline of China. In 2011, five provinces (Shandong, Zhejiang, Guangdong, Liaoning and Jiangsu) accounted for around 85% of aquatic processing plants and total processed aquatic production, with Shandong dominating.476 Processing is labour intensive and is mostly undertaken by small-scale enterprises. There a few larger processing enterprises, and there is a tendency towards consolidation and scaling up.
In 2011, 19.81 million tonnes of aquatic production was used as processing raw material, equivalent to just over 35% of total aquatic production, which is lower than the global average. The vast majority of products going for processing were derived from marine species. Commentators have noticed a focus on semi-finished products with low value-added.477 Most processing plants produce for the domestic market: only about 10% of the nearly 10,000 plants are approved to produce for export.478
By-products from processing range from between 20-60% of the harvested weight, and thus represent a considerable resource.479 These by-products are mostly used to produce fishmeal,
472 Liang M and Zhao Q. (2011). Investigation and empirical analysis of voluntary immigration and settle on land organized by government: Hanshou County in Hunan Province as an example. Economic Life Digest, (7): 170–172 (in Chinese).473 Liu X. (2007). Granting quasi-property rights to aquaculturists to achieve sustainable aquaculture in China. Ocean and Coastal Management, (50)5: 623–633.474 Zhang H, Yang Z and Wang Z. (2011). Labor quality of fishermen in metropolitan suburbs: based on field survey in Shanghai. Journal of Ocean University of China (Social Sciences Edition), (6): 23–27 (in Chinese).475 Xu Y. (2011). China to 2016: Labour cost for aquatic product processing enterprise will increase 120 percent. Journal of Modern Fisheries Information, (2): 31 (in Chinese).476 Fisheries Bureau of the Ministry of Agriculture. (2012). China Fisheries Statistical Yearbook 2012. Beijing: China Agriculture Press.477 Xie C. (2010). Problems and development countermeasures of aquatic products processing industry in China. Agricultural Technology Service, (27)6: 803–804 (in Chinese).478 Certification and Accreditation Administration of the PRC. (2013). List of Approved HACCP Verified Fishery Processing Plants Intendig to Export to the U.S., http://www.cnca.gov.cn/rjwzcjgb/qwfbcx/gwck/images/2013/08/19/CF380BEA60CE631B3C1832C4F782CC72.pdf479 Ni R, Hu J and Wang K. (2010). The integrated utilization of byproducts from aquatic products processing. Hebei Fisheries, (8): 47–50 (in Chinese).
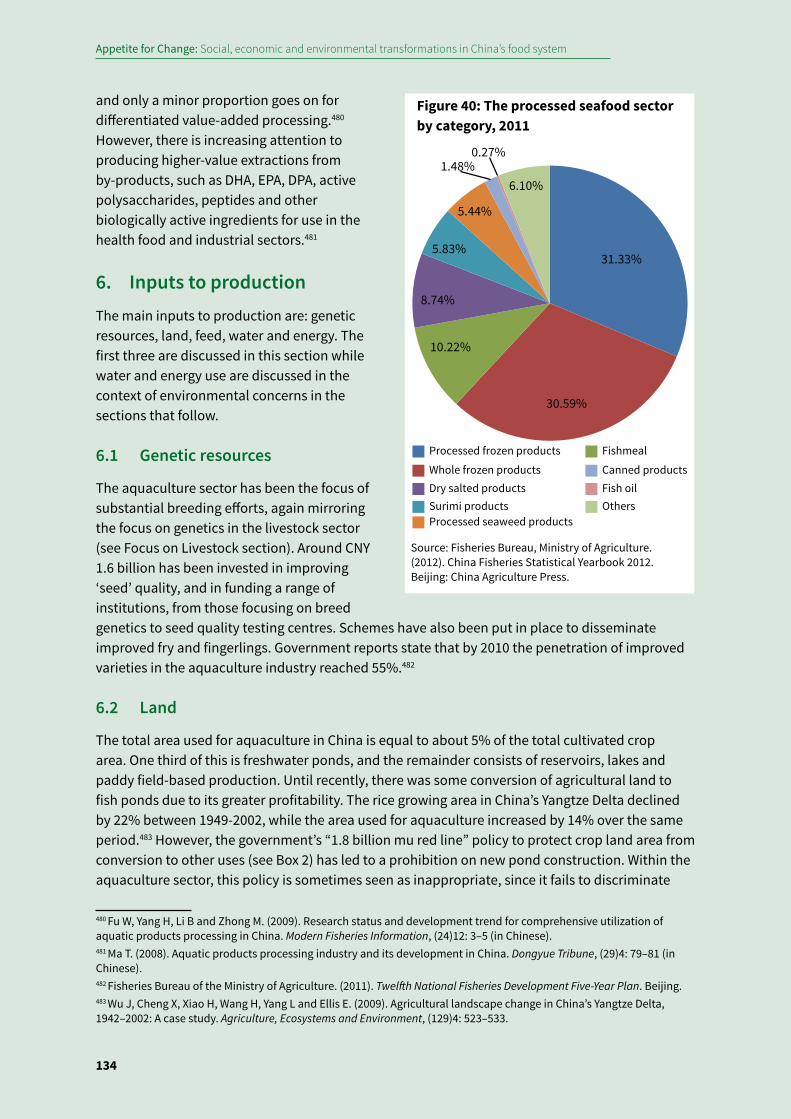
Appetite for Change: Social, economic and environmental transformations in China’s food system
134
and only a minor proportion goes on for differentiated value-added processing.480 However, there is increasing attention to producing higher-value extractions from by-products, such as DHA, EPA, DPA, active polysaccharides, peptides and other biologically active ingredients for use in the health food and industrial sectors.481
6. Inputs to productionThe main inputs to production are: genetic resources, land, feed, water and energy. The first three are discussed in this section while water and energy use are discussed in the context of environmental concerns in the sections that follow.
6.1 Genetic resources
The aquaculture sector has been the focus of substantial breeding efforts, again mirroring the focus on genetics in the livestock sector (see Focus on Livestock section). Around CNY 1.6 billion has been invested in improving ‘seed’ quality, and in funding a range of institutions, from those focusing on breed genetics to seed quality testing centres. Schemes have also been put in place to disseminate improved fry and fingerlings. Government reports state that by 2010 the penetration of improved varieties in the aquaculture industry reached 55%.482
6.2 Land
The total area used for aquaculture in China is equal to about 5% of the total cultivated crop area. One third of this is freshwater ponds, and the remainder consists of reservoirs, lakes and paddy field-based production. Until recently, there was some conversion of agricultural land to fish ponds due to its greater profitability. The rice growing area in China’s Yangtze Delta declined by 22% between 1949-2002, while the area used for aquaculture increased by 14% over the same period.483 However, the government’s “1.8 billion mu red line” policy to protect crop land area from conversion to other uses (see Box 2) has led to a prohibition on new pond construction. Within the aquaculture sector, this policy is sometimes seen as inappropriate, since it fails to discriminate
480 Fu W, Yang H, Li B and Zhong M. (2009). Research status and development trend for comprehensive utilization of aquatic products processing in China. Modern Fisheries Information, (24)12: 3–5 (in Chinese).481 Ma T. (2008). Aquatic products processing industry and its development in China. Dongyue Tribune, (29)4: 79–81 (in Chinese).482 Fisheries Bureau of the Ministry of Agriculture. (2011). Twelfth National Fisheries Development Five-Year Plan. Beijing. 483 Wu J, Cheng X, Xiao H, Wang H, Yang L and Ellis E. (2009). Agricultural landscape change in China’s Yangtze Delta, 1942–2002: A case study. Agriculture, Ecosystems and Environment, (129)4: 523–533.
31.33%
30.59%
10.22%
8.74%
5.83%
5.44%
1.48% 0.27%
6.10%
Processed frozen products
Whole frozen products
Fishmeal
Dry salted productsSurimi productsProcessed seaweed products
Canned productsFish oilOthers
Figure 40: The processed seafood sector by category, 2011
Source: Fisheries Bureau, Ministry of Agriculture. (2012). China Fisheries Statistical Yearbook 2012. Beijing: China Agriculture Press.
Focus on aquaculture
135
between high-yielding and low-yielding land areas where activities such as aquaculture might be more appropriate than grain farming.
Traditional integrated aquaculture systems, where fish were cultivated in paddy fields or in combination with silk worm production, such as in the Pearl River delta, are not the dominant form of production, and have either become highly intensified, or been replaced by industrial or urban land use.484 Recently, however, there has been a renewed interest in integrated production systems. The focus has been on integrating high value aquaculture species into high yielding rice systems, based on low chemical and fertiliser inputs.485 A typical example of these new systems is ‘rice-crab’ farming. Rice yields in these systems are typically 5%-17% higher than under monoculture rice farming, added to which around 375 kg of crab are produced per hectare. In 2011, rice-fish farming systems (including rice-crab farming) covered around 1.2 million ha, accounting for 4% of the total rice farming area.486
In addition to direct land use, aquaculture is also an indirect user of land through its increasing dependence on dedicated feed ingredients. This raises issues similar to those emerging in relation to feed for the livestock sector, although the total volume of feed use in aquaculture is smaller.
6.3 Feed production
The rapid increase in both volume and productivity in the aquaculture sector has largely been achieved through a shift towards more intensive production systems which are reliant on the use of feedstuffs, particularly commercial feeds but also those that are produced and/or manufactured on the farm. Feed accounts for the largest cost component in aquaculture, and the trend towards greater intensification increases its share of total costs further: feed accounts for 40%-60% of total costs for semi-intensive systems and 60%-80% for intensive systems.
There are four main kinds of ‘feed inputs’ to the aquaculture sector: � Fish based resources, including fishmeal and oil, and trash fish � Terrestrial plant resources, including oilseed cakes and agricultural by-products such as rice
bran � Algae, whose growth is sometimes stimulated through the use of fertiliser � Terrestrial livestock based resources, including meat and bone meal, feather meal and blood
meal as well as ‘wet’ by-products from abattoirs
Another way of categorising the feed input sector is by level of commercialisation. According to the species and production system, farmers may use:
� Commercial feeds, including nutritionally optimised, species-specific feeds made of various combinations of fishmeal/oil, and/or oilseeds
484 Chen J. (2002). Reducing water area: the price of urbanization. Journal of Shanghai Polytechnic College of Urban Management, (13)5: 35–36 (in Chinese); Edwards P. (2008). The changing face of pond aquaculture in China. Global Aquaculture Advocate, (Sepetember/October): 77–80.485 Wang W. (2011). Research on status and the development countermeasures of rice-aquaculture technology in China. China Fisheries, (11): 43–48 (in Chinese). 486 Fisheries Bureau of the Ministry of Agriculture. (2012). China Fisheries Statistical Yearbook 2012. Beijing: China Agricultural Press; National Bureau of Statistics of China. (2012). China Statistical Yearbook 2012. Beijing: China Statistics Press; Wang W. (2011). Research on status and the development countermeasures of rice-aquaculture technology in China. China Fisheries, (11): 43–48 (in Chinese).
Appetite for Change: Social, economic and environmental transformations in China’s food system
136
� ‘On farm feeds’, manufactured on-farm from purchased ingredients such as oilseeds (rape, cottonseed or soy) and mixed or pelleted to improve digestibility
� Trash fish, which are fed to high value carnivorous species; trash fish include marine discards as well as (to a small degree) low value fish from fresh water aquacultural systems. They may be given to fish as they are or combined with other purchased ingredients to make on-farm mixed feeds
There are no data on the total volume of feed use in China. However, commercial aquafeed is a rapidly growing sector, with production increasing 17-fold between 1991-2008 from 0.75 million tonnes to 12.75 million tonnes.487 While this volume of production places China as the world’s top aquafeed producer, it nevertheless accounts for only 10% of total feed animal production in China, indicating the sheer size of the livestock feed sector.488
Further intensification and species diversification is expected to stimulate further growth in demand for commercial feeds, particularly as an input to production of newly introduced (generally carnivorous or omnivorous) species. The value of feed and chemical inputs to aquaculture has grown faster than product value, with average annual growth rates ranging between 10%-35%. This suggests that the productivity and profitability of the aquaculture sector is declining.
Freshwater carps and tilapias are the biggest consumers of commercial aquafeeds, followed by shrimp.489 This is interesting for several reasons. First, it signals a shift towards intensification and away from more traditional, semi-extensive systems of production. Second, it highlights the fact that the production of carnivorous fish, which tends to depend more on feed inputs, is still relatively minor in comparison with herbivorous and omnivorous fish production. And third, while carp production is increasingly reliant on commercially formulated feeds, these systems tend to produce more than just carp. For example, a recent survey shows that in the major Chinese carp farming area of China (the middle and lower reaches of the Yangtze River and the Pearl River), where more than 95% of the farmers use manufactured feeds, a great variety of high value species are farmed in addition to carp in these farms to improve economic returns.490
Feed components: Lack of data means that it is not possible to provide a breakdown of the balance between fish- and plant-based inputs to feed production in China. However, one study states that rapeseed and cottonseed meal together account for more than 40% of freshwater fish feed ingredients.491 Indeed, 35% of rapeseed meal produced nationally is used in fish production.
487 Miao W and Liao M. (2007). Analysis of feeds and fertilisers for sustainable aquaculture development in China. In M Hasan, T Hecht, S de Silva and A Tacon (eds). Study and analysis of feeds and fertilisers for sustainable aquaculture development. Rome: FAO. pp. 141-190; Mai K. (2010). Studies on the developmental strategies of aquaculture nutrition and feed industry development in China. Feed Industry, (31)A01: 1–9 (in Chinese). 488 Fang S. (2012). Chinese aquaculture feed industry development opportunities and challenges in next five years. Guangdong Feed, (9): 20–21 (in Chinese); Mai K. (2010). Studies on the developmental strategies of aquaculture nutrition and feed industry development in China. Feed Industry, (31)A01: 1–9 (in Chinese); Li H H. (2008). 2009, China’s shrimp industry looking after upgrading. Inland Aquatic Products, (36)12: 16–18 (in Chinese). 489 Miao W and Liao M. (2007). Analysis of feeds and fertilisers for sustainable aquaculture development in China. In M Hasan, T Hecht, S de Silva and A Tacon (eds). Study and analysis of feeds and fertilisers for sustainable aquaculture development. Rome: FAO. pp. 141-190.490 Chiu A, Li L, Guo S, Bai J, Fedor C and Naylor R. (2013). Feed and fishmeal use in the production of carp and tilapia in China. Aquaculture, (414-415): 127–134.491 Ye Y and Cai C. (2011). The new situation and countermeasures of China aquatic feed. Feed Industry, (32)2: 1–10 (in Chinese).
Focus on aquaculture
137
In contrast, much less soymeal is used. Soymeal consumption in aquaculture accounts for less than 6% of the total consumed in China, while poultry, pigs and ruminants consume 52%, 29% and 13% of soy meal respectively.492
While use of plant-based feed inputs is growing due to their lower cost and greater availability, fish meal and fish oils are still major inputs to aquaculture production. The aquaculture sector in China uses 64% of all fishmeal consumed in China, up from 32% in 2005. Most commercial feeds include fishmeal but the proportions will vary depending on the requirements of the species. Higher value farmed species such as shrimp and farmed marine fish are more dependent on these ingredients.493 Higher prices and possibly greater concerns about its sustainability have meant that their production and use has levelled off recently.494 This has spurred efforts to find replacements – both plant-based (such as imported soy) and animal-based (by-products from the livestock sector). It has also meant that relationship building with South America, a source of high quality fish meal, has become a critical part of foreign policy.495
Although the use of commercial feed is growing rapidly, commercial formulated feeds account for only 40%-45% of all herbivore, omnivore and carnivore production.496 The remaining 55%-60% is fed on farm-produced feeds. These are mostly made from commercially bought-in ingredients such as oilseeds as well as on-farm resources such as wheat bran or rice bran. Larger producers in particular are able to invest in the necessary pelleting machinery, which makes this approach more cost-effective than buying in commercial feed.
7. TradeMost of the fish produced in China is consumed domestically. Nevertheless, China is still a major importer and exporter of fisheries products. While the volume of imports is greater than that of exports, the value of exports is significantly greater, reflecting the fact that China imports low value ingredients and exports value-added products. Trade is made up of the following:
� General trade, including whole fish as well as ornamental fish (which make up a very small proportion of the total)
� Processing trade, including raw material imported from other countries, which is then processed in China and re-exported
� Fishmeal.
492 Zhang W, Garnett T, Murray F J, Edwards P and Little D C. (2013). General overview of China’s aquaculture and fisheries sector. Stirling: Stirling University.493 Yang N. and Fu G. (2008). Study of fermented soybean meal replacement fish meal in litopenaeus vannamei feed. Feed Industry, (29)10: 24–26 (in Chinese). 494 Naylor R, Hardy R, Bureau D, Chiu A, Elliott M, Farrell A, Forster I, Gatlin D, Goldburg R, Hua K and Nichols P. (2009). Feeding aquaculture in an era of finite resources. Proceedings of the National Academy of Sciences of the United States of America, (106)36: 15103–10. 495 Murias A. (2012). China to import fishmeal and fish oil certified by Sernapesca. Fish Info & Services Co. Ltd., http://www.fis.com/fis/worldnews/worldnews.asp?l=e&id=53343&ndb=1496 Miao W and Liao M. (2007). Analysis of feeds and fertilisers for sustainable aquaculture development in China. In M Hasan, T Hecht, S de Silva and A Tacon (eds). Study and analysis of feeds and fertilisers for sustainable aquaculture development. Rome: FAO. pp. 141-190; Mai K. (2010). Studies on the developmental strategies of aquaculture nutrition and feed industry development in China. Feed Industry, (31)A01: 1–9 (in Chinese).
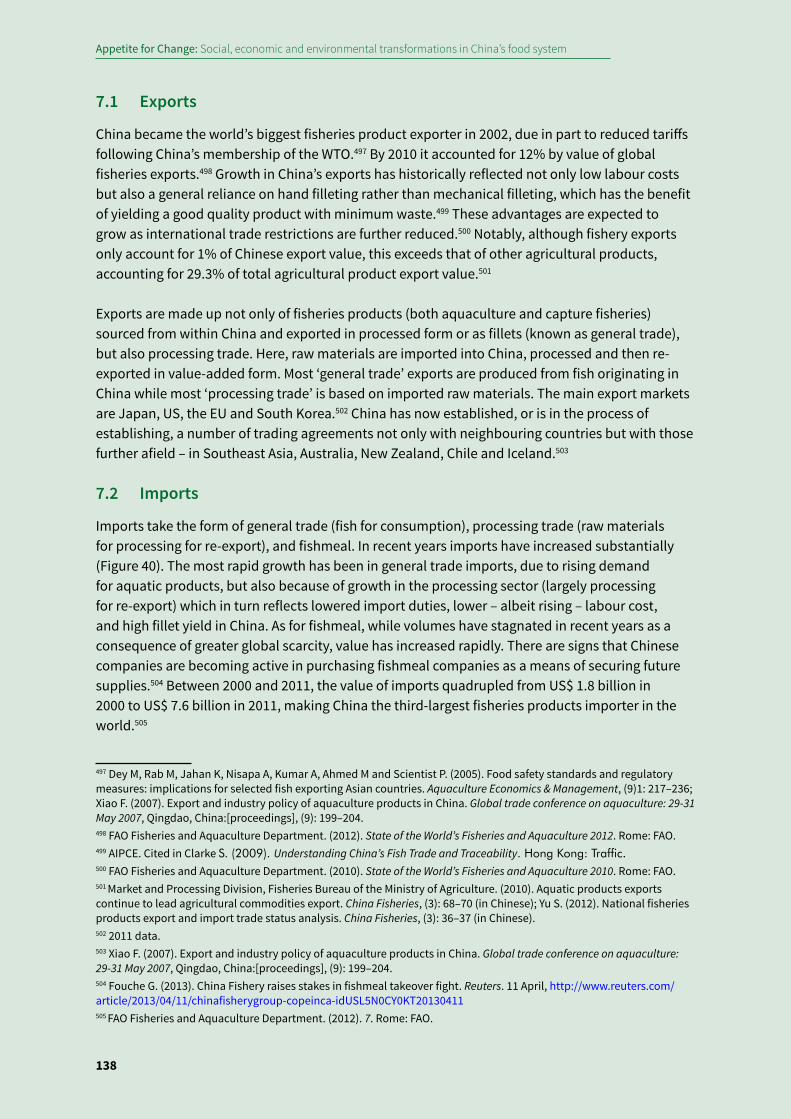
Appetite for Change: Social, economic and environmental transformations in China’s food system
138
7.1 Exports
China became the world’s biggest fisheries product exporter in 2002, due in part to reduced tariffs following China’s membership of the WTO.497 By 2010 it accounted for 12% by value of global fisheries exports.498 Growth in China’s exports has historically reflected not only low labour costs but also a general reliance on hand filleting rather than mechanical filleting, which has the benefit of yielding a good quality product with minimum waste.499 These advantages are expected to grow as international trade restrictions are further reduced.500 Notably, although fishery exports only account for 1% of Chinese export value, this exceeds that of other agricultural products, accounting for 29.3% of total agricultural product export value.501
Exports are made up not only of fisheries products (both aquaculture and capture fisheries) sourced from within China and exported in processed form or as fillets (known as general trade), but also processing trade. Here, raw materials are imported into China, processed and then re-exported in value-added form. Most ‘general trade’ exports are produced from fish originating in China while most ‘processing trade’ is based on imported raw materials. The main export markets are Japan, US, the EU and South Korea.502 China has now established, or is in the process of establishing, a number of trading agreements not only with neighbouring countries but with those further afield – in Southeast Asia, Australia, New Zealand, Chile and Iceland.503
7.2 Imports
Imports take the form of general trade (fish for consumption), processing trade (raw materials for processing for re-export), and fishmeal. In recent years imports have increased substantially (Figure 40). The most rapid growth has been in general trade imports, due to rising demand for aquatic products, but also because of growth in the processing sector (largely processing for re-export) which in turn reflects lowered import duties, lower – albeit rising – labour cost, and high fillet yield in China. As for fishmeal, while volumes have stagnated in recent years as a consequence of greater global scarcity, value has increased rapidly. There are signs that Chinese companies are becoming active in purchasing fishmeal companies as a means of securing future supplies.504 Between 2000 and 2011, the value of imports quadrupled from US$ 1.8 billion in 2000 to US$ 7.6 billion in 2011, making China the third-largest fisheries products importer in the world.505
497 Dey M, Rab M, Jahan K, Nisapa A, Kumar A, Ahmed M and Scientist P. (2005). Food safety standards and regulatory measures: implications for selected fish exporting Asian countries. Aquaculture Economics & Management, (9)1: 217–236; Xiao F. (2007). Export and industry policy of aquaculture products in China. Global trade conference on aquaculture: 29-31 May 2007, Qingdao, China:[proceedings], (9): 199–204.498 FAO Fisheries and Aquaculture Department. (2012). State of the World’s Fisheries and Aquaculture 2012. Rome: FAO.499 AIPCE. Cited in Clarke S. (2009). Understanding China’s Fish Trade and Traceability. Hong Kong: Traffic. 500 FAO Fisheries and Aquaculture Department. (2010). State of the World’s Fisheries and Aquaculture 2010. Rome: FAO.501 Market and Processing Division, Fisheries Bureau of the Ministry of Agriculture. (2010). Aquatic products exports continue to lead agricultural commodities export. China Fisheries, (3): 68–70 (in Chinese); Yu S. (2012). National fisheries products export and import trade status analysis. China Fisheries, (3): 36–37 (in Chinese). 502 2011 data.503 Xiao F. (2007). Export and industry policy of aquaculture products in China. Global trade conference on aquaculture: 29-31 May 2007, Qingdao, China:[proceedings], (9): 199–204. 504 Fouche G. (2013). China Fishery raises stakes in fishmeal takeover fight. Reuters. 11 April, http://www.reuters.com/article/2013/04/11/chinafisherygroup-copeinca-idUSL5N0CY0KT20130411 505 FAO Fisheries and Aquaculture Department. (2012). 7. Rome: FAO.
Focus on aquaculture
139
7.3 Future trends
Currently, the rate of imports is growing faster than that of exports, fuelled by growing domestic demand for aquatic products and potentially skewed by the rise of a premium market catering to the very rich. Some commentators suggest that the slowed rate of growth in exports reflects the economic downturn and that things are expected to pick up again as growth returns, although the rate of growth in imports will continue to be higher than that of exports. Others highlight rising labour costs in China and the appreciation of the Chinese Yuan and note that these, coupled with transport costs, may see China’s comparative advantage decline. At the same time, with rising domestic demand for aquatic products the sector may reorient to focusing more on growing domestic markets.
8. Consumption and marketsChina is a major consumer of aquatic products both in absolute and per capita terms. It consumes 40% of the global catch,506 and estimates based on availability of aquatic products suggest per capita consumption at between 32 kg and 40 kg per year.507 These figures are well above the global average and on a par with meat availability. Actual per capita intakes vary widely according to region, between coastal and inland regions, between rural and urban areas, and by socio-economic status. In 2011, per capita aquatic home consumption by urban residents was 14.62 kg, and for rural residents a substantially lower 5.36 kg.508 Consumption by the poorest quartile of the rural poor is about 12 kg per person per year, compared with 20kg for the richest rural quartile. In urban areas the figures are 20 kg and 27 kg respectively. Consumption in coastal areas is about 10.3 kg per capita per year, but declines towards inland areas, where it is only 1.62 kg per capita per year.509 Some 20%-35% of aquatic products are eaten outside the home, explaining the difference between survey and official data sources (see Box 15).
506 Yang Z. (2006). On Chinese fishery development strategy in the new period: Dialogue with Mr. Fan Xiao-jian. Chinese Fisheries Economics, (2): 71–80 (in Chinese). 507 FAO Fisheries and Aquaculture Department. (2012). State of the World’s Fisheries and Aquaculture 2012. Rome: FAO; National Bureau of Statistics. (2012). China Statistical Yearbook 2012. Beijing: China Statistics Press.508 National Bureau of Statistics. (2012). China Statistical Yearbook 2012. Beijing: China Statistics Press. 509 Chiu A, Li L, Guo S, Bai J, Fedor C and Naylor R. (2013). Feed and fishmeal use in the production of carp and tilapia in China. Aquaculture, (414–415): 127-134.
Source: Ma G. (2008). Aquatic products import and export trade analysis and prospect in 2007. Agriculture Outlook, (5): 31–35; Fisheries Bureau of the Ministry of Agriculture. (various years). China Fisheries Statistical Yearbook. Beijing: China Agriculture Press; Mu Y. (2007). Aquatic products export exceeded 9 billion CNY, total trade value hit a record high: 2006 national aquatic products import and export trade analysis. China Fisheries, (3): 8–10; Xiao F. (2002). Aquatic products import and export developed steady in 2001. China Fisheries, (3): 19–21; Xiao F. (2003). 2002 aquatic products import and export trade situation analysis. China Fisheries, (4): 16–19; Yu S. (2012). National fisheries products export and import trade status analysis. China Fisheries, (3): 36–37.
Figure 41: Import value of fisheries products by value (uS$ billion) and volume (million tonnes), by different categories
Appetite for Change: Social, economic and environmental transformations in China’s food system
140
There is a strong preference for live purchases, and this is the norm in rural and urban areas.510 Since live fish cannot easily or cost effectively be transported long distances, production tends to be located close to consumption and distributed by individual vendors both in markets and on the street. Around 60% of aquatic products are distributed in this way.511 However, in wealthier coastal regions, the dominance of live fish sales is being challenged by growth in cooked and processed fish products dependent on modern cold chains. These products are sold in supermarkets, typically to more affluent consumers, since prices can be as much as 50% higher than in wet markets.512 There is a growing acceptance of frozen seafood by Chinese consumers and the consumption of imported frozen seafood, especially high end, is expected to increase rapidly.513 Development of western fast food and supermarket chains as well as more widespread ownership of freezers is expected to increase frozen aqua product consumption in China.514
9. Environmental issues in the aquaculture and fisheries sectorChina’s fisheries and aquaculture sector is affected by environmental (including climatic) change (7.1), and also contributes to some major environmental challenges (7.2). Environmental impacts caused by capture fisheries and aquaculture include: nutrient losses and water pollution; overfishing; exotic species introduction; energy use and GHG emissions, and the question of resource efficiencies in relation to feed inputs.
9.1 Impacts of environmental change
There are only a few studies on the effects of climate change on fisheries in China. Analysis shows capture fisheries production of filefish (Navodon spp.) and hairtail (Trichiurus japonicas) are affected by both fishing pressure and climate change.515 Climate change also affects aquaculture, directly and indirectly through its impact on the mangrove.516
Some fisheries waters are seriously polluted with nitrogen, phosphate, oil and Cu2+,517 partly through the fisheries sector’s practices but more substantially as a result of other agricultural and industrial activities. Environmental degradation is now one of the biggest problems for both aquaculture and capture fisheries. Water quality deterioration has also been linked to outbreaks of
510 Hanson A, Cui H, Zou L, Clarke S, Muldoon G, Potts J and Zhang H. (2010). Greening China’s Fish and Fish Products Market Supply Chains. Winnipeg: IISD; Chiu A, Li L, Guo S, Bai J, Fedor C and Naylor R. (2013). Feed and fishmeal use in the production of carp and tilapia in China. Aquaculture, (414–415): 127-134.511 Zhou Y, Lv C and Lu L. (2008). Aquaculture logistics chain in China. Chinese Fisheries Economics, (26)4: 307–312 (in Chinese).512 Wu X. (2004). Hoping for qualitative leap of aquatic food market in China: Beijing supermarket aquatic products market research. China Fisheries, (4): 32–33 (in Chinese).513 Galiher J. (2011). China’s domestic seafood market. In GOAL 2011. Santiago, Chile: Global Outlook for Aquaculture Leadership. 514 Godfrey M. (2011). Change is afoot in China. SeafoodSource.com, http://www.seafoodsource.com/newsarticledetail.aspx?id=10414 515 Wang Y, Jia X, Lin Z and Sun D. (2011). Responses of Trichiurus japonicus catches to fishing and climate variability in the East China Sea. Journal of Fisheries of China, (35)12: 1882–1889 (in Chinese); Wang Y, Sun D, Jia X and Zirong H. (2013). Influence of fishing pressure and climate change on filefish catches in East China Sea. South China Fisheries Science, (9)1: 8–15 (in Chinese). 516 Gong J, Song Y and Chen S. (2009). Effects of global climate change on mangrove in Zhejiang coast. Journal of Anhui Agricultural Sciences, (37)20: 9742–9784 (in Chinese). 517 Ministry of Agriculture and Ministry of Environmental Protection. (2011). Report on the State of the Fishery Eco-Environment in China 2011. Beijing.
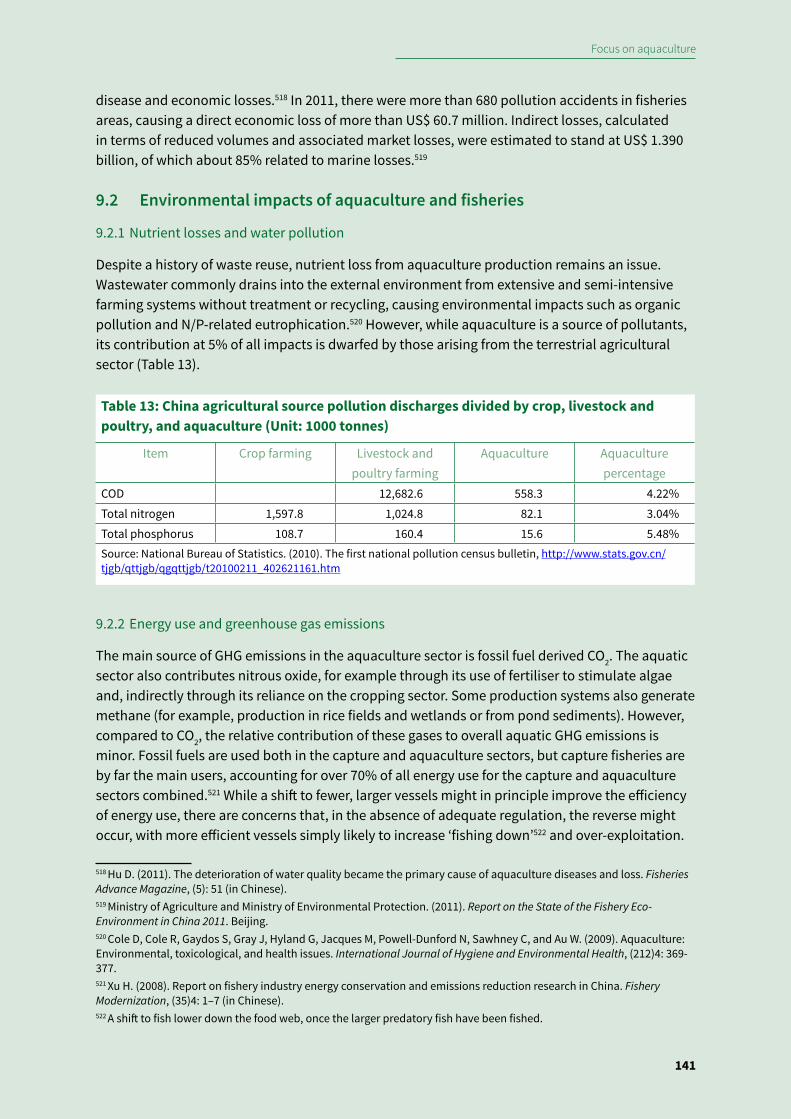
Focus on aquaculture
141
disease and economic losses.518 In 2011, there were more than 680 pollution accidents in fisheries areas, causing a direct economic loss of more than US$ 60.7 million. Indirect losses, calculated in terms of reduced volumes and associated market losses, were estimated to stand at US$ 1.390 billion, of which about 85% related to marine losses.519
9.2 Environmental impacts of aquaculture and fisheries
9.2.1 Nutrient losses and water pollution
Despite a history of waste reuse, nutrient loss from aquaculture production remains an issue. Wastewater commonly drains into the external environment from extensive and semi-intensive farming systems without treatment or recycling, causing environmental impacts such as organic pollution and N/P-related eutrophication.520 However, while aquaculture is a source of pollutants, its contribution at 5% of all impacts is dwarfed by those arising from the terrestrial agricultural sector (Table 13).
9.2.2 Energy use and greenhouse gas emissions
The main source of GHG emissions in the aquaculture sector is fossil fuel derived CO2. The aquatic sector also contributes nitrous oxide, for example through its use of fertiliser to stimulate algae and, indirectly through its reliance on the cropping sector. Some production systems also generate methane (for example, production in rice fields and wetlands or from pond sediments). However, compared to CO2, the relative contribution of these gases to overall aquatic GHG emissions is minor. Fossil fuels are used both in the capture and aquaculture sectors, but capture fisheries are by far the main users, accounting for over 70% of all energy use for the capture and aquaculture sectors combined.521 While a shift to fewer, larger vessels might in principle improve the efficiency of energy use, there are concerns that, in the absence of adequate regulation, the reverse might occur, with more efficient vessels simply likely to increase ‘fishing down’522 and over-exploitation.
518 Hu D. (2011). The deterioration of water quality became the primary cause of aquaculture diseases and loss. Fisheries Advance Magazine, (5): 51 (in Chinese). 519 Ministry of Agriculture and Ministry of Environmental Protection. (2011). Report on the State of the Fishery Eco-Environment in China 2011. Beijing. 520 Cole D, Cole R, Gaydos S, Gray J, Hyland G, Jacques M, Powell-Dunford N, Sawhney C, and Au W. (2009). Aquaculture: Environmental, toxicological, and health issues. International Journal of Hygiene and Environmental Health, (212)4: 369-377.521 Xu H. (2008). Report on fishery industry energy conservation and emissions reduction research in China. Fishery Modernization, (35)4: 1–7 (in Chinese). 522 A shift to fish lower down the food web, once the larger predatory fish have been fished.
Table 13: China agricultural source pollution discharges divided by crop, livestock and poultry, and aquaculture (unit: 1000 tonnes)
Item Crop farming Livestock and poultry farming
Aquaculture Aquaculture percentage
COD 12,682.6 558.3 4.22%Total nitrogen 1,597.8 1,024.8 82.1 3.04%Total phosphorus 108.7 160.4 15.6 5.48%Source: National Bureau of Statistics. (2010). The first national pollution census bulletin, http://www.stats.gov.cn/tjgb/qttjgb/qgqttjgb/t20100211_402621161.htm
Appetite for Change: Social, economic and environmental transformations in China’s food system
142
A comprehensive assessment of CO2 emissions resulting from both the capture and cultured sectors is lacking. However, one study estimates that CO2 emissions from aquaculture amounted to 10 million t CO2 in 2008, with freshwater ponds accounting for 73.8% of aquaculture CO2 emissions.523 If aquaculture uses 30% of all fossil fuels in the aquatic sector,524 and assuming a similar energy mix across the sector, the aquatic sector is likely to contribute about 33.3 million tonnes CO2e emission. This accounts for about 20.5% of all energy related CO2 from agriculture. However, when other GHGs are considered, the aquatic sector’s contribution to overall agricultural GHG emissions will be far lower, possibly at around 3-4% of total agricultural emissions (see Chapter Four).
9.2.3 Capture fisheries and overfishing
The state of China’s capture fisheries sector is in many ways representative of the global picture. Declining marine fisheries resources have been a reality since 1970s: sixteen species of major economic fin fish, seven crustacean and three molluscs have become depleted in the Yellow Sea fishing grounds alone. Recent surveys show that fisheries resources are continuing to decline with the majority of the catch containing a high proportion of juveniles and a trend towards lower trophic level, lower value species.525
Inland fisheries resources have also declined drastically. Around one third of the total 161 native fish species in the lower reaches of the Yangtze River are reported as endangered or even extinct because of overfishing, pollution, hydraulic projects, waterborne industry, land reclamation, illegal sand mining and invasive species.526 In the main stream of the Pearl River, one survey conducted in 2007 shows the number of fish species is now less than half that shown by records in the 1980s, and the situation is anticipated to worsen.
The deterioration in capture fisheries is being addressed through a range of measures including reducing fishing pressure through fishing vessel number control and fishing moratoriums, artificial propagation and release of juveniles and deployment of artificial reefs to enhance stocks.527 However, these efforts have met with limited success to date and have not improved fisheries yields.
9.2.4 Exotic species
Alien species introduction is a particular issue for the aquaculture sector, which does not have parallels with the terrestrial livestock sector in this regard. By the late 1990s, 63 fish species were
523 Liu H and Che X. (2010). Elementary study on evaluation of CO2 emissions from aquaculture in China. South China Fisheries Science, (6)4: 77–80 (in Chinese). 524 Based on Xu H. (2008). Report on fishery industry energy conservation and emissions reduction research in China. Fishery Modernization, (35)4: 1–7 (in Chinese).525 Huang L, Xie Y, Zhang Y, Li J and Liu Q. (2010). Current fisheries resources assessment in Xiamen Coastal Waters. Journal of Jimei University (Natural Sciences), (15)2: 81–87 (in Chinese); Lin L, Cheng J and Ling J. (2007). Analysis on recent status of the bottom trawl fishery resources in the East China Sea region. Marine Fisheries, (29)4: 371–374 (in Chinese). 526 Li Q and Jiao X. (2010). Reason And Countermeasure of Fisheries Resources Decline in Jiangsu Section of the Yangtze River. Journal of Yangtze University (Natural Sciences Edition), (7)1: 49–52 (in Chinese).527 Xu Z and Li X. (2008). Various causes of China’s fishery resources decline and their combined solution. Fishery Modernization, (35)3: 47–51 (in Chinese).
Focus on aquaculture
143
reported as introduced into China’s aquaculture sector,528 but more recent data indicate that 129 alien aquatic species have now been introduced.529 There have also been transfers of local Chinese species to other parts of China. Commentators note that these introductions have caused problems, including disease, and may have contributed to the extinction of some native species.530
9.2.5 Efficiency
Two key trends are emerging in China’s aquaculture production, both of which have environmental implications. One is the shift from production and consumption of herbivorous and/or filter feeding fish towards omnivorous and carnivorous fish. Second is the trend towards intensification characterised by, among other things, the use of more dedicated commercial feedstuffs both for herbivorous and carnivorous species. The environmental implications of these trends hinge upon their ‘efficiency’. There is much discussion about the need to improve the ‘efficiency’ of China’s aquaculture sector, mirroring the livestock debate, but the word has very different connotations for different observers. Some commentators note that China’s aquaculture sector is already highly efficient, while others argue that it is inefficient. This apparent contradiction arises because the word ‘efficiency’ is used in very different ways. With respect to aquaculture production in China there are at least four possible interpretations. Different stakeholders use the term differently depending on their views as to which aspects of sustainability are most important.
Box 30: Feeding fish to fish: the fishmeal issue
One issue that frequently arises in discourses around the environmental impacts of aquaculture is the use of fishmeal. Fishmeal is generally produced from four sources: from dedicated reduction fisheries, from by-catches, from trash fish and from processing waste. About half of the fishmeal used in China is imported, and most of this is produced from dedicated reduction fisheries, although the origins of imports from Southeast Asia are not certain. Most fishmeal produced in China is based on processing waste (Figure 41).
Is the use of fish to raise fish inherently wasteful? Where fishmeal is produced from unsustainably managed reduction fisheries, clearly there is cause for concern. However, fishmeal produced from well managed sources, such as the Peruvian anchovy fisheries where fish are still relatively abundant, may not contribute to resource depletion. While anchovies can be consumed directly, there is little market demand for them. Arguably, feeding anchovies to carnivorous farmed fish may be preferable to capturing wild fish from less sustainably managed stocks for direct consumption. Since the feed conversion efficiency of aquaculture production is typically higher than in other livestock systems, feeding fishmeal to fish delivers a greater output of animal product than feeding fishmeal to, say, pigs or poultry.
The use of by-catch (such as dolphin) reflects unsustainable fishing practices and warrants cause for concern, as does the use of trash fish. The environmental impacts associated with the use of trash fish tend to be substantially greater than those associated with fishmeal production, and the vast majority of trash fish used are juveniles of high value species.531
528 Lou Y. (2000). Present situation and countermeasure of the study on fish introduction in China. Journal of Fisheries of China, (24)2: 185–192 (in Chinese).529 Wang Y and Cao W. (2006). The strategies of aquatic invasive alien species (IAS) in China. Journal of Agro-Environment Science, (25)1: 7–13 (in Chinese).530 Jia P, Zhang W and Liu Q. (2013). Lake fisheries in China: challenges and opportunities. Fisheries Research, (140): 66–72. 531 Feng Y and Yang J. (2009). Protect resources and create new technologies: seeking a new thought for homemade fish meal. Guangdong Feed, (11): 11–14 (in Chinese).
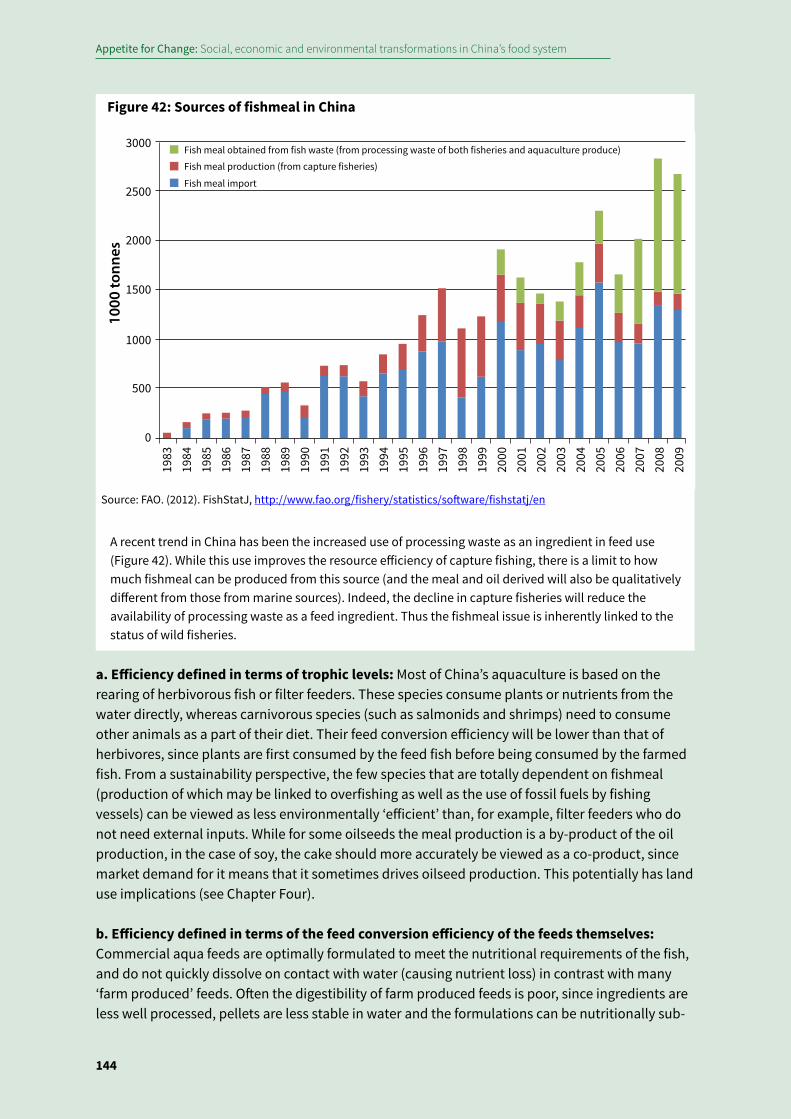
Appetite for Change: Social, economic and environmental transformations in China’s food system
144
Fish meal obtained from fish waste (from processing waste of both fisheries and aquaculture produce)
Fish meal production (from capture fisheries)
Fish meal import
1983
1984
1985
1986
1987
1988
1989
1990
1991
1992
1993
1994
1995
1996
1997
1998
1999
2000
2001
2002
2003
2004
2005
2006
2007
2008
2009
0
500
1000
1500
2000
2500
3000
1000
tonn
esFigure 42: Sources of fishmeal in China
Source: FAO. (2012). FishStatJ, http://www.fao.org/fishery/statistics/software/fishstatj/en
A recent trend in China has been the increased use of processing waste as an ingredient in feed use (Figure 42). While this use improves the resource efficiency of capture fishing, there is a limit to how much fishmeal can be produced from this source (and the meal and oil derived will also be qualitatively different from those from marine sources). Indeed, the decline in capture fisheries will reduce the availability of processing waste as a feed ingredient. Thus the fishmeal issue is inherently linked to the status of wild fisheries.
a. Efficiency defined in terms of trophic levels: Most of China’s aquaculture is based on the rearing of herbivorous fish or filter feeders. These species consume plants or nutrients from the water directly, whereas carnivorous species (such as salmonids and shrimps) need to consume other animals as a part of their diet. Their feed conversion efficiency will be lower than that of herbivores, since plants are first consumed by the feed fish before being consumed by the farmed fish. From a sustainability perspective, the few species that are totally dependent on fishmeal (production of which may be linked to overfishing as well as the use of fossil fuels by fishing vessels) can be viewed as less environmentally ‘efficient’ than, for example, filter feeders who do not need external inputs. While for some oilseeds the meal production is a by-product of the oil production, in the case of soy, the cake should more accurately be viewed as a co-product, since market demand for it means that it sometimes drives oilseed production. This potentially has land use implications (see Chapter Four).
b. Efficiency defined in terms of the feed conversion efficiency of the feeds themselves: Commercial aqua feeds are optimally formulated to meet the nutritional requirements of the fish, and do not quickly dissolve on contact with water (causing nutrient loss) in contrast with many ‘farm produced’ feeds. Often the digestibility of farm produced feeds is poor, since ingredients are less well processed, pellets are less stable in water and the formulations can be nutritionally sub-
Focus on aquaculture
145
optimal. The consequence is that use of commercial feeds leads to a greater volume of edible fish output relative to feed input. It also leads to less water pollution.
c. Efficiency defined in terms of resource use: Resources here include: i. the use of specially produced feedstuffs (based on fishmeal and/or oilseed cake); ii. land: and iii. energy/fossil fuels.
Feeds: In contradiction to (b), production based on the use of feeds based on agricultural by-products might be considered to be more resource-efficient than systems based on the use of commercially formulated feeds, even if the feed conversion efficiency of the former is lower, since the feeds are based on local by-products from other agricultural activities rather than on fish captured for the purpose, or on soy (where this is used). Edible fish is produced from unavoidable waste inedible to humans. However, even on-farm feed production tends to rely on bought-in commercially produced ingredients such as oilseeds and maize so the proportion of fish reared on ‘inedible’ by-products is in fact relatively low.
Land: Extensive systems based on the use of home grown feeds and/or no inputs may be resource-efficient in terms of feed inputs, but their use of land – itself a limited resource – will be greater than more intensive systems and so more land is required for a given level of production. On the other hand, the land used in these systems may not be suitable for other forms of cultivation, such as cropping or livestock production, particularly where water sources are brackish. Moreover, in contrast to systems utilising commercial feedstuffs, where soy may be a component of those feeds, these extensive systems are not responsible for incurring land use change elsewhere.
Energy: Energy use in extensive systems is likely to be lower than in more intensive production for two reasons: first, fishmeal production is energy intensive due to the energy used in capture fisheries and, second, more extensive systems use much less energy compared to industrial aquaculture (although within ‘semi-intensive’ systems the range, in terms of energy use, is very large). According to a survey in 2008, the average energy consumption of freshwater ponds was 0.62 kWh/kg, compared with more intensive systems where energy use varies widely, depending on the system. For example, energy use ranges from 4.19 kWh/kg (marine water ponds), to 5.07 kWh/kg (recirculating aquaculture systems) to 8.66 kWh/kg (industrial flow-through culture).532
d. Efficiency defined in terms of total outputs from the system: Where a species is fed commercial feeds, its feed conversion ratio may appear relatively high, as compared with systems where no feeds are used at all. However, the true feed conversion ratio resulting from the use of commercial feeds may be better than what it appears to be since polyculture – the cultivation of other species at the same time – can be practiced in these high input systems. The outputs from these non-mainstream species tend not to be included in the feed conversion ratio calculations. Filter feeders, such as bighead carp and silver carp, two of the most important species in Chinese inland aquaculture, are not ‘fed’ but rather consume plankton produced by secondary fertilisation from the breakdown of uneaten pelleted feed and the wastes of pellet-fed target fish species raised with them in polyculture. Their co-production improves the efficiency of the system as a whole. On the other hand, from a life cycle perspective, arguably some of the environmental impacts resulting from the use of feedstuffs fed to the target commercial species should properly be allocated to these ‘free riding’ species. Adding further complexity, while low trophic level 532 Che X, Liu H, Wu J and Zhuang B. (2010). Investigation into energy consumption of aquaculture in China. Fishery Modernization, (37)2: 9–13 (in Chinese).
Appetite for Change: Social, economic and environmental transformations in China’s food system
146
species such as carp may be more efficient in terms of their feed requirements than high trophic species, there are also carcass utilisation issues to consider. More edible product is obtainable from a salmonid species than from carp, for example, offsetting some of these higher apparent efficiencies, although the extent to which the whole fish is used will also relate to factors such as the size of the fish, methods of preparation and the poverty of the consumer.
Perhaps two observations emerge most clearly from this discussion of efficiency. First, that ideas about the desired future direction of China ’s aquaculture sector very much depends on one’s definition of efficiency and how the boundary of the aquaculture system is defined. And, second, that life cycle analyses that examine the environmental impacts and issues resulting from China’s very diverse systems of aquaculture are urgently needed.
Box 31: Crop, livestock and aquaculture linkages
The livestock, aquatic and crop sectors have historically interacted in multiple ways and these interactions continue today. Traditional integrated aquaculture systems used waste nutrients (such as manure) from monogastric livestock or silkworm production to fertilise fishponds, thereby stimulating the production of phytoplankton and zooplankton which are food for fish.533 Fish have also traditionally been raised in flooded rice paddies, with these systems thereby providing both staple carbohydrates and essential proteins and micronutrients. These systems had the advantage of turning waste products into useful inputs and diversifying outputs of the system as a whole.
The industrialisation and intensification of aquatic, crop and livestock production has increased output in each, but the separation of the sectors has reduced the extent to which nutrients are recycled, leading to nutrient surpluses in some areas and the need for external fertilisation with artificial inputs in other areas.534 Demand for raw feed materials (e.g., fishmeal and oilseeds) also creates competition between the livestock and fisheries sectors. A shared reliance on huge volumes of imported feed raw materials, such as maize and soybean, has emerged in recent years.
The sectors are also linked in other ways. For example, by-products of livestock production, such as meat and bone meal, feather meal and blood meal are widely used in the Chinese aquatic feed industry for aquatic animals,535 while fishmeal is fed to terrestrial as well as aquatic animals.536 The two sectors can also substitute for one another in the market. If the price of one sector increases or if food safety problems arise in it, this can trigger a shift towards increased consumption in another – as seen in the case of outbreaks of avian influenza.
533 Edwards P. (2009). Traditional Asian aquaculture: definition, status and trends. In G Burnell and G Allan (eds). New Technologies in Aquaculture, Improving Production Efficiency, Quality and Environmental Management. Cambridge: Woodhead Publishing Ltd. pp. 1029–1063; Edwards P. (2011). Recent developments and future prospects of inland aquaculture in Asia. Aquaculture Asia, (16)1: 3–10; Wang W. (2000). Culture and Enhancement of Fishes. Shanghai: China Agriculture Press.534 Edwards P. (2009). Traditional Asian aquaculture: definition, status and trends. In G Burnell and G Allan (eds). New Technologies in Aquaculture, Improving Production Efficiency, Quality and Environmental Management. Cambridge: Woodhead Publishing Ltd. pp. 1029–1063; Edwards P. (2011). Recent developments and future prospects of inland aquaculture in Asia. Aquaculture Asia, (16)1: 3–10.535 Xiao J and Jin Q. (2012). The research and application of meat and bone meal. Cereal and Feed Industry, (6): 56–59 (in Chinese).536 Chen M. (2012). Fish meal market analysis and purchasing strategy in 2012. Ocean and Fishery, (4): 95–97 (in Chinese).

Focus on aquaculture
147
10. Food safetyFood safety problems of aquatic product are caused by many factors including water pollution, chemical residues, the presence of parasites and microorganisms, and poor hygiene during processing and transport.537 Aquatic product food safety began to emerge as a particular issue alongside the development of export trade, the safety requirements of overseas markets and the uncovering of various food safety scandals. These scandals resulted in a ban on Chinese shrimp exported to the EU in 2002, after the detection of chloramphenicol residues, and in 2003, the refusal of eel imports to Japan after enrofloxacin residues were detected. These events focused the government to prioritise aquatic food safety issues.538 The China Entry-Exit Inspection and Quarantine (CIQ) registration system was established in 2004 to ensure traceability from aquaculture farm or fishing vessel to final product of export aquatic products.539
A large number of processing facilities in China producing for export have now achieved certification to various international sanitary standards such as the HACCP Principles ISO 22000, as well as Chain of Custody certification under the Marine Stewardship Council scheme.540 More than 1600 processing plants have attained single or multiple certification by the EU, US, Vietnam and South Korea. While this is a small fraction of the estimated 10,000 processors active in China, this figure represents a 70% growth in the number of certified processors since 2006.541
Efforts to meet health standards set by exporting countries have had the effect of promoting consolidation and scaling up, supported by government and paralleling developments in the livestock sector. Indeed the mainstream view was that the future for aquaculture lay in industrialisation. Large-scale, intensive and highly consolidated confined systems were seen to be more efficient and more able to contain pollution and disease than traditional or artisanal practices and more easy to monitor. However, studies have shown that these systems consumed ten times more energy than pond culture per kg fish produced.542 They also caused serious environmental problems such as eutrophication, disease transmission and groundwater depletion.543 Other responses have included the promotion of ‘high health’ aquaculture, which sets standards for equipment, seed-producing practice, stocking density, water treatment, feed quality,
537 Le J. (2008). Issues and countermeasures on the quality and safety of aquatic product. Food Science and Technology, (33)6: 178 (in Chinese).538 Pan W, Luo Q, Liu W, Lin Q and Tu J. (2011). Analysis and countermeasure of the problems of drug residues in aquatic products and aquatic feed. Fujian Journal of Agricultural Sciences, (26)6: 1096–1100 (in Chinese).539 China Entry-Exit Inspection and Quarantine Bureau. (2004). On Printing and Distributing the Notifications of the “Export Aquatic Traceability Procedures (Trial)” and “Exit Aquatic Products Inspection and Quarantine and Regulatory Requirements (Trial)”. No. 348. Beijing.540 Hanson A, Cui H, Zou L, Clarke S, Muldoon G, Potts J and Zhang H. (2010). Greening China’s Fish and Fish Products Market Supply Chains. Winnipeg: IISD.541 CNCA. (2010). List of HACCP validated and registered fisheries enterprises exports to the U.S.; CNCA. (2011). List of Chinese fisheries enterprises registered in Vietnam; CNCA. (2011). List of Chinese fisheries enterprises registered in South Korea, http://www.cnca.gov.cn/rjwzcjgb/qwfbcx/gwck/default.shtml; EC DG SANCO. (2010). Third Country Establishment Lists by Country—China, https://sanco.ec.europa.eu/traces/output/listsPerCountry_en.htm; INFOYU. (2007). Directories of certified China fisheries enterprises exporting to global markets. Beijing: INFOYU Publications, http://www.infoyu.net/MoreFromUs/Publications/07-3-22-14.html542 Che X, Liu H, Wu J and Zhuang B. (2010). Investigation into energy consumption of aquaculture in China. Fishery Modernization, (37)2: 9–13 (in Chinese). 543 Wang Z and Cui L. (2009). The aquaculture actuality and development tendency of the industrialized seawater fish. Hebei Fisheries, (8): 46–52 (in Chinese).
Appetite for Change: Social, economic and environmental transformations in China’s food system
148
chemical use and management, and so forth,544 although at present this concept is not subject to any third party verification and is not used in promoting fish for export markets. Ecological aquaculture represents another response and is essentially a form of integrated agriculture aquaculture system (IAAS) typically including the concept of polyculture,545 again unsupported by any system of certification.
One consequence of this emphasis on stronger regulation and standards has been the exit of smaller players from the sector. Small-scale producers are less able to invest in the infrastructure and systems needed to comply with these standards (see Focus on Dairy for parallels). In coming years, environmental and animal welfare standards may increasingly come to present non-tariff barriers to trade, triggering further changes in the management and governance of the Chinese aquaculture sector.
Aquatic food safety concerns are increasingly a major issue within China too, partly driven by consumer concerns in relation to all food sectors, and partly due to the greater availability of information in this area. Drug residues in farmed turbot in 2006 caused major damage to the industry and a financial loss of more than US$ 165 million.546 Although in 2011 the Ministry of Agriculture established food safety monitoring systems in 144 large and medium-sized cities and found that 97.8% of seafood met the national standard,547 this has not been separately verified. Consumer confidence remains low and measures to ensure aquatic food safety are still not resolved. However, there is no traceability system for aquatic products in the domestic market. Although there were experiments in some important fisheries provinces to build aquatic product traceability systems, such a system is still not fully functional.548
A major problem for food safety governance in the aquatic sector has been that a very large number of agencies are directly or indirectly involved in food safety – directly through the development or administration of laws with respect to contamination, hygiene, veterinary drugs and so forth, and indirectly through their responsibilities for the management of natural resources such as water, which have an impact on the quality and safety of aquatic products. Prior to recent reforms in 2013, a large number of government agencies were involved in one way or another in aquatic product safety.549 These agencies spanned not just quality supervision, inspection and quarantine, but also health, agriculture, industry and commerce, railways and transport, science and technology, environmental protection and planning.550 Another study lists more than 50 laws, regulations and standards applicable to aquaculture.551 This complexity has made it difficult to
544 Zhao F. (2004). Researches on key technology of healthy aquaculture in China. Marine Fisheries Research, (25)4: 1–5 (in Chinese). 545 Liu G. (2011). Several discussions on development of ecological aquaculture in China. Journal of Tianjin Agricultural College, (18)2: 44–48 (in Chinese).546 Ma Y and Zhang X. (2012). Marine aquaculture fish vaccine development market analysis. Fisheries Advance Magazine, (5): 56–58 (in Chinese).547 Pan W, Luo Q, Liu W, Lin Q and Tu J. (2011). Analysis and Countermeasure of the Problems of Drug Residues in Aquatic Product and Aquatic Feed. Fujian Journal of Agricultural Sciences, (26)6: 1096–1100 (in Chinese). 548 Wang Y, Cai Y and Xu J. (2012). The current status of the traceability system at home and abroad and problems of traceability of aquatic products in China. Chinese Fishery Abstracts, (2)2: 75–78 (in Chinese). 549 FORHEAD (2014). Food Safety in China: Problems, Governance and Research. www.forhead.org.550 Broughton E and Walker D. (2010). Policies and practices for aquaculture food safety in China. Food Policy, (35)5: 471–478.551 Zhang W, Murray F, Liu L and Little D. (2011). Development trends and local sustainability perceptions for the international trade in seafood farmed in China. Stirling: Stirling University.
Focus on aquaculture
149
coordinate among agencies and can render the system opaque and vulnerable to abuse. The 2013 organisational reforms did much to streamline the distribution of responsibilities for food safety among government agencies).552
What is interesting is that efforts to scale up and industrialise the sector also alter and at times exacerbate the nature of food safety problems. Greater intensities of production can increase the risk of disease transmission. It is reported that the average annual economic loss caused by diseases is more than US$ 1.65 billion.553 This in turn has prompted therapeutic responses, such as the use of drugs, which create food safety problems in the form of drug residues in foodstuffs and environmental problems through the pollution of waterways. A large volume of medicines is used in the aquaculture industry, the major categories including disinfectants (the largest category), repellents and insecticides, water quality (sediment quality) improving agents, antibiotics and herb drugs. While some drugs previously used in aquaculture have been abolished, others continue to be permitted. The residues of some chemicals such as chloramphenicol have caused food safety concerns, and provoked bans from importing countries.554 China has sought to address some of these issues through the establishment of initiatives such as the Good Manufacturing Practices certification systems for chemical producers as well as by implementing the Regulations on Administration of Veterinary Drugs,555 but problems and concerns persist.
Poor water quality – which can be a consequence of greater intensification, as well as of other causes such as industrial pollution – can also cause disease problems and poor aquatic health also raises animal welfare issues. Hygiene-related safety problems arise due to the predominance of live fish transport. The water used in transit may be kept to a minimum to keep costs down and as a result its quality may deteriorate; this in turn can undermine the safety of the fish that is eventually consumed. While the concept of welfare in relation to fish is very undeveloped in both China and overseas, food safety, aquatic health and wellbeing, and environmental quality are clearly closely interlinked. The ChinaGAP standard (a regional franchising of the GLOBALgap standards) released in 2008 includes fish welfare in its requirements.556
Where fish are not alive, food safety risks occur due to inadequate cold storage infrastructure. It is estimated that only 23% of aquatic products were transported in frozen form and 40% in chilled form in 2010.557 More than 15% of aquatic products are lost during transport. Such losses have made logistics a major cost source, accounting for 70% of total seafood costs according to some assessments.558
552 FORHEAD (2014). Food Safety in China: Problems, Governance and Research. www.forhead.org.553 Yang X and Zheng Z. (2007). The application status and strategy of fishery medicine in China. Journal of Shanghai Fisheries University, (16)4: 374–380 (in Chinese).554 Serrano P. (2005). Responsible use of antibiotics in aquaculture. Rome: FAO.555 Yang X and Zheng Z. (2007). The application status and strategy of fishery medicine in China. Journal of Shanghai Fisheries University, (16)4: 374–380 (in Chinese).556 Lü Q, Yang Z and Chen E. (2009). Animal welfare and GAP requirements of aquaculture welfare. Scientific Fish Farming, (3): 40–41 (in Chinese). 557 Hu Y and Yang X. (2011). Aquatic products cold chain logistics development discussion. Henan Shuichan, (1): 7–9 (in Chinese). 558 Zhou Y, Lü C and Lu L. (2008). Aquaculture logistics chain in China. Chinese Fisheries Economics, (26)4: 307–312 (in Chinese).
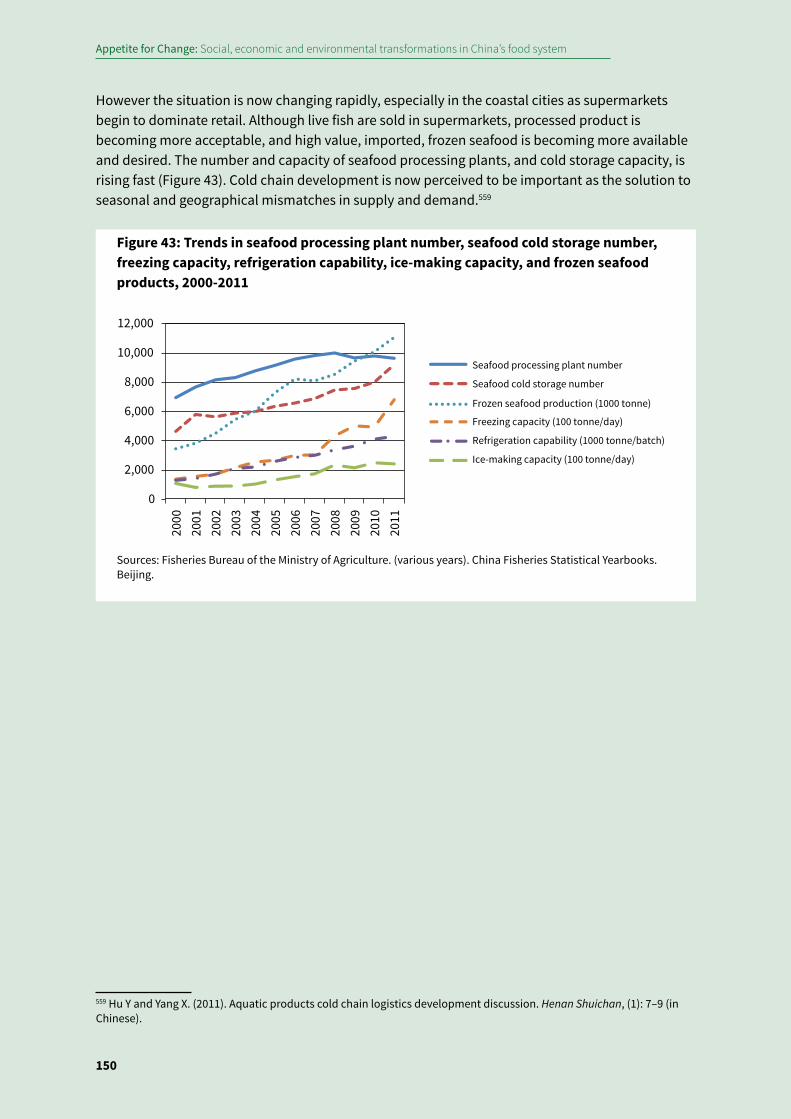
Appetite for Change: Social, economic and environmental transformations in China’s food system
150
However the situation is now changing rapidly, especially in the coastal cities as supermarkets begin to dominate retail. Although live fish are sold in supermarkets, processed product is becoming more acceptable, and high value, imported, frozen seafood is becoming more available and desired. The number and capacity of seafood processing plants, and cold storage capacity, is rising fast (Figure 43). Cold chain development is now perceived to be important as the solution to seasonal and geographical mismatches in supply and demand.559
559 Hu Y and Yang X. (2011). Aquatic products cold chain logistics development discussion. Henan Shuichan, (1): 7–9 (in Chinese).
0
2,000
4,000
6,000
8,000
10,000
12,000
2000
2001
2002
2003
2004
2005
2006
2007
2008
2009
2010
2011
Seafood processing plant number
Seafood cold storage number
Freezing capacity (100 tonne/day)
Refrigeration capability (1000 tonne/batch)
Ice-making capacity (100 tonne/day)
Frozen seafood production (1000 tonne)
Figure 43: Trends in seafood processing plant number, seafood cold storage number, freezing capacity, refrigeration capability, ice-making capacity, and frozen seafood products, 2000-2011
Sources: Fisheries Bureau of the Ministry of Agriculture. (various years). China Fisheries Statistical Yearbooks. Beijing.
Summary, conclusions and implications
151 7
7 Summary, conclusions and implications
This report has presented a picture of rapid, dynamic growth in China’s food system that has brought an interconnected set of benefits and challenges with both domestic and international implications. This chapter draws together the findings from the preceding analysis to highlight key policy challenges for the coming years, and to explore how research can contribute to addressing them.
The first section summarizes the major trends and associated issues that have emerged in the food system and their underlying drivers, and considers the interactions among them that will continue to be important in the coming decades. The resulting challenges and opportunities are explored in the following section through the lens of three broad narratives around the food system in China: a narrative of sufficiency (‘enough food’); of quality (‘safe and nutritious food’); and of abundance and excess. Each of these narratives can provide insights into the problems facing China’s food system and the potential ways forward. However, each narrative offers only partial perspectives: what is needed now is to integrate the insights they afford in order to develop a coherent vision for China’s food system. The final section looks to the future. It identifies key challenges facing policy makers and makes suggestions for further research to support informed decision making.
7.1 Past and future trends and issuesOver the last 35 years, alongside broader changes in China’s economy and society, China’s food system has been transformed. Food production has not only substantially increased but has also diversified. While the value of agricultural output has grown, and the sector is still a source of livelihoods for hundreds of millions of people, agriculture’s relative contribution to the economy has declined. Moreover, when examining food systems in China, agricultural production is no longer the only stage of importance: an increasingly complex and sophisticated food provisioning system is evolving, comprising multiple stages and actors. The distance between production and consumption has lengthened; the food processing sector is growing rapidly; and food products are sold through a range of marketing channels, retail and catering formats. The supply chain now extends beyond China, with imported commodities and products playing important roles in some key subsectors, the presence of a number of multinational corporations, and recent growth in investment by Chinese enterprises overseas.
The consequences of all these transformations for consumers have been profound. For the most part, people are no longer hungry – although there are important and persistent exceptions. Consumers have access not only to sufficient calories but also to more diverse foods. In particular, consumption of higher value meat, dairy and aquatic products, vegetable oils, processed foods, sugars and fruits has grown. Eating in restaurants and other catering establishments
Appetite for Change: Social, economic and environmental transformations in China’s food system
152
outside of the home has also increased and is associated with increasing consumption of meat and processed foods. Although total energy intake has decreased, as people in urban areas in particular lead more sedentary lifestyles, the decline in energy intake is less than the decline in energy requirements, and obesity and other impacts of diet on health are increasingly evident.
China’s food system is still dominated by small players, including 200 million farmers and countless individual and small-scale enterprises in food processing, transport, wholesale and retail. Most people continue to eat foods that, for the most part, have been produced, distributed and sold by individuals rather than large corporations. However, in the last 15 years, there have been gradual trends toward larger scales of production, growth of large scale enterprises and vertical integration in some supply chains. As elsewhere, these trends have been driven by business strategies to realise economies of scale in increasingly competitive markets and to improve the management of supply chains for quality management and food safety. These trends have also been strongly supported by government policies. Large scale farms and companies are perceived to offer economic and resource use efficiencies, and fewer, larger scale operations are also generally considered to be easier to monitor and regulate in relation to food safety, pollution and disease control. Other changes, such as migration to urban areas in search of better paid jobs, are also hastening these changes.
Growth in agricultural output, changes in the structure of production and consumption, and transformations in supply chains have had impacts on the environment, on health and nutrition and on food safety. The environmental impacts of agricultural production – including land degradation, soil and water pollution, unsustainable water use and greenhouse gas (GHG) emissions – are chiefly a consequence of two developments: reliance on increasing application of inputs and the resulting inefficiency of resource use; and growth in livestock production, a subsector that is both resource intensive and has large direct impacts on the environment. Beyond the production stage, it is increasingly apparent that some post-harvest activities also have large-scale environmental impacts. Food waste is an emerging problem, some of it caused by inadequate supply chain infrastructure (including storage and refrigeration), but increasingly also a consequence of changing attitudes and behaviours around food. Reliance on coal and biomass for cooking is a major contributor to total GHG emissions in the food system. The environmental impacts of China’s food system also extend beyond its borders. Imports of soy (driven by growing demand for animal feed), and to a lesser extent palm oil, maize and sugar, may have direct impacts on natural resources in supplying countries. Furthermore, GHG emissions from China’s food system are estimated at about 20-25% of domestic GHG emissions, or 4-5% of global GHG emissions.
The development of China’s food system has made a profound contribution to major improvements in people’s health in recent decades. Conditions associated with poverty and food insufficiency – infectious diseases, undernutrition and malnutrition, poor sanitation – are far less prevalent, though they continue to persist in some areas. However, health problems associated with wealth and abundance – including heart and pulmonary disease, strokes and diabetes – are increasingly prevalent. This reflects changing dietary patterns, and in particular the shift towards higher consumption of energy- and fat-rich foods, such as meat, vegetable oils and processed products. Risk-prone dietary patterns are compounded by increasingly sedentary lifestyles, other unhealthy behaviours such as smoking and alcohol consumption, and by the increasing
Summary, conclusions and implications
153 7
proportion of elderly among the population. Notably, these problems affect not only wealthy urban residents, but also the poor in both urban and rural areas. This shifting burden of risk – a result of both the nutrition transition and other non food lifestyle changes – is also seen in many other emerging economies, such as the other BRIC economies and some urban populations in Sub Saharan Africa.
Public concern about food safety has also risen in recent years, with documented food safety risks affecting many stages of food supply chains, from production through transport and storage to retail stages. Risks stem from a number of sources, including environmental pollution, agricultural chemicals and veterinary drugs, food additives, fake food products and the sale of out of date products. Many food safety risks interact in complex ways with underlying changes in the food system, including industry expansion, lengthening supply chains and changes in dietary patterns related to rising incomes and urbanisation. Although food safety has been a particular policy priority in recent years, effective regulation has been undermined by unclear distribution of mandates among government departments, weak regulatory capacities, and the rapidity of change in food supply chains.560
All these economic, environmental and health transformations and challenges are interwoven with changes in people’s attitudes and behaviours regarding food. There has been a discernible change in attitudes and expectations around food – a desire for richer foods, aspirational foods (including dairy and western style products) and conspicuous consumption. All this is perhaps an inevitable consequence of rising incomes, the desire to enjoy life after so many years of deprivation, the influence of diverse cultural values. At the same time, there are important counter-eddies to this general trend: these include growing concerns about health, the environment and animal welfare.
All these emerging issues are the result of multiple, interacting factors, some specific to the food system, but many also reflecting broader changes in Chinese society. Looking forward, which trends, and underlying influences are likely to be most important in driving future change?
To date, economic growth, rising incomes and urbanisation have been a complex of processes contributing to many aspects of change in China’s food system. Although growth has slowed in recent years, it is still rapid by any comparison, and even with slower growth, China is likely to become the world’s largest economy within the coming decades.561 Rising incomes are a major factor driving change in both rural and urban food consumption patterns, with contradictory effects. On the one hand, rising incomes are associated with increased consumption of meats, oils and other high value food products. There are clear associations of these trends with obesity and diabetes in both urban and rural areas, including – most worryingly – among children. Change in the structure of food consumption can be expected to continue as incomes continue to increase, and both the scale of the resulting health problems and the economic costs of this health burden are likely to increase. On the other hand, rising wealth is also associated with other changes in consumer preferences, in particular consumer perceptions and willingness to pay for ‘quality’ food.562 As incomes rise, both rural and urban consumers can be expected to ‘trade up’
560 FORHEAD (2014). Food Safety in China: Problems, Policy and Governance. www.forhead.org.561 World Bank and Development Research Center of the State Council. (2012). China 2030: Building A Modern, Harmonious, and Creative High-Income Society. World Bank: Washington D.C.562 Yu X and Abler D. (2009). The demand for food quality in rural China. American Journal of Agricultural Economics, 91(1): 57-69.
Appetite for Change: Social, economic and environmental transformations in China’s food system
154
within particular food types, preferring to purchase higher quality, higher value products. These preferences will be transmitted through supply chains, and in some cases will require changes in production practices. For some foods, consumer perceptions of quality also reflect food safety concerns, and consumer preferences are likely to reward firms that are able to maintain good practices.563 This may, over time, also extend to consumer concerns with the environmental, health and animal welfare impacts of food production.
urbanisation is also a systemic driver of change in China’s food system, affecting many aspects of both demand and supply stages in the food system. In the last 35 years, the scale of urbanisation in China has been unprecedented, with almost 450 million people becoming urban residents during this period. Projections suggest that a similar number of people will become urban residents in the coming decades.564 Along with rising incomes, urbanisation is associated with changes in consumption patterns, and rates of increase in per capita consumption of animal products have been much higher in urban than in rural areas. Combined with lifestyle changes, this contributes to the increasing prevalence of diet-related health impacts in urban areas. Lower fertility rates and longer life expectancy in urban areas have meant that the trend towards an ageing population structure is more pronounced in urban than in rural areas. Population ageing increases the incidence of many non-communicable diseases, with bone health being one particular diet-related concern in urban China. Food waste levels have been increasing particularly noticeably in urban areas. Aside from consumption, urbanisation is related to several other changes in the food system. The rapid development of the food processing industry is largely driven by urban demand. In some supply chains, demand among some urban consumers for processed foods with higher quality and food safety standards has driven transformations in supply chain relationships. Urbanisation has also influenced the location of agricultural production, in particular livestock production, with implications for the spatial distribution of waste emissions. As young people migrate to urban areas, this has reduced the availability of agricultural workers, creating new challenges but also opportunities for increasing labour productivity in this sector.
Agricultural policies have played a key role in addressing the demands of a changing society. With continued large investments in research and development and extension of agricultural technologies and irrigation, yields of most key agricultural products are expected to continue to increase and, with the exception of soy and possibly also maize and dairy products, China will likely be able to supply its own food needs in the next 20 years.565 Climate change and climate variability add uncertainty to future projections of agricultural output, but the high priority accorded to agriculture in the National Adaptation Strategy on Climate Change suggests that considerable resources will be devoted to addressing these risks.566 Policies to protect consumers from food price inflation have in general been effective, and with continual improvement will protect consumers from most likely food price shocks.
563 Ortega D, Wang H, Wu L and Olynk N. (2011). Modelling heterogeneity in consumer preferences for select food safety attributes in China. Food Policy, 36(2): 318-324.564 UN DESA (2010). World Population Prospects: The 2010 Revision. UN DESA: New York; World Bank and Development Research Center of the State Council. (2012). China 2030: Building A Modern, Harmonious, and Creative High-Income Society. World Bank: Washington D.C.565 Norse D, Lu Y and Huang J (2014). China’s food security: Is it a national, regional or global issue? In K. Brown (ed), China and the EU in Context. London: Palgrave.566 National Development and Reform Commission. (2013). National Climate Change Adaptation Strategy. Beijing.
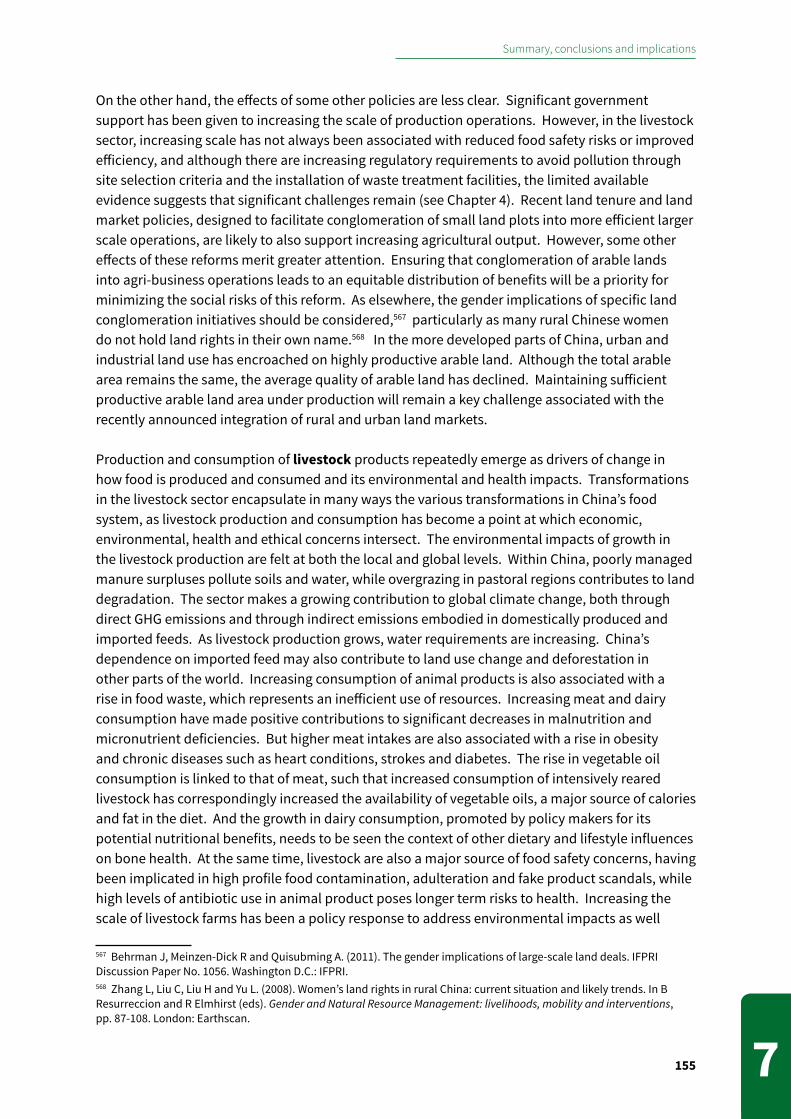
Summary, conclusions and implications
155 7
On the other hand, the effects of some other policies are less clear. Significant government support has been given to increasing the scale of production operations. However, in the livestock sector, increasing scale has not always been associated with reduced food safety risks or improved efficiency, and although there are increasing regulatory requirements to avoid pollution through site selection criteria and the installation of waste treatment facilities, the limited available evidence suggests that significant challenges remain (see Chapter 4). Recent land tenure and land market policies, designed to facilitate conglomeration of small land plots into more efficient larger scale operations, are likely to also support increasing agricultural output. However, some other effects of these reforms merit greater attention. Ensuring that conglomeration of arable lands into agri-business operations leads to an equitable distribution of benefits will be a priority for minimizing the social risks of this reform. As elsewhere, the gender implications of specific land conglomeration initiatives should be considered,567 particularly as many rural Chinese women do not hold land rights in their own name.568 In the more developed parts of China, urban and industrial land use has encroached on highly productive arable land. Although the total arable area remains the same, the average quality of arable land has declined. Maintaining sufficient productive arable land area under production will remain a key challenge associated with the recently announced integration of rural and urban land markets.
Production and consumption of livestock products repeatedly emerge as drivers of change in how food is produced and consumed and its environmental and health impacts. Transformations in the livestock sector encapsulate in many ways the various transformations in China’s food system, as livestock production and consumption has become a point at which economic, environmental, health and ethical concerns intersect. The environmental impacts of growth in the livestock production are felt at both the local and global levels. Within China, poorly managed manure surpluses pollute soils and water, while overgrazing in pastoral regions contributes to land degradation. The sector makes a growing contribution to global climate change, both through direct GHG emissions and through indirect emissions embodied in domestically produced and imported feeds. As livestock production grows, water requirements are increasing. China’s dependence on imported feed may also contribute to land use change and deforestation in other parts of the world. Increasing consumption of animal products is also associated with a rise in food waste, which represents an inefficient use of resources. Increasing meat and dairy consumption have made positive contributions to significant decreases in malnutrition and micronutrient deficiencies. But higher meat intakes are also associated with a rise in obesity and chronic diseases such as heart conditions, strokes and diabetes. The rise in vegetable oil consumption is linked to that of meat, such that increased consumption of intensively reared livestock has correspondingly increased the availability of vegetable oils, a major source of calories and fat in the diet. And the growth in dairy consumption, promoted by policy makers for its potential nutritional benefits, needs to be seen the context of other dietary and lifestyle influences on bone health. At the same time, livestock are also a major source of food safety concerns, having been implicated in high profile food contamination, adulteration and fake product scandals, while high levels of antibiotic use in animal product poses longer term risks to health. Increasing the scale of livestock farms has been a policy response to address environmental impacts as well
567 Behrman J, Meinzen-Dick R and Quisubming A. (2011). The gender implications of large-scale land deals. IFPRI Discussion Paper No. 1056. Washington D.C.: IFPRI.568 Zhang L, Liu C, Liu H and Yu L. (2008). Women’s land rights in rural China: current situation and likely trends. In B Resurreccion and R Elmhirst (eds). Gender and Natural Resource Management: livelihoods, mobility and interventions, pp. 87-108. London: Earthscan.

Appetite for Change: Social, economic and environmental transformations in China’s food system
156
as food safety concerns. Fewer, larger, and generally confined systems of production may be easier to regulate and monitor, better able to control or utilize waste effluents, and to manage animal health and contain zoonotic diseases. However, larger-scale production also brings its own problems and risks (including zoonosis, animal welfare challenges and more spatially concentrated environmental emissions). The livestock sector is therefore emerging as a domain in which many of the challenges of China’s food system transformation will need to be addressed. Ultimately the rise in livestock production and consumption raises important questions about the future of the food system in an increasingly crowded, wealthy, but resource constrained world. In these circumstances, two questions in particular merit further consideration. First, what is the role of animal products in a sustainable healthy diet? And second, what mix of measures and strategies are needed to orientate diets along a more sustainable path? These are questions that apply to other countries too, including Europe where these issues are receiving growing attention. As in China, however, experience with effective policy interventions is limited.
A final issue identified in this report concerns the overseas impacts of China’s increasingly globalised food system. Where China accounts for a significant proportion of international trade, the effects of China’s imports and exports of key agricultural commodities and products have been a focus of research and international discussion, although demand from China is by no means the only or most important factor driving changes in international trade flows and prices. There is likely to be increasing international concern with overseas investments in land and food companies. Although there is some speculation that Chinese involvement in land management and China as a source of final demand leads to a decline in environmental and social standards that affect people in supplying countries, this issue has not yet been rigorously researched. These speculations do highlight, however, that China’s overseas investments are likely to affect its relationships with the rest of the world. A further element of China’s global interactions that is not yet well understood is the impacts of climate change on the production of major commodities in countries from which China imports. This may have impacts not only on Chinese imports but also on the availability and price of these commodities for other importing countries. Current discourses are dominated by the influence of China’s ‘Going Out’ strategy. Over time, more nuanced understandings of China’s global interactions will be developed that better reflect its multiple dimensions.
7.2 Narratives about the food systemChina’s food system is a topic of intense interest for stakeholders both within and outside China, including policy makers, NGOs, research institutions, grant making foundations and, of course, citizens. Stakeholders place differing emphasis on positives and negatives trends, on achievements and challenges. They differ too in the scale of concern (global, national, local) and in their perspective. From among the cacophony of disparate discourses around food in China, three narratives, or ways of talking, can be discerned that serve as organising principles for discussion. One narrative centres on the question of ‘enough food’, as reflected in the focus of discussions on food security (narrowly defined). A second narrative is concerned with the question of ‘quality’ food – a concept here that links concerns about food safety and nutritional value. A third narrative celebrates ‘abundance’ and expresses concerns about the impacts of ‘excess’.
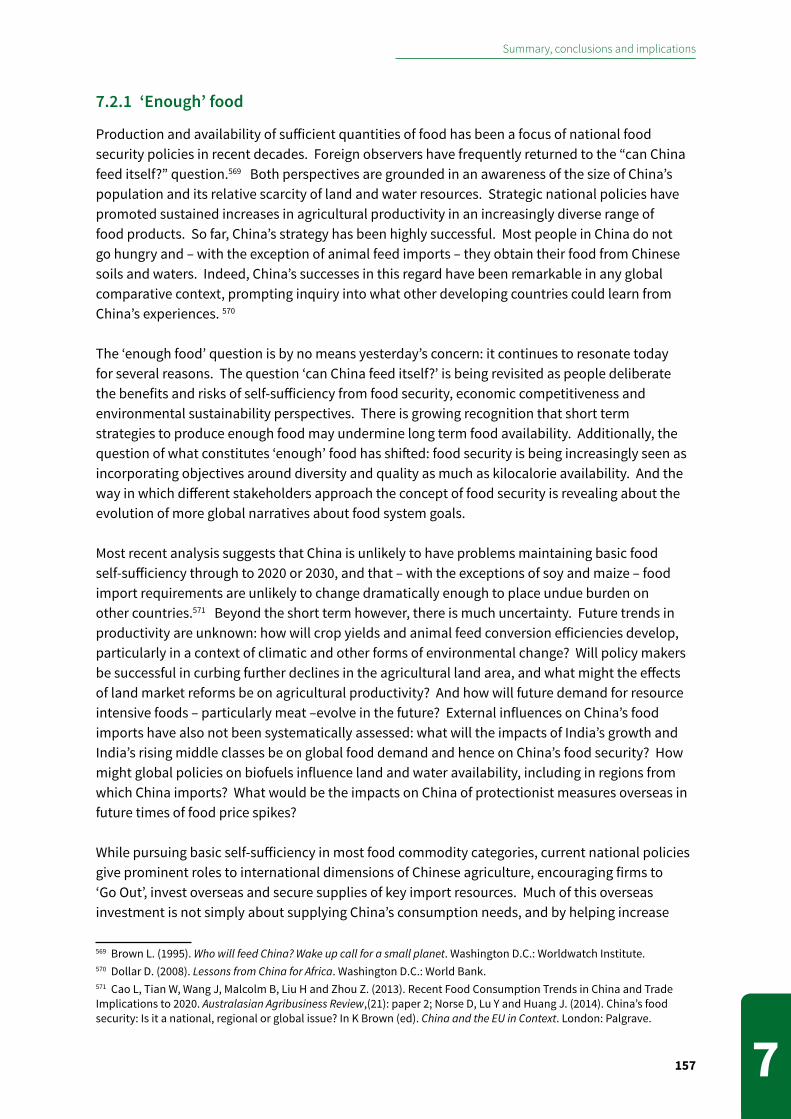
Summary, conclusions and implications
157 7
7.2.1 ‘Enough’ food
Production and availability of sufficient quantities of food has been a focus of national food security policies in recent decades. Foreign observers have frequently returned to the “can China feed itself?” question.569 Both perspectives are grounded in an awareness of the size of China’s population and its relative scarcity of land and water resources. Strategic national policies have promoted sustained increases in agricultural productivity in an increasingly diverse range of food products. So far, China’s strategy has been highly successful. Most people in China do not go hungry and – with the exception of animal feed imports – they obtain their food from Chinese soils and waters. Indeed, China’s successes in this regard have been remarkable in any global comparative context, prompting inquiry into what other developing countries could learn from China’s experiences. 570
The ‘enough food’ question is by no means yesterday’s concern: it continues to resonate today for several reasons. The question ‘can China feed itself?’ is being revisited as people deliberate the benefits and risks of self-sufficiency from food security, economic competitiveness and environmental sustainability perspectives. There is growing recognition that short term strategies to produce enough food may undermine long term food availability. Additionally, the question of what constitutes ‘enough’ food has shifted: food security is being increasingly seen as incorporating objectives around diversity and quality as much as kilocalorie availability. And the way in which different stakeholders approach the concept of food security is revealing about the evolution of more global narratives about food system goals.
Most recent analysis suggests that China is unlikely to have problems maintaining basic food self-sufficiency through to 2020 or 2030, and that – with the exceptions of soy and maize – food import requirements are unlikely to change dramatically enough to place undue burden on other countries.571 Beyond the short term however, there is much uncertainty. Future trends in productivity are unknown: how will crop yields and animal feed conversion efficiencies develop, particularly in a context of climatic and other forms of environmental change? Will policy makers be successful in curbing further declines in the agricultural land area, and what might the effects of land market reforms be on agricultural productivity? And how will future demand for resource intensive foods – particularly meat –evolve in the future? External influences on China’s food imports have also not been systematically assessed: what will the impacts of India’s growth and India’s rising middle classes be on global food demand and hence on China’s food security? How might global policies on biofuels influence land and water availability, including in regions from which China imports? What would be the impacts on China of protectionist measures overseas in future times of food price spikes?
While pursuing basic self-sufficiency in most food commodity categories, current national policies give prominent roles to international dimensions of Chinese agriculture, encouraging firms to ‘Go Out’, invest overseas and secure supplies of key import resources. Much of this overseas investment is not simply about supplying China’s consumption needs, and by helping increase
569 Brown L. (1995). Who will feed China? Wake up call for a small planet. Washington D.C.: Worldwatch Institute.570 Dollar D. (2008). Lessons from China for Africa. Washington D.C.: World Bank.571 Cao L, Tian W, Wang J, Malcolm B, Liu H and Zhou Z. (2013). Recent Food Consumption Trends in China and Trade Implications to 2020. Australasian Agribusiness Review,(21): paper 2; Norse D, Lu Y and Huang J. (2014). China’s food security: Is it a national, regional or global issue? In K Brown (ed). China and the EU in Context. London: Palgrave.
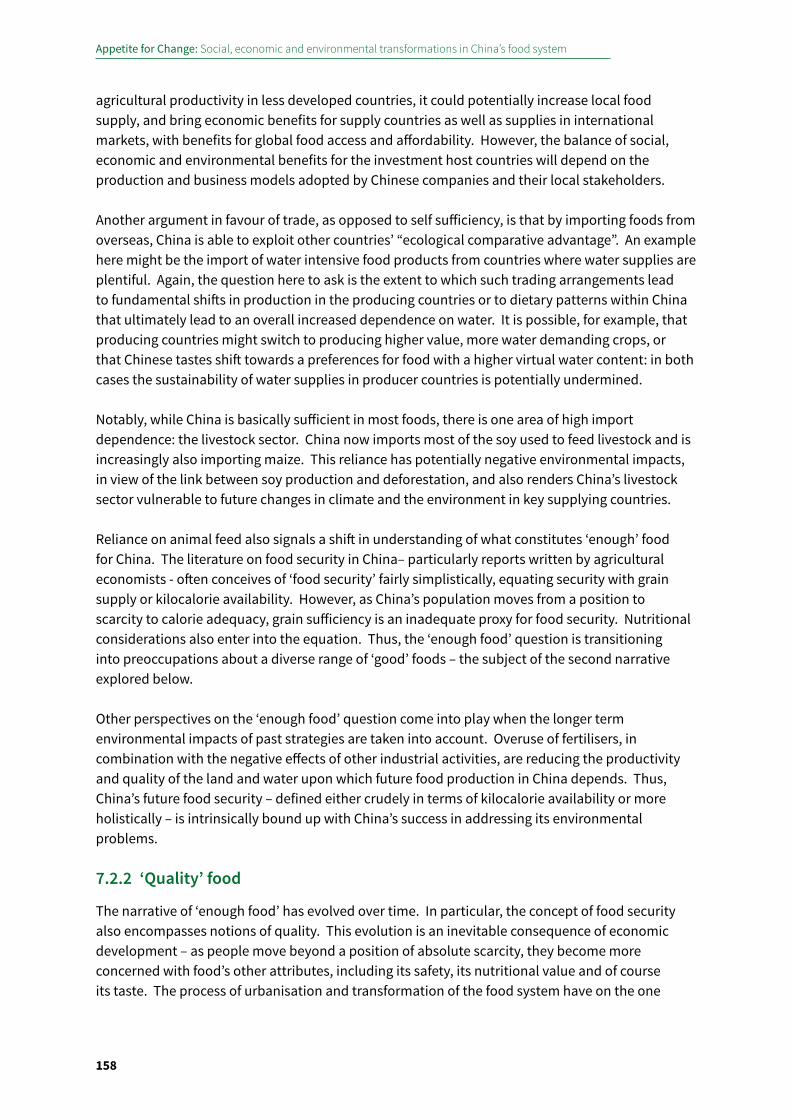
Appetite for Change: Social, economic and environmental transformations in China’s food system
158
agricultural productivity in less developed countries, it could potentially increase local food supply, and bring economic benefits for supply countries as well as supplies in international markets, with benefits for global food access and affordability. However, the balance of social, economic and environmental benefits for the investment host countries will depend on the production and business models adopted by Chinese companies and their local stakeholders.
Another argument in favour of trade, as opposed to self sufficiency, is that by importing foods from overseas, China is able to exploit other countries’ “ecological comparative advantage”. An example here might be the import of water intensive food products from countries where water supplies are plentiful. Again, the question here to ask is the extent to which such trading arrangements lead to fundamental shifts in production in the producing countries or to dietary patterns within China that ultimately lead to an overall increased dependence on water. It is possible, for example, that producing countries might switch to producing higher value, more water demanding crops, or that Chinese tastes shift towards a preferences for food with a higher virtual water content: in both cases the sustainability of water supplies in producer countries is potentially undermined.
Notably, while China is basically sufficient in most foods, there is one area of high import dependence: the livestock sector. China now imports most of the soy used to feed livestock and is increasingly also importing maize. This reliance has potentially negative environmental impacts, in view of the link between soy production and deforestation, and also renders China’s livestock sector vulnerable to future changes in climate and the environment in key supplying countries.
Reliance on animal feed also signals a shift in understanding of what constitutes ‘enough’ food for China. The literature on food security in China– particularly reports written by agricultural economists - often conceives of ‘food security’ fairly simplistically, equating security with grain supply or kilocalorie availability. However, as China’s population moves from a position to scarcity to calorie adequacy, grain sufficiency is an inadequate proxy for food security. Nutritional considerations also enter into the equation. Thus, the ‘enough food’ question is transitioning into preoccupations about a diverse range of ‘good’ foods – the subject of the second narrative explored below.
Other perspectives on the ‘enough food’ question come into play when the longer term environmental impacts of past strategies are taken into account. Overuse of fertilisers, in combination with the negative effects of other industrial activities, are reducing the productivity and quality of the land and water upon which future food production in China depends. Thus, China’s future food security – defined either crudely in terms of kilocalorie availability or more holistically – is intrinsically bound up with China’s success in addressing its environmental problems.
7.2.2 ‘Quality’ food
The narrative of ‘enough food’ has evolved over time. In particular, the concept of food security also encompasses notions of quality. This evolution is an inevitable consequence of economic development – as people move beyond a position of absolute scarcity, they become more concerned with food’s other attributes, including its safety, its nutritional value and of course its taste. The process of urbanisation and transformation of the food system have on the one
Summary, conclusions and implications
159 7
hand disconnected people from the process of production, and on the other hand increased opportunities in the supply chain for cutting corners on food safety, while also increasing the difficulty of adequate supervision. This combination of disconnection, malpractice and poor governance has triggered, with considerable justification, a crisis of public confidence in the safety of food in China.
Thus, narratives about quality include concerns with both safety (freedom from contamination or adulteration) and nutritional quality, and relate to a cluster of emerging issues. At one level, preoccupation with ‘safe’ food centres on concerns about heavy metal contamination, pesticide and other agrochemical use, zoonotic diseases, livestock related antimicrobial resistance, food borne pathogens and food adulteration. However, the quality discourse also encompasses more structural debates about the future evolution of China’s food system: the need for greater traceability, scrutiny and regulation of the supply chain, the roles of large companies as opposed to family farms or other small scale operators, and the risks posed by changing consumption patterns. What are the risks posed by consolidation, scaling up and vertical integration and what measures are available to address these risks? What new risks are posed by rapidly evolving retail and catering formats, which now include online sales? What are the possibilities afforded by alternative systems of food production and provisioning, such as organic farming and community supported agriculture – do these represent a viable and desirable ‘third way’, or do they also bring risks of their own?
Within China (and indeed in other countries), concerns about ‘quality’ also provide a conceptual framework for exploring the clear connections between human wellbeing and environmental sustainability, as in the case of soil and water contamination. Safety considerations also focus attention upon particular foods within the diet, such as meat. A question to consider here is the extent to which rising meat consumption alters and perhaps increases the balance of food safety risks.
In addition to its safety dimensions, the narrative of ‘quality’ food also incorporates the idea that food should be nutritious. Ideas about nutrition are diverse in China and reflect concepts based on traditional beliefs about the various properties of food (including those drawn from Traditional Chinese Medicine) as well modern biomedical understandings. Nutritional needs are also changing as the population ages. Sometimes, there can be interesting potential contradictions between the desire for ‘safety’ on the one hand, and ‘nutrition’ on the other. For example, the rise in dairy consumption has been driven by beliefs about nutritional benefits for infants and adults alike, while the dairy sector as a whole has been acutely affected by successive food safety scandals. The same applies in the case of fruits and vegetables, where nutrient rich foods are beset with problems of pesticide contamination. Processed foods offer a slightly different slant on the relationship between safety and nutrition. The production and consumption of processed foods receives active government support: the processing sector is a generator of employment and economic growth, while the foods themselves are seen as contributing to dietary diversity among consumers increasingly demanding convenience. Yet, many processed foods - such as bakery products, snack noodles and confectionery - can be high in fats, salt and refined carbohydrates, and thus incur other nutrition-related risks. A related question is the extent to which rising meat consumption alters the balance of food safety risks.
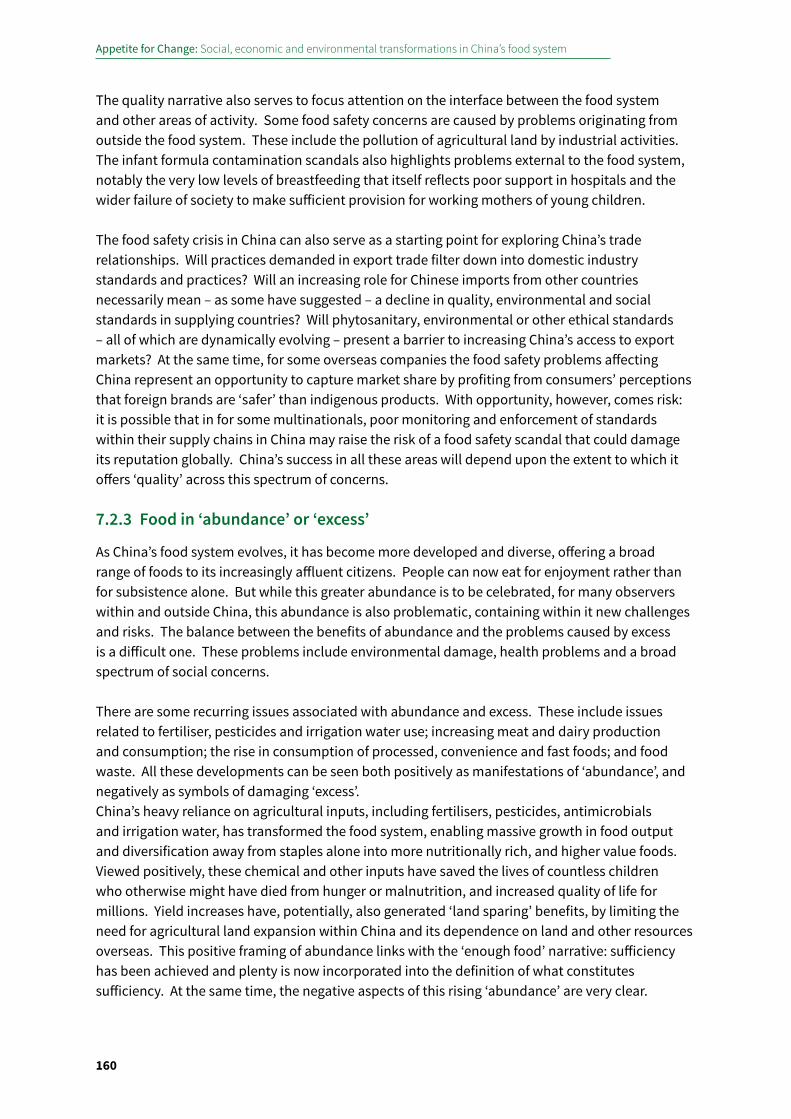
Appetite for Change: Social, economic and environmental transformations in China’s food system
160
The quality narrative also serves to focus attention on the interface between the food system and other areas of activity. Some food safety concerns are caused by problems originating from outside the food system. These include the pollution of agricultural land by industrial activities. The infant formula contamination scandals also highlights problems external to the food system, notably the very low levels of breastfeeding that itself reflects poor support in hospitals and the wider failure of society to make sufficient provision for working mothers of young children.
The food safety crisis in China can also serve as a starting point for exploring China’s trade relationships. Will practices demanded in export trade filter down into domestic industry standards and practices? Will an increasing role for Chinese imports from other countries necessarily mean – as some have suggested – a decline in quality, environmental and social standards in supplying countries? Will phytosanitary, environmental or other ethical standards – all of which are dynamically evolving – present a barrier to increasing China’s access to export markets? At the same time, for some overseas companies the food safety problems affecting China represent an opportunity to capture market share by profiting from consumers’ perceptions that foreign brands are ‘safer’ than indigenous products. With opportunity, however, comes risk: it is possible that in for some multinationals, poor monitoring and enforcement of standards within their supply chains in China may raise the risk of a food safety scandal that could damage its reputation globally. China’s success in all these areas will depend upon the extent to which it offers ‘quality’ across this spectrum of concerns.
7.2.3 Food in ‘abundance’ or ‘excess’
As China’s food system evolves, it has become more developed and diverse, offering a broad range of foods to its increasingly affluent citizens. People can now eat for enjoyment rather than for subsistence alone. But while this greater abundance is to be celebrated, for many observers within and outside China, this abundance is also problematic, containing within it new challenges and risks. The balance between the benefits of abundance and the problems caused by excess is a difficult one. These problems include environmental damage, health problems and a broad spectrum of social concerns.
There are some recurring issues associated with abundance and excess. These include issues related to fertiliser, pesticides and irrigation water use; increasing meat and dairy production and consumption; the rise in consumption of processed, convenience and fast foods; and food waste. All these developments can be seen both positively as manifestations of ‘abundance’, and negatively as symbols of damaging ‘excess’.China’s heavy reliance on agricultural inputs, including fertilisers, pesticides, antimicrobials and irrigation water, has transformed the food system, enabling massive growth in food output and diversification away from staples alone into more nutritionally rich, and higher value foods. Viewed positively, these chemical and other inputs have saved the lives of countless children who otherwise might have died from hunger or malnutrition, and increased quality of life for millions. Yield increases have, potentially, also generated ‘land sparing’ benefits, by limiting the need for agricultural land expansion within China and its dependence on land and other resources overseas. This positive framing of abundance links with the ‘enough food’ narrative: sufficiency has been achieved and plenty is now incorporated into the definition of what constitutes sufficiency. At the same time, the negative aspects of this rising ‘abundance’ are very clear.
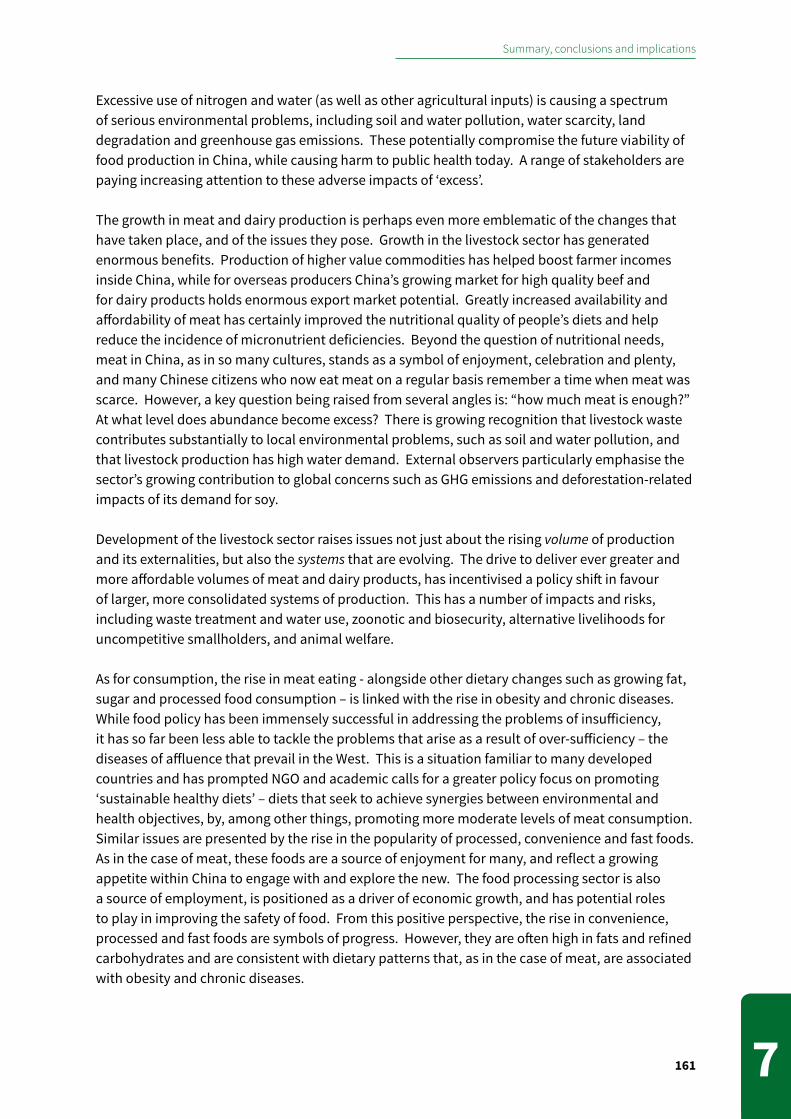
Summary, conclusions and implications
161 7
Excessive use of nitrogen and water (as well as other agricultural inputs) is causing a spectrum of serious environmental problems, including soil and water pollution, water scarcity, land degradation and greenhouse gas emissions. These potentially compromise the future viability of food production in China, while causing harm to public health today. A range of stakeholders are paying increasing attention to these adverse impacts of ‘excess’.
The growth in meat and dairy production is perhaps even more emblematic of the changes that have taken place, and of the issues they pose. Growth in the livestock sector has generated enormous benefits. Production of higher value commodities has helped boost farmer incomes inside China, while for overseas producers China’s growing market for high quality beef and for dairy products holds enormous export market potential. Greatly increased availability and affordability of meat has certainly improved the nutritional quality of people’s diets and help reduce the incidence of micronutrient deficiencies. Beyond the question of nutritional needs, meat in China, as in so many cultures, stands as a symbol of enjoyment, celebration and plenty, and many Chinese citizens who now eat meat on a regular basis remember a time when meat was scarce. However, a key question being raised from several angles is: “how much meat is enough?” At what level does abundance become excess? There is growing recognition that livestock waste contributes substantially to local environmental problems, such as soil and water pollution, and that livestock production has high water demand. External observers particularly emphasise the sector’s growing contribution to global concerns such as GHG emissions and deforestation-related impacts of its demand for soy.
Development of the livestock sector raises issues not just about the rising volume of production and its externalities, but also the systems that are evolving. The drive to deliver ever greater and more affordable volumes of meat and dairy products, has incentivised a policy shift in favour of larger, more consolidated systems of production. This has a number of impacts and risks, including waste treatment and water use, zoonotic and biosecurity, alternative livelihoods for uncompetitive smallholders, and animal welfare.
As for consumption, the rise in meat eating - alongside other dietary changes such as growing fat, sugar and processed food consumption – is linked with the rise in obesity and chronic diseases. While food policy has been immensely successful in addressing the problems of insufficiency, it has so far been less able to tackle the problems that arise as a result of over-sufficiency – the diseases of affluence that prevail in the West. This is a situation familiar to many developed countries and has prompted NGO and academic calls for a greater policy focus on promoting ‘sustainable healthy diets’ – diets that seek to achieve synergies between environmental and health objectives, by, among other things, promoting more moderate levels of meat consumption.Similar issues are presented by the rise in the popularity of processed, convenience and fast foods. As in the case of meat, these foods are a source of enjoyment for many, and reflect a growing appetite within China to engage with and explore the new. The food processing sector is also a source of employment, is positioned as a driver of economic growth, and has potential roles to play in improving the safety of food. From this positive perspective, the rise in convenience, processed and fast foods are symbols of progress. However, they are often high in fats and refined carbohydrates and are consistent with dietary patterns that, as in the case of meat, are associated with obesity and chronic diseases.
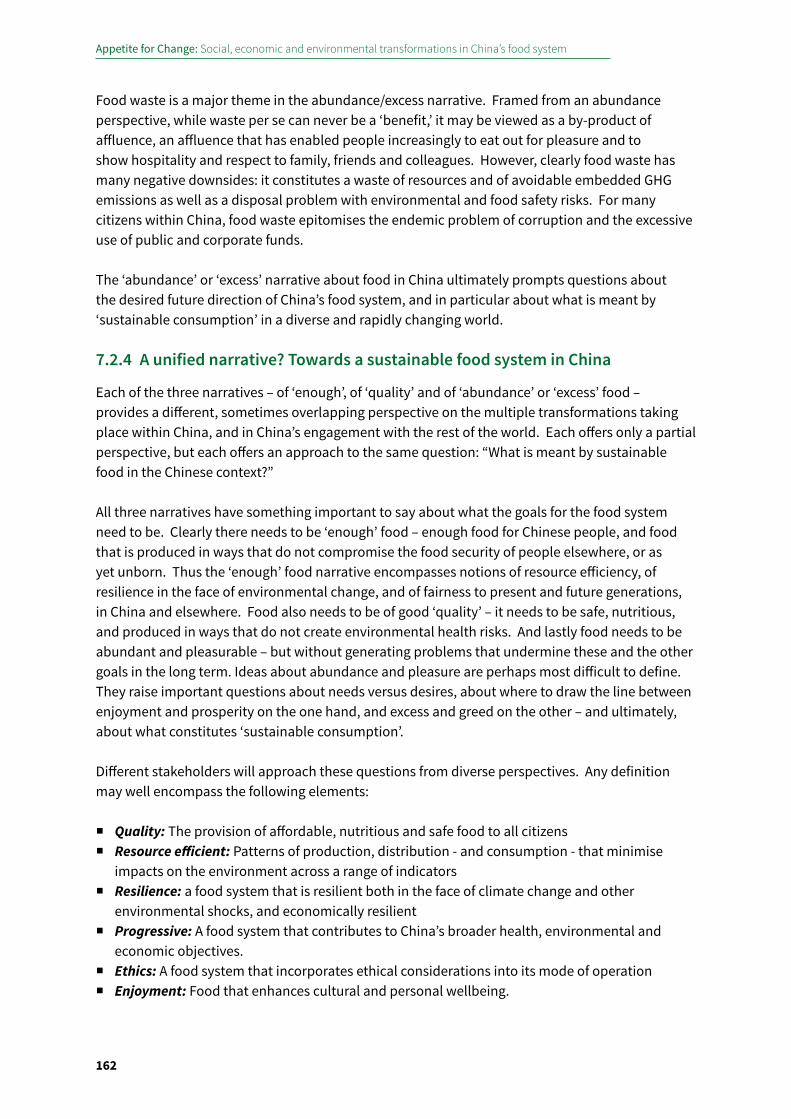
Appetite for Change: Social, economic and environmental transformations in China’s food system
162
Food waste is a major theme in the abundance/excess narrative. Framed from an abundance perspective, while waste per se can never be a ‘benefit,’ it may be viewed as a by-product of affluence, an affluence that has enabled people increasingly to eat out for pleasure and to show hospitality and respect to family, friends and colleagues. However, clearly food waste has many negative downsides: it constitutes a waste of resources and of avoidable embedded GHG emissions as well as a disposal problem with environmental and food safety risks. For many citizens within China, food waste epitomises the endemic problem of corruption and the excessive use of public and corporate funds.
The ‘abundance’ or ‘excess’ narrative about food in China ultimately prompts questions about the desired future direction of China’s food system, and in particular about what is meant by ‘sustainable consumption’ in a diverse and rapidly changing world.
7.2.4 A unified narrative? Towards a sustainable food system in China
Each of the three narratives – of ‘enough’, of ‘quality’ and of ‘abundance’ or ‘excess’ food – provides a different, sometimes overlapping perspective on the multiple transformations taking place within China, and in China’s engagement with the rest of the world. Each offers only a partial perspective, but each offers an approach to the same question: “What is meant by sustainable food in the Chinese context?”
All three narratives have something important to say about what the goals for the food system need to be. Clearly there needs to be ‘enough’ food – enough food for Chinese people, and food that is produced in ways that do not compromise the food security of people elsewhere, or as yet unborn. Thus the ‘enough’ food narrative encompasses notions of resource efficiency, of resilience in the face of environmental change, and of fairness to present and future generations, in China and elsewhere. Food also needs to be of good ‘quality’ – it needs to be safe, nutritious, and produced in ways that do not create environmental health risks. And lastly food needs to be abundant and pleasurable – but without generating problems that undermine these and the other goals in the long term. Ideas about abundance and pleasure are perhaps most difficult to define. They raise important questions about needs versus desires, about where to draw the line between enjoyment and prosperity on the one hand, and excess and greed on the other – and ultimately, about what constitutes ‘sustainable consumption’.
Different stakeholders will approach these questions from diverse perspectives. Any definition may well encompass the following elements:
� Quality: The provision of affordable, nutritious and safe food to all citizens � Resource efficient: Patterns of production, distribution - and consumption - that minimise
impacts on the environment across a range of indicators � Resilience: a food system that is resilient both in the face of climate change and other
environmental shocks, and economically resilient � Progressive: A food system that contributes to China’s broader health, environmental and
economic objectives. � Ethics: A food system that incorporates ethical considerations into its mode of operation � Enjoyment: Food that enhances cultural and personal wellbeing.
Summary, conclusions and implications
163 7
7.3 Addressing policy challenges and the role of researchWhat, then, are the key challenges faced by China’s policy makers? At one level, they can be described as the many issues highlighted in this report: the need to reduce environmental effects along the whole supply chain; to address problems associated with dietary excess while continuing to tackle hunger and malnutrition; to restore and maintain trust in the safety of the food system; to balance growth with equity as the food supply chain evolves; and to prepare for the emergence of new consumer concerns and demands, for example, around animal welfare or environmental sustainability.
Many of these environmental, health and food safety challenges are already being addressed by government policies. The problem of livestock waste, highlighted since the early 1990s as the leading source of water pollution nationwide, is beginning to be addressed. National standards require that larger scale livestock farms install waste treatment facilities, and only farms with such facilities are eligible to receive certain subsidies. Targets for reducing GHG emissions from livestock waste and fertilisers have been included in the Work Plan for Control of Greenhouse Gas Emissions in Twelfth Five Year Plan Period. The government has also announced significant investment in treating soils polluted by heavy metals. The range of food safety challenges is being addressed through revisions to related regulations and a recent comprehensive reorganization of the institutions responsible for food safety. The health risks associated with inappropriate and excessive diets are also a focus of health education efforts promoted in the Twelfth Five-Year Plan for Control of Chronic Disease – the first national plan to focus on chronic diseases.
At another level, however, the many challenges to effective achievement of these and other policy objectives points to the need to address number of underlying challenges. Some of these challenges relate to the nature of food systems, and are shared by policy makers across the world. Others relate more specifically to the policy environment in China. The following two sections explore these challenges in relation to China’s food system and identify areas where further innovations in research will help strengthen the evidence base that informs policy.
7.3.1 Policy challenges arising from the food system
Addressing the problems faced by and affecting the food system requires new perspectives on the connections among issues, new forms of collaboration between policy makers at different scales of government and with international partners, engagement with a range of different stakeholders, and consideration of how today’s emerging trends might shape a variety of possible futures.
Insights from a whole food chain approach
This report has revealed many ways in which changes at different stages of food supply chains are interlinked. In particular, although environmental challenges associated with agricultural production have long been a widespread concern, a focus on agriculture alone misses half the story. Environmental impacts of activities in the post-harvest stages of the food supply chain (processing, transport, cooking, refrigeration, waste treatment) can be considerable. For example, post-harvest processes account for nearly half of GHG emissions in China’s food system. The consumer stage – particularly how much meat people eat and how much food of all kinds they waste – is a key driver of environmental impacts, because it determines how much and what
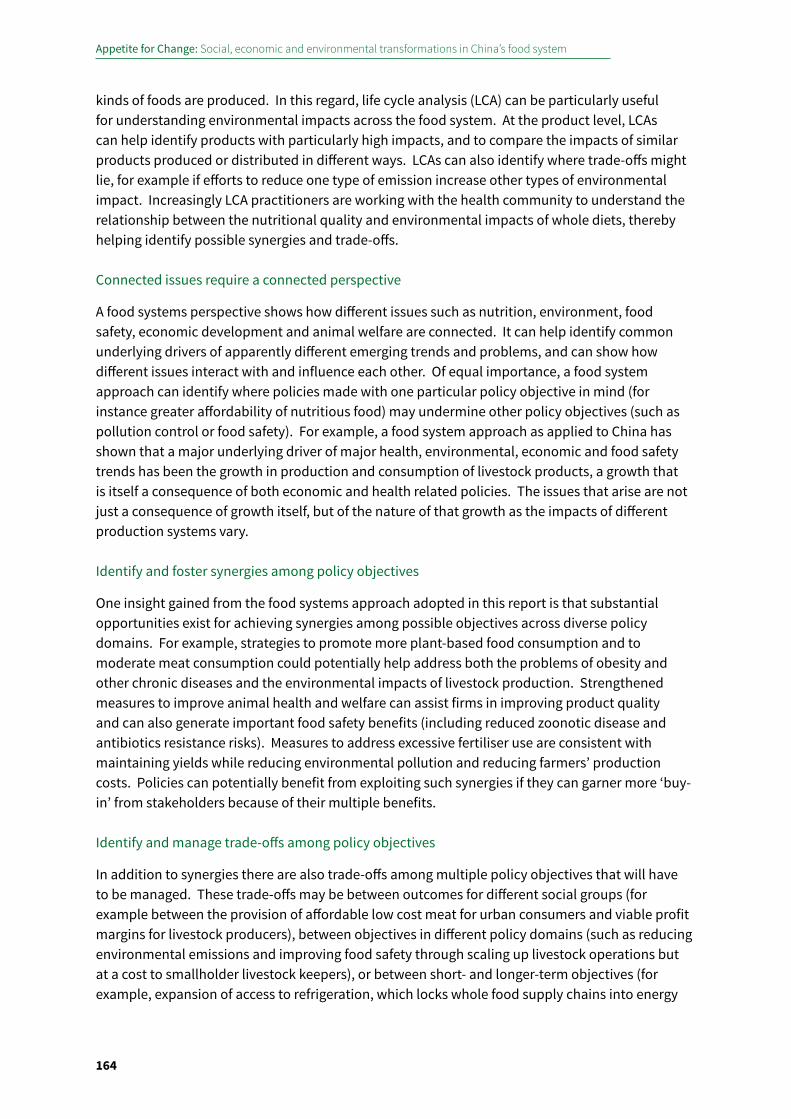
Appetite for Change: Social, economic and environmental transformations in China’s food system
164
kinds of foods are produced. In this regard, life cycle analysis (LCA) can be particularly useful for understanding environmental impacts across the food system. At the product level, LCAs can help identify products with particularly high impacts, and to compare the impacts of similar products produced or distributed in different ways. LCAs can also identify where trade-offs might lie, for example if efforts to reduce one type of emission increase other types of environmental impact. Increasingly LCA practitioners are working with the health community to understand the relationship between the nutritional quality and environmental impacts of whole diets, thereby helping identify possible synergies and trade-offs.
Connected issues require a connected perspective
A food systems perspective shows how different issues such as nutrition, environment, food safety, economic development and animal welfare are connected. It can help identify common underlying drivers of apparently different emerging trends and problems, and can show how different issues interact with and influence each other. Of equal importance, a food system approach can identify where policies made with one particular policy objective in mind (for instance greater affordability of nutritious food) may undermine other policy objectives (such as pollution control or food safety). For example, a food system approach as applied to China has shown that a major underlying driver of major health, environmental, economic and food safety trends has been the growth in production and consumption of livestock products, a growth that is itself a consequence of both economic and health related policies. The issues that arise are not just a consequence of growth itself, but of the nature of that growth as the impacts of different production systems vary.
Identify and foster synergies among policy objectives
One insight gained from the food systems approach adopted in this report is that substantial opportunities exist for achieving synergies among possible objectives across diverse policy domains. For example, strategies to promote more plant-based food consumption and to moderate meat consumption could potentially help address both the problems of obesity and other chronic diseases and the environmental impacts of livestock production. Strengthened measures to improve animal health and welfare can assist firms in improving product quality and can also generate important food safety benefits (including reduced zoonotic disease and antibiotics resistance risks). Measures to address excessive fertiliser use are consistent with maintaining yields while reducing environmental pollution and reducing farmers’ production costs. Policies can potentially benefit from exploiting such synergies if they can garner more ‘buy-in’ from stakeholders because of their multiple benefits.
Identify and manage trade-offs among policy objectives
In addition to synergies there are also trade-offs among multiple policy objectives that will have to be managed. These trade-offs may be between outcomes for different social groups (for example between the provision of affordable low cost meat for urban consumers and viable profit margins for livestock producers), between objectives in different policy domains (such as reducing environmental emissions and improving food safety through scaling up livestock operations but at a cost to smallholder livestock keepers), or between short- and longer-term objectives (for example, expansion of access to refrigeration, which locks whole food supply chains into energy
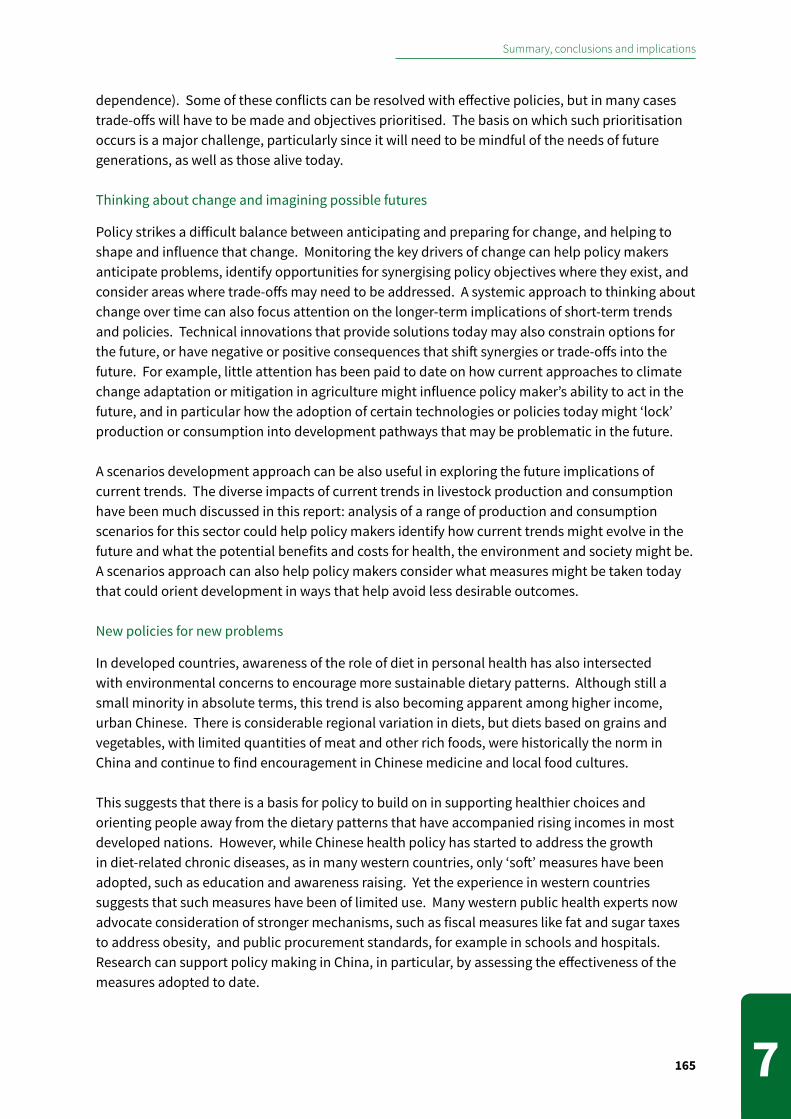
Summary, conclusions and implications
165 7
dependence). Some of these conflicts can be resolved with effective policies, but in many cases trade-offs will have to be made and objectives prioritised. The basis on which such prioritisation occurs is a major challenge, particularly since it will need to be mindful of the needs of future generations, as well as those alive today.
Thinking about change and imagining possible futures
Policy strikes a difficult balance between anticipating and preparing for change, and helping to shape and influence that change. Monitoring the key drivers of change can help policy makers anticipate problems, identify opportunities for synergising policy objectives where they exist, and consider areas where trade-offs may need to be addressed. A systemic approach to thinking about change over time can also focus attention on the longer-term implications of short-term trends and policies. Technical innovations that provide solutions today may also constrain options for the future, or have negative or positive consequences that shift synergies or trade-offs into the future. For example, little attention has been paid to date on how current approaches to climate change adaptation or mitigation in agriculture might influence policy maker’s ability to act in the future, and in particular how the adoption of certain technologies or policies today might ‘lock’ production or consumption into development pathways that may be problematic in the future.
A scenarios development approach can be also useful in exploring the future implications of current trends. The diverse impacts of current trends in livestock production and consumption have been much discussed in this report: analysis of a range of production and consumption scenarios for this sector could help policy makers identify how current trends might evolve in the future and what the potential benefits and costs for health, the environment and society might be. A scenarios approach can also help policy makers consider what measures might be taken today that could orient development in ways that help avoid less desirable outcomes.
New policies for new problems
In developed countries, awareness of the role of diet in personal health has also intersected with environmental concerns to encourage more sustainable dietary patterns. Although still a small minority in absolute terms, this trend is also becoming apparent among higher income, urban Chinese. There is considerable regional variation in diets, but diets based on grains and vegetables, with limited quantities of meat and other rich foods, were historically the norm in China and continue to find encouragement in Chinese medicine and local food cultures.
This suggests that there is a basis for policy to build on in supporting healthier choices and orienting people away from the dietary patterns that have accompanied rising incomes in most developed nations. However, while Chinese health policy has started to address the growth in diet-related chronic diseases, as in many western countries, only ‘soft’ measures have been adopted, such as education and awareness raising. Yet the experience in western countries suggests that such measures have been of limited use. Many western public health experts now advocate consideration of stronger mechanisms, such as fiscal measures like fat and sugar taxes to address obesity, and public procurement standards, for example in schools and hospitals. Research can support policy making in China, in particular, by assessing the effectiveness of the measures adopted to date.
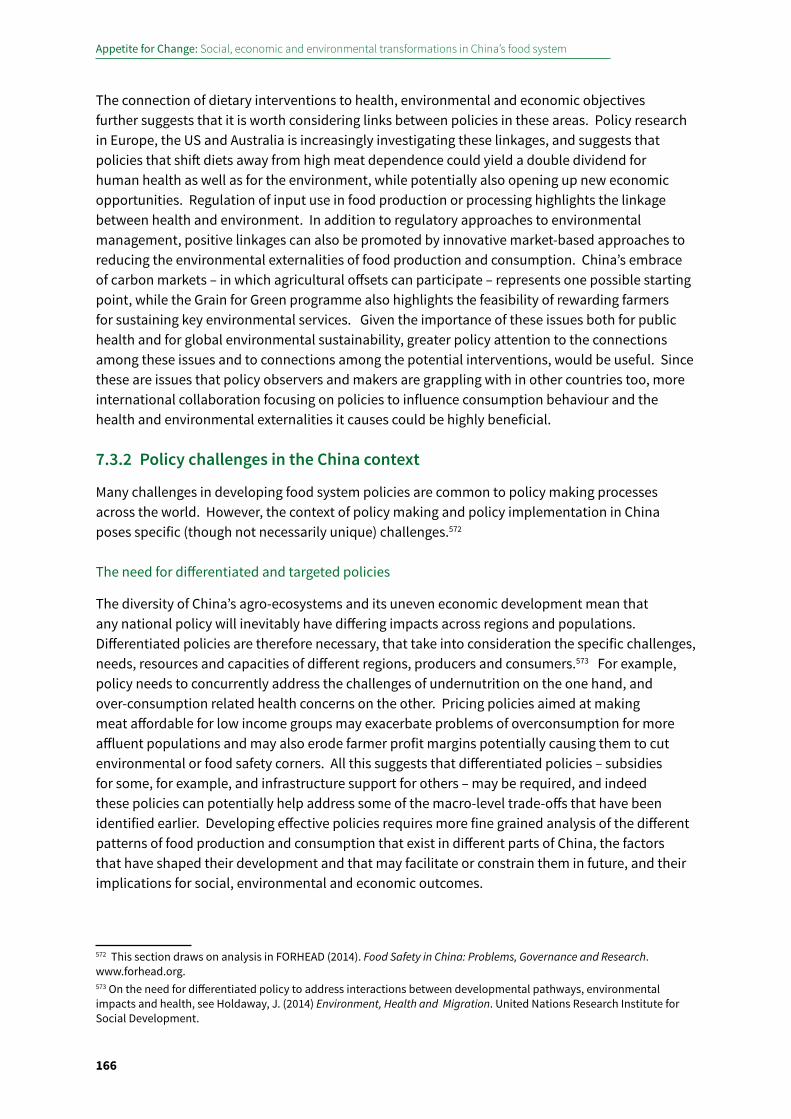
Appetite for Change: Social, economic and environmental transformations in China’s food system
166
The connection of dietary interventions to health, environmental and economic objectives further suggests that it is worth considering links between policies in these areas. Policy research in Europe, the US and Australia is increasingly investigating these linkages, and suggests that policies that shift diets away from high meat dependence could yield a double dividend for human health as well as for the environment, while potentially also opening up new economic opportunities. Regulation of input use in food production or processing highlights the linkage between health and environment. In addition to regulatory approaches to environmental management, positive linkages can also be promoted by innovative market-based approaches to reducing the environmental externalities of food production and consumption. China’s embrace of carbon markets – in which agricultural offsets can participate – represents one possible starting point, while the Grain for Green programme also highlights the feasibility of rewarding farmers for sustaining key environmental services. Given the importance of these issues both for public health and for global environmental sustainability, greater policy attention to the connections among these issues and to connections among the potential interventions, would be useful. Since these are issues that policy observers and makers are grappling with in other countries too, more international collaboration focusing on policies to influence consumption behaviour and the health and environmental externalities it causes could be highly beneficial.
7.3.2 Policy challenges in the China context
Many challenges in developing food system policies are common to policy making processes across the world. However, the context of policy making and policy implementation in China poses specific (though not necessarily unique) challenges.572
The need for differentiated and targeted policies
The diversity of China’s agro-ecosystems and its uneven economic development mean that any national policy will inevitably have differing impacts across regions and populations. Differentiated policies are therefore necessary, that take into consideration the specific challenges, needs, resources and capacities of different regions, producers and consumers.573 For example, policy needs to concurrently address the challenges of undernutrition on the one hand, and over-consumption related health concerns on the other. Pricing policies aimed at making meat affordable for low income groups may exacerbate problems of overconsumption for more affluent populations and may also erode farmer profit margins potentially causing them to cut environmental or food safety corners. All this suggests that differentiated policies – subsidies for some, for example, and infrastructure support for others – may be required, and indeed these policies can potentially help address some of the macro-level trade-offs that have been identified earlier. Developing effective policies requires more fine grained analysis of the different patterns of food production and consumption that exist in different parts of China, the factors that have shaped their development and that may facilitate or constrain them in future, and their implications for social, environmental and economic outcomes.
572 This section draws on analysis in FORHEAD (2014). Food Safety in China: Problems, Governance and Research. www.forhead.org.573 On the need for differentiated policy to address interactions between developmental pathways, environmental impacts and health, see Holdaway, J. (2014) Environment, Health and Migration. United Nations Research Institute for Social Development.
Summary, conclusions and implications
167 7
A further reason for differentiated policy making is that capacities to implement policies (including institutional mandates and relationships with other stakeholders, staffing, skills and the availability and use of resources) vary widely across the country and at different levels. A better understanding of existing capacities and constraints on local agencies’ abilities to assess and address problems at various points along the food supply chain would help inform decisions on resource investments. Most likely, a one-size-fits-all approach will not be effective, and support to local agencies will need to reflect different regional needs. Successful and unsuccessful approaches and experiences can be analyzed to derive insights for more effective management. In the international context, China might look at the experience of other large, internally differentiated countries and regions like the US or the EU, where uniform policies are not adopted or implemented in each state.
Cross-sectoral coordination
Food is a cross-sectoral issue, and in some respects Chinese policy making has been exemplary in seeking to involve multiple ministries in policy making. In particular, nutritional policy and agricultural policies have been closely linked. However, poor coordination between agencies has been a major obstacle to effective policy implementation. The recent reforms of institutions involved in food safety show that the government is well aware of the importance of clear allocation of responsibilities among agencies and coordination between agencies in the implementation of policies.574
Other issues where policy coordination across multiple sectors is clearly important include, for example, land use and land use zoning, fertiliser manufacture and use, and water management. In these – and other areas – the need for and lack of policy coordination are often mentioned, but few studies go beyond this. In particular, coordination at the national level does not mean that integration will take place locally, especially if there are insufficient finances, staff and skills, or if local economic interests run counter to national policy goals. The specific barriers to achieving more coordinated policy need to be understood. Research can support policy processes through a better understanding of how various policy stakeholders frame food system issues and how these framings intersect with existing policy and programmatic priorities, resource allocations, agency mandates and administrative structures. In several fields, China may be able to learn from the way in which policy coordination is organised in other countries, including both the advantages and disadvantages of different institutional arrangements.
Addressing barriers to effective policy implementation
Economic incentives faced by producers (and local governments) often run counter to policy objectives, and producers often face multiple barriers to adoption of practices encouraged by policies. To highlight just a few examples: the operation costs of livestock waste treatment facilities often means they are not used; practices that result in more effective fertiliser use may not be economically beneficial for farmers who spend large parts of the year working in the cities; highly competitive markets promote cost cutting, which in turn leads to food adulteration incidents. Local governments, whose officials work to meet targets for economic growth, often have limited incentives to enforce regulations. On the other hand, China has considerable experience with successful policies and programmes in which economic incentives have led to
574 FORHEAD (2014). Food Safety in China: Problems, Governance and Research. www.forhead.org.
Appetite for Change: Social, economic and environmental transformations in China’s food system
168
changes in agricultural practices, as in the case of the Grain for Green programme.
Designing effective and equitable policies to address other challenges in China’s food system requires greater understanding diverse factors that influence people’s behaviour and of how interventions might be designed to reorient current practices. While considerable research is often conducted on technical solutions to various problems throughout the food system, there is much more limited policy-relevant research on the socio-economic drivers that affect technology adoption and policy implementation, and such research as does exist is mostly limited to small scale producers and to certain sectors. Little is known about other supply chain actors, such as larger scale enterprises or investors; and despite the importance of consumption as a driver of many changes throughout the food system, many aspects of consumer behaviour are little understood, which impedes identification of effective interventions to reorient diets along healthier and more sustainable pathways. The benefits of high-quality, multidisciplinary research to inform policy formulation and evaluation are clear, and there is a need for more robust evaluation of the effectiveness of policy implementation.
Scaling effectively for sustainability
The dominant consensus in agriculture policy circles is that increasing production scale can deliver economic and environmental efficiencies and reduce food safety risks. These views are, however, contested by some academics and practitioners who advocate for alternative agricultural and food provisioning models. While there has been insufficient research into these questions, some evidence exists to suggest that the relationship between scale and safety and environmental impacts is not straightforward, and that scaling up has its own environmental and societal risks. The relationship between scale and impact requires further investigation to inform policies to manage the transition in ways that optimise the potential benefits and minimise the downsides.
The relevance of international collaboration and new research partnerships
Many other countries are faced with problems similar to those in China, and stakeholders in those countries are also starting to think about how to tackle these in an interconnected way. Considering how various challenges in China’s food system relate to international experience can be helpful in distinguishing which are generic to the issue area and which are particular to China’s development trajectory, agricultural systems, food cultures or governance systems. Reference to international experience can also be useful in understanding the range of policy responses that might be adopted and the time scales in which interventions can realistically deliver results. More thought needs to be given to which cross-national comparisons are useful for particular purposes. There will of course be differences in regulatory environment, and in a number of geographical and socio-economic factors that will render comparisons more or less relevant. In many areas, the experiences of other rapidly developing economies is likely to be highly relevant to China, while for some other issues, the experience of other federated polities (such as the USA or the EU) may be more relevant in developing appropriately differentiated policies.575
One emerging trend in developed countries is a tendency towards cross-sectoral collaboration in
575 For a discussion of the relevance of different international experience, see Holdaway J. (2013). Environment and Health Research in China. The China Quarterly, 214: 1-28.

Summary, conclusions and implications
169 7
food system research. For example, in the UK, the government-funded Waste Resources Action Programme convenes a Product Sustainability Forum with members drawn from government, major retailers and manufacturers as well as NGOs and the research community. The forum worked to create robust data on the carbon footprints of the 200 most popular grocery items, and has been working actively with the industry in a series of projects that support industry partners to identify and test key impact reduction opportunities along the supply chain.
In short, given the scale and complexity of the challenges that China’s food system faces, and its international relevance, collaborations among diverse stakeholders within China and internationally can contribute to new knowledge for addressing the new and future challenges faced.


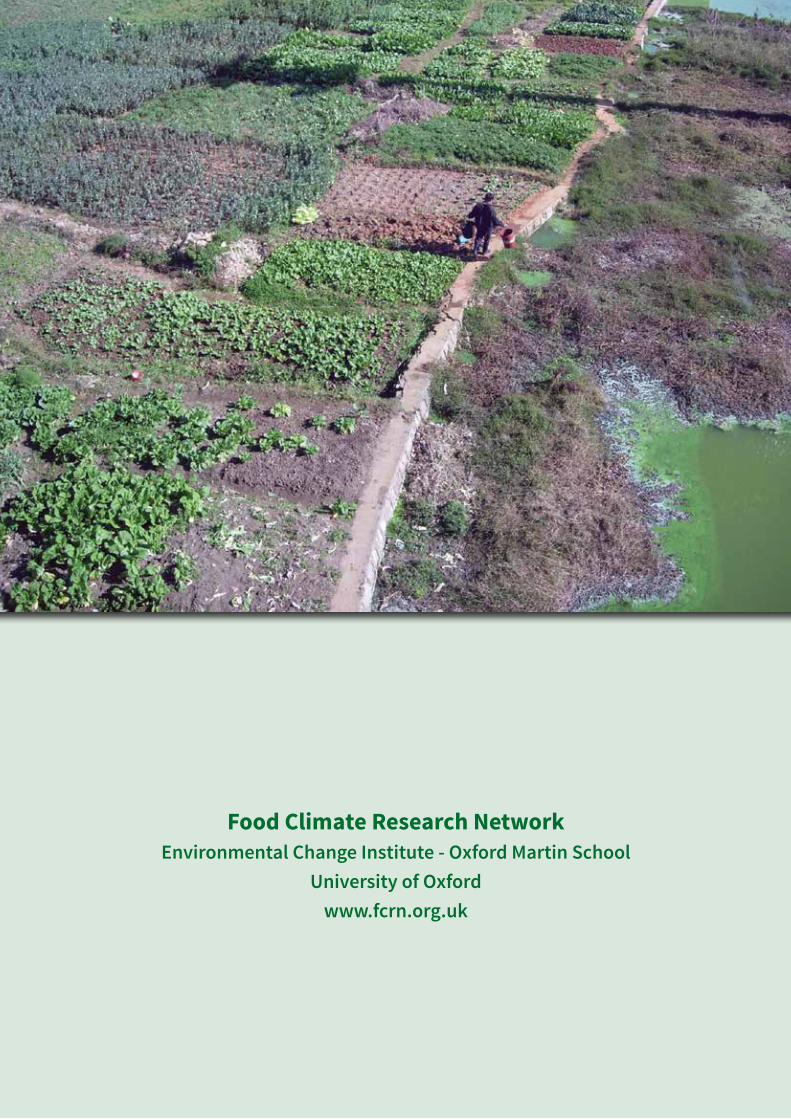
Food Climate Research NetworkEnvironmental Change Institute - Oxford Martin School
University of Oxfordwww.fcrn.org.uk