SOCIAL CHANGE RESEARCH UNIT, UNIVERSITY OF … · ON CROWD INCIDENTS A PRELIMINARY ANALYSIS ......
94
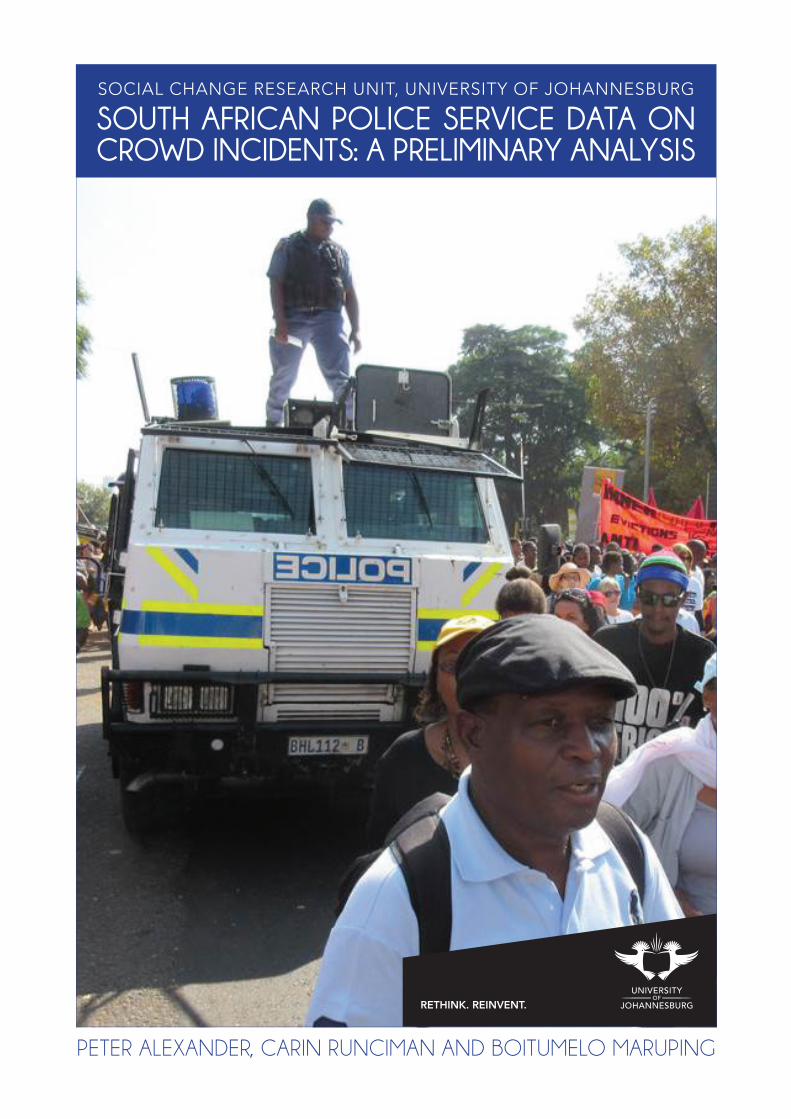
PETER ALEXANDER, CARIN RUNCIMAN AND BOITUMELO MARUPING SOCIAL CHANGE RESEARCH UNIT, UNIVERSITY OF JOHANNESBURG SOUTH AFRICAN POLICE SERVICE DATA ON CROWD INCIDENTS: A PRELIMINARY ANALYSIS
Transcript of SOCIAL CHANGE RESEARCH UNIT, UNIVERSITY OF … · ON CROWD INCIDENTS A PRELIMINARY ANALYSIS ......
PETER ALEXANDER, CARIN RUNCIMAN AND BOITUMELO MARUPING
SOCIAL CHANGE RESEARCH UNIT, UNIVERSITY OF JOHANNESBURG
SOUTH AFRICAN POLICE SERVICE DATA ON CROWD INCIDENTS: A PRELIMINARY ANALYSIS

© 2015 SOUTH AFRICAN RESEARCH CHAIR IN SOCIAL CHANGE,SOCIAL CHANGE RESEARCH UNIT,UNIVERSITY OF JOHANNESBURG.
1
South African Research Chair in Social Change
_________________________________________________
SOUTH AFRICAN POLICE SERVICE (SAPS) DATA
ON CROWD INCIDENTS
A PRELIMINARY ANALYSIS
Peter Alexander, Carin Runciman and Boitumelo Maruping
Social Change Research Unit, University of Johannesburg

2

3
Contents
Executive summary .................................................................................................... 5
Authors ....................................................................................................................... 6
Acknowledgments ...................................................................................................... 7
Abbreviations ............................................................................................................. 8
Figures and tables ...................................................................................................... 9
List of appendices .................................................................................................... 10
1. Introduction ...................................................................................................... 11
1.1 Source of data ................................................................................................ 11
1.2 Columns ......................................................................................................... 12
1.3 Purpose of report ............................................................................................ 12
1.4 Definitions: complexity and confusion ............................................................. 13
1.5 IRIS and Public Order Policing ....................................................................... 15
1.6 IRIS classifications .......................................................................................... 16
2. Peaceful and unrest incidents .......................................................................... 19
2.1 Distinctions: official ......................................................................................... 19
2.2 Distinctions: practice ....................................................................................... 20
2.3 Numbers ......................................................................................................... 22
3. Distribution of incidents by province ................................................................ 25
3.1 Overview ......................................................................................................... 25
3.2 Incidents related to population ........................................................................ 28
4. Motives ............................................................................................................ 32
4.1 Understanding and defining motives assigned by the SAPS .......................... 32
4.2 Analysing incident motives ............................................................................. 34
4.2.1 Introduction .............................................................................................. 34
4.2.2 Analysis of incident motives by province .................................................. 37
4.2.3 ‘No motive registered’ .............................................................................. 39
4.2.4 ‘Dissatisfied with service delivery’ ............................................................ 40
4.3 Aggregated motive option analysis ................................................................. 43
4.3.1 Sampling unclear motive options ............................................................. 45
4.4 Summary of key results from aggregated motive analysis .............................. 46
4.4.1 Aggregated analysis by peaceful and unrest incidents ............................ 46
4.4.2 Aggregated motive option analysis by province ....................................... 48
4.5 Conclusion ...................................................................................................... 48
5. Residentials ..................................................................................................... 50

4
6. Environmentals ................................................................................................ 52
7. Conclusions ..................................................................................................... 54
7.1 Complexity and caution in interpreting IRIS data ............................................ 54
7.1.1 Peaceful and unrest incidents .................................................................. 54
7.1.2 Provincial distribution ............................................................................... 54
7.2 Motives ........................................................................................................... 54
7.3 Recommendations and future research .......................................................... 55
8. Addendum: Misinformation from generals and minister ....................................... 56
8.1 Relevant findings from our research ............................................................... 56
8.2 Abuse of IRIS statistics ................................................................................... 57
8.2.1. SAPS generals ........................................................................................ 57
8.2.2 The President ........................................................................................... 58
8.2.3 Minister of Police ...................................................................................... 58
8.3 Implications ..................................................................................................... 59
References ............................................................................................................... 60
Appendices .............................................................................................................. 63

5
Executive summary
• Between 1997 and 2013 the South African Police Service’s (SAPS) Incident
Registration Information System (IRIS) recorded 156,230 ‘crowd incidents’; 90.0%
of these were classified as ‘crowd (peaceful)’ and 10.0% as ‘crowd (unrest).
• IRIS documentation of these incidents, which will soon be made public, is
analysed in this report. We decode key categories used in IRIS.
• Crowd incidents are not protests. Indeed, a high proportion of incidents relate to
recreational, cultural or religious events.
• The number of registered incidents plummeted after 2006 largely due to the re-
organisation of public order policing, and this underlines the reality that IRIS
statistics chronicle police activity rather than public events per se.
• The definition of ‘peaceful’ and ‘unrest’ is primarily determined by the character of
police intervention, and ‘unrest’ should not be equated with ‘violent'.
• The number of crowd incidents spiked in 1998, 2005/2006 and 2012/2013. There
were more unrest incidents in 2012 (1,811) than any other year, and the highest
number of peaceful incidents (11,010) was in 2013.
• Geographically, for the 17-year period, the proportion of crowd incidents recorded
as unrest varies between 6.3% in KwaZulu-Natal and 16.5% in Western Cape.
The number of crowd incidents per capita was substantially higher in North West
than in any other province.
• IRIS has 78 different options for assigning ‘motive’ to an incident. Aggregating
these into 10 groups reveals that, overall, ‘motives’ that are labour-related are the
most numerous (24% of the total). With unrest incidents, community-related
motives are the most common (27% of the total).
• Recognising the importance of IRIS for public accountability, we recommend that,
SAPS incorporate clear definitions of its categories and options, addressing the
concern to record protests that exists within public, political and policing spheres.
• We recommend three kinds of additional research. First, further inquiry as to how
incidents are defined, recorded and categorised. Secondly, further analysis of
notes that accompany entries for each incident, including distinguishing which are
protests. Thirdly, analysis relating police-recorded protests to media-reported
protests, and quantitative analysis linking protests with social and demographic
variables (e.g. unemployment).
6
Authors
Peter Alexander is a professor of sociology at the University of Johannesburg, where
he holds the South African Research Chair in Social Change.
Carin Runciman is a post-doctoral research fellow attached to the South African
Research Chair in Social Change at the University of Johannesburg.
Boitumelo Maruping is an MA student in sociology and a senior research assistant
with the South African Research Chair in Social Change at the University of
Johannesburg.
7
Acknowledgments
This report has been produced under the auspices of the South African Research
Chair in Social Change, which is funded by the Department of Science and
Technology, administered by the National Research Foundation, and hosted by the
University of Johannesburg (UJ). Additional funding has been provided by the Rosa
Luxemburg Foundation. We are obliged to all these institutions, without which our
research would not be possible.
We are obliged to the South African Police Service for releasing the Incident
Registration Information System (IRIS) data on which the report is based. Lt. Col.
Vernon Day responded helpfully to requests for information about IRIS and we are
grateful for his co-operation. Records were obtained through an application made
under the Promotion of Access to Information Act (PAIA), a significant achievement
of the struggle against apartheid. The South African History Archive assisted with the
application, and their expertise is much appreciated.
Our analysis has been assisted by the hard work of three senior research
assistants: Mahlatse Rampedi, Sehlaphi Sibanda and Boikanyo Moloto. We received
help in translating Afrikaans from Laurinda van Tonder and Esmé Grobler. Statistical
advice was provided by Richard Devey and Juliana van Staden at UJ’s Statistical
Consultation Service (Statkon). Lucinda Becorny provided us with administrative
support.
Trevor Ngwane, Jane Duncan, Patrick Bond and Johan Burger engaged with
us on issues around IRIS data over a number of years and/or read an earlier draft of
this report. Craig MacKenzie and Caroline O’Reilly did proof reading, UJ Graphics
designed the cover, and Postnet undertook the printing. Colleagues, students and
associates at the Social Change Research Unit provided camaraderie.

8
Abbreviations
IRIS Incident Registration Information System
PAIA Promotion of Access to Information Act
POP Public Order Policing
RGA Regulation of Gatherings Act
SAHA South African History Archive
SAPS South African Police Service
9
Figures and tables
Figures
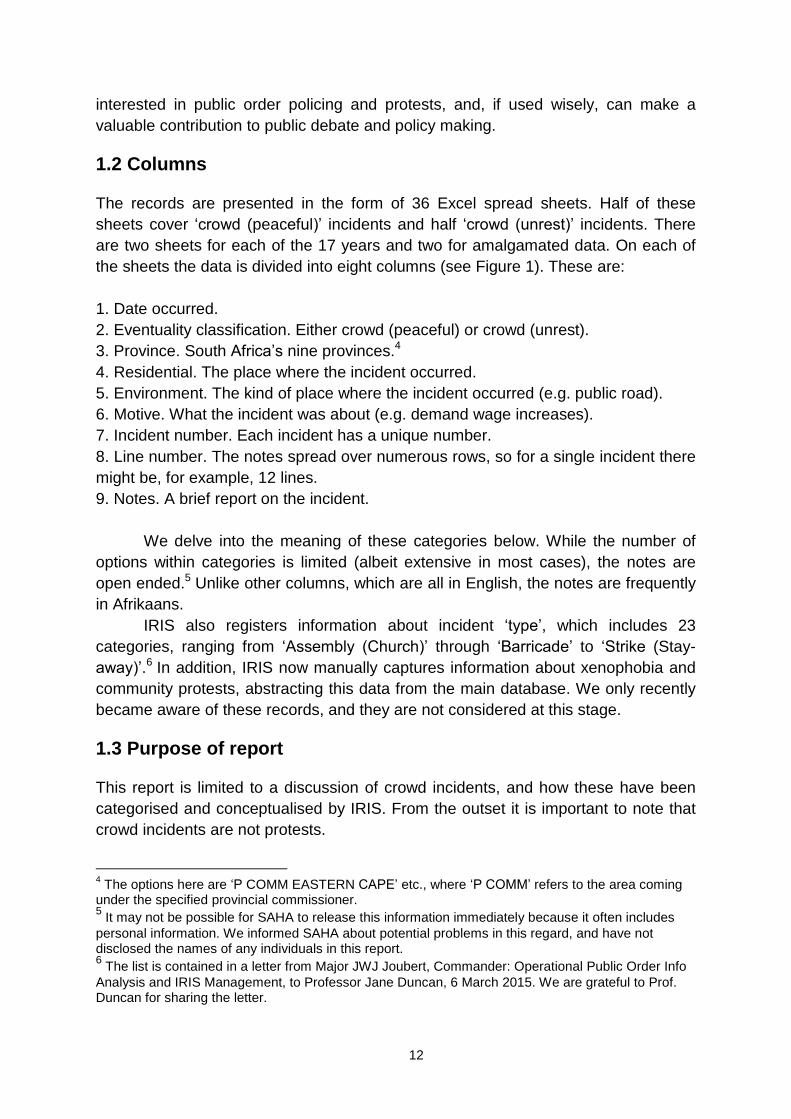
Figure 1. Photograph of IRIS crowd incident data presented on Excel spreadsheet 11
Figure 2. Incidents recorded by IRIS, 1997-2013 ..................................................... 17
Figure 3. Total crowd (peaceful) incidents, 1997-2013............................................. 24
Figure 4 Total crowd (unrest) incidents, 1997-2013 ................................................. 24
Figure 5. Percentage distribution of unrest incidents by province, 1997-2013 ......... 25
Figure 6. Crowd (peaceful) and crowd (unrest) incidents nationally per 100,000
people, 1997-2013 ............................................................................................ 29
Figure 7. Average number of incidents (peaceful and unrest) per 100,000 people, by
province (1997-2013) ....................................................................................... 29
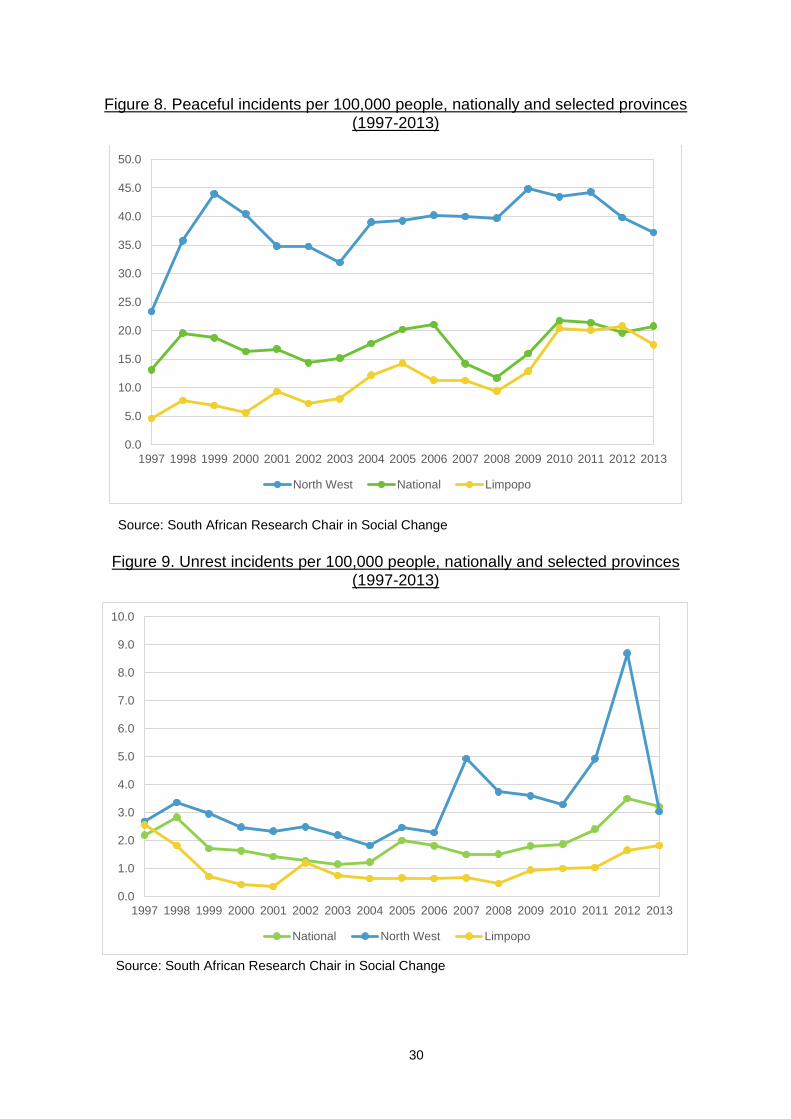
Figure 8. Peaceful incidents per 100,000 people, nationally and selected provinces
(1997-2013) ...................................................................................................... 30
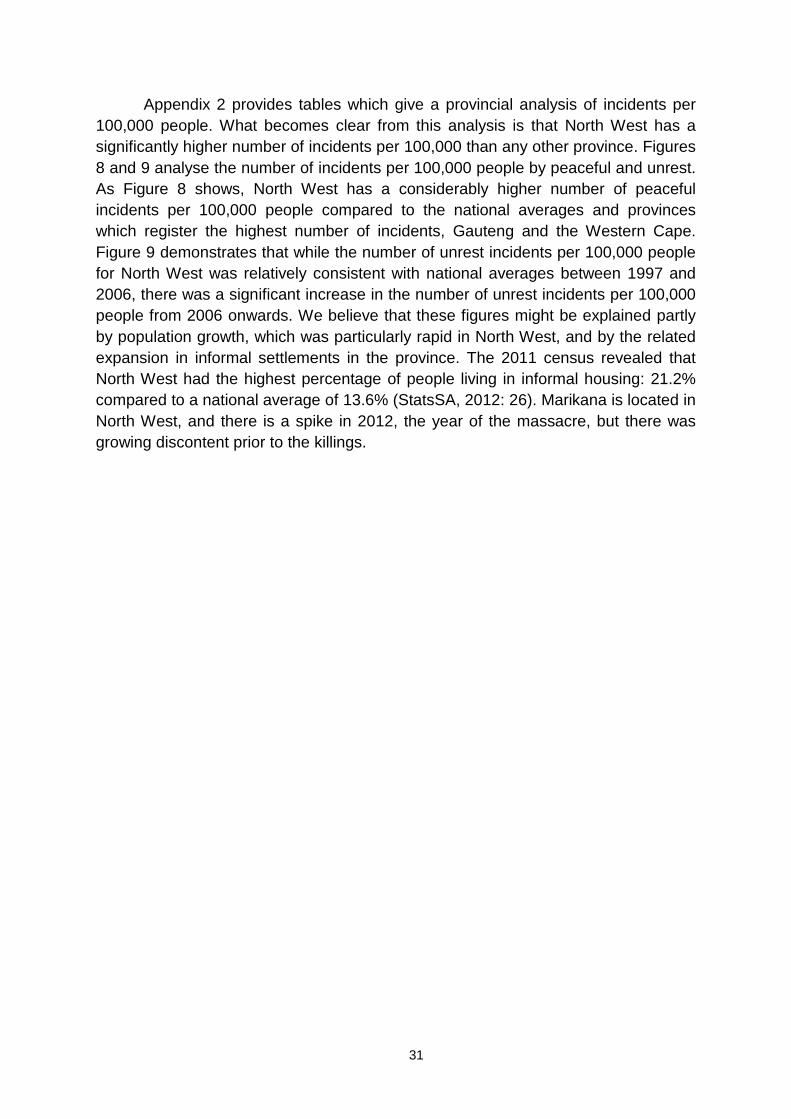
Figure 9. Unrest incidents per 100,000 people, nationally and selected provinces
(1997-2013) ...................................................................................................... 30
Figure 10. Most commonly assigned motive options, 1997-2013 ............................. 35
Figure 11. Estimated selected aggregate motive categories (peaceful), 1997-2013 47
Figure 12. Estimated selected aggregate motive categories (unrest), 1997-2013 ... 47
Tables
Table 1. Examples of incidents classified as 'peaceful' ............................................ 21
Table 2. Examples of incidents classified as 'unrest' ................................................ 22
Table 3. Peaceful and unrest incidents, totals and percentages, 1997-2013 ........... 23
Table 4. Unrest incidents by province, percentages, 1997-2013 .............................. 26
Table 5. Peaceful and unrest incidents, totals and percentages 1997-2013 ............ 27
Table 6. Provincial distribution of all incidents (peaceful and unrest), percentages,
1997-2013 ......................................................................................................... 28
Table 7. Examples of obscure motive options .......................................................... 33
Table 8. Most commonly assigned motive options, 1997 and 2008 and 2009-2013 36
Table 9. Most common motive assigned to an incident, by province ....................... 38
Table 10. Percentage of incidents recorded as 'no motive registered', 1997-2013 .. 40
Table 11. Percentage of incidents recorded as 'no motive registered', 1997-2013, by
province ............................................................................................................ 40
Table 12. Examples of incidents recorded as 'dissatisfied with service delivery'
(peaceful) .......................................................................................................... 42
Table 13. Examples of incidents recorded as 'dissatisfied with service delivery'
(unrest) .............................................................................................................. 43
Table 14. Aggregate motive categories with definitions ........................................... 44
Table 15. Unassigned motive sample by aggregated motive categories ................. 45
Table 16. 'No motive registered' sample by aggregated motive categories .............. 46
Table 17. 20 most frequently used residentials, 1997-2013 ..................................... 50
Table 18. 23 most common environmentals 1997-2013........................................... 52
10
List of appendices
Appendix 1. Peaceful and unrest incidents per year, by province, 1997-2013,
frequencies and percentages
Appendix 2. Incidents per 100,000 people by province and eventuality classification
Appendix 3. Categories of ‘motives’ recorded in IRIS database, 1997-2013, span of
use, and frequency by peaceful and unrest
Appendix 4. Definitions and examples of most 28 widely cited categories of
‘motives’ (excluding no motive registered), 1997-2013
Appendix 5. 5 most commonly assigned motives by province (excluding no motive
registered), 1997-2008 and 2009-2013
Appendix 6. Allocation of unassigned sample to motive groups
Appendix 7. Motive options assigned to aggregate motive categories
Appendix 8. Approximate percentage of motive groups by year, 1997-2013,
peaceful and unrest
Appendix 9. Approximate percentage of motive groups by province
Appendix 10. Top 10 most frequent ‘residentials’ recorded in IRIS database, listed by
province
Appendix 11. Categories of ‘environmentals’ recorded in IRIS database, 1997-2013,
peaceful and unrest’

11
1. Introduction
1.1 Source of data
This report is based on data derived from the South African Police Service (SAPS)
Incident Registration Information System (IRIS). Records were obtained with
assistance from the South African History Archive (SAHA), which requested them
through a Promotion of Access to Information Act (PAIA) application. SAHA will
make the data available to the public through its website. We are obliged to the
SAPS for its co-operation.1
The initial request, which was formulated on the basis of earlier releases of
information, was for:
Copies of any and all records in the South African Police Services’
Incident Registration Information System (IRIS) as follows: 1. Data
recorded from 1997-2013 by each calendar year for each incident class
known as (i) “crowd (unrest)” and (ii) “crowd (peaceful)”, with this broken
down by (a) geography (provinces and nationally), and this further
disaggregated according to (b) motive.2
Figure 1. Photograph of IRIS crowd incident data presented on Excel spreadsheet
The records list 156,230 crowd incidents recorded between 1997 and 2013.3
This is a vast database. IRIS has never before released anything remotely similar in
terms of scale or breadth. It provides an unparalleled resource for researchers
1 SAHA’s reference number is SAH-2014-SAP-0018.
2.While this request seems simple, getting it right meant understanding terms used by IRIS, and this
involved tracking SAPS annual reports, ministerial statements and previous releases of data, making informal requests and submitting an earlier PAIA application. 3 We have made a similar request for 2014 data, and await a response.
12
interested in public order policing and protests, and, if used wisely, can make a
valuable contribution to public debate and policy making.
1.2 Columns
The records are presented in the form of 36 Excel spread sheets. Half of these
sheets cover ‘crowd (peaceful)’ incidents and half ‘crowd (unrest)’ incidents. There
are two sheets for each of the 17 years and two for amalgamated data. On each of
the sheets the data is divided into eight columns (see Figure 1). These are:
1. Date occurred.
2. Eventuality classification. Either crowd (peaceful) or crowd (unrest).
3. Province. South Africa’s nine provinces.4
4. Residential. The place where the incident occurred.
5. Environment. The kind of place where the incident occurred (e.g. public road).
6. Motive. What the incident was about (e.g. demand wage increases).
7. Incident number. Each incident has a unique number.
8. Line number. The notes spread over numerous rows, so for a single incident there
might be, for example, 12 lines.
9. Notes. A brief report on the incident.
We delve into the meaning of these categories below. While the number of
options within categories is limited (albeit extensive in most cases), the notes are
open ended.5 Unlike other columns, which are all in English, the notes are frequently
in Afrikaans.
IRIS also registers information about incident ‘type’, which includes 23
categories, ranging from ‘Assembly (Church)’ through ‘Barricade’ to ‘Strike (Stay-
away)’.6 In addition, IRIS now manually captures information about xenophobia and
community protests, abstracting this data from the main database. We only recently
became aware of these records, and they are not considered at this stage.
1.3 Purpose of report
This report is limited to a discussion of crowd incidents, and how these have been
categorised and conceptualised by IRIS. From the outset it is important to note that
crowd incidents are not protests.
4 The options here are ‘P COMM EASTERN CAPE’ etc., where ‘P COMM’ refers to the area coming
under the specified provincial commissioner. 5 It may not be possible for SAHA to release this information immediately because it often includes
personal information. We informed SAHA about potential problems in this regard, and have not disclosed the names of any individuals in this report. 6 The list is contained in a letter from Major JWJ Joubert, Commander: Operational Public Order Info
Analysis and IRIS Management, to Professor Jane Duncan, 6 March 2015. We are grateful to Prof. Duncan for sharing the letter.
13
The authors are interested in analysing protests, and, ultimately, we intend to
use IRIS data to assist in this process. Indeed, the present study arose out of a large
project known as Rebellion of the Poor, which focuses on community protests. 7 In
addition to collecting a substantial body of interview data, this project has also
developed the largest database of media-reported protest incidents. However, in
order to conduct a rigorous interrogation of IRIS statistics from the perspective of
protest analysis, it is necessary first to understand the data in its own terms,
providing minimal interpretation. What is the data measuring? Who is capturing the
data, for what purpose and with what limitations? What is the relationship between
the theory of IRIS and what happens in practice? Many people – police, politicians,
pundits – have jumped to conclusions when utilising the data, and this is something
we wish to avoid. While we have attempted to represent the rationale and
implications of IRIS as accurately as possible, errors may have crept in, and we
welcome corrections and additional data that can improve the analysis.
We have called this report a ‘preliminary analysis’, and it is no more than this.
We have attempted to expand public knowledge about IRIS data in the expectation
that this will provide clarifications, thereby assisting further research. The report
poses far more questions than it answers. We make no apology for this. It reflects
the present state of our knowledge and we hope that other researchers will assist in
providing answers. However, on our side, we have begun the process of interpreting
the data for the purpose of distinguishing different kinds of protests and for counting
their numbers, and we hope to present a report on this in the near future.
1.4 Definitions: complexity and confusion
SAPS publishes summary statistics for ‘crowd-related incidents’ in its annual reports,
which cover the 12 months to 31 March each year. These are broken down into
‘peaceful incidents’ and ‘unrest-related incidents’. From time to time, the Minister of
Police (e.g. National Assembly 2012) has provided similar statistics for ‘crowd
management incidents’, dividing these between ‘peaceful’ and ‘unrest/violent’. The
distinction, if one exists, between ‘crowd-related’ and ‘crowd management’ and
between ‘unrest-related’ and ‘unrest/violent’ is unclear. However, quantitatively, the
difference is not significant – in 2010/11 the totals were, respectively, 12,651 and
12,654.8 ‘Violent’ is not normally a synonym of ‘unrest’, and its usage is worth noting.
IRIS data sticks to ‘unrest’, and does not utilise ‘violent’. We return to this in section
2.
The word ‘protest’ is not used in SAPS reports or in the minister’s statements
mentioned above, and it is not used in IRIS statistics examined here. It is now crystal
clear that ‘incidents’ cannot be equated with protests. The origin of the confusion is
7See Alexander 2010, Alexander 2012, Alexander & Pfaffe 2014, Alexander, Runciman & Ngwane
2014a, and Alexander, Runciman & Ngwane 2014b. 8 Specifically, see SAPS 2013: 101 and National Assembly 2012. The difference in other years may
have been somewhat higher (see Alexander 2010: 27).
14
uncertain, but it is present in a monograph by Bilkis Omar, published in 2007. She
writes that IRIS ‘confirmed that protest marches between 2002 and 2005 had
increased … [by] 50 per cent (see Figure 3)’, but her Figure 3, sourced to the SAPS,
is entitled ‘Total crowd management incidents’ (Omar 2007: 17-18). More recently,
two Media24 investigators published a story that elided ‘service delivery protests’
and IRIS data for incidents listed with the ‘motive’ ‘dissatisfied with service delivery’
(Saba & van der Merwe 2013). These two things seem similar, but they are not the
same. A subsequent article in City Press went further, claiming that ‘between
November [2013] and January [2014], 2,947 service delivery protests have taken
place across the country’ (du Plessis, Ndlangisa & Saba 2014). A simple comparison
with the earlier Media24 analysis would show this to be an erroneous claim, and
even if ‘service delivery protest’ is conflated with ‘protest’ the figures still exaggerate
the position, as we will see later. Perhaps the authors confused ‘service delivery
protest’ and ‘crowd incident’. One wonders whether inaccuracy was a consequence
of misinformation or a misreading.
Further confusion arises from a shift in the meaning of ‘gathering’. The 1993
Regulation of Gatherings Act (RGA) defines the word as meaning: ‘any assembly,
concourse or procession of more than 15 persons in or on any public road … or any
public place or premises wholly or partly open to the air’. It then specifies that the
‘assembly, concourse or procession’ must be such that either (a) ‘the principles,
policy, actions or failure to act of any government, political party or organization …
are discussed, attacked, criticized, promoted or propagated’, or ‘(b) Held to form
pressure groups, to hand over petitions to any person, or to mobilize or demonstrate
support for or opposition to the views, principles, policy, actions or omissions of any
person or body of persons or institution.’ That is, the Act defines ‘gathering’ in
political terms. A 2014 SAPS (2014) National Instruction uses precisely the same
wording, but ends at the word ‘air’. That is, the concept had been depoliticised. It is
not clear to us exactly when this occurred, but Jane Duncan (2010) showed that by
1998 the Makana Municipality (which includes Grahamstown) was considering
applications for events such as ‘fun runs’ as if they were ‘gatherings’.
To complicate matters further the National Instruction (SAPS 2014b: 2) also
states: ‘crowd management means the policing of assemblies, demonstrations and
all gatherings … whether recreational, peaceful, or of an unrest nature’. Here usage
of ‘gathering’ corresponds to its inclusion as one of the 23 ‘types’ of ‘crowd
management’ incident mentioned above. 9 Disaggregation of ‘assemblies’ from
‘gatherings’ and the mention of ‘demonstrations’ -– which, by definition, include 15 or
fewer people – indicate that ‘crowd management’, hence crowd management data, is
9 The full list of incident types contained in the letter cited in Note 5 includes: Assembly (Elections),
Assembly (Church), Assembly (Festivity/Commemorate), Assembly (Meeting), Assembly (Music festival), Assembly (Political meeting), Assembly (Poster demonstration), Assembly (Procession), Assembly (Sport), Barricade, Boycott action, Demonstration, Disaster/Catastrophe, Gathering, Hostage situation, Intimidation, Occupation, Sit-in, Stay away action, Strike (Labour affairs), Strike (Occupation), Strike (Stay away).
15
not restricted to events involving more than 15 people. 10 While the Instruction
distinguishes ‘recreational’ from ‘peaceful’ and ‘unrest’, as if it were a separate class
of incident, IRIS classifies recreational incidents under ‘peaceful’ and ‘unrest’.
One further usage of ‘gathering’ was present in the Minister of Police’s
response to a parliamentary question. In this it was stated: ‘During 2009-10, the most
common reason for conducting crowd management (peaceful) gatherings [our
emphasis] was labour related demands …’ We won’t burden the reader by
attempting to unravel this muddle, but simply assert, yet again, that what the SAPS
records is ‘incidents’, and these are not restricted to ‘gatherings’ (National Assembly
2012). To conclude, IRIS counts crowd management incidents, or crowd incidents
for short. These cannot be equated with either protests or gatherings.
1.5 IRIS and Public Order Policing
IRIS is closely connected with public order policing. Information is captured locally, at
unit level, by uniformed public order police, and then checked, stored and analysed
centrally by IRIS staff. The data is used to monitor public order interventions, inform
policy and motivate for increased funding. Before undertaking even a preliminary
analysis of statistics generated by IRIS, one needs some grasp of the history of post-
apartheid public order policing.
IRIS was established in 1992, at a moment when heightened conflict in the
public sphere matched tense negotiations, and there was much uncertainty about
the form that public order policing should take. By 1996 a philosophy of ‘crowd
control’ had been replaced, at least officially, by one of ‘crowd management’, in
which police and organisers co-operate to ensure that gatherings are peaceful.
Public Order Policing (POP) units were established and IRIS began recording crowd
management incidents. Initially the POP units had about 11,000 members (Omar
2007: 15; SAPS 2011).
In 2002 the SAPS’s priorities shifted and POP units were restructured into
Area Crime Combatting Units (ACCUs). According to Vally (2009), quoting a 2004
SAPS policy document, ‘reasons for the change included “the decrease in the
number and intensity of major demonstrations, violent marches and labour unrest
since the inception of democracy”’. Crime prevention, previously a secondary
function, became primary, and command was decentralised to area commissioners,
who deployed the units to assist local stations with regular crime combatting duties.
Staffing was reduced to 7,327 members (Omar 2007: 15; SAPS 2011).
In 2006, policing areas were disbanded, and, while this was aimed at further
strengthening stations, the units were placed under central command, and re-named
10
The Instruction defines ‘demonstration’ as meaning ‘a congregation of persons consisting of more than one person (but not more than 15 persons), demonstrating for or against any person, cause, action, or failure to take action.’ This is similar to the formulation used in the RGA.

16
Crime Combatting Units (CCUs) (Ministry of Police n.d.: 15). 11 Simultaneously,
staffing was cut to 2,595 members. There were just 23 units, compared to 42 in 1995
(SAPS 2011). The SAPS’s capacity to undertake public order policing had been
further diminished, just at the moment when, as Omar (2006: 1) noted at the time,
there was a ‘growing number and intensity of service delivery protests and riots’.
Johan Burger (2014: 19) commented: ‘The short-sightedness of this decision
was soon exposed when widespread xenophobic violence erupted in March 2008’.
The CCUs were expanded – reaching a peak during the 2010 World Cup – and in
2011 re-prioritisation of public order policing was signalled by returning to the ‘Public
Order Policing’ (POP) label (Tait & Marks 2011: 19).12 In 2013 there were 4,642
members, and in January 2014 SAPS Commissioner Riah Phiyega announced that
the number would almost double, to about 9,000 (Burger 2014: 19-20; eNCA
2014).13
1.6 IRIS classifications
IRIS records five main classes of incidents, all associated with public order policing
interventions. These are (1) ‘Crowd (peaceful)’ and (2) ‘Crowd (unrest)’, which are
the focus of this report and considered in detail below. (3) ‘Crime prevention’. This
includes a wide variety of activities – roadblocks, VIP protection, monitoring hijack
hotspots, etc. – sometimes linked to a larger operation involving Metro police or
other SAPS units. (4) ‘Support’. A range of activities such as tactical support for a
sheriff carrying out Incidents recorded by IRIS, 1997-2013, transporting criminals,
dealing with overturned trucks, and disaster management. (5) Unrest (other).
Intervention in conflict between groups of civilians, notably ‘taxi wars’, but also ‘rural
factions’, ‘urban gangs’ and ‘political violence’ (rare these days). There is a sixth
class, ‘movement’, introduced for the World Cup and not used much since.14
Figure 2 shows the number of incidents related to these classes. It is based
on information provided by the SAPS in response to an earlier PAIA application.
‘Other incidents’ includes ‘support’, ‘unrest (other)’ and ‘movement’. The graph
demonstrates the degree to which public order police are engaged in non-public
order policing, especially the crime combatting/prevention function. In 2000, public
order policing units participated in 29,605 crime prevention incidents, which might be
compared with the peak year for crowd management, 2013, when there were 12,709
incidents for peaceful and unrest combined. The importance of crime combatting
11
At SAPS headquarters the CCUs were located within Operation Response Services (ORS). Public order policing still comes under this division, which also covers IRIS, the National Intervention Units, the Special Task Force, Tactical Response Teams, Mobile Operations, and the SAPS Airwing. ORS works closely with NATJOINTS, the National Joint Operational and Intelligence Structure. Most of these structures played a role at Marikana. 12
In this report we distinguish between ‘public order policing’, all in lower case, and Public Order Policing (i.e. POP), with the former including duties carried out by ACCUs and CCUs. 13
On public order policing see also Duncan 2014. 14
In practice there is a measure of overlap between classes, and, for instance, taxi conflicts appear as crowd incidents as well as unrest (other).

17
activities is reflected in arrests. In 2010/11, the breakdown was as follows: crime
prevention – 39,020 persons, crowd management – 3,266 persons, other – 1,016
persons (SAPS 2011).
In 2012 and 2013 there was a marked upturn in ‘support’ and ‘unrest (other)’
incidents, matched, in 2013, by a sharp decline in ‘crime prevention’ incidents. But
the most remarkable feature of the graph is the way it reveals a crash in the number
of incidents following the 2006 restructuring. This was less conspicuous with crowd
(unrest) and unrest (other), suggesting that CCUs had to prioritise collective unrest
and violence when it did occur. The rapid decline in recorded crowd (peaceful)
incidents, roughly 90% of all crowd incidents, is also reflected in Figures 3 and 4.
Data for media-reported protests shows increased numbers of incidents in 2007,
2008 and 2009 after a slight lull in 2006, and there can be no doubt that the dip in
IRIS-registered crowd incidents reflects reduced capacity to intervene in and even
monitor gatherings and other public events – and perhaps, sometimes, a failure to
record responses – rather than a reduction in the number of such occasions.
Something like 30% of crowd events that would have been included in earlier years
was simply not recorded. This under-recording was uneven. At one point there were
no units at all in Mpumalanga, and very few incidents were recorded. Withdrawal of
units from less strategic centres means that under-recording would be even greater
in remoter areas (see also Vally 2009).
Figure 2. Incidents recorded by IRIS, 1997-201315
Source: South African Research Chair in Social Change
IRIS details the number of public events the public order police record, not the
number of events that occur. There will always be under-recording, but the extent of
under-recording is related to the number of units. It is reasonable to assume that
under-recording occurred least in the period up until 2002 and was worst in the years
15
IRIS data for ‘Incidents: query per classification’. Available on SAHA website, reference number
SAH 2014-SAP-008, call number AL2878_B01.7.28.
0
5000
10000
15000
20000
25000
30000
35000
1997 1998 1999 2000 2001 2002 2003 2004 2005 2006 2007 2008 2009 2010 2011 2012 2013
Crime prevention incidents Crowd incidents (peaceful and unrest)
Other incidents
18
2007 to 2009, and that it is probably still greater now than 2003 to 2006. If we factor
this into our overview, the general upward trend in numbers of crowd incidents
should be steeper.

19
2. Peaceful and unrest incidents
2.1 Distinctions: official
‘Crowd (peaceful)’ and ‘crowd (unrest)’ both involve crowd management, but IRIS
treats them as distinct classes of ‘incident’ or ‘eventuality’. What is the difference
between them? According to Lt. Col. Vernon Day (2015) who is responsible for
policy, standards and research at POP: ‘Crowd (unrest) refers to crowd management
incidents requiring some form of police intervention such as pushing back or making
arrests in order to maintain public order’. Use of tear gas, water cannon, stun
grenades or rubber bullets indicates that unrest has occurred. When the Minister of
Police was asked how many arrests there had been in the course of crowd
management all numbers related to ‘crowd (unrest)’.16 If a case docket is opened
this would be evidence of ‘unrest’.17 A spontaneous incident, even if it contravened
the RGA, does not require ‘intervention’ if it remains peaceful. In our view, it is
misleading to equate ‘crowd unrest’ with a violent gathering. The evidence for unrest
is based on what the police do – push backs, dispersal, arresting, opening a docket
etc. – rather than what protesters (or other public-event participants) do. The police
are expected to maintain order, but assessments as to what constitutes a threat to
order are somewhat subjective, and do not require evidence that there has already
been violence (in the sense of injury to a person or damage to property).
According to Day (2015): ‘Crowd peaceful refers to crowd management
incidents … which require no police interventions’. Rather than ‘crowd (unrest)’ being
seen as the opposite of ‘crowd (peaceful)’, thus implicitly violent (or explicitly so in
the case of the Minister of Police’s answer mentioned above), it is more accurate to
see crowd (peaceful) as the opposite of crowd (unrest). It is not the absence of
violence that defines ‘peaceful’, it is the absence of intervention. This evaluation
accords with the National Instruction’s approach to different levels of threat. These
are conceived as follows:
Level One: A peaceful gathering and less significant sport, entertainment or social
event which can be policed by members of Visible Policing at station level or the
Metro Police … no threat or need for the use of force is envisaged. The POP unit
must be on standby.
Level Two: Unconfirmed information regarding a possibility of a threat against lives
and property. Members of Visible Policing at station level and the Metro police …
must be the primary role players, with the relevant POP unit in reserve at the scene.
16
The figures were: 2009/10 – 4,883; 2010/11 – 4,680; 1 April 2011 to 5 March 2012 – 2,967
(National Assembly 2012). 17
Letter from Major JWJ Joubert, Commander: Operational Public Order Info Analysis and IRIS
Management, to Professor Jane Duncan, 6 March 2015.
20
Level Three. Confirmed information regarding a likely threat to lives and property.
The POP unit must take operational command.
The thinking is that Level Three situations are linked to POP intervention and could
well end up as unrest incidents. Levels One and Two, where POP is on standby or
reserve, should be peaceful incidents. The Instruction addresses the problem of
‘unforeseen (spontaneous) gatherings’ where threat levels cannot be determined in
advance and station level Visible Policing units or Metro Police are likely to be first
on the scene. It sets out a step by step approach aimed at avoiding confrontation
until a POP contingent arrives, but there is one exception. ‘If a national road is being
blocked’, states the Instruction, ’the road needs to be cleared first before
negotiations may start’. In this situation, the incident ought to be recorded as ‘unrest’
even though there is no violence and no POP intervention.
The critical point is that whether an incident is defined as unrest or peaceful is
determined by whether the police have intervened, not by whether there has been
violence.
2.2 Distinctions: practice
In the incidents we reviewed, the distinction between crowd (peaceful) and crowd
(unrest) generally holds true. However, the conflation of ‘violence’ and ‘unrest’
cannot be justified. Moreover, many incidents appear to have been wrongly
classified, presumably as a consequence of poor recording and insufficient diligence
by IRIS staff.
Table 1 provides examples of incidents which have been classified as
peaceful. However, the example recorded as ‘conflict between community and
gangs’ records a number of violent incidents, including what appears to be actions
motivated by xenophobia resulting in someone being shot. In the other two
examples, there is either evidence of arrests or of a case docket being opened.
Thus, assuming that evidence of violence, arrests and dockets being opened is
sufficient to qualify as an ‘unrest’ eventuality, these incidents were wrongly classified.
Table 2 provides examples of incidents classified as unrest. As we have argued,
such incidents should not be equated with violence. Indeed, none of the examples
provided seems to indicate there was any violent action. Furthermore, none of these
examples provide evidence of cases being opened or arrests being made.
It is therefore important that, with specific regard to peaceful/unrest, IRIS data
should be interpreted with caution. Unrest cannot be equated with violence.
Moreover, errors are frequent. Further research is therefore needed before any
conclusions about levels of violence can be drawn, and this will form part of a
subsequent report.

21
Table 1. Examples of incidents classified as 'peaceful'18
Motive Notes
Attack on security
force ON 2012-12-22 AT ABOUT 16:00 TILL 21:00 MAKHADO POP MEMBERS UNDER W/O
CHARANE MONITOR/CONTROL THE CROWD OF ± 500 PEOPLE OF TSHIKUWI/MANAME
PARADISE WHO WERE GATHERED AT THE N1 NORTH OF MAKHADO TOWN WHEREBY
A TRUCK OF STEVE TRANS DROPED ±100 BOXES OF SUNSTAR COOKING OIL.THE
COMMUNITY MEMBERS FORCE TO LOOT/TAKE THE BOXES WITHOUT OWNERS 'S
WILL AND THREW STONES TO POLICE TO GIVE THEM ACCESS TO STEAL IN THE
PRESENCE OF THE POLICE.POP MEMBERS MANAGE TO ARREST 02 A/FEMALES FOR
PUBLIC VIOLANCE AND THEFT.THE SITUATION FORCED W/O CHARE TO INSTRUCT
CONST:.. TO FIRE TWO SHOTS OF SHOTGUN TO THE GROUND.NO ANY INJURIES
REPORTED AND CAPT… ALSO ARRIVED AT SCENE AND GIVEN THE REPORT FOR
INCIDENT.ARRESTED WOMEN…THEY BOTH DETAINED AT MAKHADO SAPS FREE
FROM INJURIES AS PER CAS=722/12/2012,SAP 14=261,262/12/2012.CONST… SUSTAIN
MINOR INJURY ON HIS RIGHT HAND AND THE REPORT MADE W/O… AS PER OB=274/
12/2012 OF MAKHADO POP.THE ADRESS OF THE TRUCK WHICH DROPED THE LOAD
IS…AND THE TRUCK WAS FROM LOUIS TRICHARDT CASH-CARY STORE TO
ZIMBABWE.POP MEMBERS MANAGE TO MONITOR THE SITUATION TILL 21:00 WHERE
THE LOAD WAS RE-LOADED AND THE TRUCK WAS ESCORT TILL IT PASS THE
BAOBAB TOLL GATE.OB NO.273/12/2012 IRS NO.729836 [22/12/2012, Limpopo]
Conflict between
community and
gangs
ON MONDAY 18,MARCH 2013 AT ABOUT 14:45 PROV-JOC CONTACTED AP1 THAT AT
M/EAST TSAMAYA ROAD NEXT TO FIVE STAR THAT ±300 PEOPLE GATHERING AND
LOOTING THE PAKISTAN`S SHOPS.AP99 CAPT… INFORMED ABOUT THE
SITUATION,AP55,AP34 AND AP30 DISPATCHED FROM LYTTLETON TO MAMELODI GO
AND MONITOR THE SITUATION. AT ABOUT 15:15 AP34 WO… REPORT THAT THEY
ARRIVED AT TSAMAYA ROAD NEXT TO FIVE STAR,WERE A PAKISTAN SHOT
SOMEBODY WHO WAS PASSING.IT IS ALLEGED THAT PEOPLE WERE TRYING ROB
HIM.HE STARTED SHOOTING RONDOMLY,AND ONE PERSON WAS SHOT,ONE
ASSAULTED BY THE COMMUNITY.THE PAKISTAN GUY WAS TAKEN TO MAMELODI
EAST SAPS.AT ABOUT 15:50 AP34 REPORT THAT LT COL… INFORMED THEM THAT
ONE PAKISTAN IS STIL IN THE SHOP LOADING THE STOCK TO MOVE IT AWAY.IT
ALLEGED THAT FIGHT IS BETWEEN THE SOMALIANS AND THE PAKISTANS,SO IT
SEEMS THE PAKISTAN SHOT SOMALIAN AND THE COMMNITY ASSAULTED THE
PAKISTANS. ±300 PEOPLE GATHERRING,50% MALES AND 50% FEMALES ALL ABOVE
18 YEARS. AT 21:45 AP92 CAPT… REPORTED FROM MAMELODI EAST AT EXTENSION
16 THE SOMALIANS TCKSHOP OWNERS ARE LOADING THEIR STOCK/GROCERIES
INTO VEHICLES AND MOVING THEM TO SUNNYSIDE AND PRETORIA CBD.ONE(1)
PAKISTAN TUCKSHOP OWNER REFUSED TO MOVE HIS STOCK AWAY SAYING HE
FEELS SAFE.THE POLICE ARE ESCORTING THEM OUT OF MAMELODI.A CASE DOCKET
OF ATTEMPTED MURDER AND POSSESSION OF FIREARM AND AMMUNITION WAS
REGISTERED AT MAMELODI EAST SAPS AND ONE(1) SUSPECT WAS ARRESTED.THE
SITUATION IS CALM AND UNDER CONTROL.TUESDAY 2013-03-19 AT 00:05 AP36 W/O
RIKHOTSO REPORTED FROM HOUSE 18606,TULIP STREET,EXTENSION 16,MAMELODI
EAST THAT A TUCKSHOP WHICH BELONGS TO A PAKISTAN NATIONAL WAS BROKEN
IN AND THE OWNER… WHO WAS FOUND INSIDE WAS ASSAULTED.THE SUSPECTS
GAINED ENTRY BY REMOVING ONE ZINC FROM THE ROOF OF THE TUCKSHOP.
NOTHING WAS STOLEN FROM THE TUCKSHOP AND INTRUDERS FLED AFTER THEY
ASSAULTED THE VICTIM WHO WILL CONSULT A DOCTOR DURING THE DAY.FOUR(4)
OTHER PAKISTAN NATIONALS AGREED TO SLEEP WITH THE VICTIM INSIDE THE
TUCKSHOP TO PREVENT FURTHER BREAK INS.THE OWNER ALSO PROMISED TO
CALL THE POLICE IMMEDIATELY SHOULD ANOTHER ATTEMPT BE MADE.THE POLICE
WILL PATROL THE AREA. AT 07:00 EVERYTHING WAS QUITE. [18/03/2013, Gauteng]
18
It should be noted that with the exception of personal details, which have been removed, the notes are presented exactly how they appear within the IRIS data supplied to us.

22
Motive Notes
Dissatisfied with
local government ON 2008-01-09 BETWEEN 17:00 AND 21:00 CCU SPRINGS MEMBERS MONITORED THE
SITUATION AT BARCELONA S/CAMP WHERE -+100 MEMBERS OF CONCERNED
BARCELONA GROUP… WHO ARE MEMBERS OF PAC,IFP AND MKVF GATHERED AND
DAMAGED 75 TOILETS AT ETWATWA EXT.34 MIG FUNDED PROJECT.A CASE WAS
OPENED… (0761865225)AS PER ETWATWA SAPS CASE:79/01/2008.THE INCIDENT
TOOK PLACE AT ABOUT 17:00 TO 21:00.NO ARRESTS WAS MADE.THE SUSPECTS ARE
KNOWN TO THE COMPLAINANT.[09/01/2008, Gauteng]
Source: South African Research Chair in Social Change
Table 2. Examples of incidents classified as 'unrest'
Motive Notes
Dissatisfied with local
government
ON 2007-03-02 FROM 16:00 TO 19:00+-220 RESIDENTS OF VAALBANK TOGETHER
WITH THE COUNCILLORS HELD A MEETING AT VAALBANK COMMUNITY HALL OVER
THE SHORTAGE OF WATER SUPPLY.THE MEETING PROVED FRUITLESS DUE TO
UNRULLY BEHAVIOUR OF THE PARTICIPANT,THEY GAVE THE COUNCILLOR 24 HRS
TO RECTIFY THE PROBLEM OF WATER SUPPLY.THE MATTER HAS NOT YET BEEN
SOLVED.CCU MEMBERS OF MIDDELBURG MONITORED THE SITUATION. [02/03/2007,
Mpumalanga]
Resistance to
government policy
NC41 REPORTED THAT THEY ATTENDED THE CONFLICT OVER ILLEGAL WATER
CONNECTION AT EXT.04 ERASMUS.IT WAS 20 MEN NEAR STAND NO:5620….THE
GROUP OF EXT.04 AND 05 REACHED AN AGREEMENT NOT TO CONNECT THAT
ILLEGAL PIPE OF WATER FROM THOSE WHO HAVE LEGAL WATER PIPES.THE
MATTER WAS SOLVED PEACEFUL NOTHING ILLEGAL WAS DONE
Election campaign ON MONDAY 2011-04-04 AT ABOUT 09:00 ±1500 RESIDENTS OF THAPELONG VAN
STADENSRUS WERE INVITED FOR IMBIZO AT THAPELONG HIGH SCHOOL
PREMISES. THE MEC QABATHE OF CO-OPERATIVE GORVENANCE, TRADITIONAL
AFFAIRS AND HUMAN SETTLEMENT AND OTHER MINISTERS ATTENDED IMBIZO
WHEREBY RESIDENTS HAVE BEEN ADDRESSED IN REGARD OF BUDGET VOTE
SPEECH. AT ABOUT 14:00 PARTICIPANTS DISPERSED PEACEFUL. [04/04/2011, Free
State]
Source: South African Research Chair in Social Change
2.3 Numbers
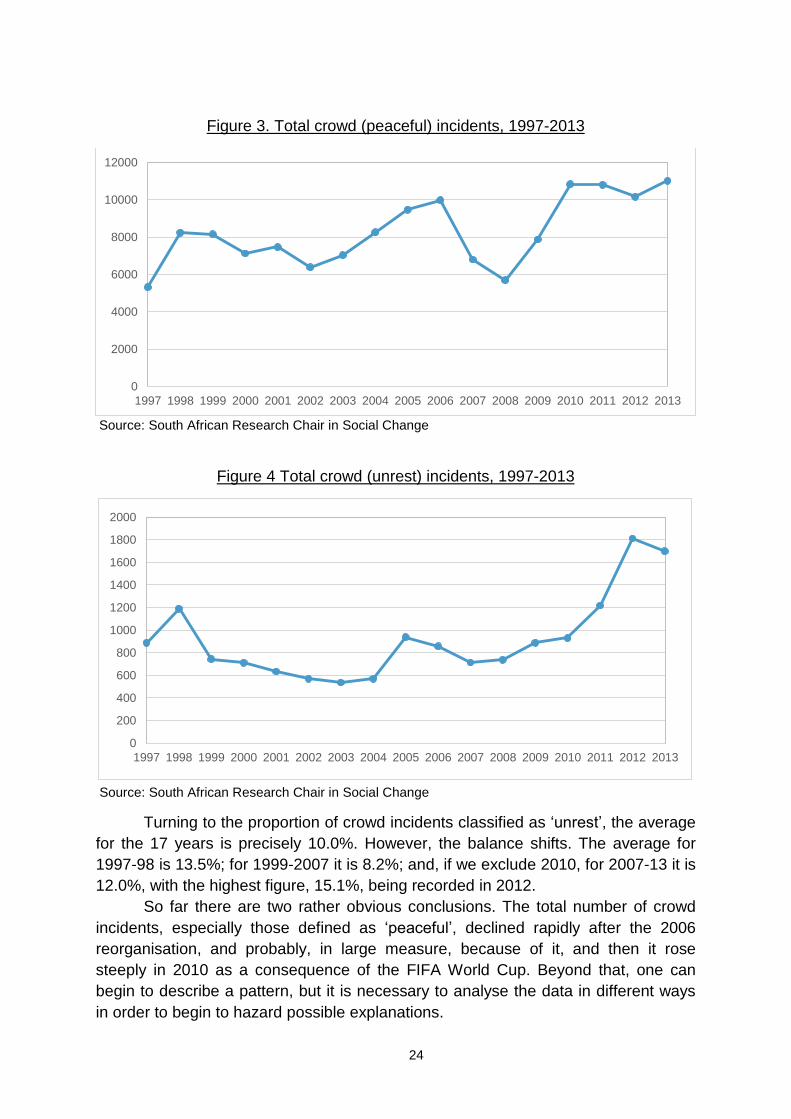
Table 3 shows total crowd incidents per year and the split between peaceful and
unrest. Figures 3 and 4 display numbers of peaceful and unrest incidents by year.
The scales are different because we want to draw attention to the different patterns,
and that for unrest is obscured if all data is presented in one graph.19
The totals reveal an early peak in 1998 – something that requires close
investigation. After a drop, the total number of incidents plateaus around 7,000-8,000
per year between 2000 and 2003. It then rises steeply, peaking at nearly 11,000 in
2006. This is the year the CCUs were introduced, units disbanded and numbers of
19
In the financial year 2013/14 there was a total of 13,575 ‘crowd-related incidents’, of which 11,668 were recorded as ‘peaceful’ and 1,907 as ‘unrest-related’ (SAPS 2014a). According to the Minister of Police in 2014/15 there were ’14,740 incidents of which 12,451 were peaceful and, 2,289 turning violent (sic)’ (Nene 2015).
23
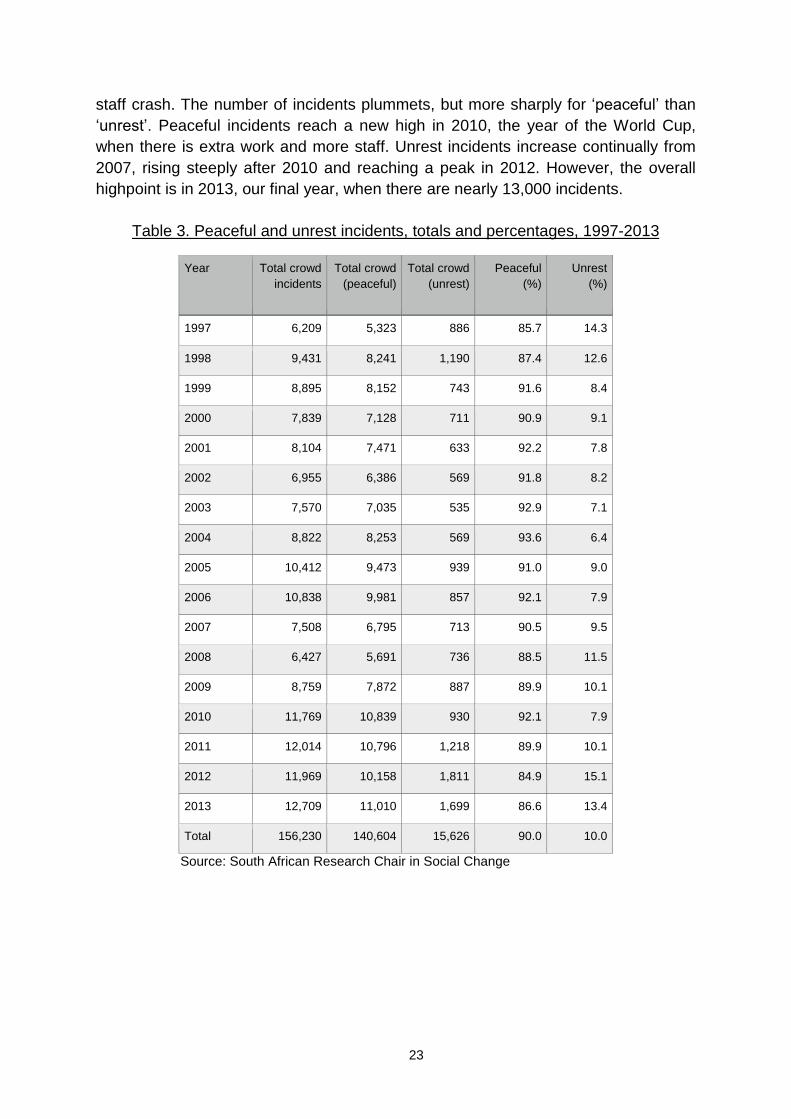
staff crash. The number of incidents plummets, but more sharply for ‘peaceful’ than
‘unrest’. Peaceful incidents reach a new high in 2010, the year of the World Cup,
when there is extra work and more staff. Unrest incidents increase continually from
2007, rising steeply after 2010 and reaching a peak in 2012. However, the overall
highpoint is in 2013, our final year, when there are nearly 13,000 incidents.
Table 3. Peaceful and unrest incidents, totals and percentages, 1997-2013
Year Total crowd
incidents
Total crowd
(peaceful)
Total crowd
(unrest)
Peaceful
(%)
Unrest
(%)
1997 6,209 5,323 886 85.7 14.3
1998 9,431 8,241 1,190 87.4 12.6
1999 8,895 8,152 743 91.6 8.4
2000 7,839 7,128 711 90.9 9.1
2001 8,104 7,471 633 92.2 7.8
2002 6,955 6,386 569 91.8 8.2
2003 7,570 7,035 535 92.9 7.1
2004 8,822 8,253 569 93.6 6.4
2005 10,412 9,473 939 91.0 9.0
2006 10,838 9,981 857 92.1 7.9
2007 7,508 6,795 713 90.5 9.5
2008 6,427 5,691 736 88.5 11.5
2009 8,759 7,872 887 89.9 10.1
2010 11,769 10,839 930 92.1 7.9
2011 12,014 10,796 1,218 89.9 10.1
2012 11,969 10,158 1,811 84.9 15.1
2013 12,709 11,010 1,699 86.6 13.4
Total 156,230 140,604 15,626 90.0 10.0
Source: South African Research Chair in Social Change
24
Figure 3. Total crowd (peaceful) incidents, 1997-2013
Source: South African Research Chair in Social Change
Figure 4 Total crowd (unrest) incidents, 1997-2013
Source: South African Research Chair in Social Change
Turning to the proportion of crowd incidents classified as ‘unrest’, the average
for the 17 years is precisely 10.0%. However, the balance shifts. The average for
1997-98 is 13.5%; for 1999-2007 it is 8.2%; and, if we exclude 2010, for 2007-13 it is
12.0%, with the highest figure, 15.1%, being recorded in 2012.
So far there are two rather obvious conclusions. The total number of crowd
incidents, especially those defined as ‘peaceful’, declined rapidly after the 2006
reorganisation, and probably, in large measure, because of it, and then it rose
steeply in 2010 as a consequence of the FIFA World Cup. Beyond that, one can
begin to describe a pattern, but it is necessary to analyse the data in different ways
in order to begin to hazard possible explanations.
0
2000
4000
6000
8000
10000
12000
1997 1998 1999 2000 2001 2002 2003 2004 2005 2006 2007 2008 2009 2010 2011 2012 2013
0
200
400
600
800
1000
1200
1400
1600
1800
2000
1997 1998 1999 2000 2001 2002 2003 2004 2005 2006 2007 2008 2009 2010 2011 2012 2013
25
3. Distribution of incidents by province
3.1 Overview
The IRIS database includes a provincial breakdown of incidents. Between 1997 and
2013 a total of 156,230 incidents are recorded for all provinces. Using the category
‘eventuality classification', IRIS personnel use one of two options, namely ‘crowd
(peaceful)’ and ‘crowd (unrest)’, to classify all incidents accordingly. Appendix 1
shows the provincial as well as annual distribution of all incidents recorded, showing
a distinction between peaceful and unrest incidents. An overwhelming majority (90%)
of these incidents are classified as ‘peaceful’, while only 10% of all incidents are
classified as ‘unrest’ incidents. This pattern is consistent (albeit with some variations)
for all provinces.
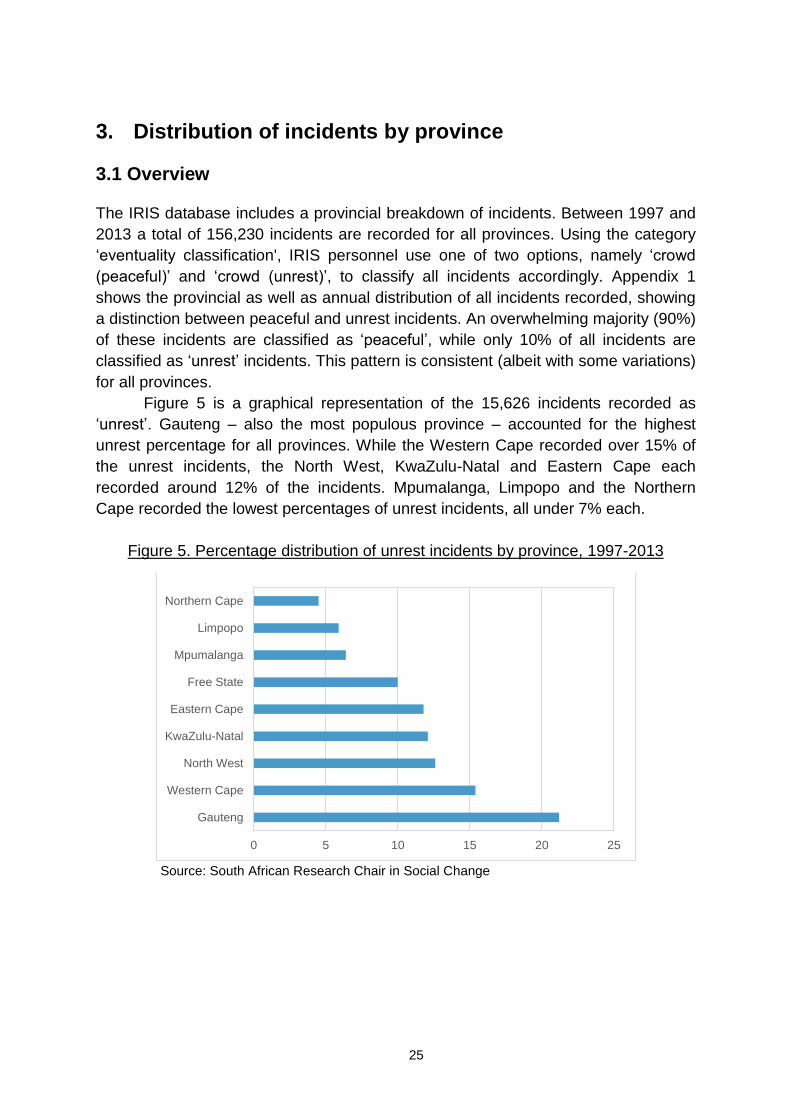
Figure 5 is a graphical representation of the 15,626 incidents recorded as
‘unrest’. Gauteng – also the most populous province – accounted for the highest
unrest percentage for all provinces. While the Western Cape recorded over 15% of
the unrest incidents, the North West, KwaZulu-Natal and Eastern Cape each
recorded around 12% of the incidents. Mpumalanga, Limpopo and the Northern
Cape recorded the lowest percentages of unrest incidents, all under 7% each.
Figure 5. Percentage distribution of unrest incidents by province, 1997-2013
Source: South African Research Chair in Social Change
0 5 10 15 20 25
Gauteng
Western Cape
North West
KwaZulu-Natal
Eastern Cape
Free State
Mpumalanga
Limpopo
Northern Cape
26
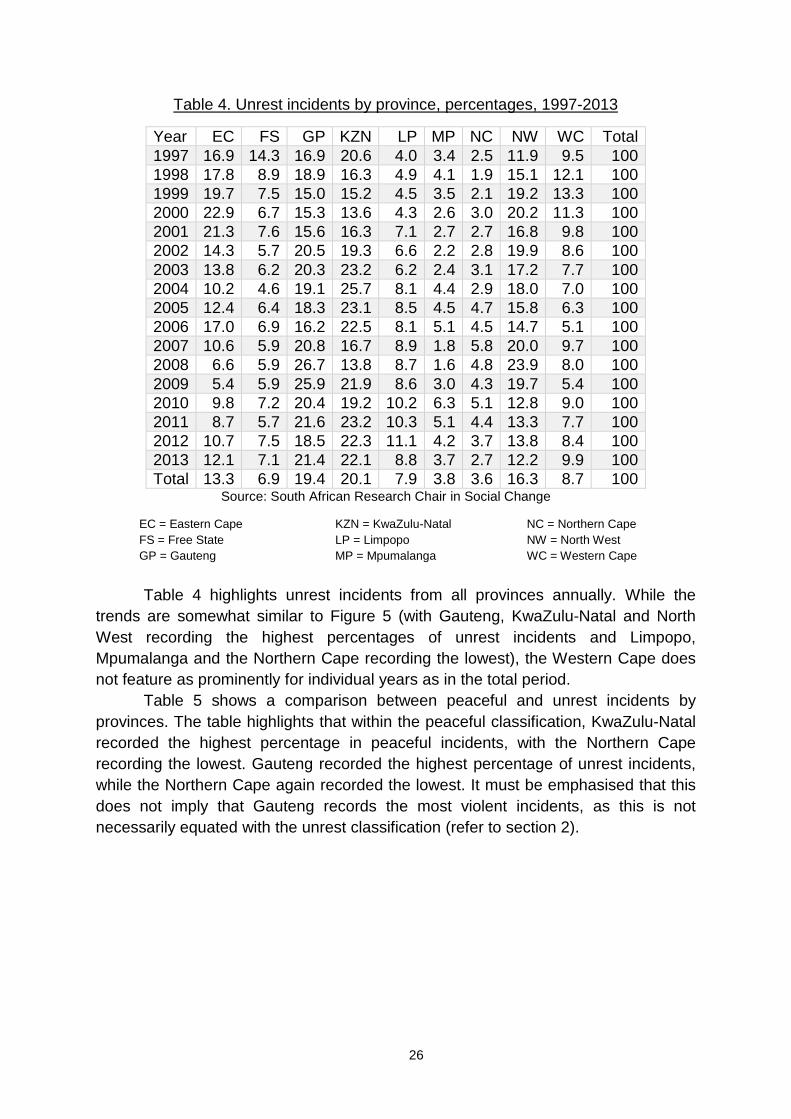
Table 4. Unrest incidents by province, percentages, 1997-2013
Year EC FS GP KZN LP MP NC NW WC Total
1997 16.9 14.3 16.9 20.6 4.0 3.4 2.5 11.9 9.5 100
1998 17.8 8.9 18.9 16.3 4.9 4.1 1.9 15.1 12.1 100
1999 19.7 7.5 15.0 15.2 4.5 3.5 2.1 19.2 13.3 100
2000 22.9 6.7 15.3 13.6 4.3 2.6 3.0 20.2 11.3 100
2001 21.3 7.6 15.6 16.3 7.1 2.7 2.7 16.8 9.8 100
2002 14.3 5.7 20.5 19.3 6.6 2.2 2.8 19.9 8.6 100
2003 13.8 6.2 20.3 23.2 6.2 2.4 3.1 17.2 7.7 100
2004 10.2 4.6 19.1 25.7 8.1 4.4 2.9 18.0 7.0 100
2005 12.4 6.4 18.3 23.1 8.5 4.5 4.7 15.8 6.3 100
2006 17.0 6.9 16.2 22.5 8.1 5.1 4.5 14.7 5.1 100
2007 10.6 5.9 20.8 16.7 8.9 1.8 5.8 20.0 9.7 100
2008 6.6 5.9 26.7 13.8 8.7 1.6 4.8 23.9 8.0 100
2009 5.4 5.9 25.9 21.9 8.6 3.0 4.3 19.7 5.4 100
2010 9.8 7.2 20.4 19.2 10.2 6.3 5.1 12.8 9.0 100
2011 8.7 5.7 21.6 23.2 10.3 5.1 4.4 13.3 7.7 100
2012 10.7 7.5 18.5 22.3 11.1 4.2 3.7 13.8 8.4 100
2013 12.1 7.1 21.4 22.1 8.8 3.7 2.7 12.2 9.9 100
Total 13.3 6.9 19.4 20.1 7.9 3.8 3.6 16.3 8.7 100 Source: South African Research Chair in Social Change
EC = Eastern Cape KZN = KwaZulu-Natal NC = Northern Cape
FS = Free State LP = Limpopo NW = North West
GP = Gauteng MP = Mpumalanga WC = Western Cape
Table 4 highlights unrest incidents from all provinces annually. While the
trends are somewhat similar to Figure 5 (with Gauteng, KwaZulu-Natal and North
West recording the highest percentages of unrest incidents and Limpopo,
Mpumalanga and the Northern Cape recording the lowest), the Western Cape does
not feature as prominently for individual years as in the total period.
Table 5 shows a comparison between peaceful and unrest incidents by
provinces. The table highlights that within the peaceful classification, KwaZulu-Natal
recorded the highest percentage in peaceful incidents, with the Northern Cape
recording the lowest. Gauteng recorded the highest percentage of unrest incidents,
while the Northern Cape again recorded the lowest. It must be emphasised that this
does not imply that Gauteng records the most violent incidents, as this is not
necessarily equated with the unrest classification (refer to section 2).

27
Table 5. Peaceful and unrest incidents, totals and percentages 1997-2013
Province Crowd (peaceful)
Crowd (unrest) Total crowd incidents
Eastern Cape 18,732 1,838 20,570 13.3% 11.8% 13.2% Free State 9,766 1,555 11,321 6.9% 10.0% 7.2% Gauteng 27,328 3,318 30,646 19.4% 21.2% 19.6% KwaZulu-Natal 28,213 1,895 30,108 20.1% 12.1% 19.3% Limpopo 11,041 917 11,958 7.9% 5.9% 7.7% Mpumalanga 5,319 1,005 6,324 3.8% 6.4% 4.0% Northern Cape 5,103 707 5,810 3.6% 4.5% 3.7% North West 22,911 1,979 24,890 16.3% 12.7% 15.9% Western Cape 12,191 2,412 146,03 8.7% 15.4% 9.3% Total 140,604 15,626 156,230
100% 100% 100%
Source: South African Research Chair in Social Change
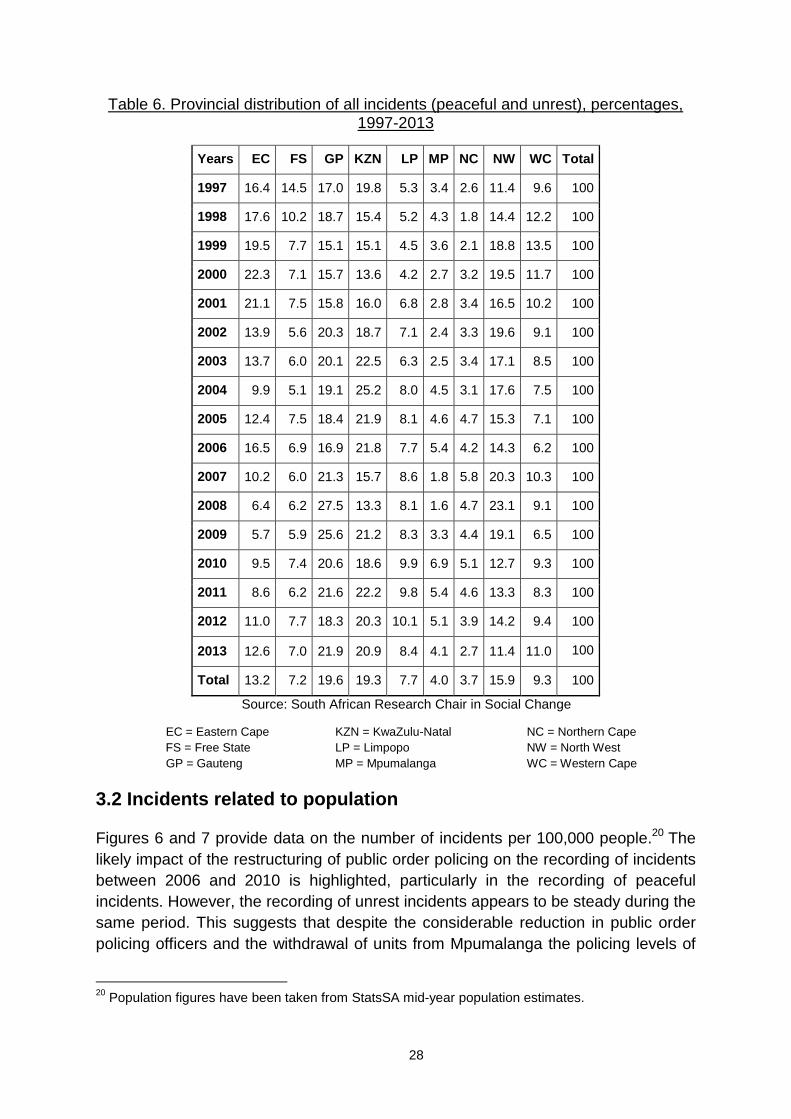
Table 6 shows that in 1997 almost 20% of all incidents recorded (the highest
percentage that year) were from the KwaZulu-Natal province. The trend did not
continue however, as Gauteng took over with 18.7% in 1998, followed by the
Eastern Cape with 19.5% in 1999. The North West province began to show some
prominence in 1999 and 2000, dwindling in 2001 and then increasing again in 2002,
accounting for over 19% of all incidents. KwaZulu-Natal dominated again from 2003-
2006, accounting for a quarter of all incidents in 2004. The years 2007-2011 saw
Gauteng dominating yet again, recording between 18.3% and 27.5% of all incidents.
While the North West and KwaZulu-Natal provinces continued to feature quite
prominently during the same period, there was a significant decrease in the number
of incidents recorded in the North West from 2010 onwards. The annual trends for
the Free State, Limpopo, Mpumalanga, Northern Cape and Western Cape has been
somewhat similar over the years, as they account for significantly lower incidents
than the Gauteng, KwaZulu-Natal and North West provinces. Also, while the Eastern
Cape was relatively dominant from 1997 to 2001, it dwindled significantly between
the years 2002 and 2013, with some uneven peaks in between.
28
Table 6. Provincial distribution of all incidents (peaceful and unrest), percentages, 1997-2013
Years EC FS GP KZN LP MP NC NW WC Total
1997 16.4 14.5 17.0 19.8 5.3 3.4 2.6 11.4 9.6 100
1998 17.6 10.2 18.7 15.4 5.2 4.3 1.8 14.4 12.2 100
1999 19.5 7.7 15.1 15.1 4.5 3.6 2.1 18.8 13.5 100
2000 22.3 7.1 15.7 13.6 4.2 2.7 3.2 19.5 11.7 100
2001 21.1 7.5 15.8 16.0 6.8 2.8 3.4 16.5 10.2 100
2002 13.9 5.6 20.3 18.7 7.1 2.4 3.3 19.6 9.1 100
2003 13.7 6.0 20.1 22.5 6.3 2.5 3.4 17.1 8.5 100
2004 9.9 5.1 19.1 25.2 8.0 4.5 3.1 17.6 7.5 100
2005 12.4 7.5 18.4 21.9 8.1 4.6 4.7 15.3 7.1 100
2006 16.5 6.9 16.9 21.8 7.7 5.4 4.2 14.3 6.2 100
2007 10.2 6.0 21.3 15.7 8.6 1.8 5.8 20.3 10.3 100
2008 6.4 6.2 27.5 13.3 8.1 1.6 4.7 23.1 9.1 100
2009 5.7 5.9 25.6 21.2 8.3 3.3 4.4 19.1 6.5 100
2010 9.5 7.4 20.6 18.6 9.9 6.9 5.1 12.7 9.3 100
2011 8.6 6.2 21.6 22.2 9.8 5.4 4.6 13.3 8.3 100
2012 11.0 7.7 18.3 20.3 10.1 5.1 3.9 14.2 9.4 100
2013 12.6 7.0 21.9 20.9 8.4 4.1 2.7 11.4 11.0 100
Total 13.2 7.2 19.6 19.3 7.7 4.0 3.7 15.9 9.3 100
Source: South African Research Chair in Social Change
EC = Eastern Cape KZN = KwaZulu-Natal NC = Northern Cape
FS = Free State LP = Limpopo NW = North West
GP = Gauteng MP = Mpumalanga WC = Western Cape
3.2 Incidents related to population
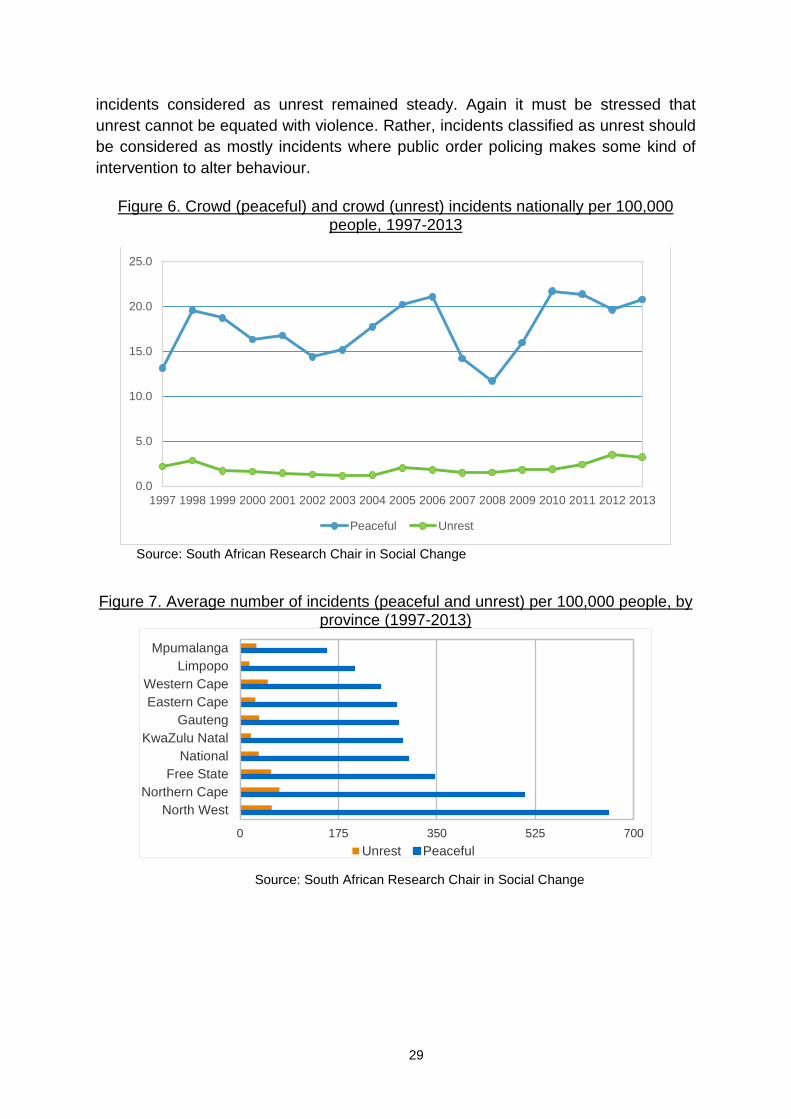
Figures 6 and 7 provide data on the number of incidents per 100,000 people.20 The
likely impact of the restructuring of public order policing on the recording of incidents
between 2006 and 2010 is highlighted, particularly in the recording of peaceful
incidents. However, the recording of unrest incidents appears to be steady during the
same period. This suggests that despite the considerable reduction in public order
policing officers and the withdrawal of units from Mpumalanga the policing levels of
20
Population figures have been taken from StatsSA mid-year population estimates.
29
incidents considered as unrest remained steady. Again it must be stressed that
unrest cannot be equated with violence. Rather, incidents classified as unrest should
be considered as mostly incidents where public order policing makes some kind of
intervention to alter behaviour.
Figure 6. Crowd (peaceful) and crowd (unrest) incidents nationally per 100,000 people, 1997-2013
Source: South African Research Chair in Social Change
Figure 7. Average number of incidents (peaceful and unrest) per 100,000 people, by province (1997-2013)
Source: South African Research Chair in Social Change
0.0
5.0
10.0
15.0
20.0
25.0
1997 1998 1999 2000 2001 2002 2003 2004 2005 2006 2007 2008 2009 2010 2011 2012 2013
Peaceful Unrest
0 175 350 525 700
Mpumalanga
Limpopo
Western Cape
Eastern Cape
Gauteng
KwaZulu Natal
National
Free State
Northern Cape
North West
Unrest Peaceful
30
Figure 8. Peaceful incidents per 100,000 people, nationally and selected provinces (1997-2013)
Source: South African Research Chair in Social Change
Figure 9. Unrest incidents per 100,000 people, nationally and selected provinces (1997-2013)
Source: South African Research Chair in Social Change
0.0
5.0
10.0
15.0
20.0
25.0
30.0
35.0
40.0
45.0
50.0
1997 1998 1999 2000 2001 2002 2003 2004 2005 2006 2007 2008 2009 2010 2011 2012 2013
North West National Limpopo
0.0
1.0
2.0
3.0
4.0
5.0
6.0
7.0
8.0
9.0
10.0
1997 1998 1999 2000 2001 2002 2003 2004 2005 2006 2007 2008 2009 2010 2011 2012 2013
National North West Limpopo
31
Appendix 2 provides tables which give a provincial analysis of incidents per
100,000 people. What becomes clear from this analysis is that North West has a
significantly higher number of incidents per 100,000 than any other province. Figures
8 and 9 analyse the number of incidents per 100,000 people by peaceful and unrest.
As Figure 8 shows, North West has a considerably higher number of peaceful
incidents per 100,000 people compared to the national averages and provinces
which register the highest number of incidents, Gauteng and the Western Cape.
Figure 9 demonstrates that while the number of unrest incidents per 100,000 people
for North West was relatively consistent with national averages between 1997 and
2006, there was a significant increase in the number of unrest incidents per 100,000
people from 2006 onwards. We believe that these figures might be explained partly
by population growth, which was particularly rapid in North West, and by the related
expansion in informal settlements in the province. The 2011 census revealed that
North West had the highest percentage of people living in informal housing: 21.2%
compared to a national average of 13.6% (StatsSA, 2012: 26). Marikana is located in
North West, and there is a spike in 2012, the year of the massacre, but there was
growing discontent prior to the killings.
32
4. Motives
4.1 Understanding and defining motives assigned by the SAPS
Incident recording personnel for the SAPS assign motives to incidents from a
dropdown menu of options. Between 1997 and 2008 there were 60 options to
choose from and from 2009 onwards there were 72.21 An incident may be recorded
with more than one motive, and this was the case in 10,997 incidents where multiple
motives for the same incident were recorded. Therefore the number of motives
analysed is greater than the number of incidents. Until 2013 it was not compulsory
for incident recording personnel to assign a motive to an incident. Indeed, 56,743
(33.9%) of all the incidents recorded have been assigned the category ‘no motive
registered’. The implications of this for analysis shall be discussed in subsequent
sections of this report.
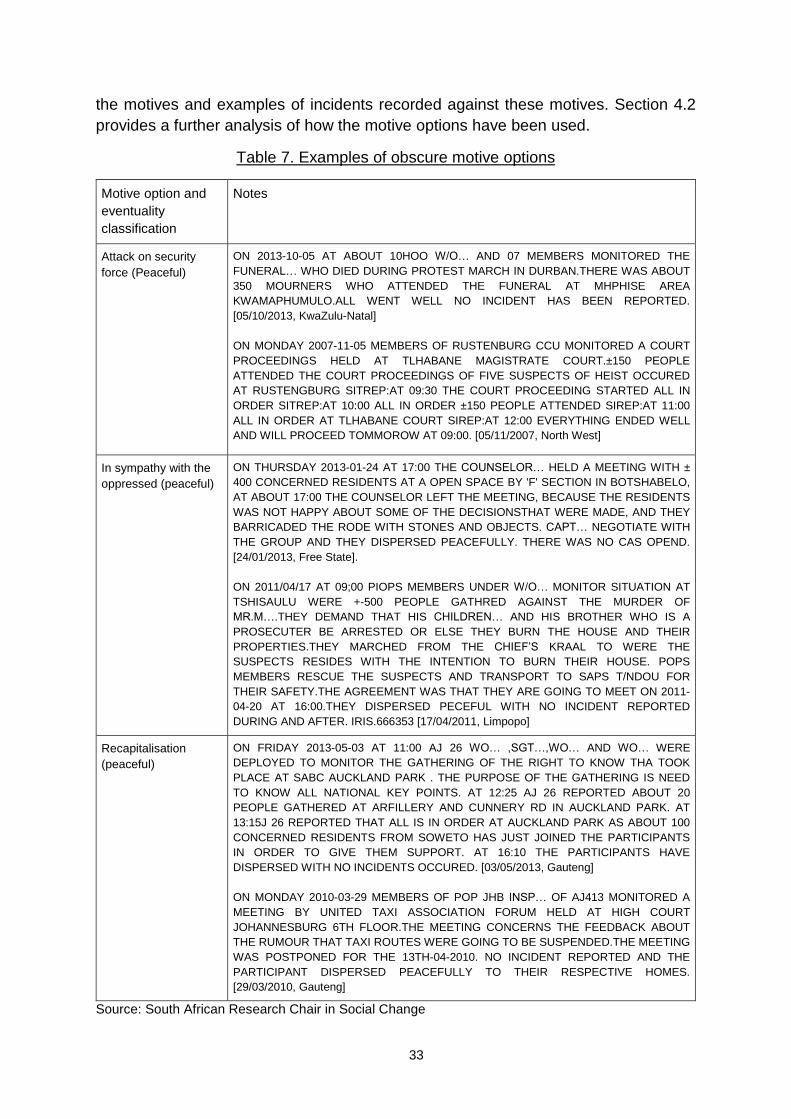
Unfortunately, in response to our PAIA request the SAPS did not provide any
information as to whether motive options have definitions, which would aid incident
recording personnel in selecting motive options. Our initial analysis of the notes
accompanying each incident quickly revealed that the way in which motive options
have been assigned to incidents was not self-evident. For instance the motive ‘attack
on security force’ would lead to the assumption that a member of the security forces
had been attacked during the incident, but the notes demonstrate that not all of the
incidents are consistent with this type of action (see Table 7 for examples).
Furthermore, some of the names of the motive options, such as ‘solidarity’, ‘in
sympathy with the oppressed’ and ‘recapitalisation’ are ambiguous in their meaning
and a reading of notes failed to reveal a consistent method according to which these
motive options had been applied (see Table 7 for examples as well as Appendix 4).
While some of these motive options are used infrequently, ‘attack on security’ is
used for only 0.5% of incidents recorded, and others such as ‘solidarity’ or ‘in
sympathy with the oppressed’ are used for 4.3% and 1.5% of incidents respectively,
making them amongst the most frequently recorded motives.
In the absence of definitions supplied by the SAPS as to the intended
meaning of the motive options and the ambiguity of some of the motive option
names, it has been necessary to provide approximate definitions for the motive
options based upon a selected reading of the notes associated with each motive
option. This also involved translating notes from Afrikaans into English to ensure
there was consistency between how motives were being selected by Afrikaans- and
English-medium incident recording personnel.
Due to the scale of the data, definitions have been provided only for the 28
motives that were selected more than 1% of the time, as these are the motives most
consistently recorded by the SAPS. Appendix 4 provides approximate definitions for
21
See Appendix 3.
33
the motives and examples of incidents recorded against these motives. Section 4.2
provides a further analysis of how the motive options have been used.
Table 7. Examples of obscure motive options
Motive option and
eventuality
classification
Notes
Attack on security
force (Peaceful) ON 2013-10-05 AT ABOUT 10HOO W/O… AND 07 MEMBERS MONITORED THE
FUNERAL… WHO DIED DURING PROTEST MARCH IN DURBAN.THERE WAS ABOUT
350 MOURNERS WHO ATTENDED THE FUNERAL AT MHPHISE AREA
KWAMAPHUMULO.ALL WENT WELL NO INCIDENT HAS BEEN REPORTED.
[05/10/2013, KwaZulu-Natal]
ON MONDAY 2007-11-05 MEMBERS OF RUSTENBURG CCU MONITORED A COURT
PROCEEDINGS HELD AT TLHABANE MAGISTRATE COURT.±150 PEOPLE
ATTENDED THE COURT PROCEEDINGS OF FIVE SUSPECTS OF HEIST OCCURED
AT RUSTENGBURG SITREP:AT 09:30 THE COURT PROCEEDING STARTED ALL IN
ORDER SITREP:AT 10:00 ALL IN ORDER ±150 PEOPLE ATTENDED SIREP:AT 11:00
ALL IN ORDER AT TLHABANE COURT SIREP:AT 12:00 EVERYTHING ENDED WELL
AND WILL PROCEED TOMMOROW AT 09:00. [05/11/2007, North West]
In sympathy with the
oppressed (peaceful) ON THURSDAY 2013-01-24 AT 17:00 THE COUNSELOR… HELD A MEETING WITH ±
400 CONCERNED RESIDENTS AT A OPEN SPACE BY 'F' SECTION IN BOTSHABELO,
AT ABOUT 17:00 THE COUNSELOR LEFT THE MEETING, BECAUSE THE RESIDENTS
WAS NOT HAPPY ABOUT SOME OF THE DECISIONSTHAT WERE MADE, AND THEY
BARRICADED THE RODE WITH STONES AND OBJECTS. CAPT… NEGOTIATE WITH
THE GROUP AND THEY DISPERSED PEACEFULLY. THERE WAS NO CAS OPEND.
[24/01/2013, Free State].
ON 2011/04/17 AT 09;00 PIOPS MEMBERS UNDER W/O… MONITOR SITUATION AT
TSHISAULU WERE +-500 PEOPLE GATHRED AGAINST THE MURDER OF
MR.M….THEY DEMAND THAT HIS CHILDREN… AND HIS BROTHER WHO IS A
PROSECUTER BE ARRESTED OR ELSE THEY BURN THE HOUSE AND THEIR
PROPERTIES.THEY MARCHED FROM THE CHIEF’S KRAAL TO WERE THE
SUSPECTS RESIDES WITH THE INTENTION TO BURN THEIR HOUSE. POPS
MEMBERS RESCUE THE SUSPECTS AND TRANSPORT TO SAPS T/NDOU FOR
THEIR SAFETY.THE AGREEMENT WAS THAT THEY ARE GOING TO MEET ON 2011-
04-20 AT 16:00.THEY DISPERSED PECEFUL WITH NO INCIDENT REPORTED
DURING AND AFTER. IRIS.666353 [17/04/2011, Limpopo]
Recapitalisation
(peaceful) ON FRIDAY 2013-05-03 AT 11:00 AJ 26 WO… ,SGT…,WO… AND WO… WERE
DEPLOYED TO MONITOR THE GATHERING OF THE RIGHT TO KNOW THA TOOK
PLACE AT SABC AUCKLAND PARK . THE PURPOSE OF THE GATHERING IS NEED
TO KNOW ALL NATIONAL KEY POINTS. AT 12:25 AJ 26 REPORTED ABOUT 20
PEOPLE GATHERED AT ARFILLERY AND CUNNERY RD IN AUCKLAND PARK. AT
13:15J 26 REPORTED THAT ALL IS IN ORDER AT AUCKLAND PARK AS ABOUT 100
CONCERNED RESIDENTS FROM SOWETO HAS JUST JOINED THE PARTICIPANTS
IN ORDER TO GIVE THEM SUPPORT. AT 16:10 THE PARTICIPANTS HAVE
DISPERSED WITH NO INCIDENTS OCCURED. [03/05/2013, Gauteng]
ON MONDAY 2010-03-29 MEMBERS OF POP JHB INSP… OF AJ413 MONITORED A
MEETING BY UNITED TAXI ASSOCIATION FORUM HELD AT HIGH COURT
JOHANNESBURG 6TH FLOOR.THE MEETING CONCERNS THE FEEDBACK ABOUT
THE RUMOUR THAT TAXI ROUTES WERE GOING TO BE SUSPENDED.THE MEETING
WAS POSTPONED FOR THE 13TH-04-2010. NO INCIDENT REPORTED AND THE
PARTICIPANT DISPERSED PEACEFULLY TO THEIR RESPECTIVE HOMES.
[29/03/2010, Gauteng]
Source: South African Research Chair in Social Change
34
4.2 Analysing incident motives
4.2.1 Introduction
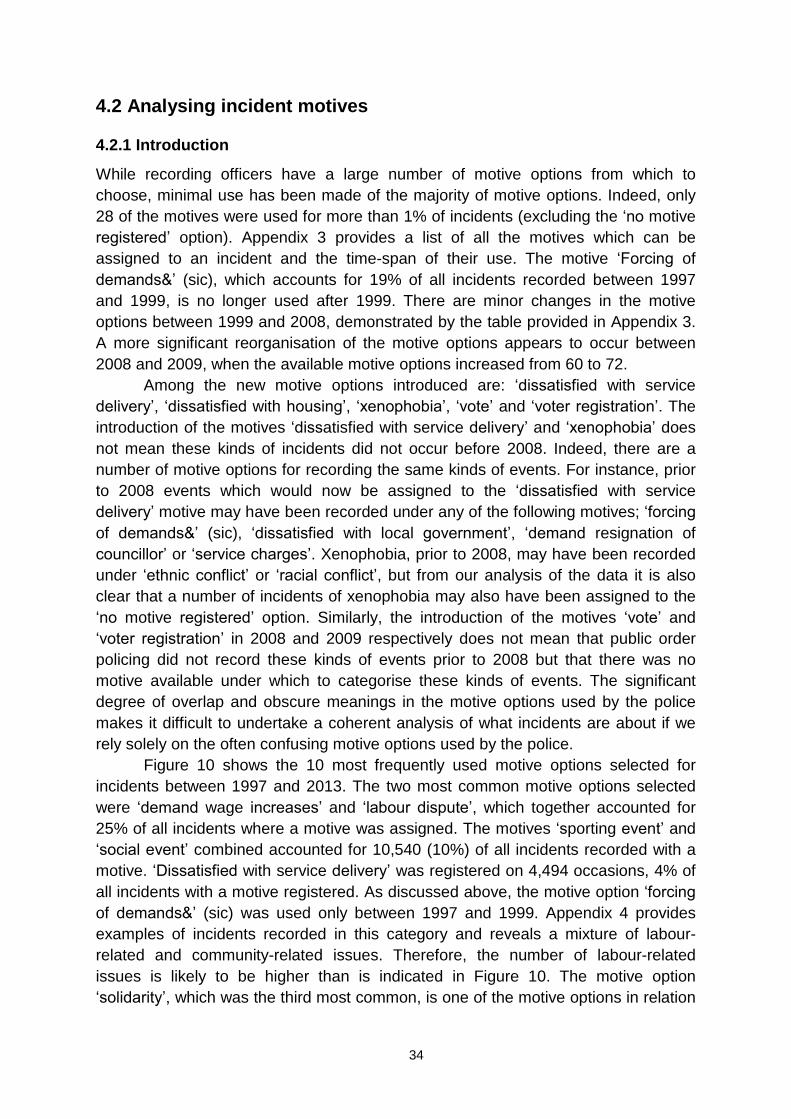
While recording officers have a large number of motive options from which to
choose, minimal use has been made of the majority of motive options. Indeed, only
28 of the motives were used for more than 1% of incidents (excluding the ‘no motive
registered’ option). Appendix 3 provides a list of all the motives which can be
assigned to an incident and the time-span of their use. The motive ‘Forcing of
demands&’ (sic), which accounts for 19% of all incidents recorded between 1997
and 1999, is no longer used after 1999. There are minor changes in the motive
options between 1999 and 2008, demonstrated by the table provided in Appendix 3.
A more significant reorganisation of the motive options appears to occur between
2008 and 2009, when the available motive options increased from 60 to 72.
Among the new motive options introduced are: ‘dissatisfied with service
delivery’, ‘dissatisfied with housing’, ‘xenophobia’, ‘vote’ and ‘voter registration’. The
introduction of the motives ‘dissatisfied with service delivery’ and ‘xenophobia’ does
not mean these kinds of incidents did not occur before 2008. Indeed, there are a
number of motive options for recording the same kinds of events. For instance, prior
to 2008 events which would now be assigned to the ‘dissatisfied with service
delivery’ motive may have been recorded under any of the following motives; ‘forcing
of demands&’ (sic), ‘dissatisfied with local government’, ‘demand resignation of
councillor’ or ‘service charges’. Xenophobia, prior to 2008, may have been recorded
under ‘ethnic conflict’ or ‘racial conflict’, but from our analysis of the data it is also
clear that a number of incidents of xenophobia may also have been assigned to the
‘no motive registered’ option. Similarly, the introduction of the motives ‘vote’ and
‘voter registration’ in 2008 and 2009 respectively does not mean that public order
policing did not record these kinds of events prior to 2008 but that there was no
motive available under which to categorise these kinds of events. The significant
degree of overlap and obscure meanings in the motive options used by the police
makes it difficult to undertake a coherent analysis of what incidents are about if we
rely solely on the often confusing motive options used by the police.
Figure 10 shows the 10 most frequently used motive options selected for
incidents between 1997 and 2013. The two most common motive options selected
were ‘demand wage increases’ and ‘labour dispute’, which together accounted for
25% of all incidents where a motive was assigned. The motives ‘sporting event’ and
‘social event’ combined accounted for 10,540 (10%) of all incidents recorded with a
motive. ‘Dissatisfied with service delivery’ was registered on 4,494 occasions, 4% of
all incidents with a motive registered. As discussed above, the motive option ‘forcing
of demands&’ (sic) was used only between 1997 and 1999. Appendix 4 provides
examples of incidents recorded in this category and reveals a mixture of labour-
related and community-related issues. Therefore, the number of labour-related
issues is likely to be higher than is indicated in Figure 10. The motive option
‘solidarity’, which was the third most common, is one of the motive options in relation

35
to which we were unable to discern a consistent definition. As a result, the motive
option ‘solidarity’ formed part of a sample which is discussed in further detail in
section 4.3.1. As the table in Appendix 6 shows, 30% of the events classified as
‘peaceful’ and assigned to the ‘solidarity’ motive option were coded as recreational,
religious or cultural events and 32% were coded as official or party political events.
This means that it is likely that the number of sporting events, which would have
been coded as recreational events in the sample, is likely to be higher than the totals
displayed in Figure 10.
Figure 10. Most commonly assigned motive options, 1997-2013
Source: South African Research Chair in Social Change
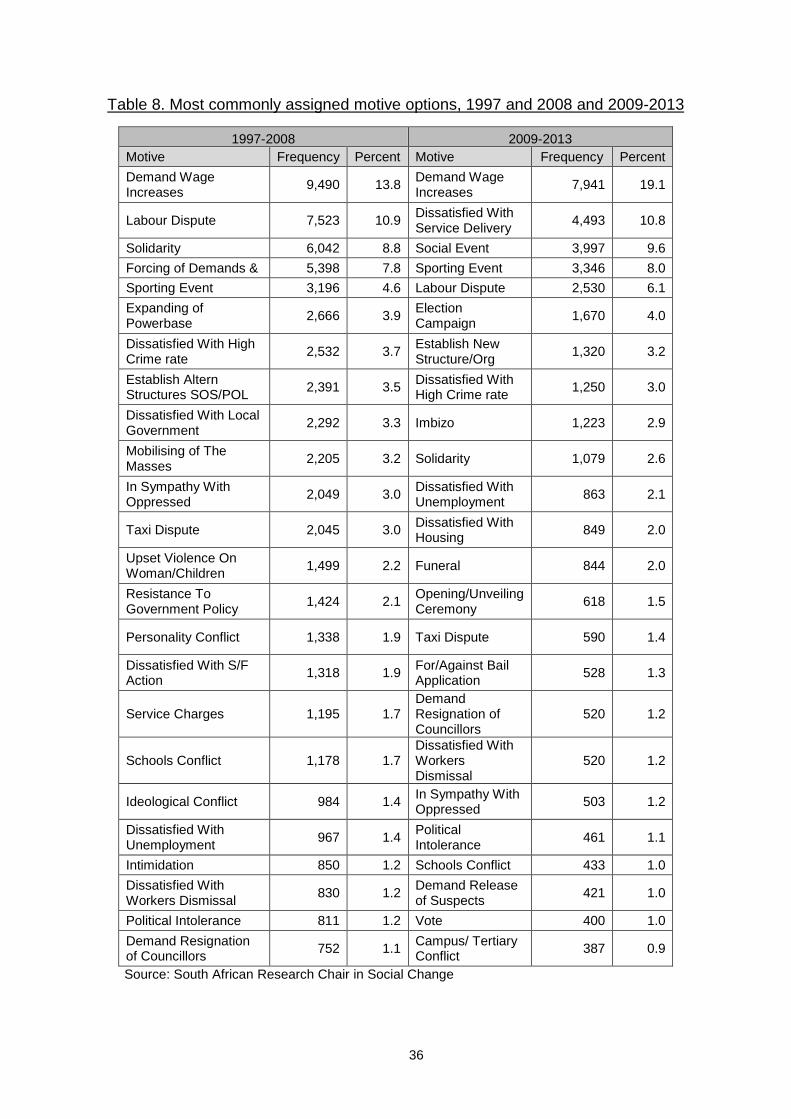
Table 8 provides the frequency and percentage use for all motive options
used for more than 1% of incidents between 1997 and 2008 and 2009 and 2013
once the ‘no motive registered’ option is excluded from the analysis. Consistent with
the results provided in Figure 10, between 1997 and 2008 the two most frequent
motives assigned to an incident are ‘demand wage increases’ and ‘labour dispute’
(14% and 11% respectively). Recreational events also feature prominently: 3,196
(4.6%) incidents were recorded as sporting events.
By analysing the data in two different time periods, which reflects the
reorganisation of the motive options discussed above, changes in the most
commonly selected motive options can be observed that are not reflected in Figure
10. Between 2009 and 2013 the motive ‘demand wage increases’ is still the most
frequently used motive, accounting for 19.1% of incidents recorded with a motive
from 2009 onwards. Table 8 also shows the number of recreational events public
order police record, with 17.6% of all of the incidents recorded with a motive in this
period relating to ‘sporting event’ or ‘social event’. A large proportion of this can be
explained by the use of public order police during the FIFA World Cup.
0
2000
4000
6000
8000
10000
12000
14000
16000
18000
20000
36
Table 8. Most commonly assigned motive options, 1997 and 2008 and 2009-2013
1997-2008 2009-2013
Motive Frequency Percent Motive Frequency Percent
Demand Wage Increases
9,490 13.8 Demand Wage Increases
7,941 19.1
Labour Dispute 7,523 10.9 Dissatisfied With Service Delivery
4,493 10.8
Solidarity 6,042 8.8 Social Event 3,997 9.6
Forcing of Demands & 5,398 7.8 Sporting Event 3,346 8.0
Sporting Event 3,196 4.6 Labour Dispute 2,530 6.1
Expanding of Powerbase
2,666 3.9 Election Campaign
1,670 4.0
Dissatisfied With High Crime rate
2,532 3.7 Establish New Structure/Org
1,320 3.2
Establish Altern Structures SOS/POL
2,391 3.5 Dissatisfied With High Crime rate
1,250 3.0
Dissatisfied With Local Government
2,292 3.3 Imbizo 1,223 2.9
Mobilising of The Masses
2,205 3.2 Solidarity 1,079 2.6
In Sympathy With Oppressed
2,049 3.0 Dissatisfied With Unemployment
863 2.1
Taxi Dispute 2,045 3.0 Dissatisfied With Housing
849 2.0
Upset Violence On Woman/Children
1,499 2.2 Funeral 844 2.0
Resistance To Government Policy
1,424 2.1 Opening/Unveiling Ceremony
618 1.5
Personality Conflict 1,338 1.9 Taxi Dispute 590 1.4
Dissatisfied With S/F Action
1,318 1.9 For/Against Bail Application
528 1.3
Service Charges 1,195 1.7 Demand Resignation of Councillors
520 1.2
Schools Conflict 1,178 1.7 Dissatisfied With Workers Dismissal
520 1.2
Ideological Conflict 984 1.4 In Sympathy With Oppressed
503 1.2
Dissatisfied With Unemployment
967 1.4 Political Intolerance
461 1.1
Intimidation 850 1.2 Schools Conflict 433 1.0
Dissatisfied With Workers Dismissal
830 1.2 Demand Release of Suspects
421 1.0
Political Intolerance 811 1.2 Vote 400 1.0
Demand Resignation of Councillors
752 1.1 Campus/ Tertiary Conflict
387 0.9
Source: South African Research Chair in Social Change
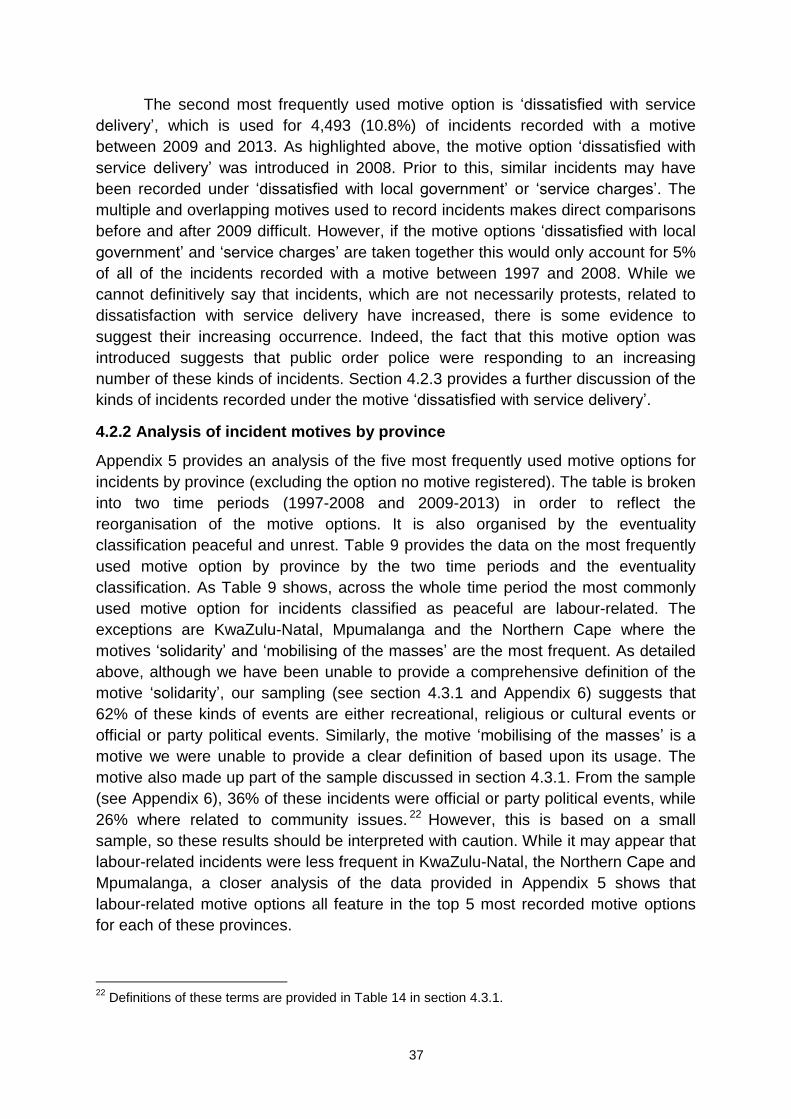
37
The second most frequently used motive option is ‘dissatisfied with service
delivery’, which is used for 4,493 (10.8%) of incidents recorded with a motive
between 2009 and 2013. As highlighted above, the motive option ‘dissatisfied with
service delivery’ was introduced in 2008. Prior to this, similar incidents may have
been recorded under ‘dissatisfied with local government’ or ‘service charges’. The
multiple and overlapping motives used to record incidents makes direct comparisons
before and after 2009 difficult. However, if the motive options ‘dissatisfied with local
government’ and ‘service charges’ are taken together this would only account for 5%
of all of the incidents recorded with a motive between 1997 and 2008. While we
cannot definitively say that incidents, which are not necessarily protests, related to
dissatisfaction with service delivery have increased, there is some evidence to
suggest their increasing occurrence. Indeed, the fact that this motive option was
introduced suggests that public order police were responding to an increasing
number of these kinds of incidents. Section 4.2.3 provides a further discussion of the
kinds of incidents recorded under the motive ‘dissatisfied with service delivery’.
4.2.2 Analysis of incident motives by province
Appendix 5 provides an analysis of the five most frequently used motive options for
incidents by province (excluding the option no motive registered). The table is broken
into two time periods (1997-2008 and 2009-2013) in order to reflect the
reorganisation of the motive options. It is also organised by the eventuality
classification peaceful and unrest. Table 9 provides the data on the most frequently
used motive option by province by the two time periods and the eventuality
classification. As Table 9 shows, across the whole time period the most commonly
used motive option for incidents classified as peaceful are labour-related. The
exceptions are KwaZulu-Natal, Mpumalanga and the Northern Cape where the
motives ‘solidarity’ and ‘mobilising of the masses’ are the most frequent. As detailed
above, although we have been unable to provide a comprehensive definition of the
motive ‘solidarity’, our sampling (see section 4.3.1 and Appendix 6) suggests that
62% of these kinds of events are either recreational, religious or cultural events or
official or party political events. Similarly, the motive ‘mobilising of the masses’ is a
motive we were unable to provide a clear definition of based upon its usage. The
motive also made up part of the sample discussed in section 4.3.1. From the sample
(see Appendix 6), 36% of these incidents were official or party political events, while
26% where related to community issues. 22 However, this is based on a small
sample, so these results should be interpreted with caution. While it may appear that
labour-related incidents were less frequent in KwaZulu-Natal, the Northern Cape and
Mpumalanga, a closer analysis of the data provided in Appendix 5 shows that
labour-related motive options all feature in the top 5 most recorded motive options
for each of these provinces.
22
Definitions of these terms are provided in Table 14 in section 4.3.1.
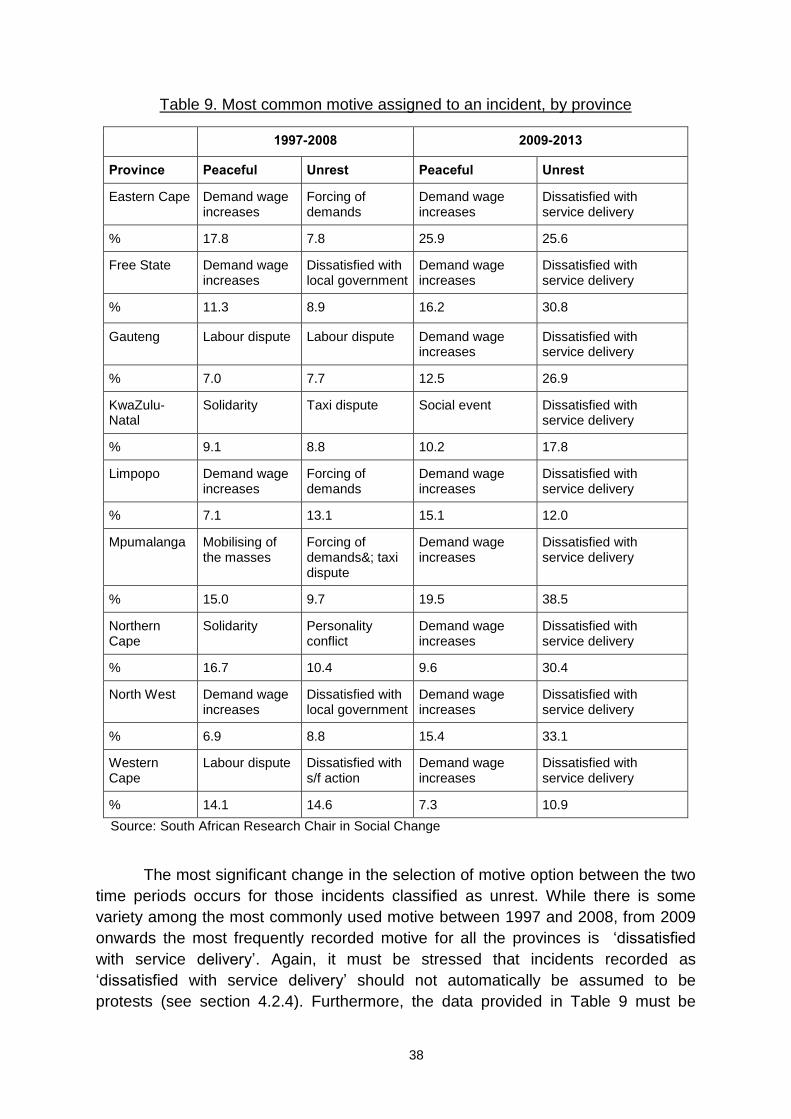
38
Table 9. Most common motive assigned to an incident, by province
1997-2008 2009-2013
Province Peaceful Unrest Peaceful Unrest
Eastern Cape Demand wage increases
Forcing of demands
Demand wage increases
Dissatisfied with service delivery
% 17.8 7.8 25.9 25.6
Free State Demand wage increases
Dissatisfied with local government
Demand wage increases
Dissatisfied with service delivery
% 11.3 8.9 16.2 30.8
Gauteng Labour dispute Labour dispute Demand wage increases
Dissatisfied with service delivery
% 7.0 7.7 12.5 26.9
KwaZulu- Natal
Solidarity Taxi dispute Social event Dissatisfied with service delivery
% 9.1 8.8 10.2 17.8
Limpopo Demand wage increases
Forcing of demands
Demand wage increases
Dissatisfied with service delivery
% 7.1 13.1 15.1 12.0
Mpumalanga Mobilising of the masses
Forcing of demands&; taxi dispute
Demand wage increases
Dissatisfied with service delivery
% 15.0 9.7 19.5 38.5
Northern Cape
Solidarity Personality conflict
Demand wage increases
Dissatisfied with service delivery
% 16.7 10.4 9.6 30.4
North West Demand wage increases
Dissatisfied with local government
Demand wage increases
Dissatisfied with service delivery
% 6.9 8.8 15.4 33.1
Western Cape
Labour dispute Dissatisfied with s/f action
Demand wage increases
Dissatisfied with service delivery
% 14.1 14.6 7.3 10.9
Source: South African Research Chair in Social Change
The most significant change in the selection of motive option between the two
time periods occurs for those incidents classified as unrest. While there is some
variety among the most commonly used motive between 1997 and 2008, from 2009
onwards the most frequently recorded motive for all the provinces is ‘dissatisfied
with service delivery’. Again, it must be stressed that incidents recorded as
‘dissatisfied with service delivery’ should not automatically be assumed to be
protests (see section 4.2.4). Furthermore, the data provided in Table 9 must be
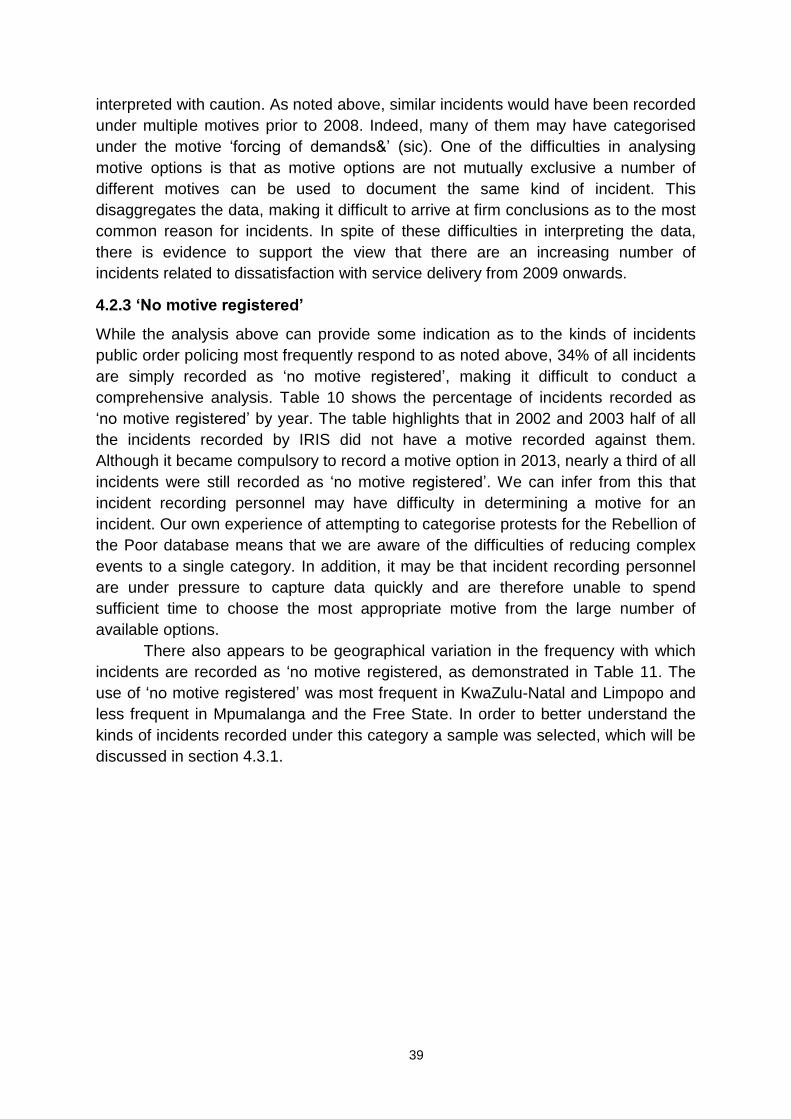
39
interpreted with caution. As noted above, similar incidents would have been recorded
under multiple motives prior to 2008. Indeed, many of them may have categorised
under the motive ‘forcing of demands&’ (sic). One of the difficulties in analysing
motive options is that as motive options are not mutually exclusive a number of
different motives can be used to document the same kind of incident. This
disaggregates the data, making it difficult to arrive at firm conclusions as to the most
common reason for incidents. In spite of these difficulties in interpreting the data,
there is evidence to support the view that there are an increasing number of
incidents related to dissatisfaction with service delivery from 2009 onwards.
4.2.3 ‘No motive registered’
While the analysis above can provide some indication as to the kinds of incidents
public order policing most frequently respond to as noted above, 34% of all incidents
are simply recorded as ‘no motive registered’, making it difficult to conduct a
comprehensive analysis. Table 10 shows the percentage of incidents recorded as
‘no motive registered’ by year. The table highlights that in 2002 and 2003 half of all
the incidents recorded by IRIS did not have a motive recorded against them.
Although it became compulsory to record a motive option in 2013, nearly a third of all
incidents were still recorded as ‘no motive registered’. We can infer from this that
incident recording personnel may have difficulty in determining a motive for an
incident. Our own experience of attempting to categorise protests for the Rebellion of
the Poor database means that we are aware of the difficulties of reducing complex
events to a single category. In addition, it may be that incident recording personnel
are under pressure to capture data quickly and are therefore unable to spend
sufficient time to choose the most appropriate motive from the large number of
available options.
There also appears to be geographical variation in the frequency with which
incidents are recorded as ‘no motive registered, as demonstrated in Table 11. The
use of ‘no motive registered’ was most frequent in KwaZulu-Natal and Limpopo and
less frequent in Mpumalanga and the Free State. In order to better understand the
kinds of incidents recorded under this category a sample was selected, which will be
discussed in section 4.3.1.

40
Table 10. Percentage of incidents recorded as 'no motive registered', 1997-2013
Source: South African Research Chair in Social Change
Table 11. Percentage of incidents recorded as 'no motive registered', 1997-2013, by
province
Province % of incidents recorded as no motive registered
Eastern Cape 31
Free State 20
Gauteng 35
KwaZulu-Natal 40
Limpopo 41
Mpumalanga 15
Northern Cape 25
North West 38
Western Cape 36
Source: South African Research Chair in Social Change
4.2.4 ‘Dissatisfied with service delivery’
In previous analyses of IRIS data (see Saba and Van der Merwe 2013, Duncan
2014: 125) the motive ‘dissatisfied with service delivery’ was conflated with the

41
numbers of service delivery protests. In light of the way in which the SAPS has
previously released information and the complexity and confusion that has
surrounded the interpretation of IRIS data, as discussed in section 1.4, this is
perhaps understandable. However, from our analysis it is clear that while a large
proportion of incidents registered under the ‘dissatisfied with service delivery’ motive
will be protests, not all incidents will either be protests or protests associated with
what is commonly referred to as a ‘service delivery protest’. Furthermore, as
discussed above, there are multiple motives under which what are understood as
‘service delivery protests’ can be recorded, so it would be inaccurate to use the
figures from one motive alone to provide an analysis of service delivery protests.
While the main focus of this report is on incidents and not protests, which will be the
subject of a subsequent report, the prominence of this motive means that an analysis
of its use is required.
As is shown in Table 12, example 1 is an official event or imbizo to discuss
service delivery, which has been recorded under the motive ‘dissatisfied with service
delivery’. Such incidents are clearly not protests. Example 2 relates to the monitoring
of a crowd outside a court, which does not seem to have a direct link to a service
delivery protest or with a grievance around service delivery. It is of course possible
that this incident has been recorded in error; however, as discussed in section 1.5,
errors made in the capturing of incidents at unit level should, theoretically, be
identified by central IRIS staff and amended. Example 3 demonstrates that, as
discussed in section 2.1, marches that take place which have not followed the
procedures set out in the Regulation of Gatherings Act (1993) are not classified as
unrest unless the police make an intervention. In example 3 the police do not
intervene and therefore the incident is classified as peaceful. The final example,
example 4, a march by the Deaf Federation of Mpumalanga, demonstrates that the
police do not apply a narrow definition of what constitutes ‘dissatisfaction with
service delivery’. Therefore the kinds of concerns raised around unemployment are
considered by public order policing to be a service-delivery-related issue.
From our provisional analysis of unrest incidents registered as ‘dissatisfied
with service delivery’ it is clear that a much higher proportion of these incidents are
likely to be protests. However, as was argued in section 2.2, the classification as
‘unrest’ should not be conflated with an understanding of these incidents as violent.
Example 1 in Table 13, where police monitored a planned electricity disconnection,
highlights what the research team have observed elsewhere in the data, which is the
frequency with which public order police are involved in the monitoring of electricity
disconnections and evictions. From the notes provided by this example, although a
crowd gathered there is no definitive evidence of a protest, such as an attempt to
barricade the road. While the disconnection had to be halted, perhaps due to
resistance by the community, this is not stated clearly in the notes. In fact the only
reference made to the behaviour of the crowd is that the ‘crowd dispersed at 12.00
quietly’. From the notes, there is no clear evidence that the crowd acted in a
disruptive or violent manner; indeed, the notes give the impression that there was
little disruption other than the halting of the disconnection for reasons which are
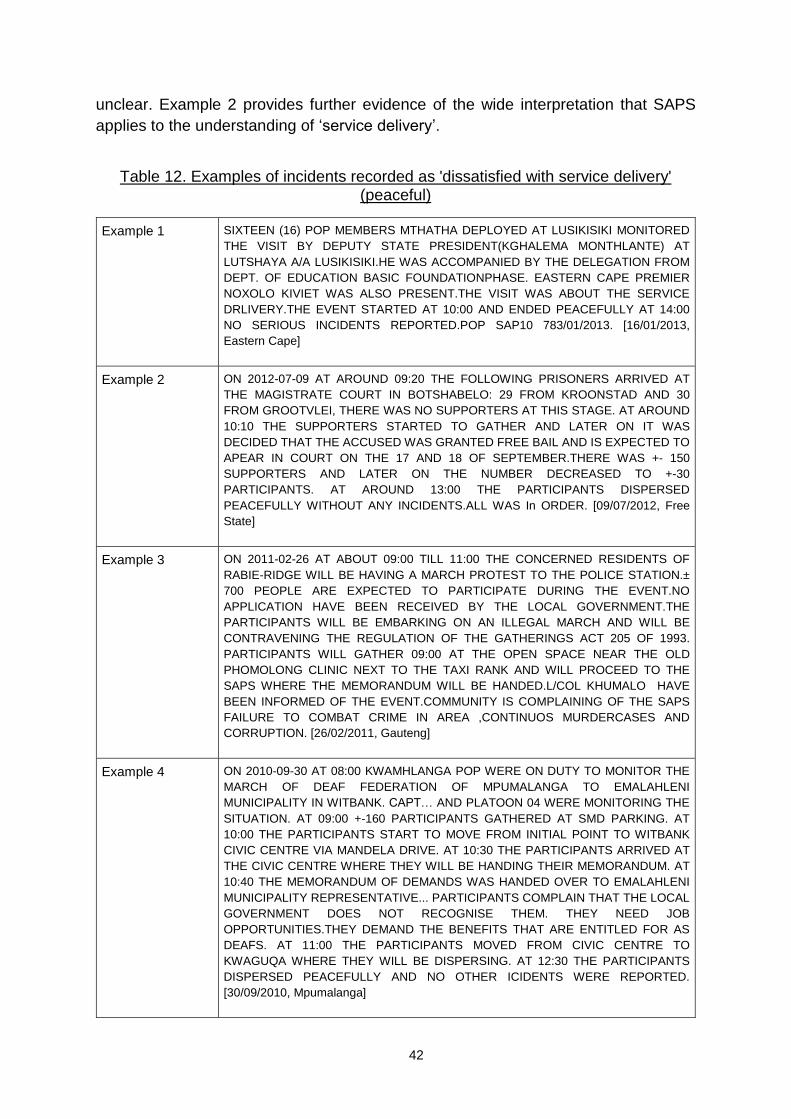
42
unclear. Example 2 provides further evidence of the wide interpretation that SAPS
applies to the understanding of ‘service delivery’.
Table 12. Examples of incidents recorded as 'dissatisfied with service delivery' (peaceful)
Example 1 SIXTEEN (16) POP MEMBERS MTHATHA DEPLOYED AT LUSIKISIKI MONITORED
THE VISIT BY DEPUTY STATE PRESIDENT(KGHALEMA MONTHLANTE) AT
LUTSHAYA A/A LUSIKISIKI.HE WAS ACCOMPANIED BY THE DELEGATION FROM
DEPT. OF EDUCATION BASIC FOUNDATIONPHASE. EASTERN CAPE PREMIER
NOXOLO KIVIET WAS ALSO PRESENT.THE VISIT WAS ABOUT THE SERVICE
DRLIVERY.THE EVENT STARTED AT 10:00 AND ENDED PEACEFULLY AT 14:00
NO SERIOUS INCIDENTS REPORTED.POP SAP10 783/01/2013. [16/01/2013,
Eastern Cape]
Example 2 ON 2012-07-09 AT AROUND 09:20 THE FOLLOWING PRISONERS ARRIVED AT
THE MAGISTRATE COURT IN BOTSHABELO: 29 FROM KROONSTAD AND 30
FROM GROOTVLEI, THERE WAS NO SUPPORTERS AT THIS STAGE. AT AROUND
10:10 THE SUPPORTERS STARTED TO GATHER AND LATER ON IT WAS
DECIDED THAT THE ACCUSED WAS GRANTED FREE BAIL AND IS EXPECTED TO
APEAR IN COURT ON THE 17 AND 18 OF SEPTEMBER.THERE WAS +- 150
SUPPORTERS AND LATER ON THE NUMBER DECREASED TO +-30
PARTICIPANTS. AT AROUND 13:00 THE PARTICIPANTS DISPERSED
PEACEFULLY WITHOUT ANY INCIDENTS.ALL WAS In ORDER. [09/07/2012, Free
State]
Example 3 ON 2011-02-26 AT ABOUT 09:00 TILL 11:00 THE CONCERNED RESIDENTS OF
RABIE-RIDGE WILL BE HAVING A MARCH PROTEST TO THE POLICE STATION.±
700 PEOPLE ARE EXPECTED TO PARTICIPATE DURING THE EVENT.NO
APPLICATION HAVE BEEN RECEIVED BY THE LOCAL GOVERNMENT.THE
PARTICIPANTS WILL BE EMBARKING ON AN ILLEGAL MARCH AND WILL BE
CONTRAVENING THE REGULATION OF THE GATHERINGS ACT 205 OF 1993.
PARTICIPANTS WILL GATHER 09:00 AT THE OPEN SPACE NEAR THE OLD
PHOMOLONG CLINIC NEXT TO THE TAXI RANK AND WILL PROCEED TO THE
SAPS WHERE THE MEMORANDUM WILL BE HANDED.L/COL KHUMALO HAVE
BEEN INFORMED OF THE EVENT.COMMUNITY IS COMPLAINING OF THE SAPS
FAILURE TO COMBAT CRIME IN AREA ,CONTINUOS MURDERCASES AND
CORRUPTION. [26/02/2011, Gauteng]
Example 4 ON 2010-09-30 AT 08:00 KWAMHLANGA POP WERE ON DUTY TO MONITOR THE
MARCH OF DEAF FEDERATION OF MPUMALANGA TO EMALAHLENI
MUNICIPALITY IN WITBANK. CAPT… AND PLATOON 04 WERE MONITORING THE
SITUATION. AT 09:00 +-160 PARTICIPANTS GATHERED AT SMD PARKING. AT
10:00 THE PARTICIPANTS START TO MOVE FROM INITIAL POINT TO WITBANK
CIVIC CENTRE VIA MANDELA DRIVE. AT 10:30 THE PARTICIPANTS ARRIVED AT
THE CIVIC CENTRE WHERE THEY WILL BE HANDING THEIR MEMORANDUM. AT
10:40 THE MEMORANDUM OF DEMANDS WAS HANDED OVER TO EMALAHLENI
MUNICIPALITY REPRESENTATIVE... PARTICIPANTS COMPLAIN THAT THE LOCAL
GOVERNMENT DOES NOT RECOGNISE THEM. THEY NEED JOB
OPPORTUNITIES.THEY DEMAND THE BENEFITS THAT ARE ENTITLED FOR AS
DEAFS. AT 11:00 THE PARTICIPANTS MOVED FROM CIVIC CENTRE TO
KWAGUQA WHERE THEY WILL BE DISPERSING. AT 12:30 THE PARTICIPANTS
DISPERSED PEACEFULLY AND NO OTHER ICIDENTS WERE REPORTED.
[30/09/2010, Mpumalanga]
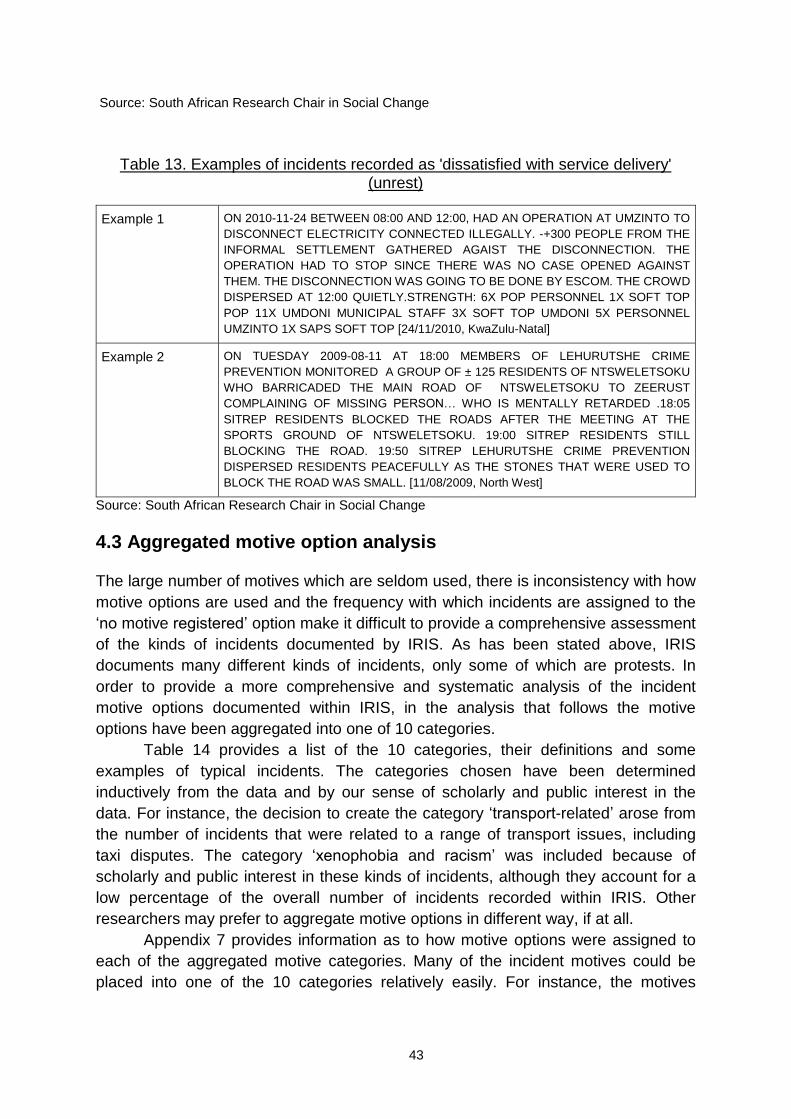
43
Source: South African Research Chair in Social Change
Table 13. Examples of incidents recorded as 'dissatisfied with service delivery' (unrest)
Example 1 ON 2010-11-24 BETWEEN 08:00 AND 12:00, HAD AN OPERATION AT UMZINTO TO
DISCONNECT ELECTRICITY CONNECTED ILLEGALLY. -+300 PEOPLE FROM THE
INFORMAL SETTLEMENT GATHERED AGAIST THE DISCONNECTION. THE
OPERATION HAD TO STOP SINCE THERE WAS NO CASE OPENED AGAINST
THEM. THE DISCONNECTION WAS GOING TO BE DONE BY ESCOM. THE CROWD
DISPERSED AT 12:00 QUIETLY.STRENGTH: 6X POP PERSONNEL 1X SOFT TOP
POP 11X UMDONI MUNICIPAL STAFF 3X SOFT TOP UMDONI 5X PERSONNEL
UMZINTO 1X SAPS SOFT TOP [24/11/2010, KwaZulu-Natal]
Example 2 ON TUESDAY 2009-08-11 AT 18:00 MEMBERS OF LEHURUTSHE CRIME
PREVENTION MONITORED A GROUP OF ± 125 RESIDENTS OF NTSWELETSOKU
WHO BARRICADED THE MAIN ROAD OF NTSWELETSOKU TO ZEERUST
COMPLAINING OF MISSING PERSON… WHO IS MENTALLY RETARDED .18:05
SITREP RESIDENTS BLOCKED THE ROADS AFTER THE MEETING AT THE
SPORTS GROUND OF NTSWELETSOKU. 19:00 SITREP RESIDENTS STILL
BLOCKING THE ROAD. 19:50 SITREP LEHURUTSHE CRIME PREVENTION
DISPERSED RESIDENTS PEACEFULLY AS THE STONES THAT WERE USED TO
BLOCK THE ROAD WAS SMALL. [11/08/2009, North West]
Source: South African Research Chair in Social Change
4.3 Aggregated motive option analysis
The large number of motives which are seldom used, there is inconsistency with how
motive options are used and the frequency with which incidents are assigned to the
‘no motive registered’ option make it difficult to provide a comprehensive assessment
of the kinds of incidents documented by IRIS. As has been stated above, IRIS
documents many different kinds of incidents, only some of which are protests. In
order to provide a more comprehensive and systematic analysis of the incident
motive options documented within IRIS, in the analysis that follows the motive
options have been aggregated into one of 10 categories.
Table 14 provides a list of the 10 categories, their definitions and some
examples of typical incidents. The categories chosen have been determined
inductively from the data and by our sense of scholarly and public interest in the
data. For instance, the decision to create the category ‘transport-related’ arose from
the number of incidents that were related to a range of transport issues, including
taxi disputes. The category ‘xenophobia and racism’ was included because of
scholarly and public interest in these kinds of incidents, although they account for a
low percentage of the overall number of incidents recorded within IRIS. Other
researchers may prefer to aggregate motive options in different way, if at all.
Appendix 7 provides information as to how motive options were assigned to
each of the aggregated motive categories. Many of the incident motives could be
placed into one of the 10 categories relatively easily. For instance, the motives
44
‘demand dismissal of employee’, ‘demand wage increases’ and ‘labour dispute’
could
Table 14. Aggregate motive categories with definitions
Aggregate motive category
Definition Examples of incidents
Community-related issues
Incidents where a geographically defined community raises an issue of concern, excluding issues of education, crime, transport or xenophobia
Community meetings, marches, protests
Labour-related Incidents related to labour-related issues
Meetings, pickets and strike-related actions
Education-related Incidents related to any form of education-related issue including tertiary-related education issues
Community meetings, official Department of Education events, marches, protests
Official government and party political events
Incidents related to official government or party political events
Official government events, imbizos, party political rallies, door-to-door party political campaigns
Recreational, cultural or religious events
Incidents related to sporting, musical, religious and other recreational or cultural events
Soccer matches, music concerts, funerals, cultural events
Crime and policing related
Incidents related to issues of crime and crime-related policing
Monitoring of court appearances, community meetings about crime, and protests about crime
Transport-related Incidents related to any form of transport
Taxi disputes, monitoring of crowds at train stations, meetings regarding transport issues, protests about transport
Elections Incidents related to any form of election
Monitoring internal political party elections, monitoring local elections, monitoring national elections
Racism and xenophobia
Incidents related to racism or xenophobia
Incidents with a racial or xenophobic orientation
Other Incidents which cannot be classified under one of the categories above
Miscellaneous
Source: South African Research Chair in Social Change
all be placed into the labour category. However, as discussed above, for a number of
motives it was difficult to ascertain a consistent way in which incident reporting
personnel had applied certain motive options. In cases where the motive accounted
for less than 1% of incidents these have been placed into the ‘other’ category for the
purposes of this analysis. While it would have been desirable to attempt to provide
comprehensive definitions for all the motive options, time constraints in analysing the
data meant this approach could not be adopted. Furthermore, the minimal use of

45
these categories meant they would not impact on the overall analysis to a significant
degree. However, with four motives, ‘establish alternative structures SOS/POL’, ‘in
sympathy with the oppressed’, ‘mobilising of the masses’ and ‘solidarity’, this
approach could not be taken, as they accounted for more than 1% of the total
incidents recorded. It was therefore necessary to create a sample of these four
motives in order to better understand the kinds of incidents that were being recorded.
4.3.1 Sampling unclear motive options
The 4 motives ‘establish alternative structures SOS/POL’, ‘in sympathy with the
oppressed’, ‘mobilising of the masses’ and ‘solidarity’ were grouped together and
named the unassigned motive group. In order to sample the unassigned motive and
provide an accurate assessment of the kinds of incidents contained within this group
a combination of disproportionate and proportionate stratified random sampling was
used to obtain a representative sample of the kinds of incidents contained within the
unassigned motive group. Strata were type of incident (either peaceful or unrest) and
year. For type of incident, sampling was disproportionate and unrest cases were
deliberately oversampled. As seen in section 2.3, for the period being considered
90.0% of all incidents recorded were peaceful, and a sample that mirrored this
distribution would generate too few unrest cases per year to reliably infer the results
to the population. For this reason a sampling ratio of 60% peaceful to 40% unrest
was used. Proportional sampling was used for year. A final sample size of 350, 210
peaceful and 140 unrest, was deemed to be operationally feasible, incidents were
grouped by type and year, and the random sampling programme in IBM SPSS
(version 22) was used to draw the required sample size per stratum. Each incident
was categorised into one of the 10 categories. The results of this sampling are
presented in Table 15, with further details provided in Appendix 6.
Table 15. Unassigned motive sample by aggregated motive categories
Source: South African Research Chair in Social Change
The sampling revealed differences as to how the unassigned motives had
been categorised into one of the aggregated motive options. In the peaceful sample,
51% of the incidents ‘official government and party political events’ or ‘recreational,
religious and cultural events’. With the unrest eventuality classification only 6% of
incidents were in the same categories. Incidents in this category include official party
political rallies, soccer matches and church services. 31% of the incidents sampled
in the unrest eventuality classification were considered to be ‘community-related’,
Community
Related
Labour
Related
Education
Related
Official
Government
and Party
Political
Events
Recreational
Religous and
Cultural
Events
Crime
Related
Transport
Related
Election
Related
Xenophobia
and Racism Other
Peaceful35 17 4 64 42 16 1 11 1 19 210
% 17% 8% 2% 31% 20% 8% 1% 5% 1% 9% 100%
Unrest 43 17 13 6 3 39 4 1 2 12 140
% 31% 12% 9% 4% 2% 28% 3% 1% 1% 9% 100%

46
compared to 17% of incidents in the peaceful classification. Furthermore, 28% of
incidents sampled in the unrest eventuality classification were ‘crime- related’,
compared to only 8% of those sampled in the peaceful eventuality classification.
A similar procedure was followed for incidents that had been assigned to the
‘no motive registered’ option. As Table 16 demonstrates, differences between
incidents sampled in the peaceful and unrest eventuality classifications were also
observed. 53% of incidents sampled within the peaceful eventuality classification
were categorised as being ‘official government and party political events’ or as
‘recreational, religious or cultural events’, compared to 8% of those sampled in the
unrest eventuality classification. 34% of incidents were categorised as ‘crime-related’
in the unrest sample compared to 8% in the peaceful sample. ‘Community-related’
incidents were also more frequently recorded in the unrest sample, with 24%
categorised as ‘community-related’ compared to 15% in the peaceful sample. The
results from the sample raise important questions and concerns about the recording
of IRIS incidents. Many of the incidents recorded as ‘no motive registered’ should,
theoretically, have been relatively easy to assign given the high proportion of official
and recreational events that were found within the sample, and it is unclear why such
incidents have not been assigned motives.
Table 16. 'No motive registered' sample by aggregated motive categories
Source: South African Research Chair in Social Change
With the results from the sampling we were able to calculate estimates of the
frequency of aggregated motive options. Using the recode function in IBM SPSS
(version 22) motives were assigned numerical codes based on the categories
motives had been assigned to (see Appendix 7). The results from the unassigned
motive and ‘no motive registered’ samples allowed us to assign incidents
proportionally to aggregated motive categories by year and eventuality classification.
4.4 Summary of key results from aggregated motive analysis
4.4.1 Aggregated analysis by peaceful and unrest incidents
Appendix 8 provides the comprehensive results from the aggregated motive
analysis. The analysis presented below provides a summary of the key trends. It
should be noted that all the figures presented below are estimates. Figure 11
demonstrates that the majority of peaceful incidents documented by IRIS are either
labour-related or recreational, cultural or religious events. The peak documented in
Community
Related
Labour
Related
Education
Related
Official
Government
and Party
Political
Events
Recreational
religous and
cultural
events
Crime
Related
Transport
Related Elections
Xenophobia
& Racism Other Total
Peaceful 32 15 2 44 68 16 3 5 0 25 210
% 15% 7% 1% 21% 32% 8% 1% 2% 0% 12% 100%
Unrest 33 11 9 2 9 48 10 0 0 18 140
% 24% 8% 7% 1% 7% 34% 7% 0% 0% 13% 100%
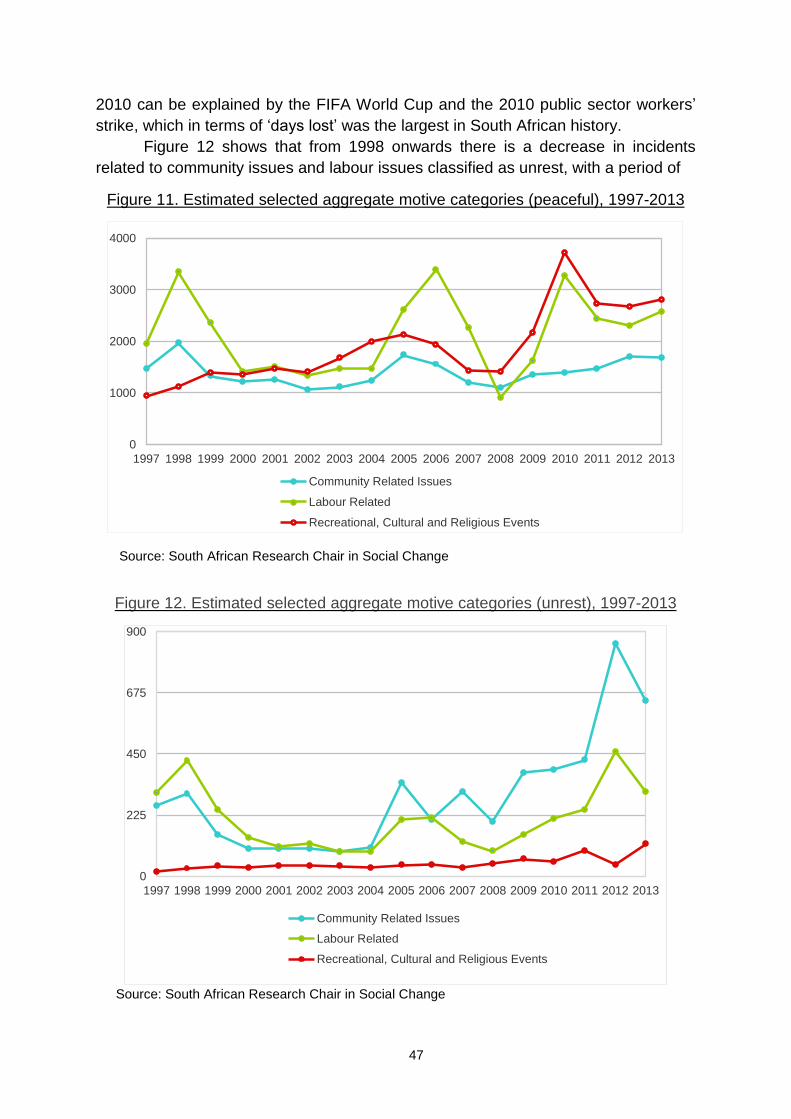
47
2010 can be explained by the FIFA World Cup and the 2010 public sector workers’
strike, which in terms of ‘days lost’ was the largest in South African history.
Figure 12 shows that from 1998 onwards there is a decrease in incidents
related to community issues and labour issues classified as unrest, with a period of
Figure 11. Estimated selected aggregate motive categories (peaceful), 1997-2013
Source: South African Research Chair in Social Change
Figure 12. Estimated selected aggregate motive categories (unrest), 1997-2013
Source: South African Research Chair in Social Change
0
1000
2000
3000
4000
1997 1998 1999 2000 2001 2002 2003 2004 2005 2006 2007 2008 2009 2010 2011 2012 2013
Community Related Issues
Labour Related
Recreational, Cultural and Religious Events
0
225
450
675
900
1997 1998 1999 2000 2001 2002 2003 2004 2005 2006 2007 2008 2009 2010 2011 2012 2013
Community Related Issues
Labour Related
Recreational, Cultural and Religious Events
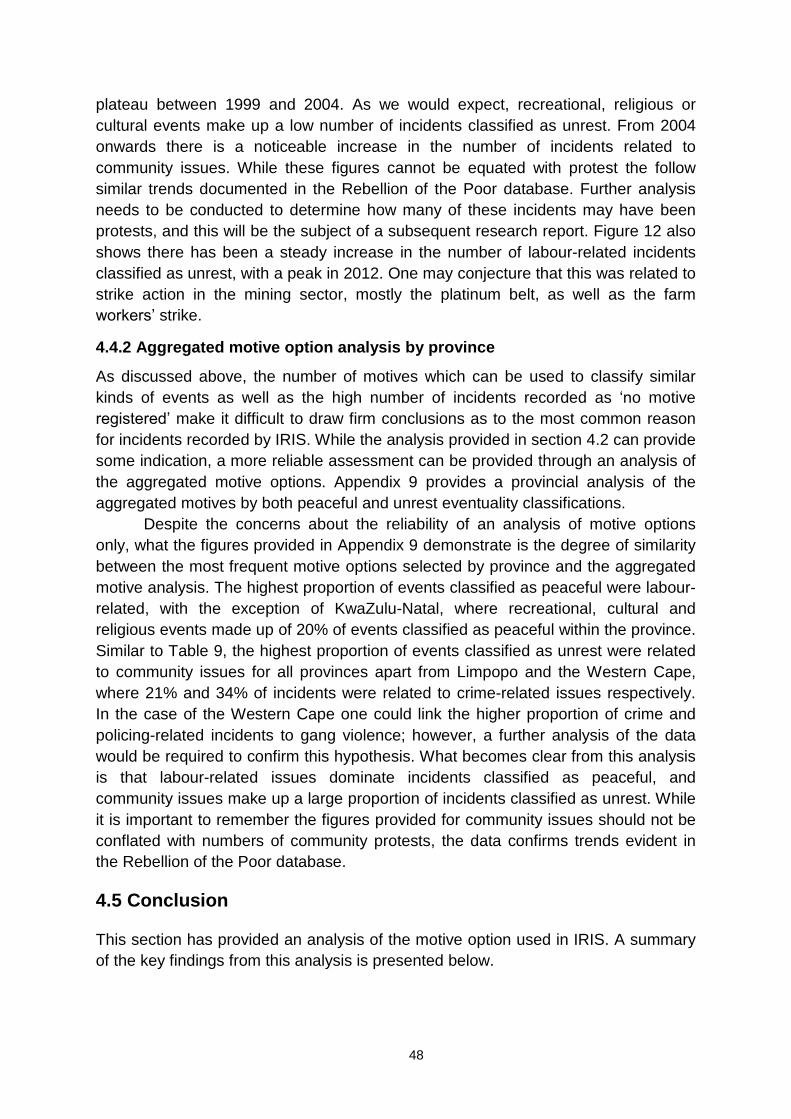
48
plateau between 1999 and 2004. As we would expect, recreational, religious or
cultural events make up a low number of incidents classified as unrest. From 2004
onwards there is a noticeable increase in the number of incidents related to
community issues. While these figures cannot be equated with protest the follow
similar trends documented in the Rebellion of the Poor database. Further analysis
needs to be conducted to determine how many of these incidents may have been
protests, and this will be the subject of a subsequent research report. Figure 12 also
shows there has been a steady increase in the number of labour-related incidents
classified as unrest, with a peak in 2012. One may conjecture that this was related to
strike action in the mining sector, mostly the platinum belt, as well as the farm
workers’ strike.
4.4.2 Aggregated motive option analysis by province
As discussed above, the number of motives which can be used to classify similar
kinds of events as well as the high number of incidents recorded as ‘no motive
registered’ make it difficult to draw firm conclusions as to the most common reason
for incidents recorded by IRIS. While the analysis provided in section 4.2 can provide
some indication, a more reliable assessment can be provided through an analysis of
the aggregated motive options. Appendix 9 provides a provincial analysis of the
aggregated motives by both peaceful and unrest eventuality classifications.
Despite the concerns about the reliability of an analysis of motive options
only, what the figures provided in Appendix 9 demonstrate is the degree of similarity
between the most frequent motive options selected by province and the aggregated
motive analysis. The highest proportion of events classified as peaceful were labour-
related, with the exception of KwaZulu-Natal, where recreational, cultural and
religious events made up of 20% of events classified as peaceful within the province.
Similar to Table 9, the highest proportion of events classified as unrest were related
to community issues for all provinces apart from Limpopo and the Western Cape,
where 21% and 34% of incidents were related to crime-related issues respectively.
In the case of the Western Cape one could link the higher proportion of crime and
policing-related incidents to gang violence; however, a further analysis of the data
would be required to confirm this hypothesis. What becomes clear from this analysis
is that labour-related issues dominate incidents classified as peaceful, and
community issues make up a large proportion of incidents classified as unrest. While
it is important to remember the figures provided for community issues should not be
conflated with numbers of community protests, the data confirms trends evident in
the Rebellion of the Poor database.
4.5 Conclusion
This section has provided an analysis of the motive option used in IRIS. A summary
of the key findings from this analysis is presented below.
49
▪ Over a third of all incidents are not assigned a motive. This compromises the
ability of the SAPS and the public to be reliably informed about the kinds of
incidents public order policing is involved in.
▪ The purpose of motive options is often unclear, and multiple motives can be
used to categorise the same kinds of events.
▪ Labour-related incidents are the most common incidents public order policing
records.
▪ Recreational, religious and cultural events and official government and party
political events also take up a large proportion of the incidents recorded by
public order policing.
▪ A large proportion of unrest incidents are related to ‘community-related’ issue.
This trend appears to have been increasing since 2004. However, the
increasing number of community-related incidents should not be conflated
with protest.
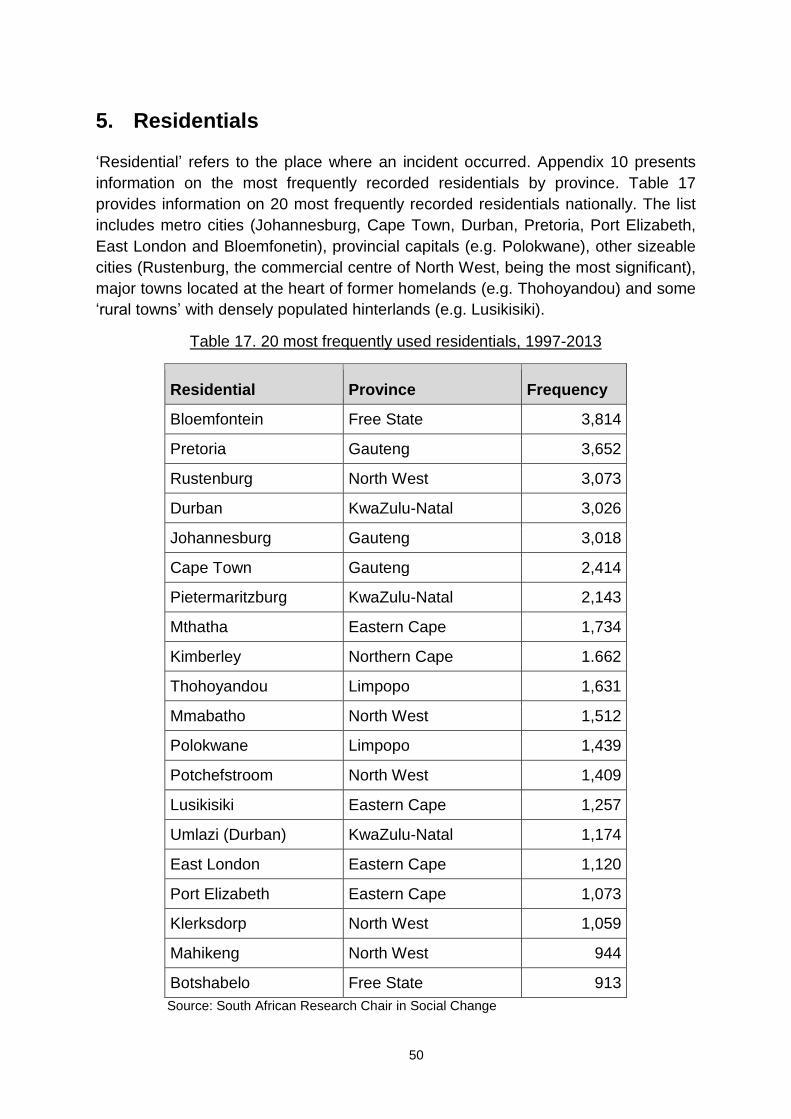
50
5. Residentials
‘Residential’ refers to the place where an incident occurred. Appendix 10 presents
information on the most frequently recorded residentials by province. Table 17
provides information on 20 most frequently recorded residentials nationally. The list
includes metro cities (Johannesburg, Cape Town, Durban, Pretoria, Port Elizabeth,
East London and Bloemfonetin), provincial capitals (e.g. Polokwane), other sizeable
cities (Rustenburg, the commercial centre of North West, being the most significant),
major towns located at the heart of former homelands (e.g. Thohoyandou) and some
‘rural towns’ with densely populated hinterlands (e.g. Lusikisiki).
Table 17. 20 most frequently used residentials, 1997-2013
Residential Province Frequency
Bloemfontein Free State 3,814
Pretoria Gauteng 3,652
Rustenburg North West 3,073
Durban KwaZulu-Natal 3,026
Johannesburg Gauteng 3,018
Cape Town Gauteng 2,414
Pietermaritzburg KwaZulu-Natal 2,143
Mthatha Eastern Cape 1,734
Kimberley Northern Cape 1.662
Thohoyandou Limpopo 1,631
Mmabatho North West 1,512
Polokwane Limpopo 1,439
Potchefstroom North West 1,409
Lusikisiki Eastern Cape 1,257
Umlazi (Durban) KwaZulu-Natal 1,174
East London Eastern Cape 1,120
Port Elizabeth Eastern Cape 1,073
Klerksdorp North West 1,059
Mahikeng North West 944
Botshabelo Free State 913
Source: South African Research Chair in Social Change

51
There is one obvious absentee: Ekurhuleni, the fourth most populous
metropolitan area. This points to a problem of reading too much into the data on
‘residentials’. Unlike the other seven metros, Ekurhuleni has no major city at its
heart; rather it is a collection of former industrial towns collectively known as the East
Rand. The boundaries of ‘residentials’ are not determined in consistent fashion.
‘Johannesburg’, for instance, should not be confused with the area covered by the
City of Johannesburg. To make matters worse, an incident occurring in a particular
place could sometimes be placed under more than one ‘residential’. For instance,
events occurring in Zandspruit, an informal settlement outside of Johannesburg, are
recorded both as ‘Zandspruit (Squatters Camp)’ and as ‘Honeydew’, the police
precinct into which Zandspruit falls.
For Port Elizabeth we found 38 different residentials that had been linked with
either ‘Port Elizabeth’ or ‘PE’. These ranged from KwaMagxaki, which recorded only
two incidents, through Despatch with 151 incidents and Central with 345, to Korsten
with 444 and New Brighton with 447. Smaller towns are less likely to be sub-divided
into smaller geographical areas and are therefore likely to feature more prominently
if a simple frequency analysis is run on a ‘residential’ name without taking into
account the different ways in which an area could be recorded. While Port Elizabeth
features only 1,073 times in Table 17, if all areas that fall under Port Elizabeth or PE
are aggregated the total number of incidents recorded for the city increases to 5,722,
a figure higher than for Bloemfontein, which appears at the top of Table 17. Thus it is
important that the frequencies provided in Table 17 and Appendix 10 are interpreted
with caution and not read as the total number of incidents for any one particular area.
Further research should place ‘residentials’ within their particular municipality.
This could pave the way to quantitative analysis linking IRIS data to a range of
demographic, economic, social and political variables that exit for municipalities. We
lacked the resources to take this step at this stage. When IRIS is reformed or
replaced, we recommend that a category for municipality be introduced.
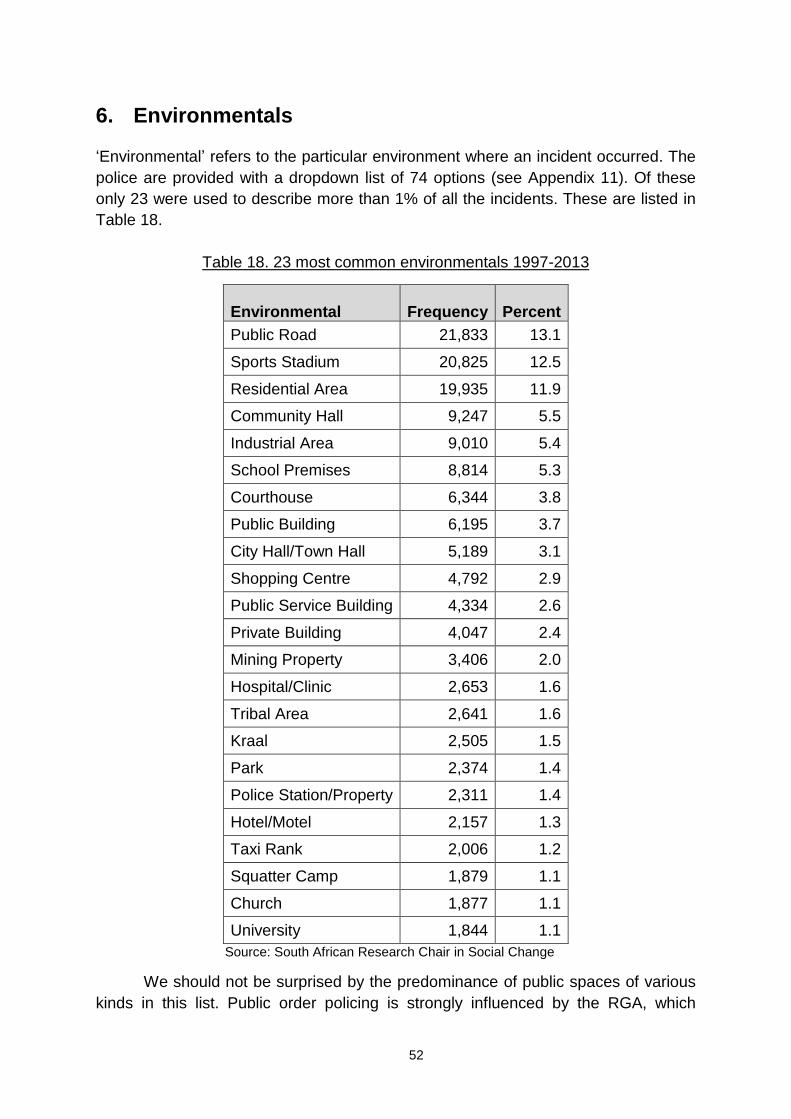
52
6. Environmentals
‘Environmental’ refers to the particular environment where an incident occurred. The
police are provided with a dropdown list of 74 options (see Appendix 11). Of these
only 23 were used to describe more than 1% of all the incidents. These are listed in
Table 18.
Table 18. 23 most common environmentals 1997-2013
Environmental Frequency Percent
Public Road 21,833 13.1
Sports Stadium 20,825 12.5
Residential Area 19,935 11.9
Community Hall 9,247 5.5
Industrial Area 9,010 5.4
School Premises 8,814 5.3
Courthouse 6,344 3.8
Public Building 6,195 3.7
City Hall/Town Hall 5,189 3.1
Shopping Centre 4,792 2.9
Public Service Building 4,334 2.6
Private Building 4,047 2.4
Mining Property 3,406 2.0
Hospital/Clinic 2,653 1.6
Tribal Area 2,641 1.6
Kraal 2,505 1.5
Park 2,374 1.4
Police Station/Property 2,311 1.4
Hotel/Motel 2,157 1.3
Taxi Rank 2,006 1.2
Squatter Camp 1,879 1.1
Church 1,877 1.1
University 1,844 1.1
Source: South African Research Chair in Social Change
We should not be surprised by the predominance of public spaces of various
kinds in this list. Public order policing is strongly influenced by the RGA, which
53
focuses on ‘public places and premises wholly or partly open to the air’. ’Public
roads’ are used for activities such as fun runs as well demonstrations and road
blockades. ‘Sports stadiums’ are used for large public meetings and big musical and
state events as well as sports. ‘Residential areas’ and ‘squatter camps’ (informal
settlements) are common sites of community protests. A large number of the
‘industrial areas’ and ‘mining properties’ would be linked to labour action. Most other
‘residentials’ could be associated with a range of ‘motives’: recreational as well as
political. ‘Tribal areas’ and ‘kraals’ are reminders that incidents occur in rural as well
as urban areas.
Closer analysis could yield dynamics we have not yet seen. It might, for
instance, be possible to discern patterns about where different kinds of protests
occur. But, for us, ‘environmentals’ reflected what we knew about incidents based on
our analysis of motives.

54
7. Conclusions
This report has offered an analysis of incidents recorded by IRIS. The main focus of
this report has been to understand incidents, not protests, recorded as either ‘crowd
(peaceful)’ or ‘crowd (unrest)’.
7.1 Complexity and caution in interpreting IRIS data
This report has highlighted the complexity of IRIS data and the need for caution in
any analysis derived from it. Of primary importance is that IRIS does not capture all
gatherings or public events. This is particularly apparent in the collapse in the
number of incidents captured by IRIS following the 2006 re-organisation of public
order policing.
7.1.1 Peaceful and unrest incidents
The data presented in this report shows clearly that 90% of incidents registered by
IRIS between 1997 and 2013 were, in IRIS’s terms, peaceful. One of the significant
contributions this report has made to deepening the understanding of IRIS data has
been to provide clarity on the distinction between ‘peaceful’ and ‘unrest’. In our view,
it is misleading to equate peaceful and unrest with peaceful and violent incidents.
‘Unrest’ relates to some form of police intervention aimed at changing the behaviour
of participants in a public event, such as dispersal or arrests. That is, the definition is
based primarily on action taken by the police, rather than by people involved in the
event. Violence as such is not a condition for an incident to be defined as ‘unrest’,
and it is clear from the unrest incidents we have examined that there is no evidence
of violence in many cases. IRIS’s ‘peaceful' category should be regarded as a
technical alternative to ‘unrest’, as, in our view, many ‘unrest’ incidents would be
regarded as ‘peaceful’ by most observers. Moreover, even within this understanding
of the peaceful/unrest distinction, many errors appear have been made in the
recording of incidents. Therefore, ‘unrest’ cannot be equated with ‘violent’.
7.1.2 Provincial distribution
An analysis of incidents per 100,000 people has highlighted that the North West
province has an exceptionally high number of incidents, especially ‘peaceful
incidents’.
7.2 Motives
With peaceful incidents the largest group of motives is ‘labour-related’ – either
‘demand wage increase’ or ‘labour dispute’. This represents 25% of the total. From
2009 onwards the most common motive for unrest incidents is ‘dissatisfied with
service delivery’. However, this report has highlighted the difficulties in analysing the
motives used by IRIS. First, the meaning and purpose of motive options is often
unclear, with multiple motives being used to categorise the same kinds of incidents.
Furthermore, over a third of all incidents are not assigned a motive (32% as recently
55
as 2013). This compromises the ability of the SAPS and the public to understand the
kinds of incidents public order policing is involved in.
In order to overcome the problems identified above, in this report we
categorised motives into one of 10 motive groups. This analysis confirmed what had
been indicated by the analysis of motive options, which is that the majority of
peaceful incidents were labour-related (24%) with recreational, religious and cultural
events a close second (21%). The majority of unrest incidents, 27%, were related to
community issues. Unrest in community-related incidents appears to have been
increasing since 2004. While this should not be conflated with protest, it does show
similar trends to those documented in the Rebellion of the Poor database.
7.3 Recommendations and future research
We believe that an effective, reliable and accurate system of recording incidents is
critical for public accountability. Clear definitions of categories and options are
required. These should be aligned with concerns to measure protest action that exist
within the police and among politicians and the public.
We also believe that there are a number of important avenues for future
research. (1) Further inquiry as to how incidents are defined, recorded and
categorised. This would require co-operation from the SAPS. (2) Further analysis of
notes that accompany entries for each incident, including distinguishing which
incidents are protests. (3) Analysis relating police-recorded protests to media-
reported protests, and quantitative analysis linking protests with social and
demographic variables (e.g. unemployment).

56
8. Addendum: Misinformation from generals and minister
The longer we worked on this report the more it became clear that top South African
Police Service (SAPS) officials and government ministers misconstrued IRIS data
and in consequence misled parliament and the public. This is significant because
their interpretations were central to motivations for a massive increase in expenditure
on public order policing. Before we provide evidence of their misreading, and specify
the implications, we provide a reminder of some key terms used by IRIS, the source
of statistics on crowd management. We hope that our analysis will spur public
debate about protests and public order policing - that is its purpose.
8.1 Relevant findings from our research
1) The Annual Report of SAPS reveals the number of ‘crowd-related incidents’
that occurred in the relevant financial year. These figures correspond to those
for ‘crowd management incidents’ and are derived from IRIS (though the
numbers are not precisely the same).
2) ‘Crowd management incidents’ are not ‘protests’. IRIS includes a list of 23
incident ‘types’, some of which, such as ‘Demonstration’ or ‘Strike (Stay-
Away)’, could be regarded as protests, but some are clearly not protests, for
example ‘Assembly (Church)’ and ‘Assembly (Sport)’.
3) In a subsequent report we will provide an estimate of the proportion of crowd
management incidents that can be regarded as protests. For now, it must
suffice to note that between 1997 and 2013 about 16% of incidents
were ‘recreational, cultural or religious events’ and about 9% were ‘official
events’.
4) The Annual Report of SAPS includes numbers for (i) ’Peaceful incidents’ and
(ii) ‘Unrest-related incidents’. These figures correspond to those for ‘Crowd
(peaceful) and ‘Crowd (unrest)’ found in IRIS (though the numbers are not
precisely the same). The term ‘violent’ does not appear in the Annual Report
or in IRIS statistics.
5) ‘Crowd (unrest)’ cannot be equated with ‘violent’. Though ‘violent’ is an
antonym for ‘peaceful’, which may mislead some people, it is not a ‘synonym’
for violent. ‘Crowd (unrest)’ refers to crowd management incidents where
Public Order Police (POP) intervene. Assuming rules are followed,
interventions occur when life or property is endangered or if a national road is
blocked. That is, actual violence by protesters is not a precondition for an
incident to be recorded as ‘unrest’
6) In our subsequent report, we provide an estimate of the proportion of protests
involving violence. Here it must suffice to note that (i) in many cases the IRIS
records provide no evidence of violence in unrest incidents, and (ii) again,
recreational, cultural, religious, and official events sometimes appear under
‘crowd (unrest)’.

57
7) With ‘peaceful’ incidents, i.e. the overwhelming majority of crowd incidents,
public order policing is either on standby or in reserve, and SAPS station
police or metro police take primary responsibility. Contrariwise, much
(perhaps most) POP work involves duties other than crowd management. This
includes activities that have proved far more costly in terms of loss or life than
the policing of protest.
8.2 Abuse of IRIS statistics
We turn now to recent examples of IRIS statistics being misused by the SAPS
leadership and ministers, including the President.
8.2.1. SAPS generals On 3 September 2014 General Phiyega, the National Police Commissioner, and Lt.
General Elias Mawela, the divisional commissioner responsible for POP, briefed
parliament’s portfolio committee about the state of public order policing in South
Africa. In the course of his presentation Mawela (2014) states:
Violent protest action escalated from 1,226 in 2011/12, and then in
2012/13 it is 1,882, and in the last financial year [2013/14] it escalated to
1,907.23
Here there is conflation between ‘unrest-related incidents’ and ‘violent protests’
which are not the same. From our analysis we have demonstrated that not all
incidents classified as unrest are violent. In analysis conducted for a forthcoming
research report on protests, we found that only 54% of protests sampled were
violent. Thus the numbers of incidents in which violence occurred is likely to be far
less than he stated.
Phiyega informed the committee that in order to deal with ‘increasing and
continual violent protest actions’, SAPS would be spending an extra R3.3 billion per
annum on POP (SAPS 2014c).24 Thus far, R2.7 billion had been set aside, so this
expanded the budget by 122%. Phiyega later added that she would be looking for an
extra 30% on top of the R3.3 billion (Portfolio Committee on Police 2014).
Misrepresentation of numbers was central to justifying massively increased
spending.25
23
This quote is taken directly from a recording of Mawela’s statement. We are grateful to Monique Doyle for providing the link to this recording and also a copy of a written abbreviated record of proceedings (Portfolio Committee on Police 2014). 24
The additional funds will be used to increase the strength of POP units from 4,721 members to 9,522 members over the space of four years, and to purchase water cannon, pyrotechnics (tear gas and stun grenades) and video equipment (SAPS 2014bc 25
Mawela informed the committee that increased spending was in line with the President’s 2013 State of the Nation Address - made in the wake of the Marikana Massacre (Portfolio Committee on Police 2014).
58
8.2.2 The President
In his State of the Nation Address given on 12 February 2015, President Jacob
Zuma (2015) said:
We are a democratic state and recognise the community’s right to protest.
We however appeal that these protests should be within the ambit of the
law and must be peaceful as stated in the Constitution. The police
successfully brought under control 13,575 recorded public order incidents,
comprising 1,907 unrest-related and 11,668 peaceful incidents.
Zuma moves from ‘protests' to ‘incidents’ without indicating that these are different
things, thus leaving his audience with the impression that they are probably the
same. He then gives the total for crowd-related incidents, praising the police for
bringing these ‘under control’, but 86% of these were ‘peaceful’, events like football
matches, religious events and self-marshalled protests, which did not need to be -
and, by definition, were not - ‘brought under control’. While his statement is framed
by reference to democratic rights, he ends by saying, in effect, that protests - all
protests - must be limited by police intervention. His choice of the word ‘control’ is
especially interesting, because it was a concept used under apartheid but replaced
by a philosophy of ‘crowd management’ after the transition
Reflecting on the same passage, Jane Duncan (2015) asks: ‘why, then, does
the President make the dramatic claim that these gatherings were “brought under
control” by the police?’ She responds: ‘Arguably, the President and the police have a
vested interest in talking up the figures, to justify a massive expansion in the number
of public order police’. We agree with this assessment.26
8.2.3 Minister of Police
On 15 May 2015 it was the turn of Nkosinathi Nhleko (2015) to give his budget vote
speech to Parliament. In this he asserts:
The country has witnessed a spike in service delivery and or community
protests for service delivery. Police resources were committed to 14,740
incidents, of which 12,451 were peaceful and 2,289 turning violent [sic].
The fact of the matter is that these protests continue to strain the
resources of the SAPS.
His mention of ‘these protests’ can be nothing other than a reference to the ’14,740
incidents’, of which, he claimed, ‘2,289 tuned violent’. Nhleko is the Minister of
Police, so must surely know that an ‘incident’ is not a ‘protest’ and that ‘unrest’ is not
26
See also the budget speech given by Nhlanhla Nene (2015), the Minister of Finance
59
‘violence’, so it is difficult to avoid the conclusion that he was not misinforming
parliament, doing so to ensure that he received support for his budget vote.
8.3 Implications
Public order police do face violence in their jobs, but the worst of this is not
associated with protests, it has come mainly from interventions in taxi conflicts, rural
faction fights etc. So why exaggerate the number of violent protests? In our view, the
answer may be found less in the violence and more in the threat to established order
that generals and ministers associate with popular protest. The effect, and possibly
the intention, of the official discourse represented above is that it stigmatises protest,
an important feature of a democratic society.
We do not doubt that the number of violent protests has increased over recent
years (though not nearly to the extent implied in the quotes above), and even if
parliament was presented with an accurate assessment of the statistics, it might still
support massive expansion of POP. But there is a price to pay. From our broader
research we know that the single most important issue propelling community
protests is housing - both the sub-standard quality of much public housing and an
absolute lack of sufficient dwellings. Assuming that an RDP house costs R150,000
on average, which is about right, the extra R3.3 billion spent on POP would be
enough to build more than 200,000 RDP houses, roughly tripling the number
completed in recent years. Putting things another way, if we take the SAPS
argument at face value, and accept that increased spending on POP can be justified
on the basis of the number of violent protests escalating from 1,226 in 2011/12 to
1,907 in 2013/14 (to use Mawela’s figures), then we are being expected to pay
nearly R5 million for each one of the extra protests. We doubt the public would
regard this as wise use of public funds.
We are disturbed by the way IRIS statistics are being misrepresented
because this has implications for criminalisation of the right to protest, for the
direction of funds away from the poor, and for holding our leaders accountable.
[Type here]
60
References
Alexander, Peter (2010). ‘Rebellion of the poor: South Africa’s service delivery
protests - a preliminary analysis’, Review of African Political Economy
37(123): pp. 25-40.
Alexander, Peter (2012). ‘Barricades, Ballots and Experimentation: Making Sense of
the 2011 Local Government Election with a Social Movement Lens,’ in
Marcelle C. Dawson and Luke Sinwell (eds), Contesting Transformation:
Popular Resistance in Twenty-First Century South Africa. London: Pluto
Press.
Alexander, Peter & Peter Pfaffe (2014). ‘Social Relationships to the Means and Ends
of Protest in South Africa’s Ongoing Rebellion of the Poor: the Balfour
Insurrections.’ Social Movement Studies: Journal of Social, Cultural and
Political Protest 13(2): pp 204-221.
Alexander, Peter, Carin Runciman & Trevor Ngwane (2014a). ’Community Protests
2004-2013: Some Research Findings’. Media presentation available on South
African Research Chair in Social Change website.
Alexander, Peter, Carin Runciman & Trevor Ngwane (2014b). ‘Growing civil unrest
shows yearning for accountability’, Business Day, 7 March, p. 11.
Day, Vernon (2015). Email to Peter Alexander, 21 May.
Duncan, Jane (2010). ‘On Protest Hotspots and Analytical Blind Spots, The South
African Civil Society Information Service, 8 March.
Duncan, Jane (2014). The Rise of Securocrats: the Case of South Africa.
Johannesburg: Jacana Media.
Duncan, Jane (2015). ‘Serve and protest? Concept paper on police violence against
protests’. Distributed at University of Johannesburg public meeting on Human
Rights, 6 March.
Du Plessis, Carien, Sabelo Ndlangisa & Athandiwe Saba (2014). ‘Zuma sidesteps
flames: President avoids Gauteng as protests rocket to 31 a day across SA
over three months’, City Press, 9 February.
eNCA (2014). ‘SAPS gets poor riot scorecard’. eNCA, 26 January. Available at
http://www.enca.com/south-africa/saps-gets-poor-riot-scorecard
[Type here]
61
Mawela, Elias (2014). Statement made to Portfolio Committee on Police, 3
September 2014. Recording downloaded from http://pmg-assets.s3-website-
eu-west-1.amazonaws.com/audio/140903pcpolice1.mp3. Approximately 44
minutes into recording.
Ministry of Police (n.d). ‘Policy and Guidelines: Policing of Public Protests,
Gatherings and Major Events’. Available from Marikana Commission of
Inquiry.
National Assembly (2012). Reply to question 397 asked by Mr M.H. Hoosen
approved by Minister of Police. Cape Town: National Assembly.
Nene, Nhlanhla (2015). 2015 Budget Speech. Pretoria: Ministry of Finance.
Nhleko, Nkosinathi (2015). Budget Vote Speech. Theme: Building a united front to
help and protect communities’. Available from GCIS Media Liaison.
Omar, Bilkis (2006). ‘Crowd Control: Can our Public Order Police Still Deliver?’ SA
Crime Quarterly 15: pp. 1-6.
Omar, Bilkis (2007). SAPS’ Costly Restructuring: a review of public order policing
capacity. Pretoria: Institute for Security Studies.
Portfolio Committee on Police (2014). ‘3 September 2014. SAPS on state of public
order policing’. Written record provided by Parliamentary Monitoring Group.
Saba, Athandiwe & van der Merwe, Jeanne (2013). ‘SA has a protest every two
days’, News24, 21 January.
SAPS (2011). ‘Presentation to the Portfolio Committee on Police on the
Implementation of Crowd Control Strategy, 30 August 2011’. Available from
Marikana Commission of Inquiry.
SAPS (2013). Annual Reports of South African Police Service 2012/13. Pretoria:
South African Police Service.
SAPS (2014). National Instruction 4 of 2014. Public Order Police: Crowd
Management During Public Gatherings and Demonstrations.
SAPS (2014c). Media Statement from the National Media Centre, Corporate
Communication, South African Police Service. 3 September.

[Type here]
62
StatsSA (2012) Census 2011: Provinces at a glance. Pretoria: StatsSA.
Tait, Sean & Monique Marks (2011). ‘You strike a gathering, you strike a rock’, South
African Crime Quarterly 38: pp. 15-22.
Vally, Natasha (2009). ‘National trends around protest action: mapping protest action
in South Africa. Study undertaken on behalf of the Centre for Sociological
Research and the Freedom of Expression Institute’, paper presented to the
Centre for Sociological Research and Development Studies Seminar,
University of Johannesburg.
Zuma, Jacob (2014). State of the Nation Address 2015. Available at
www.gov.za/president-jacob-zuma-state-nation-address-2015.
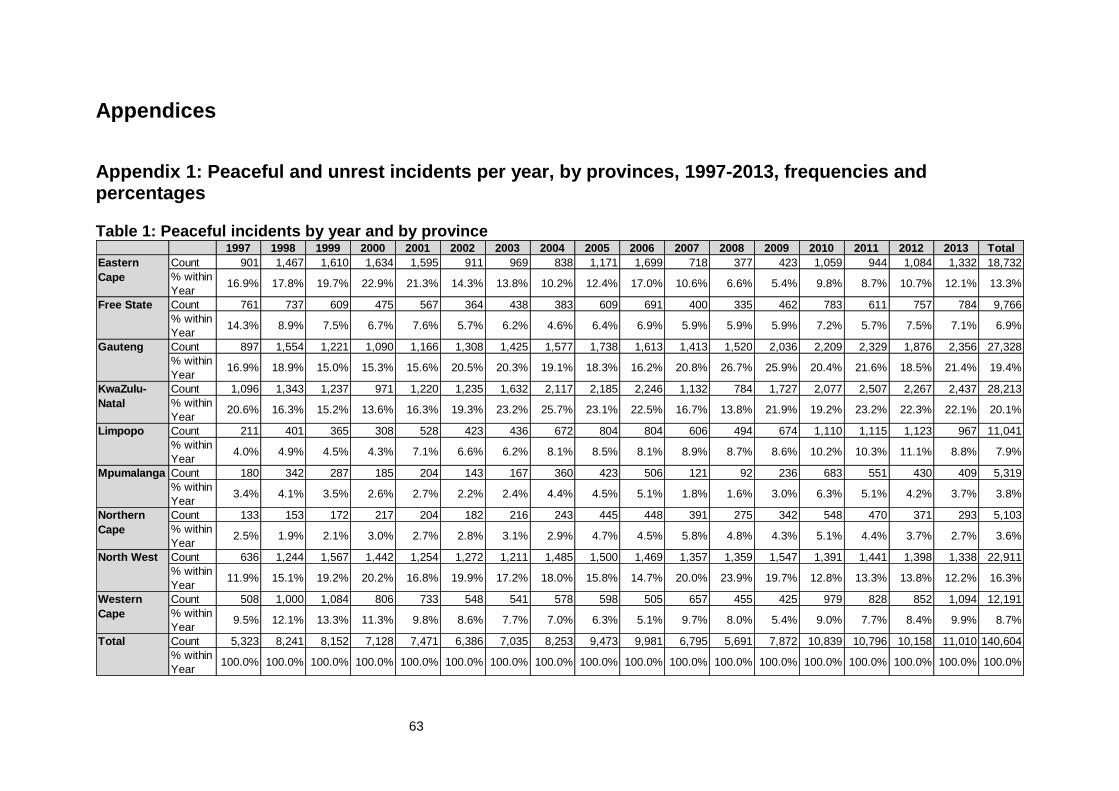
[Type here]
63
Appendices
Appendix 1: Peaceful and unrest incidents per year, by provinces, 1997-2013, frequencies and percentages Table 1: Peaceful incidents by year and by province
1997 1998 1999 2000 2001 2002 2003 2004 2005 2006 2007 2008 2009 2010 2011 2012 2013 Total
Count 901 1,467 1,610 1,634 1,595 911 969 838 1,171 1,699 718 377 423 1,059 944 1,084 1,332 18,732
% within
Year16.9% 17.8% 19.7% 22.9% 21.3% 14.3% 13.8% 10.2% 12.4% 17.0% 10.6% 6.6% 5.4% 9.8% 8.7% 10.7% 12.1% 13.3%
Count 761 737 609 475 567 364 438 383 609 691 400 335 462 783 611 757 784 9,766
% within
Year14.3% 8.9% 7.5% 6.7% 7.6% 5.7% 6.2% 4.6% 6.4% 6.9% 5.9% 5.9% 5.9% 7.2% 5.7% 7.5% 7.1% 6.9%
Count 897 1,554 1,221 1,090 1,166 1,308 1,425 1,577 1,738 1,613 1,413 1,520 2,036 2,209 2,329 1,876 2,356 27,328
% within
Year16.9% 18.9% 15.0% 15.3% 15.6% 20.5% 20.3% 19.1% 18.3% 16.2% 20.8% 26.7% 25.9% 20.4% 21.6% 18.5% 21.4% 19.4%
Count 1,096 1,343 1,237 971 1,220 1,235 1,632 2,117 2,185 2,246 1,132 784 1,727 2,077 2,507 2,267 2,437 28,213
% within
Year20.6% 16.3% 15.2% 13.6% 16.3% 19.3% 23.2% 25.7% 23.1% 22.5% 16.7% 13.8% 21.9% 19.2% 23.2% 22.3% 22.1% 20.1%
Count 211 401 365 308 528 423 436 672 804 804 606 494 674 1,110 1,115 1,123 967 11,041
% within
Year4.0% 4.9% 4.5% 4.3% 7.1% 6.6% 6.2% 8.1% 8.5% 8.1% 8.9% 8.7% 8.6% 10.2% 10.3% 11.1% 8.8% 7.9%
Count 180 342 287 185 204 143 167 360 423 506 121 92 236 683 551 430 409 5,319
% within
Year3.4% 4.1% 3.5% 2.6% 2.7% 2.2% 2.4% 4.4% 4.5% 5.1% 1.8% 1.6% 3.0% 6.3% 5.1% 4.2% 3.7% 3.8%
Count 133 153 172 217 204 182 216 243 445 448 391 275 342 548 470 371 293 5,103
% within
Year2.5% 1.9% 2.1% 3.0% 2.7% 2.8% 3.1% 2.9% 4.7% 4.5% 5.8% 4.8% 4.3% 5.1% 4.4% 3.7% 2.7% 3.6%
Count 636 1,244 1,567 1,442 1,254 1,272 1,211 1,485 1,500 1,469 1,357 1,359 1,547 1,391 1,441 1,398 1,338 22,911
% within
Year11.9% 15.1% 19.2% 20.2% 16.8% 19.9% 17.2% 18.0% 15.8% 14.7% 20.0% 23.9% 19.7% 12.8% 13.3% 13.8% 12.2% 16.3%
Count 508 1,000 1,084 806 733 548 541 578 598 505 657 455 425 979 828 852 1,094 12,191
% within
Year9.5% 12.1% 13.3% 11.3% 9.8% 8.6% 7.7% 7.0% 6.3% 5.1% 9.7% 8.0% 5.4% 9.0% 7.7% 8.4% 9.9% 8.7%
Count 5,323 8,241 8,152 7,128 7,471 6,386 7,035 8,253 9,473 9,981 6,795 5,691 7,872 10,839 10,796 10,158 11,010 140,604
% within
Year100.0% 100.0% 100.0% 100.0% 100.0% 100.0% 100.0% 100.0% 100.0% 100.0% 100.0% 100.0% 100.0% 100.0% 100.0% 100.0% 100.0% 100.0%
Mpumalanga
Eastern
Cape
Free State
Gauteng
KwaZulu-
Natal
Limpopo
Northern
Cape
North West
Western
Cape
Total
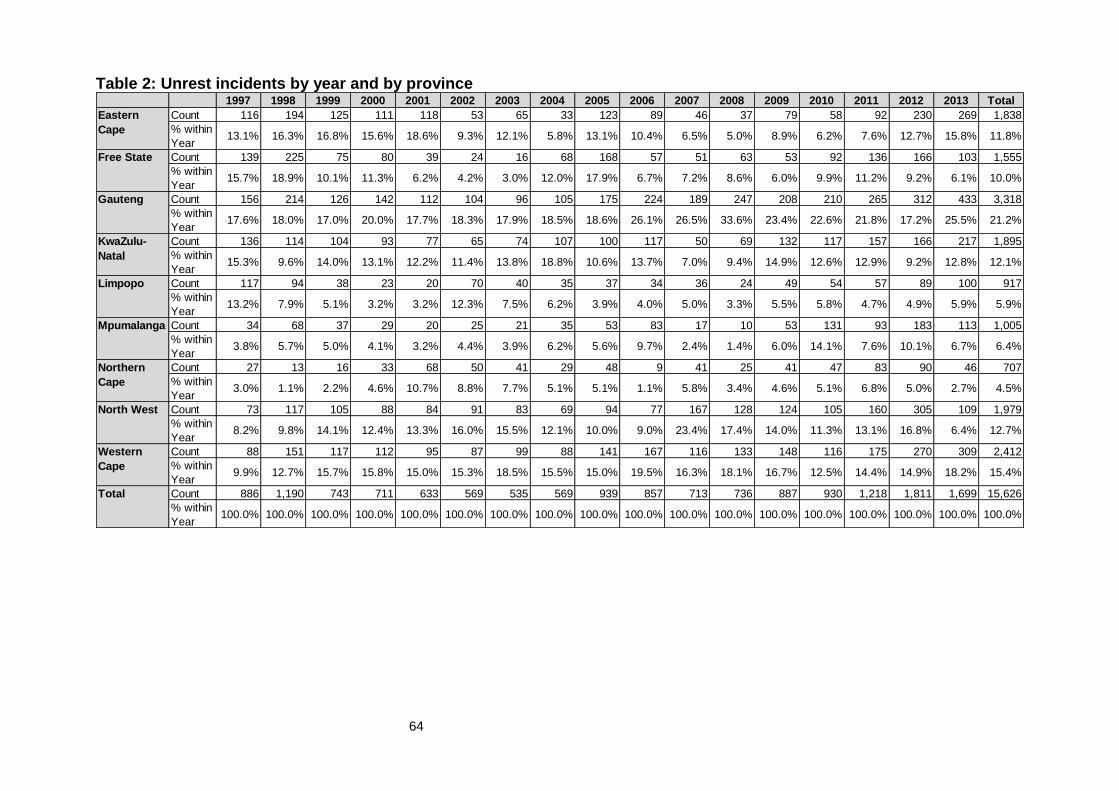
[Type here]
64
Table 2: Unrest incidents by year and by province
1997 1998 1999 2000 2001 2002 2003 2004 2005 2006 2007 2008 2009 2010 2011 2012 2013 Total
Count 116 194 125 111 118 53 65 33 123 89 46 37 79 58 92 230 269 1,838
% within
Year13.1% 16.3% 16.8% 15.6% 18.6% 9.3% 12.1% 5.8% 13.1% 10.4% 6.5% 5.0% 8.9% 6.2% 7.6% 12.7% 15.8% 11.8%
Count 139 225 75 80 39 24 16 68 168 57 51 63 53 92 136 166 103 1,555
% within
Year15.7% 18.9% 10.1% 11.3% 6.2% 4.2% 3.0% 12.0% 17.9% 6.7% 7.2% 8.6% 6.0% 9.9% 11.2% 9.2% 6.1% 10.0%
Count 156 214 126 142 112 104 96 105 175 224 189 247 208 210 265 312 433 3,318
% within
Year17.6% 18.0% 17.0% 20.0% 17.7% 18.3% 17.9% 18.5% 18.6% 26.1% 26.5% 33.6% 23.4% 22.6% 21.8% 17.2% 25.5% 21.2%
Count 136 114 104 93 77 65 74 107 100 117 50 69 132 117 157 166 217 1,895
% within
Year15.3% 9.6% 14.0% 13.1% 12.2% 11.4% 13.8% 18.8% 10.6% 13.7% 7.0% 9.4% 14.9% 12.6% 12.9% 9.2% 12.8% 12.1%
Count 117 94 38 23 20 70 40 35 37 34 36 24 49 54 57 89 100 917
% within
Year13.2% 7.9% 5.1% 3.2% 3.2% 12.3% 7.5% 6.2% 3.9% 4.0% 5.0% 3.3% 5.5% 5.8% 4.7% 4.9% 5.9% 5.9%
Count 34 68 37 29 20 25 21 35 53 83 17 10 53 131 93 183 113 1,005
% within
Year3.8% 5.7% 5.0% 4.1% 3.2% 4.4% 3.9% 6.2% 5.6% 9.7% 2.4% 1.4% 6.0% 14.1% 7.6% 10.1% 6.7% 6.4%
Count 27 13 16 33 68 50 41 29 48 9 41 25 41 47 83 90 46 707
% within
Year3.0% 1.1% 2.2% 4.6% 10.7% 8.8% 7.7% 5.1% 5.1% 1.1% 5.8% 3.4% 4.6% 5.1% 6.8% 5.0% 2.7% 4.5%
Count 73 117 105 88 84 91 83 69 94 77 167 128 124 105 160 305 109 1,979
% within
Year8.2% 9.8% 14.1% 12.4% 13.3% 16.0% 15.5% 12.1% 10.0% 9.0% 23.4% 17.4% 14.0% 11.3% 13.1% 16.8% 6.4% 12.7%
Count 88 151 117 112 95 87 99 88 141 167 116 133 148 116 175 270 309 2,412
% within
Year9.9% 12.7% 15.7% 15.8% 15.0% 15.3% 18.5% 15.5% 15.0% 19.5% 16.3% 18.1% 16.7% 12.5% 14.4% 14.9% 18.2% 15.4%
Count 886 1,190 743 711 633 569 535 569 939 857 713 736 887 930 1,218 1,811 1,699 15,626
% within
Year100.0% 100.0% 100.0% 100.0% 100.0% 100.0% 100.0% 100.0% 100.0% 100.0% 100.0% 100.0% 100.0% 100.0% 100.0% 100.0% 100.0% 100.0%
Total
Eastern
Cape
Free State
Gauteng
KwaZulu-
Natal
Limpopo
Mpumalanga
Northern
Cape
North West
Western
Cape
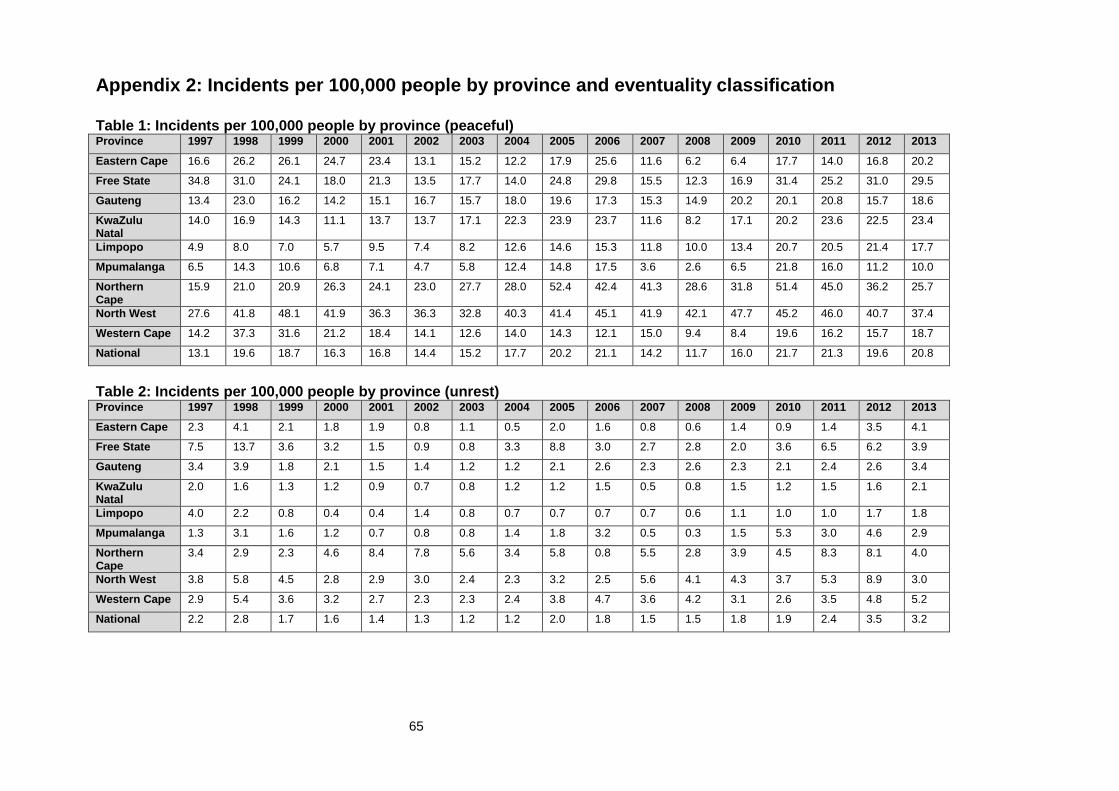
[Type here]
65
Appendix 2: Incidents per 100,000 people by province and eventuality classification Table 1: Incidents per 100,000 people by province (peaceful) Province 1997 1998 1999 2000 2001 2002 2003 2004 2005 2006 2007 2008 2009 2010 2011 2012 2013
Eastern Cape 16.6 26.2 26.1 24.7 23.4 13.1 15.2 12.2 17.9 25.6 11.6 6.2 6.4 17.7 14.0 16.8 20.2
Free State 34.8 31.0 24.1 18.0 21.3 13.5 17.7 14.0 24.8 29.8 15.5 12.3 16.9 31.4 25.2 31.0 29.5
Gauteng 13.4 23.0 16.2 14.2 15.1 16.7 15.7 18.0 19.6 17.3 15.3 14.9 20.2 20.1 20.8 15.7 18.6
KwaZulu Natal
14.0 16.9 14.3 11.1 13.7 13.7 17.1 22.3 23.9 23.7 11.6 8.2 17.1 20.2 23.6 22.5 23.4
Limpopo 4.9 8.0 7.0 5.7 9.5 7.4 8.2 12.6 14.6 15.3 11.8 10.0 13.4 20.7 20.5 21.4 17.7
Mpumalanga 6.5 14.3 10.6 6.8 7.1 4.7 5.8 12.4 14.8 17.5 3.6 2.6 6.5 21.8 16.0 11.2 10.0
Northern Cape
15.9 21.0 20.9 26.3 24.1 23.0 27.7 28.0 52.4 42.4 41.3 28.6 31.8 51.4 45.0 36.2 25.7
North West 27.6 41.8 48.1 41.9 36.3 36.3 32.8 40.3 41.4 45.1 41.9 42.1 47.7 45.2 46.0 40.7 37.4
Western Cape 14.2 37.3 31.6 21.2 18.4 14.1 12.6 14.0 14.3 12.1 15.0 9.4 8.4 19.6 16.2 15.7 18.7
National 13.1 19.6 18.7 16.3 16.8 14.4 15.2 17.7 20.2 21.1 14.2 11.7 16.0 21.7 21.3 19.6 20.8
Table 2: Incidents per 100,000 people by province (unrest) Province 1997 1998 1999 2000 2001 2002 2003 2004 2005 2006 2007 2008 2009 2010 2011 2012 2013
Eastern Cape 2.3 4.1 2.1 1.8 1.9 0.8 1.1 0.5 2.0 1.6 0.8 0.6 1.4 0.9 1.4 3.5 4.1
Free State 7.5 13.7 3.6 3.2 1.5 0.9 0.8 3.3 8.8 3.0 2.7 2.8 2.0 3.6 6.5 6.2 3.9
Gauteng 3.4 3.9 1.8 2.1 1.5 1.4 1.2 1.2 2.1 2.6 2.3 2.6 2.3 2.1 2.4 2.6 3.4
KwaZulu Natal
2.0 1.6 1.3 1.2 0.9 0.7 0.8 1.2 1.2 1.5 0.5 0.8 1.5 1.2 1.5 1.6 2.1
Limpopo 4.0 2.2 0.8 0.4 0.4 1.4 0.8 0.7 0.7 0.7 0.7 0.6 1.1 1.0 1.0 1.7 1.8
Mpumalanga 1.3 3.1 1.6 1.2 0.7 0.8 0.8 1.4 1.8 3.2 0.5 0.3 1.5 5.3 3.0 4.6 2.9
Northern Cape
3.4 2.9 2.3 4.6 8.4 7.8 5.6 3.4 5.8 0.8 5.5 2.8 3.9 4.5 8.3 8.1 4.0
North West 3.8 5.8 4.5 2.8 2.9 3.0 2.4 2.3 3.2 2.5 5.6 4.1 4.3 3.7 5.3 8.9 3.0
Western Cape 2.9 5.4 3.6 3.2 2.7 2.3 2.3 2.4 3.8 4.7 3.6 4.2 3.1 2.6 3.5 4.8 5.2
National 2.2 2.8 1.7 1.6 1.4 1.3 1.2 1.2 2.0 1.8 1.5 1.5 1.8 1.9 2.4 3.5 3.2
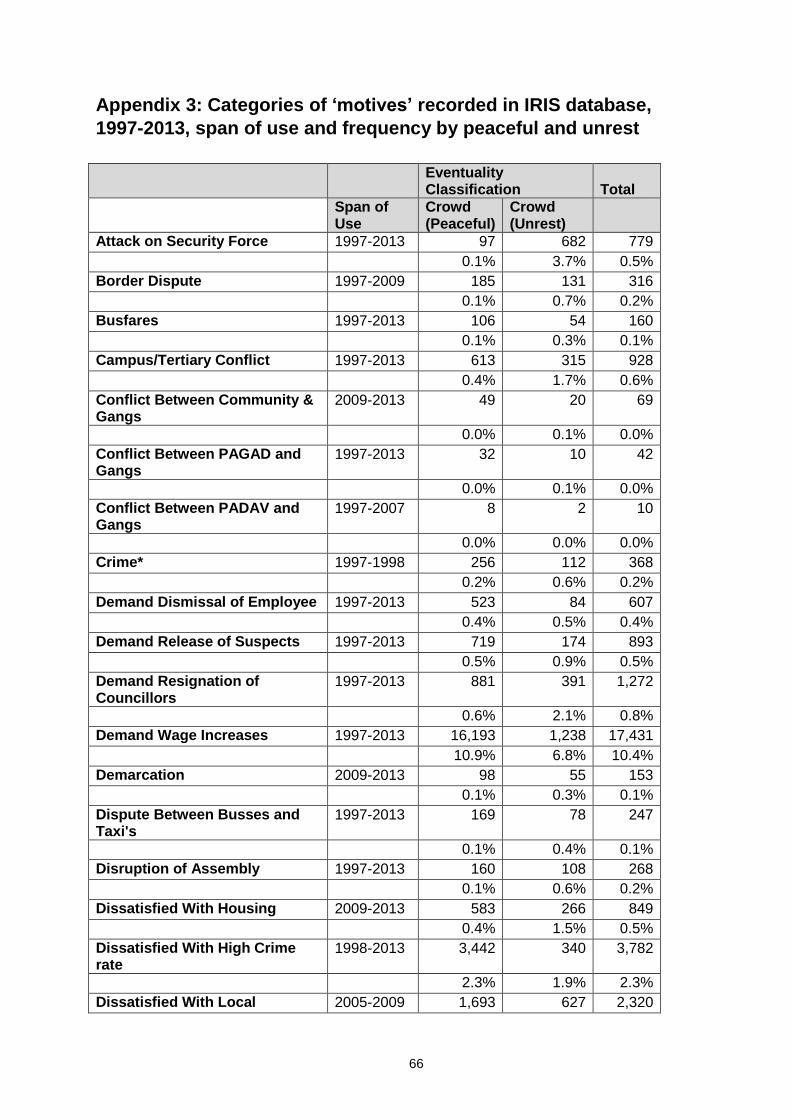
[Type here]
66
Appendix 3: Categories of ‘motives’ recorded in IRIS database,
1997-2013, span of use and frequency by peaceful and unrest
Eventuality Classification Total
Span of Use
Crowd (Peaceful)
Crowd (Unrest)
Attack on Security Force 1997-2013 97 682 779
0.1% 3.7% 0.5%
Border Dispute 1997-2009 185 131 316
0.1% 0.7% 0.2%
Busfares 1997-2013 106 54 160
0.1% 0.3% 0.1%
Campus/Tertiary Conflict 1997-2013 613 315 928
0.4% 1.7% 0.6%
Conflict Between Community & Gangs
2009-2013 49 20 69
0.0% 0.1% 0.0%
Conflict Between PAGAD and Gangs
1997-2013 32 10 42
0.0% 0.1% 0.0%
Conflict Between PADAV and Gangs
1997-2007 8 2 10
0.0% 0.0% 0.0%
Crime* 1997-1998 256 112 368
0.2% 0.6% 0.2%
Demand Dismissal of Employee 1997-2013 523 84 607
0.4% 0.5% 0.4%
Demand Release of Suspects 1997-2013 719 174 893
0.5% 0.9% 0.5%
Demand Resignation of Councillors
1997-2013 881 391 1,272
0.6% 2.1% 0.8%
Demand Wage Increases 1997-2013 16,193 1,238 17,431
10.9% 6.8% 10.4%
Demarcation 2009-2013 98 55 153
0.1% 0.3% 0.1%
Dispute Between Busses and Taxi's
1997-2013 169 78 247
0.1% 0.4% 0.1%
Disruption of Assembly 1997-2013 160 108 268
0.1% 0.6% 0.2%
Dissatisfied With Housing 2009-2013 583 266 849
0.4% 1.5% 0.5%
Dissatisfied With High Crime rate
1998-2013 3,442 340 3,782
2.3% 1.9% 2.3%
Dissatisfied With Local 2005-2009 1,693 627 2,320
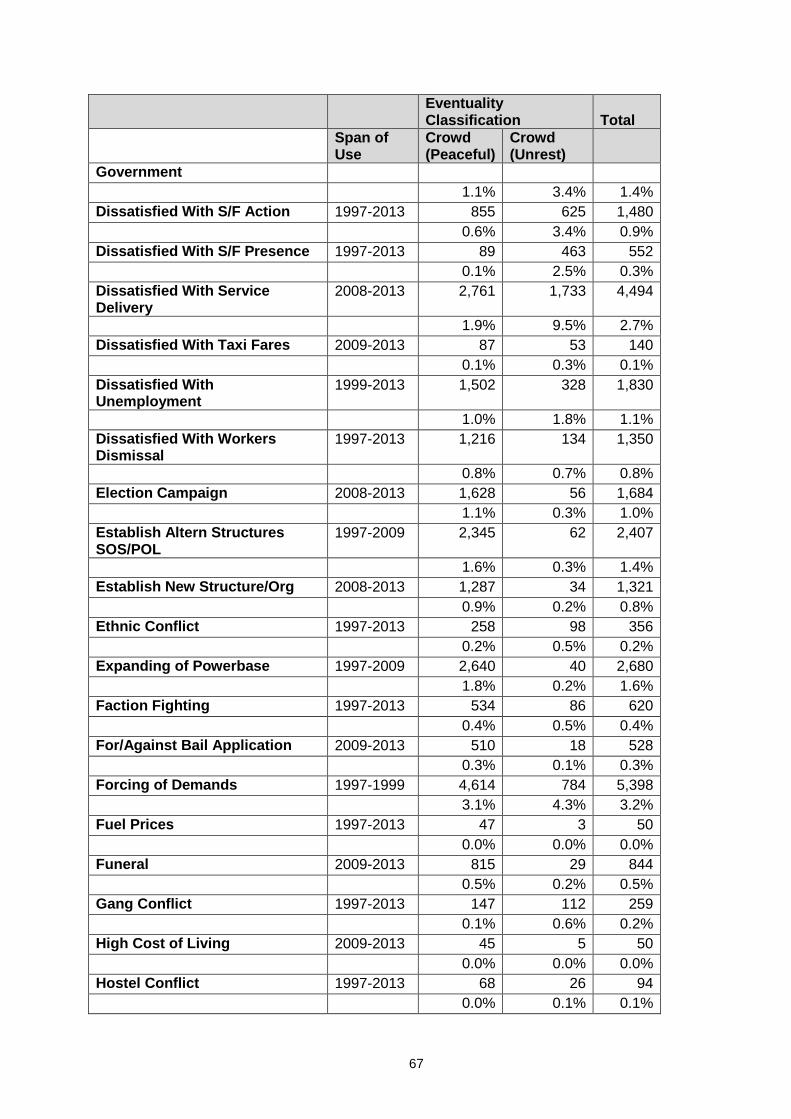
[Type here]
67
Eventuality Classification Total
Span of Use
Crowd (Peaceful)
Crowd (Unrest)
Government
1.1% 3.4% 1.4%
Dissatisfied With S/F Action 1997-2013 855 625 1,480
0.6% 3.4% 0.9%
Dissatisfied With S/F Presence 1997-2013 89 463 552
0.1% 2.5% 0.3%
Dissatisfied With Service Delivery
2008-2013 2,761 1,733 4,494
1.9% 9.5% 2.7%
Dissatisfied With Taxi Fares 2009-2013 87 53 140
0.1% 0.3% 0.1%
Dissatisfied With Unemployment
1999-2013 1,502 328 1,830
1.0% 1.8% 1.1%
Dissatisfied With Workers Dismissal
1997-2013 1,216 134 1,350
0.8% 0.7% 0.8%
Election Campaign 2008-2013 1,628 56 1,684
1.1% 0.3% 1.0%
Establish Altern Structures SOS/POL
1997-2009 2,345 62 2,407
1.6% 0.3% 1.4%
Establish New Structure/Org 2008-2013 1,287 34 1,321
0.9% 0.2% 0.8%
Ethnic Conflict 1997-2013 258 98 356
0.2% 0.5% 0.2%
Expanding of Powerbase 1997-2009 2,640 40 2,680
1.8% 0.2% 1.6%
Faction Fighting 1997-2013 534 86 620
0.4% 0.5% 0.4%
For/Against Bail Application 2009-2013 510 18 528
0.3% 0.1% 0.3%
Forcing of Demands 1997-1999 4,614 784 5,398
3.1% 4.3% 3.2%
Fuel Prices 1997-2013 47 3 50
0.0% 0.0% 0.0%
Funeral 2009-2013 815 29 844
0.5% 0.2% 0.5%
Gang Conflict 1997-2013 147 112 259
0.1% 0.6% 0.2%
High Cost of Living 2009-2013 45 5 50
0.0% 0.0% 0.0%
Hostel Conflict 1997-2013 68 26 94
0.0% 0.1% 0.1%
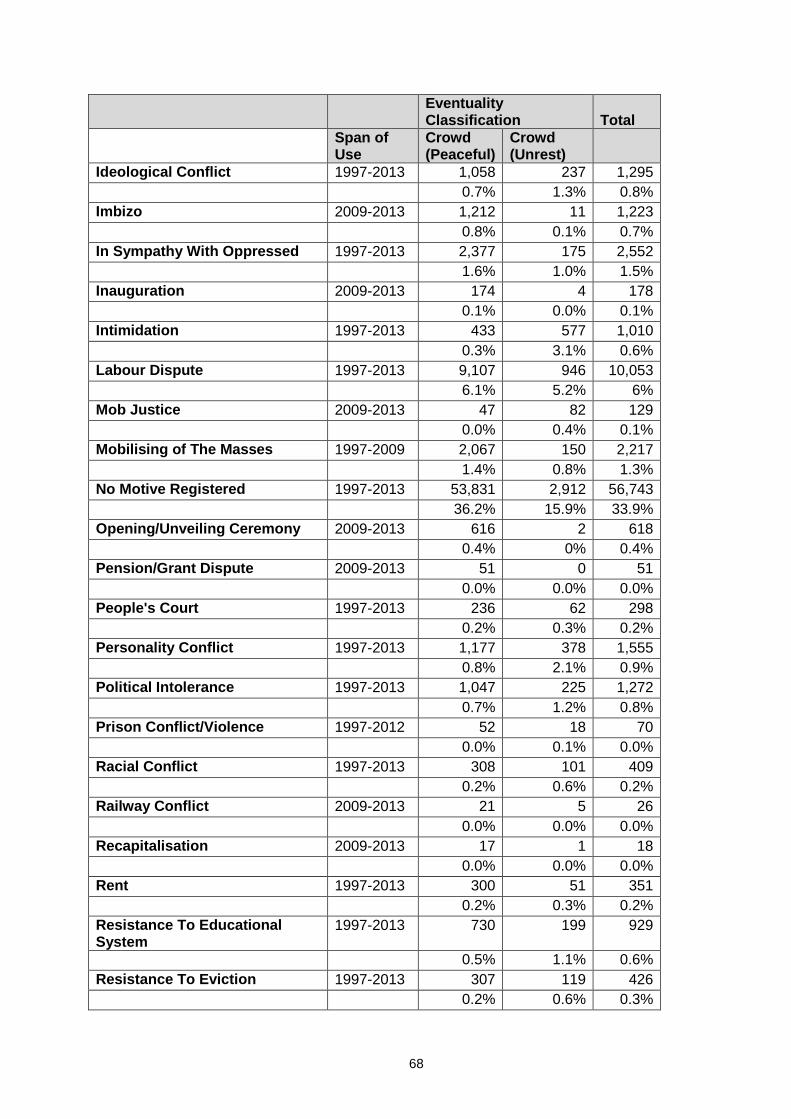
[Type here]
68
Eventuality Classification Total
Span of Use
Crowd (Peaceful)
Crowd (Unrest)
Ideological Conflict 1997-2013 1,058 237 1,295
0.7% 1.3% 0.8%
Imbizo 2009-2013 1,212 11 1,223
0.8% 0.1% 0.7%
In Sympathy With Oppressed 1997-2013 2,377 175 2,552
1.6% 1.0% 1.5%
Inauguration 2009-2013 174 4 178
0.1% 0.0% 0.1%
Intimidation 1997-2013 433 577 1,010
0.3% 3.1% 0.6%
Labour Dispute 1997-2013 9,107 946 10,053
6.1% 5.2% 6%
Mob Justice 2009-2013 47 82 129
0.0% 0.4% 0.1%
Mobilising of The Masses 1997-2009 2,067 150 2,217
1.4% 0.8% 1.3%
No Motive Registered 1997-2013 53,831 2,912 56,743
36.2% 15.9% 33.9%
Opening/Unveiling Ceremony 2009-2013 616 2 618
0.4% 0% 0.4%
Pension/Grant Dispute 2009-2013 51 0 51
0.0% 0.0% 0.0%
People's Court 1997-2013 236 62 298
0.2% 0.3% 0.2%
Personality Conflict 1997-2013 1,177 378 1,555
0.8% 2.1% 0.9%
Political Intolerance 1997-2013 1,047 225 1,272
0.7% 1.2% 0.8%
Prison Conflict/Violence 1997-2012 52 18 70
0.0% 0.1% 0.0%
Racial Conflict 1997-2013 308 101 409
0.2% 0.6% 0.2%
Railway Conflict 2009-2013 21 5 26
0.0% 0.0% 0.0%
Recapitalisation 2009-2013 17 1 18
0.0% 0.0% 0.0%
Rent 1997-2013 300 51 351
0.2% 0.3% 0.2%
Resistance To Educational System
1997-2013 730 199 929
0.5% 1.1% 0.6%
Resistance To Eviction 1997-2013 307 119 426
0.2% 0.6% 0.3%
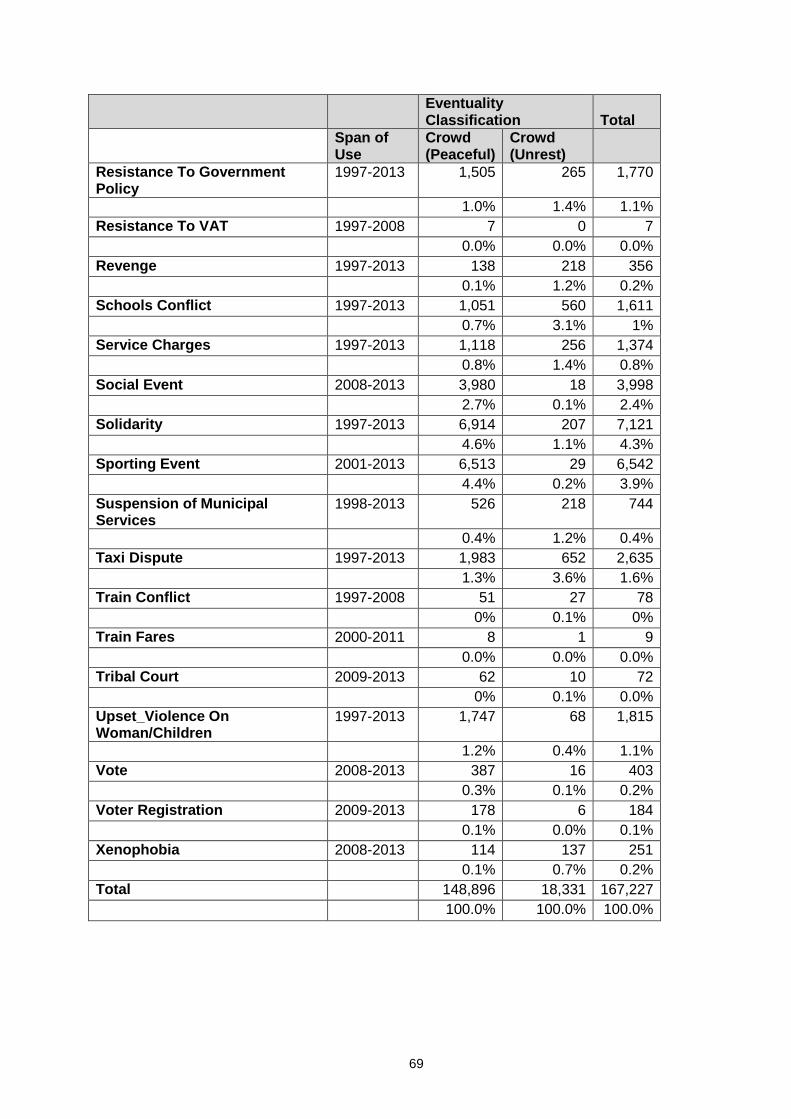
[Type here]
69
Eventuality Classification Total
Span of Use
Crowd (Peaceful)
Crowd (Unrest)
Resistance To Government Policy
1997-2013 1,505 265 1,770
1.0% 1.4% 1.1%
Resistance To VAT 1997-2008 7 0 7
0.0% 0.0% 0.0%
Revenge 1997-2013 138 218 356
0.1% 1.2% 0.2%
Schools Conflict 1997-2013 1,051 560 1,611
0.7% 3.1% 1%
Service Charges 1997-2013 1,118 256 1,374
0.8% 1.4% 0.8%
Social Event 2008-2013 3,980 18 3,998
2.7% 0.1% 2.4%
Solidarity 1997-2013 6,914 207 7,121
4.6% 1.1% 4.3%
Sporting Event 2001-2013 6,513 29 6,542
4.4% 0.2% 3.9%
Suspension of Municipal Services
1998-2013 526 218 744
0.4% 1.2% 0.4%
Taxi Dispute 1997-2013 1,983 652 2,635
1.3% 3.6% 1.6%
Train Conflict 1997-2008 51 27 78
0% 0.1% 0%
Train Fares 2000-2011 8 1 9
0.0% 0.0% 0.0%
Tribal Court 2009-2013 62 10 72
0% 0.1% 0.0%
Upset_Violence On Woman/Children
1997-2013 1,747 68 1,815
1.2% 0.4% 1.1%
Vote 2008-2013 387 16 403
0.3% 0.1% 0.2%
Voter Registration 2009-2013 178 6 184
0.1% 0.0% 0.1%
Xenophobia 2008-2013 114 137 251
0.1% 0.7% 0.2%
Total 148,896 18,331 167,227
100.0% 100.0% 100.0%
[Type here]
70
Appendix 4: Definitions and examples of 28 most widely cited
categories of ‘motives’ (excluding no motive registered), 1997-2013
Appendix 4 is available to download from
http://www.uj.ac.za/EN/Faculties/humanities/Research-
Centres/South%20Africa%20Research%20Chair%20in%20Social%20Change/Page
s/home.aspx

[Type here]
71
Appendix 5: 5 most commonly used motive options by province (excluding no motive registered), 1997-2008 and 2009-2013 1997-2008
2009-2013
Province Peaceful % Unrest % Peaceful % Unrest %
Eastern Cape
Demand Wage Increases
18 Forcing of Demands
8 Demand Wage Increases
26 Dissatisfied With Service Delivery
26
Labour Dispute 12 Dissatisfied With Local Government
7 Labour Dispute
8 Dissatisfied With Housing 8
Forcing of Demands 5 Labour Dispute 7 Sporting Event
5 Demand Wage Increases 7
Solidarity 4 Intimidation 6 Social Event 5 Labour Dispute 6
Dissatisfied With High Crime Rate
2 Schools Conflict 5 Dissatisfied With Service Delivery
4 Schools Conflict 5
Free State
Demand Wage Increases
11 Dissatisfied With Local Government
9 Demand Wage Increases
16 Dissatisfied With Service Delivery
31
Labour Dispute 9 Forcing of Demands & Intimidation
9 Sporting Event
14 In Sympathy With Oppressed
7
In Sympathy With Oppressed
9 Dissatisfied With S/F Presence
8 Labour Dispute
8 Demand Wage Increases 7
Forcing of Demands 8 Schools Conflict 7 In Sympathy With Oppressed
7 Labour Dispute 6
Solidarity 6 Service Charges 6 Dissatisfied With Service Delivery
6 Schools Conflict 4
Gauteng
Labour Dispute 7 Labour Dispute 8 Demand Wage Increases
13 Dissatisfied With Service Delivery
27

[Type here]
72
1997-2008
2009-2013
Sporting Event 6 Demand Wage Increases
7 Sporting Event
9 Demand Wage Increases 10
Demand Wage Increases
6 Forcing of Demands
6 Social Event 6 Dissatisfied With Housing 5
Solidarity 5 Dissatisfied With Local Government
6 Dissatisfied With Service Delivery
6 Labour Dispute 4
Forcing of Demands 5 Taxi Dispute 5 Labour Dispute
5 Dissatisfied With High Crime Rate
3
KwaZulu- Natal
Solidarity 9 Taxi Dispute 9 Social Event 10 Dissatisfied With Service Delivery
18
Demand Wage Increases
6 Labour Dispute 7 Demand Wage Increases
10 Demand Wage Increases 10
Expanding of Powerbase
4 Demand Wage Increases
6 Election Campaign
6 Campus/Tertiary Conflict 6
Labour Dispute 4 Campus/Tertiary Conflict
5 Funeral 5 5 Taxi Dispute 5
Taxi Dispute 3 Forcing of Demands
5 Dissatisfied With Service Delivery
4 Dissatisfied With Taxi Fares 4
Limpopo
Demand Wage Increases
7 Forcing of Demands
13 Demand of Wage Increases
15 Dissatisfied With Service Delivery
12
Dissatisfied With High Crime Rate
5 Border Dispute 11 Social Event 8 Demand Wage Increases 8
Solidarity 4 Taxi Dispute 5 Dissatisfied With Service Delivery
5 Labour Dispute 6
Sporting Event 4 Dissatisfied With High Crime Rate
5 Sporting Event
4 Dissatisfied With High Crime Rate
6
Forcing of Demands 3 Schools Conflict 4 Imbizo 3 Dissatisfied With Unemployment
4
Mpumalanga
Mobilising of the Masses
15 Forcing of Demands & Taxi
10 Demand Wage
20 Dissatisfied With Service Delivery
39
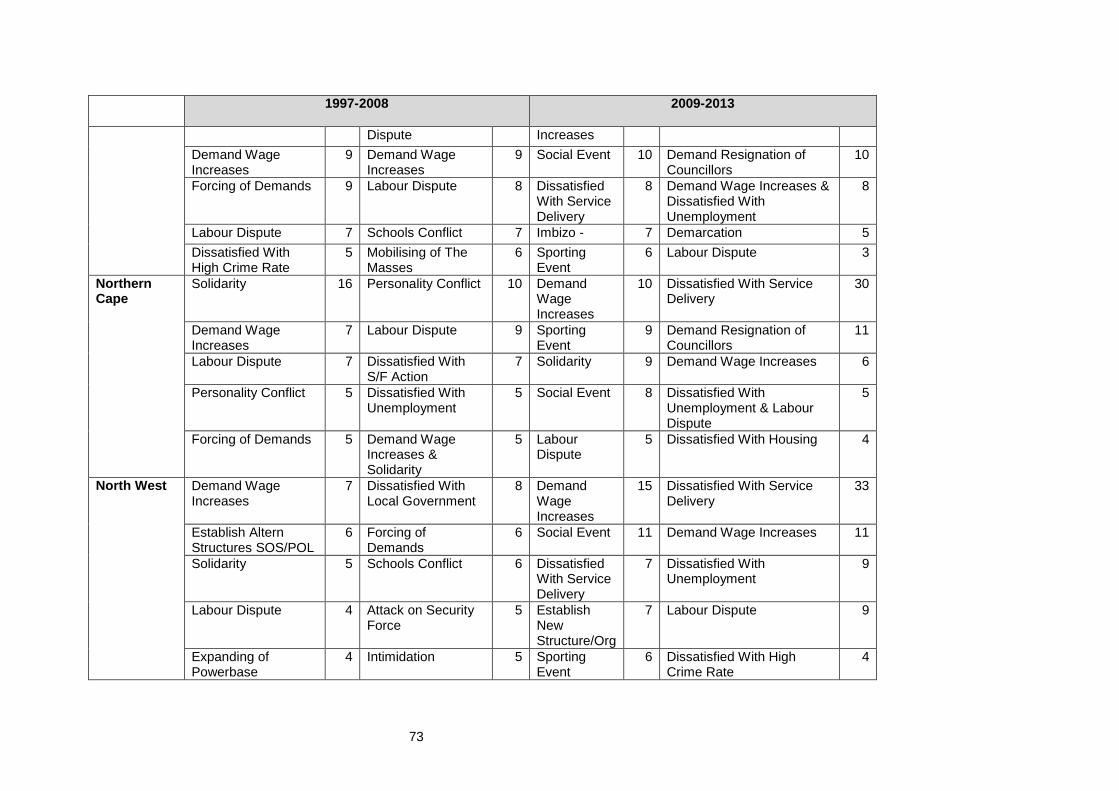
[Type here]
73
1997-2008
2009-2013
Dispute Increases
Demand Wage Increases
9 Demand Wage Increases
9 Social Event 10 Demand Resignation of Councillors
10
Forcing of Demands 9 Labour Dispute 8 Dissatisfied With Service Delivery
8 Demand Wage Increases & Dissatisfied With Unemployment
8
Labour Dispute 7 Schools Conflict 7 Imbizo - 7 Demarcation 5
Dissatisfied With High Crime Rate
5 Mobilising of The Masses
6 Sporting Event
6 Labour Dispute 3
Northern Cape
Solidarity 16 Personality Conflict 10 Demand Wage Increases
10 Dissatisfied With Service Delivery
30
Demand Wage Increases
7 Labour Dispute 9 Sporting Event
9 Demand Resignation of Councillors
11
Labour Dispute 7 Dissatisfied With S/F Action
7 Solidarity
9 Demand Wage Increases 6
Personality Conflict 5 Dissatisfied With Unemployment
5 Social Event 8 Dissatisfied With Unemployment & Labour Dispute
5
Forcing of Demands 5 Demand Wage Increases & Solidarity
5 Labour Dispute
5 Dissatisfied With Housing 4
North West
Demand Wage Increases
7 Dissatisfied With Local Government
8 Demand Wage Increases
15 Dissatisfied With Service Delivery
33
Establish Altern Structures SOS/POL
6 Forcing of Demands
6 Social Event 11 Demand Wage Increases 11
Solidarity 5 Schools Conflict 6 Dissatisfied With Service Delivery
7 Dissatisfied With Unemployment
9
Labour Dispute 4 Attack on Security Force
5 Establish New Structure/Org
7 Labour Dispute 9
Expanding of Powerbase
4 Intimidation 5 Sporting Event
6 Dissatisfied With High Crime Rate
4
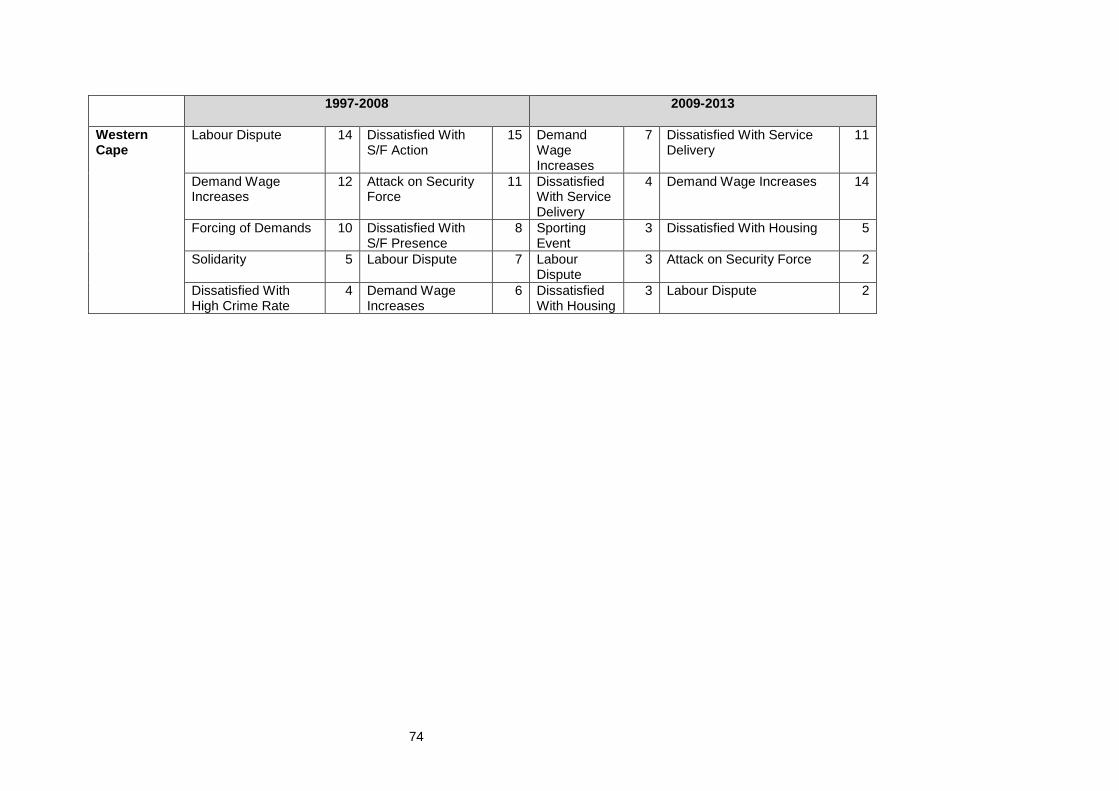
[Type here]
74
1997-2008
2009-2013
Western Cape
Labour Dispute 14 Dissatisfied With S/F Action
15 Demand Wage Increases
7 Dissatisfied With Service Delivery
11
Demand Wage Increases
12 Attack on Security Force
11 Dissatisfied With Service Delivery
4 Demand Wage Increases 14
Forcing of Demands 10 Dissatisfied With S/F Presence
8 Sporting Event
3 Dissatisfied With Housing 5
Solidarity 5 Labour Dispute 7 Labour Dispute
3 Attack on Security Force 2
Dissatisfied With High Crime Rate
4 Demand Wage Increases
6 Dissatisfied With Housing
3 Labour Dispute 2
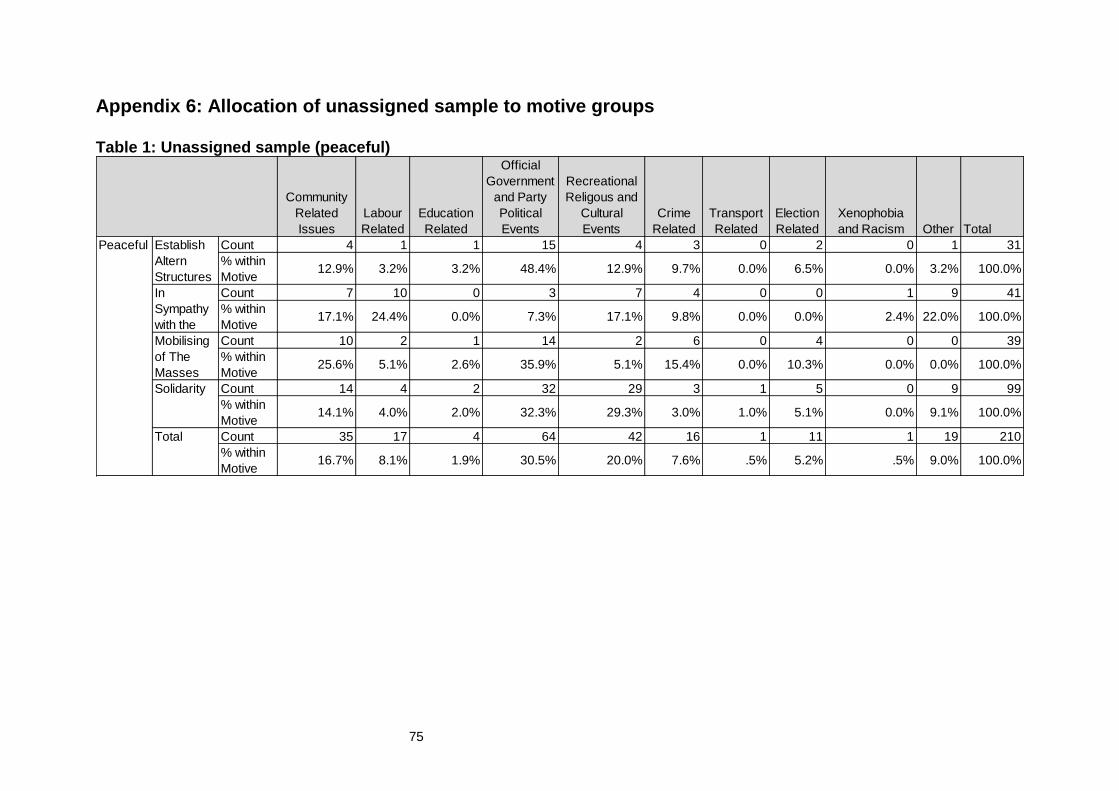
[Type here]
75
Appendix 6: Allocation of unassigned sample to motive groups Table 1: Unassigned sample (peaceful)
Community
Related
Issues
Labour
Related
Education
Related
Official
Government
and Party
Political
Events
Recreational
Religous and
Cultural
Events
Crime
Related
Transport
Related
Election
Related
Xenophobia
and Racism Other Total
Count 4 1 1 15 4 3 0 2 0 1 31
% within
Motive12.9% 3.2% 3.2% 48.4% 12.9% 9.7% 0.0% 6.5% 0.0% 3.2% 100.0%
Count 7 10 0 3 7 4 0 0 1 9 41
% within
Motive17.1% 24.4% 0.0% 7.3% 17.1% 9.8% 0.0% 0.0% 2.4% 22.0% 100.0%
Count 10 2 1 14 2 6 0 4 0 0 39
% within
Motive25.6% 5.1% 2.6% 35.9% 5.1% 15.4% 0.0% 10.3% 0.0% 0.0% 100.0%
Count 14 4 2 32 29 3 1 5 0 9 99
% within
Motive14.1% 4.0% 2.0% 32.3% 29.3% 3.0% 1.0% 5.1% 0.0% 9.1% 100.0%
Count 35 17 4 64 42 16 1 11 1 19 210
% within
Motive16.7% 8.1% 1.9% 30.5% 20.0% 7.6% .5% 5.2% .5% 9.0% 100.0%
Total
Peaceful Establish
Altern
Structures
In
Sympathy
with the
Mobilising
of The
Masses
Solidarity

[Type here]
76
Table 2: Unassigned sample (unrest)
Community
Related
Issues
Labour
Related
Education
Related
Official
Government
and Party
Political
Events
Recreational
Religous and
Cultural
Events
Crime
Related
Transport
Related
Election
Related
Xenophobia
and Racism Other Total
Count 8 1 2 0 0 5 1 0 0 1 18
% within
Motive44.4% 5.6% 11.1% 0.0% 0.0% 27.8% 5.6% 0.0% 0.0% 5.6% 100.0%
Count 7 9 1 1 0 6 0 1 1 5 31
% within
Motive22.6% 29.0% 3.2% 3.2% 0.0% 19.4% 0.0% 3.2% 3.2% 16.1% 100.0%
Count 17 2 4 2 2 11 1 0 0 2 41
% within
Motive41.5% 4.9% 9.8% 4.9% 4.9% 26.8% 2.4% 0.0% 0.0% 4.9% 100.0%
Count 11 5 6 3 1 17 2 0 1 4 50
% within
Motive22.0% 10.0% 12.0% 6.0% 2.0% 34.0% 4.0% 0.0% 2.0% 8.0% 100.0%
Count 43 17 13 6 3 39 4 1 2 12 140
% within
Motive30.7% 12.1% 9.3% 4.3% 2.1% 27.9% 2.9% .7% 1.4% 8.6% 100.0%
Unrest Establish
Altern
Structures
In
Sympathy
with the
Mobilising
of The
Masses
Solidarity
Total
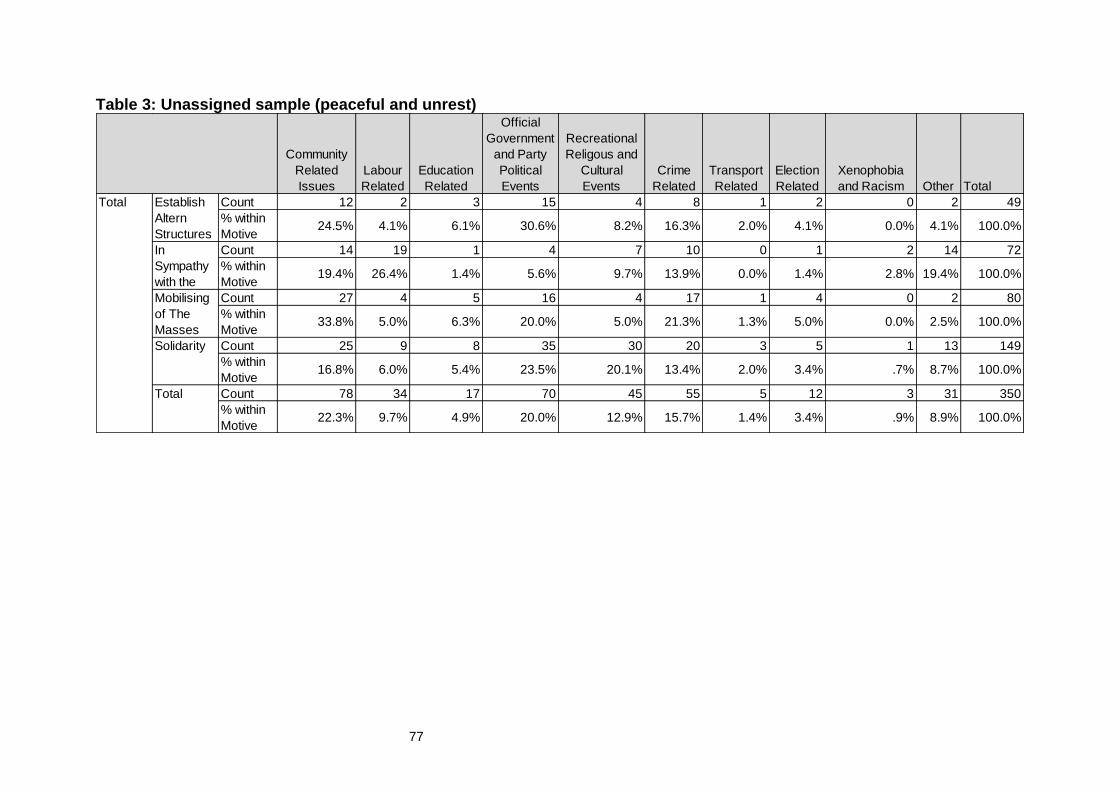
[Type here]
77
Table 3: Unassigned sample (peaceful and unrest)
Community
Related
Issues
Labour
Related
Education
Related
Official
Government
and Party
Political
Events
Recreational
Religous and
Cultural
Events
Crime
Related
Transport
Related
Election
Related
Xenophobia
and Racism Other Total
Count 12 2 3 15 4 8 1 2 0 2 49
% within
Motive24.5% 4.1% 6.1% 30.6% 8.2% 16.3% 2.0% 4.1% 0.0% 4.1% 100.0%
Count 14 19 1 4 7 10 0 1 2 14 72
% within
Motive19.4% 26.4% 1.4% 5.6% 9.7% 13.9% 0.0% 1.4% 2.8% 19.4% 100.0%
Count 27 4 5 16 4 17 1 4 0 2 80
% within
Motive33.8% 5.0% 6.3% 20.0% 5.0% 21.3% 1.3% 5.0% 0.0% 2.5% 100.0%
Count 25 9 8 35 30 20 3 5 1 13 149
% within
Motive16.8% 6.0% 5.4% 23.5% 20.1% 13.4% 2.0% 3.4% .7% 8.7% 100.0%
Count 78 34 17 70 45 55 5 12 3 31 350
% within
Motive22.3% 9.7% 4.9% 20.0% 12.9% 15.7% 1.4% 3.4% .9% 8.9% 100.0%
Total Establish
Altern
Structures
In
Sympathy
with the
Mobilising
of The
Masses
Solidarity
Total
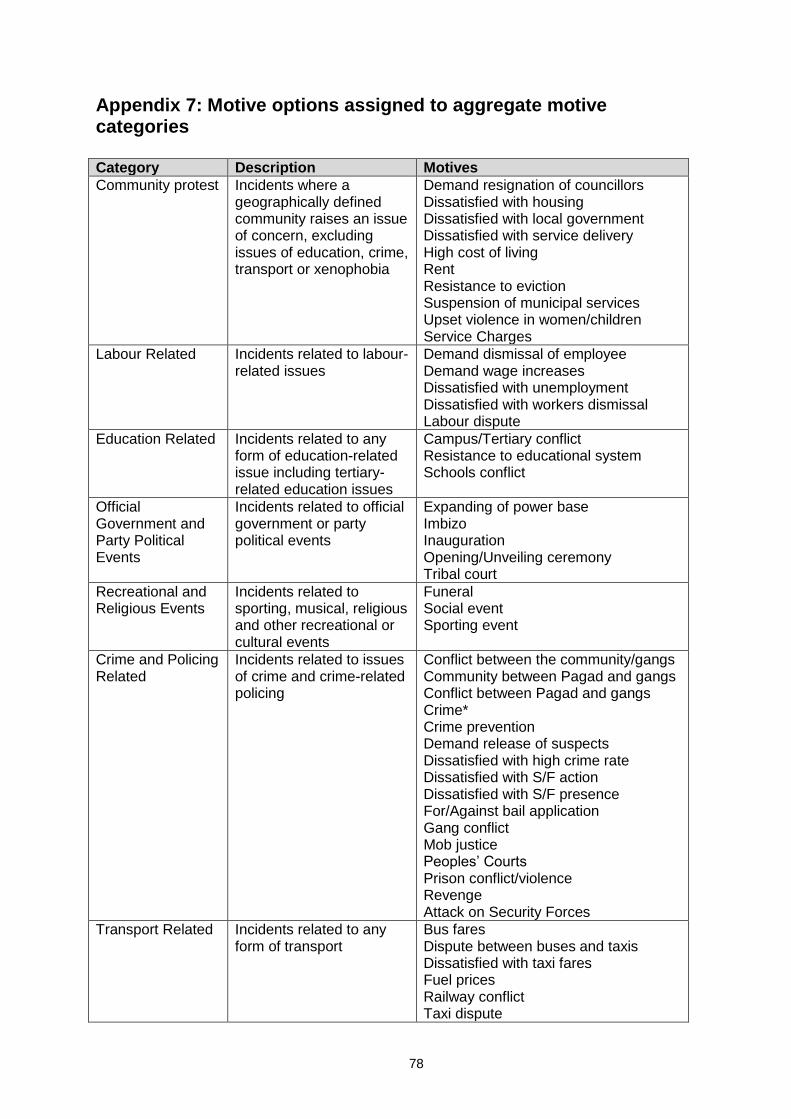
[Type here]
78
Appendix 7: Motive options assigned to aggregate motive categories Category Description Motives
Community protest Incidents where a geographically defined community raises an issue of concern, excluding issues of education, crime, transport or xenophobia
Demand resignation of councillors Dissatisfied with housing Dissatisfied with local government Dissatisfied with service delivery High cost of living Rent Resistance to eviction Suspension of municipal services Upset violence in women/children Service Charges
Labour Related Incidents related to labour-related issues
Demand dismissal of employee Demand wage increases Dissatisfied with unemployment Dissatisfied with workers dismissal Labour dispute
Education Related Incidents related to any form of education-related issue including tertiary-related education issues
Campus/Tertiary conflict Resistance to educational system Schools conflict
Official Government and Party Political Events
Incidents related to official government or party political events
Expanding of power base Imbizo Inauguration Opening/Unveiling ceremony Tribal court
Recreational and Religious Events
Incidents related to sporting, musical, religious and other recreational or cultural events
Funeral Social event Sporting event
Crime and Policing Related
Incidents related to issues of crime and crime-related policing
Conflict between the community/gangs Community between Pagad and gangs Conflict between Pagad and gangs Crime* Crime prevention Demand release of suspects Dissatisfied with high crime rate Dissatisfied with S/F action Dissatisfied with S/F presence For/Against bail application Gang conflict Mob justice Peoples’ Courts Prison conflict/violence Revenge Attack on Security Forces
Transport Related Incidents related to any form of transport
Bus fares Dispute between buses and taxis Dissatisfied with taxi fares Fuel prices Railway conflict Taxi dispute
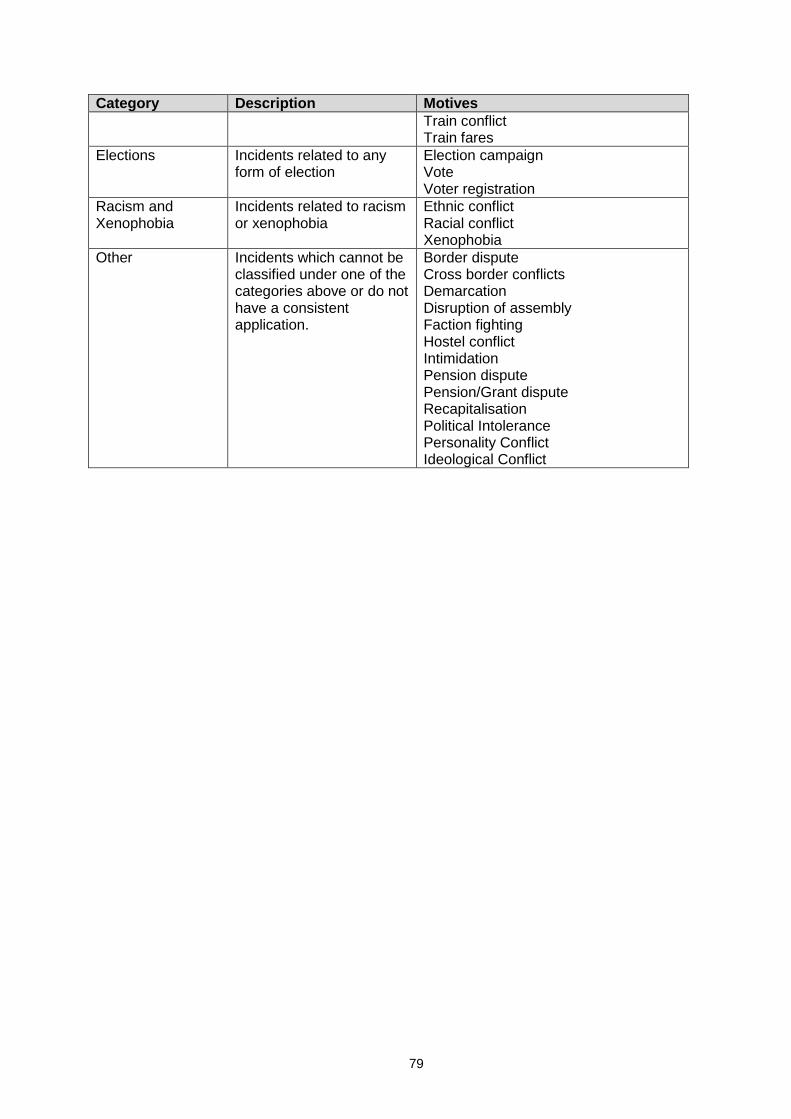
[Type here]
79
Category Description Motives
Train conflict Train fares
Elections Incidents related to any form of election
Election campaign Vote Voter registration
Racism and Xenophobia
Incidents related to racism or xenophobia
Ethnic conflict Racial conflict Xenophobia
Other Incidents which cannot be classified under one of the categories above or do not have a consistent application.
Border dispute Cross border conflicts Demarcation Disruption of assembly Faction fighting Hostel conflict Intimidation Pension dispute Pension/Grant dispute Recapitalisation Political Intolerance Personality Conflict Ideological Conflict
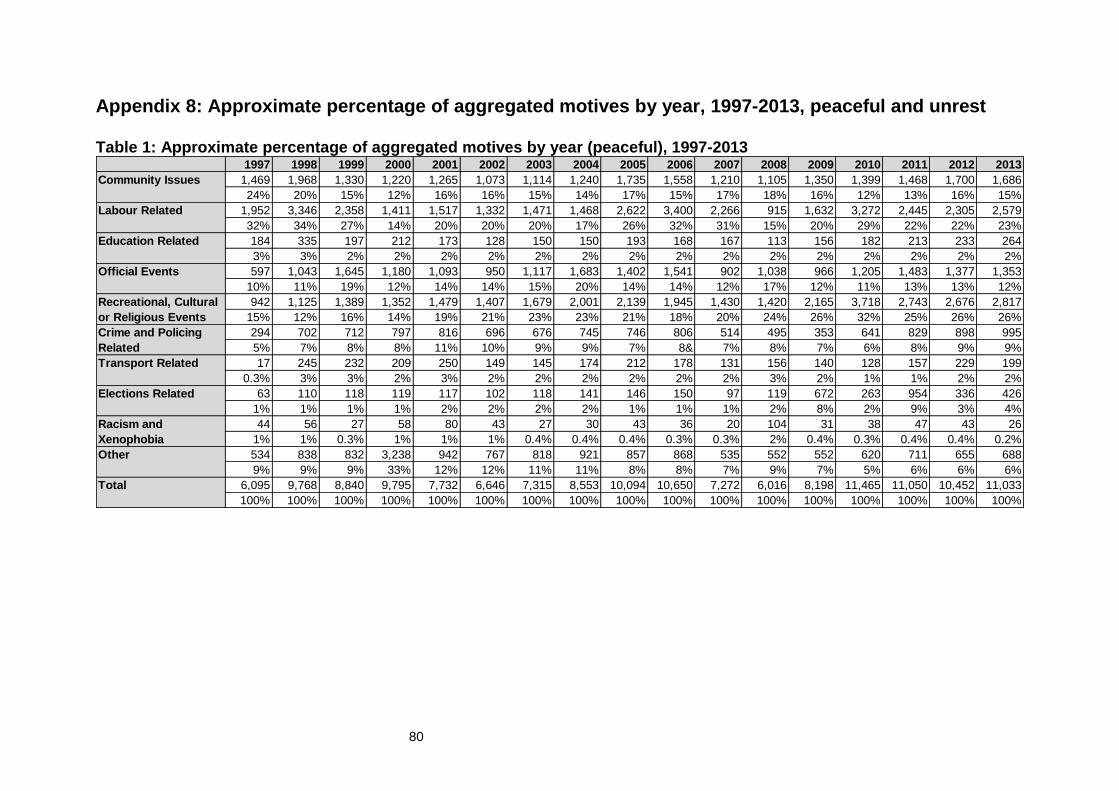
[Type here]
80
Appendix 8: Approximate percentage of aggregated motives by year, 1997-2013, peaceful and unrest Table 1: Approximate percentage of aggregated motives by year (peaceful), 1997-2013
1997 1998 1999 2000 2001 2002 2003 2004 2005 2006 2007 2008 2009 2010 2011 2012 2013
1,469 1,968 1,330 1,220 1,265 1,073 1,114 1,240 1,735 1,558 1,210 1,105 1,350 1,399 1,468 1,700 1,686
24% 20% 15% 12% 16% 16% 15% 14% 17% 15% 17% 18% 16% 12% 13% 16% 15%
1,952 3,346 2,358 1,411 1,517 1,332 1,471 1,468 2,622 3,400 2,266 915 1,632 3,272 2,445 2,305 2,579
32% 34% 27% 14% 20% 20% 20% 17% 26% 32% 31% 15% 20% 29% 22% 22% 23%
184 335 197 212 173 128 150 150 193 168 167 113 156 182 213 233 264
3% 3% 2% 2% 2% 2% 2% 2% 2% 2% 2% 2% 2% 2% 2% 2% 2%
597 1,043 1,645 1,180 1,093 950 1,117 1,683 1,402 1,541 902 1,038 966 1,205 1,483 1,377 1,353
10% 11% 19% 12% 14% 14% 15% 20% 14% 14% 12% 17% 12% 11% 13% 13% 12%
942 1,125 1,389 1,352 1,479 1,407 1,679 2,001 2,139 1,945 1,430 1,420 2,165 3,718 2,743 2,676 2,817
15% 12% 16% 14% 19% 21% 23% 23% 21% 18% 20% 24% 26% 32% 25% 26% 26%
294 702 712 797 816 696 676 745 746 806 514 495 353 641 829 898 995
5% 7% 8% 8% 11% 10% 9% 9% 7% 8& 7% 8% 7% 6% 8% 9% 9%
17 245 232 209 250 149 145 174 212 178 131 156 140 128 157 229 199
0.3% 3% 3% 2% 3% 2% 2% 2% 2% 2% 2% 3% 2% 1% 1% 2% 2%
63 110 118 119 117 102 118 141 146 150 97 119 672 263 954 336 426
1% 1% 1% 1% 2% 2% 2% 2% 1% 1% 1% 2% 8% 2% 9% 3% 4%
44 56 27 58 80 43 27 30 43 36 20 104 31 38 47 43 26
1% 1% 0.3% 1% 1% 1% 0.4% 0.4% 0.4% 0.3% 0.3% 2% 0.4% 0.3% 0.4% 0.4% 0.2%
534 838 832 3,238 942 767 818 921 857 868 535 552 552 620 711 655 688
9% 9% 9% 33% 12% 12% 11% 11% 8% 8% 7% 9% 7% 5% 6% 6% 6%
6,095 9,768 8,840 9,795 7,732 6,646 7,315 8,553 10,094 10,650 7,272 6,016 8,198 11,465 11,050 10,452 11,033
100% 100% 100% 100% 100% 100% 100% 100% 100% 100% 100% 100% 100% 100% 100% 100% 100%
Community Issues
Labour Related
Education Related
Official Events
Recreational, Cultural
or Religious Events
Crime and Policing
Related
Transport Related
Elections Related
Racism and
Xenophobia
Other
Total

[Type here]
81
Table 2: Approximate percentage of aggregated motives by year (unrest), 1997-2013
1997 1998 1999 2000 2001 2002 2003 2004 2005 2006 2007 2008 2009 2010 2011 2012 2013
261 304 152 103 102 101 89 107 344 209 313 201 381 393 428 855 647
21% 18% 12% 13% 14% 16% 15% 16% 30% 20% 35% 22% 38% 36% 32% 46% 38%
308 426 246 141 110 119 91 91 210 214 128 92 154 212 246 460 312
25% 25% 19% 17% 15% 19% 15% 14% 18% 20% 14% 10% 15% 20% 18% 25% 18%
83 140 141 102 56 50 47 46 84 60 41 50 42 87 54 86 94
7% 8% 11% 12% 8% 8% 8% 7% 7% 6% 5% 6% 4% 8% 4% 5% 5%
17 25 29 27 27 28 24 31 28 39 29 33 36 33 68 20 73
1% 1% 2% 3% 4% 4% 4% 5% 2% 4% 3% 4% 4% 3% 5% 1% 4%
18 30 38 33 39 40 37 32 41 42 34 47 63 55 94 44 119
1% 2% 3% 4% 5% 6% 6% 5% 4% 4% 4% 5% 6% 5% 7% 2% 7%
236 391 397 190 175 171 173 196 241 252 209 227 183 135 185 162 220
19% 23% 30% 23% 24% 27% 29% 29% 21% 24% 23% 25% 18% 12% 14% 9% 13%
45 98 99 67 56 39 45 55 79 94 34 39 39 31 50 75 80
4% 6% 7% 8% 8% 6% 7% 8% 7% 9% 4% 4% 4% 3% 4% 4% 5%
2 3 4 3 3 3 3 3 3 4 4 4 17 8 54 9 13
0.2% 0.2% 0.3% 0.4% 0.5% 1% 0.5% 0.4% 0.3% 0.4% 0.4% 0.4% 2% 1% 4% 0.0% 1%
19 52 52 9 8 2 6 3 9 9 9 120 10 16 10 18 31
21% 15% 12% 17% 19% 14% 15% 16% 10% 13% 10% 10% 8% 10% 11% 6% 8%
1,247 1,728 1,320 816 716 644 604 672 1,150 1,060 891 900 1,007 1,079 1,332 1,842 1,720
21% 15% 12% 17% 19% 14% 15% 16% 10% 13% 10% 10% 8% 10% 11% 6% 8%
1,247 1,728 1,320 816 716 644 604 672 1,154 1,060 891 900 1,007 1,079 1,332 1,842 1,720
100% 100% 100% 100% 100% 100% 100% 100% 100% 100% 100% 100% 100% 100% 100% 100% 100%
Total
Crime and Policing
Related
Transport Related
Elections Related
Racism and Xenophobia
Other
Community Issues
Labour Related
Education Related
Official Events
Recreational, Cultural
or Religious Events
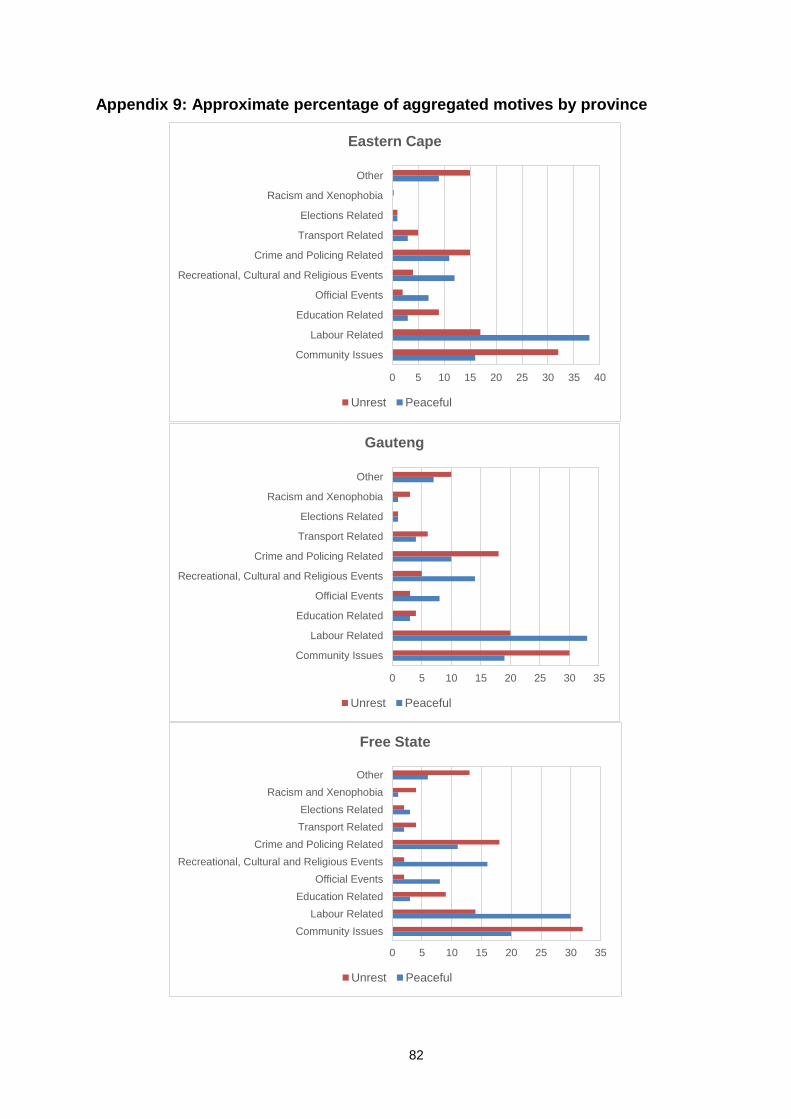
[Type here]
82
Appendix 9: Approximate percentage of aggregated motives by province
0 5 10 15 20 25 30 35 40
Community Issues
Labour Related
Education Related
Official Events
Recreational, Cultural and Religious Events
Crime and Policing Related
Transport Related
Elections Related
Racism and Xenophobia
Other
Eastern Cape
Unrest Peaceful
0 5 10 15 20 25 30 35
Community Issues
Labour Related
Education Related
Official Events
Recreational, Cultural and Religious Events
Crime and Policing Related
Transport Related
Elections Related
Racism and Xenophobia
Other
Gauteng
Unrest Peaceful
0 5 10 15 20 25 30 35
Community Issues
Labour Related
Education Related
Official Events
Recreational, Cultural and Religious Events
Crime and Policing Related
Transport Related
Elections Related
Racism and Xenophobia
Other
Free State
Unrest Peaceful

[Type here]
83
0 5 10 15 20 25
Community Issues
Labour Related
Education Related
Official Events
Recreational, Cultural and Religious Events
Crime and Policing Related
Transport Related
Elections Related
Racism and Xenophobia
Other
KwaZulu Natal
Unrest Peaceful
0 5 10 15 20 25 30 35 40
Community Issues
Labour Related
Education Related
Official Events
Recreational, Cultural and Religious Events
Crime and Policing Related
Transport Related
Elections Related
Racism and Xenophobia
Other
Mpumalanga
Unrest Peaceful
0 5 10 15 20 25
Community Issues
Labour Related
Education Related
Official Events
Recreational, Cultural and Religious Events
Crime and Policing Related
Transport Related
Elections Related
Racism and Xenophobia
Other
Limpopo
Unrest Peaceful
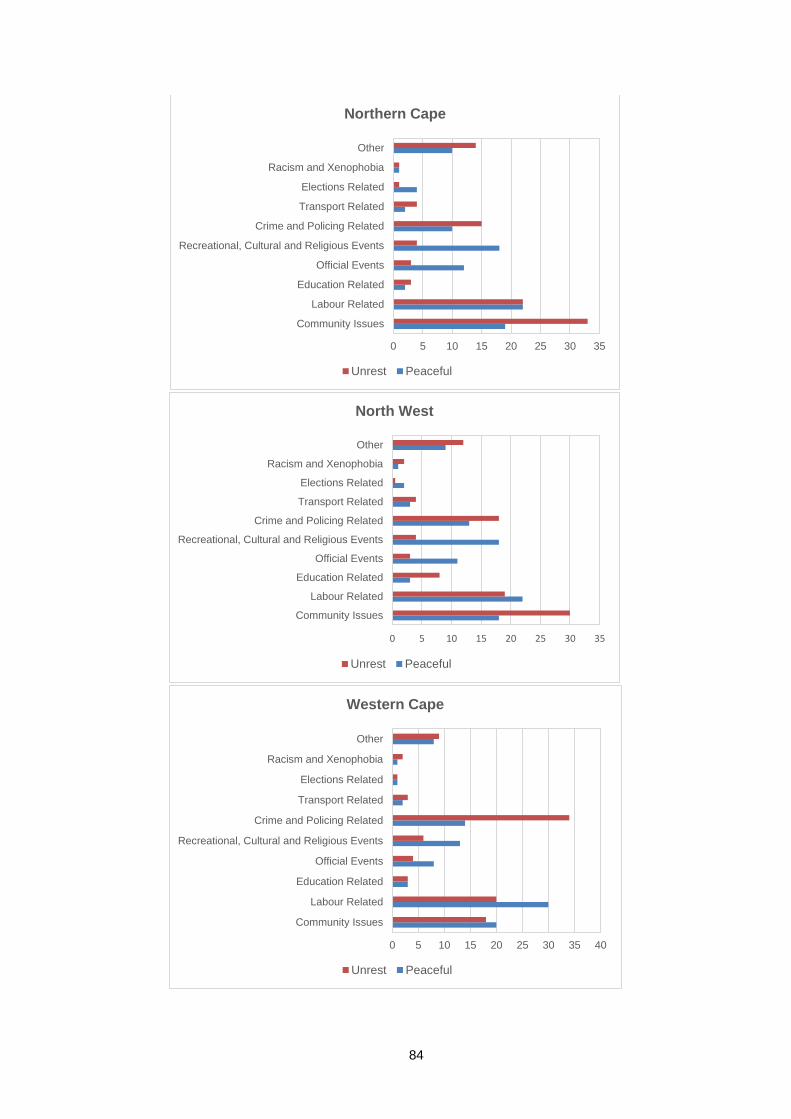
[Type here]
84
0 5 10 15 20 25 30 35
Community Issues
Labour Related
Education Related
Official Events
Recreational, Cultural and Religious Events
Crime and Policing Related
Transport Related
Elections Related
Racism and Xenophobia
Other
Northern Cape
Unrest Peaceful
0 5 10 15 20 25 30 35
Community Issues
Labour Related
Education Related
Official Events
Recreational, Cultural and Religious Events
Crime and Policing Related
Transport Related
Elections Related
Racism and Xenophobia
Other
North West
Unrest Peaceful
0 5 10 15 20 25 30 35 40
Community Issues
Labour Related
Education Related
Official Events
Recreational, Cultural and Religious Events
Crime and Policing Related
Transport Related
Elections Related
Racism and Xenophobia
Other
Western Cape
Unrest Peaceful
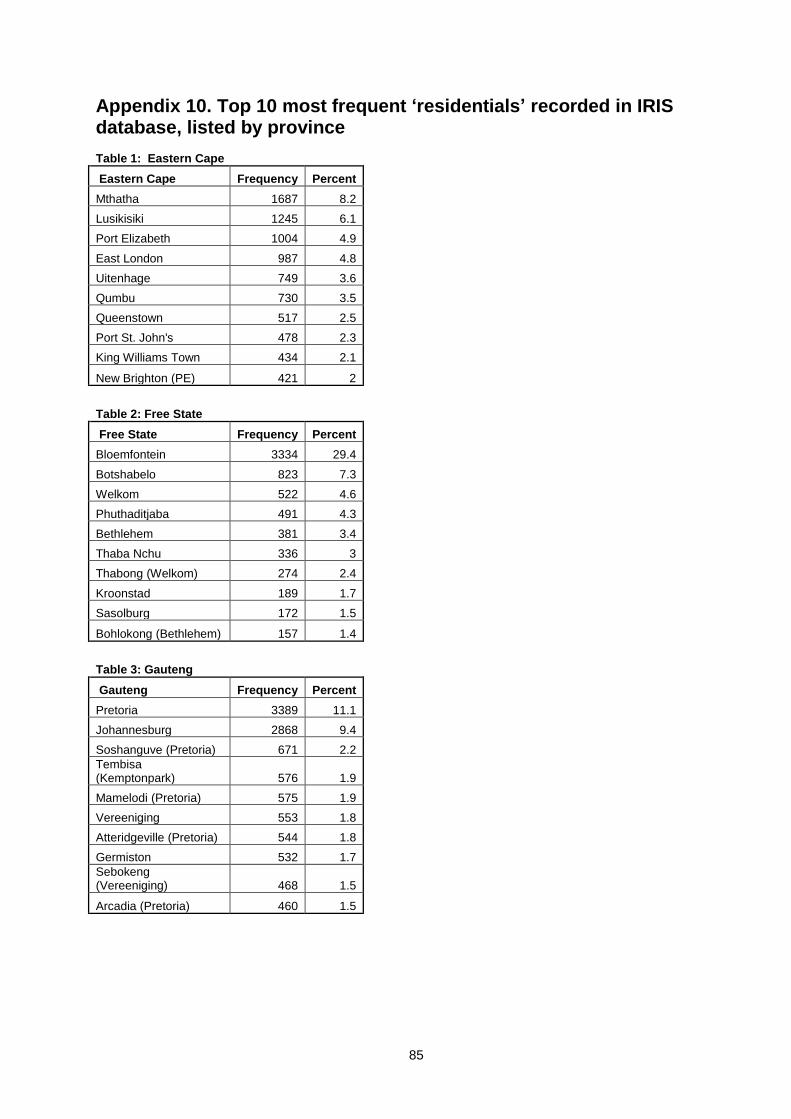
[Type here]
85
Appendix 10. Top 10 most frequent ‘residentials’ recorded in IRIS database, listed by province Table 1: Eastern Cape
Eastern Cape Frequency Percent
Mthatha 1687 8.2
Lusikisiki 1245 6.1
Port Elizabeth 1004 4.9
East London 987 4.8
Uitenhage 749 3.6
Qumbu 730 3.5
Queenstown 517 2.5
Port St. John's 478 2.3
King Williams Town 434 2.1
New Brighton (PE) 421 2
Table 2: Free State
Free State Frequency Percent
Bloemfontein 3334 29.4
Botshabelo 823 7.3
Welkom 522 4.6
Phuthaditjaba 491 4.3
Bethlehem 381 3.4
Thaba Nchu 336 3
Thabong (Welkom) 274 2.4
Kroonstad 189 1.7
Sasolburg 172 1.5
Bohlokong (Bethlehem) 157 1.4
Table 3: Gauteng
Gauteng Frequency Percent
Pretoria 3389 11.1
Johannesburg 2868 9.4
Soshanguve (Pretoria) 671 2.2
Tembisa (Kemptonpark) 576 1.9
Mamelodi (Pretoria) 575 1.9
Vereeniging 553 1.8
Atteridgeville (Pretoria) 544 1.8
Germiston 532 1.7
Sebokeng (Vereeniging) 468 1.5
Arcadia (Pretoria) 460 1.5
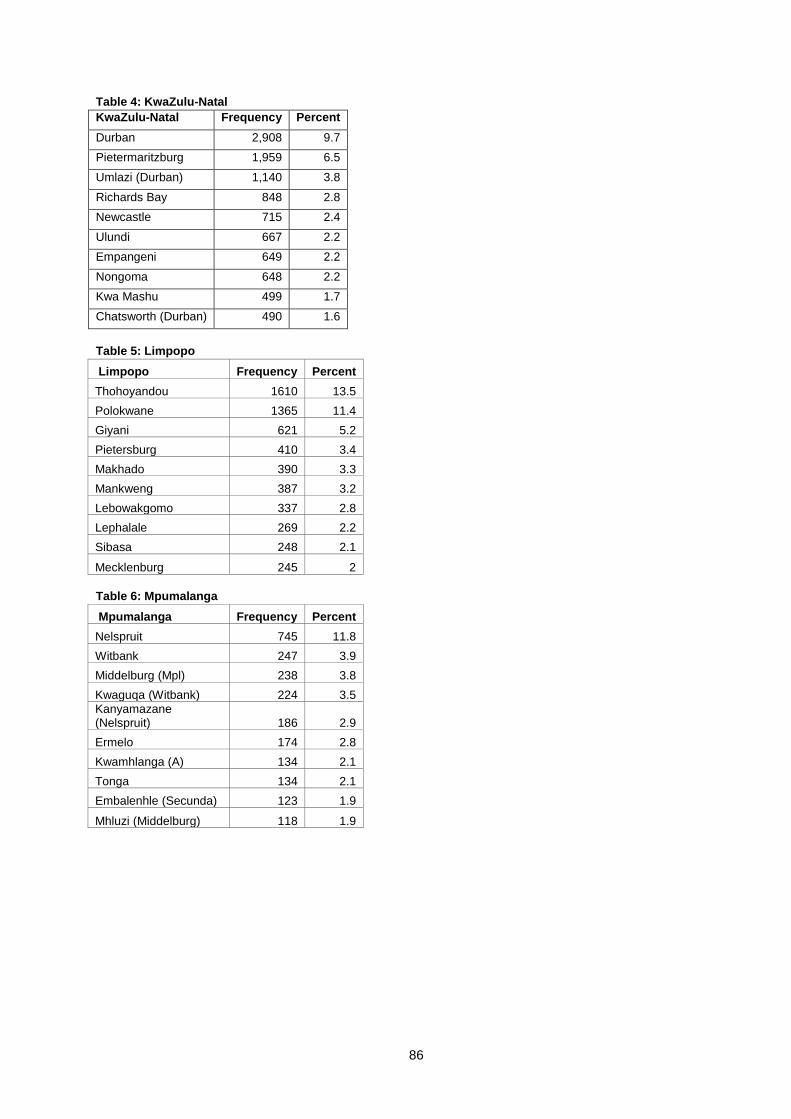
[Type here]
86
Table 4: KwaZulu-Natal
KwaZulu-Natal Frequency Percent
Durban 2,908 9.7
Pietermaritzburg 1,959 6.5
Umlazi (Durban) 1,140 3.8
Richards Bay 848 2.8
Newcastle 715 2.4
Ulundi 667 2.2
Empangeni 649 2.2
Nongoma 648 2.2
Kwa Mashu 499 1.7
Chatsworth (Durban) 490 1.6
Table 5: Limpopo
Limpopo Frequency Percent
Thohoyandou 1610 13.5
Polokwane 1365 11.4
Giyani 621 5.2
Pietersburg 410 3.4
Makhado 390 3.3
Mankweng 387 3.2
Lebowakgomo 337 2.8
Lephalale 269 2.2
Sibasa 248 2.1
Mecklenburg 245 2
Table 6: Mpumalanga
Mpumalanga Frequency Percent
Nelspruit 745 11.8
Witbank 247 3.9
Middelburg (Mpl) 238 3.8
Kwaguqa (Witbank) 224 3.5
Kanyamazane (Nelspruit) 186 2.9
Ermelo 174 2.8
Kwamhlanga (A) 134 2.1
Tonga 134 2.1
Embalenhle (Secunda) 123 1.9
Mhluzi (Middelburg) 118 1.9
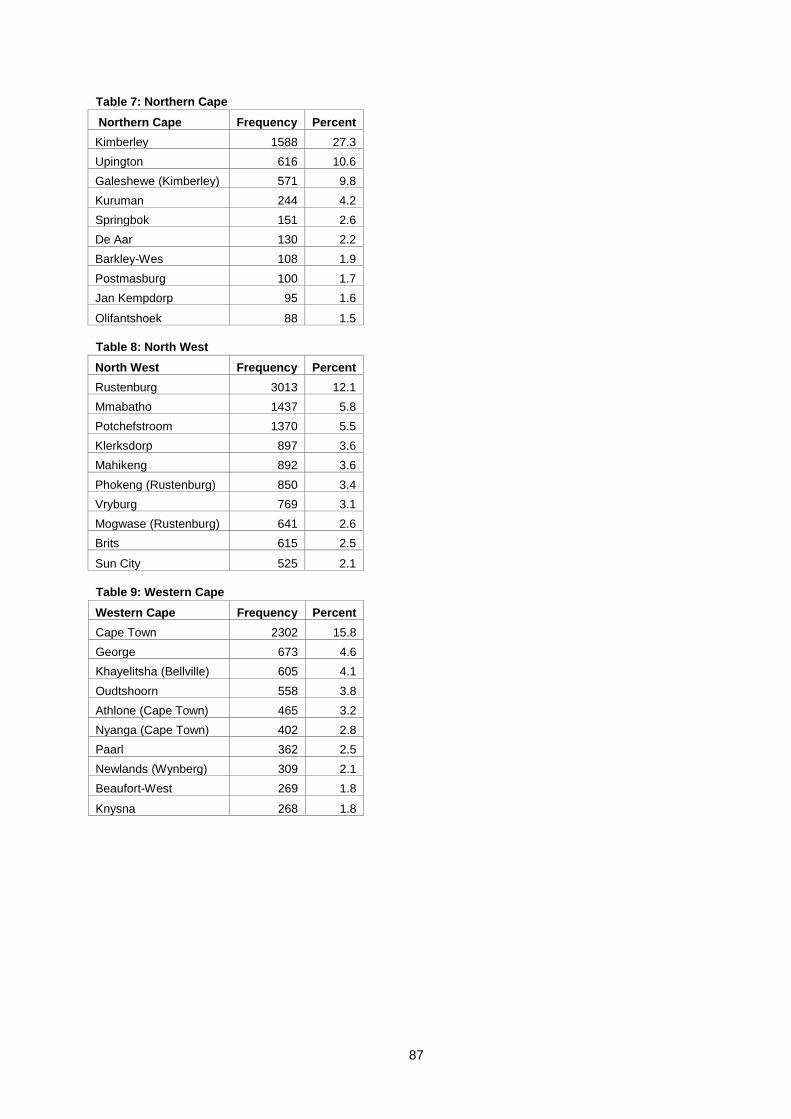
[Type here]
87
Table 7: Northern Cape
Northern Cape Frequency Percent
Kimberley 1588 27.3
Upington 616 10.6
Galeshewe (Kimberley) 571 9.8
Kuruman 244 4.2
Springbok 151 2.6
De Aar 130 2.2
Barkley-Wes 108 1.9
Postmasburg 100 1.7
Jan Kempdorp 95 1.6
Olifantshoek 88 1.5
Table 8: North West
North West Frequency Percent
Rustenburg 3013 12.1
Mmabatho 1437 5.8
Potchefstroom 1370 5.5
Klerksdorp 897 3.6
Mahikeng 892 3.6
Phokeng (Rustenburg) 850 3.4
Vryburg 769 3.1
Mogwase (Rustenburg) 641 2.6
Brits 615 2.5
Sun City 525 2.1
Table 9: Western Cape
Western Cape Frequency Percent
Cape Town 2302 15.8
George 673 4.6
Khayelitsha (Bellville) 605 4.1
Oudtshoorn 558 3.8
Athlone (Cape Town) 465 3.2
Nyanga (Cape Town) 402 2.8
Paarl 362 2.5
Newlands (Wynberg) 309 2.1
Beaufort-West 269 1.8
Knysna 268 1.8

[Type here]
88
Appendix 11: Categories of ‘environmentals’ recorded in IRIS
database, 1997-2013 (peaceful and unrest)
Crowd
(Peaceful) Crowd (Unrest)
Total
Environment Aircraft 19 1 20
0.0% 0.0% 0.0%
Airport 538 25 563
0.4% 0.2% 0.4%
Amusement Park 295 6 301
0.2% 0.0% 0.2%
Banks 124 4 128
0.1% 0.0% 0.1%
Beach Area 548 6 554
0.4% 0.0% 0.4%
BorderPost 87 17 104
0.1% 0.1% 0.1%
Building Site 808 71 879
0.6% 0.5% 0.6%
Busstop/Bus Terminal 342 62 404
0.2% 0.4% 0.3%
Cravan Park 38 0 38
0.0% 0.0% 0.0%
Cemetry 1,459 45 1,504
1.0% 0.3% 1.0%
Church 1,779 54 1,833
1.3% 0.3% 1.2%
City Hall/Town Hall 4,828 139 4,967
3.4% 0.9% 3.2%
Community Hall 8,663 225 8,888
6.2% 1.4% 5.7%
Courthouse 5,859 128 5,987
4.2% 0.8% 3.8%
Craft/Sea Craft 9 2 11
0.0% 0.0% 0.0%
Disco 19 7 26
0.0% 0.0% 0.0%
Dwelling 430 148 578
0.3% 0.9% 0.4%
Embassy/Consulate 451 9 460
0.3% 0.1% 0.3%
Filling Station 249 16 265
0.2% 0.1% 0.2%
Flea Market 66 2 68
0.0% 0.0% 0.0%
Hospital/Clinic 2,328 101 2,429
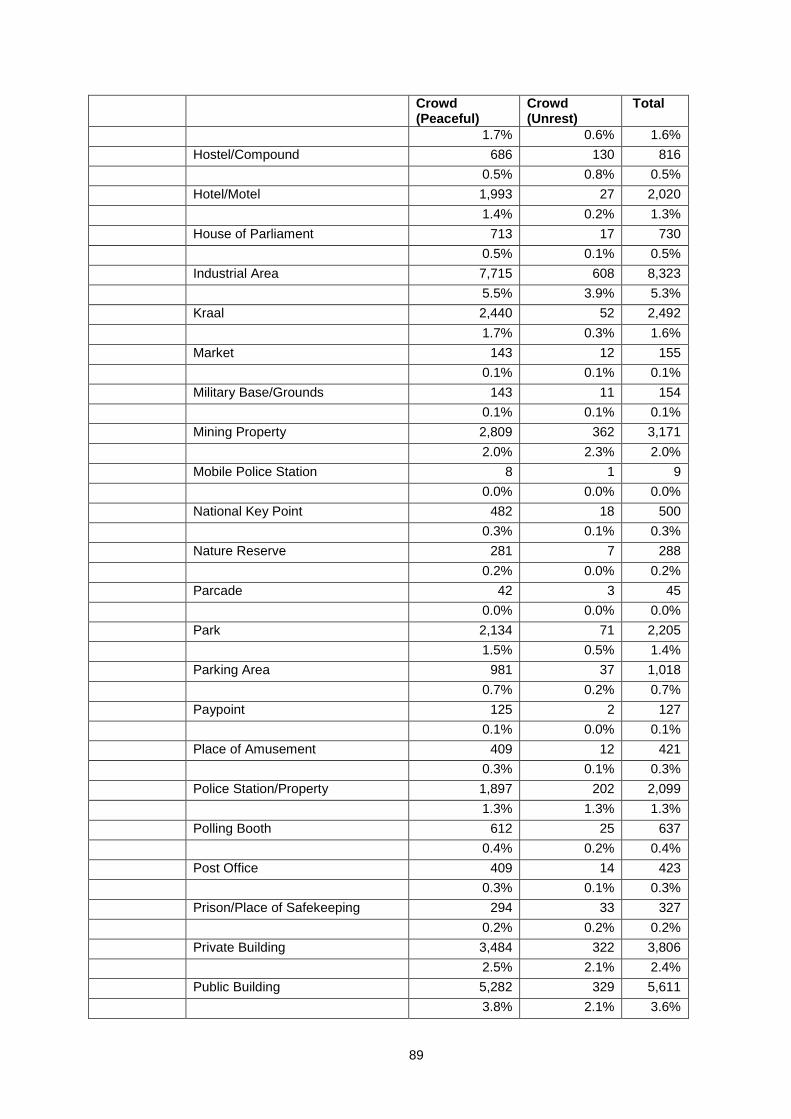
[Type here]
89
Crowd (Peaceful)
Crowd (Unrest)
Total
1.7% 0.6% 1.6%
Hostel/Compound 686 130 816
0.5% 0.8% 0.5%
Hotel/Motel 1,993 27 2,020
1.4% 0.2% 1.3%
House of Parliament 713 17 730
0.5% 0.1% 0.5%
Industrial Area 7,715 608 8,323
5.5% 3.9% 5.3%
Kraal 2,440 52 2,492
1.7% 0.3% 1.6%
Market 143 12 155
0.1% 0.1% 0.1%
Military Base/Grounds 143 11 154
0.1% 0.1% 0.1%
Mining Property 2,809 362 3,171
2.0% 2.3% 2.0%
Mobile Police Station 8 1 9
0.0% 0.0% 0.0%
National Key Point 482 18 500
0.3% 0.1% 0.3%
Nature Reserve 281 7 288
0.2% 0.0% 0.2%
Parcade 42 3 45
0.0% 0.0% 0.0%
Park 2,134 71 2,205
1.5% 0.5% 1.4%
Parking Area 981 37 1,018
0.7% 0.2% 0.7%
Paypoint 125 2 127
0.1% 0.0% 0.1%
Place of Amusement 409 12 421
0.3% 0.1% 0.3%
Police Station/Property 1,897 202 2,099
1.3% 1.3% 1.3%
Polling Booth 612 25 637
0.4% 0.2% 0.4%
Post Office 409 14 423
0.3% 0.1% 0.3%
Prison/Place of Safekeeping 294 33 327
0.2% 0.2% 0.2%
Private Building 3,484 322 3,806
2.5% 2.1% 2.4%
Public Building 5,282 329 5,611
3.8% 2.1% 3.6%
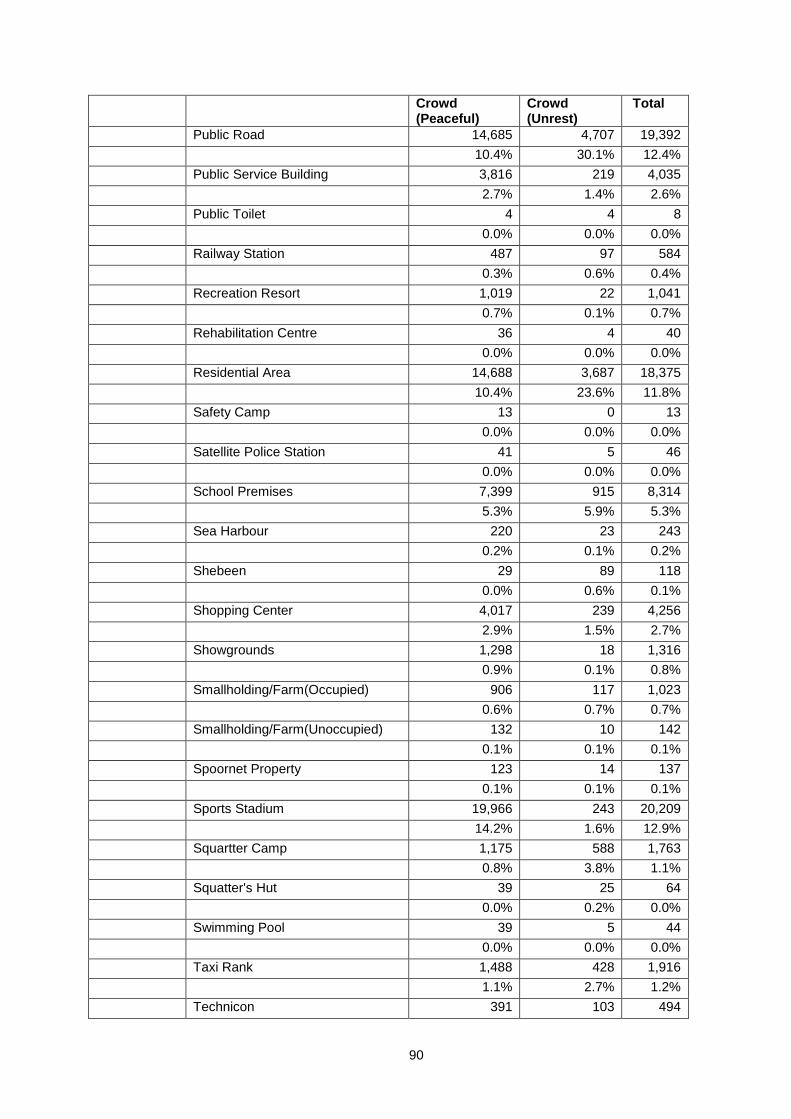
[Type here]
90
Crowd (Peaceful)
Crowd (Unrest)
Total
Public Road 14,685 4,707 19,392
10.4% 30.1% 12.4%
Public Service Building 3,816 219 4,035
2.7% 1.4% 2.6%
Public Toilet 4 4 8
0.0% 0.0% 0.0%
Railway Station 487 97 584
0.3% 0.6% 0.4%
Recreation Resort 1,019 22 1,041
0.7% 0.1% 0.7%
Rehabilitation Centre 36 4 40
0.0% 0.0% 0.0%
Residential Area 14,688 3,687 18,375
10.4% 23.6% 11.8%
Safety Camp 13 0 13
0.0% 0.0% 0.0%
Satellite Police Station 41 5 46
0.0% 0.0% 0.0%
School Premises 7,399 915 8,314
5.3% 5.9% 5.3%
Sea Harbour 220 23 243
0.2% 0.1% 0.2%
Shebeen 29 89 118
0.0% 0.6% 0.1%
Shopping Center 4,017 239 4,256
2.9% 1.5% 2.7%
Showgrounds 1,298 18 1,316
0.9% 0.1% 0.8%
Smallholding/Farm(Occupied) 906 117 1,023
0.6% 0.7% 0.7%
Smallholding/Farm(Unoccupied) 132 10 142
0.1% 0.1% 0.1%
Spoornet Property 123 14 137
0.1% 0.1% 0.1%
Sports Stadium 19,966 243 20,209
14.2% 1.6% 12.9%
Squartter Camp 1,175 588 1,763
0.8% 3.8% 1.1%
Squatter's Hut 39 25 64
0.0% 0.2% 0.0%
Swimming Pool 39 5 44
0.0% 0.0% 0.0%
Taxi Rank 1,488 428 1,916
1.1% 2.7% 1.2%
Technicon 391 103 494
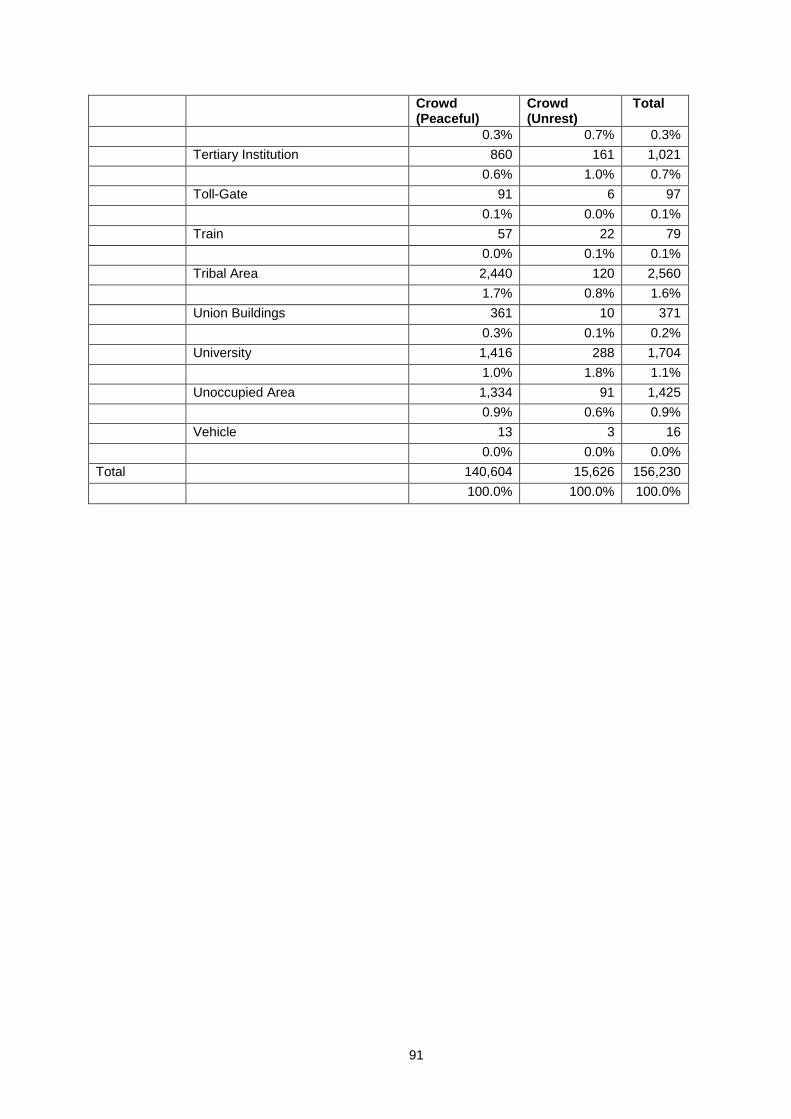
[Type here]
91
Crowd (Peaceful)
Crowd (Unrest)
Total
0.3% 0.7% 0.3%
Tertiary Institution 860 161 1,021
0.6% 1.0% 0.7%
Toll-Gate 91 6 97
0.1% 0.0% 0.1%
Train 57 22 79
0.0% 0.1% 0.1%
Tribal Area 2,440 120 2,560
1.7% 0.8% 1.6%
Union Buildings 361 10 371
0.3% 0.1% 0.2%
University 1,416 288 1,704
1.0% 1.8% 1.1%
Unoccupied Area 1,334 91 1,425
0.9% 0.6% 0.9%
Vehicle 13 3 16
0.0% 0.0% 0.0%
Total 140,604 15,626 156,230
100.0% 100.0% 100.0%
South African Research Chair in Social ChangeHouse 4 Research Village
University of Johannesburg Bunting Road CampusPO Box 524, Auckland Park, 2006
Tel: + 27 (0)11 559 4251