Social Casino and APAC : Opportunities & Challenges
17
1 SOCIAL CASINO AND APAC : OPPORTUNITIES & CHALLENGES ADI HANIN, BUSINESS DEVELOPMENT MANAGER, PLAYTIKA [email protected]
-
Upload
adi-hanin -
Category
Presentations & Public Speaking
-
view
371 -
download
0
Transcript of Social Casino and APAC : Opportunities & Challenges

1
SOCIAL CASINO AND APAC : OPPORTUNITIES & CHALLENGESADI HANIN, BUSINESS DEVELOPMENT MANAGER, PLAYTIKA

2
PLAYTIKA OVERVIEW
2
Founded in 2010
Social Casino global market leader
10 Games
13 Platforms
1000+ Employees
PLAYTIKA OVERVIEW

12 Global offices; Head Quarters in Tel-Aviv, Israel
3
PLAYTIKA OVERVIEW
PLAYTIKA OVERVIEW
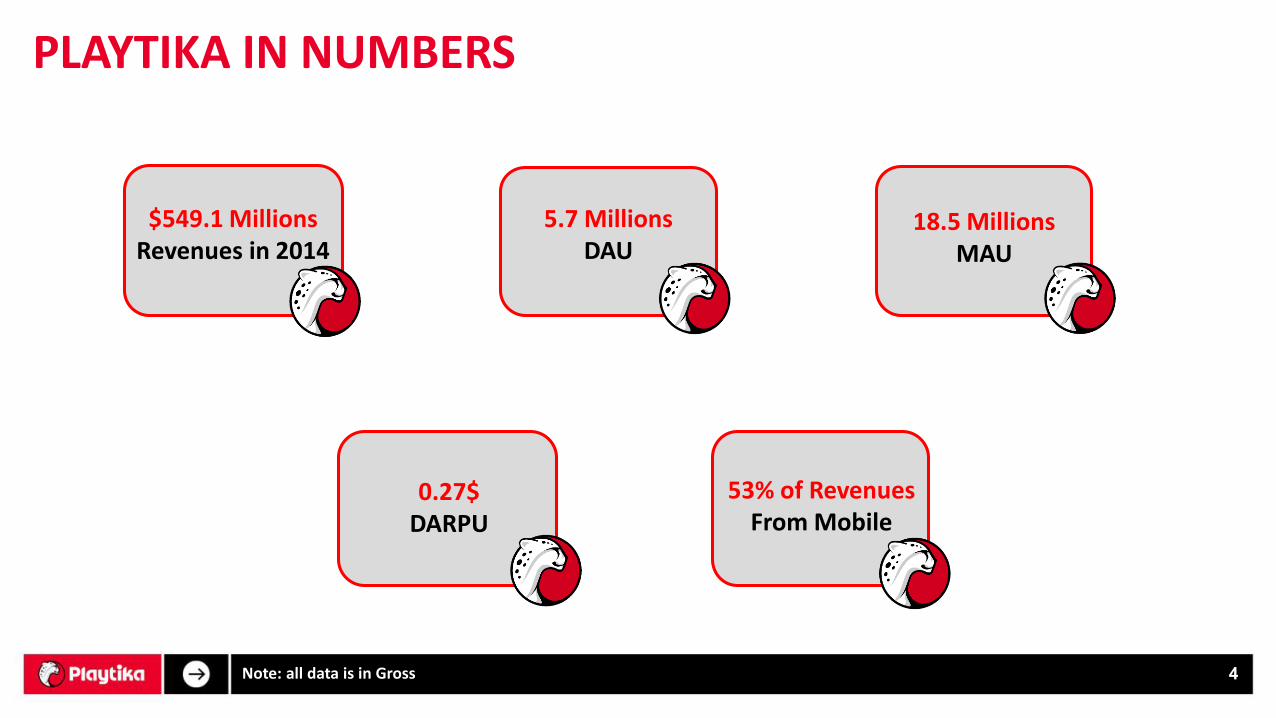
Note: all data is in Gross 4
PLAYTIKA IN NUMBERS
18.5 MillionsMAU
5.7 MillionsDAU
$549.1 MillionsRevenues in 2014
53% of RevenuesFrom Mobile
0.27$DARPU

5
GAMING MARKET REVIEW

Global Game revenues by region - 2014
6
GAMING MARKET SNAPSHOT
NAM
$23 BN
E-EU
$2.4 BNW-EU
$15.5 BN
MEA
$1.6 BN
LATAM
$3.4 BN
APAC
$37.5 BN
Population7.2 BN
Online population2.9 BN
Gamers1.7 BN
Total$83.4 BN
Source: Newzoo
By 2017 the gaming market will generate ~106BN$, most of the growth from mobile
GAMING MARKET REVIEW

China, Japan and Korea generates ~ 90% of the games revenues in the region
7
APAC – REGIONAL GAMING REVENUES 2014
Population3.9 BN
Online population1.3 BN
Gamers815 M
Total$37.5 BN
CN
$17.7 BN
KOR
$3.6 BNJP
$12.5 BN
TW
$64 MINDIA
$58 M
AU
$1.14 BN
INDO
$150 M
Source: Newzoo
GAMING MARKET REVIEW

8
SOCIAL CASINO MARKET REVIEW

9
SOCIAL CASINO IN CONTEXT
SOCIAL CASINO
SOCIAL CASINO MARKET REVIEW

By 2017 social casino revenues from mobile will increase by ~ 930%
10
SOCIAL CASINO: MARKET SIZE 2012-2017E
0.350.88
1.58
2.29
2.97
3.6
0.98
1.2
1.26
1.17
1.03
0.84
2012 2013 2014 2015 E 2016 E 2017 E
Mobile Revenues FB Revenues
$4.44 BN
$2.84 BN
$2.05 BN
$1.33 BN
$3.46 BN
$4 BN
Source: Eilers Research
SOCIAL CASINO MARKET REVIEW

11
MOBILE REVENUES REGIONAL SNAPSHOT
Source: Eilers ResearchNote: Top Titles are based on top grossing ranks in tier 1 countries in each continent
NAM
$1.02 BN
EU$158 M
MEA$8 M
LATAM$32 M
APAC$363 M
Global social casino revenues by region - 2014
SOCIAL CASINO MARKET REVIEW

12
SOCIAL CASINO MARKET REVIEW
LOCAL GAMES FOR “GLOCAL” MARKET
INDIA
LATAM
China & South East Asia
Japan
MEA
13
SOCIAL CASINO IN APAC

14
CHALLENGES IN APAC FOR WESTERN GAME DEVELOPERS
Local CRM Local Pricing Local games & Art Local Support
SOCIAL CASINO IN APAC

15
HONG-KONG SNAPSHOT
slots, 41.7%
Poker , 17.6%
card games (ex poker), 25.9%
Bingo 2.8%
other games, 9.2%
slots Poker card games (ex poker) Bingo other games
Genres share from social casino apps
Slots games constitute ~42% of the top grossing social casino revenues in Hong Kong
Population7.3 M
Online population5.4 M
Mobile Social Casino Players~140 K
Social Casino Revenues~$5 M
SOCIAL CASINO IN APAC

16
QUICK RECAP
By 2017 the gaming market will generate ~106BN$, most of the growth from mobile
China, Japan and Korea generates ~ 90% of the gaming revenues in the region, $37.5 BN
By 2017, Social casino market will generate $4.44 BN, globally
In 2014, APAC was the second largest social casino market after N. America, with revenues of $363M
Some of the challenges that western game developers face in APAC include: local support and CRM, local games and Art and local pricing.
Each APAC country has its own characteristics, in Hong Kong for example slots are the most popular social casino game genre.
RECAP

THANK YOU!Playtika is constantly looking for new opportunities
Feel free to contact me at [email protected]
if you have any ideas for us
Adi Hanin, Business Development Manager