Social and Environmental Disclosures: Substitutes or ...
42
Cahier de recherche 2009-02 Social and Environmental Disclosures: Substitutes or Complements? Denis Cormier* ESG UQÀM, Canada Marie-Josée Ledoux ESG UQÀM, Canada Michel Magnan John Molson School of Business, Concordia University, Canada February 2009 *Corresponding author: P.O. Box 8888, down town station Montréal, Québec, Canada H3C 3P8
Transcript of Social and Environmental Disclosures: Substitutes or ...

Cahier de recherche
2009-02
Social and Environmental Disclosures: Substitutes or Complements?
Denis Cormier*
ESG UQÀM, Canada
Marie-Josée Ledoux ESG UQÀM, Canada
Michel Magnan John Molson School of Business,
Concordia University, Canada
February 2009
*Corresponding author: P.O. Box 8888, down town station Montréal, Québec, Canada H3C 3P8

1
Social and Environmental Disclosures:
Substitutes or Complements? Abstract Most prior research on corporate social responsibility (CSR) disclosure considers environmental and social components as additive or complementary. In this paper, we extend the existing literature on CSR by investigating the substitution effect of social disclosure and environmental disclosure in reducing information asymmetry between managers and investors. We also attempt to study the association between different environmental disclosure sources and information asymmetry. Our results suggest that social disclosure and paper-based environmental disclosure substitute each other in reducing stock market asymmetry. We also show that environmental information communicated on the web page or by press releases does not affect information asymmetry when we consider social disclosure. These observations suggest that future research in CSR disclosure might fruitfully distinguish between social and environmental disclosure as well as communication devices. Moreover, as expected, we observe that environmental performance is negatively associated with environmental disclosure. Our results also show that environmental news exposure and firm size are key drivers of environmental disclosure. Key words: Social disclosure, governance attributes, environmental disclosure, information asymmetry.
L’information sociale et l’information environnementale :
Substituts ou compléments ?
Résumé La plupart des études en divulgation de la responsabilité sociale des entreprises considèrent l’information sociale et environnementale comme additive ou complémentaire. Dans la présente étude, nous analysons l’effet de substitution du discours social et environnemental dans la réduction de l’asymétrie informationnelle sur les marchés boursiers. Nous analysons également le lien entre les différents médias de communication environnementale et l’asymétrie informationnelle. Nos résultats montrent que la divulgation sociale et la divulgation environnementale dans le rapport annuel agissent comme substituts dans la réduction de l’asymétrie informationnelle alors que l’information environnementale communiquée sur le web ou par des communiqués de presse n’a pas d’impact sur l’asymétrie informationnelle. Ces résultats nous portent à croire que les recherches futures en divulgation de la responsabilité sociale devraient distinguer le volet social du volet environnemental de même que le mode de communication. Nos résultats montrent également que le discours environnemental est associé à la performance environnementale, à l’exposition médiatique et à la taille de la firme. Mots-clés : Divulgation sociale, divulgation environnementale, gouvernance, asymétrie d’information.

2
Introduction
An unresolved research issue in corporate social responsibility (CSR) disclosure research
is the role played by social disclosure in stakeholders’ interpretation of environmental disclosure.
There is anecdotal and empirical evidence suggesting that investors are attracted by both social
disclosure (e.g. Downing, 1997; Cormier, Ledoux and Magnan, 2009; Cormier, Aerts, Ledoux
and Magnan, 2009) and environmental disclosure (e.g. Cormier, Magnan and Morard, 1993;
Barth and McNichols, 1994; Li and McConomy, 1999; Aerts, Cormier and Magnan, 2008).
While most prior research on CSR disclosure considers environmental and social components as
additive or complementary (e.g. Ingram, 1978; Patten, 1991), Neu, Warsame and Pedwell (1998)
treat social disclosure as a determinant of environmental disclosure. They argue that social
disclosure helps to frame the interpretation of environmental disclosures. The current study
investigates whether social disclosure and environmental disclosure substitute or complement
each other in reducing information asymmetry between managers and investors, taking into
account a firm’s environmental performance, and governance attributes. In addition, we attempt
to assess which of the environmental disclosure medium is more associated with a reduction in
information asymmetry in the stock markets. Environmental disclosure is collected from three
complementary sources: paper-based annual/environmental report, web page and press releases.
Our results suggest that social disclosure and paper-based environmental disclosure
substitute each other in reducing stock market asymmetry. However, when we consider social
disclosure, environmental information communicated on the web page or press releases is not
related to a reduction in information asymmetry. These observations suggest that future research
in CSR disclosure might fruitfully distinguish between social and environmental disclosure as
well as communication devices.

3
As expected, we observe that environmental performance is negatively associated with
environmental disclosure. Finally, concerning the determinants of disclosure, our results show
that environmental news exposure and firm size are key drivers of environmental disclosure.
We contribute to the literature on the determinants of information asymmetry between
managers and investors by showing that voluntary social disclosure as well as environmental
disclosure provides different insights into how a firm creates value, information deemed useful
by investors (e.g., Bushman, Chen, Engel and Smith, 2003). In that sense, we extend prior
findings that social disclosure (e.g. Cormier, Ledoux and Magnan, 2009) and environmental
disclosures (e.g. Barth and McNichols, 1994; Aerts, Cormier and Magnan, 2008) do influence
capital markets’ participants.
To the best of our knowledge, our study is the first to investigate the effect of social and
environmental disclosure on information asymmetry between managers and investors, taking
into account environmental performance and governance attributes.
The remainder of the paper is organized as follows. Section 2 contains a theoretical
background. The study’s methodology is described in section 3. Results are presented in section
4. Finally, section 5 provides a discussion of results’ potential implication.

4
2. Environmental and social disclosures: Background and hypotheses
2.1 Disclosure and information asymmetry
Social capital, relying on relationships between an organisation and its employees,
business partners and other stakeholders, provides opportunities to create value (Burt, 1992). In
that regard, Adler and Kwon (2002) note that social capital facilitates various important
organizational actions such as inter-unit and inter-firm learning, thus contributing to their
success. Moreover, by building up of social capital, a firm is able to effectively reduce its
market-based risk profile (Orlitzky and Benjamin, 2001). For example, Waddock and Graves
(1997) suggest that stable relations with various stakeholder groups facilitate a firm’s access to
equity markets. Improvements in social capital also build trust in contracting relationships with
external stakeholders, thus enabling the firm to lower transactions costs (Hill, 1990) and
subsequent monitoring and coordination costs (Milgrom and Roberts, 1992). Hitt, Lee and Yucel
(2002) show that multinational firms with extensive social capital exhibit a competitive
advantage in the new global marketplace
Shane and Cable (2002) show how direct and indirect network ties between entrepreneurs
and potential investors, especially venture capitalists, bridge the information gap and facilitate
the financing of new ventures. However, the impact of a firm’s social disclosure on information
asymmetry between managers and investors can only be effective if the firm’s social capital
traits are visible and salient in the market, for example through social performance reputation
ratings (Fombrun and Shanley, 1990). In this vein, a corporate disclosure policy is important in
supporting lasting effects of its social capital on market-based risk and performance measures. In
that regard, Cormier, Ledoux and Magnan (2009) show that social disclosure reduces a firm’s
cost of equity capital.

5
With respect to environmental disclosure, Aerts, Cormier and Magnan (2008) find that
print environmental disclosure is associated with a decrease in analysts' forecast dispersion both
in continental Europe and in North America. However, in North America, it appears that the
impact of analyst forecast dispersion on a firm’s environmental disclosure differs depending on
the diffusion media being used. Their results suggest that web-based environmental disclosure is
only relevant in continental Europe. This might be attributable to the large sources of
environmental information available in North America. Market participants in North America
can rely on various alternative sources of information that are potentially perceived as more
credible than the web (e.g. MD&A, 10K, etc).
Press releases can be used in a more timely, more elaborate and focused fashion and with
more expressive language than annual report disclosures to confront sensitive environmental
issues. They may also be more effective in signalling commitment. In this vein, their use will be
more tactical than that of the more comprehensive and longer-term characteristic of annual report
disclosures (Aerts and Cormier, 2009). Moreover, in concert with the main theme of the strategic
legitimacy perspective on environmental reporting, Aerts and Cormier (2009) show that negative
media legitimacy is a significant driver of environmental press releases, which is not the case for
annual report environmental disclosures.
2.2 Hypotheses
Prior research documents a negative relationship between environmental disclosure and
information asymmetry (Barth and McNichols, 1994; Clarkson, Li and Richardson, 2004;
Cormier and Magnan, 2007; Aerts, Cormier and Magnan, 2008). With respect to social
disclosure, Richardson and Welker (2001) find, contrary to expectations that more disclosure

6
translates into higher cost of capital. One potential explanation for this finding is that they do not
control for endogeneity between disclosure and firm attributes.
There is anecdotal and empirical evidence suggesting that investors are attracted by both
social disclosure (e.g. Downing, 1997; Cormier, Ledoux and Magnan, 2009; Cormier, Aerts,
Ledoux and Magnan, 2009) and environmental disclosure (e.g. Cormier, Magnan and Morard,
1993; Barth and McNichols, 1994; Li and McConomy, 1999; Aerts, Cormier and Magnan,
2008). For example, Cormier, Ledoux and Magnan (2009) show that web-based social disclosure
is associated with larger earnings multiple, i.e. a lower cost of capital.
While most prior research on corporate social responsibility reporting (CSR) considers
environmental and social components as additive or complementary (e.g. Ingram, 1978; Patten,
1991), Neu, Warsame and Pedwell (1998) treat social disclosure as a determinant of
environmental disclosure. The authors argue that social disclosure enhances environmental
disclosures credibility by constructing the image of socially responsible organizations
harmonizing with environmental disclosure. Hence, the role played by social disclosure in
stakeholders’ interpretation of environmental disclosure, and vice versa, remains an unresolved
issue.
In absence of empirical evidence whether social and environmental disclosures substitute
or complement each other in reducing information asymmetry between managers and investors,
our research attempts to test the following alternative hypothesis:
H1a: There is a substitution effect between social disclosure and environmental
disclosure in reducing the information asymmetry between managers and investors.

7
H1b: There is a complementary effect between social disclosure and environmental
disclosure in reducing the information asymmetry between managers and investors.
Cho and Patten (2007) argue that the legitimizing nature of different types of
environmental disclosures is not identical and that it is important to distinguish different types of
information when assessing legitimation effects. They primarily distinguish between litigation
related and non-litigation related disclosure. Although our coding grid does not incorporate a
clear distinction between litigation related and non-litigation related information, we can
distinguish between hard disclosure (economic-based) more present in paper-based annual report
and soft environmental disclosure (more current on the web and press releases), with soft
environmental disclosure being more incentive-consistent than economic-based disclosure. This
dichotomous split of disclosure types resembles the distinction made by Clarkson, Li,
Richardson and Vasvari (2008) between soft and hard environmental disclosures, with hard
disclosures reflecting factual, objective information that cannot easily be mimicked by poor
environmental performers.
Aerts, Cormier and Magnan (2008) find that the value relevance underlying a firm’s
environmental disclosure differs depending on the diffusion media being used. Paper-based
environmental disclosure, containing more hard disclosure, leads to a reduction in analysts’
forecast dispersion while web-based environmental disclosure does not affect analysts’ forecast
dispersion. Since we expect more hard disclosure on paper-based than on web-based or press
releases media (Aerts and Cormier, 2009) and that environmental information contained in the
annual report is likely to be seen as more credible than information disclosed on the web page or
by press releases, we anticipate the relation between annual report environmental disclosure and

8
share price volatility to be higher than for web-based disclosure or press releases. Hence, we
propose our second hypothesis:
H2: The negative relationship between environmental disclosure and information
asymmetry between managers and investors will be higher for paper-based
annual/environmental report than for disclosure on the web or by press releases.
Several approaches to assess a firm's information asymmetry coexist. Francis, Khurana
and Pereira (2005), Leuz and Verrecchia (2000), Healy Hutton and Palepu (1999) and Welker
(1995) show that the extent of information asymmetry – proxied by bid-ask spread, share price
volatility or stock liquidity (trading volume) – is negatively associated with disclosure. In the
current study, we will use share price volatility and trading volume to assess the relation between
information asymmetry and social and environmental disclosures.
3. Method
3.1 Sample
The sample comprises 137 observations of web disclosure for the year 2005. We initially
collected web disclosure in the Summer of 2002 for an international study (Aerts, Cormier and
Magnan, 2007). All non-financial firms represented on the Toronto Stock Exchange S&P/TSX
Index were identified. To ensure that our sample comprised firms with active information
dynamics and investors interest, we selected firms that were followed by at least two financial
analysts. The resulting 2002 sample comprised 189 non-financial firms. Mergers and
acquisitions, bankruptcies and delistings reduced our sample to 157 in 2005. The final sample

9
comprises 137 firms since, out of the initial sample of 157 firms, there are missing data for board
size and board independence, and share volatility. The sample firms represent more than 60% of
the Toronto Stock Exchange stock market capitalization for non-financial firms. Sample firms
operate in the following industries: Metals and mines; Gold and precious metals; Oil and gas;
Paper and forest products; Consumer products; Industrial products; Real estate; Utilities;
Communication and media; Merchandising. Financial data was collected from the Stock Guide
and data about governance attributes was collected from 2004 proxy statements, those available
in Spring 2005.
Environmental disclosure is measured using a coding instrument in a manner similar to
Wiseman (1982), Cormier and Magnan (2003), Al-Tuwaijri, Christensen and Hughes (2004) and
Aerts and Cormier (2009). The grid comprises 39 items measuring environmental disclosure
quality where the items are grouped into six categories as follows:
Expenditures and risk;
laws and regulations;
pollution abatement;
sustainable development;
land remediation; and
environmental management.
The rating is based on a score from one to three. Three points are awarded for an item
described in monetary or quantitative terms, two are awarded when an item is described
specifically, and one is awarded for an item discussed in general. The information is coded
according to the grid presented in appendix 1.
10
We believe that the use of a coding scale to qualify a firm’s environmental disclosure is
appropriate for the following reasons. First, it allows for some integration of different types of
information into a single figure that is comparable across firms in terms of relevance. Second,
while other disclosure studies rely on word counts to measure environmental disclosure (e.g.,
Neu, Warsame and Pedwell, 1998; Williams and Ho Wern Pei, 1999), a qualitative scale allows
the researcher’s judgment to be utilized in rating the value or quality of the disclosures made by
a firm. While this process is more subjective, it ensures that irrelevant or redundant generalities
are not considered strategic environmental disclosures.
We collected environmental disclosure from three media: paper-based disclosure (annual
reports and environmental reports), web sites (HTML) and press releases related to
environmental information. We searched for press releases using the same keywords used for
articles pertaining to environmental issues. Two research assistants identified 37 firms that
issued 111 press releases related to environmental issues in 2005.
The social disclosure grid comprises 17 items collected from web sites in 2005. Social
capital refers to features of social organization, such as networks, norms and social trust that
facilitate co-operation for mutual advantage (Industry Canada, 2008). Social disclosure items
relate to interactions between the firm and society (e.g., alliances, clients) and within the firm
itself (i.e. with employees) (e.g. Dess and Shaw, 2001; Pastoriza, Arino and Ricart, 2008). Our
measure of social disclosure comprises only information that is on a firm’s Web site and
provided in an HTML format.1 Social indicators are based on balance scorecard literature and
performance measurement practices (e.g. Pirchegger and Wagenhofer, 1999; Marston and Polei,
1 Twenty-two firms published a distinct environmental/sustainability report in 2005. For those firms, we observe a larger mean score of social disclosure on the web page (near 50% in average). Therefore, we argue that our disclosure scores capture the overall social disclosure.

11
2004). We measure social disclosure using a coding instrument that is consistent with Wiseman
(1982), Cormier and Magnan (2003), Aerts, Cormier and Magnan (2007) and Cormier, Ledoux
and Magnan (2009). Like the environmental disclosure grid, three points are awarded for an item
described in monetary or quantitative terms, two are awarded when an item is described
specifically, and one is awarded for an item discussed in general (see appendix 1).
To ensure consistency across firms, two persons reviewed all individual scores
independently. All disagreements were subsequently reviewed by one of the co-researchers.2
We also searched for articles related to environmental issues contained in the ABI/Inform
Global database using the keywords mentioned above. 59 relevant stories were identified for
2004 (See appendix 2 for the details of collection of environmental news exposure).
3.2 Empirical model
This study attempts to provide an integrated analysis of firms' social and environmental
disclosure strategy. We posit that this strategy affects simultaneously information asymmetry and
disclosure. Based on prior literature, we use share price volatility as a proxy for information
asymmetry. The following structural equations summarize the approach adopted in the empirical
analysis (we will use trading volume in place of share price volatility as a sensitivity analysis):
2 A coding manual documenting coding instructions as well as standardized coding worksheets were prepared beforehand. Each coder then applied the following coding sequence: (1) independent identification of the occurrence of items relative to the different coding categories; (2) independent coding of the items according to quality level of content and (3) timed reconciliation on a subset of company reports. The coders were intensively trained in applying coding instructions and in using the coding worksheets. They were unaware of the research hypotheses. Initial differences in identifying grid items accounted for, on average, 7% of the maximum number of items identified. Of the information quality level coding, less than 10% had to be discussed for reconciliation. Disagreement between coders mostly occurred at the beginning of the coding process (essentially the first 5 firms by industry). A researcher reconciled coding disagreements exceeding 5% of the highest total score between the two coders. Smaller disagreements were resolved by the two coders themselves. Overall, we think that this coding process provides a reliable measure of environmental reporting. Internal consistency estimates (Cronbach's alpha on score components) show that the variance is quite systematic (from alpha 0.72 for environmental disclosure-Press releases to 0.82 for paper-based environmental disclosure).

12
Dependent variable
Share price volatility it =
ƒ( 0 + 1 Systematic risk + 2 Free float + 3 Analyst following + 4 Environmental
disclosure + 5 Environmental disclosure*Social disclosure + 6 Social disclosure + 7
Board independence + 8 Board size + 9 Board size squared + 10 Audit committee size) it
Instrumented
Environmental Disclosure it =
ƒ( 0 + 1Environmental performance + 2 Free float + 3 Analyst following + 4 Leverage
+ 5 Profitability + 6 Firm Size + 7 Board independence + 8 Board size + 9 Board size
squared + 10 Audit committee size + 11 Environmental news exposure) it
For the data concerning governance attributes, we rely to 2004 proxy statements since we
collected governance disclosure web sites during Spring 2005, i.e. in line with information
available from the more recent proxy statement available at that time, namely 2004. Share price
volatility is defined as the standard deviation of percentage changes in daily stock prices for
2005.
3.2.1 Determinants of share price volatility
Prior studies on the determinants of information asymmetry between managers and
investors suggest numerous determinants other than voluntary disclosure (Leuz and Verrecchia,

13
2000). Based on that literature, we use systematic risk, free float and analyst following as
determinants of share price volatility.
Systematic risk. The higher a firm’s systematic risk, the more difficult it is for investors
to precisely assess a firm’s value and the more likely they are expected to incur information costs
to assess its risk drivers. Prior research shows that investors charge a higher cost of equity for
firms with higher systematic risk (e.g. Leuz and Verrecchia, 2000; Hail and Leuz, 2006; Botosan
and Plumlee, 2005; Mikhail, Walther and Willis, 2004; Gebhardt, Lee and Swaminathan, 2001;
and Botosan, 1997). A positive relation is expected between systematic risk and share price
volatility.
Free float. We use free float as an inverse proxy for the presence of insiders since control
blocks have generally superior access to private information (Leuz and Verrecchia, 2000).
Hence, we expect a negative association between free float and share price volatility.
Analyst following. Prior studies (Atiase and Bamber, 1994; Imhoff and Lobo, 1992;
Marquardt and Wiedman, 1998) argued that analyst following proxies for a firm’s information
that is publicly available. More specifically, Roulstone (2003) documents results that are
consistent with analysts reducing information asymmetry by providing public information to
market participants, while there is no support for analyst following functioning as a proxy for
privately held information. A firm’s analyst following is often used as a proxy for the level of
other disclosures and the extent of a firm’ communication with financial analysts (Leuz, 2003).
Hence, we expect a negative relation between analyst following and share price volatility.
Environmental and social disclosures. For testing our substitution hypothesis, we use
Environmental disclosure in interaction with a binary variable Social disclosure greater than the
sample median.

14
Three variables are introduced to capture the impact of corporate governance attributes as
a monitoring factor: Board independence; Board size; and Audit committee.
Board independence. We expect board independence, measured as the proportion of
outside directors, to be associated with share price volatility. Another aspect of board
independence is the separation of the roles of Chair and Chief Executive Officer. Rechner and
Dalton (1991) show that an independent leadership structure in which two different persons are
posted as Chair and CEO monitors the top management effectively. Our variable takes the value
of zero (0) when the majority of directors are not independent, one (1) when the majority of
directors are independent and two (2) when the majority of directors are independent, and the
function of CEO and Chair of the board is separate. We expect a negative relationship between
this variable and share price volatility.
Board size. Some prior studies (e.g. Goilden and Zajac, 2001; Vafeas, 1999) assume the
relationship between board size and information asymmetry to be an inverted “U” shaped, with
and optimal board size existing midway. Below this optimal or the most efficient board size,
there is a positive relation between board size and information asymmetry followed by a negative
relationship. To account for the possible non-linear relationship between board size and
information asymmetry, we will include board size as well as board size squared in our models.
Hence, we expect board size to be negatively associated with share price volatility.
Audit committee size. In Canada, audit committees must comprise at least three
independent members. We can argue that three is a small number for the audit committee to play
effectively its monitoring role and that adding a few more members could be beneficial in that
regard. Hence, we expect audit committee size to be negatively associated with share price
volatility.

15
3.2.2 Determinants of environmental disclosure
Environmental performance. Many authors examine the association between
environmental disclosure in annual reports and a firm’s environmental performance. Results are
mixed. Ingram and Frasier (1980), Jaggi and Freedman (1982), Wiseman (1982), Rockness
(1985), Freedman and Wasley (1990), and Fekrat, Inclan and Petroni (1996) do not find a
significant association between environmental disclosure (in the annual report or in the 10K
report) and the CEP index of environmental performance while Patten (2002a) establishes a
negative relationship. Some recent works document a positive association between
environmental performance and the extent of discretionary environmental disclosures (Clarkson,
Li, Richardson and Vasvari, 2008 and Al-Tuwaijri, Christensen and Hughes II, 2004).
According to Al-Tuwaijri, Christensen and Hughes (2004), a positive relationship conjectures
that prior literature’s mixed results describing their interrelations may be attributable to the fact
that researchers have not jointly considered Environmental disclosure, Environmental
performance, and Economic performance. Legitimacy theory predicts a negative association
between environmental performance and environmental disclosure. This relationship suggests
that environmental disclosure is a function of social and political pressures facing firms
(Clarkson, Li, Richardson and Vasvari, 2008). Environmental performance is computed by
summing toxic release inventory (TRI) of all facilities for an individual company in pounds
deflated by $1,000 of sales (Clarkson, Li, Richardson and Vasvari, 2008; Aerts and Cormier,
2009). To facilitate the interpretation of the results, we reverse the sign of this variable. In other
words, the larger this measure is, the better the environmental performance. Consistent with prior
studies on legitimacy theory (e.g. Patten, 2002a; Aerts and Cormier, 2009), we expect a negative
relation between environmental disclosure and environmental performance.

16
Free float. Ownership structure can determine the level of monitoring and, thereby, the
extent of disclosure (Eng and Mak, 2003). Firms with widely-held ownership are expected to be
responsive to public investors’ information costs since no dominant shareholders typically have
access to the information they need (Hope, 2003) and do want or need to share it with other
stakeholders such as employees (Roe, 2003). Therefore, a positive relation is expected between
free float and disclosure.
Analyst following. Lang and Lundholm (1996) and Healy, Hutton and Palepu (1999) find
a positive relation between analyst following and the quality of a firm’s disclosure. Hence, we
expect a positive relationship between analyst following and the extent of disclosure.
Leverage: Roberts (1992), Richardson and Welker (2001) and while Elijido-Ten (2004)
does not find any significant relationship between leverage and social disclosure while Clarkson,
Li, Richardson and Vasvari (2008) find a positive relationship between leverage and
environmental disclosure based on Global Reporting Initiative Guidelines. Conversely, Cormier
and Magnan (2003) document a negative relationship between leverage and environmental
disclosure.3 Since the actual impact of leverage on environmental disclosure is unclear, no
directional predictions are made for the variable.
Profitability: Many studies document a positive association between a firm’s level of
disclosure and its financial performance (Mills and Gardner, 1984; Cochran and Wood, 1984;
McGuire, Sundgren and Schneeweis, 1988; Cormier and Magnan, 2003). Firms with superior
earnings performance have a higher propensity to reveal their “good news”. Hence, Murray,
Sinclair, Power and Gray (2006) document that firms with consistently higher returns tend to
3 An explanation for the inverse relationship (positive association for social disclosure and negative association for environmental disclosure) could be that social disclosure is more likely to be good news than environmental disclosure.

17
have higher levels of total and voluntary social and environmental disclosure. In this vein, we
expect a positive relationship between profitability and environmental disclosure.
Firm Size. Prior evidence is consistent in showing a positive relation between the extent
of corporate disclosure and firm size (Scott, 1994; Neu, Warsame and Pedwell, 1998). Firm size
proxies also other factors, such as the extent of monitoring by analysts. Firm size, measured as
ln(Assets), is introduced with an expectation of a positive relation with disclosure.
Governance and media monitoring. Three variables are introduced to capture the impact
of corporate governance as a monitoring factor affecting governance disclosure: Board
independence; Board size; and Audit committee size. We expect a positive relationship between
board effectiveness and disclosure. As for board size, to control for non-linearity in the
relationship between board size and disclosure, we will include board size and board size
squared in our models. Hence, we expect board size to be positively related to disclosure.
Environmental news exposure. A number of studies document that higher levels of media
exposure relative to environmental issues increase public concerns and thus public policy
pressure, to which companies react through greater environmental disclosure (Brown and
Deegan, 1998; Deegan, Rankin and Voght, 2000; Patten, 2002b; Li, Richardson and Thornton,
1997; Bewley and Li, 2000). Hence, a positive relationship is expected between environmental
media coverage and environmental disclosure as well as social disclosure.

18
3.2.3 Variable measurement
Variable Measure Systematic risk Beta Free float The percentage of shares that are not closely held
(total shares outstanding minus control blocks of 10% or more).
Analyst following Number of analysts following a firm. Leverage Long term debt / Total assets Profitability Return on assets Firm size Ln(Total Assets) as of year-end Board independence (0) if a majority of directors are not independent; (1) if
a majority of directors are independent; (2) if a majority of directors are independent and if the function of CEO and Chair of the board is separated.
Board size Number of directors on the board. Audit committee size Number of audit committee members. Environmental performance Toxic release inventory (TRI) of all facilities for an
individual company in pounds deflated by $1,000 of sales.
Environmental news exposure Articles related to environmental issues in 2004.
4. Results
4.1 Descriptive statistics
Table 1 provides some descriptive statistics about sample firms’ financial and governance
variables. Sample firms are relatively large (total assets averaging 5 billion dollars) and followed
by seven analysts on average. About 78% of sample firms are freefloat. Systematic risk is close
to the stock market risk, averaging 1.10 suggesting that our sample is a good representation of
the Toronto Stock Exchange. Our sample firms have independent directors in a proportion of
36% while CEO and board chair duality in 20%.
[Insert table 1]
As illustrated in Table 2A, environmental disclosure in annual/environmental reports
(22.29) is on average twice as web-based disclosure (11.03) while the mean score reach 4.13 for

19
environmental press releases. On average, social disclosure score is close to
annual/environmental report disclosure with a mean score of 16.62. Internal consistency
estimates (Cronbach's alpha on score components) show that the variance is quite systematic
(alpha varying from 0.72 to 0.82 for different components). This is slightly higher than Botosan
(1997) who finds an alpha of 0.64 for an index including five categories of disclosure in annual
reports. Cronbach's alpha estimates the proportion of variance in the test scores that can be
attributed to true score variance. It can range from 0 (if no variance is consistent) to 1.00 (if all
variance is consistent). According to Nunnaly (1978), a score of 0.70 is acceptable.
Aerts and Cormier (2009) distinguish between hard (economic-based) and soft
environmental information, with soft environmental disclosure being more incentive-consistent
than economic-based disclosure. Economic-based types of information focus on the financial,
legal and operational consequences of corporate environmental activities. This type of
information is mainly comprised within the following four components of our content grid:
expenditure and risk; compliance with laws and regulations; pollution abatement; and land
remediation and contamination, whereas soft information relates to the ‘sustainable
development’ and ‘environmental management’ grid captions. Disclosure about sustainable
development and environmental management is likely to be more discretionary, less factual and
objective, and easier to imitate even without substance to support the claims made. In table 2B,
we observe higher economic-based environmental information in paper environmental reports
compared with the web and press releases. Finally, among social disclosure components, the
highest mean scores are observed for employment opportunities (2.04), gifts and sponsorships
(2.84), and community involvement (4.13).
[Insert table 2]

20
Table 3 presents correlations. Paper-based environmental disclosure (-0.12), Social
disclosure (-0.22), Board size (-0.36), Profitability (-0.45) and Firm size (-0.46) are negatively
and significantly correlated with Share price volatility. Environmental performance is correlated
with Paper-based environmental disclosure (-0.36), Web-based environmental disclosure (-0.18),
Press releases environmental disclosure (-0.66), and Social disclosure (-0.26), indicating that
poor environmental performers are inclined to communicate more environmental information.
This result is consistent with prior research arguing that environmental disclosure is a function of
social and political pressures facing firms (Patten, 2002a). Environmental news exposure is
positively associated with Environmental disclosure (Paper: 0.33, Web: 0.34, Press releases:
0.34) and Social disclosure (0.35).
Finally, Social disclosure is correlated with Environmental disclosure (Paper, 0.40; Web,
0.46; Press releases, 0.34). Interestingly, results (not tabulated) show that those correlations are
essentially explained by hard social disclosure components (regional development, accidents at
work, health and safety programs, products development and environment).
[Insert table 3]
4.2 Multivariate analyses
Since we posit that a firm’s information dynamics affect environmental disclosure and
share price volatility simultaneously, we first assess whether or not endogeneity exists between
these variables using a Hausman test. Using this procedure, we reject the null hypothesis of no
endogeneity with respect to Share price volatility and Paper-based environmental disclosure
(t=3.49; p < 0.00). Therefore, environmental disclosure variables are treated as endogeneous

21
variables. In light of this diagnostic, we rely on a two-stage estimation procedure for a system of
simultaneous equations. The software being used is STATA.
Table 4 reports results of a two-stage least square estimation. Results show a negative and
significant relationship between share price volatility and the extent of paper-based
environmental disclosure (-0.007; p < 0.01) as well as Social disclosure (-0.398; p < 0.01).
Consistent with hypothesis 1a, the interaction term Paper-based environmental disclosure *
Social is positive and significant (0.006; p < 0.05), suggesting a substitution effect between
social disclosure and environmental disclosure in reducing stock market asymmetry. Concerning
environmental information communicated by press releases, we observe that, in absence of social
disclosure, it increases asymmetry in the stock markets (0.059; p < 0.01), and social disclosure
substitutes for environmental press releases (0.059; -0.059). Moreover, consisted with hypothesis
2, coefficients for variables Web-based environmental disclosure are not significant. An
explanation for this result might be that firms use the web to communicate less factual
information, perceived less credible by market participants. For our sample, on average, 76% of
web scores and 74% of press release scores are soft disclosure (sustainable development and
environmental management).
Results also suggest that audit committee size is associated with a reduction of share price
volatility (-0.167; p < 0.01). This suggests that a larger audit committee may play effectively its
monitoring role and that adding a few more members could be beneficial in reducing stock
market asymmetry.
Results remain similar when we include only one environmental disclosure medium at a
time in the regressions. Moreover, if we drop Social disclosure and keep only environmental
disclosure in the regressions, both Paper-based environmental disclosure (-0.015; p < 0.01) and

22
Web-based environmental disclosure (-0.030; p < 0.01) are associated to a reduction in share
price volatility while Press-releases environmental disclosure is still positively related with share
price volatility (0.006; p < 0.05). This suggests that web disclosure replicates to large extent
environmental information contained in the annual/environmental report.4
[Insert table 4]
Concerning the determinants of environmental disclosure, we observe from table 5 that
environmental performance, environmental news exposure, analyst following and firm size are
key drivers of environmental disclosure. To a lesser extent, leverage and board size are related to
environmental disclosure.
[Insert table 5]
As a first sensitivity analysis, we estimate our model keeping only soft disclosure as
expressed by the two following disclosure components: sustainable development, and
environmental management. Results presented in table 6 show that the coefficients for variable
Paper-based environmental disclosure (-0.013; p < 0.25 two-tailed) and Web-based
environmental disclosure (0.001; p < 0.85 two-tailed) are not significant while the coefficient for
the variable Press releases (0.058; p < 0.01) remains significant. This result suggests that only
4 A principal component factor analysis shows that two factors emerge (explaining 66% of the cumulative variance): (1) Press releases environmental disclosure (0.87), environmental performance (0.92); (2) Paper-based environmental disclosure (0.68), Web-based environmental disclosure (0.82), social disclosure (0.69) and Environmental news exposure (0.68). This suggests that environmental disclosure (paper and web) and social disclosure are part of an integrated reporting strategy. This might explain why we observe a substitution effect between social disclosure and environmental disclosure in reducing the information asymmetry between managers and investors.

23
hard environmental disclosure is associated with a reduction in asymmetry between managers
and investors. This is consistent with hypothesis 2.
[Insert table 6]
As a second sensitivity analysis, we replace Share price volatility by Trading volume as a
proxy for asymmetry in stock markets. Trading volume is defined as shares traded for 2005
divided by shares outstanding at year-end. The model is the following:
Dependent variable
Trading volume it =
ƒ( 0 + 1 Free float + 2 Share price volatility + 3 Environmental disclosure + 4
Environmental disclosure*Social disclosure + 5 Social disclosure + 6 Board
independence + 7 Board size + 8 Board size squared + 9 Audit committee size) it
Instrumented
Environmental Disclosure it =
ƒ( 0 + 1 Share price volatility + 2 Environmental performance + 3 Free float + 4
Analyst following + 5 Leverage + 6 Profitability + 7 Firm Size + 8 Board independence
+ 9 Board size + 10 Board size squared + 11 Audit committee size + 12 Environmental
news exposure) it
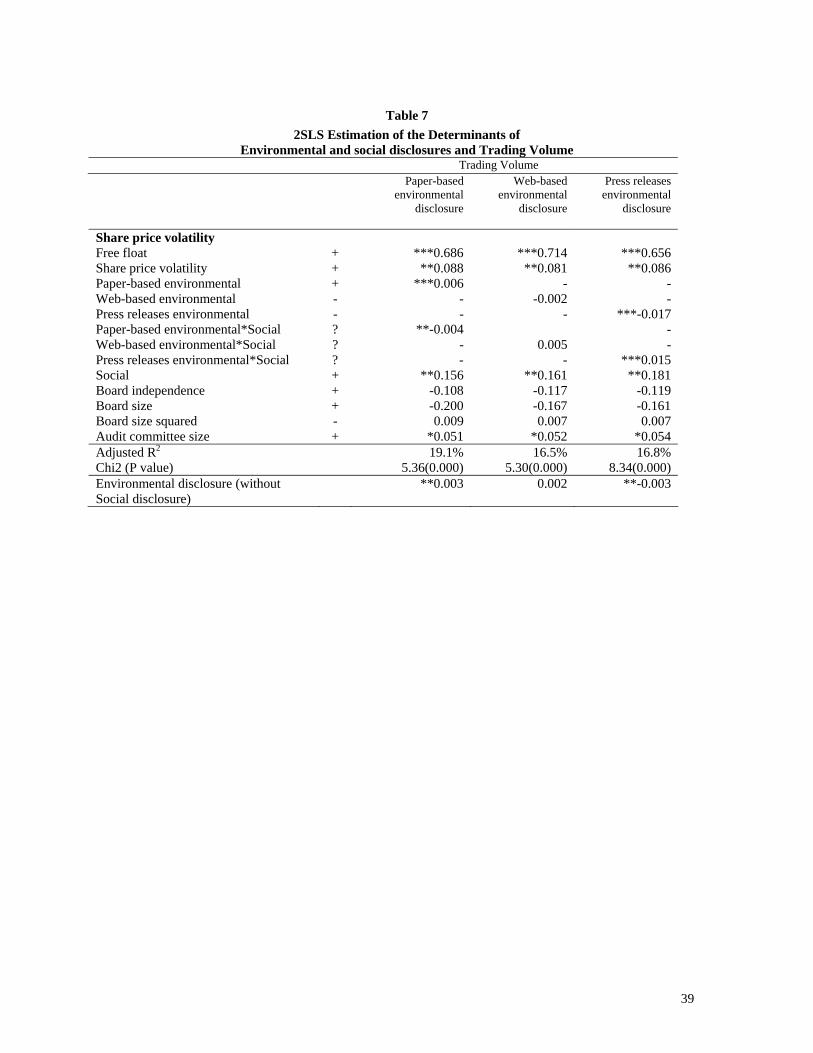
Results shown in table 7 support those presented in table 4. Environmental disclosure-
Paper is associated with an increase in trading volume (0.006; p < 0.01). Consistent with
hypothesis 1a, the interaction term Paper-based environmental disclosure* Social is negative and

24
significant (-0.004; p < 0.05), suggesting a substitution effect between social disclosure and
environmental disclosure in reducing stock market asymmetry (increasing trading volume).
Concerning environmental information communicated by press releases, we observe that, in
absence of social disclosure, it leads to reduction of trading volume, i.e. an increase in
asymmetry in the stock market (-0.017; p < 0.01).
[Insert table 7]
5. Conclusion
Most prior research on corporate social responsibility reporting (CSR) has considered
environmental and social components as additive or complementary. In this paper, we explore
the substitution effect between social disclosure and environmental disclosure in reducing
information asymmetry between managers and investors. In addition, we attempt to show the
association between different environmental disclosure sources and information asymmetry.
Environmental disclosure is coded from three complementary sources: annual/environmental
report, web page and press releases.
Our results suggest that social disclosure and paper-based environmental disclosure
substitute each other in reducing stock market asymmetry. However, environmental information
environmental information communicated on the web page is not related to a reduction in
information asymmetry when we consider social disclosure. This suggests that the use of the web
as a disclosure platform is more tactical than that of the more comprehensive and longer-term
characteristic of annual/environmental report disclosures. With regard to environmental
information communicated by press releases, we observe that, in absence of social disclosure, it
increases asymmetry in the stock markets.

25
These findings suggest that future research in corporate social responsibility reporting
might fruitfully distinguish between social and environmental disclosure as well as
communication devices.
We also show that that audit committee size is associated with a reduction in information
asymmetry. This suggests that a larger audit committee may play effectively its monitoring role
and that adding a few more members could be beneficial in reducing stock market asymmetry.
Regarding the determinants of environmental disclosure, our results show that
environmental performance, environmental news exposure, leverage, and firm size are key
drivers of disclosure.
To the best of our knowledge, our study is the first to investigate the substitution effect of
social disclosure for environmental disclosure, taking into account social disclosure,
environmental performance and governance attributes.
The results of this study should be interpreted with caution at least for three reasons.
First, our measure of social and environmental disclosures is based upon a coding instrument that
makes some explicit assumptions about the value and relevance of information. However, such
an approach is consistent with recent research efforts (e.g., Clarkson, Richardson and Vasvari,
2008). A second potential limitation is that for social disclosure, the paper focuses solely on
voluntary web-based disclosure, as such, excluding hyperlinked documents such as annual
reports or sustainability report. However, we think that our social disclosure scores capture a
firm’s overall social disclosure since we observe substantially larger scores of social disclosure
on the web page for firms publishing a distinct sustainability report. Finally, sample size may be
an issue. However, sample firms do represent a wide cross-section of Canada’s industries as well
as a significant proportion of the country’s total stock market capitalization.
26
References
Adler, P. and Kwon, S.W. (2002), Social capital: prospects for a new concept, Academy of
Management Review, 27(1), 17-40
Aerts, W., Cormier, D. and Magnan, M. (2007), The Association between Web-Based Corporate
Performance Disclosure and Financial Analyst Behaviour under Different Governance
Regimes, Corporate Governance – An International Review, 15(6), 1301-1328.
Aerts, W. and Cormier, D. (2009), Media Legitimacy and Corporate Environmental
Communication, Accounting, Organizations & Society, 34(1), 1-27.
Aerts, W., Cormier, D. and Magnan, M. (2008), Corporate Environmental Disclosure, Financial
Markets and the Media: An International Perspective, Ecological Economics, 64, 643-659.
Al-Tuwaijri, S., Christensen, T.E. & Hughes II, K.E. (2004), The Relations among
Environmental Disclosure, Environmental Performance, and Economic Performance: A
Simultaneous Equations Approach, Accounting, Organizations and Society, 29, 447-471.
Atiase R. and Bamber, L. (1994), Trading Volume Reactions to Annual Accounting Earnings
Announcements: The Incremental Role of Predisclosure Information Asymmetry, Journal of
Accounting and Economics, (May), 309-329.
Barth, M.E. and McNichols, M.F. (1994), Estimation and Market Valuation of Environmental
Liabilities Relating to Superfund Sites, Journal of Accounting Research, 32, supplement,
177-209.
Bewley, K. and Li, Y. (2000), Disclosure of Environmental Information by Canadian
Manufacturing Companies: A Voluntary Disclosure Perspective, Advances in
Environmental Accounting and Management, 1, 201-226.
Botosan, C.A. (1997), Disclosure Level and the Cost of Equity Capital, The Accounting Review,
72(3), 323-350.
Botosan, C. and Plumlee, M. (2005), Assessing Alternative Proxies for the Expected Risk
Premium, The Accounting Review, 80 (1), 21-53.
Brown, N. and Deegan, C. (1998), The Public Disclosure of Environmental Performance
Information – A Dual Test of Media Agenda Setting Theory and Legitimacy Theory,
Accounting and Business Research, 29(1), 21-41.

27
Bushman, R., Chen, Q., Engel, E. and Smith, A. (2004), Financial Accounting Information,
Organizational Complexity and Corporate Governance Systems, Journal of Accounting and
Economics, 37(2), 167-201.
Burt R. S. (1992), Structural Holes: the Social Structure of Competition, Cambridge MA,
Harvard UP.
Chen, C.R. and Steiner, T.L. (2000), Tobin’s Q, Managerial Ownership, and Analyst Coverage:
A nonlinear Simultaneous Equations Model, Journal of Economics and Business, 52, 365-
382.
Chung, K.H. and Jo, H. (1996), The Impact of Security analysts’ Monitoring and Marketing
Functions on the Market Value of Firms, Journal of Financial and Quantitative analysis,
31(4), 493-512.
Clarkson, P.M., Li, Y. and Richardson, G.D. (2004), The Market Valuation of Environmental
Capital Expenditures by Pulp and Paper Companies, The Accounting Review, 79(2), 329-
353.
Clarkson, P., Li, Y., Richardson, G.D. and Vasvari, F.P. (2008), Revisiting the Relation between
Environmental Performance and Environmental Disclosure: An Empirical Analysis,
Accounting, Organizations & Society, 33, 303-327.
Cochran, P. and Wood, R. (1984), Corporate Social Responsibility and Financial Performance,
Academy of Management Journal, 42-56.
Collett, P. and Hrasky, S. (2005), Voluntary Disclosure of Corporate Governance Practices by
Listed Australian Companies, Corporate Governance: An International Review, 13(2), 188-
196.
Cormier, D., Aerts, W., Ledoux M.J. and Magnan, M. (2009), Attributes of Social and Human
Capital Disclosure and Information Asymmetry between Managers and Investors, Canadian
Journal of Administrative Sciences, forthcoming.
Cormier, D., Ledoux, M.J. and Magnan, M. (2009), The Use of Web Sites as a Disclosure
Platform for Corporate Performance, International Journal of Accounting Information
Systems, 10(1), forthcoming.
Cormier, D. and Magnan, M. (2003), Environmental Reporting Management: A European
Perspective, Journal of Accounting and Public Policy, 22, 43-62.

28
Cormier, D. and Magnan, M. (2006), The Revisited Contribution of Environmental Reporting to
Investors’ Valuation of a Firm’s Earnings: An International Perspective, Ecological
Economics, 63(3-4), 613-626.
Deegan, C., Rankin, M. and Voght, P. (2000), Firms’ Disclosure Reactions to Major Social
Incidents: Australian Evidence, Accounting Forum, 24(1), 101-130.
Dess, G.G. and Shaw, J.D. (2001), Voluntary Turnover, Social Capital, and Organizational
Performance, Academy of Management Review, 26(3), 446-456.
Downing, P. (1997), Upping the Stakes, CaMagazine, June, 41-43.
Elijido-Ten, E. (2004), Determinants of Environmental Disclosures in a Developing Country: An
application of the Stakeholder Theory, Fourth Asia Pacific Interdisciplinary Research in
Accounting Conference, Singapore.
Eng L. L. and Mak, Y. T. (2003), Corporate Governance and Voluntary Disclosure, Journal of
Accounting and Public Policy, 22, 325-345.
Fekrat, M. A., Inclan, C. and Petroni, D. (1996), Corporate Environmental Disclosures:
Competitive Disclosure Hypothesis Using 1991 Annual Report Data, The International
Journal of Accounting, 31(2), 175-195.
Fombrun, C. and Shanley, M. (1990), What’s in a Name? Reputation Building and Corporate
Strategy, Academy of Management Journal, 33, 233-258.
Freedman, M., and Wasley, C. (1990), The Association Between Environmental Performance
and Environmental Disclosure in Annual Reports and 10Ks, Advances in Public Interest
Accounting, 183–193.
Gebhardt, W., Lee, C. and Swaminathan, B. (2001), Toward an Implied Cost of Capital, Journal
of Accounting Research, 39(1), 135-176.
Goilden, B. R. and Zajac, E. J.: 2001, When Will Boards Influence Strategy? Inclination × Power
= Strategic Change, Strategic Management Journal, 22, 1087–1117.
Francis, J., Khurana, I. and Pereira, R. (2005), Disclosure Incentives and Effects on Cost of
Capital, The Accounting Review, 80(4), 1125-1162.
Hail, L. and Leuz, C. (2006), International Differences in the Cost of Equity Capital: Do Legal
Institutions and Securities Regulation Matter, Journal of Accounting Research, 44(3), 485-
531.

29
Healy, P., Hutton, A.P. and Palepu, K.G. (1999), Stock Performance and Intermediation Changes
Surrounding Sustained Increases in Disclosure, Contemporary Accounting Research, 16(3),
485-520.
Hill, C.W.L. (1990), Cooperation, Opportunism, and the Invisible Hand: Implications for
Transaction Cost Theory, Academy of Management Review, 15, 500-513.
Hitt, M.A., Lee, H.U. and Yucel, E. (2002), The Importance of Social Capital to the
Management of Multinational Enterprises: Relational Networks among Asian and Western
Firms, Asia Pacific Journal of Management, 19, 353–372.
Hope, O. K. (2003), Disclosure Practices, Enforcement of Accounting Standards and Analysts’
Forecasts Accuracy: An International Study, Journal of Accounting Research, 41(2), 273-
272.
Imhoff, E. A. Jr. and Lobo, G. J.: 1992, The Effect of Ex Ante Earnings Uncertainty on Earnings
Response Coefficients, The Accounting Review, (April), 427-439.
Ingram R.W. (1978), An Investigation of the Information Content of (Certain) Social
Responsibility Disclosure, Journal of Accounting Research, 16(2), 270-285.
Ingram, R.W., Frazier, K.B. (1980), Environmental Performance and Corporate Disclosure,
Journal of Accounting Research, 18, Autumn, 615-22.
Jaggi, B. and Freedman, M. (1982), An Analysis of the Informational Content of Pollution
Disclosures, The Financial Review, 142-152.
Lang, M. and Lundholm, R. 1996, Corporate Disclosure Policy and Analyst Behavior, The
Accounting Review, 71, 467-492.
Lang, L. and Stulz, R. (1994), Tobin’s Q, Corporate Diversification, and Firm Performance,
Journal of Political Economy, 102(6), 1248-1280.
Leuz, C. (2003), IAS Versus US-GAAP: Information Asymmetry-Based Evidence from
Germany’s New Market, Journal of Accounting Research, 41(3), 445-472.
Leuz, C. and Verrecchia, R. (2000), The Economic Consequences of Increased Disclosure,
Journal of Accounting Research, 38 (supplement), 91-124.
Li, Y. and McConomy, B.J. (1999), An Empirical Examination of Factors Affecting the Timing
of Environmental Accounting Standard Adoption and the Impact on Corporate Valuation,
Journal of Accounting, Auditing & Finance, 14(3), 279-313.

30
Li, Y., Richardson, G. D. and Thornton, D.B. (1997), Corporate Disclosure of Environmental
Liability Information: Theory and Evidence, Contemporary Accounting Research, 14(3),
435-474.
Marquardt, C. A. and Wiedman, C. I. (1998), Voluntary Disclosure, Information Asymmetry,
and Insider Selling Through Secondary Equity Offerings, Contemporary Accounting
Research, 15(4), 505-537.
McGuire, J., Sundgren, A. and Schneeweis, T. (1988), Corporate Social Responsibility and Firm
Financial Performance, Academy of Management Journal, December, 854-872.
Marston, C.L. and Polei, A. (2004), Corporate Reporting on the Internet by German Companies,
International Journal of Accounting Information Systems, 5(3), 285-311.
Mikhail, M., Walther, B. and Willis, R. (2004), Earnings Surprises and the Cost of Equity
Capital, Journal of Accounting, Auditing and Finance, 19(4), 491-513.
Milgrom, P. and Roberts, J. (1992), Economics, Organizations, and Management, Englewood
Cliffs, NJ: Prentice Hall.
Mills, D. and Gardner, M. (1984), Financial Profiles and the Disclosure of Expenditures for
Socially Responsible Purposes, Journal of Business Research, December, 407-424.
Murray, A., Sinclair, D., Power, D. and Gray, R. (2006), Do Financial Markets Care about Social
and Environmental Disclosure? Accounting, Auditing and Accountability Journal, 19(2),
228-255.
Neu, D., Warsame, H. and Pedwell, K. (1998), Managing Public Impressions: Environmental
Disclosures in Annual Reports, Accounting, Organizations and Society, 23(3), 265-282.
Nunnaly, J. (1978), Psychometric Theory, McGraw Hill, end Edition, New York.
Orlitzky, M., and Benjamin, J.D. (2001), Corporate Social Performance and Firm Risk: A Meta-
Analytical Review, Business & Society, 40(4), 369-396.
Patten, D.M. (1991), Exposure, Legitimacy, and Social Disclosure, Journal of Accounting and
Public Policy, 10, 297-308.
Patten, D.M. (2002a), The Relation between Environmental Performance and Environmental
Disclosure: A Research Note, Accounting, Organizations and Society, 27, 763-773.
Patten, D.M. (2002b), Media Exposure, Public Policy Pressure, and Environmental Disclosure:
An Examination of the Impact of Tri Data Availability, Accounting Forum, 26(2), 153-171.

31
Pastoriza, D., Arino, M.A. and Ricart, J.E. (2008), Ethical Managerial Behaviour as an
Antecedent of Organizational Social Capital, Journal of Business Ethics, 78, 329-341.
Pirchegger, B. and Wagenhofer, A. (1999), Financial Information on the Internet: A Survey of
Homepages of Austrian Companies, The European Accounting Review, 8(2), 383-395.
Richardson, A. and Welker, M. (2001), Social Disclosure, Financial Disclosure and the Cost of
Equity Capital, Accounting, Organizations and Society, 26(7), 597-616.
Rechner, P.L. and Dalton, D. R. (1991), CEO Duality and Organizational Performance: A
longitudinal Analysis, Strategic Management journal, 12, 155-160.
Roberts, C. B. (1992), Determinants of Corporate Social Responsibility Disclosure: An
Application of Stakeholder Theory, Accounting, Organizations and Society, 17(6), 595-612.
Rockness, J.W. (1985), An Assessment of the Relationship Between US Corporate
Environmental Performance and Disclosure, Journal of Business Finance & Accounting,
12(3), 339-354.
Roe, M. J. (2003) Political Determinants of Corporate Governance, Oxford University Press:
New York.
Roulstone, D. T. (2003), The Relation between Insider-Trading Restrictions and Executive
Compensation, Journal of Accounting Research 41, 525-551.
Scott, T. (1994), Incentives and Disincentives for Financial Disclosure: Voluntary Disclosure of
Defined Benefit Pension Plan Information by French Firms, The Accounting Review, 69(1),
26-43.
Shane, S. and Cable, D. (2002), Networks Ties Reputation and the Financing of New Ventures.
Management Science, 48(3), 364-381.
Vafeas, N. (1999), Board meeting frequency and firm performance, Journal of Financial
Economics, 53, 113–142.
Waddock, S. A., and Graves, S. B. (1997), The Corporate Social Performance-Financial
Performance Link, Strategic Management Journal, 18, 303-319.
Welker, M. (1995), Disclosure Policy, Information Asymmetry and Liquidity in Equity Markets,
Contemporary Accounting Research, 11(3), 801-828.
Williams, S.M. and Ho Wern Pei, C.A. (1999), Corporate Social Disclosures by Listed
Companies on their Web sites: An International Comparison, The International Journal of
Accounting, 34(3), 389-419.

32
Wiseman, J. (1982), An Evaluation of Environmental Disclosures Made in Corporate Annual
Reports, Accounting, Organizations and Society, 7(4), 53-64.

33
Table 1
Descriptive statistics Financial and governance variables
N: 137 Min. Max. Mean Standard
deviation Share price volatility 0.818 8.828 2.135 1.228 Trading volume 0.001 3.733 0.769 0.588 Systematic risk -0.200 2.800 1.101 0.577 Free float 0.098 1.000 0.777 0.225 Analyst following 0 35 7 5.892 Board independence Independent directors Board chair duality
0 0 0
2 0.860
1
0.919 0.360 0.200
0.513 0.178 0.401
Board size 4 18 10 2.718 Audit committee size 3 9 4 1.106 Leverage 0 0.99 0.232 0.203 Profitability -1.151 0.387 0.025 0.139 Firm size (in million$) 25 39 000 5 057 7 389

34
Table 2A Descriptive statistics
Environmental and social disclosures N: 137 Min. Max. Mean Standard
Deviation Cronbach
AlphaEnvironmental news exposure 0 6 0.366 0.944 -- Environmental performance 0 25.78 0.735 2.530 -- Paper-based environmental disclosure
0 134 22.293 31.749 0.82
Web-based environmental disclosure
0 105 11.027 17.895 0.75
Press releases environmental disclosure
0 99 4.127 13.567 0.72
Social disclosure 0 71 16.620 15.568 0.77
Table 2B Descriptive statistics
Environmental and social disclosures by components N: 137 Paper-based
environmental disclosure
Web-based environmental
disclosure
Press releases environmental
disclosure
Social disclosure
Expenditures and risks 3.227 0.246 0.180 Laws and regulations conformity 2.040 0.206 0.173 Pollution abatement 5.033 3.147 0.222 Sustainable development 2.360 2.347 1.007 Land remediation and contamination 5.060 0.940 0.313 Environmental management 4.573 4.140 2.233 Purchases of goods and services 0.047 Employment opportunities 2.040 Job creation 0.333 Equity programs 0.467 Human capital development 0.333 Regional development 0.393 Gifts and sponsorships 2.840 Accidents at work 0.387 Health and safety programs 0.953 Product-related-incidents 0.167 Products development and environment 1.280 Product safety 0.387 Business ethics 1.180 Strategic alliances 0.907 Community involvement 4.127 Social activities 0.447 Other 0.313 Total 22.293 11.027 4.127 16.620

35
Table 3 Correlation matrix
1 2 3 4 5 6 7 8 9 10 11 12 13 14 15 16
1 Share price volatility
1 *0.29 0.03 -0.08 *-0.12 -0.06 -0.07 *-0.22 -0.02 *-0.36 -0.31 -0.01 -0.07 *-0.45 *-0.46 -0.10
2 Systematic risk
1 *0.19 *0.24 0.02 *0.16 0.05 *0.15 0.05 -0.03 -0.01 -0.05 *-0.14 0.10 *0.13 -0.01
3 Free float
1 *0.12 -0.03 0.02 0.01 0.05 0.14 -0.08 0.05 0.01 *-0.30 -0.03 -0.06 0.01
4 Analyst following
1 -0.03 0.03 0.02 *0.18 -0.12 0.02 0.04 -0.02 *-0.29 0.10 *0.14 *0.13
5 Paper-based environmental
1 *0.52 *0.36 *0.40 -0.01 *0.13 *0.12 *-0.36 -0.01 *0.14 *0.40 *0.33
6 Web-based environmental
1 *0.19 *0.46 -0.05 *0.29 *0.27 *-0.18 0.02 *0.12 *0.43 *0.34
7 Press releases Environmental
1 *0.34 -0.02 *0.18 0.09 *-0.66 0.09 0.02 *0.29 *0.34
8 Social disclosure
1 0.01 *0.35 *0.35 *-0.26 0.05 *0.16 *0.53 *0.35
9 Board independence
1 0.09 0.07 -0.02 *-0.14 -0.10 -0.07 -0.08
10 Board size
1 *0.55 *-0.13 *0.17 *0.16 *0.54 0.8
11 Audit committee size
1 *-0.18 0.11 *0.19 *0.38 0.07
12 Environmental performance
1 0.07 -0.07 *-0.22 -0.09
13 Leverage
1 0.07 *0.29 0.01
14 Profitability
1 *0.29 0.07
15 Firm size
1 *0.23
16 Environmental news exposure
1

36
Table 4 2SLS Estimation of the Determinants of
Environmental and social disclosures and Share Price Volatility Share price volatility Environmental
disclosure-Paper-Web-
Press releases
Paper-based environmental
disclosure
Web-based environmental
disclosure
Press releases environmental
disclosure
Share price volatility Systematic risk + ***0.732 ***0.762 ***0.750 ***0.781 Free float - 0.330 0.204 0.194 0.279 Analyst following - **-0.030 **-0.031 **-0.031 **-0.031 Paper-based environmental - ***-0.007 **-0.005 - - Web-based environmental - 0.002 - -0.002 - Press releases environmental - ***0.064 - - ***0.059 Paper-based environmental*Social ? **0.006 **0.005 - - Web-based environmental*Social ? 0.004 - 0.007 - Press releases environmental*Social ? ***-0.063 - - ***-0.059 Social - ***-0.398 ***-0.337 ***-0.397 ***-0.285 Board independence - 0.182 0.184 0.192 0.177 Board size - -0.206 -0.222 *-0.252 -0.231 Board size squared + 0.006 0.007 0.009 0.007 Audit committee size - ***-0.167 ***-0.159 ***-0.171 ***-0.156 Adjusted R2 Chi2 (P value)
32.7% 5.84(0.000)
30.3% 5.56(0.000)
30.4% 6.33(0.000)
31.2% 6.99(0.000)
Environmental disclosure (without Social disclosure)
***-0.015 ***-0.030 **0.006

37
Table 5 OLS Estimation of the Determinants of
Environmental and social disclosures and Share Price Volatility Paper-based
environmental disclosure
Web-based environmental
disclosure
Press releases environmental
disclosure Environmental performance - ***-2.809 0.195 ***-3.582 Information costs and benefits
Free float + -2.768 1.362 *4.399 Analyst following ? ***-0.875 -0.246 0.065 Leverage ? *-22.551 *-12.238 ***15.917 Profitability + 1.683 -5.249 **-7.711 Firm size + ***7.984 ***3.742 -0.177 Governance and media monitoring
Board independence + 1.223 -1.415 0.213 Board size + ***12.988 ***5.608 1.463 Board size squared - ***-0.693 **-0.247 -0.040 Audit committee size + 1.519 **2.319 **-1.629 Environmental news exposure
+ ***8.903 ***4.790 ***4.432
Adjusted R2 F statistic (P value)
37.9% 5.74(0.000)
28.7% 4.38(0.00)
59.9% 12.1(0.00)

38
Table 6 2SLS Estimation of the Determinants of
Environmental and social disclosures and Share Price Volatility Soft environmental disclosure (Sustainable development and environmental management)
Share price volatility Paper-based
environmental disclosure
Web-based environmental
disclosure
Press releases environmental
disclosure Share price volatility Systematic risk + ***0.768 ***0.757 ***0.782 Free float - 0.195 0.126 0.280 Analyst following - **-0.032 **-0.031 **-0.031 Paper-based environmental - -0.013 - - Web-based environmental - - 0.001 - Press releases environmental - - - ***0.058 Paper-based environmental*Social ? 0.013 - - Web-based environmental*Social ? - *0.012 - Press releases environmental*Social ? - - ***-0.059 Social - ***-0.332 ***-0.428 ***-0.281 Board independence - 0.181 0.203 0.173 Board size - -0.230 *-0.262 -0.211 Board size squared + 0.008 0.009 0.007 Audit committee size - ***-0.161 ***-0.166 ***-0.156 Adjusted R2 Chi2 (P value)
30.2% 5.42(0.000)
30.7% 6.87(0.000)
31.3% 6.98(0.000)
Soft environmental disclosure (without Social disclosure)
**-0.007 **0.018 **0.007
39
Table 7 2SLS Estimation of the Determinants of
Environmental and social disclosures and Trading Volume Trading Volume Paper-based
environmental disclosure
Web-based environmental
disclosure
Press releases environmental
disclosure
Share price volatility Free float + ***0.686 ***0.714 ***0.656 Share price volatility + **0.088 **0.081 **0.086 Paper-based environmental + ***0.006 - - Web-based environmental - - -0.002 - Press releases environmental - - - ***-0.017 Paper-based environmental*Social ? **-0.004 - Web-based environmental*Social ? - 0.005 - Press releases environmental*Social ? - - ***0.015 Social + **0.156 **0.161 **0.181 Board independence + -0.108 -0.117 -0.119 Board size + -0.200 -0.167 -0.161 Board size squared - 0.009 0.007 0.007 Audit committee size + *0.051 *0.052 *0.054 Adjusted R2 Chi2 (P value)
19.1% 5.36(0.000)
16.5% 5.30(0.000)
16.8% 8.34(0.000)
Environmental disclosure (without Social disclosure)
**0.003 0.002 **-0.003

40
Appendix 1
Environmental disclosure grid Expenditures and risks Sustainable development Investments Natural resource conservation Operation costs Recycling Future investments Life cycle information Future operating costs Land remediation and contamination Financing for investments Sites Environmental debts Efforts of remediation Risks provisions Potential liability- remediation Risks litigations Implicit liability Provision for future expenditures Spills (number, nature, efforts of reduction) Laws and regulations conformity
Environmental management
Litigations, actual and potential Environmental policies or company concern for the environment Fines Environmental management system Orders to conform Environmental auditing Corrective actions Goals and targets Incidents Awards Future legislation and regulations Department, group, service affected to the environment Pollution abatement ISO 14000 Emission of pollutants Involvement of the firm to the development of environmental standards Discharges Involvement to environmental organizations (industry committees, etc) Waste management Joint projects with other firms on environmental management Installation and process controls Compliance status of facilities Noise and odours Rating scale: 3: Item described in monetary or quantitative terms; 2: Item described specifically; 1: Item discussed in general
Social disclosure Purchases of goods and services Employment opportunities Job creation] Equity programs Human capital development Regional development Gifts and sponsorships Accidents at work Health and safety programs Product-related-incidents Products development and environment Product safety Business ethics Strategic alliances Community involvement Social activities Other Rating scale: 3: Item described in monetary or quantitative terms; 2: Item described specifically; 1: Item discussed in general

41
Appendix 2
News media content News media content is extracted from the ABI/Inform Global database and from three distinct sources: (1) Business, Economics: local and regional business publications (local and regional business news coverage of large corporations, privately held companies, local start-ups, executive profiles, marketing, finance, and industry news. ABI Inform provides access to business information not typically found in national news sources. It contains news and analysis, information on local markets, and more data gathered from major business tabloids, magazines, daily newspapers, wire services, and city, state, and regional business publications; (2) Business, Finance, Economics: journals, company profiles, Wall Street Journal (most scholarly and comprehensive way to explore and understand business research topics. It includes nearly 1,800 worldwide business periodicals for in-depth coverage of business and economic conditions, management techniques, theory, and business practices, advertising, marketing, economics, human resources, finance, taxation, computers, and more. It constitutes extensive international coverage with quick access to information on more than 60,000 companies with business and executive profiles); (3) Canadian Newsstand, which offers unparalleled access to the full text of Canadian newspapers (Montreal Gazette, National Post and Toronto Star). We extracted articles using a firm’s name and the following keywords: “environment”, “sustainable development”, “recycling”, “pollution”, “toxic”, “ISO14000”, “conservation”, “remediation”, “spills”, “waste management”, “energy”, “awards”, “environmental audit”.