
SOCIAL AND BEHAVIOURAL SCIENCE … to the Masyarakat Ilmuwan dan Teknolog Indonesia (MITI), the...
67
ISSN PRINT 2338-1043 ISSN ONLINE 2338-8099 SOCIAL AND BEHAVIOURAL SCIENCE ENGINEERING AND MATHEMATICS PHYSICAL SCIENCE LIFE SCIENCE
Transcript of SOCIAL AND BEHAVIOURAL SCIENCE … to the Masyarakat Ilmuwan dan Teknolog Indonesia (MITI), the...

ISSN PRINT 2338-1043
ISSN ONLINE 2338-8099
SOCIAL AND
BEHAVIOURAL SCIENCE
ENGINEERING AND
MATHEMATICS
PHYSICAL SCIENCE
LIFE SCIENCE

!
��
��
�EDITORIAL BOARD��Editor-in-Chief
Fatwa Firdaus Abdi
�Associate Editors
Sigit Aryo Pambudi Raditya Yudha Wiranegara Joni Welman Simatupang Hutomo Suryo Wasisto Junaedy Yunus Etin Dyah Permanasari Sarrah Ayuandari Almando Geraldi Awidya Santikajaya Liyu Adhikasari Hadi Teguh Yudhistira Ferry Anggoro Ardy N Sendy Pang
�
��SUPPORT TEAM
Executive Board
Iwa Kartiwa Bagus Nugroho Radium Ikono
Secretary
Ilma Andayana Dany Perwita Sari
Kurnia Yohana Yulianti
Submission Officer
Fadhilah Muslim Rahma Muthia Windy Iriana
Roy Simorangkir Muhammad Firmansyah K
Sponsorship and
Cooperation Officers
Riezqa Andika Hafsah Halidah
Elok Pratiwi
IT Support Officer
Adhitya Bhawiyuga Muhammad Wahyono
Public Relations and
Media Officers
Eryan Ramadhani Jessica Natalia Widjaja
Nurul Aufa Tangguh Chairil
Ershad Junus Amin
Book Cover Designer Emirpasha Bhaskara K
�
WEBSITE http://www.isjournal.org
ISSN Print
2338-1043
Online 2338-8099
In Collaboration With
�����������
Colophon
IS Journal strictly prohibited any practice of plagiarism in its published paper. By submitting paper to this journal, the authors had agreed to this policy. IS Journal is not responsible for any related misconduct.!
!!
COLOPHON
CONTENTS
EDITORIAL
SOCIAL BEHAVIORAL SCIENCE !The!Efficacy!of!Underdog!Brand!Strategy!in!Indonesia’s!Political!Marketing!Singgih&Setiadi,&Harryadin&Mahardika&
Indigeneity and Democracy in Indonesia (a view of The Toraja Ethnic Group) Sukri Tamma
Postharvest Integration of Rice and Soybean for Supporting National Food Security Dini Nur Hakiki, Nurfitri Ramadhani
ENGINEERING AND MATHEMATICS Energy Efficiency Imrpvement of Trawlers Alyuan Dasira, Jean-Marc Laurens
Development of Phrase-Based Approach for Answer Finder on Indonesian Factoid Question Answering Alvin Andhika Zulen, Ayu Purwarianti
Optimization Preparation and Characterization of ZSM-5 Zeolite Synthesis Using Rice Husk Chindy Feryandy HB, Simparmin Br Ginting, Hens Saputra
Implementation of Polynomial Basis Squaring Marisa Paryanto, Budi Rahardjo
PHYSICAL SCIENCE Shale Gas as an Alternative Energy in the Fulfillment of Gas Energy Requirement for Indonesian State Electricity Company (PLN) Dr. Ing. Ir. H. KRT. Nur Suhascaryo, B.Eng., M.Eng., Hongki Budi Prasetyo
LIFE SCIENCE Usage of Tuba (Derris eliptica) Root Extract as Environmentally-Friendly Insecticide to Control the Population of Lymantria beatrix Eko Budiyanto, Arvana Rifki Aditya, Ardi Yuli Wardani, C. Budimarwanti
PHP14-siRNA in GPC3-PEGylated Chitosan Nanoparticles: Providing a New Therapeutic Approach for Hepatocellular Carcinoma Dwijo Anargha Sindhughosa, Stephanie Patricia, Liveina, Ida Bagus Tjakra Wibawa Manuaba
“Anti-Rabies Egg” as Serotheraphy of Rabies Cases Mohammad Vicky Indra P, Dian Fitriani, Werstant, Marisa Rahmanti, Chaterina
Contents

��
��
Following the inception of Indonesian Scholar Journal (IS Journal) in early 2013 and our first edition published last year, I am happy to introduce the second edition of IS Journal publications. IS Journal is an open access journal initiated by Indonesian scholars around the world. Its mission is two-fold: (i) to advance research and knowledge of Indonesian scholars, and (ii) to create awareness of the significance of effective scientific writing and at the same time improve the scientific writing skills of Indonesian scholars.
As most of us realize, research process can be divided into several stages. The first few stages comprise the identification of research problem, design of experiment, the experiment itself, and data analysis. However, this is really not the end of the process. The dissemination of research through publication, which is the next stage, is also as important―if not more important. Research dissemination has been used as the basis of determining research focus direction of a country, research funding decision, and it is the key component to creating a snowball effect on a certain research topic. Based on SJR SCImago Journal & Country Rank in 2012, Indonesia is number 61 for total number of publications and number 57 for the impact of these publications (H-index). While this is definitely not the worst, this low ranking should alarm us to start taking concrete actions. In South East Asia, Indonesia is far below Singapore, Malaysia and even Thailand. As a comparison, there are ~150,000 scientific publications output from Singapore, while there are only ~20,000 from Indonesia. The numbers are even more worrying if we look at the output per capita. IS Journal is therefore present as an answer to this condition, and we hope that the concrete improvement can be realized in the near future.
In this second edition of IS Journal, the papers are still categorized into four areas: life science and medicine, social and behavioral science, mathematics and engineering, and physical science. Life science and medicine combined with mathematics and engineering make the majority of the papers. We would like to take this opportunity to appreciate all authors for their contribution to IS Journal. We thank your trust in publishing your work with us and we look forward to your future contributions. At the same time, we also invite all Indonesian scholars to be involved with IS Journal, be it by contributing your research work and publishing at IS Journal, or by joining us as one of our committee or editorial board members.
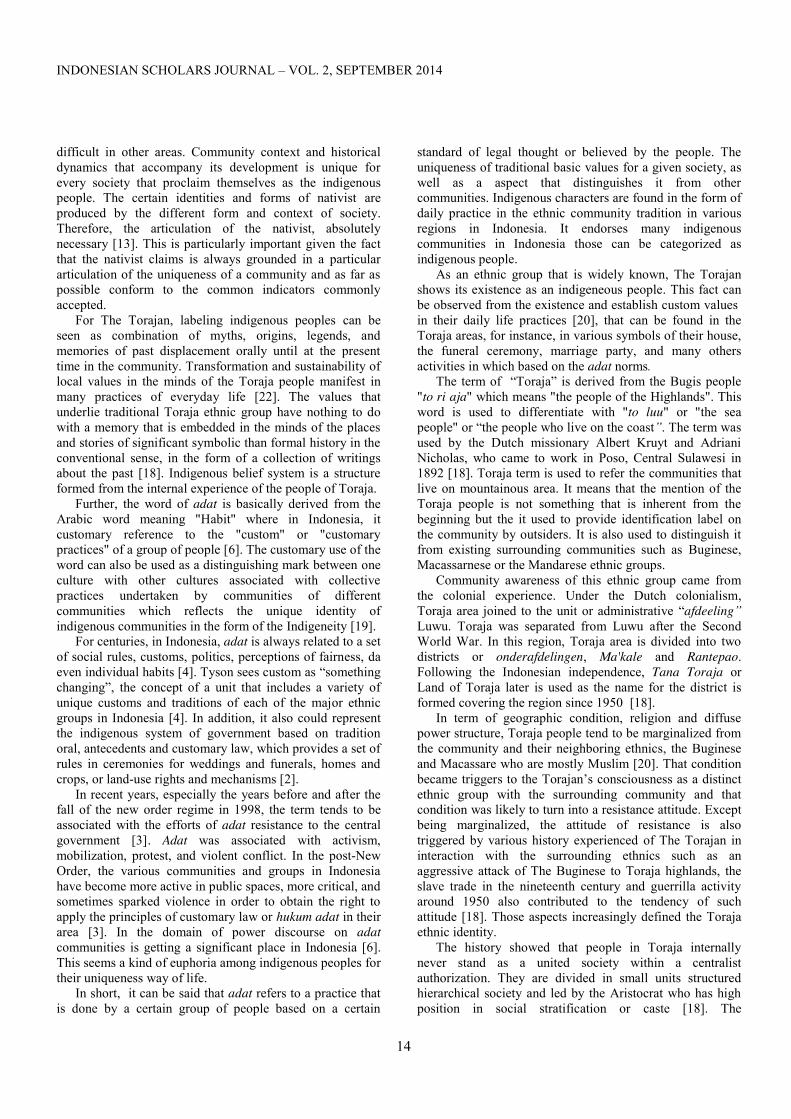
We feature the following paper in this edition: “Shale Gas as an Alternative Energy in the Fulfillment of Gas Energy Requirement for Indonesian State Electricity Company (PLN)” authored by Dr. Ing. Ir. H. KRT. Nur Suhascaryo, B. Eng, M. Eng
Editorial

�� and Hongki Budi Prasetyo. The paper poses a clear problem faced by Indonesia in terms of meeting the gas demand. Based on their projection, PLN is set to face ~1.4 billion standard cubic feet deficit of gas each day. In order to solve this, they propose the exploitation of shale gas (non-conventional type of gas; natural gas trapped within shale formations) as the solution to meet this deficit. As the potential of shale gas in Indonesia is about 574 trillion standard cubic feet, they conclude that it is clear that the development of shale gas in Indonesia should be explored. While the topic of shale gas exploitation is still an ongoing debate, this paper clearly serves to increase our awareness of such problem and therefore deserves a spotlight in our current edition.
Through this opportunity, I am also pleased to report that we have conducted a Scientific Writing Workshop from March-June 2014. Done in collaboration with Radio PPI Dunia, we invited Indonesian students to undergo series of online lecture/tutorial that is aimed to improve their scientific writing skills. This is very much in line with our missions stated above. This workshop is planned to occur regularly as a part of our concrete contribution to the Indonesian scholars community.
Finally, I would like to thank all individuals and parties that have contributed to the continual existence of IS Journal. First, it is without a doubt that most appreciation should go to my fellow committee and editorial board members for all the necessary hard work in running such a publication. While we are greatly dispersed to separate locations across the world and most of us have not physically met each other, the fact that we are able to run the organization and the publication itself deserves an acknowledgment. We also thank all our partner conferences for the wonderful collaboration that we have had. Finally, a big thank goes to the Masyarakat Ilmuwan dan Teknolog Indonesia (MITI), the Ikatan Ilmuwan Indonesia Internasional (I4), and the Overseas Indonesian Students Association Alliance (OISAA) for their generous support.
We sincerely hope that our current edition would be interesting and beneficial for you. Your comments, suggestions, and recommendations are always welcome at [email protected].
Fatwa Firdaus Abdi Editor-in-Chief
�
Editorial

Associate Editors
Awidya Santikajaya
The Australia National University, Australia
Liyu Adhikasari Universitas Indonesia, Indonesia

INDONESIAN SCHOLARS JOURNAL – VOL. 2, SEPTEMBER 2014
7
The Efficacy of Underdog Brand Strategy in Indonesia’s Political Marketing
Singgih Setiadi, S.E.1 and Harryadin Mahardika, Ph.D. 2
1Research Fellow, Faculty of Economics and Business, Universitas Indonesia 2Lecturer in Marketing, Faculty of Economics and Business, Universitas Indonesia
Abstract. Underdog brand biography has become an exciting trend in Indonesia’s political marketing landscape. Candidates, including in the latest presidential election, exploits the story of their humble origins, resources limitation, and their determination when struggling against the odds. Prior research has confirmed the efficacy of underdog brand biography in increasing consumers’ willingness to buy an underdog brand, particularly for consumers who also see themselves as underdog. We examine this notion in the context of political marketing, specifically in 2014 Indonesian presidential election in which a few candidates employed underdog brand biography as their campaign strategy. First time voters were recruited as participants of a lab experiment. Data were analyzed using moderated regression analysis (MRA), classic assumption test, and double step mediated regression analysis to examine the effect of mediating and moderating variable. Results show a significant effect of underdog brand biography toward subjects’ intention to vote, which is amplified by a partial mediation of self brand connection. Meanwhile, the effect of underdog brand biography toward subjects’ intention to vote is also moderated by self identity. Considering Indonesian’s tendency to favor the underdogs, this findings offer political marketers in designing their political marketing tools for presidential election and an initial evident for further examination toward the aforementioned notion.
Keywords : political marketing, underdog strategy, presidential election
A. BACKGROUND The idea of underdog brand strategy is to attract consumers with inspiring stories of how a targeted brand was struggling before winning the market. This strategy could be most effective for consumers who see an alignment between their own life experiences with the brand’s underdog stories. Interestingly, the emergence of underdog brand strategy could not be separated from the socio-cultural environment. Each culture developed a different perspective towards underdog, which is evident in popular folklores and stories from Cinderella and Robin Hood to religious literature such as David against Goliath (Vandello & Goldschmied, 2009). As a result, some cultures tend to favor the underdogs compared to the topdogs. In a more contemporary setting, the efficacy of underdog story to influence consumers’ mind have been portrayed in some inspiring stories such as the brilliance of Greek football team against Portugal in the 2004 European Cup final; the competition between Southwest airline and United Airlines; or the contest between Apple versus Microsoft (Hoch & Deighton, 1989). One of noteworthy context to further discuss the efficacy of underdog brand strategy is in the world of politics. There are many reasons underlying voters decision to vote, among them is their subconscious-favorability toward an underdog candidate. Naturally, the tendency to favor an underdog could be driven by a person tendency to opt in counter-conformity, unpopular choice, or avoidance of similarity, which is motivated by justice-based motivation and utilitarian-based motivation (Goldschmied, 2007).
In the implementation of the strategy, the use underdog brand biography can be declared directly by the candidate, or affirmed by other parties such as analysts, political experts, and the media. The main message in underdog brand biography includes the impression of a humble candidate that encounters limitation in resources and accesses in his/her early days in the politics. Although in these recent days he/she has become a top politician, the underdog story of the candidate will most likely attract sympathy from the voters (Vandello & Goldschmied, 2009). Underdog statements and stories have become typical in Indonesia’s latest presidential election. For example, Jokowi, the frontrunner in the contest was stated: "I want to say, I am not afraid of a formidable opponent, a grand coalition, big party, big capital" (metroTVNews.com). Another candidate, Aburizal Bakrie, was portrayed by his campaign manager as: "His courage to take risks is truly amazing. I will never forget his brave story, while running for the position of Chairman of the Indonesian Chamber of Commerce and Industry he was 'against’ a candidate who was strongly endorsed by the late President Suharto" (icalbakrie.com). This strategy is an exciting trend, which the candidates believe it will be an effective approach to target first time voters and traditional voters. Based on aforementioned background, this study examines the efficacy of underdog brand strategy in increasing voting intention toward presidential candidate. The 2014 presidential election in Indonesia is used as a context for this study. Indonesia is the third largest democracy in the world, and has just held three presidential elections since the fall of military dictatorship in 1998. Many interesting new ideas in political

INDONESIAN SCHOLARS JOURNAL – VOL. 2, SEPTEMBER 2014
8
marketing are flourishing in this new democracy, mostly because political parties and candidates are still experimenting to find the most effective strategy. In 2009 presidential election, about 45.6% voters claimed to have confidence when voting the presidential candidates, based on factors such as ideology and policies. Meanwhile 54.5% were undecided swing voters, and therefore can be expected to seek ‘signals’ about the candidates that can help them making a mental shortcut to decide who to vote. These ‘signals’ include the underdog story of the candidate.
B. LITERATURE REVIEW Based on previous research conducted by Keinan et al. (2010), an underdog brand should have two main features, namely external disadvantaged and passion & determination. This concept rises as an alternative option to the nature of superiority or usually called as topdog. The difference between underdog versus topdog brands lies in the expectation of the growth of the market share (Hoch & Deighton, 1989). Underdogs perceive to have high growth potential, whereas the topdogs were already achieved their highest position. In addition, underdog refer to the ability to ‘climb the ladder’ although encounter many obstacles, while topdog is a privileged position that inherited by special circumstances (Vandello & Goldschmied, 2009).
Fig. 1. Underdog definition (Keinan et al., 2010)
The effect of underdog brand biography toward purchase intention has been empirically tested by Keinan et al. (2010). The aforementioned study offers an opportunity for further examination on another research avenue. Therefore, this study would like to test the boundary conditions of underdog brand biography effects by using political marketing as a context. Political campaign shares the DNA of commercial product advertisement; in which candidate’s stories and character development influence the formation of voters’ attitude and intention to vote (Stern, 1994). Increasingly, the field of political marketing borrows more strategies from goods and services marketing (e.g. Sharma, 1976; Buttler & Collins, 1994; Osuagwu, 2008; Hackley & Peng, 2009). One of the main reasons of this phenomenon is the growing awareness among political candidates that they need to develop story and personality through images that show their similarities with potential voters (Crano, 1983;
Funk, 1999). This approach could be more effective compared to promoting political ideology and policies in a less mature democracy, such as Indonesia. Firmanzah (2008) stated that in this era of abundant information, voters will be saturated with too much stimulus from various sources. Media showers voters with information about political candidates, it risks voters’ ability to make a rational judgment, in the extent that they may disregard the rational aspect and thus more focused on emotional side when making a voting decision. Emotional factors are often used as heuristic, an information shortcut, which may creates less optimal decision (Newman & Sheth, 1985). Political marketers use cues such as candidate’s track record, life stories, past reputation, to assist voters who have limitations in analyzing the quality of political candidate due to the overwhelming quantity of information (Firmanzah, 2008). Candidate’s underdog story plays as a cue that work as an information shortcut to help voters in decision making. A cue of this kind creates impression on quality of work and effectiveness of programs offered by the targeted candidate (Karp et al, 2002). Hypotheses Development In order to test the boundary conditions of underdog brand biography, this study aims to address the following research questions: (1) does underdog brand biography effective for a new comer (anonymous candidate)?; and (2) does the effects of underdog brand biography influenced by factors such as subject’s self-identity and subject’s self-brand connection? Consumers form perception toward underdog by examining stories and characters of the proposed brand (Keinan et al., 2010). The underdog story will be more believable if the brand is already reaching a successful state. For example the underdog brand biography of Apple will be more believable and impactful compared to the underdog brand biography of unknown brand (e.g. a startup technological company). Intuitively, we contend that the same effects will be found in political context. The effects of underdog biography of an anonymous candidate should not be different compared to neutral biography. Therefore, we hypothesize: Hypothesis 1: Intention to vote will be significantly higher for popular candidate than anonymous candidate when underdog brand biography is employed. Hypothesis 2A and 2B: The relationships between attention to underdog brand biography and intention to vote will (not) be significant for popular (anonymous) candidate when underdog brand biography is employed. Value congruence is an intervening variable that refers to the similarity and compatibility between individuals and the candidates. A strong value congruency may boost voters’ confidence and commitment toward political candidates (e.g. Newcomb, 1978; Byrne et al, 1986; Meglino, Ravlin, & Adkins, 1989). Processing underdog storyline could increase
Low High
Passion & Determination
Victim Underdog
Topd Dog Privileged Achiever
Underdog Disposition Matrix
Ext
erna
l D
isad
vant
aged
Low
Hig
h

INDONESIAN SCHOLARS JOURNAL – VOL. 2, SEPTEMBER 2014
9
self brand connection, resulting in better attention and higher possibility to make a more accurate decision. Thus, we hypothesize: Hypothesis 3A and 3B: self-brand connection is (not) mediating the relationship between attention to underdog brand biography and vote intention for a popular candidate (anonymous).
Fig. 2. Research hypotheses Individuals have a desire to choose a brand that reflects their identity and tend to avoid brands that do not align with their identity (Keinan et al., 2010). In the political context, similarities and the attractiveness influence the voters who have the attitude, the establishment of self, and the principle of life similar to the political candidates. The more the two parties have in common, the sense of mutual interest (attraction) to each other increases and make other factors irrelevant (Crano, 1983; Condon & Crano, 1988). Therefore, we hypothesize: Hypothesis 4A and 4B: Self-identity is (not) moderating the relationship between attention to underdog brand biography and vote intention of a popular candidate (newcomer /anonymous).
C. EXPERIMENT 168 first time voters were recruited to participate in a lab experiment. They were randomly assigned to a condition of within–subjects 2 brand biography (underdog, neutral) x 2 popularity of candidate (popular, anonymous). The experiment was conducted by following the guideline of Keinan et al. (2010). Before performing the experiment, we performed a pre-test to 30 first time voters to see whether the manipulated popular candidates (and anonymous candidate) storylines is qualified as an underdog brand biography. The manipulated storylines were assessed by participants, and the results indicate there is a difference in the value of the minimum requirement assessment between neutral storylines and underdog storylines for both type of candidates. The experiment was then conducted in a laboratory setting. The neutral brand biography of popular versus anonymous candidates was given to the participants at the beginning of the
session. Accordingly, participants were given underdog brand biography manipulation. In between the treatment, they were given a cognitive exercise to erase the effects of the initial treatment (neutral brand biography). Finally, participants were asked to respond to a questionnaire containing intention to vote and attention to underdog brand biography measures.
D. FINDINGS & ANALYSIS The findings confirmed hypothesis 1, there is a significant difference of intention to vote between popular and anonymous candidate when underdog brand biography is in place. This( indicates the efficacy of underdog brand strategy for political candidate who is already famous. Whereas for those who are newcomer or anonymous to voters, they should avoid using such strategy. Hypothesis 2A and 2B were tested using regression and the result was the following regression formula:
Y = 1,357 + 0,442X + error (2A) Y = 1,140 + 0,522X + error (2B)
Based on abovementioned formula, it is confirmed that there is a positive and significant effect between underdog brand biography and intention to vote in both the case of anonymous candidate and popular candidate. Analysis on Hypothesis 3A and 3B shows the following formula:
Y = 0,142X + 0,426M (3A) Y = 0,522X (3B)
Fig. 3. Total value of self brand connection mediation variable The coefficient is positive and significant, which indicates that self-brand connection partially mediating the effect of underdog brand biography toward intention to vote. It leads to an indication that underdog brand biography may not be the sole determinant of vote intention, but it is still a key determinant of vote intention. In addition, popular candidates induce stronger self-brand connection than anonymous candidate. Meanwhile, analysis on Hypotheses 4 for the anonymous candidate [4A] and popular candidate [4B] shows the following moderation:
Y = 1,150 + (-0,088) + 0,378X2 + 0,084X1*M (4A) Y = 0,952 + (-0,094) + 0,481X2 + 0,085X1*M (4B)
It is found that moderating variables were higher for popular candidate [4B] than for anonymous candidate [4A]. However, the coefficient is negative and the values of

INDONESIAN SCHOLARS JOURNAL – VOL. 2, SEPTEMBER 2014
10
moderating variable only indicate a pseudo moderating. Moreover, self identity variable strengthen the effects of attention on vote intention, even when first time voters are not in underdog disposition condition. Overall, results show the efficacy of using underdog brand strategy in political marketing. Popular candidate could get more benefit of this strategy compared to newcomer. Candidate who opts to use this strategy should design an intervention strategy to ensure that voters’ perceive their self-identity is aligned with candidate’s positioning. Finally, a big chunk of targeted voters should be specified. Campaign message should be developed to build ‘self-brand connection’ between this targeted voters and the candidate. E. RESEARCH LIMITATIONS Like all study of this nature, the present research is not without limitations. One of notable limitation is the number of samples. We should expand the size of the samples to get more variation. In addition, the lab experiments were conducted in two high schools, which may not ideal for maintaining randomization. There is also potential limitation with the selection of popular candidate in the study. We are selecting Aburizal Bakrie, a long time politician in Indonesia, who actually has a negative reputation despite being popular. He may induce respondent bias, as some participants could have negative perception toward his candidacy. Future study should try to select a politician with more positive reputation. Finally, to increase the generalization of our conceptual framework, it is necessary to recruit of participants who are not first time voters. This will ensure more variation, and help us to expand the boundary conditions of underdog brand strategy. First time voters (Generation Z) are mostly social media active, who known to have shorter span of attention. These first timers have a lower ability to read a long biography of the candidate. Therefore, the design of the experiment should also embrace the option of using shorter candidate’s biography.
REFERENCES [1] Butler, Patrick and Collins, Neil. (1994). Political Marketing : Structure
and Process. European Journal of Marketing; pg. 19 [2] Byrne, D., Clore, G.L., & Smeaton, G. (1986). “The attraction
hypothesis: do similar attitude affect anything?” Journal of Personality and Social Psychology, (51), hlm. 1167- 1170
[3] Condon, 1. W., & Crano, W. D. (1988). Inferred evaluation and the relation between attitude similarity and interpersonal attraction. Journal of Personality and Social Psychology, 54, 789-797.
[4] Crano, W. D. (1983). Assumed consensus of attitudes: The effect of vested interest. Personality and Social Psychology Bulletin, 9, 597-608.
[5] Firmanzah (2008). “Marketing Politik : Antara Pemahaman dan Realitas” Yayasan Obor Indonesia.
[6] Funk, C. L. (1999). Bringing the candidate into models of candidate evaluation. Journal of Politics, pg. 700-720.
[7] Goldschmied, Nadav. (2007). The Appeal of the Underdog: Definition of the Construct and Implications for the Self. A dissertation in Department of Psychology, College of Arts and Sciences, University of South Florida.
[8] Hackley, Chris. and Peng, Norman. (2009). Are voters, consumers? A qualitative exploration of the voter-consumer analogy in political marketing. Qualitative Market Research: An International Journal Vol. 12 No. 2, pp. 171-186
[9] Hoch, Stephen J. & Deighton, John. (1989). Managing What Consumers Learn from Experience. Journal of Marketing. 53, pp. 1-20
[10] Karp, J.A., Vowles, J., Banducci, S.A., & Donovan, T. (2002).”Strategic voting, party activity, and candidate effect: testing explanations for split voting in New Zealand’s new mixed system, “Electoral Studies, (21),1, hlm. 1-22.
[11] Keinan, Paharia, Avery, Schor. (2010). The Underdog Effect: The Marketing of Disadvantage and Determination through Brand Biography. Journal of Consumer Research.
[12] Meglino, B. M., Ravlin, E. C., & Adkins, C. L. (1989). A work values approach to corporate culture: a field test of the value congruence process and its relationship to individual outcomes. Journal of Applied Psychology, 424-432.
[13] Newcomb, T.M. (1978).”The acquaintance process: looking mainly backward,”Journal of Personality and Social Psychology, (36), hlm. 1075-1083
[14] Newman, B. and Sheth, J. (1985), “A model of primary voter behaviour”, Journal of Consumer Research, pp. 21-33.
[15] Osuagwu, Linus. (2008). Political marketing: conceptualisation, dimensions and research agenda. Marketing Intelligence & Planning. Vol. 26 No.7, pp. 793-810
[16] Pramono, Dewi Motik. Cerita Tak Terlupakan Saat Bang Ical Memimpin Kadin. 28 Januari 2010. http://icalbakrie.com/?p=357
[17] Pujianto, Rommy. Saya Tidak Takut Dengan Koalisi Besar. 20 Mei 2014. http://pemilu.metrotvnews.com/read/2014/05/26/246002/jokowi-saya-tidak-takut-dengan-koalisi-besar
[18] Shama, Avraham. (1976). The Marketing of Political Candidates. Academy of Marketing Science. Journal (pre-1986); pg. 764
[19] Stern, Barbara B. (1994), "Classical and Vignette Television Advertising Dramas: Structural Models, Formal Analysis, and Consumer Effects," Journal of Consumer Research, pg. 601-15.
[20] Vandello, Joseph A., & Goldschmied, Nadav. (2009). The Advantage of Disadvantage: Underdogs in the Political Arena. Basic and Applied Social Psychology. 31, pp. 24-31

INDONESIAN SCHOLARS JOURNAL – VOL. 2, SEPTEMBER 2014
11
Indigeneity and Democracy in Indonesia (a view of The Toraja Ethnic Group)
*Sukri Tamma
Southeast Asian Studies Institute, Bonn University, Germany *[email protected]
Abstract. As a country with a great ethnic and cultural diversity, indigenous people is a crucial issue in Indonesia. Once marginalized in the era of Suharto's New Order, indigenous people tend to stand up in the Reform Era of the “Era Reformasi”. Democratization and decentralization in the post-New Order are seen as an opportunity for indigenous people as well as the increasing of appreciation to the issues of "indigenous people" at the international level in the form of the United Nations conventions to reclaim their rights and significant position in their region. However, the revival of indigenous people as well as the trend of democratization in Indonesia potentially result in different form based on the different localities. In the Toraja context, it potentially creates dilemmas. On one side, Toraja is part of Indonesia which is also in progress of democratization as impact of “Era Reformasi”. On the other hand, there is potentially an objective context which does not fit between democracy practices, such as elections and local elections, with established traditional values. Finally, in the context of Toraja Ethnic group in Toraja area (Toraja District and North Toraja District), the practice of democracy requires different approach to bridge Toraja’s indigeneity and the democratisation process in Indonesia. Without any compromise between the way of democracy and the established traditional values, the democratization in Toraja potentially will fail. It will produce not only unlegitimate governance based on the local values. but the Torajan indigeneity potentially will also disappear.
Keywords : Adat, Democracy, Indigenous People, Election, Reform Era, The Torajas.
A. INTRODUCTION Democracy is one of the most important issues in the
history of human evolution. The idea of democracy emphasizes the existence of a government system where people become the center of its legitimacy. Today's democracy is being applied to most countries in the world [1] although it is still in different forms and interpretations. Democracy seems to be the guarantee for the achievement of better life. Nevertheless, apparently it can not be viewed as simply as that. Democracy potentially produces various responses and interpretations due to the variety of social contexts.
In the context of Indonesia, democracy is widely expected to create the better conditions of social life, including in the local communities. However, several phenomenas suggest that implementation of democracy at the local level tends to produce different condition beyond the expectation related to the distinction context of each region [2, 3, 4, 5, 6]. It allows the differences of locality associated with local values, customs and traditions.
In the context of indigenous peoples, traditional values which are held in daily life tend to be an important basis for people behavior. Although the belief of a truth is based on the individual psychological aspects [7], but it is still associated with a particular value system that they believe in. In the context of indigenous peoples, the beliefs are usually related to social values that have became common. Therefore, the custom values are perceived as the truth for people based on their common values in daily life.
This view affects to encounter of democratization and indigenous peoples in Indonesia. Democratic ideas embodied in formal institutions including legislation will meet with common values of indigenous peoples, the interests of relevant actors as well as international support for the rights and existence of indigenous people. Then, the form of democracy result would be highly related to the dynamic of those aspects.
In term of legal pluralism, it was seen as a different discourse or the presence of thought in a simultaneously public interaction space. In this situation, actors need apropriate action to fix with the context. According to Beckman, as an arena for interest conflict, there will also be an opportunity for certain circles to manipulate the situation so that they can reduce the various aspects that potentially threaten their interest and in the same time it potentially gives them opportunity to gain their political interests [8]. Therefore, the space which all of aspects meet will full of manipulations by various parties involved. The manipulation is always based on a particular interpretation of the existing reality by linking it to various important aspects both formal rules and indigenous values in order to be accepted as true in legal form context.
In the context of Toraja, democratization becomes an important space where indigeneity local, political interests of certain circles, decentralization and formal institutions of democracy could meet up together. The interpretation of reality in the form of those discourse and interests will determine the form of democracy. Therefore, democratization in Toraja is potentially successful, as a system that represents concept of “people rule” and will bring prosperity by following its way. However, at the same

INDONESIAN SCHOLARS JOURNAL – VOL. 2, SEPTEMBER 2014
12
time, the ideas of democracy will deal with local values which it potentially ruins democracy.
B. DEMOCRATIZATION AND THE ADAT POSITION AFTER SOEHARTO During Suharto's regime, the existence of various
communities was bleak especially in the political domain. Public participation was greatly minimized through the government control. By the jargon of stability, the regime strived to minimize all possible dynamics which were considered potentially result destabilizing. It contains community attitudes including diversity in ethnicity and culture. The regime located ethnic differences, culture, and traditions as a unique culture, not merely an unique and existed socio-political system. Therefore, in the international acknowledgment, the indigeneous people tend to be ignored. It signifies that the meaning does not relevance in Indonesia due to the government policy does not admit it [6].
The condition during the New Order era indicates that the government systematically depoliticized the reality of cultural differenciates [2]. It tries to place a custom performance unity through a process of co-option and redefinition through the motto of "Bhineka Tunggal Ika” which means “Unity in Diversity”. By the monopoly of meaning, the diversity is viewed as only as a uniqueness in a certain community. Through the restrictions of cultural and custom differences of the Adat community only be seen as a symbol of local identity without and ignored as a social and political system that existed in Indonesia [2].
The “new order” government also interpreted indigenous people as an “isolated communities” [9]. Local communities are positioned as the communities that desperately need help because they are assumed still lags, primitive and less powerful. It is considered disturbing the image of modern Indonesia which promoted to the international society [3]. Thus, their existence depended on state placing. They did not have opportunity to develop their condition based on their unique values.
The regime discourse in indigeneity put them in to unfortunate conditions in economic, social and political life. According to Alfred and Corntassel, the conditions will force indigenous people to have to work or be subject to rulers desire [10]. The issue of Indigeneous people in the New Order period was seen in narrow meaning as a uniqueness of the community which are apolitical.
When the fall of the New Order regime in 1998, situation has changed. Since that, Indonesia has entered Reform Era that attempts to move away from authoritarian regimes toward democracy. The reform era then encourages social change in Indonesian. Such changes have crucial implications in various aspects of people life which took place in the national and local level. For local community, it is a great opportunity to regain their significant position after being marginalized previously even the regime was adopted the principle of decentralization through the Act no. 5 year 1974 in local government and also by the Act no. 5
year 1979 for village level government. Hence, one of urgent issue of the decentralization implementation is related to the respectful for locality of local people.
Democracy in the era of decentralization reforms intends to encourage opportunities to the dynamics of local people such as indegeneous people. The recent regional autonomy as a form of decentralization became the legitimation to develope regionals uniqueness. Then it gives a way for the revival of adat community in Indonesia [4]. The revival seems a manifestation of the universal ideas of democracy on equality and respect for differentiates. One crucial indication is the electoral systems changing for leadership succession in national and local level.
Previously, the president and local leaders were elected by the members of the legislature. Since the Act no. 32 year 2004, local leaders are elected directly by people through the local election process or "Pilkada". The new electoral system is believed to be more democratic by locating people as the determinant aspect. That such condition encourages the intensity of interaction between the candidates with the people. Hence, the candidates must try to gain the support from people. In order to get the support, the candidates also exploite specific aspects of social context such as the indigeneity. Public preference will be one strong foothold in influencing people’s voting behavior which determines people to vote. Thus, indigeneity in the form of custom or Adat in people's lives could potentially be a decisive factor in the democratic process at the local level. That condition becomes the trend in democratization process within indigenous peoples in Indonesia, including the Torajas.
C. THE TORAJA INDIGENEITY The term "indigenous" is defined as "Endangered" in the
dictionary Oxford English Dictionary. Similar to the understanding of the meaning of the word "aboriginality," which means a quality authenticity. The understanding of the history is associated with the existence or ownership of an area of land in the early stages. With the same understanding, "nativist" is derived from "native" means naturally produced naturally in a region [11].
The concept can be defined on the people described as "natives" in relation to land or a particular region, as a native of the region. It also means that there is a connection with the land or a particular area as well as in association with others, who arrived after the indigenous people [11]. This understanding links a community context with the history of its existence in a region as the first time or since the beginning of the area occupied for generations. In this case, a region may have a diverse community, but will be attached to the concept of indigenous communities which has been since the beginning or first occupied the region. Thus, the concept of indigeneity is also related to the distinction of a community-based society with a particular ethnicity or other communities.
The term indigenous has long been used as a designation distinguishing those who are “native” from their “others” in

INDONESIAN SCHOLARS JOURNAL – VOL. 2, SEPTEMBER 2014
13
specific locales and with varying scope (12). In some countries, this term may have different meanings. It has nothing to do with the type of activity and geographical contexts such as hunter-gatherers, nomads, farmers, residents of the hills, etc., which can be interchangeable in their use interchangeably with "indigenous people" [13]. This is in line with Beteille’s argument that the use of the term'' indigenous'' is similar to the term ''natives" in the colonial context, the moral meaning is often confused with each other to some extent [14]. Turpel also argues that indigenous people communities are at the center of different dominant society which have a special and unique characteristics associated with the culture, language, political and spiritual [15].
In general, an understanding of indigenous people emphasized the strong connection between ancestral lands associated and their place of residence for generations. Such understanding is related to their ancestors who occupied the area since immemorial time [11]. Indigenous peoples are the owner of unique language system, systems of knowledge and belief and have invaluable knowledge of the practice of sustainable natural resource management. They have a special relationship and the use of their traditional lands. Their ancestral lands have fundamental importance for physical and cultural survival as a collective society [16].
Thus, a community can be regarded as "indigenous people" also when they live in an area that has a community of other people, and they are considered different. Important dimension of the identity of a particular community to be considered as indigenous communities is because they are associated with the early history settlements or deprivation. Settlements and the seizure did occur throughout human history, but not of all communities have similiar condition [14].
In order to provide a relatively general meaning of the context of indigenous peoples, a declaration of the United Nations in 1994 proclaimed the rights of indigenous peoples. In addition, there is not even an official definition of "indigenous" which is adopted by any UN-system body but the system has developed a modern understanding of this term based on the following [16]:
1) Self-identification as indigenous peoples at the individual level and accepted by the community as their member.
2) Historical continuity with pre-colonial and / or pre-settler societies
3) Strong link to territories and surrounding natural resources
4) Distinct social, economic or political systems 5) Distinct language, culture and beliefs 6) Form non-dominant groups of society 7) Resolve to maintain and reproduce their ancestral
environments and systems as distinctive peoples and communities.
The declaration is intended to encourage general
framework of the norms for the universal rights of
indigenous people. It also intended to provide a framework on the concepts of “indigenous” that should be seen differently from the assumption that public tends to equate it with the minority, discriminated and oppressed [17].
Categorization in the United Nations declaration provides the basis for a general understanding of the context of indigenous peoples and to encourage efforts to support and respect for their existence. This is reflected in the development of that nativist definition by the United Nations in 1986 and by the International Labour Organization in 1989. Both in terms of defining indigenitas historical continuity, distinctiveness, marginalization, identity, and self-governance as well as through a UN declaration of 1995-2004 as the decade establish indigenous communities [13].
The recognition gives international legitimacy to the existence of various indigenous communities in various parts of the world which received respect and honour. It is also concerned with an opportunity to actively participate in various aspects of life as well as to maintain its existence. These developments create many indigenous communities in the world and then try to gather all possible sources of legitimacy that they may have to claim as indigenous peoples.
The claims made by indigenous peoples generally have many dimensions because it will be associated with the recognition of land rights, the autonomy of the political structure and the hegemony of the dominant culture of the outside community, and the desire for cultural customs and spiritual view of the world a different view of them. It is also a request for an ovation from the other parties either by the state or by the surrounding community. Such claims can be seen as a model of a new human rights called the rights of the people [15].
The linkages between nativist with special rights should have seemed to lead an understanding that they are the first people in an area. Therefore that community is considered to have certain rights and sustainability of ownership or control over a given territory. It has been known as the Principle of “The First Occupancy”. This principle states that the first, or among the first, is eligible to take or have a piece of land and obtain privileges on it, as far as property boundaries and sovereignty [11]. Thus the nativist’s claims related to the history of the early settlers in the area is the entrance to the privileges of the lands or territories they occupy. This carries major implications for their chances in the social, economic and political in the region. It is not merely incidental to ownership of a particular area, but also as an effort to protect its existence and also to claim as the one and only people that apropriate to govern that area.
In the context of Indonesia, especially Sulawesi, Li argued that the meaning of indigeneous people or adat Community is not merely seen in these indicators [14]. Every society has its own political dynamics of social history in the formation of identity as a community. An understanding of indigenous peoples may be operationalized in a particular area using existing indicators, but also may be
INDONESIAN SCHOLARS JOURNAL – VOL. 2, SEPTEMBER 2014
14
difficult in other areas. Community context and historical dynamics that accompany its development is unique for every society that proclaim themselves as the indigenous people. The certain identities and forms of nativist are produced by the different form and context of society. Therefore, the articulation of the nativist, absolutely necessary [13]. This is particularly important given the fact that the nativist claims is always grounded in a particular articulation of the uniqueness of a community and as far as possible conform to the common indicators commonly accepted.
For The Torajan, labeling indigenous peoples can be seen as combination of myths, origins, legends, and memories of past displacement orally until at the present time in the community. Transformation and sustainability of local values in the minds of the Toraja people manifest in many practices of everyday life [22]. The values that underlie traditional Toraja ethnic group have nothing to do with a memory that is embedded in the minds of the places and stories of significant symbolic than formal history in the conventional sense, in the form of a collection of writings about the past [18]. Indigenous belief system is a structure formed from the internal experience of the people of Toraja.
Further, the word of adat is basically derived from the Arabic word meaning "Habit" where in Indonesia, it customary reference to the "custom" or "customary practices" of a group of people [6]. The customary use of the word can also be used as a distinguishing mark between one culture with other cultures associated with collective practices undertaken by communities of different communities which reflects the unique identity of indigenous communities in the form of the Indigeneity [19].
For centuries, in Indonesia, adat is always related to a set of social rules, customs, politics, perceptions of fairness, da even individual habits [4]. Tyson sees custom as “something changing”, the concept of a unit that includes a variety of unique customs and traditions of each of the major ethnic groups in Indonesia [4]. In addition, it also could represent the indigenous system of government based on tradition oral, antecedents and customary law, which provides a set of rules in ceremonies for weddings and funerals, homes and crops, or land-use rights and mechanisms [2].
In recent years, especially the years before and after the fall of the new order regime in 1998, the term tends to be associated with the efforts of adat resistance to the central government [3]. Adat was associated with activism, mobilization, protest, and violent conflict. In the post-New Order, the various communities and groups in Indonesia have become more active in public spaces, more critical, and sometimes sparked violence in order to obtain the right to apply the principles of customary law or hukum adat in their area [3]. In the domain of power discourse on adat communities is getting a significant place in Indonesia [6]. This seems a kind of euphoria among indigenous peoples for their uniqueness way of life.
In short, it can be said that adat refers to a practice that is done by a certain group of people based on a certain
standard of legal thought or believed by the people. The uniqueness of traditional basic values for a given society, as well as a aspect that distinguishes it from other communities. Indigenous characters are found in the form of daily practice in the ethnic community tradition in various regions in Indonesia. It endorses many indigenous communities in Indonesia those can be categorized as indigenous people.
As an ethnic group that is widely known, The Torajan shows its existence as an indigeneous people. This fact can be observed from the existence and establish custom values in their daily life practices [20], that can be found in the Toraja areas, for instance, in various symbols of their house, the funeral ceremony, marriage party, and many others activities in which based on the adat norms.
The term of “Toraja” is derived from the Bugis people "to ri aja" which means "the people of the Highlands". This word is used to differentiate with "to luu" or "the sea people" or “the people who live on the coast”. The term was used by the Dutch missionary Albert Kruyt and Adriani Nicholas, who came to work in Poso, Central Sulawesi in 1892 [18]. Toraja term is used to refer the communities that live on mountainous area. It means that the mention of the Toraja people is not something that is inherent from the beginning but the it used to provide identification label on the community by outsiders. It is also used to distinguish it from existing surrounding communities such as Buginese, Macassarnese or the Mandarese ethnic groups.
Community awareness of this ethnic group came from the colonial experience. Under the Dutch colonialism, Toraja area joined to the unit or administrative “afdeeling” Luwu. Toraja was separated from Luwu after the Second World War. In this region, Toraja area is divided into two districts or onderafdelingen, Ma'kale and Rantepao. Following the Indonesian independence, Tana Toraja or Land of Toraja later is used as the name for the district is formed covering the region since 1950 [18].
In term of geographic condition, religion and diffuse power structure, Toraja people tend to be marginalized from the community and their neighboring ethnics, the Buginese and Macassare who are mostly Muslim [20]. That condition became triggers to the Torajan’s consciousness as a distinct ethnic group with the surrounding community and that condition was likely to turn into a resistance attitude. Except being marginalized, the attitude of resistance is also triggered by various history experienced of The Torajan in interaction with the surrounding ethnics such as an aggressive attack of The Buginese to Toraja highlands, the slave trade in the nineteenth century and guerrilla activity around 1950 also contributed to the tendency of such attitude [18]. Those aspects increasingly defined the Toraja ethnic identity.
The history showed that people in Toraja internally never stand as a united society within a centralist authorization. They are divided in small units structured hierarchical society and led by the Aristocrat who has high position in social stratification or caste [18]. The

INDONESIAN SCHOLARS JOURNAL – VOL. 2, SEPTEMBER 2014
15
hierarchical structure of Toraja society are based on wealths, age and occupation [20]. In the pre-colonial period, Toraja society is divided into three social strata, “aristocrat”, “Ordinary people” or Commoners and slave. [20]. As the highest, the aristocrats stands as the principal people who claim as the most appropriate persons to manage the people through traditional principles derived from “aluk to dolo".
According to The Torajan mythology, "aluk to dolo" is derived from the nature of the gods life system. It indeed are arranged in the heaven, even the gods are also followed and adhered it [21]. In "Tarian Pempitu do langi" or “The seven dances from the Heaven”, “aluk” serves as the procedures towards the light. This is evident from the expression "anna Bendan tutungan bia’ tunannang tendanan ma'lana-lana" which means “The torch stand, and erects a burning stick”. The Numbers of “aluk” are 7777777, in another version states 7777, the number implies perfect or complete [21, 22].
The livelihood of the gods then realized on earth when “aluk” brought down to earth which according to the myth was borne by Pong Pakulando. The gods down to the earth through either marriage with earth people or only want to live on earth. Gods descend to earth came to be known as "To Manurun", where in the Torajan myth, the most famous is “Puang Tamboralangi” who brings various “aluk” of the heaven [22]. “Aluk” then passed down from generation to generation through oral tradition.
“Aluk” belief covers all aspects of life. It can be seen from the coverage of the “aluk” as shown below [22]. 1) Aluk mellolo (concerning human birth to adulthood) 2) Aluk Rambu Tuka '(concerning the marriage party) 3) Aluk Rambu Solo’ (concerning the death, funeral
ceremony) 4) Aluk Bua '(concerning joy party) 5) Aluk Tunanan pasa '(involving market) 6) Aluk Tedong (regarding Buffalo) 7) Aluk Pare (involving Rice) 8) Alukna Banua (concerning the construction of the
house) 9) Aluk Padang (concerning land)
Each “aluk” has its guidance containing obligation and forbiddeness or Torajan called it “pemali “or taboo. All thing can not be separated from the religious nature of the “aluk”. Therefore, every aspect of life must be regulated by “aluk”. If it is ignored, everything will be useless and will not result in goodness. Violation of the “aluk” principals will get revenge from the gods [22]. That is why, if there is a catastrophe or disaster, people will soon look to which “aluk” that has been violated For the Torajan, “aluk” is a norm that must be adhered to society in various aspects of their life. Offense against it will have consequences from the gods. “Aluk” is then regarded as adat or in term of The Torajan called “ada’”. Therefore, “aluk” is “ada’” and “ada’ “is “aluk” for The Torajan [22]. That is the characteristic of the Torajan with their uniqueness. Currently, the existence of “aluk” remains found in The Torajan daily life. It revealed that many Torajan consistently
with the principles of “aluk” even it seems dilemmatic. The Toraja society desires to keep their unique identity
in a fairly complicated situation associated with differences regarding to various changes and cultural preservation efforts. It has been driven by the increasing number of the Torajan who had been received Christianity as their religion that certainly became opponent to the “aluk " even since 1969 it has been legalized as a sect of Hindunism where previously was perceived as Animist [23]. Dissent is also associated with a difference in looking at the social stratification that is considered as an integral part of the Torajan common values where considered less relevant with the develop of democracy ideas. Nevertheless, in fact, associated with the various activities in the Torajan daily life, “aluk” seems still exist even they had embraced the Christianity [20].
An important implication of the existence of “aluk” or “ada’” in their life is the persistence of the hierarchical nature of the society which the noble descendants remain important role in many aspects of social life including in the the “adat” ceremony as an important in for the Torajan. The consequence will influence various processes in the community. It became as an important reason for the royals to constantly keep their influences on the society.
In the process of influencing, The Toraja nobles tended to utilize the legitimacy of customary, so that they can continue to enjoy that position. One that gives legitimacy is the idea that the royals have The “white blood”. It is the adoption of the myths about suparanatural aspects of the early founders or their ancestors or "To Manurun” [18] it is still believed by most of the Toraja ethnic communities. Therefore, it is logically understandable that they occupy a privileged position in the social structure of society and get better treatment-including preferential treatment in various traditional ceremonies which are very important aspect of pride and respect in society. In the political context, the privileged position will give them cultural legitimation to compete in democracy process such as general election. It became one of the important factor that must be have by those who will participate in the local election or “pilkada”.
D. THE TORAJA INDIGENEITY AND LOCAL ELECTION Democracy is a word that has multiple meanings for
different people. It refers to the combination of “Demos” and “kratos” or “kratein” derived from the Greek language. In general, “Demos” is defined as "the people". In the context of Ancient Greece, "people” refers to the population of men who have grown up and further, “Kratos” or “Kratein” means "rule" [24]. Fundamentally, democracy can be understood as "power of people’s” or “people governance”, it shows that people are the most important thing. Interpretation of how people will prevail, through the mechanism of as well as what form of power, and then produce a variety of perspectives on democracy. Though they still find differences in the interpretation of the form as

INDONESIAN SCHOLARS JOURNAL – VOL. 2, SEPTEMBER 2014
16
a form of democracy, democracy has become one of the most famous system which are accepted by most people of the world to be adopted into the political system and government.
It shows that people in the world tend to see democracy as a positive system even that is very diverse in the implementation. Some people understand democracy as a system of people's lives that is considered good as in western countries. However many people see it as a political system with the basic concepts and mechanisms and certain patrons in its operation with a specific purpose. It is frequently found in practice in some countries that people declare themselves democratic but tend to only use the word of democracy to provide a label on them in order to get a positive image, in fact, they are not a democratic country [25]. Practices such potential to make democracy lose its essential meaning as a political system that puts people as the most important determinant in the political system.
So far, the general meaning of democracy which is oftentimes used in science tend to focus on the institutions and procedures of democratic government. Democracy thinkers such as Dahl [25] tend to put the understanding of democracy in terms of institutions and processes in government representation. In this context, that needs to be a mechanism that provides a space for public participation in the political process. The process is affected by certain indicators that formally regulated through legislation. Hence, if citizens can participate equally in these processes through process of free and fair elections then the results became the reference for government action, so it can be recognized as a democratic system.
Fundamentally, democracy wants the guarantees of equality and freedom for all people. It is addressed to respect the various differences and resolving conflicts by peaceful means as well as bringing social and political reforms without any turbulent. As the “heart of democracy”, general election means people's control over elected authorities, equality and freedom, political liberty and freedom of oppression, respect for the rule of law, justice and security, in its various forms [27].
In practice, each state then attempted to adjust the basic principles to the context. As a political concept, democracy will be judged associated with its basic ideas on freedom and equality for people who are formally guaranteed by regulation. Additionally, democracy also can be seen as a mechanism with various indicators. That aim is to provide way for each individual to take part in the determination of the policy-making process either directly or indirectly. It will create prosperity or good standard of life for the people.
In the“Era Reformasi”, the democracy tends to exert these meanings. The freedom of expression is guaranteed by the law and the creation of better governance. It will occur through democratic processes which are able to bring people towards the prosperity. That meaning is generally accepted for people including the local communities. Democratization is seen as a vehicle to bring people to the better quality of life. Thus, anything that allows people as individuals or as
part of community to express their existence based on the existing rules is an indication of the works democracy. This is a basic foundation for indigenous peoples return to exhibit their existence in various aspects of life including in political field. Many scholars believed that adat revitalization in post-Suharto Indonesia has coincided with the democratization process [2]. Therefore, the existence of indigenous peoples discourse in Indonesia rediscovered it place in the social and political changes that occurred after Suharto.
Their present political space seems not only as an attempt to counter the marginalization that occurred during the Soeharto. Moreover, an effort to utilize the opportunities in the current democratization and decentralization at the same time provides an opportunity for strengthening the position of local communities in the region where adat community live. The adat revivalism also finds opportunities at the same time, the discourse of respect and honor to indigenous communities at the international level is becoming an important topic [3]. United Nations Convention become one of relative strong legitimation for the existence of indigenous peoples, including in Indonesia.
The condition shows that the presence of indigenous peoples back is a mix of interrelated variables. Interpretation of the growing discourse and open spaces due to the socio-political shift in the international level, national and local giving way to the existence of the previously marginalized communities in Indonesia. Although indigenous peoples have differences in terms of social, political and cultural, but they have desire to fight for the similar existence. This suggests that the indigenous peoples actions in general is an attempt to keep them from existence removal efforts both culturally, politically and physically [10].
The uniqueness of adat practice in the form of everyday traditions, that continues to be maintained, indicates that the existence of indigenous peoples should be respected according to the mandate of the UN Convention. Attempts to obtain the existence of a larger space as well as a greater opportunity for engagement in public spaces and decision in the region area. The emergence of non-governmental organizations such as WALHI or Wahana Lingkungan Hidup Indonesia (Friends of The Earth Indonesia), AMAN or Aliansi Masyarakat Adat Nusantara (Alliance of Indigenous Peoples of the Archipelago) and other agencies becomes an important indicator of the awareness of indigenous peoples in Indonesia to fight for their rights and existences. Efforts are made not only to encourage the recognition of their existence, but at the same time also demand indigenous rights over their territories that had been marginalized by the State. These conditions indicate that the indigenous resurgence is a part of socio-political context of Indonesia society development today. Indigenous revival became a phenomenon which indicates that the process of democratization has become a way for the rise of indigenous communities in the area. The meeting point of these two things can be seen in the implementation of regional autonomy.

INDONESIAN SCHOLARS JOURNAL – VOL. 2, SEPTEMBER 2014
17
The basic concept of regional autonomy is to provide recognition to the existence of the values of the different customs in society. This allows the presence of local representations in an attempt to direct their own interests along with managing together. As a community dealing with the conditions in the region every day, it is certainly a very good understanding of the community against the tendency territory. Consequently, the involvement of the community in a variety of socio-political processes becomes a necessity [2]. It included in determining the leader of deemed fit to lead the people in the region through the local election.
As one key pillar of democracy, the electoral process is a substantial battle field for many political actors. In the reform era, elections bring a new arena for politicians to reach an important position in the region. It is both a new space for community interaction and politicians. The authority as the autonomous regions head (Municipals and districts) in the event the scheme of local autonomy to accessing variety of important resources in the area makes the local election becoming a race arena among actors interests. The position is also equally important which will provide a high social status in the context of culture.
For the Torajan, the person who occupies a position of leadership is considered to have certain advantages and will be highly respected. Based on adat, the regional leaders will be given a special position in any ceremonies performed. For the Torajan it is a matter of pride that is a very high value. Consequently, for the Torajan, the process of democracy is not just an attempt to gain political office and access to resources based on the formal regulation, but perceived as a possible way to get respectable position in society based on traditional principal. In a stratified society, the peak positions in the community would have a great value, very possibly even beyond economic values.
The Adat frame on the process tends to be the arena of the aristocrats competition between them. The history shows that the Toraja people, in the long time ago, Toraja nobility never had a centralized authority. Powers are separated into groups based “Tongkonan” which closed to Kinship Honour.
Literally “Tongkonan” means residence or home. But more than that, for the Toraja, “Tongkonan” also means a symbol on a collection of families who have family ties based on certain lineages [20]. “Tongkonan” has a wider dimension than just staying home. Thus, “Tongkonan” becomes a symbol of a particular family lineage of interrelated predecessors. With close ties of kinship that exist in it, “Tongkonan” can be an important political resourcess. “Tongkonan” symbolizes the pride and prestige of the family which is strongly associated with the nobelities. It makes rivalries in democratic institutions that tends to be owned by the nobility and the offspring due to customs legitamacy [6].
The existence of adat provides space for certain circles in the Toraja people to perform certain maneuvers. For the elites, it can be social legitimacy as well as for the common value for the community's support in the election process.
Consequently, all of participants in the local elections in Toraja involve the aristocrats.
That situation seems well understood by most of the aristocrats. They realize that the sustainability of indigenous communities will be correlated with the their legitimacy to participate in the democratic process. In addition, the aristocrats have considered most important variables for the Toraja community leader, thoughtful, smart, and wealthty.
Such those conditions would be likely to enable them to mobilize and direct the current trend in the democratic society. For the Torajas, the nobelity will take advantages. Public confidence is still quite strong in traditional as well as the fact that the offspring aristocrats who have the resources needed in the process, making elitist democracy. Although in the end the people choice determines, the option is likely to lead to what is traditionally considered to be appropriate. Therefore, efforts to maintain the continuity of traditional values are important, not only as part of indigeneity Toraja society, but also to the interests of certain elites that get the legitimacy of traditional values.
E. CONCLUSION Based on the explanations above, the tendency of
democracy that occurrs in the Toraja ethnic group shows a different model from the existing common understanding. That is strongly associated with the local customs which still exist in their life. One important implication of these conditions is practicing democracy then got a meaning based on traditional values that exist. Interpretations of existing generating practices make a difference with the general ideas of democracy on equality and freedom. In the Toraja society, individuality to the general public can not be seen as an autonomous individual authority. Adat values to be one of the determining factors in directing people's behavior tendency included in the electoral process and the elections.
As a form of democracy, the electoral process in any level can be accessed by all people who have been formally qualified. But in Toraja society, it tends to indicate that only the descendants of elite are considered appropriate. Thus, although formal law entitles every adult to participate as a candidate in the election, based on the Toraja traditional belief, a leader should come from the nobility by legitimate criteria by traditional values.
Thus, the concept of freedom and equality in a democracy can not be applied such without being influenced by the indigenous context. Without the legitimacy of the indigeneity, democratic processes and its results will meet cultural barriers in society.
In the area of Toraja which is dominated by the Torajan where their custom is still fairly held and as well as the majority inhabitant in region, the democracy process will be usually determinant by them. Another implication is about proclamation that only people of Toraja ethnic leaders who may be in Toraja. It was triggered by the presence of ethnic consciousness as a look at other ethnicities as newcomers or outsiders that do not deserve to lead their ancestral territory.

INDONESIAN SCHOLARS JOURNAL – VOL. 2, SEPTEMBER 2014
18
It suddenly became an opportunity to occupy important political positions. These conditions make the desire to maintain their identity tends to be a necessity.
This condition contains dilemmas. Social hierarchy is considered as an integral part of the Torajas adat. However, democracy allows people without it to joint with the competition. But adat seems as most. In the context of the Torajas, adat is not just habit, but as important foothold in addressing democratization. The meet of adat and democracy tends to be two opposing poles. It has potency to failure the democracy or can be a chance to find alternative think based on the Torajan context.
Indeed, the social construction of indigenous identity in Toraja is almost certainly going to give a favorable position for certain circles, in this case the elite. But if it was related to a belief-based custom then change it certainly will have implications that is not small. Impose to replace it with something very new and different takes on the risk of extinction of a unique value nativist in Indonesia, as well as showing that Indonesia has not been able to give deserved recognition to the indigenous people as a country that claims to be a democratic state. It is at once, would be an indication that democracy is not always positive as it can be the cause of the extinction of a social system that the beliefs of a society. Without respectful to the adat values, democracy and all of its institutions will be running without cultural legitimation. It can be seen as an omit to the concept of “people rule” even already meet with the formal form.
Therefore, as an important part of the Torajan identity, adat should be accommodated as two equal subjects in the necessity of democracy. The significant move that is possibly addressed is to include few aspects of adat in the democracy process. Thus the process will be seen also as a part of cultural process that will get legitimation, formal and cultural.
This would certainly be a way to discover a fundamental revision to the understanding of democracy that is associated with the unique contexts of indigenous people based on their local norms which is fundamentally became their behavior guidelines. Finally, that situation still can be proclaimed as a democratic entity or the reflect of what people desire in the term of “people rule”.
REFERENCES [1] (The democracy Index), The Economist Intelligence Unit (EIU),
2011 Available: http://www.eiu.com/ [2] Hooe, Todd Ryan. “Little kingdoms” (Adat and inequality in The
island, Eastern Indonesia). PhD. dissertation, University of Pittsburgh, USA, 2012.
[3] Davidson, Jamie S. et.al (ed), Adat dalam Politik Indonesia. KITLV-Jakarta and Yayasan Pustaka Obor Indonesia, 2010.
[4] Tyson, Adam D. Decentralization and Adat Revivalism in Indonesia; The Politics of Becoming Indigeneous. Routledge New York, 2010.
[5] Hadiz, Vedi R. 2004. Decentralization and Democracy in Indonesia: A Critique of Neo-Institutionalist Perspectives. Development and Change 35 (4), pp. 697–718, 2010.
[6] Li, Tania Murray, Articulating Indigenous Identity in Indonesia: Resource Politics and the Tribal Slot. Society for Comparative Study
of Society and History. 0010-4175/00/1796–0103 $9.50, pp. 149-179, 2000.
[7] Lewis, J. David and Andrew W. Eigert, Trust as Social Reality. The University of North Carolina Press, 1985.
[8] Benda-Beckmann, Keebet von. Forum Shopping and Shopping Forums. Journal of Legal Pluralism 117, pp. 117-159, 1981.
[9] Surat Keputusan Menteri Sosial Republik Indonesia No.5 Tahun 1994 tentang Masyarakat Terasing. Departemen Sosial, 1994.
[10] Alfred, Taiaiake and Jeff Corntassel, Being Indigenous: Resurgences against Contemporary Colonialism. Journal Government and Opposition. pp. 597-614, 2005.
[11] Waldron, Jeremy, “Indigeneity? First Peoples and Last Occupancy”. Victoria University of Wellington, Law School Forthcoming. Journal of Public Law. Vol. 1 , pp.1-57, 2002.
[12] Merlan, Francesca, Indigeneity Global and Local. Current Anthropology. Volume 50 number 3, 2009
[13] Dove, Michael R. Indigenous People and Environmental Politics. Annual Review of Anthropology. 35, pp.191–208, 2006.
[14] Béteille, André, The Idea of Indigenous People, Current Anthropology, Vol. 39, No. 2 pp. 187-192, April 1998.
[15] Turpel, Mary Ellen, Indigenous Peoples' Rights of Political Participation and Self-Determination: Recent International Legal Developments and the Continuing Struggle for Recognition. Cornell International Law Journal Vol.5 pp.5879-602, 1992.
[16] The Rights of Indigenous Peoples. United Nations, Fact Sheet No.9 (Rev.1), 1997.
[17] Bowen, John R., Should We Have a Universal Concept of 'Indigenous Peoples' Rights'?: Ethnicity and Essentialism in the Twenty-First Century . Anthropology Today, Vol. 16, No. 4. pp. 12-16, 2000.
[18] Waterson, Roxana, 2009. Paths and Rivers; Sa’dan Toraja Society in Transformation. KITLV, Leiden, 2009.
[19] Spayer, Patricia, Diversity with a Difference: Adat and the New Order in Aru (Eastern Indonesia). Cultural Anthropology 11(1) 25-50, 1996.
[20] Adams, Kathleen M., Ethnic Tourism and The renegotiation of Tradition in Tana Toraja (Sulawesi, Indonesia). American Ethnologist, Vol.36, No.4. pp. 309-320, Autumn 1997.
[21] Baruallo, Frans, Kebudayaan Toraja (Masa Lalu, Masa Kini dan Masa Mendatang). Universitas Atmajaya-Jakarta, 2010.
[22] Kombong, TH. et.al, Aluk, Adat dan Kebudayaan Toraja dalam Perjumpaannya dengan Injil. Pusbang-Badan pekerja Sinode gereja Toraja, 1992.
[23] Volkman, Toby Alice, "Visions and Revisions: Toraja Culture and the Tourist Gaze". American Ethnologist 17 (1): 91–110. February 1990.
[24] Ober, Josiah, The original meaning of “democracy”: Capacity to do things, not majority rule. Un-published.
[25] Dalton, Russell J. et.al., Understanding democracy: data from Unlikely Places. Journal of Democracy Volume 18, Number 4, pp.142-156, October 2007.
[26] Adams , Kathleen M., More than an ethnic marker: Toraja art as identity Negotiator. American Ethnologist, 25, No.3 327-51, August 1998.
[27] Beetham, David et.al., Assessing the Quality of Democracy A Practical Guide. International Institute for Democracy and Electoral Assistance, 2008
[28] Tanasaldy, Taufiq, Regime Change and Ethnic Politics in Indonesia; Dayak politics of West Kalimantan. KITLV Press Leiden, 2012.

INDONESIAN SCHOLARS JOURNAL – VOL. 2, SEPTEMBER 2014
19
Postharvest Integration of Rice and Soybean for Supporting National Food Security
Dini Nur Hakiki*, Nurfitri Ramadhani
Postharvest Technology, Bogor Agricultural University, Bogor 16680 [email protected]
Abstract. Currently Indonesia faces the problem of food availability of strategic food crops in Indonesia, such as rice and soybean. Increasing of consumption, narrowing of field, and rising of food imports, are the problems in supplying foods for 250 millions people. According to BPS data in 2011, Indonesia produced rice as much as 65.76 million tons of milled rice and soybeans as much as 851.29 thousand tons of dry beans, yet, not all of them are utilized. There are still much weight losses of products in every handling stage qualitatively and quantitatively. Losses of rice are 13% and losses of soybean are 15.50%, meaning that there are about 8.54 million tons of dry milled rice and 131.9 thousand tons of soybean seeds those could be consumed. Hence, it needs a postharvest activity properly. Postharvest handling is one of the best efforts to overcome this problem. Postharvest activities of rice and soybean have some similarities, but postharvest of soybean is simpler. In addition, farmer’s agricultural machineries are generally used only for certain commodities. When it is not harvesting time, the machines will be idle so it caused the lower productivity. Because of that, there is an idea for integrating activities between postharvest of rice and soybean. Postharvest equipments and machineries can be used to maintain the two commodities at the same time. It will give an added value to efficiency, effectiveness, and cost of postharvest. This literature review aims to answer the question of how the integration of postharvest activities of rice and soybean impact the productivity, what factors influence dominantly, and what things must be prepared. The methodology used refers to literature review of literatures and field observation. The results show that the integration of postharvest activities of rice and soybean can be done in the process of harvesting, threshing, and drying by modifying equipments and agricultural machineries. Besides that, the literature review explaining schedulee cropping patterns, technology integration, marketing and price assurance, preparation of human resources, and institutional strengthening should be considered also.
Keywords:postharvest, soybean, rice, food security, losses
A. INTRODUCTION Currently Indonesia faces the problem of food security.
Consumption of food continues to increase, but the agricultural land decrease and import of food increase, so Indonesia senitive to fullfill the needs of 250 millions people for food. The strategic foods in Indonesia are rice and soybean. Rice is being the staple food almost the entire population of Indonesia. Soybeans become an important source of vegetable protein for household and industries. Indonesian rice production amounted to 65.76 million tons of Dry Milled Rice (DMR) and 851.29 thousand tons of soybean dry seeds[1]. However, all the amount of production is not utilized. The high shrinkage occurs every handling stage of commodities in both qualitative and quantitative. Quantitative shrinkage that occurs is the result of shrinkage due to lag during the harvest and postharvest while the qualitative shrinkage results are due to faulty material damage such as grain, sprouted, shriveled beans, split beans, and other. In 2010, losses of rice is 13% and amounted to 15.50% soybean shrinkage[2] so that there are approximately 8.54 million tons of DMR and 131.9 thousand tons of soybean seeds that can not be consumed. When this shrinkage can be reduced 1% then there is 657.2 thousand tons of paddy and 1.3 thousand tons of soybeans that can be saved to be eaten by our residents with a total value of money saved as much as billion dollars. Involving not only quantitative aspects, the qualitative aspect of food that is eaten must meet
the nutritional needs of the community and avoid biological, chemical, and other objects that could endanger human health. On grain aflatoxin contamination due to improper handling can harm for humans.
Food crops such as rice and soybean still perform metabolic activities that if it is not handled properly then it will be damaged. It is perishable and limited shelf life after harvest. Postharvest handling is a series of activities starting from harvesting until ready to be consumed or marketed with the aim of suppressing shrinkage, increase shelf life, and the efficiency of agricultural commodities. However, postharvest handling has not been widely applied in the society. Some of the obstacles that occur in postharvest handling is not equitable to use application of postharvest technology. Some farmers still persist using manual systems that cause high losses results. For example, with a paddy threshing machine can reduce yield losses of up to 1.3% compared to the manual method (sickle and gebot) with a loss of 10.4% [3]. This is due to several farmers have limited capital and to apply postharvest technologies require expensive initial investment. In other hand, the limited level of knowledge and awareness of farmers in postharvest handling and lack of skilled personnel (technical skills) in the postharvest facilities operate.
Therefore to support postharvest handling well then it came the idea to form a region in the postharvest agricultural region. The postharvest area is an area that supports an

INDONESIAN SCHOLARS JOURNAL – VOL. 2, SEPTEMBER 2014
20
integrated postharvest activities both integration and integration commodities postharvest processing stages in order to improve the efficiency, effectiveness and minimally cost of postharvest. This paper aims to design concept postharvest area in support of food security refers to literature review of literatures and field observation.
B. MATERIAL AND METHODS
Literature Review Methods and Data Collection Techniques
Study of literature is a literature review focused on a research topic about postharvest integration of rice and soybean for supporting national food security, trying to identify, appraise, select and synthesize all high quality research evidence relevant to that topic. The main objective is to study literature is to find the variables to be studied, to distinguish the things that have been done and determine the things that need to be done, to synthesize and gain new perspectives, and to determine the meaning and relationships between variables.
To collecting data and literature is find the relevant data from books, websites, journals, and some research about postharvest integration of rice and soybean for supporting national food security and field observations with observations on several villages in Bogor district so as to obtain an idea about development concept of postharvest area.
This literature review aims to answer the question of how the integration of postharvest activities of rice and soybean impact the productivity, what factors influence dominantly, and what things must be prepared. The methodology using refers to literature review of literatures and field observation. The results show that the integration of postharvest activities of rice and soybean can be done in the process of harvesting, threshing, and drying by modifying equipments and agricultural machineries. Besides that, the literature review explain schedulee cropping patterns, technology integration, marketing and price assurance, preparation of human resources, and institutional strengthening must be considered also.
Integration of postharvest activities, advantages and disadvantages
Postharvest is important to mantain quality and quantity crops toensure food security. When looking to the characteristics of Indonesian agricultural area that has a similar cropping pattern as it is often time not simultaneously where farmers generally within one year not only plant one type of crop, but also other crops. On irrigated land, for example, farmers apply a combination of rice cropping with soybeans. Rice generally planted in the rainy season due to the characteristics of rice plants need plenty of water while soybean are planted in the dry season because soybean can live on dry land, and it will quickly die if the soil is watered.
Then, rice and soybean postharvest activities have some similarities that both rice and soybean through the process of harvesting, threshing, drying, and storage. Soybean postharvest activities are simpler than rice because there is no
grinding stages. Agricultural machinery owned by farmers are generally used only for certain commodities so that when not harvest the idle so the utility tool agriculture machinery be very low. Therefore, the idea arises about the integration between the activities of postharvest rice and soybean. Postharvest equipment and machines can be used to handle the two commodities at the same time that will create efficiency, effectiveness, and cost of postharvest.
There are some postharvest activities that are integrated between rice and soybean which are harvesting, collecting, threshing, transporting, drying and storage (Table 1). This integration will increase efficiency and effectiveness. Handling rice and soybeans can be done in one package agriculture machinery, storage can be done in one place so that they can choose the type of fumigant and set the same storage conditions, investment costs will not be too expensive since the package agriculture machinery is used for the two commodities at the same time, increasing the utility tool can reduce the idle time for equipment. Effective in terms of land used, namely the cropping rotation can break the chain of pests and diseases, nutrient who is always awake because soybean plants can provide an element of nitrogen needed by the rice plant.
Table 1. Integration of postharvest rice and soybeans.
Stages Rice Soybeans Postharvest integration
Harvesting
- Have similarity the tall of crops. Rice 80-120 cm; soybean 30-100 cm
- Reaper, striper, mower, combine harvester
- Crop harvesting systems using group
Collecting Harvested crop is placed in area Cover sack
Threshing
- Separate the grain from the panicle
- Speed of machine is 40-450 rpm
- Initial moisture content of 20-25%
- Separate the seeds from the stover
- Speed of machine 400 rpm
- Initial moisture content of 15-17%
Modified power thresher
Transporting
Soy beans and rice have a size that is not much different use of sack
- Sack - Means of
transportation such as cars, pick up
Drying Water content from 20% to 14%
Water content from17-20% to 13-14%
- Drying floor - Flat bed dryer
machine
Milling
Process: breaking the skin, husk separation, removal of stone,milling, bleaching, grading
Process: removal of stone, grading
-Destoner, graders
Storing Moisture content of 14% Pest of rice is Sitophilus
- packaging sacks

INDONESIAN SCHOLARS JOURNAL – VOL. 2, SEPTEMBER 2014
21
But the concept of this integration should have careful planning in operation. When the cropping pattern is not scheduled properly, it can give result in overlapping where rice and soybeans ended up in at the same time resulting in excess production capacity that can increase the damage of agriculture machinery. Agriculture machinery also must often maintenance to be able to increase its service life. Agriculture machinery elections in early purchases must be qualified, because the use of agriculture machinery become more frequent. Modification tool must be done because either there is rice and soybean characteristic that can not be equated. Workers who operate the equipment must have multitasking to handle soybean and rice. Storage should be periodically monitored for pests warehouse into more kind.
C. DISCUSSION Postharvest integration are defined in concept that
postharvest areas where there are integration of planting commodity and integration of postharvest handling commodity in one area. The lack of understanding of GHP in post-harvest handling, access machinery that still not reached by the farmers due to thelack of capital, a good marketing collateral can be circumvented by the establishment of postharvest areas. This region consists of several large areas of agricultural land of two commodities. A unit of post-harvest handling, processing waste, and industrial/market accommodate the commodities produced. Postharvest region can be built at the district level from a combination of several villages. Each of the village have several farmer groupsthat have joined in gapoktan at the district level. Gapoktan is what initiated the integration of post-harvest handling. Series of post-harvest stages can be performed in one region where gapoktan provide agricultural machinery. The grand design of postharvest area described in Figure 1.
Postharvest region aims to make costs of postharvest efficient and effective besides providing national food availability qualitatively and quantitatively. Assumptions that are built for the postharvest areas, there are: x Agricultural land is 1,000 ha of rice and 200 ha of soybean. x Productivity of rice in paddy land dry 7 tons / ha [4]. x Productivity of soybeans in soybeans land 1.7 tons / ha [5]. x Postharvest losses of rice is expected to be reduced from
13% to 8.6%.[6] x Postharvest losses soybean expected to be reduced from
15.5% to 14% [7] x Built 2 integration units of postharvest handling. x Husk and stover can use as fuel drying machine.
Figure 1. Concept of postharvest area
The following are the design of postharvest area
1. Cropping patterns The existence of coordinated scheduling planting and postharvest phases of farming among farmers. Minimize overlapping in the field that can lead to rice and soybeans managed simultaneously. Schedule of harvest rice planting was conducted in June to August and January to April. Soybean harvest in September and December.
2. Postharvest technology integration and the resulting package
Package machinery needed for a unit integration postharvest handling that can described in Table 3.
Table 2. Planting schedule
Table 3. Postharvest Handling
Postharvest Handling Technology Package Needed
Harvest Defoliation Drying
Combine harvester 2 trailer unit with completeness 1 unit, 1 set rachetstrap, 2 units of iron bridge, tarp coverings combine harvester 1 piece, high pressure washer agriculture machinery, cutter knife 2 sets, the plastic sacks for 20 grain Removing the multipurpose threshers 250kg/hour power capacity 15 units + tarpaulin size 6x6 m) Means dryer (vertical dryer) 4 unit
Location Month Dry Season Rainy Season
Jun Jul Aug Sep Oct Nov Dec Jan Feb Mar Apr May LI Soybean planting PH Rice planting PH Rice planting PH L2 PH Soybean planting PH Rice planting PH Rice planting L3 PH Soybean planting PH Rice planting PH Rice planting L4 Rice planting PH Soybean planting PH Rice planting PH Postharvest Region
L2 L3 L4 L1 L2 L3 L4 L1 L2 L3 L4 L1 rice rice rice soy soy soy soy rice rice rice rice rice

INDONESIAN SCHOLARS JOURNAL – VOL. 2, SEPTEMBER 2014
22
Milling Storage
capacity of 15 tons of fuel husk / biomass With completeness: Paddy cleaner Moisture tester Sitting digital scales Sack sewing machine Portable fire extinguisher Rice milling 2 phase 4 units Storage facilities that can accommodate 5000 tons
Application of GAP, GHP, GMP, and GWP in each integration postharvest handling should be conducted.
3. Marketing and price guarantees All products produced must have a market and price
guarantees so it can be used well. The integration of the storage makes this easy in controlling the amount of rice and soybeans so it will facilitate the marketing strategy. How much should be sold permonth and how much should be saved. The concept of postharvest area is not going to run, without a good support of agribusiness system from upstream to downstream. Postharvest subsystem is supported by upstream, farming, downstream, and supporters subsystem. As for the overall system of farm agribusiness described in Figure 2. In developing the concept of the postharvest area, there are a few things to consider: 1. Insemination technology to society
Since this is the introduction of technology into society then there was the assistance. Technology is not going to be accepted in society when no introduction at the first. Institutions is needed in the insemination process. 2. Preparation of competent human resources
In the area of postharvest handling, multitasking workers who needed to know about rice and soybean commodity and should be prepared with a variety of HR no training. 3. Integration between equipment
Agriculture machinery needs to be modified so that it can be used for two commodities simultaneously.
Concept of postharvest area certainly has positive and negative impact. The impacts are described in Table 4. Postharvest integration has aims to reduce losses by using agricultural machine. Reducing losses can make efficiency in quantity of harvest. Then, using handling properly mantains quality of product. Besides that, the number of agricultural machinery in some areas is still limited and used only in certain seasons. When it is planting rice, the harvesting machines will be idle so the integration system will be maximized by using machine. But, maintenance of harvest machinery or tools must be further improved because the useful life of equipment become more frequent. Integratedrice and soybean in land can break the chain of pest because there is crop rotation. Pest in rice is different with pest in soybean. After farmer plant rice, the pest in rice can’t survive in soybean land.
Selling rice and soybean must manage properly in the right time. If many farmer plant a commodity at the same time, so the price may go down. Integration storage rice and soybean ensure the supply so that it can determine the right
market strategy. But, the integrated storage can cause exchange pests and diseases. Rice’s pest in storage same with soybean example: Sitophilus sp.
This concept can accept by farmer if there is a good introduction to the community. It requires cooperation between stakeholderso need more efforts to organize stake holder. Farmer have tightfull schedule in planting and harvesting. If there is missunderstanding in planting or harvesting, so it’s make overlapping.
Figure 2. Systems that support regional agribusiness postharvest
Table 4. Positive and negative impact the postharvest area
Positive Impact Negative Impact
The efficiency and effectiveness of postharvest
If there is a good introduction to the community, the concept cannot be done postharvest areas
Maintains the quality of commodities
Requires cooperation between stakeholder , so need more efforts to organize stake holder
Improves the fertility of agricultural land with soybean intercrops
The integrated storage can cause exchange pests and diseases
Breaks the chain pest in the field due to crop rotation
Cultivation and harvest scheduling must tightfull because if not scheduled may cause overlapping
Makes a storage integration to ensure the supply so that it can determine the right market strategy
Maintenance tools must be further improved because the useful life of equipment become more frequent
Increases the utility agriculture machinery postharvest

INDONESIAN SCHOLARS JOURNAL – VOL. 2, SEPTEMBER 2014
23
REFERENCES [1] BPS. 2011. Produksi Padi tahun 2011. Available : http://www.bps.
go.id/brs_file/aram_1nov11.pdf. [20 April 2013] [2] DirjenPascapanenTanamanPangan. 2010. Rencana Strategis Direktorat
Pascapanen Tanaman Pangan. Available : http://tanamanpangan.deptan. go.id/doc_upload/44_KATA%20PENGANTAR.pdf. [22 April 2013]
[3] Purwadaria, H.K., E.E. Ananto, K. Sulistiadji, Sutrisno, and R. Thahir. Development of stripping and threshing type harvester.Postharvest Technologies for Rice in the Humid Tropics - Indonesia. Technical Report Submitted to GTZ-IRRI Project. IRRI, the Philippines. 38 pp. 1994.
[4] Deptan. 2012. Produksi, luas panen, dan produktivitas padi dan palawija di Indonesia Available :http://www.deptan.go.id/Indikator/tabel-1-prod-lspn-prodvitas-padi-palawija.pdf. [22 April 2013]
[5] Badan Litbang Petanian. Peta Potensi Lahan Kedelai. Available : bsdlp.litbang.deptan.go.id/index.php?option=com_content&view=article&id=229:peta-potemsi-dan-ketersediaan-lahan-kedele&catid=64:iklan-produk&Itemid=147. [22 April 2013]
[6,7] BalaiBesarPenelitianPascaPanenPertanian. 2011. Penanganan Pasca Panen Padi. Balai Besar Penelitian Pasca Panen Pertanian. Available : http://www.litbang.deptan.go.id/ berita/one/930/. [22 April 2013]
.

Associate Editors
Sigit Aryo Pambudi
North California State University, United States
Raditya Yudha Wiranegara University of Manchester, United Kingdom
Joni Welman Simatupang
National Taiwan University of Science and Technology, Taiwan
Hutomo Suryo Wasisto Institute of Semiconductor Technology (IHT), Germany

INDONESIAN SCHOLARS JOURNAL – VOL. 2, SEPTEMBER 2014
25
Energy Efficiency Improvement of Trawlers 1Alyuan Dasira*, 2Jean-Marc Laurens
1Master Research in hydrodynamic naval at Universite de Bretagne Occidentale, Brest, France 2Researcher and lecturer at LBMS/DFMS laboratory, ENSTA Bretagne, Brest, France
Abstract. Trawlers have two main operational conditions; the voyage condition and the trawling condition. The voyage condition is when the trawler travels to port and to the fishing grounds. The trawling condition is when the trawl is deployed to catch fish. To accommodate both conditions with a single diesel engine, the voyage speed must be optimized as to match the trawling condition break power. Furthermore, in trawling operation the ship resistance increases tremendously and the propeller is heavily loaded despite of the small velocity. In such condition, the propeller efficiency is low and a ducted propeller is undoubtedly the best device to increase both the thrust and the efficiency. Finally a stator can also be added in order to reduce further the fuel consumption. An academic potential flow code has been adapted to simulate the flow around these various configurations. We have applied these energy saving strategy and configurations for the case of an existing 22 meters Indonesian fishing ship. Propeller with and without duct in same size (B3-65 and Kaplan 65 in Duct 19A) are analyzed and optimized ship speed 9 Knots to 7 Knots. It shows that 13.7 % of the fuel consumption was saved with a duct propeller in trawling condition and 35% of the fuel consumption was saved with an optimized ship speed in voyage condition.
Keywords: energy efficiency; trawlers (fishing ship); ducted propeller; boundary element method; potential flow
A. INTRODUCTION Generally, efficiency in terms of fishing can be expressed
by the ratio of fishing capture over the operational cost. The fuel cost now reaches some critical values and is still increasing. In operational cost, fuel consumption is a dominant factor of the total operational cost. Thus, energy efficiency can be investigated by using fuel consumption approach. It is possible to evaluate performance of trawler under different operating conditions. The fuel consumption is mainly due to the propulsion system. Using a better propeller increases the energy efficiency. Moreover, a better efficiency can decrease the pollution due to fishing activities.
Trawlers operate in two main conditions, the voyage condition and the trawling condition. In each condition, the propeller plays an important role to determine whether the fishing vessel presents a good efficiency or not. The trawling condition is the condition in which the fishing boat pulls the trawl to catch fish. In this condition, the ship operates at low velocity. The problem is when a ship operates with a trawl, the ship resistance increases and the propeller must work harder to ensure that the ship can advance against that additional resistance. The resistance of the trawl can reach 90-95% of the total resistance. It depends on the type of trawls. The propeller is then very highly loaded and as a result, its efficiency is low. Thus, much of the energy is wasted. Duct propeller is one tool to increase the propeller efficiency in heavy loaded conditions. The duct then participates to the thrust and its contribution can reach 50% of the total thrust. This is particularly advantageous for tugs propulsion or dynamic positioning thrusters which often work near bollard pull condition [2]. It is a solution for efficiency problem in trawling condition.
Moreover, the choice of the ship speed for the voyage condition can be a problem when the power required in voyage
condition is not similar to the trawling condition. Large difference in the power required between both conditions must be avoided when using a diesel engine to ensure that it does not waste energy and/or damage to the engine. Thus, we must optimize the ship velocity in voyage condition to match the power required in trawling condition. This solution can be considered if the sailing time does not affect the fishing boat efficiency or the fish value. On the other hand, the fuel consumption depends on the velocity of the ship. The higher the velocity, the higher is the fuel consumption. This can be seen in Figure 1, which presents the fuel consumption versus ship speed for various propeller pitches. The relation is not linear. The voyage velocity must be optimized according to the fuel consumption in voyage condition but respecting the power required in trawling condition. Once the power and the RPM have been fixed, the only adjustable variable is the propeller pitch. All curves of Figure 1 are given for the same RPM, only the propeller pitch varies. That explains why most trawlers have a variable pitch propeller.
Figure 1. Fuel consumption (ton/days) versus ship speed (knots) for various
values of the propeller pitch [3]

INDONESIAN SCHOLARS JOURNAL – VOL. 2, SEPTEMBER 2014
26
B. METHODOLOGIES AND APPROACHES
1. Main Ship Data Name of ship : KM Soerya 87 Ship type : Trawler (fishing ship) Length of ship : 22.56 meter Breadth : 7.79 meter Draft : 4.26 meter Ship velocity : 9 knots Ship bottom form: V Main propulsion : Diesel engine (Caterpillar 3408TA) Power : 300 Kw RPM : 1800 RPM Reduction Ratio : 4:1 Prop diameter : 1.25 m Num of propeller : 1 Num of blade : 3
2. Ship Resistance In Figure 2 the chart shows that the procedure starts
with the calculation of the ship resistance. In order to find the characteristics of the ship propulsion and resistance in this case, firstly, the ship must be redrawn using the known parameters. The ranges for the parameters at this stage are: Cb (Lwl) = 0.53 - 0.62, Lwl/Bwl = 2.6 - 4.0 Bwl/T= 2.0 - 3.0 Lwl/Vol1/3 = 3.0 - 4.5 and Froude Number (Lwl) = 0.2 - 0.43. After that, the ship resistance can be estimated with hydrodynamic computation software code, Navcad ©. It uses the ship dimension (length, breadth, draft, coefficient block, prismatic coefficient, etc). To obtain all the necessary parameters, the ship hull is redrawn in Rhino ©, Figure 3.
Figure 2. Computational flowchart procedures
Figure 3. Ship redrawn in Rhino ©
Condition
Velocity (Knots)
Rtrawl (kN)
Rbare (kN)
Rtotal (kN)
Trawling 9 0 35.39 35.39 Voyage 3.5 21.6 1.2 22.8 Figure 4. Resistances in trawling and voyage condition
In this case, the total resistance includes the trawl resistance at the trawling velocity, 3.5 knots. In this condition, 95% of the resistance is due to the trawl and 5% to the bare ship resistance (Rbare). Reference [4] was used to determine the resistance components in trawling condition. 3. Open Water Test Diagram
Open water propeller performances are used as a starting point. They give the propeller hydrodynamic performances without the ship hull interaction. There are several methods to generate the open water test diagram such as numeric simulation, experiment, etc. Navier-Stokes solver is an affordable numerical tool to simulate ducted propeller performances, but the quality of the mesh is critical and it still requires man-hours with expert’s skill. There is a simpler model, Boundary Element Method (BEM) code or panel method code to solve hydrodynamic performances analysis in ducted propeller particularly [5]. In the panel method, the propeller is modeled as a thick body so is the duct. Moreover, the boundary element method only requires a surface mesh of the solid object. So, it needs a mesh generator for the propeller

INDONESIAN SCHOLARS JOURNAL – VOL. 2, SEPTEMBER 2014
27
and for the duct. In this study, we use a fast mesh generator developed at Ensta Bretagne,[5].
In order to use the BEM code, first, we must generate the propeller and the duct geometries separately, see Figure 5. B-series data provide the main geometry data of each propeller type. In this study we use the B3-65 propeller and the Kaplan-65 (ducted propeller) geometries data [8]. Once the duct and the propeller meshes are generated, the next procedure is to calculate the hydrodynamic forces and coefficients. In this present study we use a BEM code. The calculation procedure in this study is an iterative computation to compute the interaction between the propeller and the duct. The procedure consists of separating the flow around the propeller and the flow around the duct into two different runs. Firstly, when the flow around the duct has been solved, we compute the duct induced velocities on the blades control points, i.e. the centers of all the panels, see Figure 6.
The details of the iterative procedure are illustrated in Figure 7. The flow around the propeller is then computed and the propeller induced velocities on the surface of the duct are calculated. The procedure is repeated until convergence which occurs after only a few iterations (Figure 8). The point of convergence shows the stable point in the last iteration, and we can use this value in our analysis.
Figure 5. propeller and duct meshing
Figure 6. Propellers in center point relative to duct
Figure 7. Iterative procedure for the propeller-duct interaction
Figure 8. Example of calculation result versus number of iterations

INDONESIAN SCHOLARS JOURNAL – VOL. 2, SEPTEMBER 2014
28
Figure 9. Comparison KT KQ and eta for bare (--) and ducted () propellers
The curves in Figure 9 show two types of propeller performances, bare propeller (represented by dashed lines) and ducted propeller (represented by solid lines). We can observe that the efficiency of the ducted propeller is better than the bare propeller in heavy loaded condition, i.e. when the advanced coefficient J [0.1; 0.6] (Figure 9 Comparison KT KQ and eta for bare (--) and ducted () propeller). The additional thrust from the duct contributes to the propeller performance in this condition. On the other hand, the duct produces drag in the lightly loaded conditions; thus, in the lightly loaded conditions the ducted propeller shows a lower efficiency than the bare propeller. It was explained in many papers that the principle of the duct is to add more thrust than the lost of propeller thrust due to its presence which accelerate the flow [5]. By applying the Bernoulli equation on a semi-infinite streamlines on each side of the actuator disk, we obtain that the ratio between the downstream wake and the upstream wake to be: 1+ CTh, where CTh is the thrust loading coefficient defined as:
(1)
From this simple model, we therefore obtain the theoretical loss of efficiency due to kinetic energy in the wake. It gives the maximum efficiency for a bare propeller to be:
(2)
The same procedure also gives the maximum efficiency for a ducted propeller:
(3)
Where, is the ratio of the additional thrust given by the propeller over to total thrust TT. This formula shows how a duct propeller can provide a better efficiency. When the propeller works in heavy load condition, CTh can show a higher value. Using the formula (2), the ideal efficiency, η (ideal), is decreasing with the CTh. The higher the CTh, the
lower is the ideal efficiency. Using the ideal efficiency formula for ducted propeller (3) with the presence of (ratio), in similar condition, a better ideal efficiency can be obtained [7].
C. METHODOLOGIES AND APPROACHES
1. Ship Efficiency Calculation In the present study, ship efficiency calculations comparing bare propeller and duct propeller is carried out. The calculations concern on a fishing ship in realistic operational conditions. An existing ship is used and the ship dimensions are respected so are the propulsion characteristics, the engine characteristics, the operational condition, etc. Once the engine characteristic curve is known, the next step is to generate the ship and the propeller characteristic curves. It is called the propeller load curve. The principle at this stage is to match the ship and the propeller loads. The propeller load is represented by the KT curve and is generated by open water test simulations of the previous stage (Figure 9 Comparison KT KQ and eta for bare (--) and ducted (-) propeller. To generate the ship load curves (KT ship), we must first use the β = KT/J2 formula (5), where β can be calculated using formula (4):
(4)
When β is known, we can generate the KT ship curves in relation with J (the advanced coefficient).
KT ship = β (5) There are two operation conditions; trawling and voyage conditions. Thus, in this present study, we generate two types of KT ship curves as it is presented in Figure 10. In trawling condition, KT ship shows heavy loaded behavior because the ship runs at low speed (3.5 knots) with a high resistance (trawl). In this condition, the ship is catching fish. Then, for the next step we plot the KT ship curves onto the open water propeller results of Figure 9 (KT propellers). In this manner, we find the crossing point between the KT ship and KT propellers (bare and ducted). We called these points, the reference points. These points indicate the advance parameter for the considered condition. By the reference points (crossing point of KT ship and KT propeller) we can determine the other variables (KQ, eta and J). We used 2 types of propellers (bare and ducted), thus, we must determine the parameters (KQ, η0 and J) for each type of propeller. The procedure can be showed in Figure 11. For each condition and each propeller type, we determine the intersection between the propeller thrust coefficient curve and the parabola drawn by the KT ship.
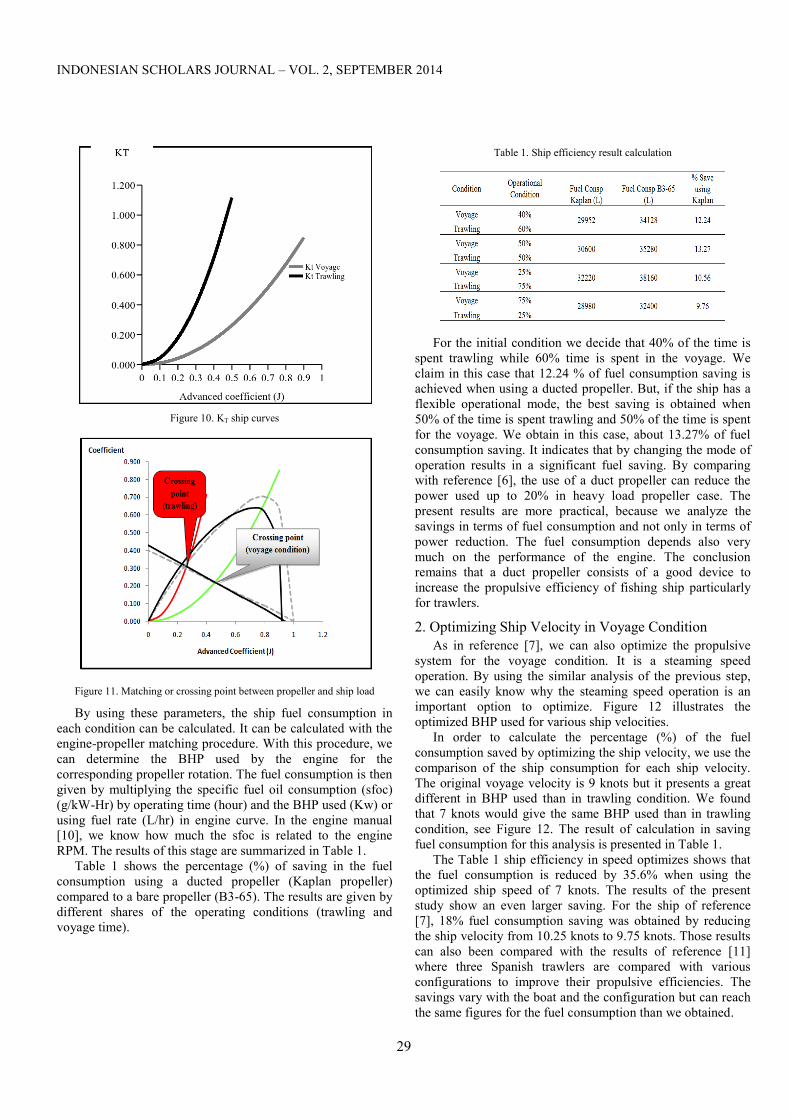
INDONESIAN SCHOLARS JOURNAL – VOL. 2, SEPTEMBER 2014
29
Figure 10. KT ship curves
Figure 11. Matching or crossing point between propeller and ship load By using these parameters, the ship fuel consumption in
each condition can be calculated. It can be calculated with the engine-propeller matching procedure. With this procedure, we can determine the BHP used by the engine for the corresponding propeller rotation. The fuel consumption is then given by multiplying the specific fuel oil consumption (sfoc) (g/kW-Hr) by operating time (hour) and the BHP used (Kw) or using fuel rate (L/hr) in engine curve. In the engine manual [10], we know how much the sfoc is related to the engine RPM. The results of this stage are summarized in Table 1.
Table 1 shows the percentage (%) of saving in the fuel consumption using a ducted propeller (Kaplan propeller) compared to a bare propeller (B3-65). The results are given by different shares of the operating conditions (trawling and voyage time).
Table 1. Ship efficiency result calculation
For the initial condition we decide that 40% of the time is
spent trawling while 60% time is spent in the voyage. We claim in this case that 12.24 % of fuel consumption saving is achieved when using a ducted propeller. But, if the ship has a flexible operational mode, the best saving is obtained when 50% of the time is spent trawling and 50% of the time is spent for the voyage. We obtain in this case, about 13.27% of fuel consumption saving. It indicates that by changing the mode of operation results in a significant fuel saving. By comparing with reference [6], the use of a duct propeller can reduce the power used up to 20% in heavy load propeller case. The present results are more practical, because we analyze the savings in terms of fuel consumption and not only in terms of power reduction. The fuel consumption depends also very much on the performance of the engine. The conclusion remains that a duct propeller consists of a good device to increase the propulsive efficiency of fishing ship particularly for trawlers. 2. Optimizing Ship Velocity in Voyage Condition
As in reference [7], we can also optimize the propulsive system for the voyage condition. It is a steaming speed operation. By using the similar analysis of the previous step, we can easily know why the steaming speed operation is an important option to optimize. Figure 12 illustrates the optimized BHP used for various ship velocities.
In order to calculate the percentage (%) of the fuel consumption saved by optimizing the ship velocity, we use the comparison of the ship consumption for each ship velocity. The original voyage velocity is 9 knots but it presents a great different in BHP used than in trawling condition. We found that 7 knots would give the same BHP used than in trawling condition, see Figure 12. The result of calculation in saving fuel consumption for this analysis is presented in Table 1.
The Table 1 ship efficiency in speed optimizes shows that the fuel consumption is reduced by 35.6% when using the optimized ship speed of 7 knots. The results of the present study show an even larger saving. For the ship of reference [7], 18% fuel consumption saving was obtained by reducing the ship velocity from 10.25 knots to 9.75 knots. Those results can also been compared with the results of reference [11] where three Spanish trawlers are compared with various configurations to improve their propulsive efficiencies. The savings vary with the boat and the configuration but can reach the same figures for the fuel consumption than we obtained.

INDONESIAN SCHOLARS JOURNAL – VOL. 2, SEPTEMBER 2014
30
Figure 12 illustrated the Optimization of BHP used in speed option
Table 1 ship efficiency in speed optimize Velocity (Knots) %RPM %BHP
used Fuel rate (L/Hr)
FC (L) 1 month
Saving (%)
9 83 48.3 41 29520 35.61
7 72 28.7 26.4 19008
D. CONCLUSION We have analyzed the ship efficiency of a fishing
vessel/trawler. Simulations using an iterative procedure between several BEM runs have been performed in order to compare the bare propeller and duct propeller performances. We found that for the same propeller diameter, using a duct propeller can increase the ship efficiency up to 13.7%. We also have optimized the ship efficiency using an optimized velocity in voyage condition; we have obtained a fuel saving up to 35% by reducing ship speed operation from 9 to 7 knots. Many references presented theoretical efficiency using duct, but this present study focuses on the fuel savings which is a more practical approach.
REFERENCES [1] United Nations Food and Agriculture Organization (FAO); the
international fish trade and world fisheries, Fisheries and Aquaculture Department, June 2008.
[2] El Lababidy, S.A., Bose, N., Liu, P., Walker, D.; Dynamic Positioning Thrusters Near Wake Hydrodynamic Characteristic at Near Bollard Pull, Journal of ship research, Vol.53, No1, March 2009.
[3] Rihan, D., O’regan, Noel.,Deakin, Barry.; The Development of a “Green Trawler”, First International Symposium on Fishing Vessel Energy Efficiency E-Fishing, Vigo, Spain, May 2010.
[4] Balash, C., Sterling,D.; Prawn Trawl Drag Due To Material Properties, Second International Symposium on Fishing Vessel Energy Efficiency E-Fishing, Vigo, Spain, May 2012.
[5] Laurens, J.-M., Moyne, S. and Deniset, F.; A BEM method for the hydrodynamic analysis of fishing boats propulsive systems, Second International Symposium On Fishing Vessel Energy Efficiency E-Fishing, Vigo, Spain, May 2012.
[6] Notti, E., Sala, A.,; On the opportunity of improving propulsion system efficiency for italian fishing vessels, Second International Symposium on Fishing Vessel Energy Efficiency, E-Fishing, Vigo, Spain, May 2012.
[7] Messina, G., Notti E.,; Energy saving in trawlers: practical and theoretical approaches, Proceedings of the International Conference on Marine Research and Transportation (ICMRT), Ischia, Naples, Italy 28-30 June 2007.
[8] Carlton, J.; Marine propeller and Propulsion Second Edition, Elsevier, USA, 2007.
[9] Kuiper, G.; The Wageningen Propeller Series, MARIN publication 92-001, Netherland, May 1992.
[10] Caterpillar; Engine specification Type 3408C 300-436 Kw and1800-2300 RPM, USA, 1997
[11] Coache, S., Laurens, J. M & Leroux, J.B (2013). Design and retrofit of the propulsion of trawlers to improve their efficiency.IMAM2013, La Corune, Spain.

INDONESIAN SCHOLARS JOURNAL – VOL. 2, SEPTEMBER 2014
31
Development of Phrase-Based Approach for Answer Finder on
Indonesian Factoid Question Answering 1Alvin Andhika Zulen* & 2Ayu Purwarianti
1,2 School of Electrical Engineering and Informatics, Bandung Institute of Technology, Indonesia *[email protected]
Abstract. In previous research, we have developed Indonesian Question Answering system that can handle factoid and non-factoid questions using monolingual approaches (Mean Reciprocal Value / MRR for factoid question = 0.619; MRR for non-factoid question = 0.808). However, there were several questions that can not be answered by the system, especially for the factoid question. It was either due to the answer did not appear in the answer list or the answer was not available on the 1st rank. In current research, we develop answer finding method using phrase-based approach, trying to solve problems in word-based answer finding method in previous research. The basic process of this method uses phrase chunker to extract phrases from a sentence. These phrases will be used extensively in the next steps for finding the answer. We use machine learning technique to classify and determine the rank of candidate answers. We use combination of word-based calculation (from previous research) and phrase-based calculation (from current research) as features for machine learning, such as keyword occurrence, phrase similarity, and phrase distance. Overall, from the test results, the phrase-based answer finding method developed in current research is able to produce Indonesian Question Answering system with better accuracy than the method used in previous research (classification accuracy = 72.44%; MRR = 0.923). This method also successfully addresses problems in our previous research.
Keywords: Factoid, Machine Learning, Phrase-Based Approach, Question Answering
A. INTRODUCTION Question Answering (QA) is a task in Natural Language
Processing (NLP) which automatically provides answers to questions given in natural language [1]. A QA system usually consists of three main components [2] as seen in Fig. 1:
1. Question analyzer, aims to classify the question according to the Expected Answer Type (EAT) as well as extract the keywords in the question
2. Passage retriever, aims to search for relevant documents/paragraphs that contain the answer based on keywords extracted by the question analyzer.
3. Answer finder, aims to search for candidate answers in documents/paragraphs that have been found previously. Each candidate answer will be given a score based on its compliance with the question. Some candidate answers will be selected as the best answers to the question.
In their last research, Pasca and Harabagiu [3] developed a high performance QA system using wide-coverage answer type taxonomy, passage retrieval with feedback loops, and machine learning based answer extraction. They utilized parser and WordNet information extensively in their QA system.
Question Answering
Document Collection
QuestionQuestion Analyzer
Passage Retriever
Answer FinderAnswer
Expected Answer TypeKeyword
Candidate Passages
Fig. 1. General QA system architecture
However, that approach is hard to be applied for Indonesian language because the lack of Indonesian language resources. Available natural language tools, such as syntactic parser (by Nasution et al. [4]), dependency parser (by Kamayani & Purwarianti [5]), and semantic parser (by Ferdian & Purwarianti [6]), have low accuracy, limited coverage, and

INDONESIAN SCHOLARS JOURNAL – VOL. 2, SEPTEMBER 2014
32
long computational time. Language resources, such as Indonesian WordNet (http://bahasa.cs.ui.ac.id/iwn/), still have limited coverage right now.
In previous research, Zulen and Purwarianti [7] have studied and implemented basic monolingual approaches on Indonesian QA system for that can handle factoid and non-factoid questions. They obtained MRR value 0.619 for factoid question and 0.808 for non-factoid question. From this research, there are several questions that can not be answered by the system, either the answer does not appear in the answer list or the answer is not available on the 1st rank, especially for factoid question, due to:
1. Deficiencies in answer scoring technique 2. Reference problem 3. Documents/paragraphs are not successfully retrieved.
The results of this previous research become the main background of the current research. Perfecting parts that have deficiencies or using other methods is expected to increase accuracy of the QA system. In current research, we try to develop a QA system with non-complicated techniques, but yet still have better accuracy than the previous research.
B. ANSWER SCORING PROBLEM
1. Distance Calculation Problem in answer scoring occurs if distance (number of
words) between the correct answer and the keywords is greater than distance between the wrong answer and the keywords. As a result, rank of the correct answer will be lower than the wrong answer.
An example for this problem can be seen in an example below. In this example, the correct answer, "Beinn Bhreagh, Nova Scotia, Kanada", is on 2nd rank, below "Edinburgh, Skotlandia, Britania Raya". This is caused by distance between answer and keywords. Keywords "Alexander", "Graham", "Bell", and "meninggal" are closer to "Edinburgh, Skotlandia, Britania Raya" compared to "Beinn Bhreagh, Nova Scotia, Kanada" (Table 1).
=========QUESTION ANALYZER=========
Question : Dimana Alexander Graham Bell meninggal ? EAT : LOCATION Keywords : Alexander, Graham, Bell, meninggal
=========ANSWER FINDER=========
1. Edinburgh, Skotlandia, Britania Raya Sentence: Alexander Graham Bell dilahirkan pada 3 Maret 1847 di Edinburgh, Skotlandia, Britania Raya dan meninggal pada 2 Agustus 1922 di Beinn Bhreagh, Nova Scotia, Kanada. 2. Beinn Bhreagh, Nova Scotia, Kanada
Table 1. Example of word-based distance calculation between candidate answers and keywords
Answer Edinburgh, Skotlandia,
Britania Raya
Beinn Bhreagh, Nova Scotia,
Kanada
Keyword Alexander 8 19 Graham 7 18
Bell 6 17 Meninggal 1 5
To overcome this problem, we modify the distance
calculation method. Distance calculation is performed not on word-based, but on a higher basis, such as phrases and clauses, by using parse tree. In current research, we choose phrase-based distance calculation. This solution is chosen because it is considered to be sufficient to produce better distance value than distance produced by word-based distance calculation.
Distance calculation is performed on the highest phrase level in phrase structure tree. This calculation is chosen because it can exhibit two related phrases if the phrases are contained in the same phrase at higher level. If the calculation is carried out at lower level, the relationship between phrases will be difficult to get and the calculated distance will not differ much from word-based calculation. We use following rules in distance calculation:
1. If two phrases are located in the same phrase at higher phrase level, the distance is 0.
2. If the two phrases are not located in the same phrase at higher phrase level, the distance is (number of phrases between + 1). For example, distance between two adjacent phrases is 1.
As an illustration, phrase structure of sentence in the previous example can be seen in Fig. 2. Keywords used are also found in phrase form: "Alexander Graham Bell" and "meninggal". We can see that the correct answer "Beinn Bhreagh, Nova Scotia, Kanada" is located in the same phrase with the keyword "meninggal" (distance = 0) at highest phrase level, so it has higher probability to become the answer of the question (Table 2).
To extract phrases from a sentence, we need phrase chunker or parser. Currently, there is no phrase chunker for Indonesian sentence. The parser for Indonesian sentence that already exists does not have good accuracy.
Therefore, we implement a simple phrase chunker for Indonesian sentence using regular expression (regex) pattern-matching. This method is adopted from RegexpParser in Natural Language Toolkit (NLTK) (in Bird et al. [8]). The phrase chunker will extract:
1. Noun Phrase (NP), 2. Verb Phrase (VP), 3. Prepositional Phrase (PP), 4. Adjective Phrase (ADJP), and 5. Adverbial Phrase (ADVP).
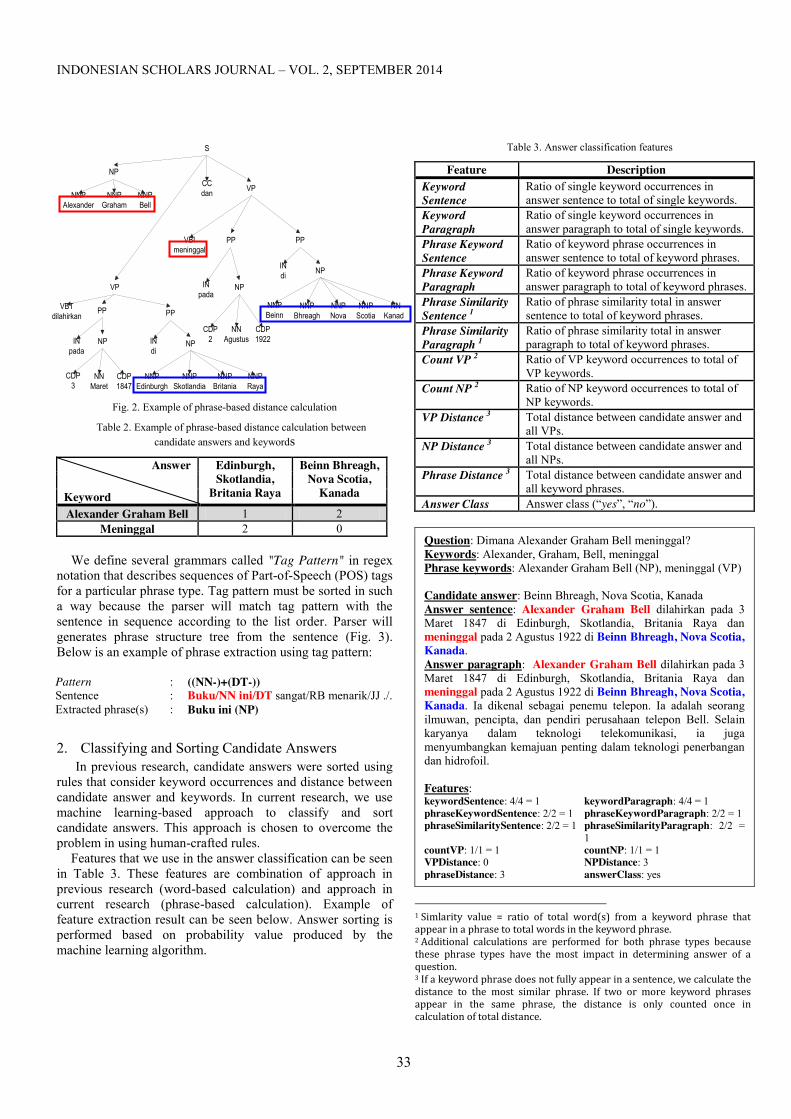
INDONESIAN SCHOLARS JOURNAL – VOL. 2, SEPTEMBER 2014
33
Fig. 2. Example of phrase-based distance calculation
Table 2. Example of phrase-based distance calculation between candidate answers and keywords
Answer Edinburgh, Skotlandia,
Britania Raya
Beinn Bhreagh, Nova Scotia,
Kanada
Keyword Alexander Graham Bell 1 2
Meninggal 2 0
We define several grammars called "Tag Pattern" in regex notation that describes sequences of Part-of-Speech (POS) tags for a particular phrase type. Tag pattern must be sorted in such a way because the parser will match tag pattern with the sentence in sequence according to the list order. Parser will generates phrase structure tree from the sentence (Fig. 3). Below is an example of phrase extraction using tag pattern:
Pattern : ((NN-)+(DT-)) Sentence : Buku/NN ini/DT sangat/RB menarik/JJ ./. Extracted phrase(s) : Buku ini (NP)
2. Classifying and Sorting Candidate Answers In previous research, candidate answers were sorted using
rules that consider keyword occurrences and distance between candidate answer and keywords. In current research, we use machine learning-based approach to classify and sort candidate answers. This approach is chosen to overcome the problem in using human-crafted rules.
Features that we use in the answer classification can be seen in Table 3. These features are combination of approach in previous research (word-based calculation) and approach in current research (phrase-based calculation). Example of feature extraction result can be seen below. Answer sorting is performed based on probability value produced by the machine learning algorithm.
Table 3. Answer classification features
Feature Description Keyword Sentence
Ratio of single keyword occurrences in answer sentence to total of single keywords.
Keyword Paragraph
Ratio of single keyword occurrences in answer paragraph to total of single keywords.
Phrase Keyword Sentence
Ratio of keyword phrase occurrences in answer sentence to total of keyword phrases.
Phrase Keyword Paragraph
Ratio of keyword phrase occurrences in answer paragraph to total of keyword phrases.
Phrase Similarity Sentence 1
Ratio of phrase similarity total in answer sentence to total of keyword phrases.
Phrase Similarity Paragraph 1
Ratio of phrase similarity total in answer paragraph to total of keyword phrases.
Count VP 2 Ratio of VP keyword occurrences to total of VP keywords.
Count NP 2 Ratio of NP keyword occurrences to total of NP keywords.
VP Distance 3 Total distance between candidate answer and all VPs.
NP Distance 3 Total distance between candidate answer and all NPs.
Phrase Distance 3 Total distance between candidate answer and all keyword phrases.
Answer Class Answer class (“yes”, “no”).
Question: Dimana Alexander Graham Bell meninggal? Keywords: Alexander, Graham, Bell, meninggal Phrase keywords: Alexander Graham Bell (NP), meninggal (VP) Candidate answer: Beinn Bhreagh, Nova Scotia, Kanada Answer sentence: Alexander Graham Bell dilahirkan pada 3 Maret 1847 di Edinburgh, Skotlandia, Britania Raya dan meninggal pada 2 Agustus 1922 di Beinn Bhreagh, Nova Scotia, Kanada. Answer paragraph: Alexander Graham Bell dilahirkan pada 3 Maret 1847 di Edinburgh, Skotlandia, Britania Raya dan meninggal pada 2 Agustus 1922 di Beinn Bhreagh, Nova Scotia, Kanada. Ia dikenal sebagai penemu telepon. Ia adalah seorang ilmuwan, pencipta, dan pendiri perusahaan telepon Bell. Selain karyanya dalam teknologi telekomunikasi, ia juga menyumbangkan kemajuan penting dalam teknologi penerbangan dan hidrofoil. Features: keywordSentence: 4/4 = 1 keywordParagraph: 4/4 = 1 phraseKeywordSentence: 2/2 = 1 phraseKeywordParagraph: 2/2 = 1 phraseSimilaritySentence: 2/2 = 1 phraseSimilarityParagraph: 2/2 =
1 countVP: 1/1 = 1 countNP: 1/1 = 1 VPDistance: 0 NPDistance: 3 phraseDistance: 3 answerClass: yes
1 Simlarity value = ratio of total word(s) from a keyword phrase that appear in a phrase to total words in the keyword phrase. 2 Additional calculations are performed for both phrase types because these phrase types have the most impact in determining answer of a question. 3 If a keyword phrase does not fully appear in a sentence, we calculate the distance to the most similar phrase. If two or more keyword phrases appear in the same phrase, the distance is only counted once in calculation of total distance.
S
NP
VP
NNPAlexander
NNPGraham
NNPBell
VBTdilahirkan
PP
INpada
NP
CDP3
NNMaret
CDP1847
PP
INdi
NP
NNPEdinburgh
NNPSkotlandia
NNPBritania
NNPRaya
VP
VBImeninggal
PP
INpada
NP
CDP2
NNAgustus
CDP1922
PP
INdi NP
NNPBeinn
NNPBhreagh
NNPNova
NNPScotia
NNKanada
CCdan

INDONESIAN SCHOLARS JOURNAL – VOL. 2, SEPTEMBER 2014
34
C. REFERENCE PROBLEM Reference problem occurs when there are words that refer
to other words in previous sentence and the referred words are keywords from the question. If this reference issue is not resolved, it will affect the keyword occurrences and distance features.
An example for this problem can be seen below. In this example, the correct answer, "198 cm", is on 8th rank. Keyword "Michael Jordan" does not appear in the answer sentence. The word that appears is pronoun "Ia" which refers to "Michael Jeffrey Jordan" in the first sentence. Keyword occurrences will be decreased and distance between candidate answers and keywords will be bigger.
Solution for this problem is considering the use of reference resolution as an additional process in answer finder. In current research, we implement a rule-based reference resolution which utilizes POS tags, phrases, and named entity information. This method is adopted from Budi et al. [9] and Williams et al. [10]. Illustration of the method can be seen in Fig. 3.
=========QUESTION ANALYZER=========
Question : Berapa tinggi dari Michael Jordan ? EAT : QUANTITY Keywords : tinggi, Michael, Jordan
=========PARAGRAPH RETRIEVER=========
1. Document: Michael_Jordan Paragraph: Michael Jeffrey Jordan dilahirkan di Brooklyn, New York, Amerika Serikat, pada 17 Februari 1963 adalah pemain bola basket profesional asal Amerika. Ia merupakan pemain terkenal di dunia dalam cabang olahraga itu. Setidaknya, ia enam kali merebut kejuaraan NBA bersama kelompok Chicago Bulls (1991-1993, 1996-1998). Ia memiliki tinggi badan 198 cm dan merebut gelar pemain terbaik.
=========ANSWER FINDER========= 8. 198 cm Sentence : Ia memiliki tinggi badan 198 cm dan merebut gelar pemain terbaik.
Reference resolution is done to pairs of entity <e1,e2> (referring entity, referred entity). Entity e1 is a NP obtained from phrase chunker. Entity e2 is a Named Entity (NE) obtained from NE tagger, located in the same sentence with e1 or in the previous sentence in the same paragraph. Features used for the reference resolution can be seen in Table 4.
Fig. 3. Process flow in reference resolution
Table 4. Reference resolution features
Features Description is String Match Partial
Indicates whether e1 and e2 are partially equal or not, after removing determiner (ini, itu, tersebut).
is Abbreviation Indicates whether e1 is abbreviation form of e2 or not.
is Personal Pronoun
Indicates whether e1 is a personal pronoun (PRP) or not (ia, dia, beliau).
is Demonstrative NP
Indicates whether e1 is a Demonstrative NP (ended with ini, itu, tersebut) or not.
is Organization Indicates whether e1 contains words referring to organization, such as perusahaan, komite, or not.
Named Entity Named entity of e2. is Entity Type Match
Indicates whether named entity of e1 and e2 are equal or not.
D. PASSAGE RETRIEVER PROBLEM Problem in passage retriever occurs when relevant
documents or paragraphs are not successfully retrieved by the component. As a result, answers to questions can not be found. Therefore, it is necessary to consider additional processes to find relevant documents and paragraphs. By utilizing the phrase chunker, we make several additional processes in this component:
1. Searching query in phrase form by using PhraseQuery provided by Lucene (in McCandless et al. [11]).
2. Searching NP keyword in the title of article. This process is added because the NP in question is often contained in title of relevant article.
E. QA SYSTEM ARCHITECTURE Architecture of the QA system constructed in this research
can be seen in Fig. 4. We also can see details of each module and comparison with QA system developerd in previous research.
F. EXPERIMENT
1. Experimental Data Test data are collected in form of list of questions, answers,
and relevant Indonesian Wikipedia documents from respondents. We obtain 203 test data with similar distribution for each EAT. The test data distribution and example for each EAT can be seen in Table 5.
2. Experimental Scenario We use three machine learning algorithms in answer
classification: 1. Support Vector Machine (SVM), is a statistical-
based learning algorithm which will construct an optimal separating hyperplane that separates instances of each class. It uses kernel functions to transform data so that the data is linearly separable in multidimensional space [12].
POS Tagger
NE Tagger
Phrase Chunker
Reference ResolverRaw text POS List
NE List
NP List
Resolved text

INDONESIAN SCHOLARS JOURNAL – VOL. 2, SEPTEMBER 2014
35
Fig. 4. QA system architecture
Table 5. Test question distribution and example
EAT Total Example Person 40 Siapa nama penemu telepon ? Organization 41 Apa nama perusahaan minyak yang
dimiliki Malaysia ? Location 41 Dimana Candi Mendut terletak ? Datetime 41 Kapan Alexander Graham Bell lahir ? Quantity 40 Berapa tinggi Gunung Tangkuban
Perahu ?
2. Maximum Entropy (MaxEnt), is a statistical-based learning algorithm that uses probability distributions as basis for learning. The main principle of this algorithm is “if there is no other information known to separate two events, the probability of both events will be considered equal (maximum entropy condition)” [13].
3. J48, or also knows as C4.5 algorithm is a decision tree based learning algorithm. Principle of this algorithm is to find the most effective attribute in dividing the data according to their class, which later become a node in decision tree [14].
SVM and MaxEnt algorithms are chosen because they are two common algorithms used in text processing. J48 algorithm is chosen because it can show the generated classification rules.
Table 6. Test scenario details
Scenario Name
Answer Finding Method
Machine Learning Algorithm
Scenario 1 Word-based (Baseline) - Scenario 2 Phrase-based Support Vector Machine Scenario 3 Phrase-based Maximum Entropy Scenario 4 Phrase-based J48
Test is divided into four main scenarios with black box method. Details of each test scenario can be seen in Table 6. Test will be done using two testing tecniques:
1. Cross validation with 4-folds. 2. Data split with 75% training data and 25% testing data.
3. Experimental Result Testing is performed to see the accuracy of answer finder
component in classifying and sorting answers. The test results using cross validation technique can be seen in Table 7 (classification accuracy) and Table 8 (MRR). The test results using data split technique can be seen in Table 9 (classification accuracy) and Table 10 (MRR). Highest accuracy/MRR values are colored in blue while lowest accuracy MRR values are colored in red.
Table 7. Answer classification accuracy (Cross validation)
EAT SVM J48 MaxEnt
Yes No Yes No Yes No Person 60.2 82.3 42.4 85.1 63.8 83.5 Organization 62.0 89.0 42.9 90.8 62.7 86.3 Location 74.4 61.8 50.6 80.6 75.6 64.8 Datetime 72.8 70.8 46.5 86.3 81.2 74.0 Quantity 78.1 67.1 66.8 78.3 76.8 70.0 All 66.8 75.8 47.2 84.7 69.1 76.9
Table 8. MRR value for answer finder (Cross validation)
EAT Baseline SVM J48 MaxEnt Person 0.585 0.846 0.635 0.854 Organization 0.801 0.786 0.663 0.797 Location 0.696 0.813 0.614 0.716 Datetime 0.849 0.757 0.573 0.799 Quantity 0.680 0.811 0.601 0.755 All 0.723 0.802 0.617 0.784
Table 9. Answer classification accuracy (Data split)
EAT SVM J48 MaxEnt
Yes No Yes No Yes No Person 58,82 89,16 47,06 81,53 62,75 88,55 Organization 65,00 78,04 35,00 81,84 62,50 79,44 Location 70,18 78,71 49,12 84,59 73,68 78,71 Datetime 88,89 85,54 61,11 89,76 94,44 87,35 Quantity 85,00 72,27 80,00 75,78 80,00 76,95 All 68,58 81,16 47,35 82,17 69,47 82,23
Table 10. MRR value for answer finder (Data split)
EAT Baseline SVM J48 MaxEnt Person 0,589 1,000 0,683 1,000 Organization 0,769 0,821 0,655 0,833 Location 0,848 0,955 0,659 0,909 Datetime 0,914 0,909 0,727 1,000 Quantity 0,488 0,933 0,783 0,875 All 0,728 0,922 0,700 0,923
Question AnalyzerCorpus
User Interface
Passage Retriever
Answer Finder
Document Preprocessing
WikipediaIndonesia
Dump
Question
Answer
EATKeywords
Keywords
Wikipedia Article
Document Collection
RelevantParagraphs
Answer
Question
Index File
Document Indexing
Document Collection
Searching Index
SearchingIndex
Preprocessed Article
EAT Classifier
POS Tagger
Phrase ChunkerStemmer
Paragraph Searcher
Document Searcher
Answer Classifier & Ranker
POS Tagger
Phrase Chunker
Stemmer
Reference ResolutionNE Tagger
: Module from previous research : Refined module : New module
Keyword Extractor
WEKA
Lucene
: Existing library / module

INDONESIAN SCHOLARS JOURNAL – VOL. 2, SEPTEMBER 2014
36
Accuracy value for each algorithm with cross validation technique and data split technique are not much different. This indicates that the test results of built classification model are valid.
MRR value obtained in current research is higher than MRR value in previous research (baseline). This indicates that the phrase-based answer finding method is successful enough to answer factoid question correctly and address problems in previous research.
SVM and MaxEnt algorithms have better performance than J48 algorithm, both in classifying and sorting answers. SVM and MaxEnt algorithms are statistical-based learning algorithms that use features together to perform classification in single step. J48 algorithm uses features separately to perform classification in several steps. Statistical model is more suitable for text processing problems. In addition, J48 algorithm tends to have overfitting problems on training data and leads to poor performance on testing data.
From the test results, there are several questions that can not be answered by the system, especially case where the answer is not in the 1st rank. The causes are:
1. Phrase distance value 2. Similarity value 3. Priority between NP and VP features
G. CONCLUSION Answer finding method developed in current research is
phrase-based answer finding method. This method is chosen to overcome problems in word-based method in previous research by Zulen and Purwarianti [7]. The basic process of this method is using phrase chunker to extract phrases from a sentence. Machine learning is used to classify and determine the ranking of candidate answers with combination of word-based calculation (previous research) and phrase-based calculation (current research) as features.
Better test results obtained indicate that phrase-based method developed in current research is successful enough to answer factoid questions correctly and address problems in previous research. But, there are several questions that can not be answered by the system. It is necessary to refine the module used in the system and consider using complete parse tree instead of phrase tree.
REFERENCES [1] Jurafsky, D. and Martin, J.H., Speech and Language Processing, 2nd ed.,
USA: Pearson Education, 2009. [2] Harabagiu, S.M., Pasca, M.A., and Maiorano, S., “Experiments with
Open-Domain Textual Question Answering,” Proceedings of the 18th International Conference on Computational Linguistics (COLING 2000), Saarbrücken, Germany, 2000.
[3] M. A. Pasca and S. M. Harabagiu, “High Performance Question Answering.” Proceedings of the 24th Annual International ACM SIGIR Conference on Research and Development on Information Retrieval, New Orleans, USA, 2001.
[4] R. P. Nasution, D. H. Widyantoro and A. Purwarianti, A, “INAGP : Pengurai Kalimat Bahasa Indonesia Sebagai Alat Bantu Untuk Pengembangan Aplikasi PBA,” Proceedings of Seminar Nasional Ilmu Komputer dan Aplikasinya (SNIKA 2009), Bandung, Indonesia, 2009.
[5] M. Kamayani and A. Purwarianti, “Dependency Parsing for Indonesian with GULP,” Proceedings of the 3rd International Conference on Electrical Engineering and Informatics (ICEEI 2011), Bandung, Indonesia, 2011.
[6] F. Ferdian and A. Purwarianti, “Implementation of Semantic Analyzer in Indonesian Text-Understanding Evaluation System,” Proceedings of IEEE International Conference on Computational Intelligence and Cybernetics (CYBERNETICSCOM 2012), Denpasar, Indonesia, 2012.
[7] A. A. Zulen and A. Purwarianti, “Study and Implementation of Monolingual Approach on Indonesian Question Answering for Factoid and Non-Factoid Question,” Proceedings of the 25th Pacific Asia Conference on. Language, Information and Computation (PACLIC 2011), Singapore, Singapore, 2011.
[8] S. Bird, E. Klein, and E. Loper, Natural Language Processing with Python. USA: O’Reilly Media, Inc., 2009.
[9] I. Budi, S. Bressan and Nasrullah, “Co-Reference Resolution for Indonesian Language Using Association Rules,” Proceedings of the 8th International Conference on Information Integration and Web-based Applications & Services (iiWAS 2006),Yogyakarta, Indonesia, 2006.
[10] S. Williams, M. Harvey and K. Preston, “Rule-based Reference Resolution for Unrestricted Text Using Part-of-Speech Tagging and Noun Phrase Parsing,” Proceedings of the 1st Discourse Anaphora and Anaphor Resolution Colloquium (DAARC 1996), Lancaster, UK, 1996.
[11] M. McCandless, E. Hatcher and O. Gospodnetic, Lucene in Action, 2nd ed., USA: Manning Publication, 2010.
[12] V. N. Vapnik, The Nature of Statistical Learning Theory, 2nd ed., USA: Springer-Verlag, 2000.
[13] S. Guiasu and A. Shenitzer, “The Principle of Maximum Entropy,” The Mathematical Intelligencer, vol. 7, 1985.
[14] J. R. Quinlan, C4.5 : Programs for Machine Learning, USA: Morgan Kaufmann Publishers, 1993.

INDONESIAN SCHOLARS JOURNAL – VOL. 2, SEPTEMBER 2014
37
Optimization Preparation and Characterization of ZSM-5 Zeolite Synthesis
Using Rice Husk 1,2Chindy Feryandy HB*, 1Simparmin Br Ginting &2Hens Saputra
1Chemical Engineering Department, Universitas Lampung, 35145 Lampung, Indonesia 2Process Industrial Technology Center - TIRBR, Agency for the Assessment and Application of Technology - BPPT,
Tangerang Selatan, Indonesia *email: [email protected]
Abstract. The optimization of ZSM-5 synthesis from Lampung natural zeolite using tetraprophyl ammonium bromide (TPABr) as template was conducted in this research. The objective is to obtain the best crystallization process parameter, related to crystallinity of the product. The synthesis of ZSM-5 material was carried out in an autoclave with the constant parameters which are TPABr/SiO2 ratio 0.05 mol/mol, and Si/Al ratio 40 mol/mol. The varying parameter is time of crystallization at 24 hours, 36 hours, and 48 hours. Rice husk ash and extracts are used as source of silica for silica enrichment to achieve the certain SiO2/Al2O3 ratio. The product was characterized qualitatively and quantitatively. According to the experimental results, the structure of ZSM-5 was formed for all of silica extract with the percent of crystallinity for the 24 h, 36 h and 48 h was 77.55%, 77.93% and 72.50% respectively. The crystallinity of ZSM-5 from natural zeolite and rice husk ash enrichment was 33.70%, 83.04%, 73.86%. In this experiment, another zeolite structure as the intermediate products such as ZSM-8 and Analcym was observed. The obtained cube-shaped crystals possesses high surface area ca. 239 m2/g, average pore size 33.27 Ǻ and pore volume ca. 0.08 cm3/g.
Keywords: zsm-5, natural zeolite, silica enrichment, rice husk
A. INTRODUCTION Large amount of natural zeolites are found in several
regions in Indonesia including in Lampung. Natural zeolites are widely used for many purposes such as fertilizer, animal feed, water treatment and waste water treatment, ion exchangers, adsorbents and catalysts. Recently ZSM-5 has been used in many industries. ZSM-5 stands for Zeolite Socony Mobile – 5. ZSM-5 is a synthetic zeolite which rich in silica and possesses a very good thermal and hydrothermal stability. The characteristics of ZSM-5 was supporting the application as catalyst at high temperatures. Furthermore it has a sour center, cavities, and pores with uniform shapes and sizes that compatible as selective catalysts for the shape and size of the substances involved reactions. In industry, ZSM-5 is mainly used for the interconversion of hydrocarbons, i.e. meta-xylene to para-xylene, methanol conversion into benzene, conversion of oxygenated hydrocarbons (alcohol / methanol) in the biomass into gasoline, and others catalytic processes. Synthetic zeolite is more attractive than natural zeolite due to higher purity, stability, activity, and selectivity. In addition, synthetic zeolite has a three-dimensional channel that is not easily deactivated by the clogging materials. The utilization of natural zeolite could be increased to high technology industries area by structure conversion or functional groups modification.
Researchers have been interested in preparation of zeolites from various silica resources. Ginting and Nofalianti (2010), managed to synthesize ZSM-5 from natural Kalianda South Lampung natural zeolite, Tetra Propyl Ammonium Bromide (TPABr) as template. The highest relative percent crystallinity of 61.33% was obtained from SiO2/Al2O3 molar ratio of 40 mol/mol. In 2007, Andhi and Didik have synthesized ZSM-5 using rice husk ash as silica sources, without organic templates, obtaining single-phase ZSM-5, 50.19% crystallinity at ¬ SiO2/Al2O3 molar ratio of 50 mol / mol.
Metta, et al (2003) have prepared the ZSM-5 using alumina and silica as raw materials derived from coal fly ash (lignite fly ash) and rice husk ash. The maximum yield of 59 wt.% from 40 mol / mol SiO2/Al2O3 molar ratio. Rice husk is the waste of agriculture that contained high silica about 86.9% -97.3% (Houston, 1972). In this study, ZSM-5 was synthesized from Lampung natural zeolite and rice husk as silica source. The synthesis time, effect of crystallinity, surface area, pore size, and pore volume was investigated.
B. EXPERIMENTAL
1. Preparation of ZSM-5 Materials used are: Rice Husk, and HCl, natural zeolite
origin Kalianda South Lampung, NaOH, TPABr (tetra propyl ammonium bromide), H2SO4, and distilled water.

INDONESIAN SCHOLARS JOURNAL – VOL. 2, SEPTEMBER 2014
38
0
1000
2000
3000
4000
5000
0 10 20 30 40
Run 1 (4 hour)
2. Synthesis methods of ZSM-5 Solution A is prepared by dissolving silica in NaOH. Then
refluxed at a temperature of 80-90˚ C for 1 hr. Solution B was made by dissolving the natural zeolite into NaOH solution. C solution made by dissolving TPABr into distilled water. Solution B and C incorporated into the solution A while stirring. The resulting mixture has a pH ranging from 11-13. To obtain a pH of 11, into a solution of 1 N H2SO4 was added drop by drop until the pH reached 11. The final mixture is produced in the form of the solution, not the gel. The resulting mixture was placed into an autoclave and heated at a fixed temperature of 1800C at autogenously pressure. Solids are formed from the heating were filtered, washed with distilled water 2 times, then dried in an oven at a temperature of 1050 C. The products produced in the form of a white powder that is ready to Characterized, using X-ray diffraction (XRD) at IIU (International Islamic University) Malaysia and Integrated Laboratory UIN (State Islamic University) in Jakarta.; Scanning Electron Microscopy (SEM) at the National Nuclear Energy Agency (BATAN) Serpong, and Brunauer, Emmett, Teller (BET) in the Laboratory of Chemical Engineering UI (University of Indonesia) Depok.
3. Characterization The obtained ZSM-5 was characterized by X-ray
diffraction (XRD), Scanning Electron Microscopy (SEM), BET surface area analyzer, SEM-EDS the structure of ZSM-5 was identified by XRD. Microstructure of product was observed using SEM. The pore characteristics was studied using BET surface area analyzer.
C. RESULTS AND DISCUSSION
1. Qualitative Analysis Qualitative analysis aims to determine the reaction of
ZSM-5 products i.e. the main product, residual reactants, and the metastable phase (Goto and Sand, 1988).
The obtained ZSM-5 was clearly identified from Figures 2 and 3. The XRD diffraction patterns of the synthesized ZSM-5 was compatible with standard (Mobile Oil or IZA). The natural zeolite was decayed and converted successfully to the synthetic ZSM-5.
2. Quantitative Analysis Quantitative analysis aims to determine the percent
crystallinity of the obtained ZSM-5, BET surface area, pore volume and pore size.
The XRD diffraction patterns of calcined ZSM-5 for run 1 to 3 (source: silica extract) and 1 'to 3' (source: silica ash) are shown in Figure 2 and 3. Calculation result shows that the highest crystallinity was achieved by samples from silica dust because silica from rice husk ash has higher purity than the silica extract
Fig. 1 . ZSM-5 synthesis mechanism
Fig. 2. XRD patterns of synthesized ZSM-5 (Run 1,2 and 3 for Silica Extract after calcination)

INDONESIAN SCHOLARS JOURNAL – VOL. 2, SEPTEMBER 2014
39
0
1000
2000
3000
4000
5000
0 20 40
Standard of ZSM-5 (Mobile Oil)
0 1000 2000 3000 4000 5000
0 10 20 30 40
Run 2 (36 hour)
0
1000
2000
3000
4000
5000
0 10 20 30 40
Standard of ZSM-5 (Mobile Oil)
Fig. 2. XRD patterns of synthesized ZSM-5 (Run 1,2 and 3 for Silica Extract after calcination)
Fig. 3. XRD patterns of synthesized ZSM-5 (RUN 1’,2’ and 3’, Silica Ash after calcination)
The morphology (shape crystal ZSM-5) and particle uniformity was observed using SEM as shown in Figure 4.
The SEM micrograph as shown in Figure 4 supported the XRD pattern of ZSM-5 structure. The images show uniform cube like of ZSM-5 crystal with diameter ca. 3 µm.
Results of BET specific surface area analysis, pore volume, and pore size by nitrogen adsorption-desorption are shown in Table 2.
Following the calculation of percent crystallinity of the two methods:
Table 1. Percent of crystallinity of synthesized ZSM-5
Note: RUN 1-3 (time 24 hr, 36 hr dan 48 hr; silica source: extract silica) RUN 1’-3’ (time 24 hr, 36 hr dan 48 hr; silica source: extract silica)
SAMPLE
Percent of Crystallinity (%)
ASTM RUN 1 (24 hr) 77,55 RUN 2 (36 hr) 77,93 RUN 3 (48 hr) 72,50 RUN 1’(24 hr) 33,70 RUN 2’(36 hr) 83,04 RUN 3’(48 hr) 73,86
0 1000 2000 3000 4000 5000
0 10 20 30 40
Run 3' (24 hour)

INDONESIAN SCHOLARS JOURNAL – VOL. 2, SEPTEMBER 2014
40
(a)
(b)
(c)
Fig 4. SEM analysis of the ZSM - 5 (a) Magnification 500times, (b) Magnification 1500 times and
(c) Magnification 3000 times
The surface area, pore size, and pore volume of synthesized ZSM-5 for 24 h reaction is 226.7 m2 / g, 0.105 cc / g and 28.675 Ǻ respectively. Increasing reaction time could increase the BET surface area, pore volume, and pore size. The highest results was obtained at 36 hr. The crystallization time above 36 hr could decrease the specific surface area, pore volume and pore size. This results was supported by the previous researcher Abdul Hamid and Educate Prasetyoko (2011). The longer of aging time will give smaller porosity.
Table 2. BET analysis results of synthesized ZSM-5
Run Reaction
Time (hours)
Surface Area (m2/g)
Pore Volume
(cc/g)
Pore Size (Ǻ)
1 (24 hr)
226,7 0,105 28,675
2’ (36 hr)
239 0,108 33,272
3’ (42 hr)
194 0,088 29,562
Note : RUN 1 (Silica source : extract, after calcination) RUN 2’ (Si source : ash, after calcination) RUN 3’ (Si source : ash, after calcination)
Goncalves (2008) describes the influence of crystallization time in the synthesis of ZSM-5. The increased of Crystallization time will result in a rapid change from a mesoporous aluminosilicate ZSM-5, then increased the amount of precursor ZSM-5 which formed Crystallization, so the porosity was reduced. There were not significant change in pore diameter. The pore diameter was influenced by the size of the template used in the synthesis.
D. CONCLUSION The ZSM-5 crystal was synthesized from Lampung natural zeolite and rice husk as the source of silica. The intermediate products were ZSM-8 and Analcym. The best of ZSM-5 crystallinity (83.04%) was obtained at optimum crystallization times of 36 hours, using rice husk ash as silica source. The specific surface area, pore volume and pore diameter was 239 m2/g, 0.108 cc/g and 28.67 Å respectively.
REFERENCES [1] Goto Y. and Sand L.B. “Crystallization of ZSM-5 from Natural Japanese
Mordenit and Clinoptilolite”, in Occurrence Properties and Utilization of Natural Zeolite, Akademiai Kaido, jepang, 1988.
[2] Goncalves, M. L., Dimitrov, L. D., Jordao, M. H., Wallau, M., and Urquieta-Gonzalez, E. A.). “Synthesis of mesoporous ZSM-5 by crystallisation of aged gels in the presence of cetyltrimethylammonium cations”. Catal. Today, pp. 69-79, 2008.
[3] Andhi Laksono P., Didik Prasetyoko.. Abu Sekam Padi Sebagai Sumber Silika Pada Sintesis Zeolit ZSM-5 Tanpa Menggunakan Templat Organik, Surabaya, Akta Kimia Indonesia Vol.3, 2007.
[4] Metta C., Teerapong Namto., Paisan K., Jumras L. “Synthesis of ZSM-5 zeolite from lignite fly ash and rice husk ash”, Bangkok, Kasetsart University, Thailand, 2003.
[5] Yanti, Merry. “Synthesis of ZSM-5 Zeolite Natural Kalianda (Effect of Temperature on Crystallinity Product’s, Bandar Lampung, Universitas Lampung, Bandar Lampung, Indonesia, 2010.
[6] Ginting, Simparmin, Br., and Nofalianti E., ” Synthesis of ZSM-5 Zeolite Natural Lampung (Effect of SiO2/Al2O3 mole ratio Percent crystallinity Against ZSM-5)”, Proceedings of the Research Seminar & Community Services UNILA, Bandar Lampung, Indonesia, 20 September 2010.

INDONESIAN SCHOLARS JOURNAL – VOL. 2, SEPTEMBER 2014
41
Implementation of Polynomial Basis Squaring 1Marisa Paryasto*, 2Budi Rahardjo
1Telkom University 2Institut Teknologi Bandung
Abstract. Operations on binary field representation are very specific and the algorithm used would significantly affect the whole performance of computation. Squaring is one of the most used operations in binary field. Our related work is using binary operations for implementing Elliptic Curve Cryptography. This work presents an algorithm of squaring operation on polynomial basis implemented using C programming language as a part of developing a library to support our main research in cryptography implementation.
Keywords: binary field arithmetic, squaring, polynomial basis
A. INTRODUCTION Operations on binary field representation are very specific and the algorithm used would significantly affect the whole performance of computation. Squaring is one of the most frequent operation which in this work is being optimized by utilizing the advantage of and operation considered as ”free” in hardware implementation: shift operation. The shifting operation will reduce number of operations both in multiplying and reducing process.
This work is a part of our main research in cryptography implementation [10], [7], [8], [6], [9], [4]. In implementing Elliptic Curve Cryptography, we need a library that can efficiently perform binary operations. Squaring is one of the most common operations being used in both field and curve operations. The technique implemented here straight-forwardly utilizes C programming language as a part of building a cryptographic library.
B. POLYNOMIAL BASIS
1. Definition
In polynomial basis, the elements in GF(2m) can be
represented in the form of GF(2m)=am−1xm−1+...+a1x+a0,
ai∈ GF(2) . If α ∈ GF(2m) and is a root of the irreducible
polynomial f(x) = xm + fm−1 + ... + f1x + f0 over GF(2), the
set {1,α,..., αm−1} constitutes the polynomial basis in GF(2m). There exists a polynomial for any m to be chosen as an
irreducible binary polynomial P (x) of degree m. Irreducibility of P(x) means that P(x) cannot be factored as a product of binary polynomial each of degree less than m.
2. Operations
Arithmetic operations in GF(2m) are performed modulo an irreducible polynomial f(x) over GF(2). Addition of polynomials is performed under modulo 2 arithmetic, or
bitwise exclusive-or (XOR) operations in their binary representations. Subtraction is exactly the same as addition in modulo 2 arithmetic.
Multiplication is often considered as the most important
operation among all of GF(2m) arithmetic operations, but it is complex and time-consuming. The algorithm used, and the choice of polynomial irreducible (trinomial, pentanomial) will contribute to the level of the complexity of multiplication.
Squaring operation in GF (2m ) requires multiplication in
GF (2m ).
C. PREVIOUS WORKS In [2], squaring operation is implemented using classic
squaring with LSB-first or MSB-first, or using bit-level Montgomery squaring. The classic squaring is carried out by performing multiplication with only one input operand to
perform c(x) = a(x)a(x) mod f(x) = a(x)2 mod f(x) and use the reduction matrix R . Reduction matrix R is a linear mapping of the 2m − 1 coefficient of a(x) into the m coefficient of c(x) . This mapping is represented in a matrix notation by [5]. Bit-
level algorithm for Montgomery squaring in GF(2m) can be found in [3]. [1] describes squaring and reduction algorithm for trinomial, pentanomial and general polynomial irreducible.
An also related work is an implementation of conversion algorithm from polynomial basis (PB) to optimal normal basis (ONB) and vice versa [10]. The conversion algorithm is very useful because in ONB representation, squaring is just a matter of shifting the bit-string to the right.
D. IMPLEMENTATION Squaring operation is implemented by doing two steps. One is multiplying and then the next one is reduction. Multiplying is done by multiplying a multiplicand by itself. For every bit of multiplicand, the multiplier will be shifted to the left. If the bit referred in the multiplicand is 1, the multiplicand will be AND-ed with the multiplier in a bit-wise

INDONESIAN SCHOLARS JOURNAL – VOL. 2, SEPTEMBER 2014
42
manner. If the bit referred in the multiplicand is 0, the multiplier will only be shifted without being AND-ed.
Squaring algorithm: 1: // multiplication process 2: for (i = m−1; i > 0; i−−) 3: result = multiply(A, B); 4: // reduction process 5: for (i = 0; i <m/2; i++) 6: result = reduction(result , poly red);
The listed program of squaring process:
1: void squarePB(int A[], int p[]){ 2: int i, j, k, x, y; 3: int B[m] , result [m]; 4: int p long[m]; //to hold poly irred in 5: //a longer array, 6: // making computation easier 7: int iteration ; 8: int flag = 1; 9: for (i = 0; i <m; i++) 10: p long[i] = 0; 11: for (i = 0; i <= n; i++) 12: p long[i] = p[i]; 13: // initializing B[] 14: for (i = 0; i <m; i++){ 15: B[i] = 0; 16: result[i] = 0; 17: } 18: j = n−1; 19: for (i = m−1; i >= n−1; i−−){ 20: B[i] = A[j]; 21: j −−; 22: } 23: if (A[n−1] == 1){ 24: for (i = 0; i <m; i++) 25: result[i] = B[i]; 26: for (k = n−2; k >= 0; k−−){ // if bit 1, 27: // shift−left and xor 28: if (A[k] == 1){ 29: //shifting B to the left one bit 30: for (i = 0; i < m−1; i++) 31: B[i] = B[i+1]; 32: //and make sure to give trailing 0s 33: B[m−1] = 0; 34: // xor 35: for (i = 0; i <m; i++) 36: result[i] = result[i] ˆ B[i]; 37: } 38: else{ //if the bit is 0, just shift no xor 39: //shifting B to the left one bit 40: for (i = 0; i < m−1; i++) 41: B[i] = B[i+1]; 42: //and make sure to give trailing 0s 43: B[m−1] = 0; 44: } 45: }
1. Multiplication Figure 1 below is the illustration of multiplication process.
The polynomial to be multiplied is A(x) = x6 +x4 +x3 +x+1 or 1011011 in bit representation.
The listed program for the multiplication program is:
n = number of bits m = 2n − 1 A = multiplicand B = multiplier 1: for (i = m−1; i > 0; i−−){ //from right to left , 2: //from LSB to MSB 3: if (A[i] == 1){ 4: shift left(B); 5: xor(A, B); 6: } 7: else 8: shift left(B); 9: }
The result of multiplication consists of 2n-1 bits, which in
this case is 2(7)-1=13 bits. The result is x12 + x8 + x6 + x2 + 1 or 1000101000101 in bit representation.
2. Reduction The process of reduction is simple by XOR-ing the result
of multiplication with the binary representation of the chosen polynomial irreducible. The result string will be XOR-ed with the polynomial irreducible whenever its bit equal to 1.
The illustration is presented in Figure 2.
Fig 1. Multiplication Process

INDONESIAN SCHOLARS JOURNAL – VOL. 2, SEPTEMBER 2014
43
Fig 2. Reduction Process
Reduction algorithm:
1: poly red = 10000011 2: n = number of bits m = 2n − 1 3: for (i = 0; i<m/2; i++){ //from left to right, 4: //from MSB to LSB 5: if (result[i] == 1){ 6: xor(result , poly red); 7: } 8: else{ 9: shift right(result); 10: } 11: } 12: //now is the part of reduction 13: iteration = 0; 14: k=0; 15: while (flag == 1){ 16: if (k>=m/2) 17: flag = 0; 18: if (result[k] == 1){ // do xor 19: i t e r a t i o n ++; 20: j=0; 21: for (i = 0; i <m; i++){ 22: result[i] ˆ= p long[j]; 23: j ++; 24: } 25: k=0; 26: } 27: else{ //do shift to the right, no need xor−ing 28: i t e r a t i o n ++; 29: //shifting result to the right one bit 30: for (i = m−1; i >=0; i−−) 31: p long[i] = p long[i−1]; 32: //make sure to give trailing 0s 33: p long [0] 34: k++; 35: } 36: }
E. COMPLEXITY COMPARISON We compare our work with several squaring algorithms
from [2]. Figure 3 shows that all algorithms are compared to each other by calculating complexity of the multiplication and reduction process. Squaring complexity is the sum of multiplication and reduction complexities.
All algorithms being compared to ours are implemented in VHDL for hardware implementation while ours is implemented in software. Our algorithm has lower complexity compared to classic squaring and bit-level Montgomery ver 1, and has higher complexity compared to LSB-first squaring and bit-level Montgomery ver 2. The purpose of comparing all algorithms in complexity is to show the performance of each by putting them on the same objective point of view, and then observe the position of our method in between other methods.
In hardware implementation, the lower complexity will save areas and or time, while in software implementation, slightly difference as shown in Figure 3 will not give significant impact.
F. CONCLUSION Polynomial operations in GF(2m) can be done more
efficiently by doing the process in bit level. The cost of checking the bit will save the cost of processing unnecessary bits because the complexity of multiplication and reduction process will grow exponentially with the numbers of bit length. Optimization in hardware implementation will be different with software implementation. In software implementation, the optimization is done generally by reducing iteration while in hardware implementation it is highly dependent to the architecture, instruction set and programming language being used.
Figure 3. Squaring Complexity
REFERENCES [1] Cryptographic Algorithms on Reconfigurable Hardware. Springer Sci-
ence+Business Media, LLC, 2006. [2] Jean-Pierre Deschamps, Jose Luis Imana, and Gustavo D. Sutter. Hard-
ware Implementation of Finite Field Arithmetic. The McGraw-Hill Companies, Inc., 2009.
[3] Cetin K. Koc and Tolga Aca. Montgomery Multiplication in GF(2k), volume 1, pages 57–69. Kluwer Academic Publishers, Boston, April 1998.
[4] Intan Muchtadi-Alamsyah, Marisa Widyastuti, and Muhammad Hafiz

INDONESIAN SCHOLARS JOURNAL – VOL. 2, SEPTEMBER 2014
44
Khusyairi. Finite field basis conversion. In International Conference on Mathematics, Statistics and their Applications, 2009.
[5] Christof Paar. Efficient VLSI Architectures for Bit-parallel Computation in Galois Fields. PhD thesis, 1994.
[6] Marisa Paryasto. Adaptive multiprecision elliptic curve cryptosystem with partial encryption and multilayer plaintext. July 2011.
[7] Marisa Paryasto, Budi Rahardjo, Intan Muchtadi-Alamsyah, and Kus- priyanto. Rancangan unit aritmetika finite field berbasis composite field. In Munas Aptikom, 2010.
[8] Marisa Paryasto, Budi Rahardjo, Fajar Yuliawan, Intan Muchtadi- Alamsyah, and Kuspriyanto. Composite field multiplier based on look- up table for elliptic curve cryptography implementation. volume 2, pages 890–893. ICEEI, July 2011 2011.
[9] Marisa Paryasto, Budi Rahardjo, Fajar Yuliawan, Intan Muchtadi- Alamsyah, and Kuspriyanto. Composite field multiplier based on look- up table for elliptic curve cryptography implementation. ITB Journal of Information and Communication Technology, 6(1), 2012.
[10] Marisa W. Paryasto, Budi Rahardjo, Intan Muchtadi Alamsyah, and Muhammad Hafiz Khusyairi. Implementation of polynomial basis - optimal normal basis I conversion. In Jurnal Ilmiah Teknik Komputer, 2009.

Associate Editors
Hadi Teguh Yudhistira
Sungkyunkwan University, South Korea
Ferry Anggoro Ardy Nugroho Chalmers University of Technology, Sweden
Sendy Phang
University of Nottingham, United Kingdom

INDONESIAN SCHOLARS JOURNAL – VOL. 2, SEPTEMBER 2014
46
Shale Gas As An Alternative Energy in The Fulfilment of Gas Energy Requirement for
Indonesian State Electricity Company (PLN) Dr. Ing. Ir. H. KRT. Nur Suhascaryo, B.Eng., M.Eng & Hongki Budi Prasetyo*
Study Programme of Department of Petroleum Engineering Universitas Pembangunan Nasional “Veteran” Yogyakarta *[email protected]
Abstract. The consumption of gas energy which is increasing especially in the fulfillment of power plant requirement, and not offset by the supply of gas energy, causes the deficit of energy—especially gas energy—in Indonesia. Therefore, the findings of new sources which produce gas energy through geological and geophysical exploration are needed to settle the problem. The type of this research is qualitative descriptive study using data collection method in the form of literature study and objective analysis of the data. Data analysis method used is a combination of trend analysis and descriptive analysis. Based on the analysis result, the requirement of gas for PLN’s power plant reached 1.8 BSCFD (Billion Standard Cubic-Feet per Day) but only about 1 BSCFD is met. In 2015, the requirement of PLN’s power plant is expected to increase to 2.1 BSCFD and be totalized with the private power plant requirement. However, the supply of gas is only expected to reach 0.8 BSCFD. This means there are still 1.4 BSCFD needed. Indonesia shale gas potential is about 574 trillion standard cubic feet (TSCF). It is greater than Coal Bed Methane (CBM) and gas, which are only about 453.3 TSCF and 334.5 TSCF, respectively. Finally, based on a combination of trend and descriptive analysis, it is proper to develop the potential of shale gas to meet the requirement of national energy, especially sources of gas energy for power plant in Indonesia.
Keywords: Alternative Energy, PLN, Shale Gas.
NOMENCLATURE
PLN : Indonesian State Electricity Company
A. INTRODUCTION The depletion of oil reserves and the threat of a surge of energy subsidies have supported Indonesia’s switch to natural gas, given the availability of much larger reserves than oil. More optimal utilization of gas, as well as the commitment and seriousness of the government in its management are needed. Until now the use of natural gas is not optimal, so that many activities across various sectors (e.g., electricity, industrial, household), still relies on the use of petroleum energy such as coal. Natural gas has been used to replace and meet the energy needs of the natural gas in Indonesia but has not been able to meet the needs of domestic gas because demand growth is not accompanied by an increase in the production infrastructure capacity, transmission and distribution of gas. Up to this time, domestic gas consumption for electricity generation is dominated PT. PLN and gas industries but these have not met the energy needs for the power plant. It is necessary to search new fields through exploration and exploitation to increase gas production. Onshore Indonesia represents a hyper-mature gas development play. Most conventional reservoirs have already been exploited. With the current high price for gas, more effort is being applied to the development of non-conventional gas plays: tight gas, coalbed methane, and shale gas.
Figure 1. Indonesia shale gas potential
Some of the earliest gas wells were produced from shales; however, their low flow rates limited development interest. Recently, gas shales have become a more attractive target because they represent a huge resource (500 to 780 TCF1) and the economic challenges for their development have lessened with rising gas prices and new evaluation and completion technologies.
There are currently 7 basins in Indonesia that contain shale gas and 1 klasafet shaped formation2. 3 basins are located in Sumatra: Baong Shale, Telisa Shale and Gumai Shale. In the

INDONESIAN SCHOLARS JOURNAL – VOL. 2, SEPTEMBER 2014
47
island of Java and Kalimantan, there are 2 basins each. In Papua, only klasafet shaped formation exists. Figure 13 shows the potential of shale gas in Indonesia. Each of these formations, if explored and exploited, will result in new gas field and eventually large enough gas energy production. Gas production from shale gas is large enough and expected to meet the energy needs for the fulfillment of particular gas power plant in Indonesia.
B. APPROACH
Shale Gas Characteristics However, shale is the most common sedimentary rock.
Shale with the potential to be an economic gas reservoiris relatively rare. Due to their low permeability, gas shales are self-sourced. They must have the requisite volume and type of organic matter and proper thermal history to generate hydrocarbons, especially gas. The first step in any evaluation is the identification of a potential gas shale reservoir4. Shale is a fine-grained, clastic sedimentary rock composed of mud that is a mix of clay minerals and tiny fragments (silt-sized particles) of other minerals, especially quartz, dolomite, and calcite5. Shale is characterized by breaks along thin laminations, parallel to the bedding. Mudstones are similar in composition but do not usually show layering within the zone.
From a petrophysical analysis point of view, clay-rich shales have traditionally been called “shales” and non-clay shales have been called “silts” . Petrophysical analysis deals with minerals, not particle size, so it is confusing to us when a zone is called shale when the logs show little presence of clay. Figure 25 shows the composition and their petrophysical characteristics of shale.
Shale-gas formations are both the source rocks and the reservoir rocks. There is no need for migration and since the permeability is near zero, it forms its own seal The gas may be trapped as free gas in natural fractures and intergranular porosity, as gas is sorbed onto kerogen and clay-particle surfaces, or as gas is dissolved in kerogen and bitumen6. The shale gas reservoirs are characterized by low production rates (20-500 MCFPD) but are usually spread over large areas and are up to 450 m thick.
Figure 2. Core photo of gas shale - about 50% clay, 50% quartz plus calcite, 10 - 15% total porosity, 3 - 6% effective porosity, < 0.001 mD permeability)
They are organically rich with total organic carbon content (TOC) varying from 1 to 20 wt%, such that the reservoirs contain large gas reserves (2 to 20 BCF/km2). Shale gas reservoirs rely on natural fractures for porosity and permeability as the matrix porosity or permeability is low. In the absence of natural fractures, these reservoirs need stimulation by way of hydraulic fracturing. Compared to conventional reservoirs, shale gas reservoirs have low recovery factors (~20%). For the wells drilled into these reservoirs, the initial decline rates are rapid (~70%) but bottom out gradually (~6%) in later years7.
Shale Gas Potential in Indonesia The study of shale gas potential of the region has been
carried out, and some of them have been found to be potentially attractive for considerable energy. Shale gas potential in Indonesia is predicted at 338 TCF in North Sumatra, 558 TCF in Central Sumatra, 964 TCF in South Sumatra, 1,723 TCF in East Kalimantan and 6,480 TCF8 in West Papua.
In Sumatra there are 3 potential basins as area of shale gas, which are Baong shale, Telisa shale and Gumai shale. Figure 39 shows the location of shale gas in Sumatra basin. Figure 410 shows the stratigraphy of North Sumatra basin. Formation of blue zone indicates areas that have the potential formation as shale gas areas Based on the research that has been done, there are several formations as a potential shale gas areas in North Sumatra basin, namely Belumai formation, Baong formations and Bampo formation. Belumai formation has an average level of Total Organic Carbon (TOC) of 0.94 and an average T.max at 429 0C. Baong formation has an average level of Total Organic Carbon (TOC) of 0.90 and an average T.max at 433 0C. Bampo formation has an average level of Total Organic Carbon (TOC) of 0.59 and an average T.max at 439 0C. Figure 59 shows the NW-SE seismic section of North Sumatra area. From the figure, the direction and sequence of formations in North Sumatra basin can be observed. The sequence of formation of old to young is Parapat – Bampo – Belumai – Baong – Keutapang formation. Bampo Formation indicates fair shale gas quality, whereas Belumai and Baong Formations show fair-good shale gas quality. Shale gas resource calculation of these formations is 114.35 TCF9.
Shale gas potential is also found in South Kalimantan precisely located in the Barito basin. Figure 611 shows the location of shale gas potential in the Barito basin. Potential of shale gas in this basin is in Tanjung formation. Sandstones of the Tanjung Formation are quartz arenites and sub-litharenites13 and plot within the ‘craton interior’ and ‘quartzose recycled’ fields14. Figure 714 shows detrital modes of sandstones from the Tanjung, Montalat and Warukin formations. Figure 812 shows stratigraphy of Barito basin South Kalimantan. Tanjung formation has an average level of Total Organic Carbon (TOC) of 0.53 and an average T.max at 450 0C. Figure 99 shows the NW-SE seismic section of South Kalimantan area.

INDONESIAN SCHOLARS JOURNAL – VOL. 2, SEPTEMBER 2014
48
Figure 3. The location of shale gas in Sumatra basin
Figure 4. Stratigraphy of North Sumatra basin
Figure 5. NW-SE seismic section of North Sumatra area
Figure 6. Location of shale gas potential in the Barito basin
Figure 7. Ternary diagrams showing detrital modes of sandstones from the Tanjung, Montalat and Warukin Formations. (Left) sandstone classification
according to Folk (1968). (Right) tectonic setting according to QmFLt ternary plot of Dickinson & Suczek (1979). Q: quartz, Qm: monocrystalline quartz, F:
feldspar, L: lithics, Lt: total lithics (including polycrystalline quartz).

INDONESIAN SCHOLARS JOURNAL – VOL. 2, SEPTEMBER 2014
49
Figure 8. Stratigraphy of Barito basin in South Kalimantan
Figure 9. NW-SE seismic section of South Kalimantan area
Graph 1. The projections of production, consumption and export of Indonesian gas
Indonesian Gas Production and Consumption Domestic gas consumption continues to increase every
year, especially in the industry sector. This is because the price of gas fuel is very competitive, relatively stable, and more environmentally friendly.
In terms of natural gas production, Indonesia had growth problems in the period 2000-2009, due to Indonesia's natural gas production of only about 2,805,540 MMSCF to 3,155,243 MMSCF15. Highest production was achieved in 2003. Based on the 2010 data, natural gas proven reserves reached 104.71 TSCF and potential reserves reached 48.74 TSCF16. Graph 115 shows the projections of production, consumption and export of Indonesian gas.
Looking at current trends, gas production growth will still occur even if the factors are not directly related (error terms) have a strong influence. Government intervention is needed, through regulation to eliminate the negative influence on the error terms of Indonesia's natural gas production, including shale gas.
Gas Consumption Indonesian by State Electricity Company
In the last 5 years, the total gas consumption continues to rise. Graph 216 shows fuel consumption for electricity generation. In 2005, gas consumption reached 3,541 MMSCFD, a year later increased to 3,716.1 MMSCFD and 2009 was 4,233.7 MMSCFD. Increase in gas consumption, mainly in the sectors of fertilizer, power and other industries17. Based on data and projections from the PLN, the requirement of gas for PLN’s power plant reached 1.8 BSCFD (Billion Standard Cubic-Feet per Day) but only about 1 BSCFD is met15. In 2015, the requirement of PLN’s power plant is expected to increase to 2.1 BSCFD, and be totalized with the private power plant requirement. However, the supply of gas is expected to only reach 0.8 BSCFD. It means there are still 1.4 BSCFD needed. Graph 315 shows domestic gas consumption for power generation sector. Based on the graph, there will be a substantial gas demand that is not matched by the production of gas. This leads to a very large difference in gas that must be met in order to be able to meet the needs of the power plant.

INDONESIAN SCHOLARS JOURNAL – VOL. 2, SEPTEMBER 2014
50
Graph 2. Fuel consumption for electricity generation
Graph 3. Domestic gas consumption for power generation sector
C. DISCUSSION Shale gas has begun to be developed in some countries
and the results are contributing in fulfilling energy gas. Graph 43 shows the development shale gas compared to conventional gas. Indonesia has a very large the potential of shale gas. Indonesia shale gas potential is about 574 trillion standard cubic feet (TSCF). It is larger than Coal Bed Methane (CBM) which is only about 453.3 TSCF and gas which is 334.5 TSCF2. Currently, Indonesia gas production is still not sufficient to meet the energy needs, especially in electricity sector. The shale gas potential is supposed to be developed to meet national energy needs, especially in the electrical energy needs, as PT. PLN still requires a considerable supply of gas. Increasingly large gas that is not offset by the gas supply leads to a very large supply-demand gap. For 2015, the estimated gas demand for electricity generation is increased to 2.1 BSCF, and private power plants by 0.1 BSCF. With the shale gas potential of 574 TSCF, it is very prospective to meet the needs of the power plant.
Graph 216 shows that the gas consumption for power generation every year will always increase. This increase must be balanced with the production and supply of gas to PT. PLN. One alternative that can be taken is to utilize the existing potential of shale gas. Graph 43 shows that the use of shale gas can provide a substantial contribution to gas production. Based on the trend, gas production from shale gas will always go up every year. This increased gas production should be be sufficient for the gas to PT. PLN.
Graph 4. Development shale gas compare to conventional gas
D. CONCLUSION
From this study, the following conclusions have been made: x Shale gas potential in Indonesia is realized in North
Sumatra at 338 TCF, Central Sumatra at 558 TCF, South Sumatra at 964 TCF, East Kalimantan at 1,723 TCF and West Papua at 6,480 TCF.
x The requirement of gas for PLN’s power plant reached 1.8 BSCFD (Billion Standard Cubic-Feet per Day) but only about 1 BSCFD is met.
x Gas production from shale gas will always go up every year. Increased gas production should be sufficient for the gas to PT. PLN.
ACKNOWLEDGEMENT Author would like to thank:
x Petroleum engineering students of UPN Veteran Yogyakarta which has provided a lot of information and references
x The parties who giving the spirit and motivation as well as facilities and infrastructure in this working paper to be resolved.
REFERENCES [1] Hill, D.G. and Nelson, C.R.: “Gas Productive Fractured Shales: An
Overview and Update,” GasTIPS (Summer 2000). [2] Ministry of Energy and Mineral Resources Republic Indonesia. (2011,
November, 30). Potential Shale Gas Indonesia Reaches 574 TSCF. Available: http://www.esdm.go.id/berita/migas/40-migas/5214-potensi-shale-gas-indonesia-capai-574-tscf.html
[3] Bambang Winarko and Lufina Mahadewi,“Shale Gas Energy Alternative towards a Rapid Growth of Coal Energy Demand,” Proceedings of the Breakfast Dialog ), pp. 26, Jakarta, Indonesia, April 3, 2013.
[4] Rick Lewis, David Ingraham, Marc Pearcy, Jeron Williamson, Walt Sawyer and Joe Frantz,“New Evaluation Techniques for Gas Shale Reservoirs,” Proceedings of Reservoir Symphosium 2004 ), p. 26, New Orleans, LA, June 16-19, 2004.
[5] E. R. (Ross) Crain (2013, July, 28). Shale Gas Basics. Available http://spec2000.net/17-specshgas.htm

INDONESIAN SCHOLARS JOURNAL – VOL. 2, SEPTEMBER 2014
51
[6] John B. Curtis, “Fractured shale-gas systems,” AAPG Buletin, vol. 86, no. 11, pp. 1921–1938, Nov. 2002.
[7] EIA document. 2011. Review of emerging resources: US shale gas and shale oil plays. Available: ftp://ftp.eia.doe.gov/natgas/usshaleplays.pdf.
[8] Migas Review document. 2013. Shale Gas, Indonesian Energy Future. Available: http://migasreview.com/shale-gas-masa-depan-energi-indonesia.html.
[9] Reserch and Development Centre for Oil and Gas Technology “LEMIGAS”, “Pilot Projects of Unconventional Gas (Accepted for publication),”Ministry of Energy and Mineral Resources Republic., to be published.
[10] Kjellgren, G.M. & H. Sugiharto (1989). Oil geochemistry: a clue to the hydrocarbon history and prospectivity of the southeastern North Sumatra Basin, Indonesia. Proc. 18th Ann. Conv. Indon. Petrol. Assoc., p. 363-384.
[11] Supriatna, S., Djamal, B., Heryanto, R. and Sanyoto, P., Geological map of Indonesia, Banjarmasin Sheet, Bandung: Geological Research Centre Bandung, 1994
[12] L.F. Rotinsulu, S. Sardjono, and N. Heriyanto“Shale Gas Energy Alternative towards a Rapid Growth of Coal Energy Demand,” Proceedings Indonesian Petroleum Association 22nd Annual Convention), pp. 1-27.
[13] Robert L. Folk, Petrology of Sedimentary Rock, Hemphill's: Austin, Texas, 1968, p. 108
[14] William R. Dickinson and C.A. Suczek, “Plate tectonics and sandstone compositions,” AAPG Buletin, vol. 63, no. 11, pp. 2164-2182, Dec. 1979
[15] BUMN Research Bureau of Center LM FEUI document. 2012. National Gas Analysis.Available:http://www.lmfeui.com/data/13%20agt%202012%20Industri%20Energi%20Nasional-Web%20LM%20FEUI.pdf
[16] Agency for The Assessment and Application of Technology. 2012. Indonesia Energy Outlook 2012 : Future Energy Development for Supporting Economic Growth and National Energy Security. Available: www.bpt.go.id
[17] Ministry of Energy and Mineral Resources Republic Indonesia. (2013, January, 29). Domestic Gas Consumption Reaches 50.3 Percent of National Production. Available: http://www.esdm.go.id/berita/migas/40-migas/3854-konsumsi-gas-domestik-capai-503-persen-produksi-nasional.html.
.

Associate Editors
Junaedy Yunus
Kobe University, Japan
Etin Dyah Permanasari Osaka University, Japan
Sarrah Ayuandari
Innsbruck University, Austria
Almando Geraldi KAIST, South Korea

INDONESIAN SCHOLARS JOURNAL – VOL. 2, SEPTEMBER 2014
53
Usage of Tuba (Derris eliptica) Root Extract as Environmentally-friendly Insecticide to Control
the Population of Lymantria beatrix Eko Budiyanto, Arvana Rifki Aditya, Ardi Yuli Wardani*, and C. Budimarwanti
Department of Chemistry Education, Yogyakarta State University [email protected]
Abstract. Tuba (Derris eliptica) root contains rotenone compound which classified as moderately hazardous class II pesticide. This experimental research aimed to determine the effectivity of tuba (Derris elliptica) root extract to control the population of caterpillar (Lymantria Beatrix) pests and verify the optimum concentration of tuba root extract in insecticide formulation to control Lymantria Beatrix caterpillar population. The method used in this research included three steps, which were making of insecticide from tuba root extract, rearing of Lymantria beatrix catterpillars, and laboratory testing. Tuba root extract prepared by extraction process with 95% ethanol solvent, pure extract then diluted with water for each concentration variable. Drying time test for synthetic pesticide, tuba root extract 100%, 75%, 50% and 25% gave result 60, 25, 29, 40, and 120 minutes respectively. Spraying test toward leaves showed that increasing of rotenone extract content increased the damage toward leaves surface. Lymantria Beatrix treatment with insecticide from tuba root extract 25%, 50%, 75%, and 100% gave efficacy of insecticide (EI) value 67%, 80%, 73%, and 73% respectively. Therefore it could be concluded that optimum concentration of tuba root extract to control population of Lymantria beatrix caterpillar was in 50% extract with EI (efficacy of insecticide) 80% and gave LC50 value 116,86 ppm.
Keywords: extract, Lymantria beatrix, tuba, rotenone
A. INTRODUCTION Caterpillar is a kind pest that often attacks fruit plants. This pest eats leaves as it is nutrition source. In some occasion, caterpillars population increases quickly. In 2011, caterpillars attacked thousands of mango plants, specified on ‘manalagi’ mango variety in Probolinggo, East Java. These caterpillars then identified as Lymantria beatrix species. This kind of species is not classified as butterfly larvae but moth larvae. This caterpillars attack caused damage on 14.779 mango plants, caused irritation in people’s skin, and some schools stopped their activity [1]. Lymantria beatrix caterpillars were not only attacked Probolinggo, but also Pasuruan, Malang, Jombang, and Bojonegoro. Government tried to solve the problem by sprayed synthetic pesticide, but Lymantria beatrix population still increased since this pest has been immuned from synthetic pesticide. The use of synthetic pesticide also harms the environment. WHO has recorded that every year there are 44,000-2,000,000 poisoned people cases all over the world, most of cases take place in developing countries [2]. Continuous use of syntetic pesticide leads to immunity of pests toward pesticide itself, increasing of cost due to expensive price of synthetic pesticide, and spread poison to environment. Therefore, it is necessary to conduct a research towards some plants that have potential to be used as botanical insecticide.
Tuba (Derris eliptica) root contains rotenone which traditionally used as poison for fish. Rotenone (C23H22O6) is a derivate of Pyranofurochromon, basic structure that derived from isoflavone [3]. Rotenone structure shown in Figure 1.
Figure 1. Rotenone (C23H22O6) structure.
The most popular member in rotenone group is rotenoids. Rotenone found in Fabaceaea family, such as Derris elliptica, Pachyrrhizus erosus, and Tephrosia sp. Rotenone has toxic effect for insects and fishes, but less toxic for mammals. The toxicity of rotenone is because of it’s efficacy in interrupting mitochondrial electron transport which hinders the utilization of oxygen in respiratory organisms, leading to cell death and eventually to the death of the organism if the dose is high enough. The mechanism of interrupting electron transfer is similar to other well-studied respiratory inhibitors. Because the respiratory mechanism of fish is directly linked to water through the gills, rotenone may pass directly into the bloodstream of fish, leading to death. Rotenone is much less toxic to mammals and birds because the route of ingestion is through the gut where much of the compound is broken down to less toxic components before toxic quantities can enter the

INDONESIAN SCHOLARS JOURNAL – VOL. 2, SEPTEMBER 2014
54
bloodstream [4]. World Health Organization classified rotenone as moderately hazardous class II pesticide. There are some reports indicating that an exposure to rotenone may cause toxicity to mammals. However, rotenone usually used in small quantities and it is rapidly broken down in water or soil. Almost all toxicity may be lost after 2-3 days of summer exposure [5]. So that this compound can be used as environmentally-friendly insecticide. The aims of this research were determined the effectivity tuba (Derris elliptica) root extract to control the population of caterpillar (Lymantria beatrix) pests and verified the optimum concentration of tuba root extract insecticide to control Lymantria beatrix caterpillar population.
B. METHOD The subject of this research was insecticide from tuba root extract and object of this research was effectivity of tuba root extract insecticide to control the population of Lymantia beatrix caterpillars. Independent variable for this research was concentration of tuba root extract which were 25%, 50%, 75%, and 100%, with negative control was 0% concentration of tuba root extract and positive control was clorpirivos (commercial synthetic insecticide). Dependent variable in this research was the mortality number of Lymantria beatrix caterpillars after treated by tuba root extract insecticide. Temperature, humidity, number of caterpillars, and nutrition source used as controlled variable. Research process divided into three major steps, which were: making of insecticide from tuba root extract, rearing of Lymantria beatrix catterpillars, and laboratory testing. Rotenone could be extracted from tuba root with ethanol 95% solvent because it was soluble in ethanol with solubility 5 mg/mL [6].Tuba root extract prepared by maceration process with ethanol 95% solvent. Dried small size tuba root was immersed in ethanol for 24 hours. After 24 hours of immersion, Solution was filterred and evaporated with evaporator Bucchi (temperature 82 oC) till ethanol solvent completely separated from concentrated extract. Concentrated extract then mixed with distilled water and ethanol with compotition as shown in Table 1.
Next step was rearing Lymantia beatrix caterpillars sample that was taken from Probolinggo. Rearing process aimed to breed the larvae for laboratory test purpose. Rearing process was done in a special cage and feeding the sample with ‘manalagi’ mango leaves. Rearing process followed the circle until instar III larvae with necessary amount for reserach purpose (90 larvaes).
Table 1. Formulation of insecticide.
Composition Extract 0%
Extract 25%
Extract 50%
Extract 75%
Extract 100%
Concentrated tuba root extract
0 mL 25 mL 50 mL 75 mL 100 mL
Distilled water 99 mL 74 mL 49 mL 24 mL 0 mL
Ethanol 95% 1 mL 1 mL 1 mL 1 mL 0 mL
Third step was laboratory testing, it was consisted of two tests, which were sprayed testing toward leaves and mortality testing of Lymantria beatrix caterpillars. For the first test, each formulation of tuba root extract insecticide and clorpirivos sprayed over mango leaves. Drying time for insecticide on leaves recorded and the damaged on each leave observed for 1 week. For mortality test of Lymantria beatrix caterpillars, 3 cages prepared for each formulation. Each cage filled up with 5 larvaes instar III. Nutrition source (‘manalagi’ mango leave) immersed in formulation for 1 minute, wiped and put in each cage. Lymantria beatrix caterpillars would eat these leaves and took the toxic into its belly. The effect of insecticide observed by the number of mortality of Lymantria beatrix caterpillars for every hour. Data analysis for mortality amount of Lymantria beatrix caterpillars used probit analysis to determine the value of LC50 and LT50 for treatment with tuba root extract insecticide. Research data would be processed and presented in table and graph. Efficiency of each formulation was determined by efficacy value [6]. Calculation of efficacy value (EI) as follow.
%100xTa
TaCaEI � (1)
EI = efficacy of insecticide tested (%) Ta = population or intensity of attack on control plot after insecticide application Ca = population or intensity of attack on treatment plot after insecticide application
C. DISCUSSION Corrosiveness and drying time properties of tuba root
insecticide could be verified by observed the damage that created by tuba root insecticide and drying time of insecticide on leaf surface. To verify these properties, tuba root insecticide, negative control and positive control sprayed over the mango leaves. Tuba root insecticide mist that laid on the mango leaves were observed. The level of the damage was determined by the area that looked burned on observation. Leaf that didn’t sufer any damage classified with - mark, damage only on the tip of the leaf was classified with + mark, damage on edge and tip of the leaf was classified with ++ mark, and damage on all area of leaf was classified with +++ mark. Drying time was recorded to determine the time needed to evaporate distilled water and left residue of rotenone on mango leaves. Mango leave damage due to insecticide was observed for one week. Observation data for insecticide sprayed toward mango leaves shown in Table 2.

INDONESIAN SCHOLARS JOURNAL – VOL. 2, SEPTEMBER 2014
55
Table 2. Observation data.
Parameter Positive control
(clorpiri-vos)
Negative control (Extract
0%)
Extract 25%
Extract 50%
Extract 75%
Extract 100%
Drying time (minutes)
60 240 120 40 29 26
Leaves damage (day 6)
+++ - + + ++ ++
Observation data showed that the increasing of water
content in formulation made the insecticide dried in longer time and synthetic insecticide (clorpirivos) made the worst damage toward mango leaves. Clorpirivos and rotenone were slightly corrosive material, so that they can damage the leaves. More damage on leaves gave the proof that the material existed on leaves surface in longer time. The damage toward leaves proved that synthetic insecticide take longer time to be degraded than rotenone. Observation result also shown that increasing concentration of rotenone made the degradation time longer, although further research is needed to verify the exact time for each formulation of insecticide to be degraded in nature. After observe the physical properties of tuba root insecticide, next step is preparation for laboratory testing. For laboratory testing, sample of Lymantria beatrix caterpillar was needed. This caterpillar sample was taken from Probolinggo, East Java. Lymantria beatrix followed rearing process in order to breed and multiplied the number of Lymantria beatrix. Rearing process also had purpose to get caterpillars in certain phase. This research used instar III caterpillars because it was the most active phase of larvae that attacked ‘manalagi’ mango plants and ate its leaves. Rearing process took place in a special cage, during rearing process Lymantria beatrix was given ‘manalagi’ mango leaves as its nutrition sources. Lymantria beatrix has methamorphosis process as shown in figure 3. This larvae then divided into 18 cages for treatment process and each cage filled up with 5 caterpillars. Cages 1-3 for positive control, cages 4-6 for negative control, cages 7-9 for extract 25%, cages 10-12 for extract 50%, cages 13-15 for extract 75%, and cages 16-18 for extract 100%. Manalagi mango immersed in each formulation for 1 minutes and putted in each cage. Each cage observed for every hour. Research data shown in Table 3.
Synthetic insecticide could kill all off caterpillars in 5 hours, it was faster than insecticide from tuba root extract which able to kill all caterpillars in 7 till 8 hours. This result showed that clorpirivos was more toxic than rotenone from tuba root extract. Rate of mortality of caterpillars shown as graph in Figure 4.
Table 3. Number of Lymantria beatrix caterpillars that still live in every hour.
Hour
Positive control
(clorpiri-vos)
Negative control (Extract
0%)
Extract 25%
Extract 50%
Extract 75%
Extract 100%
0 5 ± 0 5 ± 0 5 ± 0 5 ± 0 5±0 5±0
1 4,7± 0,47 5 ± 0 5 ± 0 5 ± 0 5±0 4,7±0,47
2 2,7± 1,25 5 ± 0 4,7±0,47 4,7±0,47 3,7±0,94 4±0
3 1± 0,82 5 ± 0 4±0,82 4±1,41 2,3±0,47 2,7±0,94
4 0,3±0,07 5 ± 0 3,7±0,47 3,3±0,94 2,3±0,47 1,7±0,47
5 0 5 ± 0 1,7±0,47 1±0 1,3±0,47 1,3±0,47
6 0 5 ± 0 0,3±0,07 0,3±0,07 0,7±0,07 0,7±0,07
7 0 5 ± 0 0 0 0 0,7±0,07
8 0 5 ± 0 0 0 0 0
Figure 2. Mortality percentage graph of Lymantria beatrix after treatment with
each formulation
That graph showed that mortality rate by clorpirivos escalated after 1 hour and mortality rate by insecticide from tuba root escalated after 2 hour. This one proved that clorpirivos was more toxic and has faster reaction rate in Lymantria beatrix caterpillar’s belly than insecticide from tuba root extract. This data then analyzed by probit method analysis to determine LC50 value of each hour and LT50 of each formulation [8]. LC50 value of tuba root extract insecticide for each hour shown in Table 4,
Table 4. LC50 value for each hour.
1 hour
2 hours
3 hours
4 hours
5 hours 6 hours 7 hours
LC50 value (ppm)
350 185 126 116 1897 4,5x10⁸ 1,7x10⁹
0
10
20
30
40
50
60
70
80
90
100
0 1 2 3 4 5 6 7 8
positive control
negative control
extract 25%
extract 50%
extract 75%
extract 100%
% m
orta
lity
of L
yman
tria
bea
trix
cate
rpill
ar
time (hours)

INDONESIAN SCHOLARS JOURNAL – VOL. 2, SEPTEMBER 2014
56
LC50 value showed the concentration of substance that could kill a half of population in a plot. Insecticide from tuba root extract has optimum LC50 in 4 hours. LT50 value showed the time needed to kill a half population of pests in a plot [9]. Insecticide with extract 25%, 50%, 75%, and 100% have LT50 value 5 hours, 5 hours, 4 hours, and 4 hours respectively. To verify optimum concentration of tuba root extract in insecticide formulation, efficacy of insecticide (EI) counted. Greater value of EI represented that the insecticide was more effective in killing pests. From the experiment data, EI value for extract 25%, extract 50%, extract 75%, and extract 100% were 67%, 80%, 73%, and 73% respectively. Tuba root extract insecticide with rotenone extract 50% had optimum concentration in controlling Lymantria beatrix caterpillar population. EI value was influenced by water (solvent) content of each formulation. Greater water content (than optimum concentration) made a lower concentration of tuba root extract insecticide, therefore it could decrease the EI value. In the other hand, lower water content (than optimum concentration) made a more concentrated solution of tuba root extract insecticide, and because of the volatility of rotenone, it made the formulation evaporated faster and had bigger possibility that rotenone has been evaporated before made contact with caterpillars. Therefore it also decreased EI value. Drying time testing proved that formulation of extract 75% and 100% had faster drying time than formulation of extract 50%, which were 29 and 26 minutes compared with 40 minutes.
D. CONCLUSION Tuba root extract insecticide can be made by extraction process then mixed the concentrated extract with distilled water and ethanol 95%. Tuba root extract with 50% extract formulation has optimum concentration in controlling Lymantria beatrix caterpillar population.
ACKNOWLEDGEMENT This project financially supported by Student Union Grant of Yogyakarta State University. The authors would like to acknowledge the great help received from Mr. Albert and Suputa, M.P from Pest and Plant’s Disease Laboratory Gadjah Mada University.
REFERENCES [1] _____. (2011, April 15). Ganti Kerugian Petani akibat Ulat Bulu.
[Online]. Available: http://www.mediaindonesia.com [2] ______. (2009, May 16). Bahaya Pestisida Sintesis. [Online]. Available:
http://www.tanimaju.webs.com/ [3] Jayadipraja, E. A., H. Ishak & A.A Arsin,”Affectivity Test of Derris
elliptica Root Extract to the larvae Anopheles sp. Mortality,” Hasanuddin University, Indonesia, 2013
[4] Kevin. C Ott. Rotenone. A Brief Review of its Chemistry, Environmental Fate, and the Toxicity of Rotenone Formulations [Online]. Available: http://www.newmexicotu.org/
[5] Yoon, A. S., “Extraction of Rotenone from Derris elliptica and Derris Malaccensis by Pressurized Liquid Extraction Compared with Maceration,”Journal of Cromatography A. vol. 1125, no. 2, pp 172-176, Sept. 2006.
[6] Guenther, Herb. (2011, December 31). Rotenone Review Advisory Committee Final Report And Recommendations To The Arizona Game And Fish Department. [Online]. Available: http://www.azgfd.gov/
[7] Mardiningsih, T. L., Sukmana, N. Tarigan & S. Suriati,” The Effectiveness of Botanical Insecticides of Azadirachtin and Saponin Active Ingredients To Mortality of Aphis gossypii Glover and Intensity of Attack,” Bul. Littro, vol. 21, no. 2, pp. 171 – 183, Jan. 2010.
[8] Rabczenko, Daniel., A. Gliniewicz, B. Kluge, S. Piekarski,”An Universal Tool for tht Analysis of Effectiveness of Insecticides,” Pestycidy/Pesticides, vol. 1, no. 4, pp. 57-62 , Mar. 2010
[9] Gundogdu, Ayse,”Acute Toxicity of Zinc and Copper for rainbow Trout (Onchorhyncus mykiss),”Journal of Fisheries Science, vol. 2, no. 5, pp. 711-721, May 2008.

INDONESIAN SCHOLARS JOURNAL – VOL. 2, SEPTEMBER 2014
57
PHP14-siRNA in αGPC3-PEGylated Chitosan Nanoparticles: Providing a New Therapeutic
Approach for Hepatocellular Carcinoma 1Dwijo Anargha Sindhughosa*, 1Stephanie Patricia, 1Liveina and 2Ida Bagus Tjakra Wibawa Manuaba
1Faculty of Medicine, Udayana University, Denpasar, Bali, Indonesia 2Departement of General Surgery, Faculty of Medicine, Udayana University, Denpasar, Bali, Indonesia
Abstract. Hepatocellular carcinoma (HCC) is one of the leading causes of death worldwide. Current treatment has shown rapid development with good result in some cases, although there are still many limitations. It can be seen from the high recurrence rate, complications and side effects, as well as the effectiveness of existing therapies. 14-kDa Phosphohistidine Phosphatase (PHP14) is the first histidine phosphatase protein found in vertebrae which expression increase significantly in HCC patients. Knockdown of PHP14 using small interfering RNA (siRNA) able to inhibit proliferation and increase apoptosis of cancer cell through several mechanisms. Inhibition of proliferation occur through cell cycle arrest, while decrease in Bcl-2 and increase in Bax responsible to increase of cancer cell apoptosis. PHP14-siRNA is incorporated into PEGylated chitosan nanoparticles in order to increase its efficacy. In addition, chitosan nanoparticles has a role in inhibiting tumor growth through antiangiogenesis mechanism that involves down regulation of VEGFR2. The nanoparticles are conjugated with αGPC3, GPC3 monoclonal antibody to specifically target cancer cells. Thus, it will result in tumor regression and may be considered as useful therapeutic approach for the treatment of HCC. This literature review is aimed to provide a complete mechanism of PHP14-siRNA in αGPC3-PEGylated chitosan nanoparticles as novel strategy in treating HCC expectantly in the future this strategy can be performed to improve the health status in HCC patients.
Keywords: PHP14; hepatocellular carcinoma; siRNA; nanoparticles; Bax; Bcl-2.
A. INTRODUCTION Hepatocellular carcinoma (HCC), currently ranked as the fifth most common malignancy worldwide, is a primary liver malignancy that most commonly found as many as 75 % of cases [1,2]. Various therapeutic modalities such as surgical resection, transplantation, and percutaneous ablation have been used to treat HCC and give a good result in several cases. However, these have some limititations such as high cost intervention, complications, and high recurrence rate [3-5]. Therefore, a new strategy is needed to treat HCC effectively. 14-kDa phosphohistidine phosphatase (PHP14), also known as PHPT1, is the first histidine phosphatase protein found in vertebrae that is able to dephosphorylate ATP-citrate lyase and β-subunits of G proteins in vitro and also has a role in the migration and invasion of lung cancer cells [6,7]. Research by Han et al [8] shows that there was a significant increase in the expression of PHP14 in the majority of HCC patient samples and knockdown of PHP14 using small interfering RNA (siRNA) can inhibit cancer cell proliferation and increase apoptosis of HCC cells significantly. However, direct distribution of siRNA into the body has some limitations such as off target effects, immune stimulation, non-specific distribution, and hampered penetration [9,10]. Nanoparticle is a colloidal particle in 10-1000 nm sized. Biodegradable polymer nanoparticles such as chitosan layered by hydrophilic polymer polyethylene glycol (PEG) are used to distribute chemical drug, carrying DNA, proteins, peptides,
and genes [11]. In addition, chitosan nanoparticle has a role in inhibiting tumor growth through antiangiogenesis mechanisms [12]. Surface modification using polyethylene glycol (PEG) can avoid its clearance by macrophages, thus prolonging circulation time in the body [13]. It also can conjugated with monoclonal antibodies, such as GPC3 monoclonal antibodies (αGPC3), enhancing its specific distribution to target cells (HCC cells). Glypican 3 (GPC3) is a heparan sulfat proteoglycans (HSPG) family which can not be found in the normal adult tissue, but it is significantly overexpressed in 80% cases of HCC. Moreover, GPC3 is able to enhance the growth of HCC by stimulating the canonical Wnt signaling pathway, that could potentially be used as therapeutic targets and biomarkers [14,15]. Here, we review and analyze comprehensively about the complete mechanism of PHP14-siRNA in αGPC3-PEGylated chitosan nanoparticles as a new therapeutic approach of HCC.
B. LITERATURE REVIEW
1. Hepatocellular Cellular (HCC) Pathogenesis Pathogenesis of HCC remains poorly understood due to the
high complexity and diversity of genomic aberrations. Etiology of HCC include viral hepatitis, alcoholic hepatitis, fatty liver (NAFLD), and metabolic syndrome. Regeneration of damaged hepatocytes begins with the activation of liver stem cells [16]. HCC cells can arise from mutations in stem

INDONESIAN SCHOLARS JOURNAL – VOL. 2, SEPTEMBER 2014
58
Fig.1. Molecular and immunopathogenesis of hepatocellular carcinoma (HCC)
cells derived from mature hepatocytes or bone marrow cells. Specific features of HCC is increased vascularity in tumor tissue [17,18]. VEGF, PDGF, EGF, FGF, and IGF are several growth factors that facilitate neoangiogenesis, cell proliferation, and tumor invasion [19].
VEGF and FGF are the main signals in neoangiogenesis cascade.[18] VEGF is considered as the most potent angiogenic factor in HCC and often expressed excessively, as well as its receptors (VEGFR-1 and VEGFR-2) [20]. Other proangiogenesis signaling are PDGF and EGF. High expression of EGF mostly associated with differentiation and invasion of cancer cells [17]. EGF activated by TGFA as a major paracrine activators. IGF also plays an important role in cancer tissue growth. [18] In HCC, IGF2 is expressed abundantly.
Through the activation of tyrosine kinase receptors (EGFR, IGFR, VEGFR), RAS intracellular can be activated via the RAF/MEK/ERK pathway. This reaction produces antiapoptotic and proliferation signaling. Activation of the receptor tyrosine kinase also activates PI3K. PI3K produces lipid second messengers which activates the serine/threonine kinase AKT. Activated AKT phosphorylates several cytoplasmic proteins, including mTOR. mTOR activation increases cell proliferation and inactivate BAD leading to decreased function of apoptosis and increased cell survival [21]. This pathway is suppressed by phosphatase and tensin homolog which targets on the dephosphorylation of P13K lipid products [22].
The most common etiology of HCC is HBV infection. Another theory that explain the pathogenesis of HCC is chronic necro-inflammation of liver cells. In respond to liver damage, hepatocytes undergo proliferation and produce AFP. The repeated process leads to accumulation of mutations [23].
Research conducted by Zhang et al offer evidence that CD4+CD25+ regulatory T cells (Tregs) involved in the immunopathogenesis of HBV-related HCC [24]. CD4+CD25+ Tregs suppress the activation and proliferation of CD4+ and CD8+, which possess anti-tumor effects [25]. The level of
CD4+CD25+ Tregs increase in chronic hepatitis B (CHB) patients and correlate with immune response impairment. Research found that the frequencies of Tregs in HCC patients’ circulation is significantly higher compared with healthy controls (4.26 ± 4.18% and 1.67 ± 0.73% in HCC patients and healthy controls, respectively; P < 0.01). The same condition also found in CHB patients (4.39 ± 1.45% and 1.67 ± 0.73% in CHB patients and healthy controls, respectively; P < 0.01). Moreover, flow cytometric analysis that was conducted showed that the frequencies of CD4+CD25+ Tregs in the liver of HCC and CHB patients were significantly higher (CHB patients vs healthy controls, 4.95 ± 1.33% vs 1.43 ± 0.66%; HCC patients vs healthy controls, 5.99 ± 2.09% vs 1.43 ± 0.66%) [24].
HBV infection will induce and expand CD4+CD25+ Tregs. In addition, HBV infection also augment CD4+CD25+ Tregs’ suppressor ability toward anti-tumor immune responses to HCC tumor antigen. Both of these process leads to impairment of CD4+ and CD8+ activation and proliferation. As the result, HCC will develop through the inhibition of specific-immune response toward HBV and HCC tumor antigen (Fig.1) [24].
2. Small Interfering RNA (siRNA) Small interfering RNA (siRNA) derived from long chain dsRNA which would be recognized and cut by dicer enzyme to produce a double-stranded siRNA (ds-siRNA) with a length of 21-23 nt. [26-28] Several researches has supported the use of siRNA as a potential therapy. siRNA that could prevent mRNA translation can be developed as therapy of cancer, respiratory diseases, ocular disease, hepatic failure with chronic hepatitis, severe autoimmune disease, and HIV/AiDS.[27-29] siRNA works on RNAi pathway that acts on translation level. Furthermore, siRNA do not interact with chromosomal DNA and can suppress the abnormal protein production before protein synthesized [28].
3. αGPC3-PEGylated Chitosan Nanoparticles Glypican 3 (GPC 3) is a heparan sulfate proteoglycan which is not expressed in human normal tissue. GPC3 can be
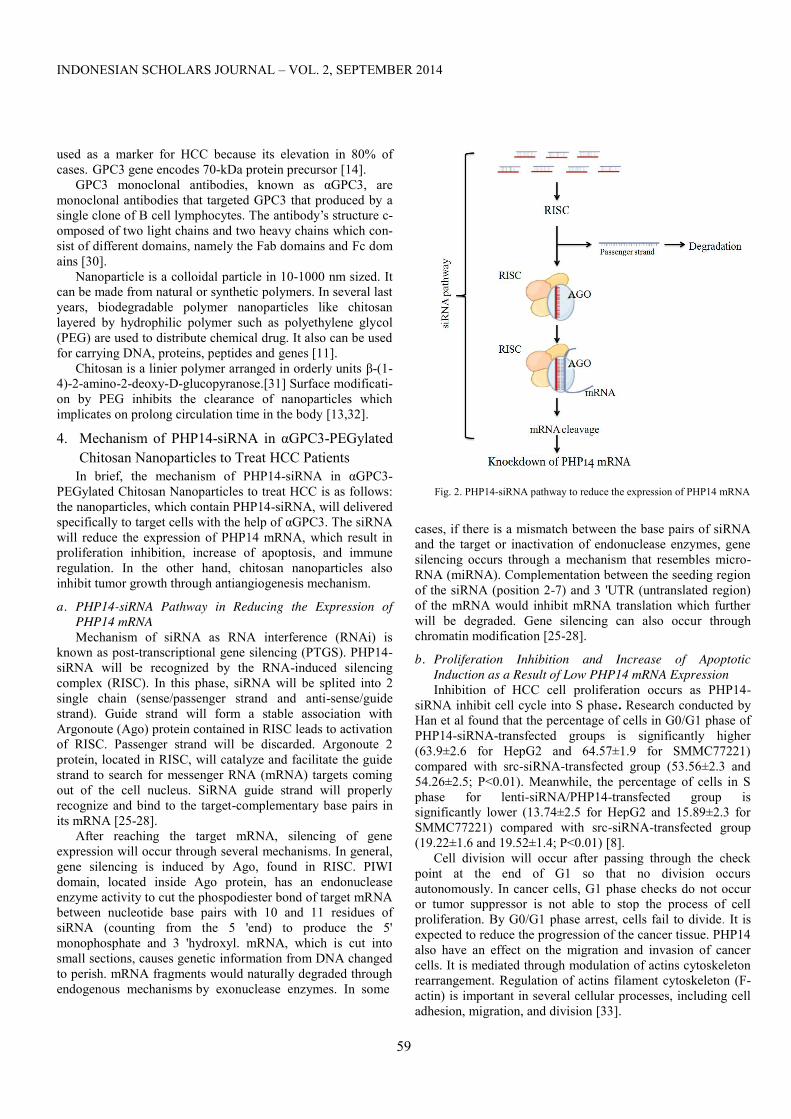
INDONESIAN SCHOLARS JOURNAL – VOL. 2, SEPTEMBER 2014
59
used as a marker for HCC because its elevation in 80% of cases. GPC3 gene encodes 70-kDa protein precursor [14]. GPC3 monoclonal antibodies, known as αGPC3, are monoclonal antibodies that targeted GPC3 that produced by a single clone of B cell lymphocytes. The antibody’s structure c-omposed of two light chains and two heavy chains which con-sist of different domains, namely the Fab domains and Fc domains [30]. Nanoparticle is a colloidal particle in 10-1000 nm sized. It can be made from natural or synthetic polymers. In several last years, biodegradable polymer nanoparticles like chitosan layered by hydrophilic polymer such as polyethylene glycol (PEG) are used to distribute chemical drug. It also can be used for carrying DNA, proteins, peptides and genes [11]. Chitosan is a linier polymer arranged in orderly units β-(1-4)-2-amino-2-deoxy-D-glucopyranose.[31] Surface modificati- on by PEG inhibits the clearance of nanoparticles which implicates on prolong circulation time in the body [13,32].
4. Mechanism of PHP14-siRNA in αGPC3-PEGylated Chitosan Nanoparticles to Treat HCC Patients
In brief, the mechanism of PHP14-siRNA in αGPC3-PEGylated Chitosan Nanoparticles to treat HCC is as follows: the nanoparticles, which contain PHP14-siRNA, will delivered specifically to target cells with the help of αGPC3. The siRNA will reduce the expression of PHP14 mRNA, which result in proliferation inhibition, increase of apoptosis, and immune regulation. In the other hand, chitosan nanoparticles also inhibit tumor growth through antiangiogenesis mechanism.
a. PHP14-siRNA Pathway in Reducing the Expression of PHP14 mRNA Mechanism of siRNA as RNA interference (RNAi) is
known as post-transcriptional gene silencing (PTGS). PHP14-siRNA will be recognized by the RNA-induced silencing complex (RISC). In this phase, siRNA will be splited into 2 single chain (sense/passenger strand and anti-sense/guide strand). Guide strand will form a stable association with Argonoute (Ago) protein contained in RISC leads to activation of RISC. Passenger strand will be discarded. Argonoute 2 protein, located in RISC, will catalyze and facilitate the guide strand to search for messenger RNA (mRNA) targets coming out of the cell nucleus. SiRNA guide strand will properly recognize and bind to the target-complementary base pairs in its mRNA [25-28].
After reaching the target mRNA, silencing of gene expression will occur through several mechanisms. In general, gene silencing is induced by Ago, found in RISC. PIWI domain, located inside Ago protein, has an endonuclease enzyme activity to cut the phospodiester bond of target mRNA between nucleotide base pairs with 10 and 11 residues of siRNA (counting from the 5 'end) to produce the 5' monophosphate and 3 'hydroxyl. mRNA, which is cut into small sections, causes genetic information from DNA changed to perish. mRNA fragments would naturally degraded through endogenous mechanisms by exonuclease enzymes. In some
Fig. 2. PHP14-siRNA pathway to reduce the expression of PHP14 mRNA
cases, if there is a mismatch between the base pairs of siRNA and the target or inactivation of endonuclease enzymes, gene silencing occurs through a mechanism that resembles micro-RNA (miRNA). Complementation between the seeding region of the siRNA (position 2-7) and 3 'UTR (untranslated region) of the mRNA would inhibit mRNA translation which further will be degraded. Gene silencing can also occur through chromatin modification [25-28].
b. Proliferation Inhibition and Increase of Apoptotic Induction as a Result of Low PHP14 mRNA Expression Inhibition of HCC cell proliferation occurs as PHP14-
siRNA inhibit cell cycle into S phase. Research conducted by Han et al found that the percentage of cells in G0/G1 phase of PHP14-siRNA-transfected groups is significantly higher (63.9±2.6 for HepG2 and 64.57±1.9 for SMMC77221) compared with src-siRNA-transfected group (53.56±2.3 and 54.26±2.5; P<0.01). Meanwhile, the percentage of cells in S phase for lenti-siRNA/PHP14-transfected group is significantly lower (13.74±2.5 for HepG2 and 15.89±2.3 for SMMC77221) compared with src-siRNA-transfected group (19.22±1.6 and 19.52±1.4; P<0.01) [8].
Cell division will occur after passing through the check point at the end of G1 so that no division occurs autonomously. In cancer cells, G1 phase checks do not occur or tumor suppressor is not able to stop the process of cell proliferation. By G0/G1 phase arrest, cells fail to divide. It is expected to reduce the progression of the cancer tissue. PHP14 also have an effect on the migration and invasion of cancer cells. It is mediated through modulation of actins cytoskeleton rearrangement. Regulation of actins filament cytoskeleton (F-actin) is important in several cellular processes, including cell adhesion, migration, and division [33].

INDONESIAN SCHOLARS JOURNAL – VOL. 2, SEPTEMBER 2014
60
The induction of apoptosis occurs due to a decrease in anti-apoptotic protein Bcl-2 and an increase in pro-apoptotic protein Bax (Bcl-2-associated X protein). A study conducted by Han et al showed 8,91% of the HepG2 cells transfected with src-siRNA undergo apoptosis, while the percentage of apoptotic HepG2 cells in lenti siRNA/PHP14 transfected group is 17.82%. A similar thing happened on SMMC77221 cells (8.23% were apoptotic for src-siRNA-transfected group and 15.98% were apoptotic for lenti siRNA/PHP14 transfected group). Down regulation of Bcl-2 and up regulation of Bax proved using western blot analysis [8].
Regulation of Bcl-2 family will induce apoptosis through the intrinsic pathway, which involves mitochondria. Bcl-2 prevents cell death by bind to proteins such as pro-apoptotic BH3-only protein activator, Bax, and Bak. Because pro-apoptotic proteins is bounded, signaling will not happen, the cell death will not occur as well [8,34].
Bax mechanism begins with Bax activation (fig. 3) either directly or indirectly [35]. Direct activation is the result of interaction between activator (Bid, Bim, Puma, and p53) with Bax that induce conformational changes that marked with the emergence of the Bax N-terminus. N-terminus is not present in the inactivated Bax [36]. Activators itself occur because the presence of damage stimuli such as oncogene activation, DNA damage, and so on [37]. While indirect activation is due to the BH3-only protein, a protein that acts as activators or sensitizers [38]. Sensitizer activates Bax indirectly by releasing Bax and other activators from binding with anti-apoptotic protein. Finally, Bax is able to undergo activation. When Bax is not activated, Bax is located in the cytosol in the form of monomer. During the process of activation, Bax is translocated to the outer membrane of mitochondria [39-41].
After the activation, Bax will form homo-oligomers that can be seen through western staining followed by chemical crosslinking (fig.3) [42]. Bax oligomer will form holes in mitochondria and cause mitochondrial outer membrane permeabilization (MOMP). Pro-apoptotic proteins that was originally located in the mitochondrial intermembrane will come out towards the cytosol through the hole formed, including cytochrome c and SMAC (second mitochondria-derived activator of caspase) [43]. The release of cytochrome c will activate caspase proteases that cut important cellular proteins. This will lead to a variety morphological characteristics of apoptosis, such as condensation of nuclei, DNA laddering, and exposure of phosphatidylserine to the outer plasma membrane.
Cancer cells have three ways in preventing apoptosis through the intrinsic pathway: (1) Decreased BH3-only proteins activator that play a role in apoptosis by releasing activators and Bax from binding to anti-apoptotic proteins, (2) Low or no Bax and Bak, and (3) Increased expression of Bcl-2 or others anti-apoptotic protein. Thus, the decrease in Bcl-2 and the increase in Bax caused by siRNA silencing of PHP14, result in cell apoptosis and inhibits cancer progression [34].
Fig. 3. Induction of apoptosis through the Bax cascade: Bax is not activated and located in the cytosol (a). Eventually, Bax is activated either directly or indirectly. Direct activation caused by the interaction of activator with Bax (b). Activated Bax will form homo-oligomers and result in mitochondrial outer membrane permeabilization (MOMP), releasing cytochrome c and
induce apoptosis (c).
c. Immune regulation as a Result of Low PHP14 mRNA Expression The anti-apoptotic molecule Bcl-2 plays a central role in
the decision of expanded populations of T cells survival, including CD4+CD25+ Tregs. CD4+CD25+ Tregs play a vital role in immunological self-tolerance, anti-tumor immune responses, antiviral immune responses and transplantation through its function to suppress the activation and proliferation of CD4+ and CD8+. This Tregs increases in patients with HCC. The removal of CD4+CD25+ Tregs can enhance the immune response to HBV or tumours in vitro. Hence, decreasing the amount of Bcl-2 can improve the anti-tumor immune responses, especially to keep CD4+ T cells and CD8+ T cells in adequate amount and function [25].
CD4+ T cells have a function to sense cellular senescence and embark an immune response that stimulates macrophages to clear senescent cells. They also produce cytokines such as interferon γ (IFNγ) and tumor necrosis factor α (TNFα) which promote the senescence of cancer cells. These mechanisms are important for the suppression of hepatocarcinogenesis. Another type of cells which is important toward tumor clearance and tumor prevention is NK cells. Upon the release of IFNγ, NK cells in the liver can eliminate infected cells, malignant cells and stressed hepatocytes. Therefore, the cytolytic activity of NK cells could also be the key to control (pre)malignant cells in the liver (fig.4) [25].
The silencing of PHP14 by siRNA also plays a role in CD4 T cell activation (fig.4). Influx of Ca2+ into T cells via Ca2 release-activated channels (CRAC) is important for T cell activation. Sufficient influx of Ca2+ via CRAC also requires the activation of calcium-activated K+ channel, KCa3.1. A study by Srivastasa et al showed that PHP14 inhibits the

INDONESIAN SCHOLARS JOURNAL – VOL. 2, SEPTEMBER 2014
61
Fig. 4. Mechanism of PHP14-siRNA in interfering immune regulation
activation of KCa3.1 directly by binding and dephosphorylating H358 in the carboxyl terminus. Besides, it is also shown that the silencing of PHP14 in primary human CD4+ T cells led to increased KCa3.1 channel activity and TCR-stimulated calcium influx. Hence, PHP14 siRNA can regulates the activation of CD4+ T cell which is correlated with HCC progression [44-45].
d. Antiangiogenesis Mechanism of Chitosan Nanoparticles Angiogenesis, with the help of VEGF, plays an important
role in various diseases, especially cancer.[46] Proangiogenic effect is primarily mediated by the cell surface receptor tyrosine kinase, the amount of VEGF and VEGFR2 [47]. Chitosan nanoparticles could inhibit the growth of HCC through antiangiogenesis mechanism. Chitosan nanoparticles can significantly decrease the expression of both VEGFR2 mRNA (<0.2 for chitosan nanoparticles-treated treated groups and 1.0 for control group; P<0.05 and P<0.01) and protein (5.13±0.87 and 4.97±0.65 for chitosan nanoparticles group and 7.14±0.93 for control group; P<0.01) [12]. Inhibition of the VEGFR2-induced signaling implicate in the prevention of angiogenesis thus able to inhibit the growth of HCC.
VEGFR2 induces angiogenesis through signaling cascades that begins with the binding of VEGF to VEGFR2. VEGF that is capable to bind to VEGFR2 include VEGFA, VEGFC, and VEGFD. VEGFC and VEGFD must undergo proteolysis proc-ess before being able to bind to VEGFR2 [48]. Once stimulated by VEGF, VEGFR2 undergo autophosphorylation, in which a phosphate group is transferred into tyrosine
residues. VEGFR2 activates the PLCγ and PI3K. PLCγ binds to phosphorylated Tyr1175 then activates PKC by increasing diacylglycerol and intracellular calcium concentration. This will mediate the activation of mitogen-activated protein kinase (MAPK)/extracellular-signal-regulated kinase-1/2 (ERK1/2) cascade and endothelial cell proliferation [49]. PKC also activates eNOS thus increasing vascular permeability (fig.5).
In addition to PLCγ, SHB adapter molecules also bind to phosphorylated Tyr1175 thus induces migration and activation of PI3K [50]. P13K will activate serine/threonine kinase AKT/ PKB and would mediate cell survival. AKT/PKB also regulates the production of nitric oxide (NO) through direct phosphorylation and activation of endothelial NO synthase (eNOS). In addition to interacting with PLCγ and SHB, phosphorylated Tyr1175 also interact with Sck/ShcB (fig.5) [51].
Other studies have shown that VEGF stimulates Ras activation in human umbilicus vein endothelial cells (HUVECs) [52,53]. VEGF stimulation also induces Raf-MEK-MAPK signaling pathway that are independent of Ras via PKC. This has been demonstrated in endothelial cells of liver sinusoids [54].
Another phosphorylation site located on the VEGFR2 is Tyr951, which is where TSAd (T-cell-specific adapter, also known as VEGF receptor-associated protein (VRAP)) binds (fig.5). This signaling pathway serves in regulating endothelial cell migration [55,56]. TSAd also regulates vascular permeability by inducing the formation of TSAd and Src complex [55]. Tyr1214 plays a role in actin remodeling through the activation of CDC42 and p38 MAPK [57]. p38 MAPK induces phosphorylation of heat-shock protein-27 (Hsp27) and resulting in actin reorganization and migration [58,59].
Fig. 5. Angiogenesis cascade through VEGFR2-induced signaling pathway

INDONESIAN SCHOLARS JOURNAL – VOL. 2, SEPTEMBER 2014
62
C. CONCLUSIONS Although several thepeutic modalities have been used as treatment for HCC, a new therapeutic approach is still needed to overcome the obstacles that coming from those therapeutic modalities that have been currently used. PHP14-siRNA have found to become a promising strategy to treat HCC. PHP14-siRNA, which encapsulated with αGPC3-PEGylated chitosan nanoparticles, is the new therapeutic approach to achieve this goal. However, the high price of these technologies becomes major problem that cannot be underestimated. In addition, further research is still needed to prove the effectiveness of this new treatment so that it can be given to patients with HCC.
It is still debated whether the activity of CD4+ T cells promote development of tumor or inhibit its progression. According to Coussens and Smyth, there is a subtle balance between proinflammatory activity, which weakens antitumour immunity and anti-tumour activity. When tumor-mediated immunosuppressive activity is stronger than antitumor immunity, tumor cells undergo immune escape and grow rapidly with local invasion and metastasis. Further research upon the role of inflammation toward HCC development is necessary [60,61].
REFERENCES [1] Gomaa AI, Khan SA, Toledano MB, Waked I, Taylor-Robinson SD.
Hepatocellular carcinoma: epidemiology, risk factors and pathogenesis. World J Gastroenterol. 2008; 14(27): 4300-4308.
[2] Gao W, Ho M. The role of glypican-3 in regulating wnt in hepatocellular carcinomas. Cancer Reports. 2011; 1(1): 14-19.
[3] Livraghi T, Solbiati L, Meloni MF, Gazelle GS, Halpern EF, Goldberg SN. Treatment of focal liver tumors with percutaneous radio-frequency ablation: complications encountered in a multicenter study. Radiology. 2003; 226: 441–451.
[4] Shiina S, Teratani T, Obi S, Sato S, Tateishi R, Fujishima T, Ishikawa T, et al. A randomized controlled trial of radiofrequency ablation with ethanol injection for small hepatocellular carcinoma. Gastroenterology. 2005; 129: 122–130.
[5] Giorgio A, Tarantino L, de Stefano G, Coppola C, Ferraioli G. Complications after percutaneous saline-enhanced radiofrequency ablation of liver tumors: 3-year experience with 336 patients at a single center. AJR Am J Roentgenol. 2005; 184: 207–211.
[6] Klumpp S, Bechmann G, Maurer A, Selke D and Krieglstein J: ATP-citrate lyase as a substrate of protein histidine phosphatase in vertebrates. Biochem Biophys Res Commun. 2003; 306: 110-115.
[7] Maurer A, Wieland T, Meissl F, et al: The beta-subunit of G proteins is a substrate of protein histidine phosphatase. Biochem Biophys Res Commun. 2005; 334: 1115-1120.
[8] Han S, Wang L, Zhao J, Zhang Y, Li M, Zhou X, et al. 14-kDa phosphohistidine phosphatase plays an important role in hepatocellular carcinoma cell proliferation. Oncology letters. 2012; 4: 658-664.
[9] Guo J, Bourre L, Soden DM, O’Sullivan GC, O’Driscoll C. Can nonviral technologies knockdown the barriers to siRNA delivery and achieve the next generation of cancer therapeutics? Biotechnol Adv. 2011; 29(4): 402-417.
[10] Jiang HL, Xu CX, Kim YK, Arote R, Jere D, Lim HT, Cho MH, Cho CS. The suppression of lung tumorigenesis by aerosol-delivered folatechitosan-graft-polyethylenimine/Akt1 shRNA complexes through the Akt signaling pathway. Biomaterials. 2009; 30(29): 5844-5852.
[11] Mohanraj VJ, Chen Y. Nanoparticles – a review. Trop J Pharm Res. 2006; 5(1): 561-73.
[12] Xu Y, Wen Z, Xu Z. Chitosan nanoparticles inhibit the growth of human hepatocellular carcinoma xenografts through an antiangiogenic mechanism. Anticancer Research. 2010; 30: 5103-5110.
[13] Morachis JM, Mahmoud EA, Almutairi A. physical and chemical strategies for therapeutic delivery by using polymeric nanoparticles. Pharmacol Rev. 2012; 64(3): A-O.
[14] Park JO, Stephen Z, Sun C, Veiseh O, Kievit FM, Fang C, et al. Glypican-3 targetting of liver cancer cells using multifunctional nanoparticles. Mol Imaging. 2011; 10(1): 69-77.
[15] Capurro MI, Xiang YY, Lobe C, Filmus J. Glypican-3 promotes the growth of hepatocellular carcinoma by stimulating canonical wnt signaling. Cancer Res. 2005; 65(14): 6245–54.
[16] Jordan CT, Guzman ML, Noble M. Cancer stem cells. NEJM. 2006; 355(12): 1253-1261.
[17] Meguro M, Mizuguchi T, Kawamoto M, Hirata K. The molecular pathogenesis and clinical implications of hepatocellular carcinoma. International Journal of Hepatology. 2011; doi: 10.4061/2011/818672.
[18] Zender L, Villanueva A, Tovar V, Sia D, Chiang DY, Llovet JM, Cancer gene discovery in hepatocellular carcinoma. J Hepatol. 2010; 52(6): 921–929.
[19] Li Q, Xu B, Fu L, Hao SX. Correlation of four vascular specific growth factors with carcinogenesis and portal vein tumor thrombus formation in human hepatocellular carcinoma. Journal of Experimental and Clinical Cancer Research 2006; 25(3): 403-409
[20] Yoshiji H, Kuriyama S, Yoshii J, Ikenaka Y, Noguchi R, Hicklin DJ, et al. Synergistic effect of basic fibroblast growth factor and vascular endothelial growth factor in murine hepatocellular carcinoma. Hepatology 2002; 35(4): 834–42
[21] Roberts LR and Gores GJ. Emerging drugs for hepatocellular carcinoma. expert opinion on emerging drugs. 2006; 11(3): 469-87
[22] Hu TH, Huang CC, Lin PR. Expression and prognostic role of tumor suppressor gene PTEN/MMAC1/TEP1 in hepatocellular carcinoma. Cancer. 2003; 97(8): 1929-40
[23] Alisa A. Alpha-Fetoprotein and immunotherapy for hepatocellular carcinoma. University of London. 2010.
[24] Zhang HH, Mei MH, Fei R, Liu F, Wang JH, Liao WJ, et al. Regulatory T cells in chronic hepatitis B patients affect the immunopathogenesis of hepatocellular carcinoma by suppressing the anti-tumour immune responses. Journal of Viral Hepatitis 2010; 17(Suppl. 1): 34-43
[25] Mossanen JC, Tacke F. Role of lymphocytes in liver cancer. OncoImmunology 2013; 2(11): e26468-1 – e26468-9
[26] Carthew RW, Sontheimer EJ. Origins and mechanisms of miRNAs and siRNAs. Cell. 2009; 136: 642-55
[27] ElHefnawi M, Mysara M. Bioinformatics – trends and methodologies. Mahdavi MA, editor. Rijeka: InTech; 2011. 513-38 p.
[28] Oh YK, Park TG. siRNA delivery systems for cancer treatment. Advanced Drug Delivery Reviews. 2009; 61(10): 850-62
[29] Milhavet O, Gary DS, Mattson MP. RNA interference in biology and medicine. Pharmacol Rev. 2003; 55(4): 629-48
[30] Breedveld FC. Therapeutic monoclonal antibodies. Lancet. 2000; 355: 735-40
[31] Malhotra M, Lane C, Catherine, Tomaro-Duchesneau, Saha S, Prakash S. A novel method for synthesizing PEGylated chitosan nanoparticles: strategy, preparation, and in vitro analysis. Int J Nanomedicine. 2011; 6: 485-94
[32] Harris JM, Zalipsky S. Poly (ethylene glycol) chemistry and biological applications. Washington, DC: American Chemical Society. 1997; 489: 155-69
[33] Xu A, Hao J, Zhang Z, Tian T, Jiang S, Hao J, et al. 14-kDa phosphohistidine phosphatase and its role in human lung cancer cell migration and invasion. Lung Cancer. 2010; 67(1): 48-56
[34] Brunelle JK, Letai A. Control of mitochondrial apoptosis by the Bcl-2 family. J Cell Sci. 2009; 122(4): 437-41
[35] Willis SN, Fletcher JI, Kaufmann T, van Delft MF, Chen L, Czabotar PE, et al. Apoptosis initiated when BH3 ligands engage multiple Bcl-2 homologs, not Bax or Bak. Science. 2007; 315(5813): 856-9
[36] Yethon JA, Epand RF, Leber B, Epand RM, Andrews DW. Interaction with a membrane surface triggers a reversible conformational change in Bax normally associated with induction of apoptosis. J. Biol. Chem. 2003; 278(49): 48935-41
[37] Wei MC, Zong WX, Cheng EH, Lindsten T, Panoutsakopoulou V, Ross AJ, et al. Proapoptotic BAX and BAK: a requisite gateway to mitochondrial dysfunction and death. Science. 2001; 292(5517): 727-30

INDONESIAN SCHOLARS JOURNAL – VOL. 2, SEPTEMBER 2014
63
[38] Letai A, Bassik MC, Walensky LD, Sorcinelli MD, Weiler S, Korsmeyer SJ. Distinct BH3 domains either sensitize or activate mitochondrial apoptosis, serving as prototype cancer therapeutics. Cancer Cell 2002; 2(3): 183-92
[39] Billen LP, Kokoski CL, Lovell JF, Leber B, Andrews DW. Bcl-XL inhibits membrane permeabilization by competing with Bax. PLoS Biol.2008; 6(6): e147.
[40] Hsu YT, Wolter KG, Youle RJ. Cytosolto-membrane redistribution of Bax and Bcl-X(L) during apoptosis. Proc. Natl. Acad. Sci. USA. 1997; 94: 3668-72
[41] Wolter K. G, Hsu YT, Smith CL, Nechushtan A, Xi XG, Youle RJ. Movement of Bax from the cytosol to mitochondria during apoptosis. J. Cell Biol. 1997; 139: 1281-1292.
[42] Wei MC, Lindsten T, Mootha VK, Weiler S, Gross A, Ashiya M, Thompson CB, Korsmeyer SJ. tBID, a membrane-targeted death ligand, oligomerizes BAK to release cytochrome c. Genes Dev. 2000; 14: 2060-2071
[43] Wang X. The expanding role of mitochondria in apoptosis. Genes Dev. 2001; 15: 2922-2933
[44] Srivastava S, Zhdanova O, Di L, Li Z, Albaqumi M, Wulff H, Skolnik E Y. Protein histidine phosphatase 1 negatively regulates CD4 T cells by inhibiting the K+ channel Kca3.1. Procedding of the National Academy of Sciences 2008;105(38):14442-6
[45] Sundh UB. Studies in phosphohistidine phosphatase 1: What? Where? Why?. Acta Universitatis Upsaliensis. Digital Compherehensive of Uppsala Dissertations from the Faculty of Medicine 2012;76. 44p
[46] Pralhad T, Madhusudan S, Rajendrakumar K. Concept, mechanisms and therapeutics of angiogenesis in cancer and other diseases. J Pharm Pharmacol 2003; 55: 1045-1053
[47] Shibuya M, Claesson-Welsh L. Signal transduction by VEGF receptors in regulation of angiogenesis and lymphangiogenesis. Exp Cell Res 2006; 312: 549-560
[48] Olsson AK, Dimberg A, Kreuger J, Welsh LC. VEGF receptor signaling – in control of vascular function. Nature Reviews. 2006; 7: 359-371
[49] Takahashi T, Yamaguchi S, Chida K,Shibuya MA. Single autophosphorylation site on KDR/Flk-1 is essential for VEGF-A-dependent activation of PLC-gamma and DNA synthesis in vascular endothelial cells. EMBO J. 2001; 20: 2768–2678
[50] Holmqvist K. The adaptor protein shb binds to tyrosine 1175 in vascular endothelial growth factor (VEGF) receptor-2 and regulates VEGF-dependent cellular migration. J. Biol. Chem. 2004; 279: 22267–22275
[51] Warner AJ, Lopez-Dee J, Knight EL, Feramisco JR, Prigent SA. The Shc-related adaptor protein, Sck, forms a complex with the vascular-endothelialgrowth- factor receptor KDR in transfected cells. Biochem. J. 2000; 347: 501–509
[52] Shu X, Wu W, Mosteller RD, Broek D. Sphingosine kinase mediates vascular endothelial growth factor-induced activation of ras and mitogenactivated protein kinases. Mol. Cell Biol. 2002; 22: 7758–7768
[53] Meadows KN, Bryant P, Pumiglia K. Vascular endothelial growth factor induction of the angiogenic phenotype requires Ras activation. J. Biol. Chem.2001; 276: 49289–49298
[54] Takahashi T, Ueno H, Shibuya M. VEGF activates protein kinase C-dependent, but Ras-independent Raf-MEK-MAP kinase pathway for DNA synthesis in primary endothelial cells. Oncogene. 1999; 18: 2221–2230
[55] Matsumoto T. VEGF receptor-2 Y951 signaling and a role for the adapter molecule TSAd in tumor angiogenesis. EMBO J. 2005; 24: 2342–2353
[56] Zeng H, Sanyal S, Mukhopadhyay D. Tyrosine residues 951 and 1059 of vascular endothelial growth factor receptor-2 (KDR) are essential for vascular permeability factor/vascular endothelial growth factorinduced endothelium migration and proliferation, respectively. J. Biol. Chem. 2001; 276: 32714–32719
[57] Lamalice L, Houle F, Jourdan G, Huot J. Phosphorylation of tyrosine 1214 on VEGFR2 is required for VEGF-induced activation of Cdc42 upstream of SAPK2/p38. Oncogene 2004; 23: 434–445
[58] McMullen ME, Bryant PW, Glembotski CC, Vincent PA, Pumiglia KM. Activation of p38 has opposing effects on the proliferation and migration of endothelial cells. J. Biol. Chem. 2005; 280: 20995–21003
[59] Rousseau S, Houle F, Landry J,Huot J. p38 MAP kinase activation by vascular endothelial growth factor mediates actin reorganization and cell migration in human endothelial cells. Oncogene. 1997; 15: 2169–2177
[60] Coussens LM, Werb Z. Inflammation and cancer. Nature 2002; 420(6917): 860-7
[61] Smyth MJ, Cretney E, Kershaw MH, Hayakawa Y. Cytokines in cancer immunity and immunotherapy. Immunol Rev 2004; 202: 275-93

INDONESIAN SCHOLARS JOURNAL – VOL. 2, SEPTEMBER 2014
64
“Anti-Rabies Egg” as Serotheraphy of Rabies Cases
Mohammad Vicky Indra P*, Dian Fitriani, Werstant, Marisa Rahmanti, and Chaterina
Faculty of Veterinary Medicine, Airlangga University *[email protected]
Abstract. The aim of this research is to show anti-rabies antibody isolated from egg yolk produced from chicken which was immunized by rabies virus. Five chicken strain Lohman Brown (final stock) aged 20 week and adapted for 1 week. Further, it did immunization using rabies virus every 2 week, serum was collected every week and egg was collected every day. The immunization did intramuscular by complete freund’s adjuvant (CFA) at first immunization and incomplete freund’s adjuvant (IFA) at second immunization (booster). The egg collected did isolation anti-rabies antibody from egg yolk, and was then examined by Indirect ELISA test to show anti-rabies antibody titer at serum and egg yolk. The observation variable was total titer which serum and egg yolk produced at 0, 1, 2, 3 and 4 week(s). The result shows that immunization of chicken used rabies vaccine (inactive) can stimulate antibody from serum and egg yolk. The titer is specific antibody of antigen (rabies virus) which is formed at egg yolk lower than titer serum antibody. The conclusion is anti-rabies antibody from egg yolk has high immunogenity, so it is feasible to be used as serotherapy agent and chickens can be used as test-animals to produce hyperimun anti-rabies serum applied as an alternative method.
Keyword: Rabies Antibody, ELISA, Immunization, Serotheraphy.
NOMENCLATURE
CFA : Complete Freund’s Adjuvant. IFA : Incomplete Freund’s Adjuvant.
A. INTRODUCTION Patients as dog-bite victims are suspected rabies carriers
by the injection of anti-rabies hyperimmune serum produced in horses. Using horses as animals for the production of serum, viz. antibody (hyperimmune serum), lately is rarely applied considering the principles of animal welfare and the high production costs. Horses used for the production of hyperimmune serum in long term will have amyloidosis. The use of chicken eggs to produce antibodies has been developed recently. Some benefits of the use of chicken eggs as the source of antibody production is a low cost, the ease in isolation and its preparation and also high productivity and fast [9].
Rabies is a zoonotic disease that causes death in Indonesia, psychological effects and fatal in humans. Rabies is an endemic disease in some islands such as Sumatra, Kalimantan, Sulawesi and East Nusa Tenggara. Recently rabies remains a public health problem in Indonesia due to high mortality reaching 100 people per year. In addition, 22 provinces in Indonesia are area of rabies in animals since 1986 [11].
In the last few years, several sources of egg yolk antibodies are available commercially. The use of oral antibodies has produced some success stories in the prevention of viral and bacterial enteric infections in chickens, pigs, mice and calves. It can be suggested that the antibodies in the egg yolk can act against enteric pathogens by binding, immobilization and consequently reducing or
inhibiting the ability of the growth, replication or the pathogen colony formation [9]. To produce antibodies, hens are exposed (usually injections) with a specific antigen that induces an immune response including the production of antibodies. Normally antibodies are then transferred to the egg yolk. Booster immunization (second exposure) is usually given at a slower time to ensure the transfer of antibodies from hen egg yolk to be sustained. The use of the eggs for the production of anti-rabies serum hyper immune is one potential alternative method to be developed. Research shows that Ig Y concentrations in chicken serum are not significantly different to that of the egg yolk [8].
B. MATERIAL AND METHOD
1. Instrument Material Tested animals in this research were ten chickens varied
layer strain Lohman Brown (final stock) aged 20 week. It used to produce anti-rabies antibody. Adjuvan Freund Complete (Sigma; F-5581) and Incomplete (Sigma; F-5506), NaCl physiology (NaCl ; Merck Cat. No. K 337 03004 721), antigen rabies virus (from Pusvetma Surabaya), Chlorofom (Merck ; Cat. No. K 363 15445-630), washing buffer, blocking buffer, creamer, conjúgate anti-chicken which labelled alkalin phospatase, buffer substrat and substrate p-NPP (KPL ; Cat. No. 50-80-01), anti-rabies standard antibody (Pusvetma), micro tube (Biologic Research Company 80-1500, USA) mikroplate ELISA (flat bottom) dan ELISA reader.

INDONESIAN SCHOLARS JOURNAL – VOL. 2, SEPTEMBER 2014
65
2. Method Anti-rabies antibody was produced in chicken strain
Lohman Brown (final stock) before spawning aged (20 weeks) by immunization using rabies virus. The immunizations were performed 4 times once in 2 weeks. First immunization (primer) used Complete Freund,s Adjuvant (CFA) and second immunization (booster I and II) used Incomplete Freund’s Adjuvant (IFA). Every 2 weeks, post immunization did egg and blood collect. Next, antibody was tested to whole antigen rabies virus using inderect-ELISA test.
The eggs have been collected later extraction to obtain yolk antibodies by using chloroform. 0.5 ml of egg yolk was added 0.5 PZ pH 7.2 and then mixed using mixed vortex and then 2 ml of chlorofom was added. It was incubated during 30-60 minutes in room temperature and mixed by vortex every 5 minutes. Next method was centrifuged at 3000 rpm (1000x) for 15 minutes. After centrifugation, antibody was frozen at -200C temperature [1].
Next, Indirect ELISA test showed titer anti-rabies antibody in serum and egg yolk. Antigen rabies virus was binded at microplate solid phase in buffer carbonate (coating buffer) and incubated during 18 hours at 4oC. The microplate was washed use washing buffer 3 times, blocked with buffer creamer 4% 200 µl/well, and incubated at 37oC for 1 hours. Then, it was washed with washing buffer 3 times and added the sample to be tested an anti-rabies antibody from egg yolk and serum. Dilution positive control (anti-rabies) as a standard was conducted from 1/100, 1/200 until 1/12.800. Then, the antibody samples were diluted 1 :50 (egg yolk) and 1 :100 (serum) and added to each well 100 µl. Incubation for 1 hours at 37oC washed with washing buffer 3 times and added conjugate anti-chicken which was labeled enzyme alkaline phosphatase (1 :4000) and incubated at 370C for 1 hours. After being washed with washing buffer 3 times, then substrate p-NPP was added and infiltration was read at wavelength of 405 nm [11], [13].
C. RESULT AND DISCUSSION The test result was used indirect ELISA method to show
titer anti-rabies antibody as shown in Table 1. Immunization using rabies vaccine (inactive) can stimulate formation of antibody in egg yolk and serum. Titer specific antibody at antigen rabies virus was formed in egg yolk with lower score than titer antibody serum. This is shown in Figure 1. Table 1. Graphic Of Average Optical Density (OD) Score And Titer Serum
And Egg Yolk After Vaccine With Rabies Vaccine.
Week Serum Egg Yolk OD
Average Titer OD
Average Titer
0 0,132 0 0,125 0 1 0,412 400 0,323 200 2 0,539 800 0,365 200 3 0,587 800 0,457 400 4 0,632 1600 0,565 800
Figure 1. Graphictiter Anti-Rabies Antibody (Igy) Serum And Egg Yolk
After Vaccine Used Rabies Vaccine.
Immunization of chicken was intramuscularly performed twice by complete freund’s adjuvant (CFA) in the first immunization and incomplete freund’s adjuvant (IFA) at the second immunization (booster). CFA and IFA additions increased immune response. CFA contains dead mycobacteria or mycobacterial cell wall component that has ability to initiate stimulate cellular immune responses and humoral immune response against the immunogen in the injected [13].
The first immunization is done with the addition of an adjuvant CFA which is complete so that it can stimulate the production of antibodies. According to Abbas et al. (2000), immune response occurs when previously existing memorize cells produced antibody with affinity and affidity, as well as high specificity. Therefore, booster was not done using CFA, but the IFA using incomplete adjuvant for the immune response which is well established before the first immunization. This is done to prevent the occurrence of hypersensitivity reactions to immunogen.
The immunogenicity test of antigen rabies (rabies vaccine) which was immunized in chicken on egg-laying period is done using indirect ELISA. ELISA is a sensitive method for the detection of antigens, antibodies, hormones and toxic materials. ELISA with homogeny system is not influenced by non sensitive enzyme activity and not used to screening. ELISA with heterogeneous system not influenced by enzyme activity, its conjugate does not affect the reaction of antigen antibody. Heterogeneous system finds 2 models: competitive and non-competitive. Competitive models are used for the measurement of antigen in a competitive basis between the labeled and not the antibody coated at polystirol microplate or polyvinyl. Non-competitive ELISA is the most widely used because it is more sensitive, for instance at the direct ELISA (first antibody labeled), indirect ELISA (second antibody labeled) and antibody bridge (third antibody labeled).
Based on the results, immunization by chicken using the rabies vaccine (inactive) can trigger the formation of antibody, either antibody in serum and egg yolk. Titer specific antibody against antigen (rabies virus) which was formed in egg yolk is relatively lower than titer serum antibody. This is according to Narat opinion [9] who argued
0
500
1000
1500
2000
Tite
r Ant
i-Rab
ies
Antib
ody
Serum
Egg Yolk
INDONESIAN SCHOLARS JOURNAL – VOL. 2, SEPTEMBER 2014
66
that the amount of specific antibodies in serum was higher than specific antibody in egg yolk.
IgY serum is transferred selectively from layer circulation system traverse oolemma to the oocytes mature on ovary. This transfer involves specific receptor in membrane egg yolk which is possible specific transfer at total IgY subpopulation in maternal circulation system. Morrison (2001) identified IgY section which is role transfer process from circulation system to egg yolk. Fc Regio and hinge region are known by specific receptor at egg yolk membrane. Transovarial line for 3-6 days. Transfer is processed in last stadium form of egg process.
Utilizing antibody from egg yolk had high titer antibody, though lower thab serum antibody. It is similar than titer antibody from horse’s serum. Furthermore, antibody from egg yolk gives many benefits compared to the one available in market, such as low cost of production, easy isolation, high productivity and fast.
To conclude, anti-rabies antibody from egg yolk has high immunogenity, so it is feasible to be used as serotherapy agent and chickens can be used as tested animals to produce hyperimun anti-rabies serum applied as an alternative method.
D. CONCLUSION The conclusion that can be drawn from this research is
the anti-rabies antibody from egg yolk has a fairly high immunogenicity; therefore, it is possible to be used as a serotherapy agent.
ACKNOWLEDGMENT Special thanks to Directorate of Higher Educatio, Ministry of Culture and Education in Indonesia for the research fund.
REFERENCES [1] Beck, J.R., D.E. Swayne, S. Davison, S. Casavant and C. Gutierrez.
2003. Validation of Egg Yolk Antibodi testing As A Method to Determine Influenza Status in White Leghorn Hens. Avian Disease 47 : 867-871.
[2] Ebina, T. 1996. Prophylaxis of Rotavirus Gastroenteritis Using Immunoglobulin. Arach. Virol. 12 (1) : 217 – 223.
[3] Ikemori, Y. 1997. Passive Protection of Neonatal Calves Against Bovine Coronavirus-Induced Diarhea by Administration of Egg Yolk or Colostrum Antibody Powder. Vet. Microbiol. 54 : 105 – 111.
[4] Imberechts, H., P. Deprez, E. Van Driessche. and P. Pohl. 1997. Chicken Egg Yolk Antibodies Against F18B Fimbrie of Escherichia coli Inhibit Shedding of F18 Positive Escherichia coli by Experimentally Infected Pigs. Vet. Microbiol., : 329 – 341.
[5] Imberechts, H., P. Deprez, E. Van Driessche. and P. Pohl. 1997. Chicken Egg Yolk Antibodies Against F18B Fimbrie of Escherichia coli Inhibit Shedding of F18 Positive Escherichia coli by Experimentally Infected Pigs. Vet. Microbiol., : 329 – 341.
[6] Kuncorojakti. S. 2010. Efektifitas Antibodi Anti-Hemaglutinin Asal Kuning Telur (IgY) sebagai Agen Imunoterpi pada Ayam yang Terinfeksi virus Avian Influenza A/H5N1. Tesis. Fakultas Kedokteran Hewan Universitas Airlangga. Surabaya.
[7] Kuroki, M. 1994. Passive Protection Against Bovine Rotavirus in Calves by Specific Immunoglobulin from Chicken Egg Yolk. Arach. Virol., 138 : 143 – 148.
[8] Larsson A. and Lindahl T. 1993. Chicken antiprotein G for the Detection of Small amounts of Protein G. Hibridoma 12; 143-147.
[9] Narat, M. 2003. Production of Antibodies in Chickens. Food Technol. Biotechnol. 41 (3) : 259 – 267.
[10] Rahimi, S. 2007. Prevention Salmonella Infection in Poultry by Specific Egg-Derived Antibody. Int. J. Poult. Sci., 6 : 230 – 235.
[11] Rahmahani, J.,Suwarno dan Wibisono, F. J. 2010. Karakterisasi Protein dan Gen Penyambi Glikoprotein Virus Rabies Isolat Lokal di Indonesia. Media Kedokteran Hewan. Vol.26 No.3 September 2010; 183-192.
[12] Rohiman dan Nurtjahjo, 1985, Vaksin Anti-Rabies (Human Diploid Cell) dan Kegunaannya Bagi Manusia, Medika Jurnal Kedokteran Farmasi, Jakarta.
[13] Suwarno. 2009. Karakteristik Protein NA Virus Avian influenza A/Chk/Bl/2003 Sebagai Antigen Diagnostik pada ELISA Tidak Langsung. Media Kedokteran Hewan 24 (3) : 153 – 158.
[14] Tizard, I. R. 1996. Veterinary Immunology. An Introduction. W. B. Saunders Company. Philadelphia. p. 531.
[15] Tsubokura, K. 1997. Oral Administration of Antibodies as Prophylaxis and Therapy in Campylobacter jejuni-infected Chickens. Clin. Exp. Immunol., 108 : 451 – 455.
[16] Wilkie, D. C. 2006. Non-Antibiotic Approaches to Control Pathogens in The Gastrointestinal Tract of The Broiler Chicken. Ph.D Thesis : University of Saskatchewan. Canada.