University of Jordan1 Body Fluids & Blood. University of Jordan2.
E c o n o m i c &S
oc
ia
l
Af
fa
ir
s
DESA Working Paper No. 103 ST/ESA/2011/DWP/103
February 2011
Behavioural Factors as Emerging Main Determinants of Child Mortality in Middle-Income Countries: A Case Study of Jordan
Cornelia Kaldewei and Ingo Pitterle
Cornelia Kaldewei (e-mail: [email protected]) and Ingo Pitterle (e-mail: [email protected]) are Economic Affairs Officers at the Development Policy and Analysis Division, Department of Economic and Social Affairs, United NationsComments should be addressed by e-mail to the authors.
Abstract
This paper uses data from Jordan’s 2007 Demographic and Health Survey to reassess the main determinants of child mortality in this middle-income country. Running different logit estimations to allow for different time windows and sets of variables, we find that behavioural factors have gained importance, compared to the household and community factors that were found to be important in earlier studies. We conclude that once a country has passed a certain threshold in household income, education and access to health care and safe drinking water, policies targeting behavioural changes are the most promising for achieving further reductions in mortality rates.
JEL Classification: I12, I18, J13, O29
Keywords: child mortality; infant mortality; emerging determinants; behavioural factors; middle-income countries; Jordan

Contents
1. Introduction .................................................................................................................... 1
2. The Health Sector and Human Development in Jordan ................................................... 3 Human development trends ............................................................................................... 3 Health system and policies ................................................................................................. 3 Infant and under-five mortality trends ................................................................................ 43. Data Sources and Explanatory Variables .......................................................................... 5
The dataset ......................................................................................................................... 5 Set of determinants for analysis .......................................................................................... 6 Descriptive statistics ........................................................................................................... 94. Methodology ................................................................................................................... 10
5. Results ............................................................................................................................. 12 Behavioural factors ............................................................................................................. 15 Personal and biological factors ............................................................................................ 16 Household and Community Factors .................................................................................. 176. Conclusion ...................................................................................................................... 18
References .................................................................................................................................... 19
Annex .......................................................................................................................................... 21
Tables
1: Infant and under-five mortality in Jordan and global trends, 1970-2007 ............................ 52: Early childhood mortality by five-year intervals preceding JPFHS 2007 ............................. 53: Infant and under-five mortality rates by factor, for the 10-year interval preceding JPFHS 2007 ............................................................................. 94: Binomial logit regression estimates and test statistics for infant mortality in Jordan (estimations I and II) ......................................................................... 135: Binomial logit regression estimates and test statistics for infant mortality in Jordan (estimations III and IV) ..................................................................... 14
UN/DESA Working Papers are preliminary documents circulated in a limited number of copies and posted on the DESA website at http://www.un.org/en/development/desa/papers/2010 to stimulate discussion and critical comment. The views and opinions expressed herein are those of the author and do not necessarily reflect those of the United Nations Secretariat. The designations and terminology employed may not conform to United Nations practice and do not imply the expression of any opinion whatsoever on the part of the Organization.
United Nations Department of Economic and Social Affairs2 United Nations Plaza, Room DC2-1428New York, N.Y. 10017, USATel: (1-212) 963-4761 • Fax: (1-212) 963-4444e-mail: [email protected]://www.un.org/en/development/desa/papers/2011

1
Behavioural Factors as Emerging Main Determinants of Child Mortality in Middle-Income Countries: A Case Study of Jordan1
Cornelia Kaldewei and Ingo Pitterle
1. Introduction
Great strides have been made over the past decades in reducing child mortality at the global level, as docu-mented by a decline of one third in the under-five mortality rate between 1990 and 2009 (Inter-agency Group for Child Mortality Estimation Report, 2010). All developing regions have experienced considerable improvements in child survival during this period, with Northern Africa and East Asia making the fastest progress. Despite these achievements, however, most developing countries still lag significantly behind the developed world, with an average of 66 deaths per 1,000 live births in 2009, compared to only six in devel-oped regions. Against this backdrop, the joint UN-World Bank report cited above concludes that the rate of decline in child mortality remains insufficient to achieve Millennium Development Goal 4 (MDG 4)—to reduce under-five mortality rates by two thirds between 1990 and 2015.
Trends in child mortality, as well as its determinants, have long been the subject of academic and policy debates, the literature on the topic going back to the early twentieth century.2 Prompted by new measurement techniques introduced in the 1960s and increased interest in development and mortality in-dicators among the international community, intense research was carried out in the 1970s and 1980s. This was further facilitated by newly available datasets at the household and individual levels, associated with the World Fertility Surveys (WFS) and, later, the Demographic and Health Surveys (DHS), which led to a focus on socio-economic and demographic characteristics, in addition to the known biomedical determinants of child mortality.3 In an attempt to bridge the methodological gaps between the different approaches, Mosley and Chen (1984) established an analytical framework combining the two sets of what they called “socioeco-nomic” and “proximate” (direct) determinants.
The literature has continued to grow since the 1970s and 1980s, and has delivered some useful and generally accepted insights into the determinants of child mortality, highlighting, inter alia, the importance of birth spacing, breastfeeding, access to health care (including immunization), mother’s education, urban versus rural residence, safe drinking water and household income.4 As a result, Governments, international organizations and non-governmental organizations (NGOs) have embarked on policy initiatives to im-prove child health outcomes, including through improved access to primary care facilities, immunization campaigns, improved access to safe drinking water, as well as progress in education. These measures, in combination with general improvements in GDP per capita and other human development categories, have contributed to a remarkable decline in child mortality in many countries over the past thirty years.
1 The views expressed are those of the authors and should not be attributed to the United Nations or any of its Member States. Helpful comments were received from Rob Vos, José Cuesta, Marco Sánchez, Matthias Krause, Nicolas Maystre and Giacomo Sbrana.
2 For overviews of the early literature on child mortality, see Preston (1996) and Wolpin (1997).3 In addition, econometric techniques such as the logistic regression and hazard models had by then become more widely
available in user-friendly automated formats. 4 Charmarbagwala et al. (2004) provide an overview of the more recent literature based on household survey data.
2 D E S A W o r k i n g P a p e r N o . 1 0 3
Following the successful interventions of the past, and faced with the persistent lag in mortality rates behind developed country achievements, the moment has come to reassess the relative importance of deter-minants. This concerns especially those middle-income countries where the pace of past improvements has started to stall, as basic health interventions have been implemented and additional policies may be required to further narrow the gap in mortality rates.
In this vein, the present paper contributes to the reassessment of the main determinants of child mortality that becomes necessary as a country’s level of development increases and the success of initial policy interventions wears off. For our analysis, we use the case of Jordan, a lower middle-income country that has come a long way in reducing child mortality, as evidenced by the drop in under-five mortality from over 80 per 1,000 live births in the 1970s to 26 per 1,000 in 2007.5 While this is a remarkable achievement, particularly at Jordan’s per capita income level, recent progress was slower than in many other middle-income countries. At this point, a fresh assessment of the main determinants is warranted to inform the policies needed to get the country back on track towards achieving MDG 4.
Our empirical results are based on a standard binomial logit analysis of the most recent available data from the 2007 Jordan Population and Family Health Survey (JPFHS), which is part of the worldwide DHS programme. The sample includes over 40,000 children born between January 1971 and September 2007. Differentiating between personal and biological factors, behavioural factors, and household and community factors, we find that behavioural factors such as birth spacing, smoking and breastfeeding seem to matter most for infant and under-five mortality in Jordan.6 This is in contrast to earlier studies on Jordan that had found a strong impact of household and community factors, most notably the area of residence—urban versus rural—and the mother’s education level (Adlahka and Suchindran, 1985; ESCWA, 1991; Shakhatreh, Abbas and Issa, 1996). In addition, we find that in the recent past, the mortality risk for boys has decreased faster than for girls, possibly suggesting differential treatment of the two groups.
Taken together, our results confirm the hypothesis that the main determinants of child mortal-ity change as a country reaches a higher overall level of development. Household and community factors lose importance as general access to health care and education improves and income levels rise. In turn, behavioural variables become more important, requiring new policy approaches to further reduce mortality rates. This should be seen as good news for policymakers. With the appropriate policies to foster behavioural change, such as targeted awareness campaigns on the risks of smoking and the benefits of greater birth spac-ing and breastfeeding, and renewed efforts to protect the rights of the girl child, Jordan has a good chance of making strong progress towards further reductions in child mortality.
The remainder of the paper is organized as follows. Section 2 provides an overview of human development trends and the health sector in Jordan and highlights recent trends in infant and under-five mortality. Section 3 introduces the dataset and the determinants for the empirical analysis, and reports the related descriptive statistics. Section 4 discusses why we choose a standard logit model over a hazard model (the main alternative model used in the literature on child mortality). Section 5 outlines our main findings and the resulting policy recommendations, and section 6 presents conclusions.
5 Mortality figures are taken from CME Info (2010), a database based on the research of the Inter-agency Group for Child Mortality Estimation.
6 While our analysis focuses on infant mortality, we show that the qualitative results also carry over to under-five mortality.
Child Mortality in Middle-Income Countries: A Case Study of Jordan 3
2. The Health Sector and Human Development in Jordan
Human development trends
For a lower middle-income developing country, Jordan has achieved above-average outcomes in terms of human development indicators such as education and health. According to the human development index (HDI) for 2007, the most recent available year, Jordan achieved a ranking of 96 out of a total of 182 coun-tries.7 In the health and education sub-indices, the country scored higher, ranking seventy-eighth in terms of life expectancy at birth, sixty-fourth in adult literacy rate, and sixty-second in combined primary, secondary and tertiary gross enrolment ratio. This is in spite of a much lower ranking—107th—in GDP per capita as measured in purchasing power parity.
These overall positive human development results are, however, diminished by Jordan’s lacklustre performance in terms of gender. The gender-related development index (GDI), first introduced in the Human Development Report 1995, uses the same sub-indices as the HDI, but takes into account differences between women and men. Using the ratio between GDI and HDI to rank countries according to gender dis-parities relegates Jordan to a ranking of 145. Jordan’s rank drops significantly both in terms of life expectancy at birth and adult literacy rate, but it performs relatively well in terms of combined enrolment ratio, where it slips only from rank 62 to rank 63. This bodes well for future adult literacy rates and possibly also for future infant and maternal mortality outcomes.
Health system and policies
Jordan’s past public spending on education and health, as well as other social spending, has been instru-mental in achieving the described development outcomes. According to the Human Development Report of 2007/2008—the most recent one to display these numbers for Jordan—the Government spent 20.6 per cent of its budget on education in 2001, equivalent to 4.9 per cent of GDP. Public spending on health was equivalent to 5.3 per cent of GDP in 2007, supporting a relatively well-developed nationwide public health-care system, with 1,392 public health centres and 43 public hospitals in 2007. An additional 3.8 per cent of GDP in private health spending contributes further to Jordan’s health-care coverage, including through a number of world-class facilities that also attract patients from abroad.8
Jordan’s health system is modern and well-developed, both by regional standards and in comparison to other lower middle-income countries. It consists of three major elements: the public sector, the private sector, and donor initiatives. In 2007, these sectors’ respective contributions to overall health-care financing amounted to 54.9 per cent, 40.2 per cent, and 4.9 per cent (Ministry of Health of Jordan, 2009).
In terms of coverage and accessibility, the Jordanian health system performs relatively well. In 2004, around 70 per cent of the population was covered by formal health insurance (Ajluni, 2006). Insurance coverage tends to be higher among women, the elderly, and rural population groups.9 The average patient travel time to a public health-care centre is about 30 minutes.
7 The human development index (HDI) has been compiled by the United Nations Development Programme (UNDP) on a regular basis since 1990. It combines different measures of development and well-being into one index number, allowing an assessment of development that goes beyond pure measures of income. At the time of writing, the most recent available report is the Human Development Report 2009.
8 Data on spending and hospital coverage are taken from the Ministry of Health, Jordan, Annual Statistical Book (2009), the most recent issue at the time of writing.
9 This has been achieved mainly through targeted policies and programmes by the Ministry of Health, such as the provision of free health insurance for all people living in high poverty areas.

4 D E S A W o r k i n g P a p e r N o . 1 0 3
Policies to promote maternal and child health have become a central concern for the Jordanian Government since the 1970s. Child immunization was identified as a priority area, and by the late 1980s more than 90 per cent of children living in Jordan were fully vaccinated. From the 1990s onwards, popula-tion issues also started to play an increasing role in the country’s development plans and projects (Al-Qutob, 1994). In 1993, Jordan’s cabinet approved the National Birth Spacing Program and in 1996, government agencies were requested to implement the National Population Strategy, which included, among other areas, maternal and child health, family planning and birth spacing (National Population Commission, 2000). In the five-year development plan for 1993–1997, the staffing of primary health-care centres with nurses and midwives was one of the key strategies for raising the quality of health care, directly benefiting maternal as well as child health. More recently, the Government has further increased its efforts to expand access to health care by raising insurance coverage and reaching out to vulnerable groups, as emphasized, for instance, in the 2004-2006 development plan.
Infant and under-five mortality trends
While MDG 4 calls for a reduction of child mortality, the related target is to “reduce by two thirds, between 1990 and 2015, the under-five mortality rate”. In more technical terms, infant mortality and under-five mor-tality rates are measured as the number of deaths per 1,000 live births before a child’s first birthday and before its fifth birthday, respectively. The child mortality rate in turn is defined as the rate of deaths between the ages of one and five years, and can be computed as the difference between under-five and infant mortality rates.
According to CME Info (2010), a database compiled by the Inter-agency Group for Child Mortality Estimation, Jordan has been able to reduce infant and under-five mortality rates from 74 to 22 and from 103 to 26, respectively, between 1970 and 2007. Until 2005, mortality rates in Jordan were consistently lower than the median of countries for which comparable data is available (see table 1). Compared to the mean mortality rates, Jordan’s performance looks even more impressive. Since the 1980s, however, the pace of decline has continuously slowed—more so than in other countries, as reflected by Jordan’s deteriorating rank. While Jordan ranked 93rd out of 197 countries in both infant and child mortality in 1995, it had slipped by 13 ranks, down to 106th out of the same 197, by 2007. Median mortality rates in that year were 20 for infant mortality and 24 for under-five mortality, compared to Jordan’s 22 and 26, respectively.
The final report of the 2007 JPFHS provides a more detailed overview and analysis of these trends at the national and subnational levels (Department of Statistics [Jordan] and Macro International Inc., 2008). Overall, the numbers and trends are compatible with CME Info (2010) data, while additional information is supplied based on a series of five-year time intervals prior to the survey. Such time intervals can be con-structed on the basis of reported birth and death dates of children in the survey (the earliest reported date of birth in the 2007 JPFHS was January 1971, and the most recent was September 2007). Table 2 gives an overview of early childhood mortality rates in Jordan by time interval prior to the survey.
In addition to the general time trends, table 2 also differentiates further between mortality rates by age, revealing uneven progress for different age groups. While under-five mortality has declined steadily over the three five-year periods prior to the survey, from 26 to 21 per 1,000 live births, this was mainly owing to similar declines in infant mortality. Child mortality, in contrast, has not moved much over time, hovering around 2 or 3 per 1,000 live births. In turn, the decline in infant mortality seems to have been driven mostly by the decrease in post-neonatal mortality, whereas neonatal mortality rates have not followed a clear time trend.

Child Mortality in Middle-Income Countries: A Case Study of Jordan 5
Given the already low rate of child mortality, the country’s efforts to further reduce under-five mortality rates should focus on infant mortality, and especially on neonatal mortality. With this in mind, we concentrate our analysis in the following sections on the determinants of infant mortality.
3. Data Sources and Explanatory Variables
The dataset
Our analysis is based on data from the 2007 JPFHS carried out by the Department of Statistics of Jordan. The survey is part of the worldwide DHS programme, a project that supports developing countries by
Table 1: Infant and under-five mortality in Jordan and global trends, 1970-2007
Year Mortality rate (global median, mean) Rank (no. of countries)Infant mortality (per 1,000 live births)
1970 74 (79, 86.1) 63 (139)1975 62 (70, 75.9) 72 (158)1980 49 (56, 65.5) 76 (175)1985 39 (47, 56.4) 81 (187)1990 32 (37, 49.8) 89 (195)1995 28 (31, 45.3) 93 (197)2000 25 (27, 40.2) 96 (197)2005 23 (22, 35.0) 101 (197)2007 22 (20, 33.1) 106 (197)
Under-five mortality (per 1,000 live births)
1970 103 (117, 130.7) 63 (139)1975 84 (96, 113.5) 73 (158)1980 64 (73, 96.1) 76 (175)1985 49 (59, 82.1) 82 (187)1990 39 (46, 72.4) 88 (195)1995 33 (37, 65.7) 93 (197)2000 30 (32, 57.9) 96 (197)2005 27 (26, 50.1) 101 (197)2007 26 (24, 54.3) 106 (197)
Source: CME Info (2010); authors’ calculations.
Table 2: Early childhood mortality by five-year intervals preceding JPFHS 2007
Years preceding the survey
Neonatal mortality ratea
Post-neonatal mortality rateb
Infant mortality rate
Child mortality rate
Under-five mortality rate
0-4 14 5 19 2 215-9 16 5 21 3 24
10-14 15 8 23 3 260-9 15 5 20 2 22
Source: Department of Statistics [Jordan] and Macro International Inc. (2008).
a Defined as the number of deaths during the first 28 completed days of life per 1,000 live births.
b Computed as the difference between the infant and neonatal mortality rates.

6 D E S A W o r k i n g P a p e r N o . 1 0 3
providing a standardized framework and technical assistance for the collection, analysis and dissemination of data on population, health, HIV and nutrition.10
The 2007 JPFHS covers a nationally representative sample of 14,564 households and 10,876 ever-married women aged 15-49, with response rates of 99 per cent and 98 per cent, respectively. The sample is designed to produce representative results for the country level, as well as for urban and rural areas, the Badia (desert or semi-desert) and non-Badia areas, the North, Central and South region, and also for all 12 gover-norates. Since the sample allocation is not strictly proportional to each governorate, weights are attributed at the household and at the individual woman level in order to ensure representative estimates.11
Based on a total of 10,876 women interviewed with between 0 and 19 children each, we construct a comprehensive dataset covering the household, maternal and individual characteristics of 43,460 children born between January 1971 and September 2007.
Set of determinants for analysis
Following the analytical framework developed by Mosley and Chen (1984), the literature on infant and child mortality has established a set of individual and socio-economic factors that have been shown to influence the probability of early childhood death. In line with other studies, we group these determinants into three categories (e.g., Vos et al., 2004; Mustafa and Odimegwu, 2008): a child’s personal and biological character-istics, the behavioural characteristics of the child’s mother, and socio-economic household and community characteristics. Annex table A.1 provides a detailed overview of all independent variables that are used in our analysis, and indicates their expected effect on infant mortality.
Personal and biological factors
The personal and biological characteristics included in the study are the infant’s sex, its birth order rank, and whether the infant was born prematurely and/or as part of a multiple delivery. To account for improving health conditions over time, we also include a dummy variable that differentiates between children born in different time intervals before the year of the survey (1971-1987, 1988-1997, 1998-2007).
Since the 2007 JPFHS data do not provide direct information about premature birth, we use birth weight as a proxy, assuming that premature birth is closely correlated with low birth weight. We do this by introducing a dummy for low birth weight with a cut-off value of 2,500 grams, in line with the correspond-ing WHO definition (WHO, 2005). Concerning the effect of birth order on infant mortality, a number of past studies have pointed to a J- or U-shaped effect, with the probability of infant mortality being higher for first born children and for children of birth order four and higher (e.g., Sastry, 1997; Titaley et al., 2008). To account for this in our regression analysis, we construct two dummies, one for first born children, and one for children with birth order four and higher.
Behavioural factors
We include the following behavioural characteristics in our analysis: whether the infant’s mother smokes tobacco; whether delivery took place in a private or public facility; the age of the mother at birth; whether
10 The DHS programme is implemented by Macro International, Inc., and funded by the US Agency for International Development’s (USAID) Bureau for Global Health (BGH).
11 For a detailed description of the sample design and data collection, see the final report by the Department of Statistics, Jordan, and Macro International Inc. (2008).

Child Mortality in Middle-Income Countries: A Case Study of Jordan 7
the preceding birth interval was shorter than the WHO-recommended 24 months between a preceding birth and a new pregnancy (WHO, 2006) (translating into a 33-month interval between consecutive births); and whether the infant has been breastfed for at least six months.12
With regard to smoking, we group consumption of cigarettes and nargila (water pipe) together into one dummy variable. Further, we do not differentiate by the frequency of tobacco consumption, since such information is not available in the JPFHS data.
Concerning the age of the mother, we expect a J- or U-shaped relationship, with a higher probability of mortality for children of very young mothers and for those born to older mothers (e.g., Rutstein, 2000; Uddin and Hossain, 2008). We test for this relationship by grouping mothers by age, defining a dummy for mothers under the age of 20 and one for mothers 30 years of age and older.
Breastfeeding has been recognized as a major determinant of infant and child health. We construct a dummy variable to reflect the WHO recommendation of a minimum of six months of exclusive breast-feeding (WHO, 2003). In order to avoid a possible reverse causation bias, we also include those children as fully breastfed who died before the age of six months but were breastfed up to their time of death (in full months). One drawback is that all cases of neonatal mortality have to be dropped (i.e., when a child dies before completing one month of age) when including the breastfeeding dummy, since data is only available by full months.
Household and community factors
The household and community characteristics included in our analysis are access to safe drinking water, ac-cess to improved sanitation, the geographical and rural/urban location of the household, its socio-economic status, the mother’s education level and the district’s immunization status.
Typically used measurements for socio-economic status are household income or consumption expenditures per capita (e.g., Deaton and Zaidi, 1999). However, as is standard for DHS, the 2007 JPFHS does not include information on either one of these variables. Instead, we use the household wealth factor—routinely included in DHS datasets—to rank households according to their relative socio-economic status.13
We also include household size as a control variable, the effect of which is a priori ambiguous: while a larger number of household members could imply higher fertility levels and a fiercer competition for re-sources, a larger number of potential caregivers—such as elder or unoccupied single women or older siblings living in the household—may in fact decrease the risk of mortality.14
12 We also attempted to include a dummy variable indicating whether the mother had the WTO-recommended minimum of four pre-natal controls (Berg, 1995). However, owing to the limited number of observations (4,591), inclusion of this variable reduced the sample size too much to generate meaningful results, forcing us to drop it from the analysis.
13 Following the principal components approach suggested by Filmer and Pritchett (2001), the household wealth factor is based on information on housing characteristics and assets owned by household members. As a proxy for long-run socio-economic status, such an index has in fact been shown to outperform more traditional income and expenditure measures in terms of explaining differences in health outcomes (Rutstein and Johnson, 2004).
14 Another reason to treat this control variable with some care is the fact that there may be problems of endogeneity, as mortality rates and “replacement” considerations affect fertility decisions and household size. However, while it is a valid concern in high mortality contexts, this effect should not be overemphasized for a middle-income country like Jordan that has already made great progress in reducing child mortality.

8 D E S A W o r k i n g P a p e r N o . 1 0 3
Descriptive statistics
Summary statistics based on the 2007 JPFHS data allow us to differentiate infant and under-five mortality rates according to the determinants that are included in our analysis. While this does not tell us anything about causalities or the exact magnitude of a correlation and its statistical significance, it provides a first overview of the incidence of early childhood mortality in different contexts.
In addition to the mortality rates by factor, table 3 also shows the prevalence of each factor as measured by the percentage of children born during the 10-year period prior to the survey who exhibit this characteristic. All calculations are based on this 10-year period in order to generate a sufficiently large sample size, while at the same time excluding older observations which may not properly reflect current trends. We are not separately reporting mortality rates for variables that can take on many different values such as the mother’s education level in years and the total number of household members. For household wealth, we report summary statistics for different quintiles.
Among the personal and biological factors, there are clear differences in mortality rates according to birth weight (our proxy for premature delivery), multiple deliveries and birth order. As expected, low birth weight is associated with higher infant mortality, as is being part of a multiple delivery. Mortality rates also vary with birth order: infant mortality is highest for children of birth order four or higher and is lowest for children of birth order two or three. While this is in line with other studies on infant mortality, it contrasts with the findings of an earlier study on Jordan by Shakhatreh, Abbas and Issa (1996). Analysing mortality statistics for the period 1980-1990, these authors find that infant mortality rates were lowest for first-born children.
A child’s sex does not seem to be associated with infant mortality, though under-five mortality is slightly higher for girls than for boys. This finding is somewhat surprising, as the consensus in the literature is that girls have a biological advantage, causing higher rates of infant mortality for boys (e.g., Drevenstedt et al., 2008). In fact, we find such a relationship when we look at the entire dataset, including all children born between January 1971 and September 2007 instead of just the 10 years before the survey: While overall infant and under-five mortality are higher during this longer time period—at 23 and 26 per 1,000 live births, respectively (reflecting the improvements that have taken place over the last thirty years)—the infant mortality rate was 20 for girls and 26 for boys, and the under-five mortality was 23 for girls and 29 for boys. This difference in the descriptive statistics over time seems to suggest that boys were the main beneficiaries of the recent improvements in mortality rates.
Among the behavioural determinants, we find meaningful associations for the smoking variable and for breastfeeding, as well as for the length of the preceding birth interval, but not for the type of delivery facility. According to the statistics, infant mortality is much higher if the mother smokes or if the birth interval is short, and it is lower if an infant has been breastfed for at least six months. Against this backdrop, it is important to note that around 11 per cent of children are born to mothers who report smoking. Also, 44 per cent of children are born less than 33 months after the preceding birth and more than 30 per cent are breastfed for less than six months.
Among the household and community characteristics, we observe higher mortality rates among infants and children who lack access to either safe drinking water or improved sanitation facilities. Importantly, while only 2.5 per cent of children are born into households without an improved source of drinking water, 15 per cent lack access to improved sanitation facilities. Concerning the mother’s age at birth, we find the expect-ed U-shaped relation with infant and under-five mortality. Further, we find that above-average immunization

Child Mortality in Middle-Income Countries: A Case Study of Jordan 9
Table 3: Infant and under-five mortality rates by factor, for the 10-year interval preceding JPFHS 2007
Factor
Prevalence (percentage of all children born 10 years prior to survey)
Infant mortality rate (per 1,000 live births)
Under-five mortality rate (per 1,000 live births)
Personal and biological factors
Infant’s/child’s sexMale 51.4% 20 22Female 48.6% 20 23
Premature deliverya
Low birth weight 11.0% 50 n.a.Normal birth weight 89.0% 12 n.a.
Multiple deliveryMultiple birth 3.2% 109 110Single birth 96.8% 17 20
Birth orderFirst born 21.7% 20 22Second or third born 37.7% 18 20Fourth born or higher 40.6% 23 25
Behavioural factors
Mother smokes tobaccoSmokes 10.8% 33 34Does not smoke 89.2% 19 21
Type of delivery facilitya
Private 34.9% (19) n.a.Public 65.1% (18) n.a.
Mother’s age at birthUnder 20 years 6.1% 36 38Between 20 and 29 years 56.4% 17 1930 years and above 37.5% 22 24
Preceding birth intervalLess than 33 months 56.1% 25 2733 months or more 43.9% 17 18
Breastfeedinga
Less than 6 months 31.3% (11) n.a.6 months or more 68.7% (3) n.a.
Household and community factors
Access to drinking waterimproved source 97.5% 20 22non-improved source 2.5% 30 33
Access to sanitation improved 85.1% 19 21non-improved 14.9% 27 31
RegionCentral 61.9% 19 21North 29.1% 21 23South 9.0% 27 32

10 D E S A W o r k i n g P a p e r N o . 1 0 3
coverage within a district is associated with lower mortality, both at the infant and the under-five levels. There are also clear differences in mortality rates according to residence, with lower infant and under-five mortality rates in urban areas, as well as in the Central region. In comparison, mortality rates are higher in the North and highest in the South region. Interestingly, the data show slightly lower mortality rates for the Badia region.
Using wealth quintiles, we find no clear trend for socio-economic status. While mortality rates are highest for the lower two quintiles, they are lowest for the middle quintile, and substantively higher for the upper two quintiles. It is worth noting that the lower quintiles are overrepresented in our sample as poorer households tend to have more children than richer households.
4. Methodology
In the following, we use a standard binomial logit model to analyse the determinants of infant mortality in Jordan. Two factors led us to choose infant mortality as the dependent variable instead of under-five mortal-ity, which is the official MDG indicator: First, as described in section 2 above, the main driver of under-five mortality in Jordan is in fact infant mortality. In order to reduce under-five mortality, it is therefore key to identify the determinants of infant mortality and consider appropriate policy tools for reducing that rate. Second, from a more technical point of view, the estimation of under-five mortality with a standard logit model, based on the 2007 JPFHS data, does not allow us to include important behavioural variables such as breastfeeding. This is owing to the fact that information on breastfeeding is available only for children who are born within the five-year interval before the survey, and the logit model forces us to drop all observations that are not fully at risk—in this case, all children less than five years of age and alive at the time of the sur-vey. Again, since under-five mortality in Jordan is concentrated during the first year of life, we are confident
Table 3 (cont’d)
Factor
Prevalence (percentage of all children born 10 years prior to survey)
Infant mortality rate (per 1,000 live births)
Under-five mortality rate (per 1,000 live births)
Badia areaBadia 8.8% 18 21non-Badia 91.2% 20 23
Urban residenceurban 83.5% 20 22rural 16.5% 23 27
Socio-economic statuslower quintiles 46.4% 23 26middle quintile 20.7% 13 14Higher quintiles 32.9% 20 23
District immunization statusAbove average 58.2% 18 19Below average 41.8% 24 28
Total 20 22
Source: Department of Statistics [Jordan] and Macro International Inc. (2008); authors’ calculations.
Note: Figures for a private versus public delivery facility are reported in parentheses to account for an apparent response bias causing an underreporting of mortality. Mortality figures for breastfeeding are also reported in parentheses as they are significantly biased downwards owing to the omission of neonatal deaths in the breastfeeding variable. “n.a.” signifies not applicable.
a Data is available for only the last five children born to a mother.

Child Mortality in Middle-Income Countries: A Case Study of Jordan 11
that the results of our analysis of the determinants of infant mortality carry over to the analysis of under-five mortality. For control purposes, we also run a separate estimation for under-five mortality (excluding breast-feeding as a determinant). The results broadly confirm this view and are reported in the annex.
In one of our estimations, we focus explicitly on the role of breastfeeding for child health. In this particular case, we use post-neonatal mortality as the dependent variable instead of infant mortality, in order to avoid a possible reverse causation bias (as discussed in subsection 3.B.) To help us better interpret the results of this estimation, we also run a comparative estimation without the breastfeeding variable for post-neonatal mortality. The results of that latter estimation are reported in the annex.
We use a standard binomial logit model, acknowledging that in the literature, empirical studies of infant, child or under-five mortality use either logit/probit models or hazard models such as the semi-parametric Cox Proportional Hazard Model (Cox, 1972).15 Both types of models have specific advantages and disadvantages to be taken into account in the modelling decision. Binary choice models, specifically the logit/probit model, typically entail a censoring problem, as some individuals are not fully exposed to the (mortality) risk. In our sample, this is the case for children under one year of age and alive at the time of the survey—since it is uncertain whether these children will die before reaching their first birthday. A simple way to resolve this issue is by dropping these children from the sample. However, so reducing the sample size necessarily lowers the statistical power of the results.
The Cox Proportional Hazard Model, on the other hand, allows for the inclusion of censored data, making full use of the available case information. It further differs from binary choice models in that it uses the information about an infant’s age in months at time of death, whereas a logit or probit model only focuses on survival to the age of one. However, the Cox model is restrictive in its assumption of proportional hazard functions, meaning that for each covariate, the ratio of hazards must remain the same for any two observations (individuals) over time. If this is not the case for any given covariate, that covariate can only be included in a stratified Cox model, where it is used as a stratification variable and not as a determinant, and no coefficient can be computed for this variable. This is an acceptable way of solving the problem as long as the variable concerned is not of primary interest for the analysis.
In the case of infant mortality, the proportional hazards assumption is typically violated for the covariate “sex of the child”. As discussed above, owing to biological factors, infant boys are prone to a higher mortality risk than infant girls, particularly so during the first few months of life. This leads us to expect a change in the hazard ratio between boys and girls over time.16 We cannot resort to using the child’s sex as a stratifying variable, however, since we are explicitly interested in its effect on the mortality risk given the observed gender bias in Jordan’s human development and mortality indicators.
Based on the above, we prefer a binary choice model over the Cox Proportional Hazard Model. A link test for model specification reveals that the logit model is a better fit than the probit model. We thus proceed with our estimation using the standard binomial logit regression model, as specified below:
Prob( | ) expexp
Y = =+
11
xx'
x'
β
β (1)
15 In their meta-analysis of determinants of child mortality, Charmarbagwala et al. (2004) compare a total of 38 studies, 21 of which use logit/probit techniques and 18 use hazard models (one paper uses both).
16 We ran a Cox Proportional Hazard regression for control purposes, finding that the proportional hazard assumption was indeed violated for the child’s sex, as well as for being part of a multiple delivery and for the mother’s education status. The results of this regression are available from the authors upon request.

12 D E S A W o r k i n g P a p e r N o . 1 0 3
where the probability for the realization of the event Y = 1 (here: child dies before its first birthday), con-ditional on the covariate vector x, is determined by the logistic function of the covariate vector x and the vector of coefficients β.
As covariates, we use the determinants specified above, which are described in detail in annex table A.1. Using the Box-Tidwell test to assess the functional form of all variables, we find that our variable for mother’s education should not enter the regression equation linearly, but in its squared form.
Finally, it is worth noting that we do not use sample weights in our logit estimations, even though the 2007 JPFHS data are stratified along geographic and rural/urban lines. While sample weights are re-quired for obtaining unbiased estimators of means and other indicators for descriptive statistics purposes, we follow the argumentation in Wooldridge (2002) and O’Donnell et al. (2008) that, when it comes to the econometric analysis of causal relationships, unweighted estimators are consistent and more efficient than their weighted counterparts. This is the case provided that the source of the differences between the sample and the population proportions is not driven by the variable of interest, in this case infant mortality. Assuming that infant mortality does not strongly influence the choice of geographic residence, we therefore prefer the use of unweighted estimators.
5. Results
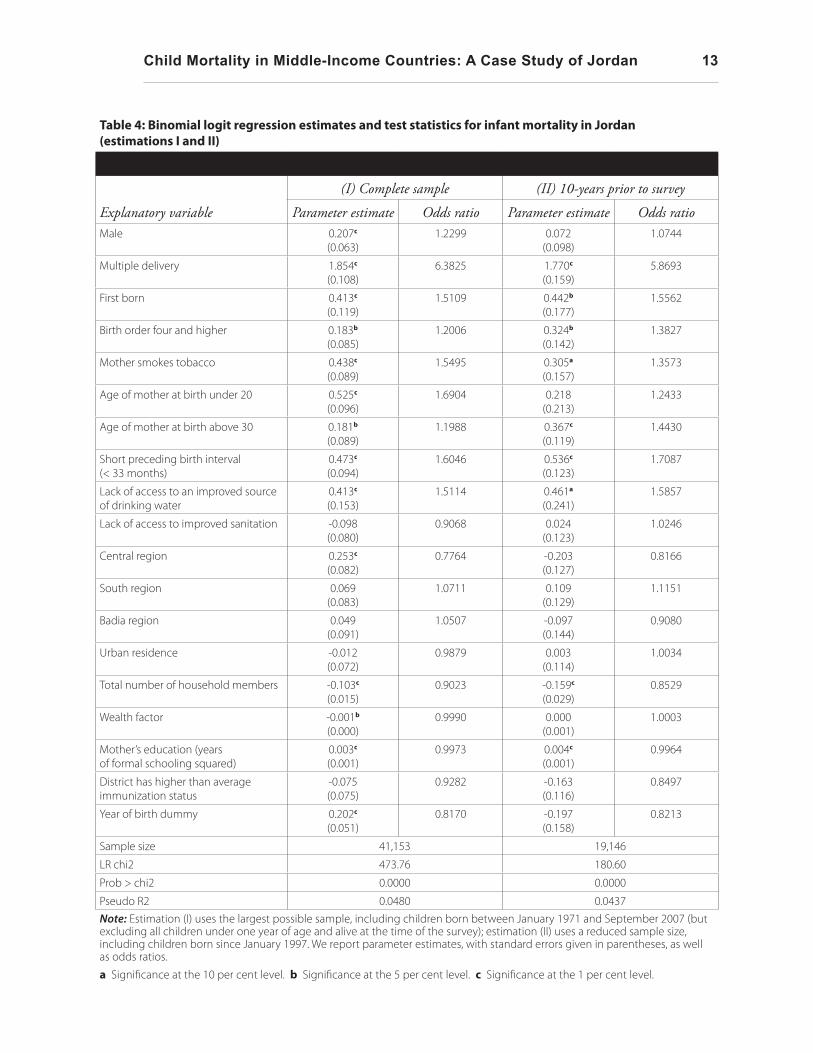
We report on four different estimations for infant mortality. In estimation (I) in table 4, we include those variables with only a complete set of observations in order to maximize the sample size and hence the robustness of our results. This estimation captures the relation between infant mortality and its determinants for children born between January 1971 and September 2007. In estimation (II) in table 4, we use the same set of variables, but include only the children that were born during the 10-year period prior to the survey, thereby reducing the sample size by about one half (from 41,153 to 19,146). This sample is identical to the one used for the descriptive statistics in table 3. In estimations (III) and (IV) in table 5, we include additional potentially important determinants, mainly behavioural factors, for which fewer observations are available. Estimation (III) is based on the full set of variables from estimations (I) and (II), with premature delivery and type of delivery facility (public or private) as additional determinants. As is the case with the breastfeeding variable, information on these two variables is available only for children who are born within the five-year interval before the survey, thus further reducing the sample size to 8,112. Finally, in estimation (IV), we include information about whether the infant was breastfed for at least six months, while dropping most of the variables that were insignificant in estimation (III). As discussed above, by including breastfeed-ing, we are also obliged to drop all cases of neonatal mortality, i.e., when a child dies before completing one month of age. For comparison, we also rerun estimation (I) with post-neonatal mortality as the dependent variable. The results of that estimation are reported in annex table A.3.
Our models fit the data relatively well, as indicated by the Hosmer-Lemeshow goodness-of-fit-tests and by large proportions of correct classifications.17 The regression diagnostics do not signal any problems of multicollinearity, and the large dataset ensures that our results are robust to the exclusion of outliers.18
17 The p-values associated with the Hosmer-Lemeshow tests range from 0.18 to 0.67, while the proportion of correctly classified cases is above 97 per cent in all four estimations.
18 To avoid biases in our estimators, we tested for pairwise correlation between all determinants. We also followed the suggestion by Berry and Feldman (1985) to regress the determinants against each other to identify correlation. However, we did not find strong correlations between any of our determinants.
Child Mortality in Middle-Income Countries: A Case Study of Jordan 13
Table 4: Binomial logit regression estimates and test statistics for infant mortality in Jordan (estimations I and II)
Explanatory variable
(I) Complete sample (II) 10-years prior to survey
Parameter estimate Odds ratio Parameter estimate Odds ratioMale 0.207c
(0.063)1.2299 0.072
(0.098)1.0744
Multiple delivery 1.854c (0.108)
6.3825 1.770c (0.159)
5.8693
First born 0.413c (0.119)
1.5109 0.442b (0.177)
1.5562
Birth order four and higher 0.183b (0.085)
1.2006 0.324b (0.142)
1.3827
Mother smokes tobacco 0.438c (0.089)
1.5495 0.305a (0.157)
1.3573
Age of mother at birth under 20 0.525c (0.096)
1.6904 0.218 (0.213)
1.2433
Age of mother at birth above 30 0.181b (0.089)
1.1988 0.367c (0.119)
1.4430
Short preceding birth interval (< 33 months)
0.473c (0.094)
1.6046 0.536c (0.123)
1.7087
Lack of access to an improved source of drinking water
0.413c (0.153)
1.5114 0.461a (0.241)
1.5857
Lack of access to improved sanitation -0.098 (0.080)
0.9068 0.024 (0.123)
1.0246
Central region 0.253c (0.082)
0.7764 -0.203 (0.127)
0.8166
South region 0.069 (0.083)
1.0711 0.109 (0.129)
1.1151
Badia region 0.049 (0.091)
1.0507 -0.097 (0.144)
0.9080
Urban residence -0.012 (0.072)
0.9879 0.003 (0.114)
1.0034
Total number of household members -0.103c (0.015)
0.9023 -0.159c (0.029)
0.8529
Wealth factor -0.001b (0.000)
0.9990 0.000 (0.001)
1.0003
Mother’s education (years of formal schooling squared)
0.003c (0.001)
0.9973 0.004c (0.001)
0.9964
District has higher than average immunization status
-0.075 (0.075)
0.9282 -0.163 (0.116)
0.8497
Year of birth dummy 0.202c (0.051)
0.8170 -0.197 (0.158)
0.8213
Sample size 41,153 19,146
LR chi2 473.76 180.60
Prob > chi2 0.0000 0.0000
Pseudo R2 0.0480 0.0437Note: Estimation (I) uses the largest possible sample, including children born between January 1971 and September 2007 (but excluding all children under one year of age and alive at the time of the survey); estimation (II) uses a reduced sample size, including children born since January 1997. We report parameter estimates, with standard errors given in parentheses, as well as odds ratios.
a Significance at the 10 per cent level. b Significance at the 5 per cent level. c Significance at the 1 per cent level.

14 D E S A W o r k i n g P a p e r N o . 1 0 3
Table 5: Binomial logit regression estimates and test statistics for infant mortality in Jordan (estimations III and IV)
Explanatory variable
(III) (IV)
Parameter estimate Odds ratio Parameter estimate Odds ratioMale -0.037
(0.170)0.9637 -0.588a
(0.314)0.5554
Multiple delivery 1.552c (0.283)
4.7211 -0.762 (1.039)
0.4669
First born 0.110 (0.308)
1.1157 0.027 (0.575)
1.0269
Birth order four and higher 0.418a (0.248)
1.5194 0.464 (0.434)
1.5908
Mother smokes tobacco 0.205 (0.283)
1.2274
Age of mother at birth under 20 0.325 (0.381)
1.3836 0.320 (0.657)
1.3777
Age of mother at birth above 30 0.480b (0.208)
1.6158 0.592 (0.363)
1.8077
Short preceding birth interval (< 33 months)
0.664c (0.210)
1.9431 0.727a (0.378)
2.0694
Lack of access to an improved source of drinking water
0.365 (0.436)
1.4412
Lack of access to improved sanitation 0.149 (0.211)
1.1612
Central region -0.145 (0.216)
0.8650
South region -0.017 (0.232)
0.9834
Badia region -0.264 (0.255)
0.7677
Urban residence -0.182 (0.199)
0.8339
Total number of household members -0.259c (0.059)
0.7720 -0.200b (0.097)
0.8191
Wealth factor 0.003b (0.001)
1.0026 -0.000 (0.002)
0.9996
Mother’s education (years of formal schooling squared)
-0.004c (0.001)
0.9958 -0.006b (0.003)
0.9941
District has higher than average immunization status
-0.011 (0.197)
0.9886
Premature delivery 1.114c (0.190)
3.0470 0.791b (0.339)
2.2049
Private delivery facility -0.042 (0.229)
0.9593 -0.139 (0.420)
0.8706
Breastfeeding <6 months 1.366c (0.308)
3.9207
Sample size 8,112 7,997LR chi2 113.35 49.26Prob > chi2 0.0000 0.0000Pseudo R2 0.0775 0.0886Note: Estimation (I) uses the largest possible sample, including children born between January 1971 and September 2007 (but excluding all children under one year of age and alive at the time of the survey); estimation (II) uses a reduced sample size, including children born since January 1997. We report parameter estimates, with standard errors given in parentheses, as well as odds ratios.
a Significance at the 10 per cent level. b Significance at the 5 per cent level. c Significance at the 1 per cent level.

Child Mortality in Middle-Income Countries: A Case Study of Jordan 15
Behavioural factors
Compared to older studies on infant and child mortality in Jordan (Adlahka and Suchindran, 1985; ESCWA, 1991; Shakhatreh, Abbas and Issa, 1996), we find a significant shift away from standard household and community factors, including infrastructure and health-care services, as the main determinants of mortality risk. In turn, the inclusion of more behavioural factors allows us to trace a number of “emerging” determinants that seem to have gained importance as Jordan has achieved higher development status and lower infant and child mortality rates. In this vein, our estimation results suggest that variables related to the behaviour of the child’s mother have a significant and often large effect on infant mortality in Jordan and should thus be at the centre of future policy interventions: A short preceding birth interval, being born to a mother who smokes, and lack of breastfeeding all substantially increase a child’s risk of dying before its first birthday.
In line with results by Adlahka and Suchindran (1985) and Shakhatreh, Abbas and Issa (1996), the birth interval variable is highly significant in each of our specifications, with odds ratios of 1.60 and 1.71 in estimations (I) and (II), respectively. This means that—all else being equal—children born after a birth interval of less than 33 months have around 1.7 times the odds of dying before their first birthday compared to children born after a longer interval. While the proportion of children born less than 33 months after the preceding birth has declined somewhat over the last three decades, it was still over 50 per cent during the 10 years prior to the survey (see table 3). An expansion of birth-spacing initiatives may therefore still be a powerful tool for further reducing child mortality.
For the mother’s age at birth, we find the expected U-shaped relationship in our basic estimation (I), with higher risks of infant mortality of children born to mothers under 20 years and mothers over 30 years old. Interestingly, the picture changes when we focus on more recent time periods in estimations (II) and (III) (10 years and 5 years prior to the survey, respectively). In both of these samples, the impact of being born to an older mother remains significant at the 5 per cent level while the effect of being born to a very young mother becomes insignificant. The latter finding contrasts directly with earlier results by Shakhatreh, Abbas and Issa (1996), who find that the impact of being born to a younger mother is significant, but the impact of being born to an older mother is not. We interpret our results against the backdrop of an underly-ing change in behavioural patterns during the past three decades, with a relative reduction in the numbers of very young mothers and a relative increase in the number of older mothers. In fact, a mother’s mean age has risen from 26 years in the whole sample (1971-2007) to 28 years in the 10-year period before the survey. At the same time, the share of mothers under the age of 20 has declined from 10.8 per cent to only 6.1 per cent. This small share of very young mothers, combined with the reduced sample size in the 10-year period before the survey, results in a larger standard error in estimation (II), rendering the estimated coefficient for the effect of being born to a younger mother statistically insignificant. In view of this trend, we also conclude that the change in the behavioural patterns away from very young motherhood is likely to have contributed to the observed decrease in Jordan’s infant and child mortality.
Going beyond the above-cited earlier studies on infant and child mortality in Jordan, we also include smoking as an additional behavioural variable, to account for the impact of a mother’s tobacco consumption on infant mortality. As one might expect, we find that being born to a mother who smokes increases a child’s mortality risk significantly.19 In fact, the child of a mother who smokes has 1.55 times the
19 This is the case for estimations (I) and (II). As the sample size decreases drastically for estimation (III), the smoking variable maintains its sign but loses significance (owing to large standard errors).
16 D E S A W o r k i n g P a p e r N o . 1 0 3
odds of dying before its first birthday compared to a child of a non-smoking mother, according to estimation (I) (and 1.36 according to estimation (II)). This is particularly noteworthy as during the 10 years prior to the survey, about 11 per cent of the children were born to mothers who smoke (see table 3). These numbers are broadly in line with recent WHO estimates which indicate that about 10 per cent of Jordanian women smoke some form of tobacco (WHO, 2008). While this figure is low compared to much of the Western world, it is high for an Arab country, and recent trends show that tobacco consumption in its various forms (smoked and smokeless) has been on the rise among the young, particularly among girls. According to WHO, a total of 30.3 per cent of Jordanian youth aged 13-15 use some form of tobacco, including 33.7 per cent of boys and 26.1 per cent of girls.20 While Jordan has a long history of anti-smoking legislation, and Jordanian authorities have recently strengthened enforcement mechanisms as well as legislation, smok-ing still remains an accepted social behaviour.21 Against this background, and in view of our results on infant mortality, more needs to be done to discourage tobacco consumption, particularly by girls and young women. Public awareness programmes, including school campaigns like those currently implemented by the Jordanian Ministry of Health, the Education Ministry and local NGOs, are a step in the right direction, and should be rolled out more broadly at a national level.
Finally, we find that insufficient breastfeeding has a strong and highly statistically significant effect on increasing post-neonatal mortality (estimation (IV)). The odds of dying between the first month and the first birthday are 3.93 times greater for children who have not, or have not fully, been breastfed compared to children who have been breastfed for at least six months. While this has been an established fact in the litera-ture, it is particularly relevant in Jordan, given that during the 10-year period before the survey more than 30 per cent of all children were breastfed for less than the six months recommended by the WHO (see table 3). A recent report on child and maternal nutrition paints an even bleaker picture of breastfeeding behaviour in Jordan (UNICEF, 2009): According to the latest data only 22 per cent of children were exclusively breastfed during the first six months of their lives, well below the average for the developing world, which was estimat-ed at 37 per cent in 2008. Against this backdrop, government agencies should support measures to facilitate breastfeeding, in addition to further increasing their efforts to advertise its benefits.
Personal and biological factors
Our estimation results confirm the importance of several standard personal and biological factors for infant mortality, including being born prematurely, being part of a multiple delivery and having a higher birth order.
As expected, if a child has a birth weight of less than 2,500 grams—our proxy for premature delivery—or is part of a multiple delivery, it has a much higher probability of dying before its first birthday. The respective odds ratios in estimation (III) are 3.04 and 4.72.22 In line with other studies, we also find that infant mortality is highest for children with birth order four or higher, while it is lowest for children with birth order two or three.
20 Cigarette consumption among the young is much lower, at 13.2 per cent for boys and 7.1 per cent for girls aged 13-15, indicating a revival of traditional forms of tobacco consumption such as the water pipe.
21 For an overview of tobacco control measures in Jordan, see Belbeisi et al. (2009). 22 In estimation (IV), the dummy for multiple delivery loses its significance as information about breastfeeding is
included. This can be attributed to the fact that most of those children who are part of a multiple delivery and who do not live to their first birthday die within the first 30 days of their lives—and are therefore dropped from the sample in estimation (IV).

Child Mortality in Middle-Income Countries: A Case Study of Jordan 17
A more striking result is our finding on the relationship between an infant’s sex and its mortality risk, where based on standard results in the literature we would expect boys to display a higher risk of infant mortality than girls. In fact, we find the expected relationship to be significant in estimation (I), which covers the period from 1971 to 2007, with an odds ratio of 1.23.23 In stark contrast, this relationship disap-pears in estimation (II), covering the shorter interval of the last 10 years before the survey, where we find no statistical significance and an odds ratio close to 1. Taken together with the descriptive statistics results discussed in subsection 3.C, we interpret this finding to suggest preferential treatment of boys over girls. As access to health care and preventive medicine improved and infant mortality declined, a historic cultural preference for boys over girls seems to have caused boys to benefit relatively more from these developments. Lamentably, such a relationship is not uncommon in countries at intermediate development levels, as docu-mented by Fuse and Crenshaw (2006). Thus, the lack of significance of the variable in estimation (II) points to a distortion in the mortality risk by sex, and should alert policymakers to the need for greater action to promote the health and well-being of the girl child.
Household and Community Factors
The three earlier empirical studies of infant and child mortality in Jordan cited above found several house-hold and community factors to be associated with infant mortality, most importantly the area of residence (rural or urban) and the mother’s education level. Our results confirm the relevance of mother’s education, which is significant in all four estimations (although the average effect of one additional year of schooling seems to be small). We take this as an indication of the progress Jordan has made during the past few decades in improving girl’s access to primary and secondary education.
In contrast to these earlier studies, our results suggest that the area of residence is no longer a key de-terminant. Urban residence and residence outside the Badia region do not have a significant effect in any of our estimations. Residence in the Central region, which includes the capital Amman, has a positive impact on infant mortality in estimation (I), which covers the period from 1971 to 2007, but this effect does not carry over to estimation (II), covering only the last 10 years before the survey. We interpret this development as a likely outcome of improved overall access to health facilities, as discussed in subsection 2.B. Another indicator of improved access to health care and preventive medicine is the lack of significance of a district’s immunization status as a determinant of infant mortality. This has evolved against the backdrop of successful vaccination campaigns in the past which have led to high overall vaccination coverage.24
Similarly, household wealth seems to have become less important for infant mortality, in line with the overall improvement in access to health care. While the wealth factor is significant in estimation (I) and the sign is as expected, its quantitative impact is extremely low. In estimation (II), covering the shorter interval of the last 10 years before the survey, it loses significance altogether. This result points to an overall positive effect of development gains over time, and particularly of the improved access to and increased qual-ity of public health care. This result is supported by the fact that the choice of delivery facility (public versus private) does not have a significant impact on mortality, as evidenced in estimations (III) and (IV).
23 As shown in annex table A.3, which repeats estimation (I) for post-neonatal mortality as the dependent variable, there is no statistically significant relationship between an infant’s sex and post-neonatal mortality. This implies that the higher risk of boys’ dying before reaching their first birthday that is apparent in estimation (I) is primarily the result of a higher neonatal mortality risk.
24 For details on Jordan’s vaccination coverage, see Department of Statistics [Jordan] and Macro International Inc. (2008), pp. 116-123.

18 D E S A W o r k i n g P a p e r N o . 1 0 3
While the impact of many “standard” determinants of infant mortality from the group of household and community factors has thus declined or even disappeared, we still find that access to safe drinking water remains an important factor. Our results suggest that in spite of the overall vastly improved access to safe drinking water in Jordan, lack of access still greatly increases the risk of infant mortality. The variable is sig-nificant, with odds ratios of 1.51 and 1.59 in estimations (I) and (II), respectively. While only 2.5 per cent of children were affected by a lack of access to safe drinking water in the 10 years prior to the survey, this result underlines the importance of universal access in order to make further progress in reducing infant mortality. Meanwhile, we do not find any significant effects of lack of access to improved sanitation.
Lastly, we find that a larger number of household members decreases the risk of infant mortality, possibly pointing towards a beneficial effect of a larger number of caregivers.
6. Conclusion
Jordan has made great strides over the past four decades in lowering infant and under-five mortality. However, the recent rate of progress has been slower than in many other middle-income countries, and the gap with developed countries remains large. Additional efforts are therefore required to further improve child health outcomes and allow the country to achieve international development goals.
The objective of this study was to re-examine the main determinants of infant and under-five mortality, and to inform the national policy debate in Jordan. Our results are also likely to be relevant for countries at a similar stage of development that face challenges in improving child health conditions. Previous empirical work on infant and under-five mortality in Jordan, carried out between 1985 and 1996, emphasized the importance of household and community factors for child health, most notably the area of residence (rural or urban) and the mother’s education level. Our results suggest that these factors play a lesser role today, as overall access to health facilities as well as girls’ access to primary and secondary education have improved substantially over recent decades. Instead, what seems to matter most for infant and under-five mortality at this juncture are factors related to the behaviour of the child’s mother. According to our find-ings, a short preceding birth interval, being born to a mother who smokes and lack of breastfeeding all have a significant and robust effect on child health. These factors should thus be at the centre of future policy interventions. Public awareness campaigns, such as those already put in place by the Jordanian Government against smoking, could be tailored to the specific target audience of young women and mothers who smoke, and similar campaigns could be implemented for family planning (in terms of birth spacing) and the ben-efits of breastfeeding. If applied in a sustained and well-targeted fashion with broad geographical and social outreach, such campaigns have the potential to be a cost-effective and powerful tool in combating infant and under-five mortality.
Our results also indicate that boys in Jordan have benefited relatively more from the improvements in health care than girls. To the extent that this uneven progress is the result of a cultural preference for boys, a renewed push for the protection of the rights of the girl child can be expected to yield further reductions in infant mortality.

Child Mortality in Middle-Income Countries: A Case Study of Jordan 19
ReferencesAdlakha, Arjun L., and Chirayath. M. Suchindran (1985). Factors affecting infant and child mortality. Journal of Biosocial Science,
vol. 17, pp. 481-496.
Ajluni, Musa T. (2006). Social determinants of health. World Health Organization, Eastern Mediterranean Regional Office (EMRO). Amman, Jordan.
Al-Qutob, Ra’eda (1994). Towards family planning policy in Jordan. Working Paper No.9, United Nations Population Fund (UNFPA) Country Support Team for the Arab States. Amman, Jordan.
Belbeisi, Adel, and others (2009). A surveillance summary of smoking and review of tobacco control in Jordan. Globalization and Health vol. 5 (2009), p. 18.
Berg, Cynthia (1995). Prenatal care in developing countries: the World Health Organization technical working group on antenatal care. Journal of the American Medical Women’s Association, vol. 50, No. 5, pp. 182-186.
Berry, William D., and Stanley Feldman (1985). Multiple Regression in Practice. Beverly Hills, CA: Sage Publications.
Charmarbagwala, Rubiana, and others (2004). The determinants of child health and nutrition: A meta-analysis. International Evaluation Group Working Paper. Washington, D. C.: The World Bank.
CME Info (2010). Database on Child Mortality Estimates. Inter-agency Group for Child Mortality Estimation. Available from http://www.childmortality.org/cmeMain.html (accessed on 5 November 2010).
Cox, David R. (1972). Regression models and life tables. Series B (Methodological). Journal of the Royal Statistical Society, vol. 34, No. 2, pp. 187-220.
Deaton, Angus, and Salman Zaidi (1999). Guidelines for constructing consumption aggregates for welfare analysis. Working Paper No. 217, Woodrow Wilson School of Public and International Affairs, Research Program in Development Studies, Princeton University, Princeton, New Jersey.
Department of Statistics (Jordan) and Macro International Inc. (2008). Jordan: Population and Family Health Survey 2007. Calverton, Maryland.
Drevenstedt, Greg, and others (2008). The rise and fall of excess male infant mortality. Proceedings of the National Academy of Sciences of the United States of America, vol. 105, pp. 5016-5021.
ESCWA (1991). Socio-economic differentials in child mortality: the case of Jordan. Population Bulletin ESCWA, vols. 38-39, pp. 79-120. Beirut, Lebanon: United Nations Economic and Social Commission for Western Asia.
Filmer, Deon, and Lant Pritchett (2001). Estimating wealth effects without expenditure data – or tears. An application to educational enrollments in States of India. Demography, vol. 38, No. 1, pp. 115-132.
Fuse, Kana, and Edward M. Crenshaw (2006). Gender imbalance in infant mortality: A cross-national study of social structure and female infanticide. Social Science and Medicine, vol. 62, pp. 360-374.
Inter-agency Group for Child Mortality Estimation Report (2010). Levels and trends in child mortality. New York: United Nations Children’s Fund (UNICEF). Available from http://www.childmortality.org/stock/documents/Child_Mortality_Report_2010.pdf.
Jurdi, Rozzet (2008). Unintended pregnancies remain high in Jordan. MENA working paper series. Population Reference Bureau, Cairo.
Ministry of Health of Jordan (2009). Annual Statistical Book 2009. Available from http://www.moh.gov.jo.
Mosley, Henry W., and Lincoln C. Chen (1984). An analytical framework for the study of child survival in developing countries. Population and Development Review, supplement to vol. 10, pp. 25-45.
Mustafa, Hisham E., and Clifford Odimegwu (2008). Socioeconomic determinants of infant mortality in Kenya: Analysis of Kenya DHS 2003. Journal of Humanities and Social Sciences, vol. 2, No. 2, pp. 1-16.
National Population Commission (2000). The updated national population strategy: concepts, foundation, and goals 2000-2020. Amman, Jordan. Available from http://www.policyproject.com/pubs/countryreports/Jordan_NPS.pdf.
O’Donnell, Owen, and others (2008). Analysing health equity using household survey data: a guide to techniques and their implementation. Washington, D. C.: The World Bank.
Preston, Samuel H. (1996). Population studies of mortality. Population Studies, vol. 50, No. 3, pp. 525-536.
Rutstein, Shea (2000). Factors associated with trends in infant and child mortality in developing countries during the 1990s. Bulletin of the World Health Organization, vol. 78, No. 10, pp. 1256-1270.
Rutstein, Shea O., and Kiersten Johnson (2004). The DHS Wealth Index. DHS Comparative Reports No. 6. Calverton, Maryland. ORC Macro.
20 D E S A W o r k i n g P a p e r N o . 1 0 3
Sastry, Narayan (1997). Family-level clustering of childhood mortality risk in Northeast Brazil. Population Studies, vol. 51, No. 3, pp. 245-261.
Shakhatreh, Farouk M. N., Adnan A.H. Abbas and Abdalah A. Issa (1996). Determinants of infant mortality and the use of maternity services in Jordan. Dirasat. medical and biological sciences, vol. 23, No. 2, pp. 59-69.
Titaley, Christiana R., and others (2008). Determinants of neonatal mortality in Indonesia. BMC Public Health, vol. 8, No. 1, p. 232.
Uddin, Jamal, and Zakir Hossain (2008). Predictors of infant mortality in a developing country. Asian Journal of Epidemiology, vol. 1, No. 1, pp. 1-16.
UNDP (2008). Human Development Report 2007/08: Fighting climate change: Human Solidarity in a Divided World. New York: United Nations Development Programme. Available from http://hdr.undp.org/en/reports/global/hdr2007-2008/.
UNDP (2009). Human Development Report 2009: Overcoming barriers: Human mobility and development. New York: United Nations Development Programme. Available from http://hdr.undp.org/en/reports/global/hdr2009/.
UNICEF (2009). Tracking progress on child and maternal nutrition. New York: United Nations Children’s Fund. Available from http://www.unicef.pt/docs/Progress_on_Child_and_Maternal_Nutrition_EN_110309.pdf.
Vos, Rob, and others (2004). Health. In Ecuador: Creating Fiscal Space for Poverty Reduction. A Fiscal Management and Public Expenditure Review, vol. II, Report No. 28911-EC. Washington D. C.: The World Bank and Inter-American Development Bank.
WHO (2003). Global strategy for infant and young child feeding. Geneva: World Health Organization.
WHO (2005). World Health Report 2005: Make every mother and child count. Geneva: World Health Organization. Available from http://www.who.int/whr/2005/whr2005_en.pdf.
WHO (2006). Report of a WHO technical consultation on birth spacing. Geneva: World Health Organization.
WHO (2008). Report on the global tobacco epidemic, 2008: The MPOWER package. Geneva: World Health Organization.
Wolpin, Kenneth I. (1997). Determinants and consequences of the mortality and health of infants and children. In Handbook of Population and Family Economics, Mark R. Rosenzweig and Oded Stark, eds. Amsterdam: Elsevier.
Wooldridge, Jeffrey M. (2002). Econometric Analysis of Cross Section and Panel Data. Cambridge, MA: MIT Press.

Child Mortality in Middle-Income Countries: A Case Study of Jordan 21
ANNEX
Table A.1: Determinants of infant and under-five mortality
Determinant Expected effect on mortality Type of variablePersonal and biological factors
Infant’s/child’s sex Increased risk of infant mortality of boys
Dummy variable with the value 1 if the child is male and 0 if it is female. Complete range of observations.
Premature delivery Increased risk of infant and under-five mortality of premature/underweight newborns
Dummy variable with the value 1 if the child’s weight at birth is below 2,500 grams and 0 if it is above. Only 10,272 observations.
Multiple delivery Increased risk of infant and under-five mortality of children that are born as part of a multiple delivery
Dummy variable with the value 1 if the child is part of a multiple delivery and 0 otherwise. Complete range of observations.
Birth order U-shaped effect on infant and under-five mortality
Two dummy variables: (i) “first born” takes on the value 1 if the child is the first born and 0 otherwise; (ii) “birth order four and higher” takes on the value 1 if the child is of birth order 4 or higher and 0 otherwise. Complete range of observations.
Behavioural factors
Mother smokes tobacco Increased risk of infant and under-five mortality if mother smokes
Dummy variable with the value 1 if the mother smokes tobacco and 0 if she does not. Complete range of observations.
Use of private/ public health care
Ambiguous Dummy variable with the value 1 if delivery takes place in a private facility and 0 otherwise. Only 10,424 observations.
Age of mother at birth U-shaped effect on infant and under-five mortality
Two dummy variables: (i) “age of mother at birth under 20” takes on the value 1 if the mother is less than 20 years old at time of birth and 0 otherwise; (ii) “age of mother at birth above 30” takes on the value 1 if the mother is 30 years or older at time of birth and 0 otherwise. Complete range of observations.
Preceding birth interval Increased risk of infant and under-five mortality if the preceding birth interval is less than 33 months
Dummy variable with the value 1 if the preceding birth interval is less than 33 months and 0 otherwise. Only 33,404 observations.
Breastfeeding Increased risk of infant and under-five mortality if breastfeeding is insufficient
Dummy variable with the value 1 if the child has been breastfed for less than 6 months (unless the child died before six months of age and was breastfed until then) and 0 otherwise. Only 10,263 observations (excluding all cases of neonatal mortality, as discussed in the text).
Household and community factors
Safe drinking water Increased risk of infant and under-five mortality if household lacks access to safe drinking water
Dummy variable with the value 1 if a household does not have access to an improved source of drinking water and 0 if it does.a Complete range of observations.
Improved sanitation Increased risk of infant and under-five mortality if household lacks access to improved sanitation facilities
Dummy variable with the value 1 if a household does not have access to improved sanitation facilities and 0 if it does.b Complete range of observations.
Region of residence Decreased risk of infant and under-five mortality in Central region (including the capital, Amman) as compared to the North and South regions.
Two dummy variables: (i) “Central region” takes on the value 1 if the household is located in the central region and 0 otherwise; (ii) “South region” takes on the value 1 if the household is located in the South region. Complete range of observations.c
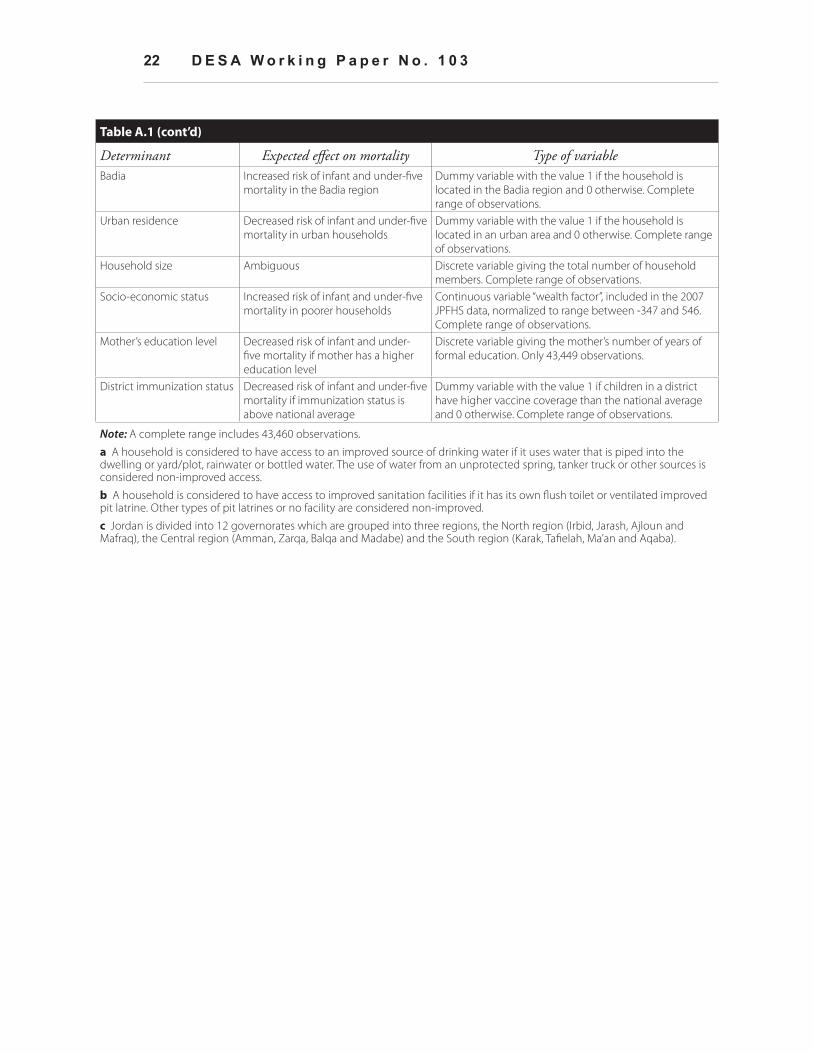
22 D E S A W o r k i n g P a p e r N o . 1 0 3
Table A.1 (cont’d)
Determinant Expected effect on mortality Type of variableBadia Increased risk of infant and under-five
mortality in the Badia regionDummy variable with the value 1 if the household is located in the Badia region and 0 otherwise. Complete range of observations.
Urban residence Decreased risk of infant and under-five mortality in urban households
Dummy variable with the value 1 if the household is located in an urban area and 0 otherwise. Complete range of observations.
Household size Ambiguous Discrete variable giving the total number of household members. Complete range of observations.
Socio-economic status Increased risk of infant and under-five mortality in poorer households
Continuous variable “wealth factor”, included in the 2007 JPFHS data, normalized to range between -347 and 546. Complete range of observations.
Mother’s education level Decreased risk of infant and under-five mortality if mother has a higher education level
Discrete variable giving the mother’s number of years of formal education. Only 43,449 observations.
District immunization status Decreased risk of infant and under-five mortality if immunization status is above national average
Dummy variable with the value 1 if children in a district have higher vaccine coverage than the national average and 0 otherwise. Complete range of observations.
Note: A complete range includes 43,460 observations.
a A household is considered to have access to an improved source of drinking water if it uses water that is piped into the dwelling or yard/plot, rainwater or bottled water. The use of water from an unprotected spring, tanker truck or other sources is considered non-improved access.
b A household is considered to have access to improved sanitation facilities if it has its own flush toilet or ventilated improved pit latrine. Other types of pit latrines or no facility are considered non-improved.
c Jordan is divided into 12 governorates which are grouped into three regions, the North region (Irbid, Jarash, Ajloun and Mafraq), the Central region (Amman, Zarqa, Balqa and Madabe) and the South region (Karak, Tafielah, Ma’an and Aqaba).

Child Mortality in Middle-Income Countries: A Case Study of Jordan 23
Table A.2: Binomial logit regression estimates and test statistics for under-five mortality in Jordan
Parameter estimate Odds ratioMale 0.163c
(0.060)1.1771
Multiple delivery 1.730c (0.108)
5.6403
First born 0.307c (0.112)
1.3587
Birth order four and higher 0.151a (0.080)
1.1630
Mother smokes tobacco 0.382c (0.084)
1.4651
Age of mother at birth under 20 0.529c (0.091)
1.6974
Age of mother at birth above 30 0.251c (0.083)
1.2851
Short preceding birth interval (< 33 months) 0.410c (0.087)
1.5071
Lack of access to an improved source of drinking water 0.520c (0.140)
1.6823
Lack of access to improved sanitation -0.091 (0.075)
0.9134
Central region -0.264c (0.077)
0.7680
South region 0.071 (0.078)
1.0740
Badia region 0.026 (0.087)
1.0259
Urban residence -0.055 (0.068)
0.9463
Total number of household members -0.138c (0.015)
0.8715
Wealth factor -0.001c (0.000)
0.9988
Mother’s education (years of formal schooling squared) -0.002c (0.001)
0.9977
District has higher than average immunization status -0.079 (0.070)
0.9244
Year of birth dummy 0.096a (0.049)
1.1003
Sample size 33,105LR chi2 470.62Prob > chi2 0.0000Pseudo R2 0.0453Note: The estimation uses the largest possible sample, including children born between January 1971 and September 2007 (but excluding all children under five years of age and alive at the time of the survey). We report parameter estimates, with standard errors given in parentheses, as well as odds ratios.
a Significance at the 10 per cent level. b Significance at the 5 per cent level. c Significance at the 1 per cent level.

24 D E S A W o r k i n g P a p e r N o . 1 0 3
Table A.3: Binomial logit regression estimates and test statistics for post-neonatal mortality in Jordan (complete sample)
Parameter estimate Odds ratioMale 0.078
(0.0995)1.0818
Multiple delivery 1.260c
(0.210)3.5268
First born 0.251 (0.199)
1.2849
Birth order four and higher 0.234a
(0.132)1.2638
Mother smokes tobacco 0.566c
(0.133)1.7606
Age of mother at birth under 20 0.647c
(0.148)1.9102
Age of mother at birth above 30 0.169 (0.143)
1.1846
Short preceding birth interval (< 33 months) 0.594c
(0.155)1.8120
Lack of access to an improved source of drinking water 0.617c
(0.210)1.8528
Lack of access to improved sanitation 0.008 (0.121)
1.0078
Central region -0.105 (0.126)
0.9006
South region -0.084 (0131)
0.9193
Badia region 0.003 (0.142)
1.0027
Urban residence -0.055 (0.113)
0.9468
Total number of household members -0.109c
(0.023)0.8968
Wealth factor -0.002c
(0.001)0.9975
Mother’s education (years of formal schooling squared) -0.003c
(0.001)0.9967
District has higher than average immunization status -0.160 (0.117)
0.8517
Year of birth dummy -0.369c
(0.080)0.6918
Sample size 33,105LR chi2 470.62Prob > chi2 0.0000Pseudo R2 0.0453Note: The estimation uses the largest possible sample, including children born between January 1971 and September 2007 (but excluding all children under five years of age and alive at the time of the survey). We report parameter estimates, with standard errors given in parentheses, as well as odds ratios.
a Significance at the 10 per cent level. b Significance at the 5 per cent level. c Significance at the 1 per cent level.