Soccer Guru - University of California,...
37
Soccer Guru Final Report INFO247: Information Visualization and Presentation UC Berkeley School of Information Spring 2016 Sameer Bajaj, Safei Gu, Keshav Potluri
Transcript of Soccer Guru - University of California,...

Soccer Guru
Final Report INFO247: Information Visualization and Presentation
UC Berkeley School of Information Spring 2016
Sameer Bajaj, Safei Gu, Keshav Potluri
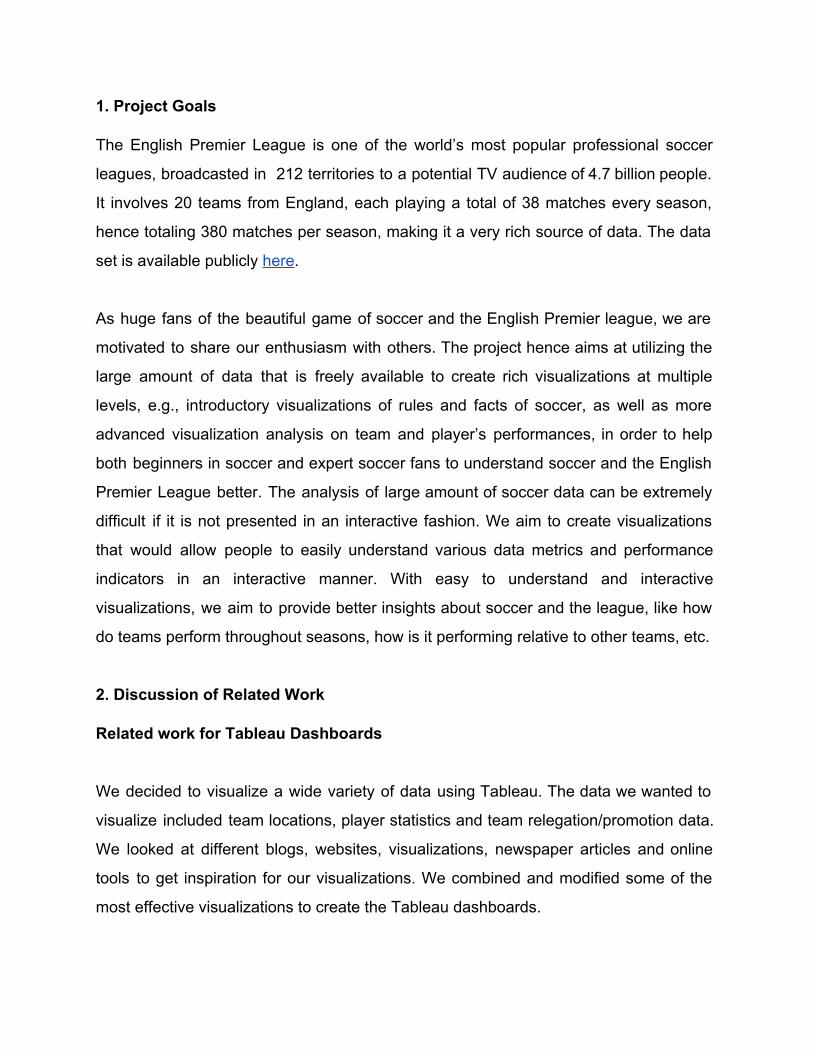
1. Project Goals
The English Premier League is one of the world’s most popular professional soccer
leagues, broadcasted in 212 territories to a potential TV audience of 4.7 billion people.
It involves 20 teams from England, each playing a total of 38 matches every season,
hence totaling 380 matches per season, making it a very rich source of data. The data
set is available publicly here.
As huge fans of the beautiful game of soccer and the English Premier league, we are
motivated to share our enthusiasm with others. The project hence aims at utilizing the
large amount of data that is freely available to create rich visualizations at multiple
levels, e.g., introductory visualizations of rules and facts of soccer, as well as more
advanced visualization analysis on team and player’s performances, in order to help
both beginners in soccer and expert soccer fans to understand soccer and the English
Premier League better. The analysis of large amount of soccer data can be extremely
difficult if it is not presented in an interactive fashion. We aim to create visualizations
that would allow people to easily understand various data metrics and performance
indicators in an interactive manner. With easy to understand and interactive
visualizations, we aim to provide better insights about soccer and the league, like how
do teams perform throughout seasons, how is it performing relative to other teams, etc.
2. Discussion of Related Work
Related work for Tableau Dashboards
We decided to visualize a wide variety of data using Tableau. The data we wanted to
visualize included team locations, player statistics and team relegation/promotion data.
We looked at different blogs, websites, visualizations, newspaper articles and online
tools to get inspiration for our visualizations. We combined and modified some of the
most effective visualizations to create the Tableau dashboards.

We first wanted the user to get familiarized with the different teams that participate in
the Premier League. We came across a map representation of the different teams on
google maps one of the soccer blogs. This representation is available here. This map
where the various teams are located on the map. This map inspired us to use maps in
Tableau to visualize the different teams and their attributes effectively. It helped us not
only plot the various teams on a map, but also gave us flexibility of plotting the attributes
that we wanted to address with our map such as stadium size and the division in the
football league.
Fig 1 : Plotting various teams on the map based on their location.
Next we wanted to understand and visualize how premier league points are awarded to
each player in the premier league. We looked at a number of websites and blogs that
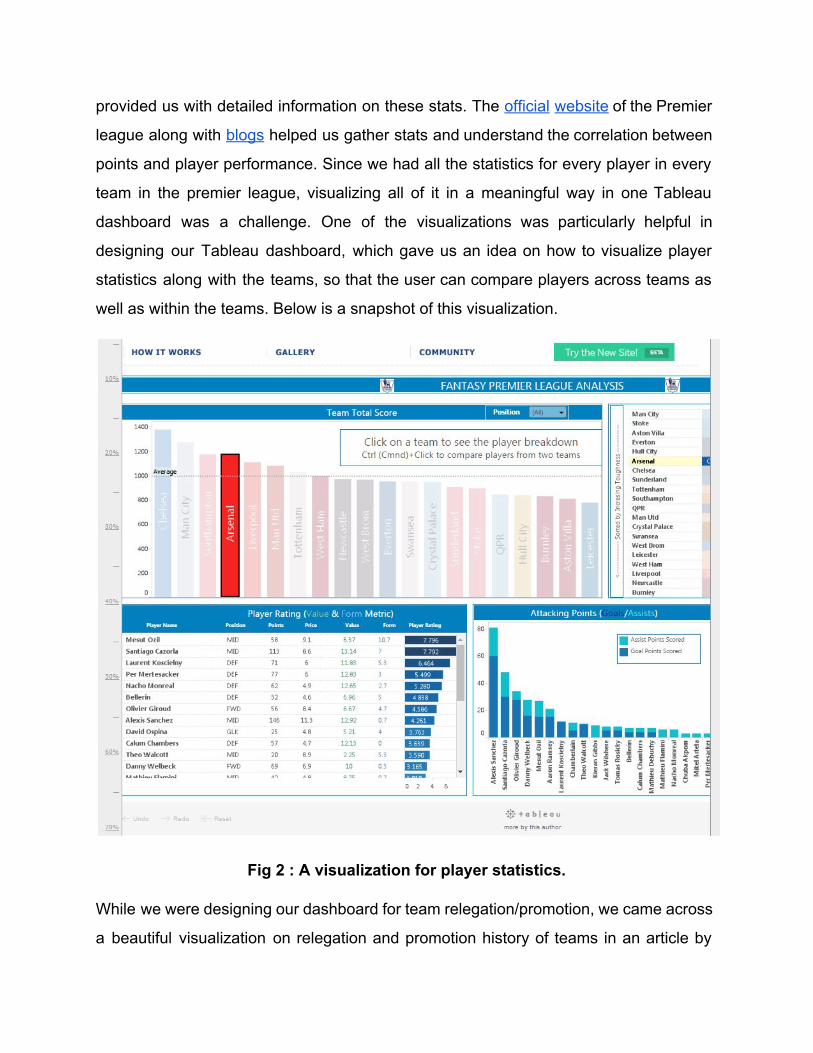
provided us with detailed information on these stats. The official website of the Premier
league along with blogs helped us gather stats and understand the correlation between
points and player performance. Since we had all the statistics for every player in every
team in the premier league, visualizing all of it in a meaningful way in one Tableau
dashboard was a challenge. One of the visualizations was particularly helpful in
designing our Tableau dashboard, which gave us an idea on how to visualize player
statistics along with the teams, so that the user can compare players across teams as
well as within the teams. Below is a snapshot of this visualization.
Fig 2 : A visualization for player statistics.
While we were designing our dashboard for team relegation/promotion, we came across
a beautiful visualization on relegation and promotion history of teams in an article by

FiveThirtyEight. This visualization was complementary to our visualization on correlation
of points and relegation/promotion and reinforced the idea of how certain teams perform
across the years in terms of relegation or promotion. Although this chart showed
different data (which team played in which league in which year.), it was extremely
helpful in representing our data in a similar fashion (which teams were relegated from
Premier League to a lower league and which teams were promoted from the Premier
League to the Champions League).
Fig 3 : Chart showing which teams played in which league across years.

Related work for the Relative Team Performance, D3.js visualization:
In order to design and implement relative team performances, we looked at a couple of
existing designs for the same. Once we had our design prepared, to implement our idea
of a bubble network visualization, we referred to some of the D3 examples to see how
similar network visualization precedents are designed and implemented in D3.js. We will
briefly describe three of the most helpful and relevant designs below, and explain how
they are related to our project.
The first related work is a forcedirected graph by Mike Bostock, showing character
cooccurrence in Les Misérables which can be viewed here. The more related
characters are placed closer to each other in the graph, with thicker links connecting
each other, while unrelated characters are visually farther apart, with thinner links as
visualized connections.
Fig 4 : Character cooccurrence in Les Misérables

From this graph, we learned that through mapping the attributes of the links with
performance score data, we could visualize the relative numeric match performances
between each two teams in the English Premier League. However, as we proceeded,
we decided to use color differences instead of using the thicknesses of the links to
visualize the relative performance between two teams, because we had received user
feedback that the thickness difference was too subtle to observe, as well as not so
clearly understandable as the color differences of the links.
The second related work is another forcedirected diagram by Mike Bostock available
here, clearly showing the network of patentrelated suits among the companies in
today’s mobile communications industry. In this diagram, solid links indicate current
suits, dashed links are resolved suits, green links are licensing, and the arrow of the link
shows that this is an incoming suit to that targeting company.
Fig 5 : Network of patentrelated suits

This visualization inspired us in the way that there could be more than one link
established between each two nodes, if differentiated clearly with a certain degree of
arc to avoid link overlapping. And each link could indicate different directions and
relationship between the two nodes. In this graph, there is no distance difference
between each two nodes, but the visualization intention is focused on the attributes of
the links to tell the story. In our D3.js visualization, we implemented the similar idea of
using arc and direction of the link to differentiate two links between the same pair of
nodes. However, we visualized the idea of arc and direction of the link in a more
conceptual and artistic way, so that users could focus more on the overall winloss
performance relationship between each pair of teams, instead of the literal arrow details
or pairs of links in the graph.
Another related work which can be viewed here, was by Christopher Manning, showing
the relational network among the paid lobbyists in Chicago, their clients, and the
agencies they lobby. In the graph below, blue nodes represent lobbyists, while grey
nodes represent their clients and green nodes represent their agencies.
Fig 6 : Relational network among the paid lobbyists in Chicago

With this visualization, we realized that our visualization is going to end up with a very
dense network full with links among the 20 nodes. However, allowing the users to
highlight the links related to one specific node by clicking on that node could help solve
this possible cognitive overload. During our implementation of the visualization, we tried
different version of opacity of the default display of all the links, and with the best tested
result, we decided to hide all the dense default links until the user clicks on a node to
highlight and display the set of links related to that specific node.
One of the most interesting visualization that led us to the idea of using bubble charts
was the NY Times visualization “the clubs that connect the world cup” which
represented which players in the different clubs across the world are representing which
countries. This visualization informs the user about which clubs contribute to the most
number of players to the world cup nations.
Fig 7 : The Clubs that connect the World Cup

This visualization gave us the idea of using interconnected bubble network to represent
relative team performances with respect to each other. This also gave us the idea of
how to tackle the problem of crowding by only highlighting elements that are in context.
Related work for the Team Progression during the Season, D3.js visualization:
We wanted to visualize performance of the teams during the season. How do certain
teams perform consistently or how do certain teams perform in first or last half of the
season or how do certain team performances fluctuate. We were sure we wanted to use
line charts for the time series data, but just using points would have given us
exponential curves with different slopes and would not have been very helpful. We
hence wanted to plot relative position along with the absolute number of points. We took
inspiration from different visualizations available across the web. Some of them are
discussed below.
The visualization that was most helpful was the MLS (Major League Soccer) weekly
standings visualization available here. This visualization depicted how teams stood in
terms of absolute standings during every week of the tournament. This was something
that we wanted to depict. There was another visualization in the same blog which
depicted the absolute points of every team during every week of the tournament. These
visualizations together formed the base for our visualization which combined the
elements from both of them.

Fig 8 : Weekly Standings for MLS
Fig 9 : Total points for every team across the week

In our final visualization, we decided our x axis to represent every week like in Fig 9. For
the y axis, even though we used the total points, we used a different axis for every week
using the minimum and maximum total points of the teams in that week. This gave us
the relative positioning like in Fig 8 while still encoding the points data like in Fig 9.

3. Description of the Visualizations
Here are some visualizations implemented via Tableau which display the teams that
play in different divisions in the premier league. Displaying this visualization right at the
start was particularly important since we wanted our viewers to have a general
understanding of where the matches in the premier league take place. Each circle
represents the stadium location for each team and the size of the circle represents the
relative size of the stadium. Hovering over each circle provides the user with further
information about the stadium location, size and team.
Fig 10 Teams that play in the Premier League

Fig 11 : Championship teams and their stadium sizes on the map
Description of the Guide to Squad Formations (D3.js)
A Formation describes how the players in a soccer team are positioned on the field.
Different formations are used by teams based on the skill of the opposite team, the
match situation and also the skills of the players in their own team. If a team wants to
play defensive soccer, the 442 formation, with 4 defenders, 4 midfielders and two
forwards, can be used. On the other hand, 343 is an offensive formation with little
defensive play and more focus on attack. There is no optimal formation that a team can
use for every match.
Team formations can change any time during the game. Below are the screenshots of
the D3.js visualizations displaying the most common formations used in soccer. You

can use the board as a playground to experiment with different formations by moving
each player (circle) around the board.
Our first formation visualization displayed the 442 formation as shown below:
Fig 12 : A 442 formation (the most common formation used by managers)
In this visualization, formations could be switched by clicking on the thumbnails. The
following are examples of predefined formations in our visualization.
Fig 13 : 4312 formation (also known as the diamond formation)

Fig 14 : 343 formation (when the team has to go all out attack)
Description of Team Progression during the Season (D3.js)
All 20 teams in the Premier League, play every other team twice every season, playing
a total of 38 matches. Every team plays one match every week. A win earns a team 3
points, a draw earns both the teams 1 point and a loss does not earn any point. At the
end of 38 weeks, the team with the maximum number of points wins the League.
Different teams perform differently in the league. The better teams perform consistently
throughout the year, while some teams perform extremely well for one half of the year,
but manage to loose in the other half. Also, due to the highly unpredictable nature of the
league, any team can win or lose at any time. Therefore, looking at how teams perform
throughout the year, can provide some interesting insights about the league.

Below are screenshots of the visualizations showcasing the team performance as the
League progresses. Each line represents the point progression of a particular team over
the selected season.
Fig 15 : Premier league team performance in the season 20142015
By hovering over a team, the viewer can quickly analyze the team’s performance over
the season. Wins are highlighted by a green dot. Draws are highlighted by a yellow dot
and losses are highlighted by red dots.The viewer can also hover over each dot to view
the exact result of match.

Fig 16 : Displaying a particular team performance over the season Description of Relative Team Performance (D3.js)
This D3.js visualization aims to provide a clear way to show the network of the teams in
the English Premier League, with their relative performance against other teams
visualized as the links in the graph. Over the years, teams have developed rivalries
amongst themselves, establishing patterns within the league. For example, Stoke City
no matter how badly it performs throughout the season, defeats all the top clubs in
home matches. Manchester United almost always defeats its rivals, Liverpool. Such
interesting insights can be developed if one views the relative performances of teams
with respect to each other.
Below are some screenshots that demonstrate how user could interacts with this
visualization.

Fig 17 : This is the default view. Interface representing each node as each team, with links hidden in this view to avoid information overload.
Fig 18 : Double Click on a team reveals connections w.r.t. every other team. A green line means the team won the match, red represents loss & yellow a draw.

When people double click one node, all the links related to that team would show up as
the screenshot above, with one link representing one match, and the color of the link
indicating whether the selected team won, lost, or drew the match.
Fig 20 : Hover produces a tooltip. Also the nodes can be freely dragged.
Users could also drag each node to a different location to view the network graph
clearly. By hovering one link or one node, users could read the related information
through the Tooltip.
Description of Player Information (Tableau)
Players maketh the team! Soccer is a team sport. And like any other team sport, a team
can perform well for a variety of reasons. A team can perform exceptionally well across
seasons because they have better players. Or a team can perform well exceptionally
well because they have one exceptionally good player. Or a team can perform well

because they have a team of average players who perform well together. Sometimes a
team can have ups and downs because of player injuries or sudden good performance
of certain players. All these can be examined if we examine data related to player
performance in detail.
Below are some screenshots that display the player performance dashboard.
Fig 21 : Dashboard to represent player data. This is the default view

Fig 22 : The screenshot above displays when the team filters are active and a
particular player is selected
Description of Team Position, Advancement and Relegation (Tableau)
At the end of 38 weeks, the total points obtained by the team decide its fate for the next
season. The team with the highest points wins the league and is crowned as the
Champion. The top 3 teams including the champion, get a chance to compete with
Europe's best clubs in the UEFA Champions league next season. The team in the 4th
position, gets a chance to compete against other teams in Europe to secure a berth in
the UEFA Champion's League. The bottom 3 teams are relegated from the Premier
League and do not get to play again in the Premier League next season. Instead 3 new
clubs from lower leagues get a chance to play in the Premier League. All the other
teams in the Premier League are consideredsafeand get the chance to compete again

next season. Analyzing this data can lead to some interesting insights about the
different clubs in the Premier League.
Below is the screenshot of the dashboard to analyze the Team Position, Relegation and
Advancement across seasons.
Fig 23 : Default view of different team statuses in the league through seasons 20012011
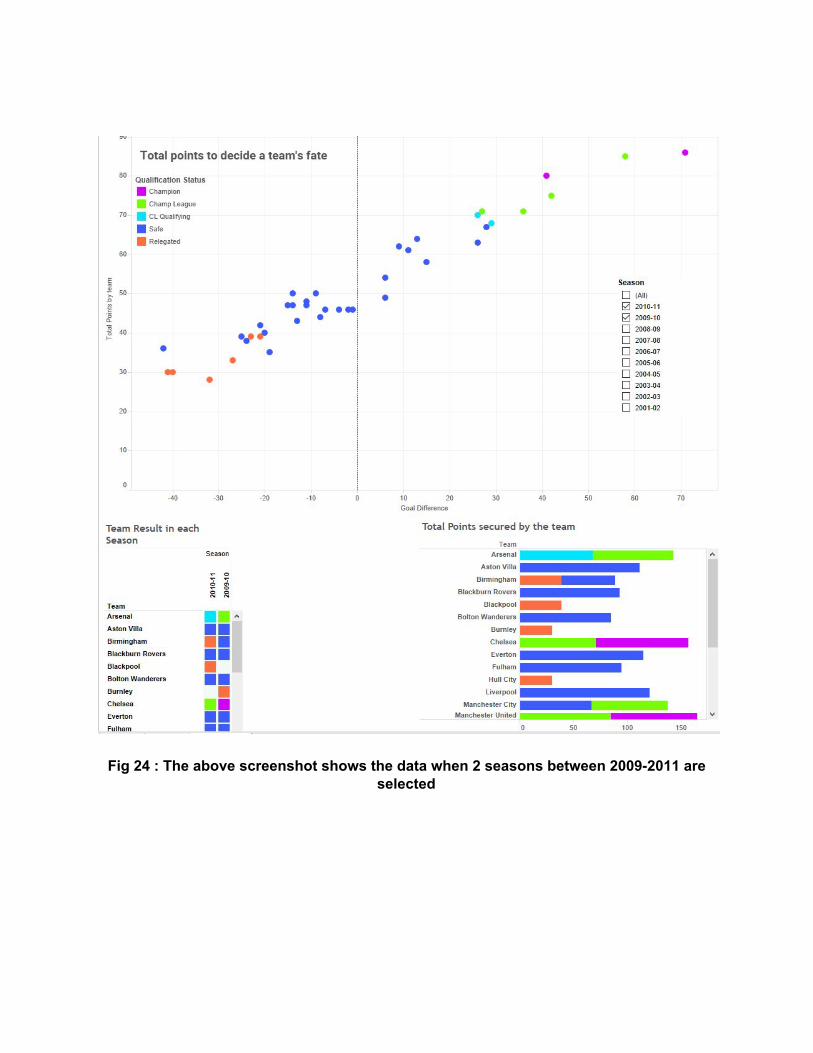
Fig 24 : The above screenshot shows the data when 2 seasons between 20092011 are selected

4. Data Used to Accomplish the Goals
The data for the project is a data set containing statistics for every match played in the
English Premier League since 2008. The English Premier League is one of the world’s
most popular professional soccer leagues, broadcasted in 212 territories to 643 million
homes and a potential TV audience of 4.7 billion people. It involves 20 teams from
england, each playing a total of 38 matches every season, hence totalling 380 matches
per season. The data set contains the statistics for each match for the past 8 years
making it a really rich source of information. The data set is available publicly here.
The data set captures a total of more than 30 data points for each match which range
from generic data like team names, venue, referees etc. to more detailed data like
number of shots taken, number of fouls, number of passes, number of saves etc. The
data is available as separate files for each year since 2008.
Although this data set has detailed data about each match, we foresee that additional
data might be required depending upon our design prototype. Additional data sources
have been identified and some of them are as follows: OpenFootball, ESPN API,
OpenFooty API, footballdata.co.uk etc. A complete list of other possible resources is
available here.
5. Tools Used to Accomplish the Goals
The data set was extremely large and hence we needed to explore the data first to gain
some insights before we designed our visualizations. We hence first used MetaReader
and Excel Pivot Table to first understand the data, identify trends and then identify the
need for preprocessing. We used python 3.0 scripts to change the format of data in
particular instances and to preprocess it. Once we had a dataset without any
discrepancies, we decided to perform EDA on it. We used Tableau for the purpose of
EDA and to gain some useful insights.

Once we were comfortable with the data and had gained sufficient insights on it, we
decided to come up with our designs for the visualizations that we wanted to show. In
order to create our prototypes, we used Adobe Illustrator, Adobe Photoshop, and hand
sketches to communicate and finalize our ideas into prototypes.
We decided to show three of our final visualizations using Tableau and three of our
visualization using D3.js. We utilized D3.js to visualize squad formations, team
progression during the season and the relative performances of the teams. We used
Tableau to visualize the team locations, player performance and team position and
relegation statistics.
For creating the website to present the visualizations, we used HTML, CSS, JS,
Bootstrap and Angular.js. We used additional Illustrator to create icons and other visual
elements using Illustrator. We used Github for collaboration and sharing the code. We
used Google Docs to plan and execute the project.
6. Steps to Accomplish the Goals
● We firstly used MetaReader and Excel Pivot Table to understand the data,
identify trends and then identify the need for preprocessing. We also prepared
the format of the data in particular instances and preprocessed it via Python 3.0
scripts.
● Secondly, with the dataset without any discrepancies, we decided to perform
EDA on it, in order to gain more insights and to provide more foundations for our
brainstorming of information visualization ideas.
● We sketched and discussed our ideas, brainstormed based on this, finalized our
overall narrative with these visualizations, and came up with visualization
prototypes made in Adobe Illustrator, Adobe Photoshop and hand sketches.

● We conducted a lot of research to see how we could visually analyze and
present data to implement our prototypes. In this process, we also did more
research to find additional data from other sources to support our design.
● During our process of implementing the visualizations, We iteratively refined
each visualization design with feedbacks from our classmates, and we added
richer visualizations into our main narrative as great ideas came into our mind.
● After we got a first draft of the visualizations, we discussed any improvements
required to the design, evaluated the design with actual users through usability
testing, and gathered feedback for another round of design modifications to
refine our design.
● We enhanced our design according to our main user feedback.
● We designed three versions of the website, made prototypes to see how it could
clearly accommodate our visualizations in a narrative. And then we implemented
the website.
● We summarized the feedback we received during INFO 247 project showcase,
and refined our design to accommodate the feedback that is feasible to be
implemented before the submission deadline.
● We collaboratively wrote this final report.
7. Results, Responses from Users, Results from Usability Tests
7.1 Results
We managed to implement three of our final interactive visualizations using Tableau,
and three of our visualization using D3.js, with the overall narrative implemented via a
website and illustrations made in Adobe Illustrator and Photoshop. Through our iterative
agile process from design, user feedback, to implementation, we gathered very valuable
user feedback and integrated most of the feedback that are feasible within the limited
time period before the project deadline. During our usability testings, most of our
participants said that they love our visualizations overall!

7.2 Responses from Users
Our project is targeting two different user groups, one is beginners in soccer and
English Premier League, the other group is expert soccer fans in soccer and English
Premier League. Based on this, we conducted our usability tests with these two different
types of users. Below is the overview of the responses from the two types of users.
● Beginners in soccer
○ “It’s great to see the visualization of squad formations I never knew the
details of how two defenders might have a slight difference in their
designated locations on the soccer field.”
○ The visualized introduction to soccer and the English Premier League
makes it easier for the user to quickly absorb the knowledge and
successfully understand the detailed difference from the images.
○ In the section of advanced team/player performance visualization, we
need more explanation or annotation to make it more understandable for
beginner users, such as displaying the full name of the teams instead of
the abbreviations derived from the dataset.
● Experts in Soccer and English Premier League
○ This type of users were impressed with the bubble D3 chart that allowed
them to see how their favorite teams performed against other teams.
○ The users liked the details of the matches played over the last 5 seasons,
with an overall comparison of the performance trends of different teams
during each season.
○ The tableau charts gave them indepth player performance analysis that
they thought was cool and helpful. “Expert” users liked to see the trend
and analysis of how their favorite players performed.

○ “Expert” users thought the introduction part is cool, and when they wanted
to skip to the advanced performance and data analysis part, they could
navigate to that part directly through the website navigation bar.
To sum up, the majority of the two types of users love our visualizations overall. The
detailed usability issues identified through our usability tests will be discussed in the
section below, “Results from Usability Tests”.
7.3 Results from Usability Tests
Because of the page limit, we will focus on discussing the usability issues we identified
for each part of our design through the usability tests, and skip through the positive
feedback part, since the usability issues are the most valuable feedback to guide our
design refinement.
Overall
Our participants in our usability testing overall love our visualizations! We
separated introduction section and advanced performance trends/data
exploration section, so that beginner users could follow the whole narrative
starting with the introduction to soccer and English Premier League and then
read the visualization analysis of team and players’ performance trends, while
expert users can skip the introduction section if they want, and directly jump to
the parts they will be more interested in. However, there are also two overall
usability issues we identified and tried to fix.
● For the overall navigation of the website, previously we have animated
horizontal sliding effect among different sections of our narrative, but
usability tests showed it had distractions from displaying information, and
created usability issue when people scrolled down one section, and they
needed to return to the top of the page to horizontally slide to another

section. Based on this, we changed the overall navigation to a more
intuitive way of vertical scrolling, without requesting the users to go back
and forth just for sliding to another section.
● Too much text on the website. Before we were worries about too few
explanations would leave the users with no clue of our various
visualizations and overall narrative. But now we got the feedback that the
text paragraphs were too long and thus the users would not read the text
descriptions, but only the titles.
Teams and Their Stadiums, Tableau Map
● Because we have 134 teams in this map, when switching among different
leagues, the color coding for different teams sometimes could looks
problematic, for example, several teams share close colors, and Swansea
is white, which is difficult to see on the map.
● The zoomingframe of the map causes some usability issue, when people
want to scroll down the page but end up trapped in the map frame. We
would like to spend more time in the future to figure out if it is possible to
do a fixed frame map for this one.
English Premier League Official Website Image
● The hyperlink embedded in this image links to the website, which is not
expected, a lightbox at the same page showing a popout of the larger
image would be better. We would love to spend more time in the future to
figure out how to do a lightbox on website to implement this effect.
The Guide to Squad Formations, D3.js
● There were too much text, and instead, we could show corresponding text
explanation when highlighting different formations. And we could reduce
the text explanation by adding annotations or marks to the visualization,

eg., annotations to show where are Defenders, Strikers, Midfielders and
Goalkeeper located on the soccer field.
Team Progression during the Season, D3.js
● People could not easily understand what different visual elements mean
without mouse hovering. Instead, we could put the legend on top of the
chart, so that it is easier for people to refer to.
● It would be even better for people to be able to highlight several different
lines to compare different teams’ performances.
● There are a little too much information in Tooltip, we could either reduce or
highlight information.
● The abbreviations of the team names need more explanation to beginner
users, and we could try to display the full names of the teams instead of
the abbreviations derived from the dataset.
Relative Team Performance, D3.js
● Without users reading the instruction above the visualization, double
clicking is not so intuitive to them than single clicking to select a node to
see its relative performance against other teams.
● Even with the tooltip over the links showing detailed match result, users
still need more visual hints to visually understand whether a link means
team A winning over team B or in a reversed way.
● For beginner users, it is not immediately clear how points are calculated
based on match result, and we could include a formula such as Points = X
x 3 + Y x 1 + Z x 0.
Player Information, Tableau
● People got confused about meaning of the color change in the
performance line chart in the middle. We fixed this.
Team Position, Advancement and Relegation, Tableau

● We fixed the order of the season filter. Before it was ascending, which is
less common, and we changed it to the descending order to show the
latest season on the top.
● We fixed the color and order of the Qualification Status filter, so that there
would not be a confusion in the closer colors of “Champion” and
“Relegated”, and the order of the color legend will be descending, which is
closer to how the data will be mapped out in the visualization.
8. Future work
We encountered the issues with responsiveness when embedding D3 and Tableau on
the website. We would love to figure out a way to make D3 and Tableau iframes more
responsive and quick on the website.
Besides, we love the idea that Marti suggested to us to show a trail of movement in the
Squad Formation visualization, so that people can track to see how different roles
change and move when team formation changes. We would love to spend more time in
the future to figure out how to implement this in D3.js.
For the visualization of Team Progression during the Season, we also love the idea to
integrate animations of micro interactions on the D3 line chart, so that we could have
more visual indication and excitement to show if one highlighted team is performing
better or worse during the selected season.
Last but not the least, for the visualization of Relative Team Performance, we would
love to spend more time in the future to figure out how to implement more explicit visual
hints such as arrows to show the direction of each link, so that people could understand
whether a link means team A winning over team B or in a reversed way.

9. Links to Video Demo and Website
To see our final project, go here.
Our code is publicly available on Github here.
For a guided video tour of our final product, go here.
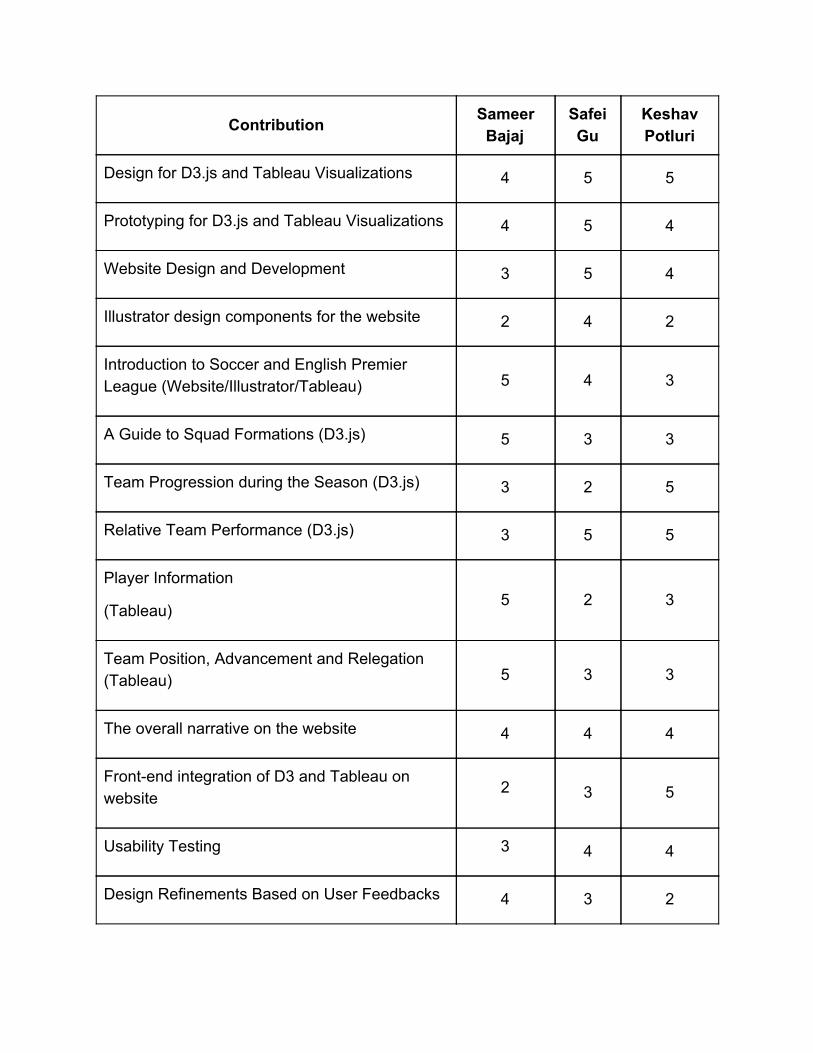
10. Team Contribution
Our Project was a collaborative effort and even though we had the tasks clearly split
amongst ourselves, for the maximum efficiency we routinely rotated the tasks amongst
ourselves. For example, if one person is stuck in D3, another would pick it up and drive
it to completion and the third person would integrate it to the website. As such we
decided to give points to all our individual contributions using a scale of 15 in each
task.
1 = low 2 = sufficient 3 = supporting 4 = significant 5 = outstanding
Contribution Sameer Bajaj
Safei Gu
Keshav Potluri
Design for D3.js and Tableau Visualizations 4 5 5
Prototyping for D3.js and Tableau Visualizations 4 5 4
Website Design and Development 3 5 4
Illustrator design components for the website 2 4 2
Introduction to Soccer and English Premier League (Website/Illustrator/Tableau) 5 4 3
A Guide to Squad Formations (D3.js) 5 3 3
Team Progression during the Season (D3.js) 3 2 5
Relative Team Performance (D3.js) 3 5 5
Player Information
(Tableau) 5 2 3
Team Position, Advancement and Relegation (Tableau) 5 3 3
The overall narrative on the website 4 4 4
Frontend integration of D3 and Tableau on website
2 3 5
Usability Testing 3 4 4
Design Refinements Based on User Feedbacks 4 3 2

Total 52 52 52

Appendix
Initial prototype of the network graph showing relative team performance against other teams
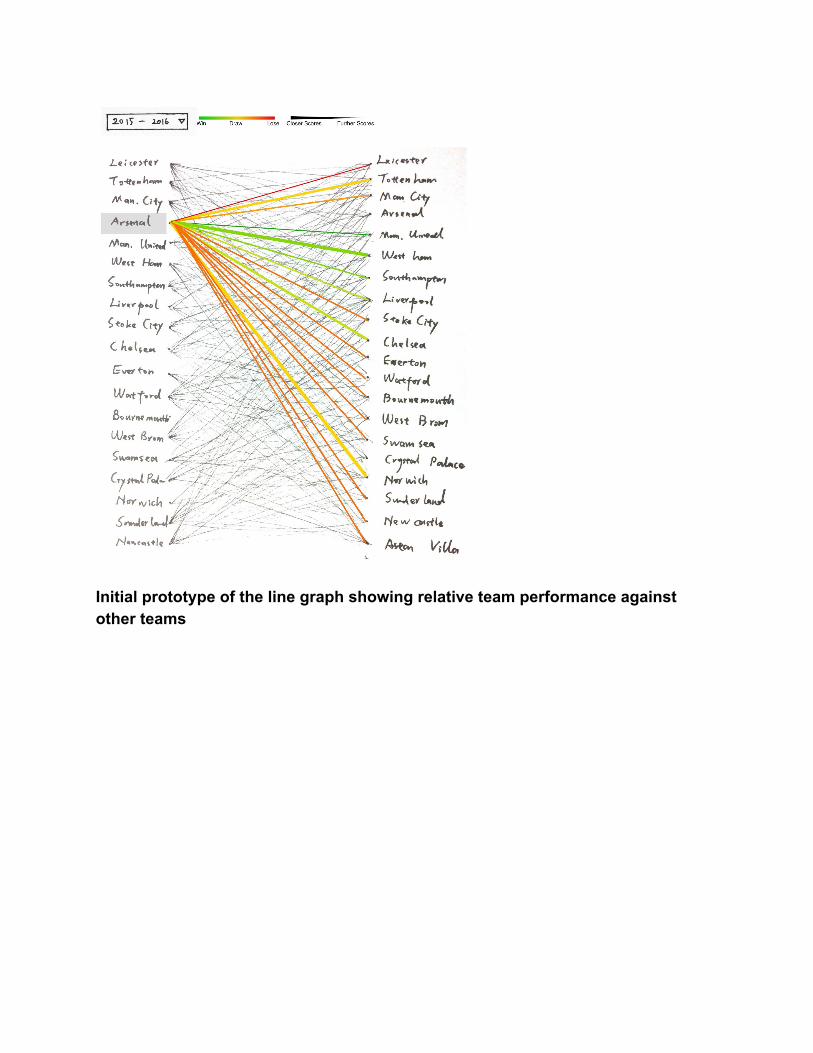
Initial prototype of the line graph showing relative team performance against other teams