SO-Sieve - soiloffice.com - Scientific Manual - English... · − Test data can be edited using...
31
SO-Sieve Version 1.0.6651.3 Scientific Manual This software is developed by Soil Office Software Group. SO-Sieve includes sieve analysis, hydrometer and Atterberg limits tests. Soil type is also presented based on USCS (Unified Soil Classification System). March 2018
-
Upload
duongxuyen -
Category
Documents
-
view
221 -
download
5
Transcript of SO-Sieve - soiloffice.com - Scientific Manual - English... · − Test data can be edited using...
SO-Sieve Version 1.0.6651.3
Scientific Manual This software is developed by Soil Office Software Group. SO-Sieve includes sieve analysis, hydrometer and Atterberg limits tests. Soil type is also presented based on USCS (Unified Soil Classification System).
March 2018
SO-Sieve Scientific Manual
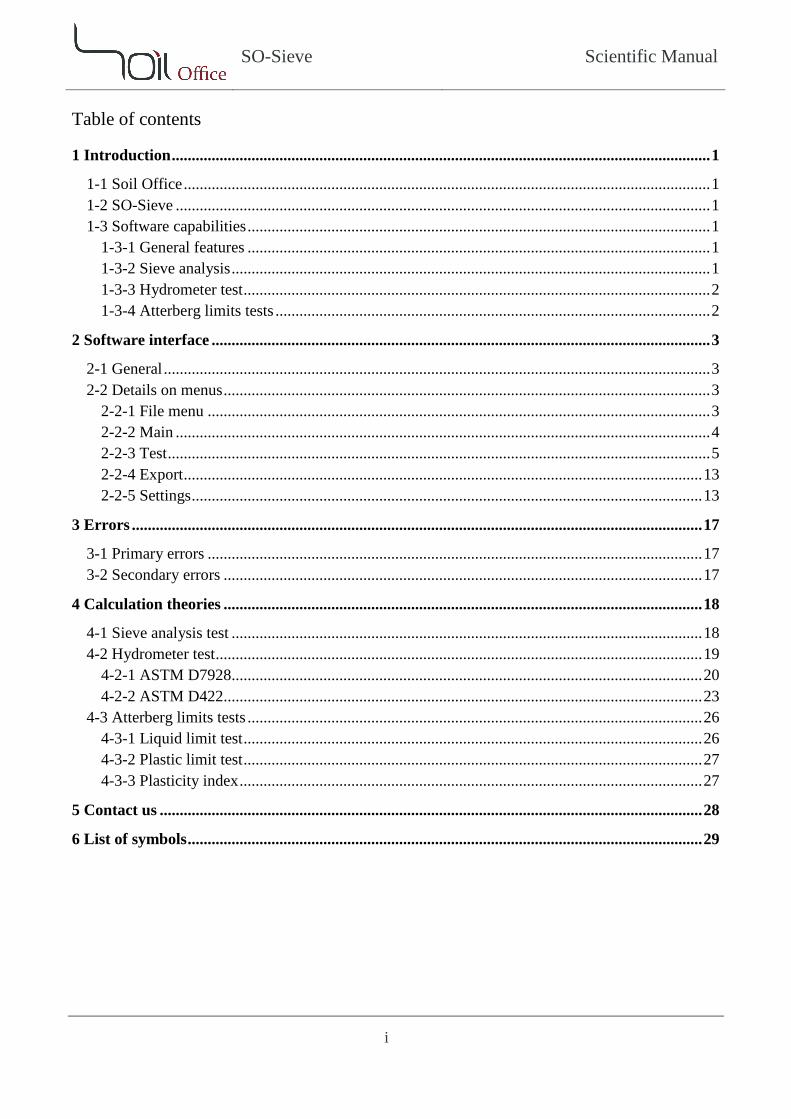
Table of contents
1 Introduction ....................................................................................................................................... 1
Soil Office .................................................................................................................................... 1 1-1 SO-Sieve ...................................................................................................................................... 1 1-2 Software capabilities .................................................................................................................... 1 1-3
General features .................................................................................................................... 1 1-3-1 Sieve analysis ........................................................................................................................ 1 1-3-2 Hydrometer test ..................................................................................................................... 2 1-3-3 Atterberg limits tests ............................................................................................................. 2 1-3-4
2 Software interface ............................................................................................................................. 3
General ......................................................................................................................................... 3 2-1 Details on menus .......................................................................................................................... 3 2-2
File menu .............................................................................................................................. 3 2-2-1 Main ...................................................................................................................................... 4 2-2-2 Test ........................................................................................................................................ 5 2-2-3 Export .................................................................................................................................. 13 2-2-4 Settings ................................................................................................................................ 13 2-2-5
3 Errors ............................................................................................................................................... 17
Primary errors ............................................................................................................................ 17 3-1 Secondary errors ........................................................................................................................ 17 3-2
4 Calculation theories ........................................................................................................................ 18
Sieve analysis test ...................................................................................................................... 18 4-1 Hydrometer test .......................................................................................................................... 19 4-2
ASTM D7928...................................................................................................................... 20 4-2-1 ASTM D422........................................................................................................................ 23 4-2-2
Atterberg limits tests .................................................................................................................. 26 4-3 Liquid limit test ................................................................................................................... 26 4-3-1 Plastic limit test ................................................................................................................... 27 4-3-2 Plasticity index .................................................................................................................... 27 4-3-3
5 Contact us ........................................................................................................................................ 28
6 List of symbols ................................................................................................................................. 29
i
SO-Sieve Scientific Manual
1 INTRODUCTION
SOIL OFFICE 1-1
“Soil Office” is a developer of geotechnical engineering software since 2013. Our main objective is to develop functional
and user friendly software, capable of performing precise calculations. The following software is currently considered:
− SO-Foundation: Bearing capacity of shallow foundations − SO-Lab: Soil mechanics laboratory tests and boring logs including:
SO-Sieve: Sieve analysis, Hydrometer & Atterberg limits • SO-Shear: Direct shear • SO-Unconfined: Unconfined compression • SO-Triaxial: Triaxial compression • SO-Consolidation: One-dimensional consolidation • SO-Log: Geotechnical engineering boring logs •
Feel free to contact us regarding any criticism, recommendation or additional information.
SO-SIEVE 1-2
“SO-Sieve” having a user-friendly interface, includes sieve analysis, hydrometer and Atterberg limits tests. It also presents soil type based on USCS (Unified Soil Classification System).
Sieve analysis and Atterberg limits may either be determined by test results or visual examination. Hydrometer test can be calculated using both ASTM D7928 and ASTM D422 (withdrawn 2016) standards. Note that sieve analysis and hydrometer tests could randomly be generated based on user-defined criteria.
Finally, in addition to test data and corresponding calculations, software outputs are presented in both landscape and portrait formats.
SOFTWARE CAPABILITIES 1-3
GENERAL FEATURES 1-3-1
− User is informed about the common ranges regarding input parameters. − Software outputs are exported in both landscape and portrait formats. − Test data and corresponding calculations are presented in a separate format. − Blank laboratory data sheets may be used for test data input. − Saving files with a minimal size.
SIEVE ANALYSIS 1-3-2
− Visual examination may be used for the determination of particle-size distribution. − Random generation of sample sieve analysis tests based on user-defined criteria. − Various sieve sets may be defined and used when needed. − Test data can be edited using either graph or input table.
1
SO-Sieve Scientific Manual
HYDROMETER TEST 1-3-3
− Random generation of sample hydrometer tests based on user-defined criteria. − Hydrometer calculation using ASTM D7928:
Control cylinder correction: Correction value is measured using a control cylinder after each of the •test readings.
Calibration relationship: is defined and automatically applied. •
− Hydrometer calculation using ASTM D422:
Normal correction: Separate corrections are applied for the effect of temperature and dispersing agent. •Temperature correction may be automatic or manually assigned by the user.
Composite correction: is measured at two temperatures (spanning the range of expected test •temperatures) and corrections for other temperatures are calculated by the use of linear interpolation.
− The following may be defined through software settings and used when needed:
Time list. • Various 151H and 152H hydrometers. • Corrections regarding various hydrometers including composite correction and calibration •
relationship.
ATTERBERG LIMITS TESTS 1-3-4
− Visual examination may be used for the determination of soil type according to plasticity chart. − User is warned when ASTM D4318 regulations are not satisfied.
2
SO-Sieve Scientific Manual
2 SOFTWARE INTERFACE
GENERAL 2-1
After running SO-Sieve, the following menus are visible on the top ribbon:
File menu: Contains commands relating to the handling of files, such as creating a new project, save, etc. Main: Project information, borings and samples are determined using this menu. Test: Contains the following:
USCS: Includes sieve analysis, hydrometer and Atterberg limits tests. Note that only final results •regarding Atterberg limits tests can be assigned through this menu.
Atterberg limits: Specifically used for Atterberg limits tests. • Edit: Tests performed on a sample can be copied, moved or deleted using this menu. •
Export: Contains the following:
Export: Is used to export software outputs. • Blank: Includes blank laboratory data sheets. •
Settings: Program settings are determined through this menu. Help: Contains the following:
Scientific manual: Describes functionality of different parts of the software and the theories of the •utilized methods.
Index: Contains indexed help topics. •
License: The permit to use the software and information on the client. About: Contains general information.
SO-Sieve: Brief description about the current software and its version. • Soil Office: Introducing Soil Office Software Group. •
DETAILS ON MENUS 2-2
FILE MENU 2-2-1
This menu is consisted of the following:
New: Creation of a new project. Open: Opens a previously defined project. Save: Saves project (with *.sos extension). Save as: Saves project with a different name. Sample project: Sample project in order to demonstrate software features and easily work with it. Results regarding each of the sieve analysis, hydrometer and Atterberg limits tests are introduced or calculated by a variety of methods. Close: Closes project. Exit: Closes project and exits SO-Sieve
3
SO-Sieve Scientific Manual
MAIN 2-2-2
PROJECT INFORMATION 2-2-2-1
Basic project information including name, client, location and code are entered in this section. A separate field is also
dedicated for notes. The user can specify the project location on the map and the coordinates will be shown in the
corresponding field. Project address is also presented by activating the “Reverse geocoding” option and the user may
accept it or not.
TABLE OF BORINGS 2-2-2-2
Project borings are identified through this table. The input parameters are listed below:
Boring method: Whenever the boring is machine-drilled and the method is not included in the available options or the user prefers it not to be specified, the “-” option can be used. Name: Boring name. Depth: Boring depth. Elev.: Ground elevation at top of boring. GWT: Depth to water table measured from boring top (Ground Water Table). Note: Notes regarding the boring such as weather conditions including recent rain or other events that could affect subsurface conditions. Export: Defines whether the boring is included in the output or not. This option is active by default. Contractor: Name of the drilling contractor. Start date: Start date of drilling. Finish date: Finish date of drilling.
TABLE OF SAMPLES 2-2-2-3
Samples obtained within each of the borings are introduced in this table. The input parameters are listed below:
Depth: Sample depth. Sample category: Sample category including “Disturbed”, “Undisturbed” and “Rock core”. Sample type: Varies by boring method and sample category. “-” may be used if empty for any reason. Color: Sample color. Some colors are available by default and others can be defined by the user. Code: Sample code. Note: Notes regarding sample or its extrusion process.
4
SO-Sieve Scientific Manual
TEST 2-2-3
The following are used in various parts of the software:
More …: Is displayed as red when filled and contains:
Date: Test date. Time: Test time. Tested by: Name of the technician. Note: Notes regarding the test.
Delete test: The test in the relevant section will be deleted.
Other parameters along with their usage are presented in their relevant sections. Note that some parameters are defined
more than once for the ease of access.
USCS 2-2-3-1
2-2-3-1-1 SIEVE ANALYSIS
The grain-size distribution of coarse-grained soil is generally determined by means of sieve analysis. Some related
parameters are presented below:
PEAT: is active whenever soil is of “peat” type. Activating this option, results in deactivation of others. Cobble: is selected if “cobbles” exist in the sample. Boulder: is selected if “boulders” exist in the sample. Organic: is related to the existence of organic fines in the soil sample. Dry mass: Sample dry mass. Load sieve set: using this option, various sieve sets can be loaded. Note that sieve sets are filtered considering used sieves (sieves where mass retained column is filled) in the sieve analysis table. Used sieves: if active, only sieves that are used in the sieve analysis test are displayed.
Sieve analysis test table: has the following columns:
Sieve: Sieve name. Opening: Sieve opening. Mass retained: Soil mass retained on sieve in grams and percent, respectively. Cumulative percent coarser: Cumulative percent of soil retained on a sieve. Cumulative percent finer: Cumulative percent of soil passing a sieve. Pan: Soil mass retained on the pan.
Note:
1- Whenever grain size corresponding to 100 [%] cumulative percent finer is not available in the test, one sieve size larger than the first used sieve (according to sieve list presented in ASTM E11) is considered as 100 [%] cumulative percent finer.
2- Soil mass retained on “No. 200” sieve has to be entered, otherwise, fines cannot be determined.
5
SO-Sieve Scientific Manual
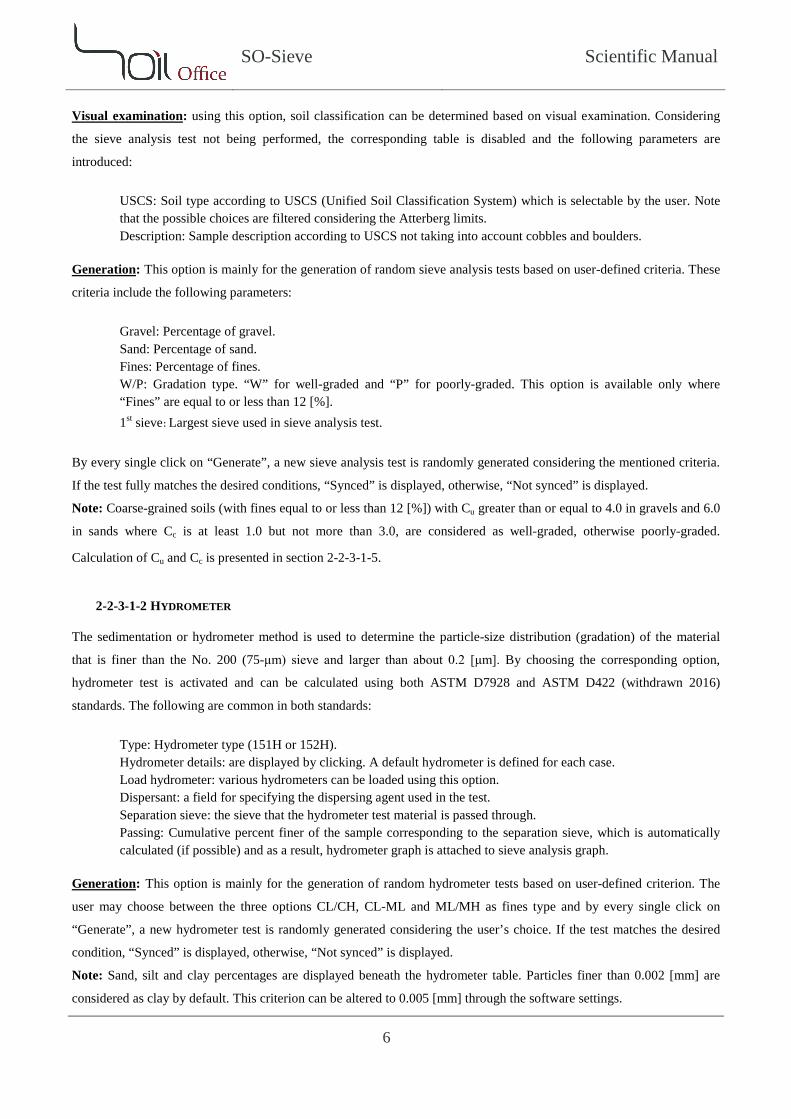
Visual examination: using this option, soil classification can be determined based on visual examination. Considering
the sieve analysis test not being performed, the corresponding table is disabled and the following parameters are
introduced:
USCS: Soil type according to USCS (Unified Soil Classification System) which is selectable by the user. Note that the possible choices are filtered considering the Atterberg limits. Description: Sample description according to USCS not taking into account cobbles and boulders.
Generation: This option is mainly for the generation of random sieve analysis tests based on user-defined criteria. These
criteria include the following parameters:
Gravel: Percentage of gravel. Sand: Percentage of sand. Fines: Percentage of fines. W/P: Gradation type. “W” for well-graded and “P” for poorly-graded. This option is available only where “Fines” are equal to or less than 12 [%]. 1st sieve: Largest sieve used in sieve analysis test.
By every single click on “Generate”, a new sieve analysis test is randomly generated considering the mentioned criteria.
If the test fully matches the desired conditions, “Synced” is displayed, otherwise, “Not synced” is displayed.
Note: Coarse-grained soils (with fines equal to or less than 12 [%]) with Cu greater than or equal to 4.0 in gravels and 6.0
in sands where Cc is at least 1.0 but not more than 3.0, are considered as well-graded, otherwise poorly-graded.
Calculation of Cu and Cc is presented in section 2-2-3-1-5.
2-2-3-1-2 HYDROMETER
The sedimentation or hydrometer method is used to determine the particle-size distribution (gradation) of the material
that is finer than the No. 200 (75-μm) sieve and larger than about 0.2 [μm]. By choosing the corresponding option,
hydrometer test is activated and can be calculated using both ASTM D7928 and ASTM D422 (withdrawn 2016)
standards. The following are common in both standards:
Type: Hydrometer type (151H or 152H). Hydrometer details: are displayed by clicking. A default hydrometer is defined for each case. Load hydrometer: various hydrometers can be loaded using this option. Dispersant: a field for specifying the dispersing agent used in the test. Separation sieve: the sieve that the hydrometer test material is passed through. Passing: Cumulative percent finer of the sample corresponding to the separation sieve, which is automatically calculated (if possible) and as a result, hydrometer graph is attached to sieve analysis graph.
Generation: This option is mainly for the generation of random hydrometer tests based on user-defined criterion. The
user may choose between the three options CL/CH, CL-ML and ML/MH as fines type and by every single click on
“Generate”, a new hydrometer test is randomly generated considering the user’s choice. If the test matches the desired
condition, “Synced” is displayed, otherwise, “Not synced” is displayed.
Note: Sand, silt and clay percentages are displayed beneath the hydrometer table. Particles finer than 0.002 [mm] are
considered as clay by default. This criterion can be altered to 0.005 [mm] through the software settings.
6
SO-Sieve Scientific Manual
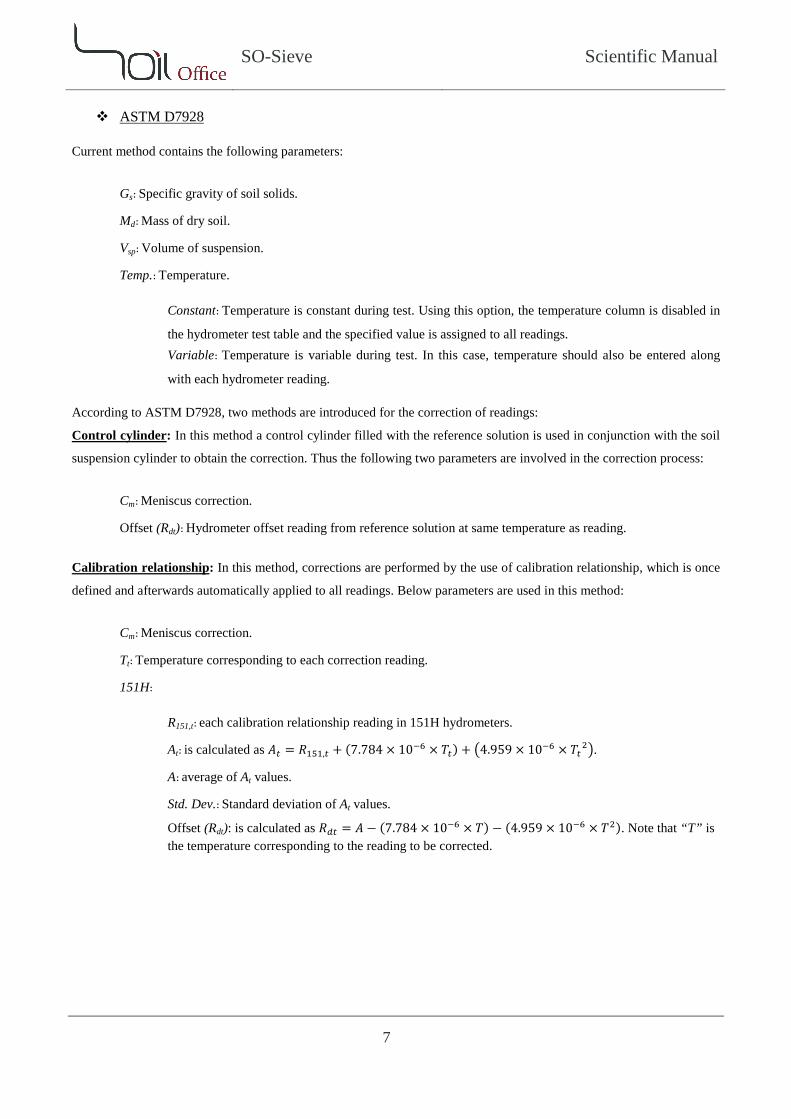
ASTM D7928
Current method contains the following parameters:
Gs: Specific gravity of soil solids.
Md: Mass of dry soil.
Vsp: Volume of suspension.
Temp.: Temperature.
Constant: Temperature is constant during test. Using this option, the temperature column is disabled in
the hydrometer test table and the specified value is assigned to all readings. Variable: Temperature is variable during test. In this case, temperature should also be entered along
with each hydrometer reading.
According to ASTM D7928, two methods are introduced for the correction of readings: Control cylinder: In this method a control cylinder filled with the reference solution is used in conjunction with the soil
suspension cylinder to obtain the correction. Thus the following two parameters are involved in the correction process:
Cm: Meniscus correction.
Offset (Rdt): Hydrometer offset reading from reference solution at same temperature as reading.
Calibration relationship: In this method, corrections are performed by the use of calibration relationship, which is once
defined and afterwards automatically applied to all readings. Below parameters are used in this method:
Cm: Meniscus correction.
Tt: Temperature corresponding to each correction reading.
151H:
R151,t: each calibration relationship reading in 151H hydrometers.
At: is calculated as 𝐴𝑡 = 𝑅151,𝑡 + (7.784 × 10⁻⁶ × 𝑇𝑡) + �4.959 × 10⁻⁶ × 𝑇𝑡2�. A: average of At values. Std. Dev.: Standard deviation of At values. Offset (Rdt): is calculated as 𝑅𝑑𝑡 = 𝐴 − (7.784 × 10⁻⁶ × 𝑇) − (4.959 × 10⁻⁶ × 𝑇2). Note that “T” is the temperature corresponding to the reading to be corrected.
7
SO-Sieve Scientific Manual
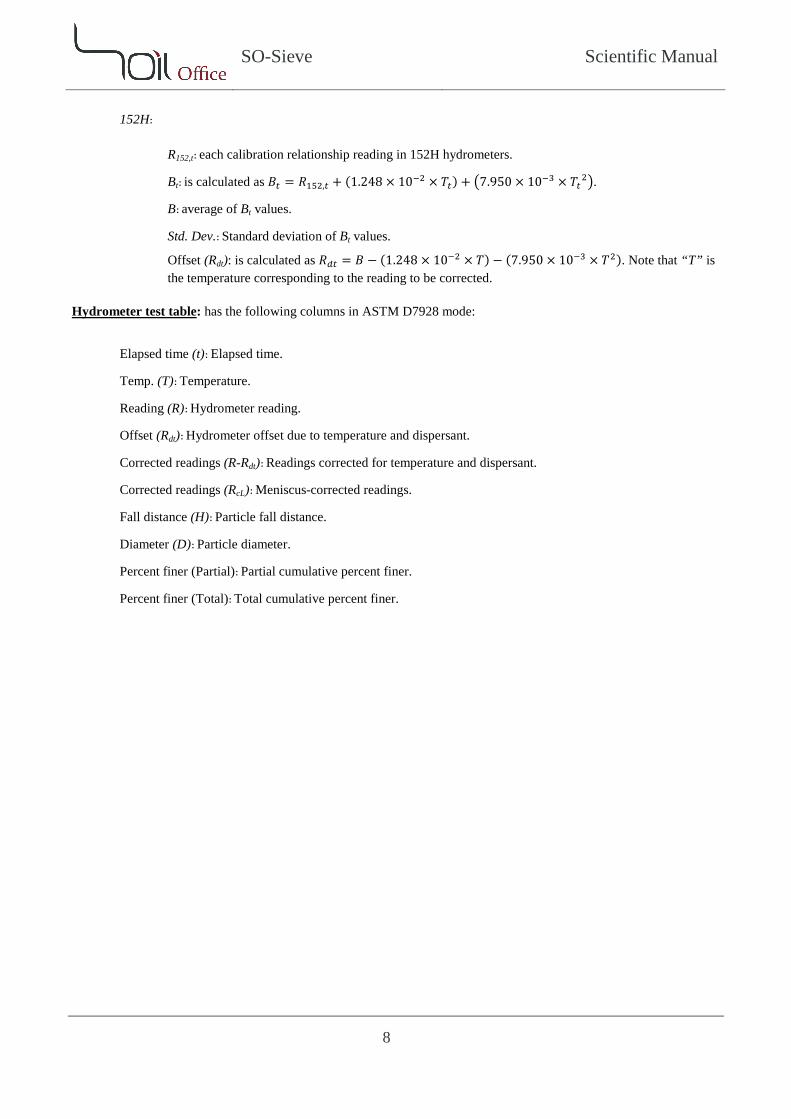
152H:
R152,t: each calibration relationship reading in 152H hydrometers.
Bt: is calculated as 𝐵𝑡 = 𝑅152,𝑡 + (1.248 × 10⁻² × 𝑇𝑡) + �7.950 × 10⁻³ × 𝑇𝑡2�. B: average of Bt values. Std. Dev.: Standard deviation of Bt values. Offset (Rdt): is calculated as 𝑅𝑑𝑡 = 𝐵 − (1.248 × 10⁻² × 𝑇) − (7.950 × 10⁻³ × 𝑇2). Note that “T” is the temperature corresponding to the reading to be corrected.
Hydrometer test table: has the following columns in ASTM D7928 mode:
Elapsed time (t): Elapsed time.
Temp. (T): Temperature. Reading (R): Hydrometer reading.
Offset (Rdt): Hydrometer offset due to temperature and dispersant.
Corrected readings (R-Rdt): Readings corrected for temperature and dispersant.
Corrected readings (RcL): Meniscus-corrected readings.
Fall distance (H): Particle fall distance.
Diameter (D): Particle diameter.
Percent finer (Partial): Partial cumulative percent finer.
Percent finer (Total): Total cumulative percent finer.
8
SO-Sieve Scientific Manual
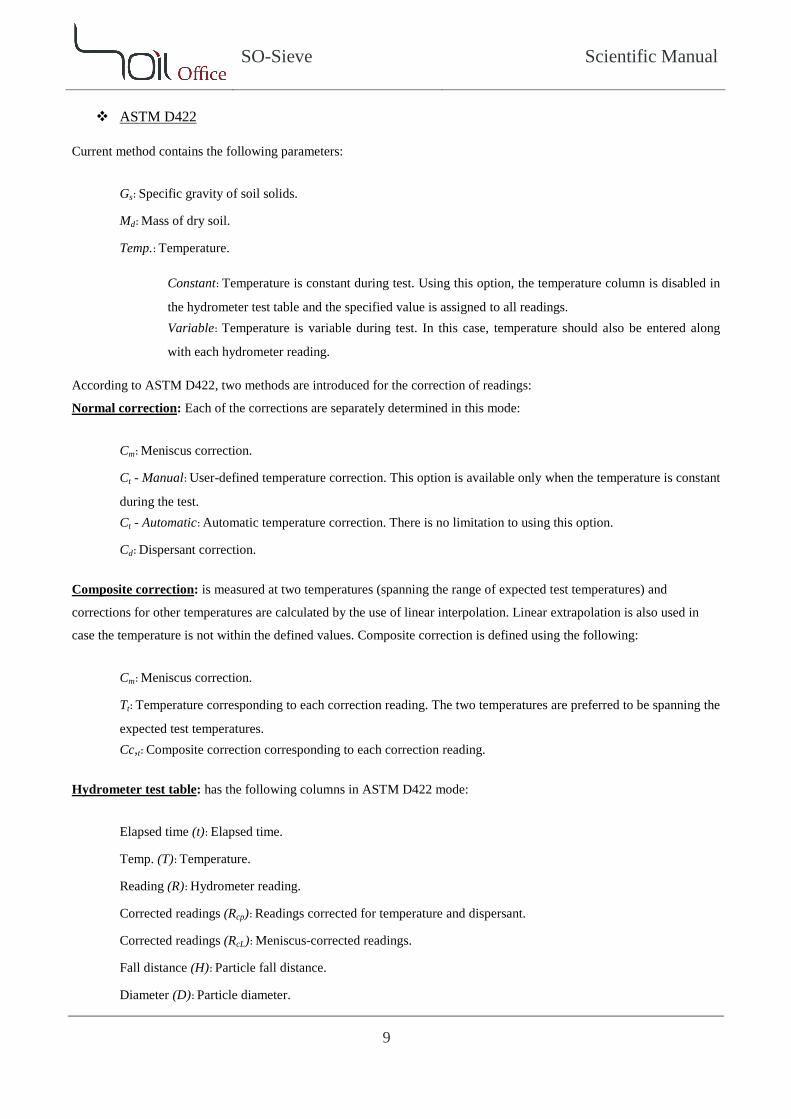
ASTM D422
Current method contains the following parameters:
Gs: Specific gravity of soil solids.
Md: Mass of dry soil.
Temp.: Temperature.
Constant: Temperature is constant during test. Using this option, the temperature column is disabled in
the hydrometer test table and the specified value is assigned to all readings. Variable: Temperature is variable during test. In this case, temperature should also be entered along
with each hydrometer reading.
According to ASTM D422, two methods are introduced for the correction of readings:
Normal correction: Each of the corrections are separately determined in this mode:
Cm: Meniscus correction.
Ct - Manual: User-defined temperature correction. This option is available only when the temperature is constant
during the test. Ct - Automatic: Automatic temperature correction. There is no limitation to using this option.
Cd: Dispersant correction.
Composite correction: is measured at two temperatures (spanning the range of expected test temperatures) and
corrections for other temperatures are calculated by the use of linear interpolation. Linear extrapolation is also used in
case the temperature is not within the defined values. Composite correction is defined using the following:
Cm: Meniscus correction.
Tt: Temperature corresponding to each correction reading. The two temperatures are preferred to be spanning the
expected test temperatures. Cc,t: Composite correction corresponding to each correction reading.
Hydrometer test table: has the following columns in ASTM D422 mode:
Elapsed time (t): Elapsed time.
Temp. (T): Temperature. Reading (R): Hydrometer reading.
Corrected readings (Rcp): Readings corrected for temperature and dispersant.
Corrected readings (RcL): Meniscus-corrected readings.
Fall distance (H): Particle fall distance.
Diameter (D): Particle diameter.
9
SO-Sieve Scientific Manual
Percent finer (Partial): Partial cumulative percent finer.
Percent finer (Total): Total cumulative percent finer.
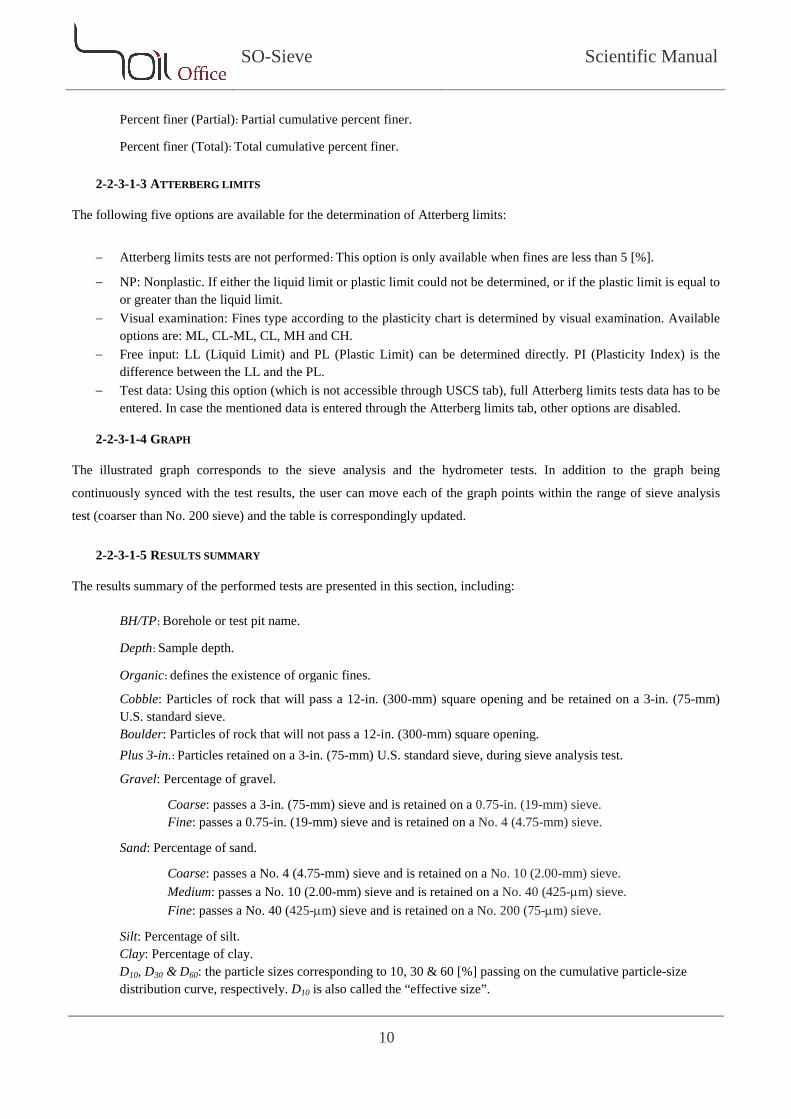
2-2-3-1-3 ATTERBERG LIMITS
The following five options are available for the determination of Atterberg limits:
− Atterberg limits tests are not performed: This option is only available when fines are less than 5 [%].
− NP: Nonplastic. If either the liquid limit or plastic limit could not be determined, or if the plastic limit is equal to or greater than the liquid limit.
− Visual examination: Fines type according to the plasticity chart is determined by visual examination. Available options are: ML, CL-ML, CL, MH and CH.
− Free input: LL (Liquid Limit) and PL (Plastic Limit) can be determined directly. PI (Plasticity Index) is the difference between the LL and the PL.
− Test data: Using this option (which is not accessible through USCS tab), full Atterberg limits tests data has to be entered. In case the mentioned data is entered through the Atterberg limits tab, other options are disabled.
2-2-3-1-4 GRAPH
The illustrated graph corresponds to the sieve analysis and the hydrometer tests. In addition to the graph being
continuously synced with the test results, the user can move each of the graph points within the range of sieve analysis
test (coarser than No. 200 sieve) and the table is correspondingly updated.
2-2-3-1-5 RESULTS SUMMARY
The results summary of the performed tests are presented in this section, including:
BH/TP: Borehole or test pit name.
Depth: Sample depth.
Organic: defines the existence of organic fines.
Cobble: Particles of rock that will pass a 12-in. (300-mm) square opening and be retained on a 3-in. (75-mm) U.S. standard sieve. Boulder: Particles of rock that will not pass a 12-in. (300-mm) square opening. Plus 3-in.: Particles retained on a 3-in. (75-mm) U.S. standard sieve, during sieve analysis test.
Gravel: Percentage of gravel.
Coarse: passes a 3-in. (75-mm) sieve and is retained on a 0.75-in. (19-mm) sieve. Fine: passes a 0.75-in. (19-mm) sieve and is retained on a No. 4 (4.75-mm) sieve.
Sand: Percentage of sand.
Coarse: passes a No. 4 (4.75-mm) sieve and is retained on a No. 10 (2.00-mm) sieve. Medium: passes a No. 10 (2.00-mm) sieve and is retained on a No. 40 (425-µm) sieve. Fine: passes a No. 40 (425-µm) sieve and is retained on a No. 200 (75-µm) sieve.
Silt: Percentage of silt. Clay: Percentage of clay. D10, D30 & D60: the particle sizes corresponding to 10, 30 & 60 [%] passing on the cumulative particle-size distribution curve, respectively. D10 is also called the “effective size”.
10
SO-Sieve Scientific Manual
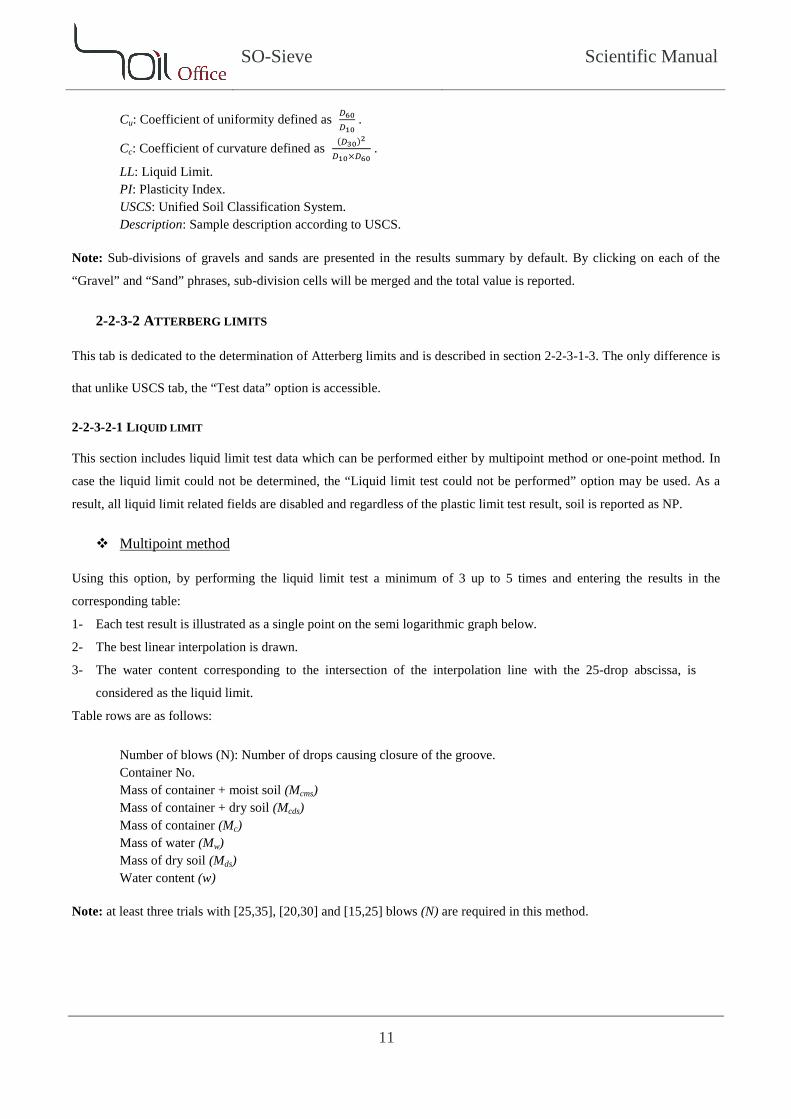
Cu: Coefficient of uniformity defined as 𝐷60
𝐷10 .
Cc: Coefficient of curvature defined as (𝐷30)2
𝐷10×𝐷60 .
LL: Liquid Limit. PI: Plasticity Index. USCS: Unified Soil Classification System. Description: Sample description according to USCS.
Note: Sub-divisions of gravels and sands are presented in the results summary by default. By clicking on each of the
“Gravel” and “Sand” phrases, sub-division cells will be merged and the total value is reported.
ATTERBERG LIMITS 2-2-3-2
This tab is dedicated to the determination of Atterberg limits and is described in section 2-2-3-1-3. The only difference is
that unlike USCS tab, the “Test data” option is accessible.
2-2-3-2-1 LIQUID LIMIT
This section includes liquid limit test data which can be performed either by multipoint method or one-point method. In
case the liquid limit could not be determined, the “Liquid limit test could not be performed” option may be used. As a
result, all liquid limit related fields are disabled and regardless of the plastic limit test result, soil is reported as NP.
Multipoint method
Using this option, by performing the liquid limit test a minimum of 3 up to 5 times and entering the results in the
corresponding table:
1- Each test result is illustrated as a single point on the semi logarithmic graph below.
2- The best linear interpolation is drawn.
3- The water content corresponding to the intersection of the interpolation line with the 25-drop abscissa, is
considered as the liquid limit.
Table rows are as follows:
Number of blows (N): Number of drops causing closure of the groove. Container No. Mass of container + moist soil (Mcms) Mass of container + dry soil (Mcds) Mass of container (Mc) Mass of water (Mw) Mass of dry soil (Mds) Water content (w)
Note: at least three trials with [25,35], [20,30] and [15,25] blows (N) are required in this method.
11
SO-Sieve Scientific Manual
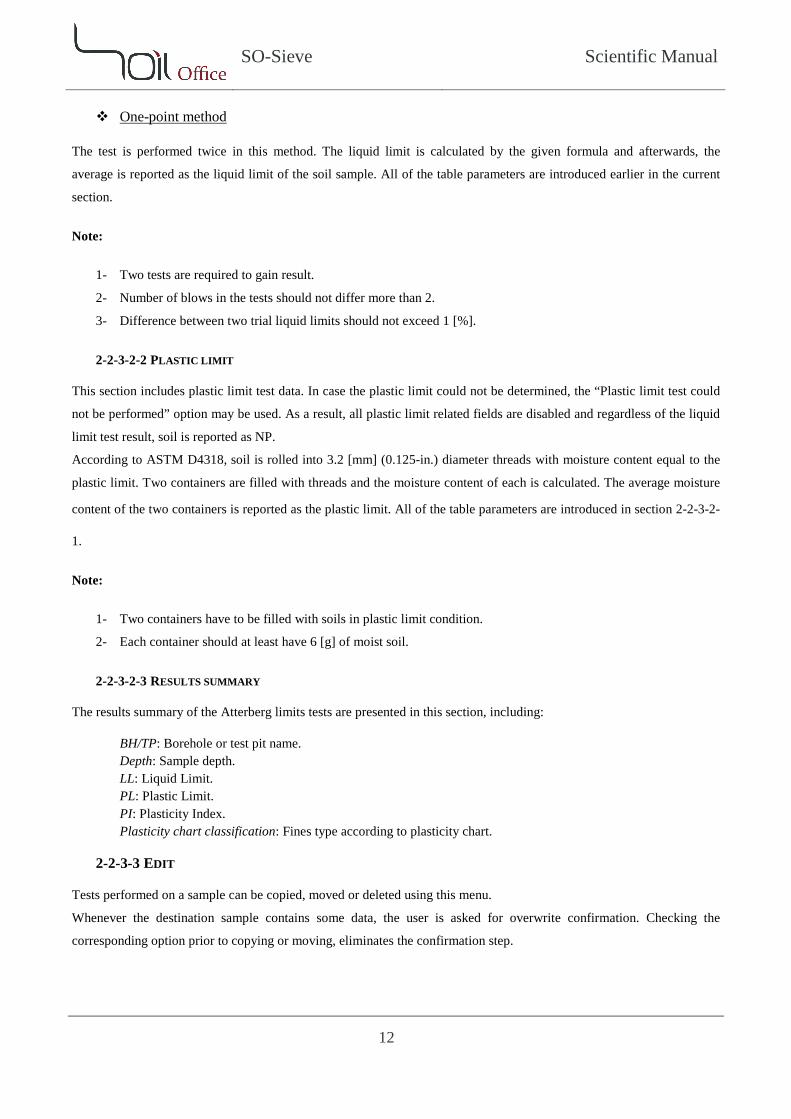
One-point method
The test is performed twice in this method. The liquid limit is calculated by the given formula and afterwards, the
average is reported as the liquid limit of the soil sample. All of the table parameters are introduced earlier in the current
section.
Note:
1- Two tests are required to gain result.
2- Number of blows in the tests should not differ more than 2.
3- Difference between two trial liquid limits should not exceed 1 [%].
2-2-3-2-2 PLASTIC LIMIT
This section includes plastic limit test data. In case the plastic limit could not be determined, the “Plastic limit test could
not be performed” option may be used. As a result, all plastic limit related fields are disabled and regardless of the liquid
limit test result, soil is reported as NP.
According to ASTM D4318, soil is rolled into 3.2 [mm] (0.125-in.) diameter threads with moisture content equal to the
plastic limit. Two containers are filled with threads and the moisture content of each is calculated. The average moisture
content of the two containers is reported as the plastic limit. All of the table parameters are introduced in section 2-2-3-2-
1.
Note:
1- Two containers have to be filled with soils in plastic limit condition.
2- Each container should at least have 6 [g] of moist soil.
2-2-3-2-3 RESULTS SUMMARY
The results summary of the Atterberg limits tests are presented in this section, including:
BH/TP: Borehole or test pit name. Depth: Sample depth. LL: Liquid Limit. PL: Plastic Limit. PI: Plasticity Index. Plasticity chart classification: Fines type according to plasticity chart.
EDIT 2-2-3-3
Tests performed on a sample can be copied, moved or deleted using this menu. Whenever the destination sample contains some data, the user is asked for overwrite confirmation. Checking the
corresponding option prior to copying or moving, eliminates the confirmation step.
12
SO-Sieve Scientific Manual
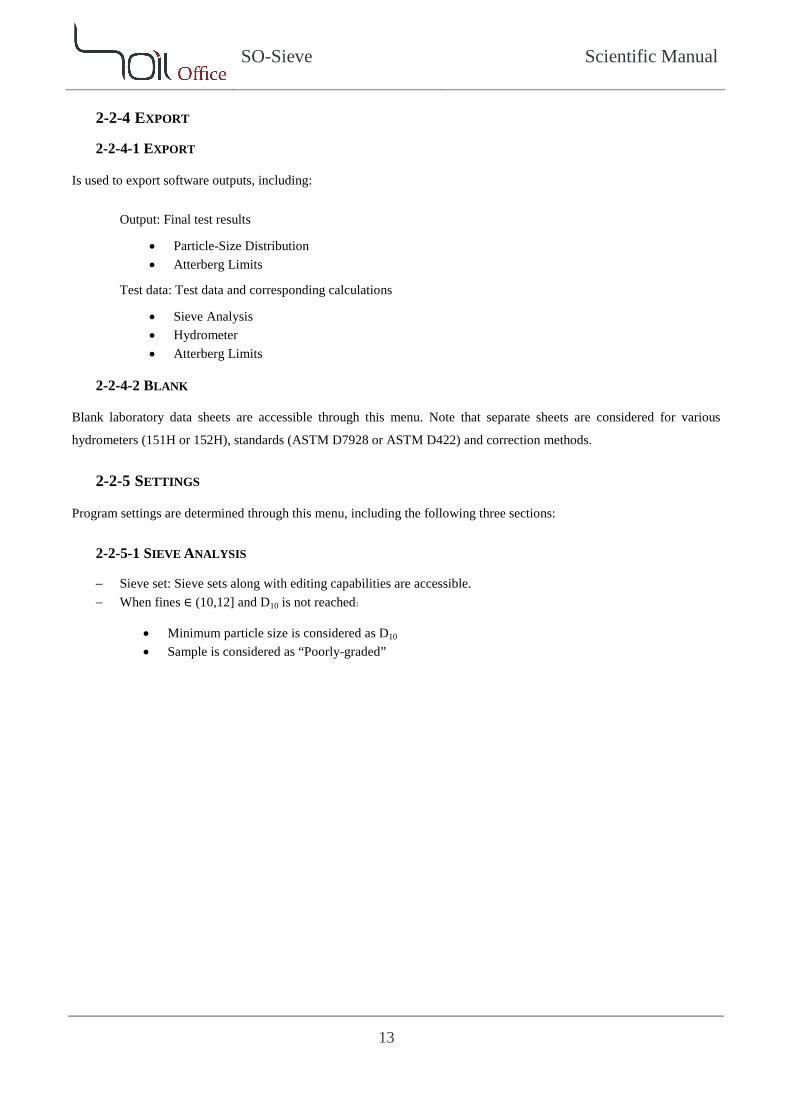
EXPORT 2-2-4
EXPORT 2-2-4-1
Is used to export software outputs, including:
Output: Final test results
Particle-Size Distribution • Atterberg Limits •
Test data: Test data and corresponding calculations
Sieve Analysis • Hydrometer • Atterberg Limits •
BLANK 2-2-4-2
Blank laboratory data sheets are accessible through this menu. Note that separate sheets are considered for various
hydrometers (151H or 152H), standards (ASTM D7928 or ASTM D422) and correction methods.
SETTINGS 2-2-5
Program settings are determined through this menu, including the following three sections:
SIEVE ANALYSIS 2-2-5-1
− Sieve set: Sieve sets along with editing capabilities are accessible. − When fines ∈ (10,12] and D10 is not reached:
• Minimum particle size is considered as D10 • Sample is considered as “Poorly-graded”
13
SO-Sieve Scientific Manual
HYDROMETER 2-2-5-2
− Particles finer than 0.002/0.005 [mm] are considered as clay: 0.002 [mm] is considered as default but can be altered by user’s will.
− Default mode: Default test mode (including the standard and the hydrometer type) is determined through this option.
− Time list.
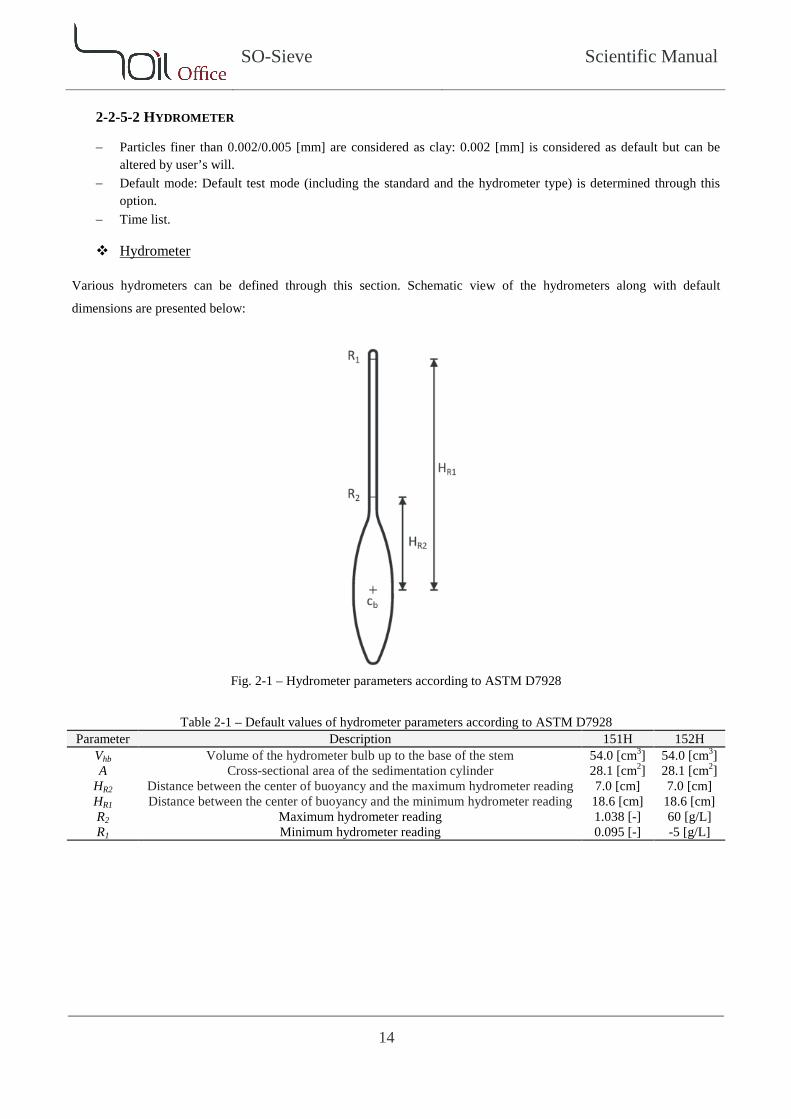
Hydrometer
Various hydrometers can be defined through this section. Schematic view of the hydrometers along with default
dimensions are presented below:
Fig. 2-1 – Hydrometer parameters according to ASTM D7928
Table 2-1 – Default values of hydrometer parameters according to ASTM D7928 152H 151H Description Parameter
54.0 [cm3] 54.0 [cm3] Volume of the hydrometer bulb up to the base of the stem Vhb 28.1 [cm2] 28.1 [cm2] Cross-sectional area of the sedimentation cylinder A 7.0 [cm] 7.0 [cm] Distance between the center of buoyancy and the maximum hydrometer reading HR2
18.6 [cm] 18.6 [cm] Distance between the center of buoyancy and the minimum hydrometer reading HR1 60 [g/L] 1.038 [-] Maximum hydrometer reading R2 -5 [g/L] 0.095 [-] Minimum hydrometer reading R1
14
SO-Sieve Scientific Manual
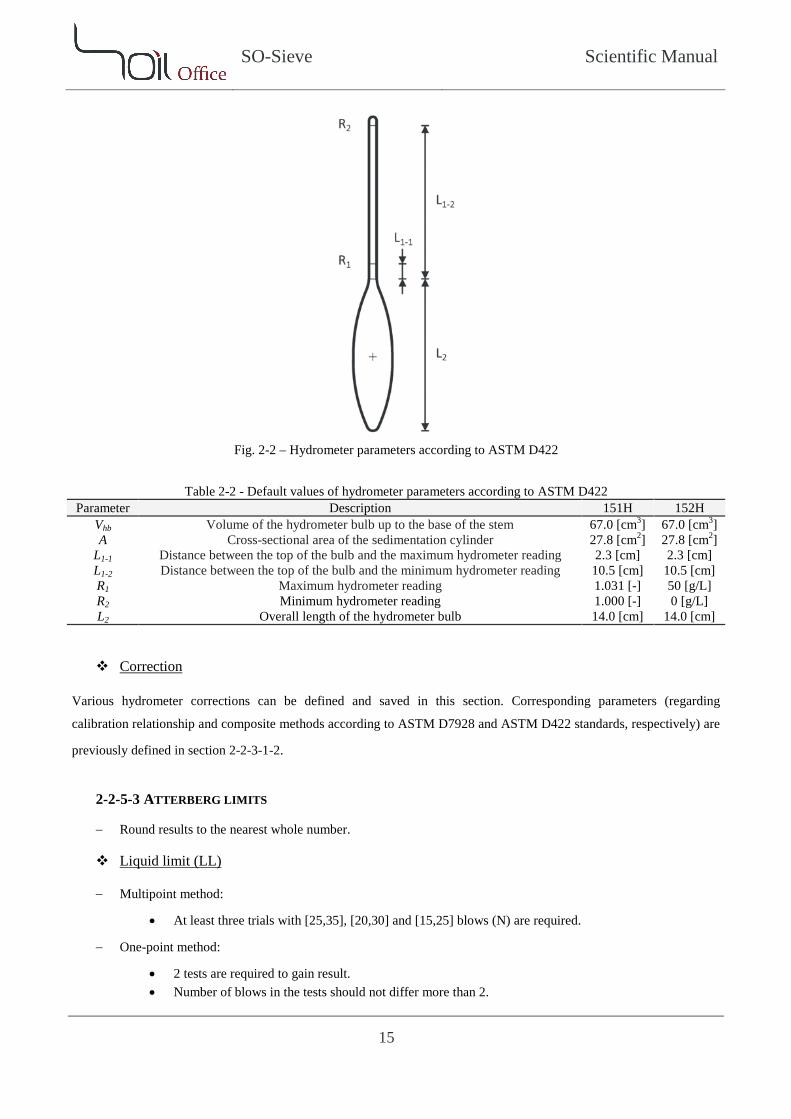
Fig. 2-2 – Hydrometer parameters according to ASTM D422
Table 2-2 - Default values of hydrometer parameters according to ASTM D422 152H 151H Description Parameter
67.0 [cm3] 67.0 [cm3] Volume of the hydrometer bulb up to the base of the stem Vhb 27.8 [cm2] 27.8 [cm2] Cross-sectional area of the sedimentation cylinder A 2.3 [cm] 2.3 [cm] Distance between the top of the bulb and the maximum hydrometer reading L1-1
10.5 [cm] 10.5 [cm] Distance between the top of the bulb and the minimum hydrometer reading L1-2 50 [g/L] 1.031 [-] Maximum hydrometer reading R1 0 [g/L] 1.000 [-] Minimum hydrometer reading R2
14.0 [cm] 14.0 [cm] Overall length of the hydrometer bulb L2
Correction
Various hydrometer corrections can be defined and saved in this section. Corresponding parameters (regarding
calibration relationship and composite methods according to ASTM D7928 and ASTM D422 standards, respectively) are
previously defined in section 2-2-3-1-2.
ATTERBERG LIMITS 2-2-5-3
− Round results to the nearest whole number.
Liquid limit (LL)
− Multipoint method:
At least three trials with [25,35], [20,30] and [15,25] blows (N) are required. •
− One-point method:
2 tests are required to gain result. • Number of blows in the tests should not differ more than 2. •
15
SO-Sieve Scientific Manual
Difference between 2 trial liquid limits should not exceed 1 [%]. •
Plastic limit (PL)
− 2 containers have to be filled with soils in plastic limit condition. − Each container should at least have 6 [g] of moist soil.
16
SO-Sieve Scientific Manual
3 ERRORS
Possible errors in the software are divided to primary and secondary errors which are described in the current chapter.
PRIMARY ERRORS 3-1
Whenever wrong or illogical data are entered, the corresponding cells’ colors are altered and a message is shown in the
bottom ribbon to guide the user. The utilized colors are described below:
Red: The cell is empty or of the wrong data type. Orange: The entered valued is not acceptable. Green: Calculations may be performed, but the cell value seems to be illogical. Pink: Demo version limitations.
Note: Project data cannot be saved while primary errors (except green type) exist.
SECONDARY ERRORS 3-2
Unlike primary errors, secondary errors do not apply any limitations on saving project data and are mostly encountered
when changes in some data, cause some others to be inaccurate or incompatible. These errors are of 2 types;
compatibility and depth:
Compatibility errors: Identify incompatibility among input data. Depth errors: Identify errors due to depth values.
Secondary errors have the following advantages:
− Software does not crash. − All errors regarding each input data are individually specified.
Note: By clicking on the error types located beneath the tables, a message is shown and the user is informed about the
probable cause or causes of the errors.
17
SO-Sieve Scientific Manual
4 CALCULATION THEORIES
In this chapter, brief descriptions regarding sieve analysis, hydrometer and Atterberg limits tests are presented. Also
utilized parameters along with calculation methods are fully described. Note that all parameters are defined in this
chapter for the ease of access and the calculational parameters are marked with an asterisk (*).
SIEVE ANALYSIS TEST 4-1
The grain-size distribution of coarse-grained soil is generally determined by means of sieve analysis. A sieve analysis is
conducted by taking a measured amount of dry, well-pulverized soil and passing it through a stack of progressively finer
sieves with a pan at the bottom. The amount of soil retained on each sieve is measured, and the cumulative percentage of
soil passing through each is determined. This percentage is generally referred to as percent finer.
The percent finer for each sieve is plotted on semilogarithmic graph. Note that the grain diameter is plotted on the
logarithmic scale and the percent finer is plotted on the arithmetic scale.
Sieve analysis test includes the following parameters:
Dry mass: Sample dry mass, [g]. Sieve: Sieve name. Opening: Sieve opening, [mm]. Mass retained: Soil mass retained on sieve, [g]. Pan: Soil mass retained on the pan, [g]. (∗) Mass retained [%]: Soil mass retained on sieve, [%]. (∗) Cumulative percent coarser: Cumulative percent of soil retained on a sieve, [%]. (∗) Cumulative percent finer: Cumulative percent of soil passing a sieve, [%].
Calculations are as below:
𝑀𝑎𝑠𝑠 𝑟𝑒𝑡𝑎𝑖𝑛𝑒𝑑 [%] =𝑀𝑎𝑠𝑠 𝑟𝑒𝑡𝑎𝑖𝑛𝑒𝑑𝐷𝑟𝑦 𝑚𝑎𝑠𝑠
× 100
𝐶𝑢𝑚𝑢𝑙𝑎𝑡𝑖𝑣𝑒 𝑝𝑒𝑟𝑐𝑒𝑛𝑡 𝑐𝑜𝑎𝑟𝑠𝑒𝑟 (𝑡ℎ𝑎𝑛 𝑖𝑡ℎ 𝑠𝑖𝑒𝑣𝑒) = �(𝑀𝑎𝑠𝑠 𝑟𝑒𝑡𝑎𝑖𝑛𝑒𝑑 [%])𝑖
𝑖=1
𝐶𝑢𝑚𝑢𝑙𝑎𝑡𝑖𝑣𝑒 𝑝𝑒𝑟𝑐𝑒𝑛𝑡 𝑓𝑖𝑛𝑒𝑟 (𝑡ℎ𝑎𝑛 𝑖𝑡ℎ 𝑠𝑖𝑒𝑣𝑒) = 100 −�(𝑀𝑎𝑠𝑠 𝑟𝑒𝑡𝑎𝑖𝑛𝑒𝑑 [%])𝑖
𝑖=1
18
SO-Sieve Scientific Manual
HYDROMETER TEST 4-2
Hydrometer test is based on the principle of sedimentation of soil particles in water and is used to determine the particle-
size distribution of the material that is finer than the No. 200 (75-μm) sieve and larger than about 0.2 [μm]. The test is
performed on material passing the No. 10 (2.0-mm) or finer sieve. The test specimen is mixed with a dispersing agent
and test water. The slurry is allowed to condition and is then thoroughly mixed and placed in a cylinder with additional
test water. Readings are taken with a hydrometer and thermometer over specific time intervals. Calculations are
performed and the results are presented as the mass percent finer versus the log of the particle diameter.
Hydrometer test could be performed and calculated using both ASTM D7928 and ASTM D422 (withdrawn 2016)
standards with the following parameters in common:
Type: Hydrometer type (151H or 152H). Separation sieve: the sieve that the hydrometer test material is passed through. Passing: Cumulative percent finer of the sample corresponding to the separation sieve, which is automatically calculated (if possible) and as a result, hydrometer graph is attached to sieve analysis graph, [%].
19
SO-Sieve Scientific Manual
ASTM D7928 4-2-1
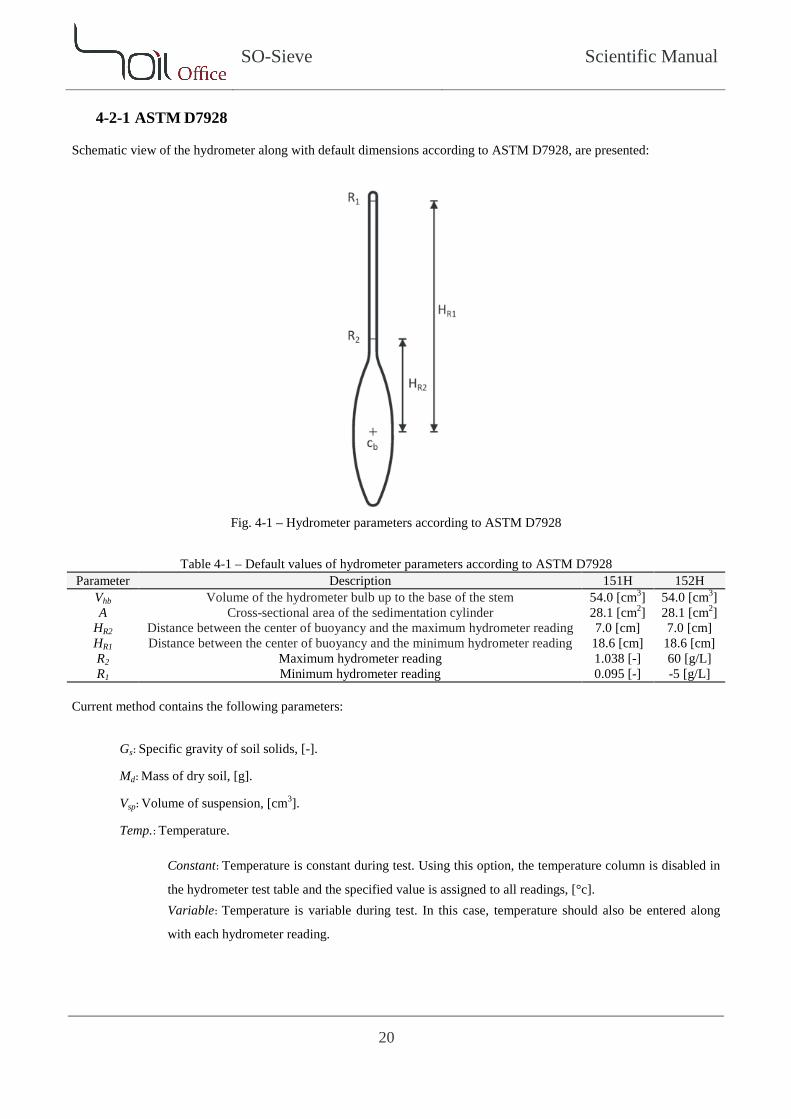
Schematic view of the hydrometer along with default dimensions according to ASTM D7928, are presented:
Fig. 4-1 – Hydrometer parameters according to ASTM D7928
Table 4-1 – Default values of hydrometer parameters according to ASTM D7928 152H 151H Description Parameter
54.0 [cm3] 54.0 [cm3] Volume of the hydrometer bulb up to the base of the stem Vhb 28.1 [cm2] 28.1 [cm2] Cross-sectional area of the sedimentation cylinder A 7.0 [cm] 7.0 [cm] Distance between the center of buoyancy and the maximum hydrometer reading HR2
18.6 [cm] 18.6 [cm] Distance between the center of buoyancy and the minimum hydrometer reading HR1 60 [g/L] 1.038 [-] Maximum hydrometer reading R2 -5 [g/L] 0.095 [-] Minimum hydrometer reading R1
Current method contains the following parameters:
Gs: Specific gravity of soil solids, [-].
Md: Mass of dry soil, [g].
Vsp: Volume of suspension, [cm3].
Temp.: Temperature.
Constant: Temperature is constant during test. Using this option, the temperature column is disabled in
the hydrometer test table and the specified value is assigned to all readings, [°c]. Variable: Temperature is variable during test. In this case, temperature should also be entered along
with each hydrometer reading.
20
SO-Sieve Scientific Manual
According to ASTM D7928, two methods are introduced for the correction of readings: Control cylinder: In this method a control cylinder filled with the reference solution is used in conjunction with the soil
suspension cylinder to obtain the correction. Thus the following two parameters are involved in the correction process:
Cm: Meniscus correction, 151H: [-] 152H: [g/L].
Offset (Rdt): Hydrometer offset reading from reference solution at same temperature as reading, 151H: [-]
152H: [g/L].
Calibration relationship: In this method, corrections are performed by the use of calibration relationship, which is once
defined and afterwards automatically applied to all readings. Below parameters are used in this method:
Cm: Meniscus correction, 151H: [-] 152H: [g/L].
Tt: Temperature corresponding to each correction reading, [°c].
151H:
R151,t: each calibration relationship reading in 151H hydrometers, [-].
(∗) At: is calculated as 𝐴𝑡 = 𝑅151,𝑡 + (7.784 × 10⁻⁶ × 𝑇𝑡) + �4.959 × 10⁻⁶ × 𝑇𝑡2�. (∗) A: average of At values. (∗) Std. Dev.: Standard deviation of At values which has to be less than 0.0005. (∗) Offset (Rdt): is calculated as 𝑅𝑑𝑡 = 𝐴 − (7.784 × 10⁻⁶ × 𝑇) − (4.959 × 10⁻⁶ × 𝑇2). Note that “T” is the temperature corresponding to the reading to be corrected.
152H:
R152,t: each calibration relationship reading in 152H hydrometers, [g/L].
(∗) Bt: is calculated as 𝐵𝑡 = 𝑅152,𝑡 + (1.248 × 10⁻² × 𝑇𝑡) + �7.950 × 10⁻³ × 𝑇𝑡2�. (∗) B: average of Bt values. (∗) Std. Dev.: Standard deviation of Bt values which has to be less than 0.5. (∗) Offset (Rdt): is calculated as 𝑅𝑑𝑡 = 𝐵 − (1.248 × 10⁻² × 𝑇) − (7.950 × 10⁻³ × 𝑇2). Note that “T” is the temperature corresponding to the reading to be corrected.
21
SO-Sieve Scientific Manual
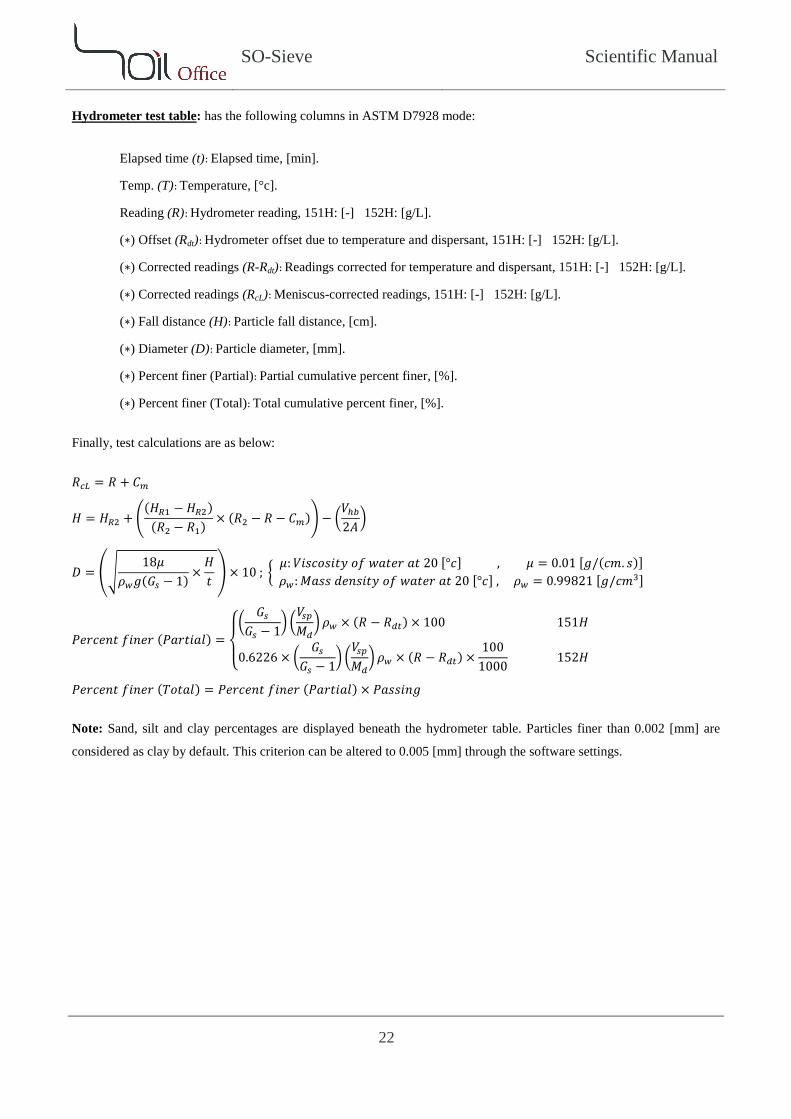
Hydrometer test table: has the following columns in ASTM D7928 mode:
Elapsed time (t): Elapsed time, [min].
Temp. (T): Temperature, [°c]. Reading (R): Hydrometer reading, 151H: [-] 152H: [g/L].
(∗) Offset (Rdt): Hydrometer offset due to temperature and dispersant, 151H: [-] 152H: [g/L].
(∗) Corrected readings (R-Rdt): Readings corrected for temperature and dispersant, 151H: [-] 152H: [g/L].
(∗) Corrected readings (RcL): Meniscus-corrected readings, 151H: [-] 152H: [g/L].
(∗) Fall distance (H): Particle fall distance, [cm].
(∗) Diameter (D): Particle diameter, [mm].
(∗) Percent finer (Partial): Partial cumulative percent finer, [%].
(∗) Percent finer (Total): Total cumulative percent finer, [%].
Finally, test calculations are as below:
𝑅𝑐𝐿 = 𝑅 + 𝐶𝑚
𝐻 = 𝐻𝑅2 + �(𝐻𝑅1 − 𝐻𝑅2)
(𝑅2 − 𝑅1) × (𝑅2 − 𝑅 − 𝐶𝑚)� − �𝑉ℎ𝑏2𝐴
�
𝐷 = ��18𝜇
𝜌𝑤𝑔(𝐺𝑠 − 1) ×𝐻𝑡
� × 10 ; � 𝜇:𝑉𝑖𝑠𝑐𝑜𝑠𝑖𝑡𝑦 𝑜𝑓 𝑤𝑎𝑡𝑒𝑟 𝑎𝑡 20 [°𝑐] , 𝜇 = 0.01 [𝑔/(𝑐𝑚. 𝑠)] 𝜌𝑤:𝑀𝑎𝑠𝑠 𝑑𝑒𝑛𝑠𝑖𝑡𝑦 𝑜𝑓 𝑤𝑎𝑡𝑒𝑟 𝑎𝑡 20 [°𝑐] , 𝜌𝑤 = 0.99821 [𝑔/𝑐𝑚3]
𝑃𝑒𝑟𝑐𝑒𝑛𝑡 𝑓𝑖𝑛𝑒𝑟 (𝑃𝑎𝑟𝑡𝑖𝑎𝑙) =
⎩⎨
⎧�𝐺𝑠
𝐺𝑠 − 1� �𝑉𝑠𝑝𝑀𝑑
� 𝜌𝑤 × (𝑅 − 𝑅𝑑𝑡) × 100 151𝐻
0.6226 × �𝐺𝑠
𝐺𝑠 − 1� �𝑉𝑠𝑝𝑀𝑑
� 𝜌𝑤 × (𝑅 − 𝑅𝑑𝑡) ×100
1000 152𝐻
𝑃𝑒𝑟𝑐𝑒𝑛𝑡 𝑓𝑖𝑛𝑒𝑟 (𝑇𝑜𝑡𝑎𝑙) = 𝑃𝑒𝑟𝑐𝑒𝑛𝑡 𝑓𝑖𝑛𝑒𝑟 (𝑃𝑎𝑟𝑡𝑖𝑎𝑙) × 𝑃𝑎𝑠𝑠𝑖𝑛𝑔
Note: Sand, silt and clay percentages are displayed beneath the hydrometer table. Particles finer than 0.002 [mm] are
considered as clay by default. This criterion can be altered to 0.005 [mm] through the software settings.
22
SO-Sieve Scientific Manual
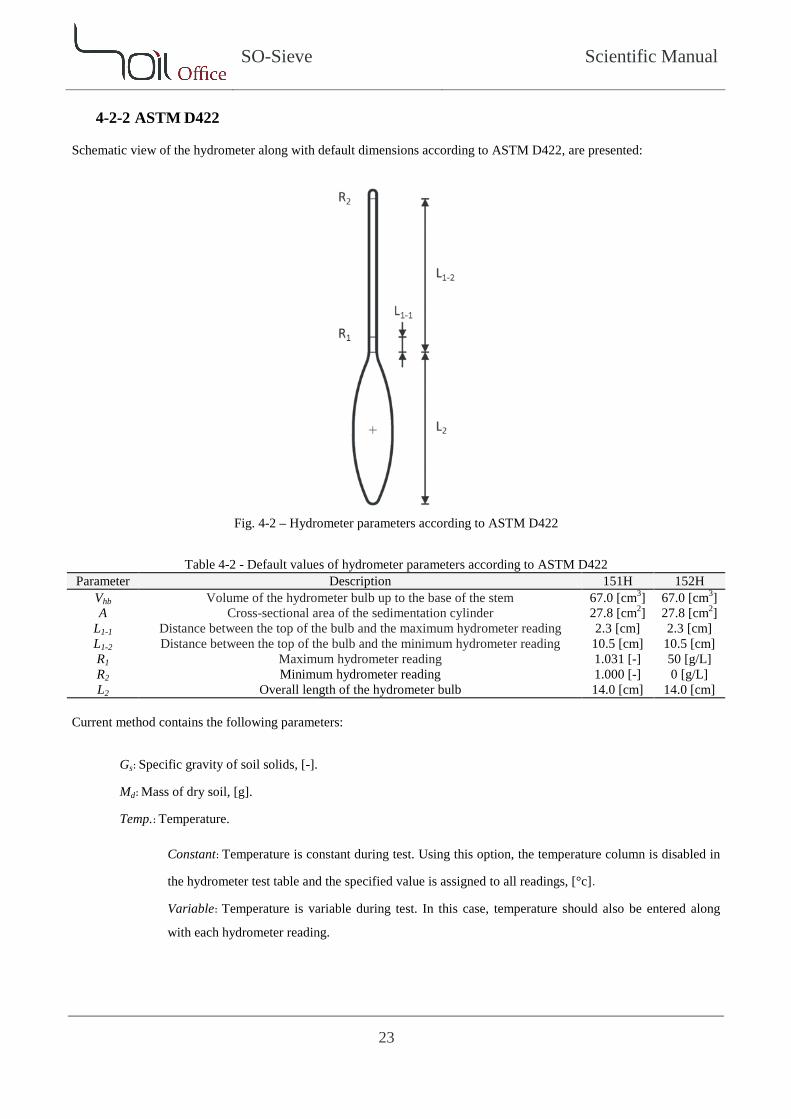
ASTM D422 4-2-2
Schematic view of the hydrometer along with default dimensions according to ASTM D422, are presented:
Fig. 4-2 – Hydrometer parameters according to ASTM D422
Table 4-2 - Default values of hydrometer parameters according to ASTM D422 152H 151H Description Parameter
67.0 [cm3] 67.0 [cm3] Volume of the hydrometer bulb up to the base of the stem Vhb 27.8 [cm2] 27.8 [cm2] Cross-sectional area of the sedimentation cylinder A 2.3 [cm] 2.3 [cm] Distance between the top of the bulb and the maximum hydrometer reading L1-1
10.5 [cm] 10.5 [cm] Distance between the top of the bulb and the minimum hydrometer reading L1-2 50 [g/L] 1.031 [-] Maximum hydrometer reading R1 0 [g/L] 1.000 [-] Minimum hydrometer reading R2
14.0 [cm] 14.0 [cm] Overall length of the hydrometer bulb L2
Current method contains the following parameters:
Gs: Specific gravity of soil solids, [-].
Md: Mass of dry soil, [g].
Temp.: Temperature.
Constant: Temperature is constant during test. Using this option, the temperature column is disabled in
the hydrometer test table and the specified value is assigned to all readings, [°c]. Variable: Temperature is variable during test. In this case, temperature should also be entered along
with each hydrometer reading.
23
SO-Sieve Scientific Manual
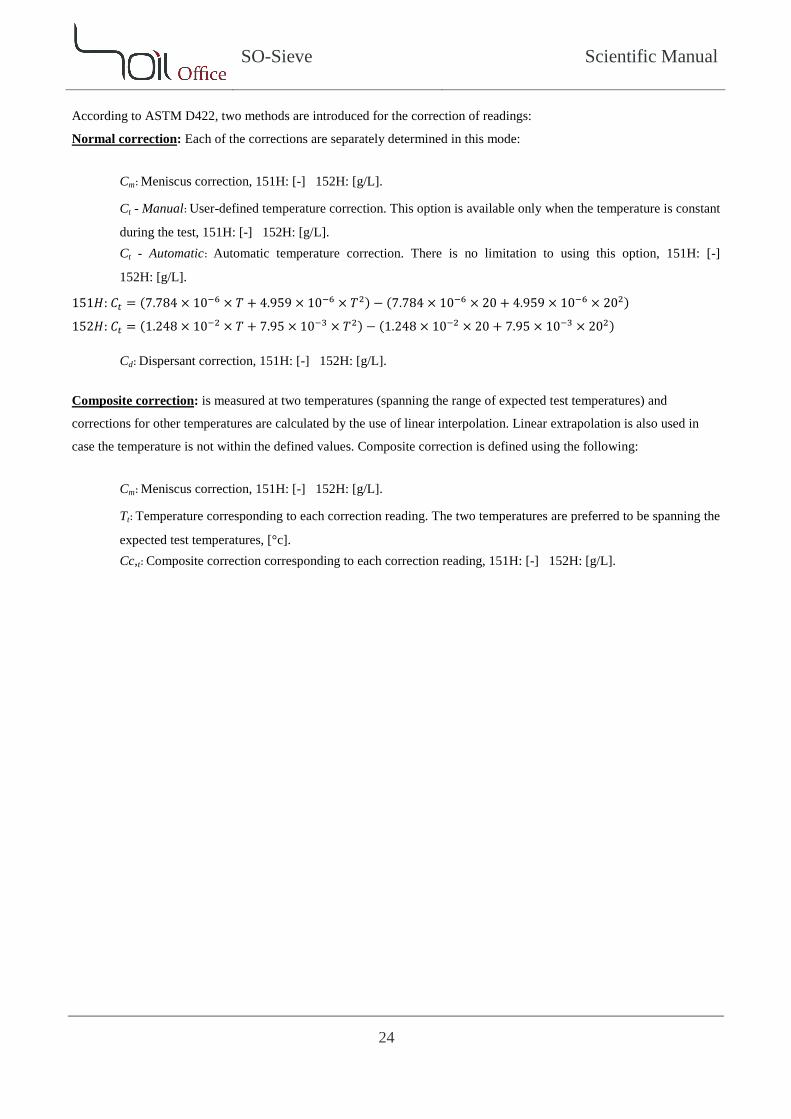
According to ASTM D422, two methods are introduced for the correction of readings:
Normal correction: Each of the corrections are separately determined in this mode:
Cm: Meniscus correction, 151H: [-] 152H: [g/L].
Ct - Manual: User-defined temperature correction. This option is available only when the temperature is constant
during the test, 151H: [-] 152H: [g/L]. Ct - Automatic: Automatic temperature correction. There is no limitation to using this option, 151H: [-]
152H: [g/L].
151𝐻: 𝐶𝑡 = (7.784 × 10⁻⁶ × 𝑇 + 4.959 × 10⁻⁶ × 𝑇2) − (7.784 × 10−6 × 20 + 4.959 × 10−6 × 202)
152𝐻: 𝐶𝑡 = (1.248 × 10⁻² × 𝑇 + 7.95 × 10⁻³ × 𝑇2) − (1.248 × 10−2 × 20 + 7.95 × 10−3 × 202)
Cd: Dispersant correction, 151H: [-] 152H: [g/L].
Composite correction: is measured at two temperatures (spanning the range of expected test temperatures) and
corrections for other temperatures are calculated by the use of linear interpolation. Linear extrapolation is also used in
case the temperature is not within the defined values. Composite correction is defined using the following:
Cm: Meniscus correction, 151H: [-] 152H: [g/L].
Tt: Temperature corresponding to each correction reading. The two temperatures are preferred to be spanning the
expected test temperatures, [°c]. Cc,t: Composite correction corresponding to each correction reading, 151H: [-] 152H: [g/L].
24
SO-Sieve Scientific Manual
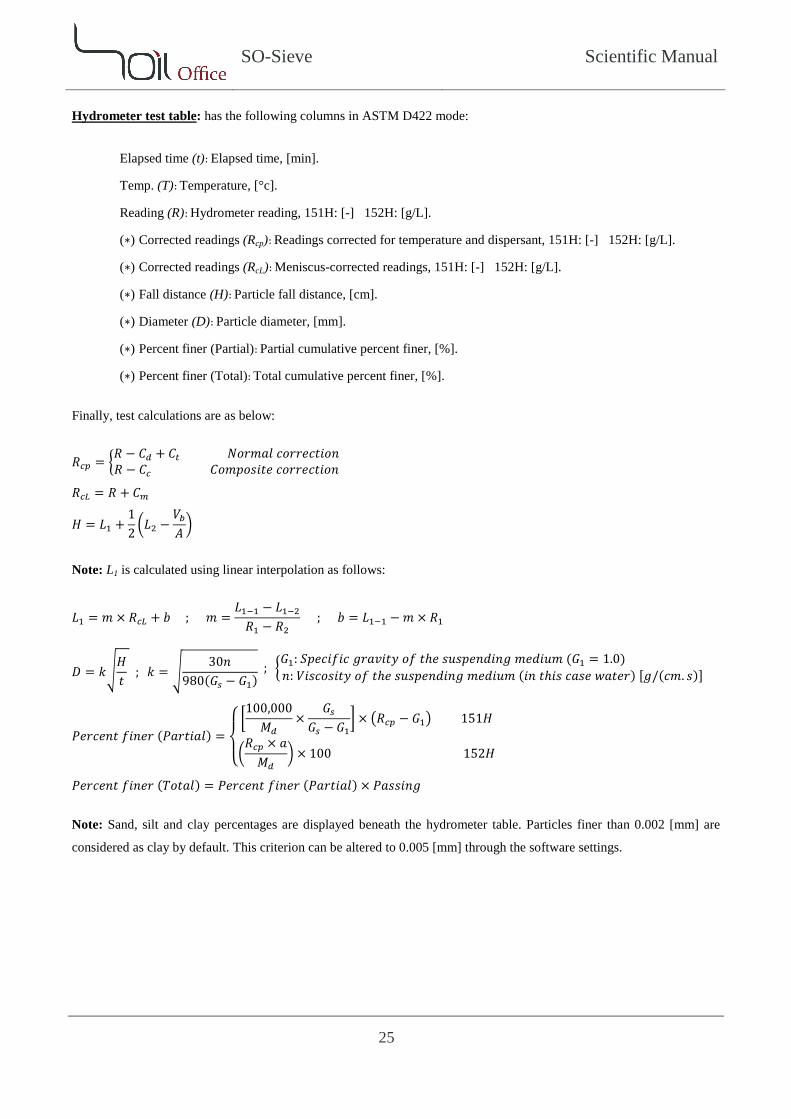
Hydrometer test table: has the following columns in ASTM D422 mode:
Elapsed time (t): Elapsed time, [min].
Temp. (T): Temperature, [°c]. Reading (R): Hydrometer reading, 151H: [-] 152H: [g/L].
(∗) Corrected readings (Rcp): Readings corrected for temperature and dispersant, 151H: [-] 152H: [g/L].
(∗) Corrected readings (RcL): Meniscus-corrected readings, 151H: [-] 152H: [g/L].
(∗) Fall distance (H): Particle fall distance, [cm].
(∗) Diameter (D): Particle diameter, [mm].
(∗) Percent finer (Partial): Partial cumulative percent finer, [%].
(∗) Percent finer (Total): Total cumulative percent finer, [%].
Finally, test calculations are as below:
𝑅𝑐𝑝 = �𝑅 − 𝐶𝑑 + 𝐶𝑡 𝑁𝑜𝑟𝑚𝑎𝑙 𝑐𝑜𝑟𝑟𝑒𝑐𝑡𝑖𝑜𝑛𝑅 − 𝐶𝑐 𝐶𝑜𝑚𝑝𝑜𝑠𝑖𝑡𝑒 𝑐𝑜𝑟𝑟𝑒𝑐𝑡𝑖𝑜𝑛
𝑅𝑐𝐿 = 𝑅 + 𝐶𝑚
𝐻 = 𝐿1 +12�𝐿2 −
𝑉𝑏𝐴�
Note: L1 is calculated using linear interpolation as follows:
𝐿1 = 𝑚 × 𝑅𝑐𝐿 + 𝑏 ; 𝑚 =𝐿1−1 − 𝐿1−2𝑅1 − 𝑅2
; 𝑏 = 𝐿1−1 − 𝑚 × 𝑅1
𝐷 = 𝑘�𝐻𝑡
; 𝑘 = �30𝑛
980(𝐺𝑠 − 𝐺1) ; �
𝐺1: 𝑆𝑝𝑒𝑐𝑖𝑓𝑖𝑐 𝑔𝑟𝑎𝑣𝑖𝑡𝑦 𝑜𝑓 𝑡ℎ𝑒 𝑠𝑢𝑠𝑝𝑒𝑛𝑑𝑖𝑛𝑔 𝑚𝑒𝑑𝑖𝑢𝑚 (𝐺1 = 1.0) 𝑛: 𝑉𝑖𝑠𝑐𝑜𝑠𝑖𝑡𝑦 𝑜𝑓 𝑡ℎ𝑒 𝑠𝑢𝑠𝑝𝑒𝑛𝑑𝑖𝑛𝑔 𝑚𝑒𝑑𝑖𝑢𝑚 (𝑖𝑛 𝑡ℎ𝑖𝑠 𝑐𝑎𝑠𝑒 𝑤𝑎𝑡𝑒𝑟) [𝑔/(𝑐𝑚. 𝑠)]
𝑃𝑒𝑟𝑐𝑒𝑛𝑡 𝑓𝑖𝑛𝑒𝑟 (𝑃𝑎𝑟𝑡𝑖𝑎𝑙) =
⎩⎨
⎧ �100,000𝑀𝑑
×𝐺𝑠
𝐺𝑠 − 𝐺1� × �𝑅𝑐𝑝 − 𝐺1� 151𝐻
�𝑅𝑐𝑝 × 𝑎𝑀𝑑
� × 100 152𝐻
𝑃𝑒𝑟𝑐𝑒𝑛𝑡 𝑓𝑖𝑛𝑒𝑟 (𝑇𝑜𝑡𝑎𝑙) = 𝑃𝑒𝑟𝑐𝑒𝑛𝑡 𝑓𝑖𝑛𝑒𝑟 (𝑃𝑎𝑟𝑡𝑖𝑎𝑙) × 𝑃𝑎𝑠𝑠𝑖𝑛𝑔
Note: Sand, silt and clay percentages are displayed beneath the hydrometer table. Particles finer than 0.002 [mm] are
considered as clay by default. This criterion can be altered to 0.005 [mm] through the software settings.
25
SO-Sieve Scientific Manual
ATTERBERG LIMITS TESTS 4-3
In cohesive soils, originally, six “limits of consistency” of fine-grained soils were defined by Albert Atterberg. In current
engineering usage, the term usually refers only to the liquid limit, plastic limit, and in some references, the shrinkage
limit. The methods described herein are performed only on that portion of a soil that passes the No. 40 (425-μm) sieve.
Note: Both liquid limit and plastic limit are whole numbers.
LIQUID LIMIT TEST 4-3-1
In cohesive soils, liquid limit (LL) is the water content, in percent, of a soil at the arbitrarily defined boundary between
the semi-liquid and plastic states. The undrained shear strength of soil at the liquid limit is considered to be
approximately
2 [kPa]. The liquid limit is determined by performing trials in which a portion of the specimen is spread in a brass cup,
divided in two by a grooving tool, and then allowed to flow together from the shocks caused by repeatedly dropping the
cup in a standard mechanical device. Liquid limit table rows are as follows:
Number of blows (N): Number of drops causing closure of the groove. Container No. Mass of container + moist soil (Mcms) Mass of container + dry soil (Mcds) Mass of container (Mc) (∗) Mass of water (Mw) (∗) Mass of dry soil (Mds) (∗) Water content (w)
Calculations are performed as follows:
𝑀𝑤 = 𝑀𝑐𝑚𝑠 −𝑀𝑐𝑑𝑠
𝑀𝑑𝑠 = 𝑀𝑐𝑑𝑠 − 𝑀𝑐
𝑤 =𝑀𝑤
𝑀𝑑𝑠
This test is performed by the following two methods:
MULTIPOINT METHOD 4-3-1-1
In this method at least three trials with [25,35], [20,30] and [15,25] blows (N) are required. In order to determine the
liquid limit, the relationship between the water content (w) and the corresponding numbers of drops (N) of the cup, are
plotted on a semilogarithmic graph with the water content as ordinates on the arithmetical scale, and the number of drops
as abscissas on a logarithmic scale. Afterwards, the best straight line is drawn through the plotted points. The water
content corresponding to the intersection of the line with the 25-drop abscissa is considered as the liquid limit.
26
SO-Sieve Scientific Manual
ONE-POINT METHOD 4-3-1-2
In this method two trials with [20,30] blows (N) are required. The liquid limit regarding each trial is calculated using the
following equation:
𝐿𝐿𝑛 = 𝑤𝑛 × �𝑁𝑛25�0.121
Where the subscripts indicate the test number. The liquid limit is the average of the two trial liquid limit values.
Note:
1- Number of blows in the tests should not differ more than 2. 2- Difference between two trial liquid limits should not exceed 1 [%].
PLASTIC LIMIT TEST 4-3-2
The plastic limit (PL) is determined by alternately pressing together and rolling into a 3.2 [mm] (0.125-in.) diameter
thread a small portion of plastic soil until its water content is reduced to a point at which the thread crumbles and can no
longer be pressed together and re-rolled. The water content of the soil at this point is reported as the plastic limit. Threads
with the mentioned criteria are placed in two containers and the average water content of the threads are calculated in
each. Plastic limit is the average water content of the two containers. All table parameters are previously defined in
section 4-3-1.
Note: Each container should at least have 6 [g] of moist soil.
PLASTICITY INDEX 4-3-3
Plasticity index is the difference between the liquid limit and the plastic limit.
𝑃𝐼 = 𝐿𝐿 − 𝑃𝐿
Note: If either the liquid limit or plastic limit could not be determined, or if the plastic limit is equal to or greater than the
liquid limit, the soil is reported as nonplastic (NP).
27

SO-Sieve Scientific Manual
5 CONTACT US
Feel free to contact us regarding any criticism, recommendation or additional information.
1- Visit www.soiloffice.com/ContactUs 2- Send an e-mail to [email protected] 3- Call (+98) 912 313 4107 – Emad Zargaran.
(Also available on WhatsApp and LINE) 4- Call “Emad.Zargaran” via Skype.
28
SO-Sieve Scientific Manual
6 LIST OF SYMBOLS
Symbol Description 1𝑠𝑡 𝑠𝑖𝑒𝑣𝑒 largest sieve used in sieve analysis test
𝐴 average of At values 𝐴𝑡 of the parameters used in the calibration relationship of 151H hydrometers 𝐵 average of Bt values 𝐵𝑡 of the parameters used in the calibration relationship of 152H hydrometers 𝐶𝑐 coefficient of curvature 𝐶𝑐 composite correction corresponding to each test reading 𝐶𝑐,𝑡 composite correction corresponding to each correction reading 𝐶𝑑 dispersant correction 𝐶𝑚 meniscus correction 𝐶𝑡 temperature correction 𝐶𝑢 coefficient of uniformity 𝐷 particle diameter
𝐷10,𝐷30 & 𝐷60 the particle sizes corresponding to 10, 30 & 60 [%] passing on the cumulative particle-size distribution curve, respectively. D10 is also called the “effective size”.
𝐸𝑙𝑒𝑣. ground elevation at top of boring 𝐺𝑠 specific gravity of soil solids
GWT depth to water table measured from boring top (Ground Water Table) 𝐻 particle fall distance 𝐿𝐿 Liquid Limit 𝑀𝑑 mass of dry soil 𝑁𝑃 Nonplastic 𝑃𝐼 Plasticity Index 𝑃𝐿 Plastic Limit 𝑅 hydrometer reading
𝑅151,𝑡 each calibration relationship reading in 151H hydrometers 𝑅152,𝑡 each calibration relationship reading in 152H hydrometers 𝑅𝑐𝐿 meniscus-corrected readings 𝑅𝑐𝑝 readings corrected for temperature and dispersant 𝑅𝑑𝑡 hydrometer offset due to temperature and dispersant
𝑅𝑑𝑡 hydrometer offset reading from reference solution at same temperature as reading (in control cylinder method)
𝑡 elapsed time 𝑇 temperature 𝑇𝑡 temperature corresponding to each correction reading
𝑈𝑆𝐶𝑆 Unified Soil Classification System 𝑉𝑠𝑝 volume of suspension 𝑊/𝑃 gradation type. “W” for well-graded and “P” for poorly-graded
29

![Sieves in discrete groups, especially sparselibrary.msri.org/books/Book61/files/35kowa.pdf · 2010]on the affine sieve. Another survey of sieves in discrete groups, with a particular](https://static.fdocuments.us/doc/165x107/604a6d70223ac20b9d2ea0ca/sieves-in-discrete-groups-especially-2010on-the-afine-sieve-another-survey.jpg)


![Welcome [] · Welcome DRE 124 Structural ... accuracy for fine sieve analysis, 0.5 g accuracy for coarse sieve analysis Sieves Mechanical Sieve Shaker- 6. MATERIALS Fine Aggregate](https://static.fdocuments.us/doc/165x107/5ae713887f8b9a29048e4d16/welcome-dre-124-structural-accuracy-for-fine-sieve-analysis-05-g-accuracy.jpg)