so many ties - Fuqua School of Business · SO MANY TIES, SO LITTLE TIME: ... Podolny and Baron...
52
1 So Many Ties, So Little Time: A Task Contingency Perspective on The Value of Social Capital in Organizations * Morten T. Hansen Harvard University Joel M. Podolny Stanford University Jeffrey Pfeffer Stanford University Running head: So many ties, so little time Word count: 11,600 * Correspondence to: Morten Hansen, Morgan Hall 343, Soldiers Field Park, Boston, MA 02163. Phone (617) 495 5590. Fax (617) 496 6568. E-mail: [email protected]. We would like to thank Herminia Ibarra, Rakesh Khurana, and Ezra Zuckerman for helpful comments and James Schorr and William Simpson for help with the data analysis.
Transcript of so many ties - Fuqua School of Business · SO MANY TIES, SO LITTLE TIME: ... Podolny and Baron...

1
So Many Ties, So Little Time: A Task Contingency Perspective on
The Value of Social Capital in Organizations*
Morten T. Hansen
Harvard University
Joel M. Podolny
Stanford University
Jeffrey Pfeffer
Stanford University
Running head: So many ties, so little time
Word count: 11,600
* Correspondence to: Morten Hansen, Morgan Hall 343, Soldiers Field Park, Boston, MA 02163. Phone
(617) 495 5590. Fax (617) 496 6568. E-mail: [email protected]. We would like to thank Herminia
Ibarra, Rakesh Khurana, and Ezra Zuckerman for helpful comments and James Schorr and William
Simpson for help with the data analysis.

2
TITLE
So Many Ties, So Little Time: A Task Contingency Perspective on
The Value of Social Capital in Organizations
ABSTRACT
We used data from 67 new product development teams to test a task contingency perspective on
social network structure in organizations. Results showed that exploratory teams completed their projects
more quickly if they had a social network structure composed of many strong external ties that were non-
redundant. In contrast, teams pursuing tasks that exploited existing expertise took longer to complete if
they had this type of social network structure, mainly because external ties had to be maintained but were
not much needed for the task. The network position that was most beneficial for exploration tasks was a
liability for exploitation tasks. We propose that organization network theories of tie strength and
structural holes need to be broadened to reflect the effects of task differences, network costs, and
difficulties in getting others to help.

3
SO MANY TIES, SO LITTLE TIME: A TASK CONTINGENCY PERSPECTIVE ON
THE VALUE OF SOCIAL CAPITAL IN ORGANIZATION
When organizational scholars first examined the effects of informal social networks in the
workplace, much of the research highlighted the possibility that these networks undermined performance
(e.g., Roy 1952; Seashore 1954). This older research was also sensitive to many of the personal costs,
challenges, and normative requirements involved in building, maintaining, and extracting resources from
a personal network. For example, Blau (1964) and Gouldner (1960) argued that an individual’s ability to
maintain a tie and extract resources from another person depends on adherence to a norm of reciprocity
and membership in some relatively well-connected collectivity of which both actors are a part (Homans
1950; Kapferer 1969; Roethlisberger and Dickson 1939).
In contrast to this older research, more recent organization network research has focused on the
instrumental value of networks, treating informal relations as social capital to be harnessed in pursuit of
goals, such as garnering resources, gaining promotions, and completing tasks (e.g., Burt 1992; Gabbay
and Zuckerman 1998; Hansen 1999; Nahapiet and Ghoshal 1998; Podolny and Baron 1997). By focusing
on the instrumental value of social networks, however, recent research has not given much attention to
potential drawbacks of social ties (e.g., Adler and Kwon 1999; Gabbay and Leenders 1999). Individuals
and groups in an organization may benefit from receiving knowledge from network contacts, but their
work may also be hampered by time-consuming activities devoted to maintaining ties, helping others in
the network, and trying to get others to provide needed help. These network-related activities may
actually outweigh the benefits derived from network positions in some circumstances and should be
considered in analyzing the effects of social networks on performance-related outcomes. To address this
concern, we analyze both potential benefits and drawbacks of social networks. Our research question is,
under what conditions does an actor’s social capital in an organization enable or hinder the realization of
the actor’s performance-related goals?

4
We argue that the type of task pursued by the focal actor will determine whether the costs and
difficulties of cultivating and using certain network configurations will outweigh the knowledge benefits
derived from the same network attributes. This approach builds on some recent network research that has
recognized that the value of social networks is contingent on particular circumstances (Burt 1997;
Gabbay and Zuckerman 1998; Hansen 1999; Podolny and Baron 1997; Uzzi 1997; Walker, Kogut and
Shan 1997) and contrasts with a pure structuralist theory of social networks, in which the focus is almost
exclusively on the potential of the pattern of relations to explain individual and organization-level
outcomes (e.g., Brass 1984; Burt 1992). In focusing almost exclusively on patterns of relations, however,
the structural perspective has tended to ignore the costs and difficulties of building and using a network
and the different types of tasks involved. If the benefits of a particular pattern of ties were completely
independent of these factors, then the exclusive focus on network structure might be reasonable, but they
are not likely to be independent. While structural network theory provides a valuable baseline, we seek to
broaden the theory by analyzing the task-contingent effects of structural network variables.
We make three contributions toward a contingency perspective on social network structure. First,
we draw on March’s (1991) distinction between exploration and exploitation tasks to develop a
contingency argument. Tasks that involve a high degree of exploration, in that they depart from the
existing expertise of the focal organization unit, require different amounts, frequency and type of help
from the network than exploitation tasks, which depart very little from the existing competence base. The
exploration-exploitation distinction is of theoretical importance because it can be used to characterize
many different types of specific work tasks and hence is more encompassing than other contingency
variables that have been studied, including the complexity of knowledge flowing through social relations
(Hansen 1999) and whether tasks involve basic research or product development (Gabbay and Zuckerman
1998).
The second contribution is that we focus on the attainment of immediate work-related objectives.
While much existing research has focused on individual promotion opportunities (e.g., Burt 1997;
Podolny and Baron 1997), there has been little research extending the arguments to the accomplishment

5
of work tasks. Network structures that enhance job mobility may not necessarily enhance the realization
of immediate work objectives. For example, applying Granovetter’s (1973) weak tie argument about
finding a job, Hansen (1999) found that there was a positive effect of having weak ties on task
accomplishment in situations where the knowledge obtained through those ties were simple, but that this
effect turned negative when the knowledge obtained was complex. We contribute a more comprehensive
analysis of the effects of network structure on task accomplishment by including the effects of tie
strength, network size, and the degree of redundancy among contacts on task accomplishment.
The third contribution is the focus on team-level networks. While classical lab research on social
networks focused on within-team networks (e.g., Shaw 1964, 1971), there has been a dearth of subsequent
social network studies that have treated teams as the unit of analysis, even though teams have long been
considered important in organization theory. Part of the problem has been the collection of team network
data. For example, although Hansen (1999) analyzed teams, his study relied on inter-divisional network
data, which were not collected from team members. In contrast, we analyze the concept of an external
team network based on the aggregate of individual team members’ responses to questions about their
network relations to non-team members within their focal organization unit. We are therefore able to
extend existing research that has addressed the effects of individual-level tie strength and structural holes
(e.g., Burt 1997; Podolny and Baron 1997) to the team-level of analysis.
We test the task contingency view of network effects with an analysis of network data on 67 new
product development teams situated in a large computers and electronics company. We analyze the
effects of team-level network attributes on the ability of teams to complete their projects in a timely
manner.
NETWORK STRUCTURE--SOCIAL CAPITAL OR LIABILITY?
Organization network research has invoked the term “social capital” as an overarching concept
for understanding what features of an actor’s social relations are most conducive to the realization of that
actor’s objectives in organizations (see Nahapiet and Ghoshal 1998; Portes 1999). In reviewing the social

6
capital literature, Adler and Kwon (1999) found that many studies have analyzed relative benefits of
various network attributes but few have investigated the costs, risks, and problems associated with social
capital in organizations (for some exceptions, see Brass, Butterfield and Skaggs 1998; Gabbay and
Leenders 1999; Leana and Van Buren 1999). Once costs and other drawbacks of having social network
positions are considered, it is no longer obvious that networks represent a positive social capital. They
may instead be a liability in certain situations.
A dominant trend in social capital studies in organizations has been the analysis of structural
network variables, including network size, network sparseness, and tie strength. For example, scholars
have found that individuals with large and broad networks have more power in the organization (e.g.,
Brass and Burkhardt 1992; Ibarra and Andrews 1993). Studies have also focused on the instrumental
benefits of having sparse or non-redundant networks (i.e., there are few ties between contacts in a
person’s network), finding that they lead to faster promotion (Burt 1992 and 1997) and higher ability to
switch careers (Higgins 1999). Studying the effects of tie strength, Granovetter (1973) originally showed
that weak ties were instrumental in getting a job, but researchers have since pointed to several values of
strong ties, including transfer of tacit knowledge (Hansen 1999), exchange of fine-grained information
(Uzzi 1997) and help in building coalitions (Krackhardt 1992). Considering all three dimensions, Burt
(1992) argued that the network structure most conducive to the realization of an actor’s objectives is one
that is composed of many strong bridging ties. According to his structural hole theory, sparse networks
are especially beneficial because each contact serves as a bridge to non-redundant sources of information.
Moreover, Burt argued that, controlling for the extent to which a tie is a bridge, strong ties are more
valuable for actors in gaining resources compared with weak ones, because they facilitate both higher
volume and higher quality of information flow.
In short, a number of organization network scholars in the structuralist network tradition have
highlighted the positive value of social capital in the form of a network composed of many strong and
non-redundant ties. This structuralist thesis provides a valuable baseline in that it is formulated a
relatively high level of abstraction and therefore can be applied equally well across different organization

7
contexts (e.g., Burt 1992). The downside to this high level of generality is the neglect of important
features of particular contexts that modify the basic thesis. We consider two related issues in the
organizational context.
First, having direct relations with others typically involves spending time building and
maintaining these relationships, as well as time helping others in the network. Such activities can be
labeled costs (or investments), because they involve discrete time-consuming activities during one time
period that may have a positive return in subsequent periods. Organization network scholars have not
fully considered the effects of such network costs but instead have limited their discussion to a
consideration of the opportunity costs of different network positions. For example, because having direct
ties involves costs, a redundant network tie can be substituted with a tie that yields more non-redundancy,
thus leading to a more optimal network. However, both types of direct ties, whether redundant or not,
involve time devoted to networks, which may be time not spent on completing one’s own work. Once
costs are considered, a network structure composed of many strong ties may not always be valuable.
Second, getting help from network contacts may be a non-trivial issue, especially in sparse
networks. As the works of Coleman (1990), Portes and Sensenbrenner (1993), and Uzzi (1997) suggest,
one actor’s ability to secure resources from another depends on the extent to which the two are part of
some broader common collectivity in which there is some pressure to help others in the collectivity. For
example, Portes and Sensenbrenner used the term “enforceable trust” to refer to a focal actor’s ability to
rely on common third parties to punish that other actor if he or she does not assist the focal actor in the
pursuit of the focal actor’s objectives. By definition, sparse networks have few such third-party ties (i.e.,
there are few ties between an actor’s contacts), leading to difficulties in getting others to help. Because of
this problem, sparse networks may not always be valuable.
The issues of costs and difficulties raise the question of whether a network structure composed of
many strong and non-redundant ties will hinder the realization of an actor’s performance-related goals in
some circumstances, and hence become a liability. The type of task pursued by an actor informs this
issue.
8
TASK CONTINGENT EFFECTS OF SOCIAL NETWORKS
Exploration versus exploitation
Depending on the work-related tasks they pursue, focal actors (i.e., individuals and groups) in
organizations rely on various types of knowledge from their network to complete their work. Tasks that
involve a high degree of exploration, in that they depart from the existing expertise of the focal actor and
the focal organization unit, require different types and amounts of knowledge than exploitation tasks,
which depart very little from the existing competence base in an organization unit. Exploration involves
problems that are novel to the focal actor and to other people in the focal organization unit (Benner and
Tushman 1999; Levinthal and March 1993; March 1991). Because the task is novel, a focal actor may
benefit from using network contacts to discuss ideas, exchange views, and brainstorm with them (cf.
Nonaka 1990; Sutton and Hargadon 1996). Although the task is novel for network contacts as well, they
may possess analogous experience which they can draw on to provide insight and suggest possible
avenues for identifying viable solutions.
Furthermore, because the task is novel, much of the knowledge involved in exploratory tasks is
likely to be tacit, that is, it is difficult to articulate or can only be acquired through experience (Hansen
1999; Nelson and Winter 1982; Polanyi 1966; Von Hippel 1988:76, 1994).1 In contrast, much of the
knowledge involved in exploitation tasks is likely not to be tacit (i.e., explicit), because the focal actor has
much of the expertise required and hence is likely to understand the problem, possible solutions, and the
causal mechanisms among the parameters involved in the task. However, actors engaged in exploitation
tasks may still benefit from obtaining knowledge through their network contacts. They may be able to
obtain existing, complementary knowledge that avoids duplication of effort (Teece 1986). For example, a
product developer that obtains an existing software code from a network contact may save several months
of work.
Moreover, exploration tasks are unpredictable in that a focal actor cannot easily predict when and
how frequently he or she needs to consult contacts to obtain knowledge. An actor may meet a network
9
contact once to talk about a novel idea, but they may need to meet again several times because they could
not foresee the development path of the idea. In contrast, in exploitation tasks, the focal actor has a good
understanding of what knowledge is needed to complete the work and therefore knows better when and
how frequently he or she needs to consult contacts to obtain knowledge. In short, actors pursuing
exploration tasks are likely to benefit by obtaining tacit and novel insights from network contacts and by
having immediate and repeated access to network contacts. In contrast, actors pursuing exploitation tasks
do not need to obtain large amounts of knowledge through their network but are likely to derive some
benefits from obtaining existing, explicit knowledge that avoids duplication of effort. These differences
between exploitation and exploration tasks have implications for the value of having many, strong, and
reciprocal ties.
The contingent effects of rich networks
Actors that are engaged in exploratory tasks are likely to benefit from having a network
composed of many, strong and reciprocal relations (hereafter called a rich network). Strong established
relations (i.e., frequent contact and close relations) are beneficial for exploratory tasks, for two reasons.
First, the exchange of tacit knowledge between two individuals is likely to be more effective in strong
than weak ties. Strong ties often mean that the parties to the relationship have established heuristics for
working together and understanding each other’s ways of expressing ideas and thoughts (Hansen 1999;
Uzzi 1997). Thus, in a strong tie, even if actors do not know much about the particular knowledge
involved, they can discuss subtle problems and vague approaches with less risk of misunderstanding each
other. Second, because the need for exchanging ideas may occur at unpredictable times in exploration
tasks, actors need quick and easy access to others willing to engage in discussions at a moment’s notice.
Strong ties afford faster and greater access to such unplanned requests for interactions because contacts
have a greater motivation to assist (Granovetter 1982; Krackhardt 1992). In contrast, in exploitation tasks,
the knowledge involved tends to be well-understood, and actors do not need established heuristics and
frequent interactions to exchange it.

10
In addition, actors pursuing exploratory tasks may benefit from having spent time in the past
helping others. A track record of reciprocal helping activities is likely to create an obligation on the part
of others to assist the focal actor (Gouldner 1960). This assistance is valuable in exploratory tasks because
of the need for quick and unpredictable access to others to obtain advice and exchange ideas. As Uzzi
(1997) found in his study of embedded ties in the apparel industry, extra effort was voluntarily given in
reciprocated ties. The benefits of having invested in reciprocal helping behaviors are less valuable in
exploitation tasks, however, because there is less need for extra and immediate efforts given by other
people, who only need to spend a few moments to pass on knowledge that is well understood by both
parties.
Actors pursuing exploratory tasks are also likely to benefit from having a relatively large number
of direct ties. Controlling for the redundancy among contacts, large networks afford more advice and
possible solutions to exploratory problems than do small networks, simply because there are more people
with whom the focal actor can brainstorm and exchange views (at some point, however, very large
networks may be counter-productive by creating a problem of assimilating numerous advice, solutions,
and ideas). This positive value of large networks is likely to be less for actors engaged in exploitation
tasks, however, because they do not benefit from considering a range of ideas and possible solutions
afforded by large networks. They already have a good understanding of what knowledge is needed and
are likely to only need a relatively small set of contacts to obtain existing, complementary knowledge that
avoids duplication of effort.
In short, the benefits of having a rich network characterized by many strong ties and extensive
reciprocity are greater for exploratory than for exploitative tasks. However, this network position comes
at a cost. First, strong ties necessarily require greater time and effort to maintain compared with weak ties.
Frequent interactions involve greater time devoted to maintaining networks, while close ties involve
higher levels of emotional intensity and thus require more energy than do distant relations (cf. Marsden
and Campbell 1984). Second, an adherence to a norm of reciprocity implies that the focal actor forgoes
the immediate pursuit of his or her own objectives in order to assist others in the pursuit of their

11
objectives. In a given time period, a focal actor that sets aside time to help another is likely to spend less
time pursuing the completion of his or her own work during that time period.2 Third, having many direct
ties is also more costly than having few, because the relations need to be maintained, even if they are
weak. More time is likely to be spent staying in touch and interacting with others to the extent that an
actor has many contacts. Thus, there are likely to be substantial costs involved a network position of
many strong and reciprocal ties.
In highly exploratory tasks, the benefits of having a rich network are likely to exceed the costs of
this network position, as shown in figure 1. The reason is the difference between the net value of rich
networks (the upper-right quadrant in figure 1) and the problems associated with non-rich networks
(lower-right quadrant in figure 1). A network of few, weak and non-reciprocal ties creates a knowledge
deficit for exploratory tasks, because the actor not only lacks the required expertise at the outset but also
cannot obtain much of it through this type of network. We therefore predict that there is a net positive
value of having rich networks in exploratory tasks:
Hypothesis 1a: In exploration tasks, rich networks (many strong and reciprocal ties) positively
affect the realization of immediate performance-related objectives.
For exploitation tasks, we predict that the costs are likely to outweigh the benefits. The benefits of having
a network of many strong ties and extensive reciprocity are much less than in exploration tasks, but the
costs of rich networks are the same for both types of tasks (compare upper-left with lower-left quadrants
in figure 1):
Hypothesis 1b: In exploitation tasks, rich networks negatively affect the realization of immediate
performance-related objectives.
-------- Insert Figure 1 about here --------
The contingent effects of network sparseness
In exploratory tasks, actors benefit from tapping into diverse knowledge. Because the task is
novel, there is likely to be more than one viable solution to the problem, implying that there is a benefit in
searching for and considering a broader set of alternatives. A diverse network is likely to be beneficial

12
because contacts are likely to offer a range of distinct knowledge, ideas, and views (cf. Burt 1992; Uzzi
1997). In contrast, in a dense network, contacts know one another and are hence likely to circulate the
same knowledge among themselves. Moreover, a very dense network—one where everybody is
connected--is likely to be closed off from the outside, making it hard for new knowledge, such as new
ideas and different kinds of insights, to penetrate the network. Such networks may therefore be ossified,
steeped in traditional ways of solving tasks and possessing little new knowledge (Uzzi 1997). Actors with
very dense networks may therefore find it difficult to receive valuable insights from the network to
complete exploratory tasks.
Although exploration tasks are likely to benefit from a sparse network because of diverse
knowledge, such a network position also involves the problem of enforcing a norm of cooperation.
However, the benefits of sparse networks are likely to outweigh the drawbacks when tasks are
exploratory, as shown in figure 2. While an actor in a sparse network benefits from diverse knowledge but
also faces the problem of enforcement (lower-right quadrant in figure 2), an actor in a dense network not
only lacks access to diverse knowledge but also has to maintain costly relations to redundant contacts
(upper-right quadrant in figure 2). The latter situation is therefore likely to be less beneficial than the
former one. Thus, we predict that actors pursuing exploratory tasks derive a net positive value from
increasing sparseness in the network:
Hypothesis 2a: In exploration tasks, network sparseness positively affects the realization of
immediate performance-related objectives.
The discussion so far points to the positive consequence of having sparse networks in exploratory
tasks. There is much less benefit of tapping into diverse knowledge in exploitation tasks, however,
because the task is well understood and can be executed without considering a range of ideas and
potential solutions that can be obtained through sparse networks. Absent this benefit of sparse networks in
exploitative tasks, the question becomes whether a sparse or dense network returns the most value.
However, both very dense and sparse networks may lead to problems in exploitative task situations, as
shown in figure 2 (compare upper-left with lower-left quadrants). As Uzzi (1997) argued, while there may

13
initially be some positive returns in shifting from a very dense network to one that is somewhat sparse,
there will at some point be diminishing returns from increasing sparseness. At relatively high levels of
sparseness, the returns to added sparseness may be negative, because it will be more difficult for the focal
actor to obtain knowledge from contacts when there are no third-parties available to enforce the norm that
contacts ought to help the focal actor by providing knowledge (Coleman 1990; Portes and Sensenbrenner
1993). Thus, because the end points of the sparseness dimension creates problems, we expect that actors
pursuing exploitation tasks benefit most by having a medium level of sparseness in their network:
Hypothesis 2b: In exploitation tasks, there is an inverted U-shaped relationship between network
sparseness and realization of immediate performance-related objectives.
-------- Insert Figure 2 about here --------
By considering costs and problems of network positions relative to the benefits they provide, we
have argued that the net value of networks depend on whether actors pursue exploration or exploitation
tasks. While we predict that exploration tasks attain a net positive value from having a rich and non-
redundant network, this position is likely to have negative consequences for exploitation tasks.
METHODS
Setting
To test our hypotheses we studied 67 new product development teams located in a large,
multidivisional electronics and computer company. These teams represent the focal actors in our
empirical analysis. The company, with annual sales of more than $5 billion, is a highly decentralized firm
engaged in developing, manufacturing, and selling a wide range of electronics and computing products. In
preparation for systematic data collection on project teams in the firm, we visited 14 divisions and
conducted initial open-ended interviews with more than 50 project engineers and managers. These
interviews helped us better understand the context and develop survey instruments that would allow us to
test our hypotheses about the effects of networks on team performance.

14
The new product development projects we studied involved products primarily for industrial
markets and typically entailed development of both hardware and software. Projects frequently began
with a product idea and the opening of a budget account. Once an account was open, there were informal
interactions with other departments, such as marketing, and with other people in the division to obtain
advice and exchange ideas. After some investigation and preliminary work, project teams presented
proposals in front of key managers. This was the only formal review meeting for projects in this
company. If the group approved the project and plan, which included a proposed budget and schedule,
the project proceeded.
After approval of the project, obtaining advice and exchanging ideas remained important
activities. Established advice relations enabled team members to obtain knowledge from other product
developers and functional specialists in marketing and manufacturing within the organization (cf.
Eisenhardt and Tabrizi 1995; Henderson and Cockburn 1994). However, network activities were not
without drawbacks. Some engineers spent a considerable amount of time working on other projects,
mainly helping solve specific technical problems. One manager whom we interviewed complained that
some of his engineers were too keen on working on interesting technical problems, regardless of whether
they occurred in their own projects. While beneficial for some projects, these activities also made it
harder for some engineers to make good progress on their own projects. In addition, engineers spent
considerable time maintaining their relationships. They frequently interacted informally across teams to
talk about projects, including new problems, opportunities, technical specifications, market demand, and
product updates. While some of these activities were related to specific project work, many of them were
not but nevertheless involved time to stay in touch with others and keep on top of new technology trends.
Thus, networking activities were not by-products of ongoing work but involved discrete time-consuming
activities.
Data and Methods
To keep the data collection and analysis manageable, we analyzed the within-division networks
for teams located in 25 different divisions, allowing us to test our predictions in 25 different sub-

15
organizations that share some common characteristics, such as the same top manager and formal reporting
structures. The divisions ranged in size from 100 to 900 people, permitting a focal person to develop
extensive network relations even in the smallest division. Although there were a number of network
contacts spanning divisions (see Hansen 1999), teams had relatively more contacts within the division.
This is not surprising since there are almost invariably more dense social relations within a boundary than
across that boundary (Deutsch 1953). Thus, the focal division provided an appropriate membership
boundary for our study (cf. Marsden 1990).3
We first created a list of all projects that the divisions in our sample undertook during a period of
three years. We limited the study to three years because it was problematic to collect data further back in
time. Because including only successfully completed projects may bias the results, we also included both
canceled projects and projects still in progress.
We administered two surveys: a survey for the project managers of the product development
projects included in the study, and a network survey to all project engineers and project managers
working on these projects. The two surveys were sent out sequentially. The first step was to send the
project survey to the project manager of the project, asking about characteristics of the project, including
starting and ending times. The project managers of 120 projects returned their surveys, yielding a
response rate of 85 percent. The second step was to administer the individual network survey, designed as
a computerized survey on a floppy disk in which respondents answered various questions about contacts
in their network. We submitted a packet of individual network surveys to each project manager, asking
him or her to distribute the surveys to the individual engineers on the team and to complete one him- or
herself. At this point, 22 project managers decided that their teams should not fill out the network surveys
and consequently did not distribute the individual surveys to the teams. There were no significant
differences between these 22 projects and the remaining 98 projects with respect to project size and
completion time (for completed projects). Among the remaining projects, 510 surveys were distributed,
and 259 (51 percent) were returned.

16
Because we wanted to have sufficient information on a team’s network relations, we only
included projects with at least a 50 percent response rate for the network survey. Thus, we ended up with
67 projects (with an average network survey response rate of 74 percent). Two of these projects were
cancelled, and 13 were still in progress at time of data collection. As Table 1 shows, there were no
significant differences between the 67 included projects and the 53 excluded projects with respect to
budget size, extent of use of existing software and hardware (existing “ware”), degree of exploitation, and
completion time for completed projects. There was a significant difference in the number of people. The
average number of people is slightly larger in the omitted group (6.37) than in the final sample (5.39),
although the difference is not large. Thus, there is most likely not a selection bias in the final sample of
projects.
--------- Insert Table 1 about here ----------
We merged the project data with the individual network data by assigning an engineer’s network
relations to the project on which he or she worked. We only included network ties that existed prior to the
start of the project, because we wanted to ensure that the network variables were measured prior to the
measure of the dependent variable. We relied on methodological standards that have been followed by
Burt (1992:173, 1997) and Podolny and Baron (1997). For example, Podolny and Baron (1997) first
asked respondents to indicate the duration of a network tie and then only included ties that had been in
existence prior to the occurrence of a promotion, which was their dependent variable. Similarly, we asked
respondents how many years each of their network ties had been in existence and then only included ties
that they said existed prior to the start of their project.
The potential bias in this approach is that it may exclude some relations that existed prior to a
project’s start but that ceased to exist by the time the respondents filled in the survey. If these relations are
prevalent, then there should be fewer relations for projects that were started in 1993 (the first year of
observation) than those started later (in 1994), because more ties are likely to have ceased to exist during
this relatively longer time span. The number of reported team ties, however, is fairly similar between

17
projects that were started in 1993 and 1994 (4.4 and 4.5 team-level advice relations outside the team,
respectively, with no significant difference in t-test of means; t=.13 and p=.89, with equal variance). This
similarity is partly due to the fact that individuals in the company tended to have long established
relations, with a reported average duration of six years. Thus, there is not likely to be a bias resulting from
missing information on recently disbanded network ties in the data set.
Dependent and Independent Variables
Project completion time. We focused on project completion time to measure teams’ realization
of immediate performance-related goals. While there were other dimensions of teams’ degree of goal
achievement, completion time was a critical factor because the resulting products had to be marketed in a
timely manner to be competitive in the electronics and computer markets into which they were launched
(cf. Eisenhardt and Tabrizi 1995). Late project teams were typically seen by managers as being poor
performers, and very late projects were seen as failures because the teams missed important market
opportunities. However, teams could not trade off other performance dimensions, such as product quality
(e.g., few software bugs), for faster completion, because there were quality standards in place to ensure
that marketed products met certain standards. Project completion time was therefore an appropriate
measure of the teams’ immediate performance-related goals.
We measured project completion time as the number of months from the start of concept
development to the time of market introduction for a given project (or time to the end of the study period
or cancellation for ongoing and canceled projects, respectively). We defined starting time as the month
when a dedicated person started working part or full time on the project, which typically coincided with
the time a budget account was opened for the project. We defined the end date as the date on which the
product was released to shipment, which is a formal milestone date in this company because it signifies
that the product is ready to be manufactured and shipped on a regular basis. These definitions turned out
to be very clear and provided few problems in specifying the starting and finishing times.
18
Scholars have proposed two other measures of project speed. First, completion time can be
measured as the extent to which the project is finished on schedule (e.g., Ancona and Caldwell 1992). The
assumption in this measure is that inherent project differences are accounted for by the original schedule,
but also that everybody sets equally ambitious schedules. These conditions were unlikely to be true in
this company, where individual project managers set their own targets. Moreover, it may not be an
objective measure: Cyert and March (1992) proposed that targets such as schedules are often adjusted
according to expectation and experiences and hence become subjective indicators. A second approach to
measuring project speed involves grouping projects by some similarity measure and then assessing a
project's deviation from the mean completion time of the group of similar projects (Eisenhardt and Tabrizi
1995). The difficulty with this approach is that it depends on a clear similarity measure, which was not
possible to obtain in this setting. Furthermore, the projects included in this study did not span several
industries but were confined to one 4-digit SIC code. Thus, their inherent differences were not as large as
those in samples where the mean-deviation measure has been used (e.g., Eisenhardt and Tabrizi 1995).
Instead, we used the number of months to complete the project as the dependent variable and then added
project-specific variables to control for differences between the projects.
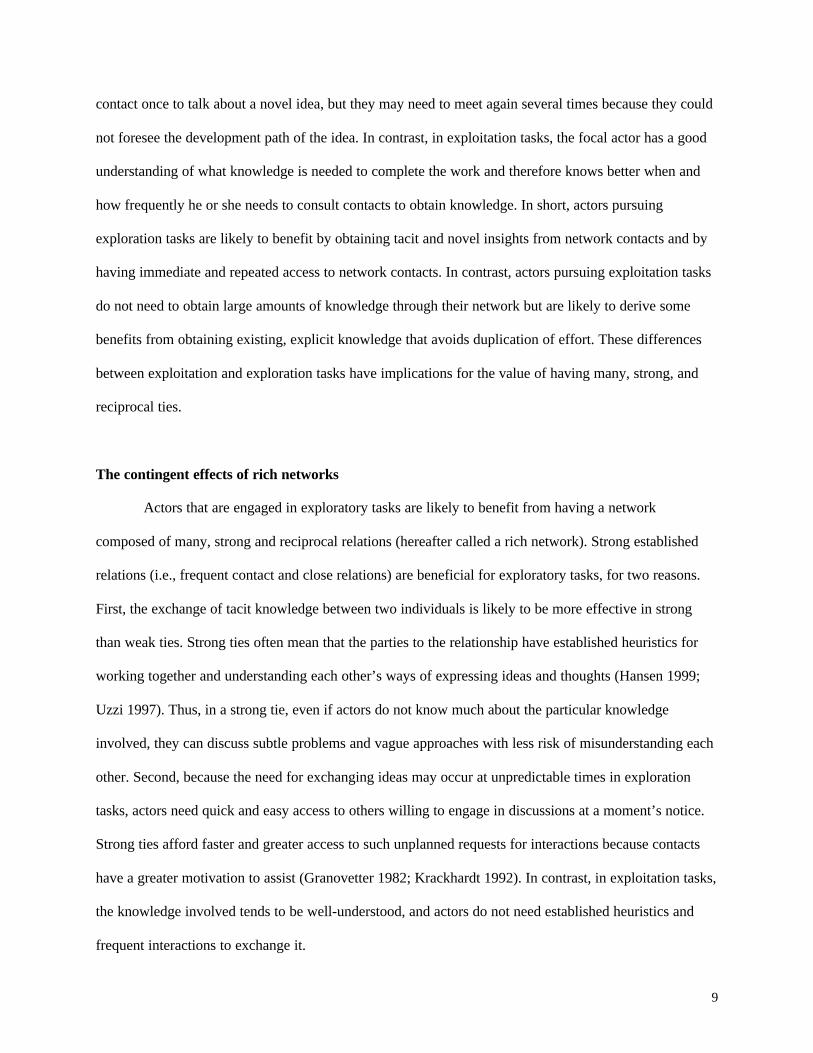
Network size. To get information on contacts in an individual’s advice network, we asked
respondents, “Looking back over the last year, are there any persons in your division from whom you
regularly sought information and advice to help your project work?” The respondents were asked to enter
the last and first names of the contact and were allowed to name up to five advice relations.4 We asked the
respondent how long each advice relation had been in existence and only included advice ties that existed
prior to the start of the project and that were between a team member and non-team members in the focal
division. The size of a team’s advice network was computed by taking the team’s number of non-
duplicate contacts (outside the team) who were listed as a regular source of advice before the start of the
project (network size).
We relied on several assumptions in aggregating individual relations to team-level networks. Our
approach is illustrated in figure 3 for two individuals, John and Jim, who together constitute a project

19
team. The top half of the figure shows the individual networks (by graph and matrix; network data are
treated as symmetric), and the lower half of the figure depicts the aggregated team network. John has
three network contacts, and he reports one indirect tie between them (between Mary and Tim). Jim also
has three network contacts and reports one indirect tie as well.
The first step in constructing the team-level network data was to divide the ties into those
between team members and those between a team member and outside people. Because John and Jim are
in the team, the tie between them is counted as a within-team tie and is excluded from the team-level
advice network (we include within-team ties in a control variable). The second step accounted for
duplicate ties. Because both John and Jim have ties to Mary, those ties are counted as one in the team
network.5 The third step was to add up non-duplicate ties. The team illustrated in the figure is recorded as
having direct advice ties to three people (Tim, Laura, and Mary) and thus has an advice network of three
ties.
---------- Insert Figure 3 about here ----------
Network sparseness. We followed the procedure adopted by Burt (1992 and 1997) and Podolny
and Baron (1997). We asked the team members whether they thought there was a tie between each pair of
contacts (i.e., indirect ties) they had listed in their egocentric advice network. The computerized survey
prompted the respondent to assess such a tie by generating a list of all possible pairs in his or her advice
network. There are two important assumptions in this approach. First, we assume that the reporting on
indirect ties was not systematically biased across teams, so that members from one team were not more
biased in their reporting of indirect ties compared with members from another team (cf. Krackhardt and
Kilduff 1999).The second assumption concerns unknown data among contacts. Because we do not fully
know the extent of indirect ties, we relied on the number of indirect ties that were known in our
egocentric network data. In the example in figure 3, we do not know whether Tim and Laura have a tie
between them because neither Jim nor John were asked to assess whether such a relationship existed (they
were only asked to assess indirect ties between contacts they had named in their own individual network).

20
The area in the figure marked “not reported” indicates the number of ties in the matrix that are not known.
There is no reason to believe, however, that the extent of indirect ties for unreported contacts should
differ systematically from the extent of ties for reported contacts. Respondents did not underreport on
these ties; they were simply not asked to assess whether they existed. We therefore made the assumption
that the proportion of indirect ties among the possible number of indirect ties that are unknown equals the
proportion of estimated indirect ties among the possible number of indirect ties that respondents were
asked to assess. We used the maximum number of indirect ties that could have been reported, given the
number of individual responses among team members. This maximum number is given by:
Adjusted maximum number of indirect ties = N*(N-1) / 2 - x*(x-1)/2 - y*(y-1)/2
where N is the number of individuals listed in the team network matrix as depicted in the figure (five
individuals), x is the number of team members in this matrix (John and Jim), and y is the number of
contacts who were named by different respondents; hence, respondents were not asked to assess whether
ties existed between these pairs of contacts--Tim and Laura in figure 1. To arrive at the measure, we
divided the number of reported indirect ties by this maximum score and subtracted this proportion from 1
to measure sparseness, not density (network sparseness):
Network Sparseness = 1- (no. reported indirect ties/adjusted maximum number of indirect ties)
Finally, to test for a curvilinear relationship, we squared the standardized value of this variable
(sparseness-squared).
Tie Strength. To measure the strength of relations of the task-advice ties, we asked about the
closeness and frequency of contact that the respondents had to the named sources of task advice.
Closeness was assessed by a 4-point scale (with anchors, “distant” and “especially close”): “ how close
are you to [name of person in network]?” Frequency was assessed by a 7-point scale: “How often do you
communicate with [name]?”, with anchors “less than once a month” and “several times a day.” We took

21
the average reported closeness and frequency for the number of advice ties reported by the team (tie
strength).6
Reciprocal helping behavior. Our initial discussions with engineers and managers in the
company suggested that engineers engaged in three somewhat different behaviors to induce social
obligations of reciprocity (Ekeh 1974). First, some engineers in the company helped others, with the
implicit understanding that they would be seen as good colleagues and be helped by someone some time
in the future. Second, some engineers attempted to take the interest and goals of others into consideration
when they asked for support for their own project. For example, some engineers on a project sometimes
considered how their new product development effort could be timed to fit the staffing requirement of
another project. Third, other engineers were somewhat more explicit, helping others but making it
understood that they expected help by the same person sometime in the near future. These behaviors can
be seen as representative of both dyadic reciprocity (i.e., helping another with the expectation that the
particular other will offer help in the future) and generalized reciprocity (i.e., helping another with the
expectation that some one will offer help in the future).
To capture these different behaviors, we asked the respondents to indicate, on a six-point scale
(with anchors of “never” to “very frequently”), how often they engaged in the following behaviors: (1)
“Help others whose support or help you need?”; (2) “think about the interests and goals of others in trying
to obtain their support for your project?”; and (3) “offer help to others with their work if they will help
your project work?” To compute the overall reciprocity behaviors for a team we took the value reported
by a team member for each item and then computed the average value (reciprocal helping). Because the
Cronbach Alpha for this scale was not high (0.62), we also ran models with each of the three dimensions
entered separately.
Degree of project exploitation. We used a four-item scale to capture the extent to which a given
project was similar to the focal division’s existing technical and market expertise and therefore could
exploit that expertise (see Olson , Walker, and Ruekert 1995). The project manager was asked to answer
four questions on a 7-point scale (1= None of the required expertise, 4 = Half the required expertise, 7 =

22
All of the required expertise): (1) Prior to this project, how much experience did your team have with the
technologies and technical competencies that the project required? (2) Prior to this project, how much
experience did your team have with the market for which the product was developed? (3) Prior to this
project, how much experience did your division have with the technologies and technical competencies
that the project required? (4) Prior to this project, how much experience did your division have with the
market for which the product was developed? We computed the measure by taking the average of the
scores for the four questions (degree exploitation). The Cronbach Alpha for this scale is 0.85.
No project manager reported that the team had substantial expertise but the division had not,
while seven project manager reported that the team had little of the required expertise but the division had
substantial expertise. The similar responses for project- and division-level expertise suggest that division
managers were able to staff the projects with the division’s engineers who had the most relevant expertise
for the project. This confirms our field interviews, where we were told that the most important staffing
criterion was the matching of the engineers’ skills to project requirements. Thus, the four items on the
scale indicate the same underlying construct--the extent to which the focal project task departed from the
division’s existing competence base (we conducted separate analyses using only the two project-level
items, but we found no significant differences in the results and therefore do not report these additional
results).
To test for the contingent effects of exploitation vs. exploration, we interacted the exploitation
variable with tie strength, amount of reciprocal helping, network size, and the network sparseness
variables. The construction of the interaction term including exploitation and the network sparseness
variables were more complicated than a simple two-way interaction term because our hypotheses imply
that three variables need to be interacted (i.e., exploitation, sparseness, and sparseness squared). We chose
to model this as a step function in order to make the interpretation of the results easier. We divided the
degree of exploitation into three segments: projects in the upper third on the exploitation scale—highly
exploitative projects (exploitation 3rd); projects in the middle third on the exploitation scale (exploitation
2nd); and projects in the lower third on the exploitation scale—highly exploratory projects (exploitation

23
1st).7 We constructed three dummy variables which took on a value of 1 if the focal project belonged to
the segment, and 0 otherwise. The dummy variables were then interacted with the two network sparseness
variables.
Control variables
Project type. To make the projects comparable, we controlled for several project-specific factors.
We used the log of estimated dollar costs at the start of the project to control for size and scope
differences between the projects (budget). In our field interviews with project managers, we were also
told that estimated costs capture inherent differences in technical complexity among the projects (the
more complex the technology, the more engineering hours billed to the project). We used the budget
figure to avoid confounding final costs and the dependent variable. High final costs may reflect long
completion time because of more engineering hours billed to the project.8 We also created a variable that
measured the extent to which the project team was able to reuse existing software code and hardware
components within its division. The project manager was asked to indicate the percentage of existing
software and hardware that were reused from the focal division (existing ware).
Divisional control. Because the projects were drawn from divisions of varying sizes, we entered
a control variable measuring the sales for the respective divisions (divisional size). Teams may have
different networks depending on the size of the organization. For example, it is possible that teams in
large subunits have larger networks, simply because there are more people with whom team members
could build relations. We therefore controlled for this possible source of variation. Data on sales were
obtained from a company-specific financial database.
Respondents. To control for the possibility that a team’s number of advice relations is caused by
the number of team members who responded to the survey, we included a measure of the number of team
members who completed the survey (number respondents). We also controlled for differences in
experience among project teams by including the average years of employment in the company among
the team members (team tenure). This variable also reflects variations in skill levels among teams because

24
expertise in project work was to a significant degree a function of the number of times engineers had
worked on projects in this company. Finally, we entered a control for the proportion of advice relations
within the team (within-team density), to control for the possibility that a team’s network size is simply a
correlate of the number of relations among the team members. This measure was computed the same way
as we computed a team’s external advice relations, except that we only included ties between team
members. We took the number of reported advice relations among team members, divided by the total
possible number of relations among them (counting asymmetric relations). Thus, a team’s network of
relations is decomposed into a within-team network and an external team network.
Statistical analysis
The statistical analysis of completion time was complicated by the fact that 13 of the 67 projects
were still ongoing at the time of data collection and represented right-censored cases (Tuma and Hannan
1984). Furthermore, two projects were canceled. To incorporate these cases into the analysis, we
analyzed the time to completion using a hazard rate model. The hazard rate is a measure of the likelihood
of a project either completing or terminating at time t, conditional on it not having completed or
terminated before t. The higher the transition rate, the more likely that the project will be completed
faster. The hazard rate model takes the following form:
r(t)j = r(t) j * exp[aXj],
where r(t) j is the completion rate of project j, t is project time in the risk set, and r(t) j* is the completion
rate including the effects of all the control variables in the model. The effects of the independent variables
are specified in the exponential bracket. X is a vector of explanatory variables, and a is vector of
corresponding coefficient estimates.
We used maximum likelihood estimation as implemented in the statistical program TDA
(Blossfeld and Rohwer 1995). We used the piecewise exponential specification because we did not want

25
to make any assumption about duration dependence that would require a specific parametric distribution.
To control for duration dependence, the model included four time periods that reflect the time-distribution
of events; the interval marks are 200, 300, 400, 500 and 650 days.9 The transition rate is assumed to be
constant within these periods, and covariates are assumed not to vary across time periods (Blossfeld and
Rohwer 1995:114).
RESULTS
Descriptive statistics are shown in table 2, and the results of the hazard rate analysis are presented
in table 3. Because we include several interaction measures that involve the degree of project exploitation,
we standardized the relevant variables to avoid problems of multicollinarity among the main variables and
the interaction terms (the results reported in table 3 remain the same if non-standardized values are used).
Model 1 in table 3 presents the baseline model with all the control variables and the main effects for the
three main structural network variables we have considered (i.e., network size, tie strength, and
sparseness). The network size variable is positive and significant throughout the models in table 3. The
main effect for tie strength is also significant and positive, but the network sparseness variable is not
significant in model 1. Thus, this baseline model shows that teams with many strong ties took shorter
time to complete their projects than teams with few and weak ties. However, as the subsequent models
demonstrate, this baseline does not hold for exploitation projects.
---------- Insert Tables 2 and 3 about here ----------
In models 2 through 7, we entered the variables relating to the richness of the teams’ networks.
The first set of results concerns tie strength. The main effect of tie strength is positive and significant,
while the interaction term including tie strength and exploitation is negative and significant in models 2
through 7. The two effects must be seen together, as follows (from model 7):10
Rate = exp [0.632*tie strength – tie strength*(0.737*exploitation)].
Because the variables are standardized (observed value minus mean, divided by standard deviation), the
relative effects can best be seen through a plot of the results, as shown in figure 4. For exploitation

26
projects (one standard deviation above the mean on the exploitation scale), the stronger the ties, the lower
the completion rate (i.e., the longer the completion time). For exploration projects (one standard deviation
below the mean on the exploitation scale), the stronger the ties, the faster the completion rate. Although
the magnitude of the effect for exploration projects is quite high, as shown in figure 4, there is also a
substantive decline for exploitation projects. For example, a change in tie strength of two standard
deviations implies a reduction of the completion rate from 1.11 to 0.90, a drop of 19%. In short, these
results lend support to hypotheses 1a and 1b, that strong ties are beneficial for exploration projects but
harmful for exploitation projects. We also ran separate models including only one of the two dimensions
of tie strength—frequency and closeness. These results (not reported here) showed that the magnitude of
the negative coefficient for the interaction term was twice as large for frequency than for closeness. That
is, there was a much larger negative impact of having frequent than close ties for exploitation projects.
This was most likely the case because maintaining frequent interactions is likely to be more time
consuming than maintaining close ones.
The results for the interaction term including amount of reciprocal helping and degree of
exploitation is entered in models 3 through 7. This variable is not significant in any of the models, but the
main effect for the amount of reciprocal helping remains significant and negative in all models. The lack
of significant result for the interaction term and the significant estimate for the main variable hold even
when we ran separate models for the three sub-items of the reciprocity variable. Teams whose members
engaged in the three reciprocal helping behaviors took longer time to complete their projects, regardless
of project type. This surprising and interesting result indicates that helping others has a negative effect on
completing one’s own work in a timely manner, although such helping may benefit others, as we discuss
below.
The variable interacting network size and degree of exploitation is entered in models 4 through 7
in table 3. The effect of the interaction variable is negative and significant throughout the models, while
the main effect for network size remains positive. These two effects must been seen together (from model
7): 11

27
Rate = exp [0.671*network size – network size*(1.023*exploitation) ].
Figure 5 shows the combined effect of network size and the interaction term for exploitative and
exploratory projects. As the plots reveal, exploratory teams had higher completion rate with increasing
network size, while exploitation teams had lower completion rate with increasing network size. These
results confirm hypotheses 1a and 1b, that large networks are beneficial for exploratory tasks but harmful
for exploitative tasks. These findings must be seen in context of the range of the network size variable
(which ranges from 1 to 17 team-level advice ties). First, because no teams in the sample had zero ties, we
cannot infer that exploitation teams were better off having no ties. Second, because we limited the
maximum number of advice ties to five for each respondent on a team, there is an upper boundary limit
on a teams’ reported network size. Thus, we cannot infer from the results that exploratory teams with very
large networks were better off. It is possible that exploratory teams with very large networks experience
problems in maintaining many ties, but our results cannot test for this possibility.
In short, the results for the network richness variables show that exploratory teams took less time
to complete their projects to the extent that they had many strong ties, while exploitation teams with many
strong ties took longer time to complete their projects. These findings support hypotheses 1a and 1b.
However, both types of project teams took longer to complete their projects to the extent that their
members engaged in reciprocal helping behaviors.
---------- Insert figures 4 and 5 about here ---------
We entered the effects for the network sparseness variables in models 5 through 7. First, in model
5, we added the squared term for the network sparseness variable (but did not interact it with degree of
exploitation). When the squared term is entered, the effect for the main sparseness variable becomes
positive and significant, while the effect for the squared term is negative. Thus, there is an inverted U-
shaped relationship between network sparseness and completion rate. In models 6 and 7, we entered the
network sparseness variables for each of the three segments of exploitation.12 The curvilinear relationship
holds for highly exploitative projects (i.e., projects in the upper third on the exploitation scale) and

28
medium exploitative projects (i.e., the middle third on the exploitation scale), but not for exploratory
projects (i.e., the lower third on the exploitation scale). Thus, highly exploitative teams took less time to
complete their project if they had a medium-level of network sparseness. The plot in figure 6 shows that
exploitative project teams that went from a very low level of network sparseness (i.e., high density) to a
medium level of sparseness completed their projects more quickly. Beyond a medium level of network
sparseness, however, exploitative project teams took longer to complete. The turning point is 0.6 standard
deviation below the mean level of network sparseness (at this point, teams had a density of 40% of the
maximum possible indirect ties in their egocentric team network). This result lends support to hypothesis
2a, that there is an inverted U-shaped relationship between network sparseness and the realization of
immediate performance-related goals for exploitation teams.
While the curvilinear relationship between network sparseness and completion time did not hold
for exploratory projects, the effect for the main variable of network sparseness is positive for exploration
teams, as shown in model 7. However, this result is only significant at p < 0.1 and using a one-tailed test
of significance. Because hypothesis 2b states that a high level of network sparseness is more beneficial
for exploratory teams, using a one-tailed test for this directional hypothesis is appropriate. Thus, there is
evidence – albeit weak evidence -- that exploratory teams took less time to complete their projects to the
extent that they had sparse networks. This result is also plotted in figure 6. In the discussion, we consider
in greater detail why this particular result is not as strong as some of the others.
--------- Insert figure 6 about here ----------
In summary, the statistical analysis by and large confirmed our hypotheses, with two
qualifications. Our hypothesis about the positive effect of reciprocal helping activity for exploratory
projects were not supported; all teams experienced a negative effect on completion time of engaging in
reciprocal helping activities. In addition, while all other results were significant at the p<0.01 or p<0.05
levels (see model 7 in table 3), the result for the positive effect of network sparseness on completion time
for exploratory projects was only significant at p<0.10 in a one-tailed test.
29
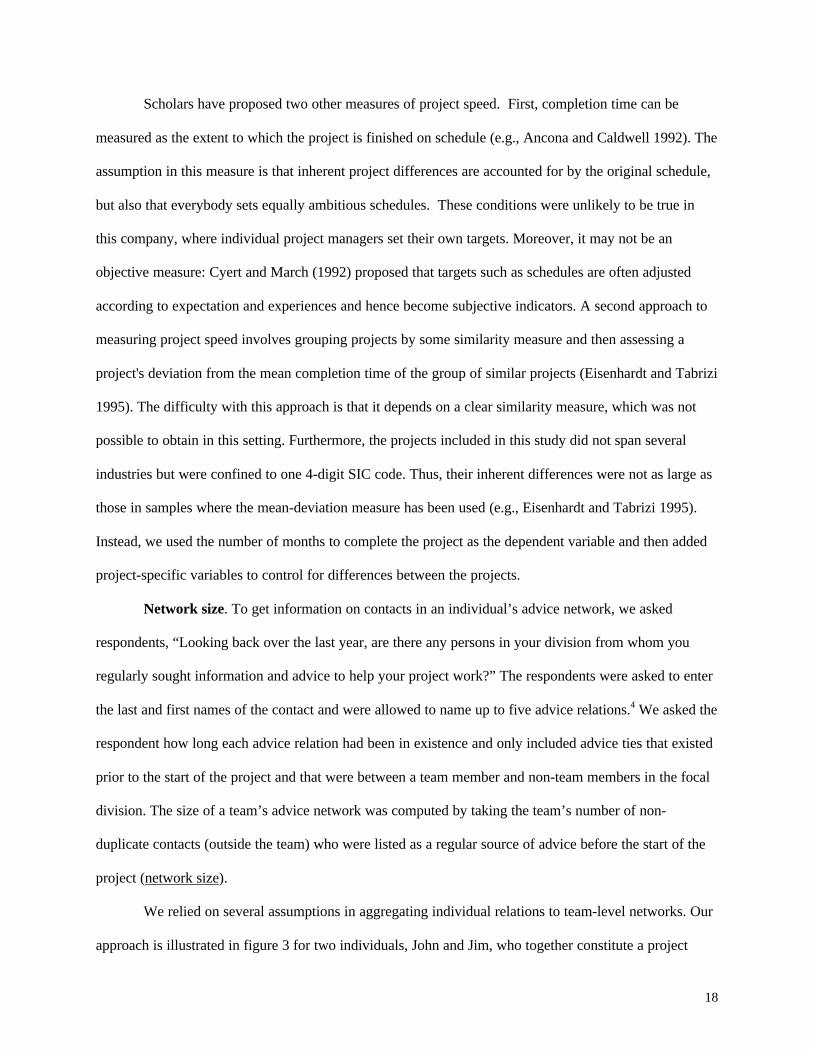
DISCUSSION
The main finding of this study is that different tasks required different network structures to be
effective. Several network attributes that were valuable for exploratory teams were harmful for
exploitation tasks, and vice versa. Specifically, exploratory project teams in our sample benefited from a
network structure similar to the one laid out in Burt’s (1992) structural hole theory: they took less time to
complete their projects to the extent that they had many strong and non-redundant ties. In contrast,
exploitation teams took less time to finish if they had a network composed of weakly tied contacts that
were moderately interconnected. Thus, the network position that was most beneficial for exploration
teams was a liability for exploitation teams.
Limitations and research issues
Our results are specific to the context we studied. In a high-technology environment in which
speed is important for competition, the time required to build social relationships and to help others can
have negative consequences. In environments in which speed is less critical, the investment of time and
energy in network building may be less problematic. Also, the firm we studied coordinates its
development activities informally. By decentralizing so much of its activities to divisions and forgoing
the use of strong, central coordination, the benefits of building efficient networks for completing projects
may be greater.
Nevertheless, our findings are generalizable to some other work contexts, especially to those with
low levels of slack and where network-related activities are simply not a by-product of ongoing work
(Nohria and Gulati 1996). If individuals and groups experience time constraints, there is likely to be some
tradeoff between spending time doing one’s own work well and allocating time to cultivating networks
and helping others. Because of this tradeoff, there are substantial costs associated with some network
positions, and these costs should affect a range of performance-related goals. For example, decisions may
be delayed or poorly made, production quality may suffer, and the degree of innovation may be lacking to
the extent that individuals and groups do not fully commit time to conduct high-quality work because

30
they spend time on networks. Subsequent research could apply the basic idea of a tradeoff between
network-time and work-time to investigate network costs in other settings involving a range of tasks.
Another important issue is the limitation imposed by our unit of analysis. By studying individual
project teams, we were unable to pinpoint whether network positions and activities that prolonged a single
project’s completion had negative consequences for the organization as a whole. Helping others may have
harmed the focal project team but may have provided substantial benefits for other projects, yielding a net
positive effect overall. While this issue can complicate interpretation, it has also been partially addressed
by how we conducted the study. Because we have a representative sample of all projects that this
organization had started during a period of two years, our data set includes many project teams that were
recipients of help from others. Receiving this help should be partially captured by the network variables: a
team’s incoming flow of knowledge through advice-seeking relations is most likely the result of helping
activities carried out by members of other teams. Thus, the benefit of having many advice-seeking
relations (a positive effect for the focal team) is likely to be the result of someone else’s reciprocal
helping behaviors (a negative effect for the focal team). Although our analysis thus partially captured this
dual effect, our study did not pinpoint in detail the recipients of specific helping behaviors. We can
therefore not conclude that the demonstrated negative effect of reciprocal helping behaviors on
completion time is offset (or even surpassed) by some positive effect associated with receiving all that
help. Although our result about the negative consequence of reciprocal helping behaviors for task
performance is interesting, more research is needed to understand the various consequences of reciprocal
helping activities for both the focal actor and the aggregate unit.
Finally, because we did not track investments in networks over time, we could not analyze
whether investments made in one period (e.g., helping others and interacting frequently with contacts)
had positive or negative returns in subsequent periods. Theoretically, investments in activities that slow
down current product development efforts might actually enhance completion of subsequent product
development efforts, if people do not need to invest as heavily in the future and if some of the benefits
from these activities are deferred in the form of social capital to be drawn upon in subsequent efforts. This

31
issue suggests that future research should be more dynamic, considering how network benefits and
investments in the network are allocated differentially across time.
From network structure to contingency theory
An important implication of our study is that the effects of structural network attributes, such as
network size, sparseness, and tie strength, cannot be fully understood without considering the specific
organization context, including costs of networks, difficulties in getting others to help, and different task
requirements. Our results suggest that organization network research would benefit from using the
structuralist approach as a foundation but then proceeding to consider these context-specific issues. The
implication is that network structure theories, such as Burt’s (1992) structural hole theory, Coleman’s
(1990) prediction about the value of connected networks, and Granovetter’s (1973, 1982) weak-tie theory,
need to be modified to reflect the possibility that their predictions only hold in some organization
contexts.
An exciting task for organization network researchers is therefore to develop parsimonious
contingency theories about the effects of social networks in organizations. Building on traditional
contingency perspectives on organization design (e.g., Lawrence and Lorsch 1967; Tushman 1977), some
recent network research has shown that individual or group network effects are contingent on particular
organization contexts, including whether the task is basic research or product development (Gabbay and
Zuckerman 1998), the knowledge required is tacit or explicit (Hansen 1999; Uzzi 1997), and managers’
peer groups are large or small (Burt 1997). Our study contributes to this emerging body of work in two
ways. First, we use March’s (1991) distinction between exploration and exploitation because it captures a
fundamental difference in the nature of work, that is, between work that is inherently novel (innovation,
experimentation, one-time decisions, radical change, etc.) and work that is routine (daily work,
continuous improvement, production efficiency, etc.). Particular work tasks (e.g., basic versus applied
research) can thus be studied at a more abstract level of classification, leading to a more parsimonious

32
contingency model, because the fundamental distinction between exploration and exploitation is used
instead of many different and highly context-specific task variables.
Second, the distinction between exploration and exploitation complements the distinction
between tacit and explicit knowledge, which has emerged as another important contingency variable for
understanding knowledge flows among people and groups (Hansen 1999; Szulanski 1996; Uzzi 1997;
Zander and Kogut 1995). While there is likely to be a positive association between the degree of
exploration and the tacitness of knowledge involved, they are not the same underlying dimension. For
example, some exploratory tasks involve innovations that are mainly based on recombination of existing
components, which contain a high level of explicit knowledge (cf. Henderson and Clark 1990; Nahapiet
and Ghoshal 1998). Likewise, for exploitation tasks, some routine work involves execution of skills that
are largely based on tacit know-how (cf. Von Hippel 1988, 1994). Thus, social network research studying
contingency effects needs to distinguish between the effects of tacit knowledge (which was studied by
Hansen 1999) and the degree of project exploitation, which has been the focus of our study.
While our study highlighted task differences, future research could profitably combine a task
contingency view with a knowledge contingency approach and study the combined effects of both
constructs on outcomes such as task performance. For example, do exploratory tasks that involve highly
explicit knowledge (e.g., recombination of chunks of existing knowledge) require different network
structures compared with exploratory tasks involving highly tacit knowledge? We speculate that they do.
While both tasks are likely to benefit from a non-redundant network that enables the inflow of diverse
knowledge and ideas, the exploratory-explicit situation may not require strong ties to transfer explicit
knowledge. This assertion needs to be developed further and tested in future research.
Our study also highlights another interesting contingency issue concerning exploratory tasks. We
hypothesized that exploratory tasks benefit from sparse networks. However, our empirical results were
not as strong for this hypothesized effect as for the other results. The reason may be that the positive
benefit of receiving diverse input from sparse networks may be offset by an integration problem.
Disconnected contacts in a sparse network do not have established relationships among one another and

33
thus are less likely to come together to exchange views, brainstorm, deepen their understanding of a
problem through discussions, and pass on their collective knowledge to a focal actor. Although each non-
redundant contact may have distinct views and knowledge, the contacts are unlikely to engage one
another to develop their collective insight to help the focal actor. Sutton and Hargadon (1996), in their
research on brainstorming among product designers, found that effective brainstorming sessions
involving a team and other designers relied on past and enduring social relationships among the people
involved. Designers knew one another and had established a set of heuristics for relating to one another
(cf. Uzzi 1997). The existence of a dense network among the designers made it easier, faster, and more
effective to engage in discussions about subtle and vague concepts.
Thus, people and groups that are engaged in exploration tasks may face a tradeoff between having
sparse networks (which enable diverse input) and dense ones (which enable extended brainstorming). For
some exploration tasks, receiving diverse input may be more important than having an extended
brainstorming group, implying that a sparse network is relatively more important. Other exploration tasks
may benefit relatively more from being able to use an interconnected set of people as a forum in which to
brainstorm and gain insight. In our study, we were unable to disentangle the relative values of these
benefits for exploratory project teams, but this topic needs to be studied in order to pinpoint the
conditions under which sparse or dense networks are beneficial for exploration tasks.
Our results also point to some other research questions that warrant exploration in subsequent
studies. One of the interesting findings from our analysis is that some exploitation teams had ties that
were too strong and, as a result, their projects were completed more slowly. This raises the question of
why presumably rational individuals overinvest in ties. One answer involves one of the assumptions
implicit in the organization network literature. Much of this literature assumes that the network that is
most conducive to the mobility of the individual is also the network that is most conducive to task
performance (e.g., Burt 1997; Podolny and Baron 1997), but this assumption may not hold. For example,
it may be that it is in the individual’s interest to have strong ties because those ties are a basis of future job

34
opportunities and promotions (e.g. Burt, 1992). This finding means that future studies of the effects of
networks need to consider carefully whether the dependent variable is relevant to the organization, the
individual, or both.
A second possible explanation for overinvestment in building strong ties does not presuppose that
individual and organizational interests are necessarily antithetical. Rather, individuals must make
decisions about network investments under conditions of considerable uncertainty. It is difficult to
forecast what sorts of projects one will work on in the future and what kinds of connections and
information those projects will require. Therefore, even if people are considering the organization’s needs
completely, individuals may still overinvest in social relations, which may be harmful in some projects,
such as exploitation projects. Future research could profitably examine which of these explanations for
network building hold and how individuals decide to make investments in building networks.
Although the older research on networks in organization highlighted the possibility that networks
may undermine performance, this negative view of networks has been largely been replaced by a more
positive view of social network effects in organizations. While organization network research has moved
from a negative to a positive view spanning a period of forty years, there is a dearth of research
synthesizing positive and negative effects of social networks in organization. Our task contingency
perspective on network effects in organizations is one approach to this synthesis.

35
REFERENCES
Adler, Paul S., and Seok-Woo Kwon. 1999. “Social Capital: The Good, The Bad, and The Ugly.”
Unpublished manuscript, Department of Management and Organization, University of Southern
California, CA: Los Angeles.
Ancona, Deborah G., and David F. Caldwell . 1992. “Bridging the boundary: External activity and
performance in organizational teams." Administrative Science Quarterly 37: 634-665.
Benner, Mary. J., and Michael L. Tushman. 1999. “Process management and organizational adaptation: the
productivity dilemma.” Unpublished manuscript, Harvard Business School, MA: Boston.
Blau, Peter M. 1964. Exchange and Power in Social Life. New York: John Wiley.
Blossfeld, Hans-Peter, and Gotz Rohwer. 1995 Techniques of Event History Modeling. Mahwah, NJ:
Lawrence Erlbaum Associates, Inc.
Brass, Daniel J. 1984. “Being in the right place: A structural analysis of individual influence in an
organization.” Administrative Science Quarterly 29: 518-539.
Brass, Daniel . J. and Marlene E. Burkhardt. 1992. "Centrality and Power in Organizations". Pp.191- 215 in
Networks and Organizations: Structure, Form and Action, edited by N. Nohria and R.G. Eccles.
Boston, MA: Harvard Business School Press.
Brass, Daniel J., Kenneth D. Butterfield, and Bruce C. Skaggs. 1998. “Relationships and unethical behavior:
A social network perspective.” Academy of Management Review 23: 14-31.

36
Burt, Ronald S. 1992. Structural Holes: The Social Structure of Competition. Cambridge, MA: Harvard
University Press.
------------. 1997. “The contingent value of social capital.” Administrative Science Quarterly 42: 339-365
Coleman, James S. 1990. Foundations of social theory. Cambridge, MA: Belknap Press of Harvard
University Press.
Cyert, Richard M., and James G. March. 1992. Foundations of social theory. 2nd ed. Cambridge, MA:
Blackwell Business.
Deutsch, Karl W. 1953. Nationalism and Social Communication. New York: Wiley.
Eisenhardt, Kathleen, and Benham N. Tabrizi. 1995. "Accelerating adaptive processes: Product innovation in
the global computer industry.” Administrative Science Quarterly 40: 84-110.
Ekeh, Peter P. 1974. Social Exchange Theory: the two traditions. Cambridge, MA: Harvard University Press.
Gabbay, Shaul M. & Roger Th. A.J. Leenders. 1999. “CSC: The structure of advantage and disadvantage.”
Pp. 1-14 in Corporate social capital and liability, edited by Roger Th. A.J. Leenders & Shaul M.
Gabbay. Boston: Kluwer Academic Publishers.
Gabbay, Shaul M. and Ezra W. Zuckerman. 1998. “Social capital and opportunity in corporate R&D:
The contingent effect of contact density on mobility expectations.” Social Science Research 27: 189-
217.

37
Gouldner, Alvin W. 1960. “The norm of reciprocity: A preliminary statement.” American Sociological
Review 25: 161-178.
Granovetter, Mark S. 1973. “The strength of weak ties." American Journal of Sociology 6: 1360-1380.
-------, 1982. "The strength of weak ties: A network theory revisited." Pp. 105-130 in Social Structure
and Network Analysis, edited by Peter V. Marsden and Nan Lin . Beverly Hills, CA: Sage.
Hansen, Morten T. 1999. “The search-transfer problem: The role of weak ties in sharing knowledge
across organization subunits,” Administrative Science Quarterly 44: 82-111.
Henderson, Rebecca M., and Kim B. Clark. 1990. "Architectural innovation: The reconfiguration of existing
product technologies and the failure of established firms." Administrative Science Quarterly 35: 9-30.
Henderson, Rebecca M., and Ian Cockburn. 1994. “Measuring competence? Exploring firm effects in
pharmaceutical research." Strategic Management Journal, Winter Special Issue, 15: 63-84.
Higgins, Monica C. 1999. “Changing careers: The effects of social context.” Unpublished manuscript,
Harvard Business School, 98-016.
Homans George C. 1950. The Human Group. New York: Harcourt.
Ibarra, Heminia, and Steven B. Andrews. 1993. “Power, social influence, and sense making: Effects of
network centrality and proximity on employee perceptions.” Administrative Science Quarterly 38:
277-303.
Kapferer, Bruce. 1969. “Norms and the manipulation of work relationships in a work context.” Pp. 181-244

38
in Social Networks in urban settings, edited by J.C. Mitchell. Manchester, England: Manchester
University Press.
Krackhardt, David. 1992. “The strength of strong ties: The importance of philos in organizations”. Pp. 216-
239 in Networks and Organizations, edited by N. Nohria and R. G. Eccles. Boston, MA: Harvard
Business School Press.
Krackhardt, David and Martin Kilduff. 1999. “Whether close or far: Social distance effects on perceived
balance in friendship networks.” Journal of Personality & Social Psychology 76: 770-782.
Lawrence, Paul, and Jay Lorsch. 1967. Organizations and Environments: Managing Differentiation and
Integration. Boston, MA: Harvard Business School Press.
Leana, Carrie R. and Harry J. Van Buren III. 1999. “Organization social capital and employment practices.”
Academy of Management Review 24: 538-557.
Levinthal, Daniel A., and James G. March. 1993. “The myopia of learning.” Strategic Management Journal
14: 95-112.
March, James G. 1991. “Exploration and Exploitation in Organization Learning,” Organization Science 2:71-
87.
Marsden, Peter V. 1990. "Network data and measurement." Annual Review of Sociology 16: 435-463. Palo
Alto, CA: Annual Reviews, Inc.
Marsden, Peter V., and Karen E. Campbell. 1984. “Measuring tie strength." Social Forces 63: 482-501.

39
Nahapiet, Janine, and Sumantra Ghoshal. 1998. “Social capital, intellectual capital, and the organizational
advantage.” Academy of Management Review 23: 242-266.
Nelson, Richard R., and Sidney G. Winter. 1982. An Evolutionary Theory of Economic Change. Cambridge,
MA: Belknap Press.
Nohria, Nitin, and Ranjay Gulati. 1996. “Is slack good or bad for innovation?” Academy of Management
Journal 39: 1245-1264.
Nonaka, Ikujiro. 1990. “Redundant, overlapping organizations: A Japanese approach to managing the
innovation process.” California Management Review 32: 27-37.
Olson, E., Walker, O., and Ruekert, R. 1995. "Organizing for effective new product development: the
moderating role of product innovativeness." Journal of Marketing 48-62.
Podolny, Joel M., and James N. Baron. 1997. “Relationships and resources: Social networks and mobility in
the workplace.” American Sociological Review 62: 673-693.
Polanyi, Michael. 1966. The Tacit Dimension. New York: Anchor Day Books.
Portes, Alejandro. 1999. “Social Capital: Its origin and applications in modern sociology.” Annual Review of
Sociology 24: 57-76.
Portes, Alejandro and J. Sensenbrenner. 1993. “Embeddedness and immigration: Notes on the social
determinants of economic action.” American Journal of Sociology 98: 1320-1350.
40
Roethlisberger, F. J., and William J. Dickson. 1939. Management and the Worker. Cambridge, MA: Harvard
University Press.
Roy, Donald. 1952. “Quota restriction and goldbricking in a machine shop.” American Journal of
Sociology 57: 427-442.
Seashore, Stanley E. 1954. Group Cohesiveness in the Industrial Work Group. Ann Arbor, MI: Institute
for Social Research, University of Michigan.
Shaw, Marvin E. 1964. “Communication networks.” in Advances in Experimental Social Psychology, edited
by L. Berkowitch. New York: Academic Press.
--------- 1971. Group Dynamics: The Psychology of Small Group Behavior. New York: McGraw-Hill
Sutton, Robert I., and Andrew Hargadon. 1996. “Brainstorming groups in context: Effectiveness in a product
design firm.” Administrative Science Quarterly 41: 685-718.
Szulanski, Gabriel. 1996. "Exploring internal stickiness: Impediments to the transfer of best practice within
the firm.” Strategic Management Journal, Winter Special Issue, 17: 27-43.
Teece, David J. 1986. "Profiting from technological innovation: Implications for integration, collaboration,
licensing and public policy." Research Policy 15: 285-305.
Tuma, Nancy B., and Michael T. Hannan. 1984. Social Dynamics: Models and Methods. New York:
Academic Press.

41
Tushman, Michael L. 1977. “Special boundary roles in the innovation process." Administrative Science
Quarterly 22: 587-605.
Uzzi, Brian. 1997. “Social structure and competition in interfirm networks: The paradox of embeddedness.”
Administrative Science Quarterly 42: 35-67.
Von Hippel, Eric. 1988. The Sources of Innovation. New York: Oxford University Press.
---------1994. “Sticky information and the locus of problem solving: Implications for innovation.”
Management Science 40: 429-439.
Walker, Gordon, Bruce Kogut and W. Shan. 1997. “Social capital, structural holes and the fromation of an
industry network.” Organization Science 8: 109-125.
Zander, Udo, and Bruce Kogut. 1995. "Knowledge and the speed of transfer and imitation of organizational
capabilities: An empirical test." Organization Science 6: 76-92.

42
Many, strong,reciprocal ties
Few, weak,non-reciprocalties
Networkrichness(direct ties)
Exploitation Exploration
Task Type
Positive:very high knowledge benefits,high network costs
Positive:Some knowledge benefits,low network costs
Negative:Knowledge deficit,low network costs
Negative:Some knowledge benefits,High network costs
Figure 1. Comparing the net value of network richness for exploitation and exploration tasks

43
VeryDense
VerySparse
Networksparseness(indirect ties)
Exploitation Exploration
Task Type
Negative:No diverse knowledge benefit,redundant contacts
Negative:Some knowledge benefits,but enforcement difficulty
Positive:High diverse knowledge benefits,but enforcement difficulty
Negative:Some knowledge benefits,redundant contacts
Figure 2. Comparing the net value of network sparseness for exploitation and exploration tasks
Positive

44
Table 1. Comparing samples.
Excluded Sample Final Sample
N=53 N=67
Mean St.dev. Mean St.dev. T-test (p-level)
Number of people 6.37 3.12 5.39 2.49 1.89*
Budget 6.89 1.19 6.65 0.98 1.39
Existing ware 0.49 0.33 0.41 0.28 1.51
Degree exploitation 4.66 1.43 4.61 1.49 0.19
Completion time + 14.44 5.30 15.04 5.87 0.52
* p < 0.1 +) n = 38 for excluded sample and n=54 for final sample

45
1 1 1
1
1
1 1
1
0 0
0
0
Figure 3. Aggregating individual networks to a team network
John’s Network
Mary
Jim
Tim
John
John
Mary
Laura
Jim
John Jim Mary Tim
John
Jim
Mary
Tim
1 1
11
1
0 0
0
1
0
1
1
John Jim Mary Laura
John
Jim
Mary
Laura
Team Network
Jim
John
Mary
Tim
Laura
11
1
1
1 1
1
1
John Jim Mary Tim
John
Jim
Mary
Tim
1
0
Laura
01Laura
Jim’s Network
Not
Reported

46
Table 2. Descriptive statistics and correlations
Variable Mean St. dev. Min Max 1 2 3 4 5 6 7 8 9 10 11 12 13 14 151. Existing ware .41 .28 0 .902. Budget 6.65 .98 4.49 9.21 -.373. Tenure mean 13.60 4.85 2.00 25.0 .20 -.144. Product .76 .43 0 1 .26 -.07 .045. Divisional sale (log) 3.74 .93 1.09 4.93 .40 -.16 .12 .206. No. respondents 3.81 1.84 1 10 -.06 .59 -.32 .06 .147. Within-team density .23 .22 0 1.00 .14 -.13 .23 .15 .08 -.308. Exploitation1 0 1.00 -2.24 1.59 .52 -.22 -.01 .41 .27 .10 .269. Network Size1 0 1.00 -1.45 4.03 .03 .29 .09 .17 .10 .44 -.07 .0710. Tie Strength1 0 1.00 -3.78 2.32 -.10 .19 -.23 -.14 .11 .17 -.10 -.07 -.1611. Reciprocity1 0 1.00 -2.24 1.52 .11 .34 -.21 .01 -.04 -.48 -.13 -.05 .44 -.0212. Network sparseness1 0 1.00 -1.91 1.21 -.19 .08 .10 .10 -.28 .06 -.17 -.05 .25 -.21 .0013. Netw. Sparse-squared .98 1.11 0.00 3.63 .03 -.04 -.31 -.07 -.05 -.16 .15 -.01 -.50 .14 -.14 .4514. Strength*Exploit -.06 1.06 -4.83 2.51 .01 .07 .12 .21 .02 .15 .01 .19 .18 -.17 .02 .06 -.1015. Reciprocity*Exploit -.05 .93 -3.17 2.43 .04 .02 -.02 -.11 .05 .12 .27 .02 .15 .02 .22 .13 -.03 -.1916. Netw Size*Exploit .07 .87 -1.83 3.01 -.19 .18 -.05 .02 -.04 -.02 -.11 -.30 -.01 .23 .15 -.28 -.14 .22 -.221 Variables are standardized by subtracting the mean from the value and dividing by the standard deviation.N=67

47
Table 3. Results from Hazard Rate Analysis of Completion Time (N=67)
Model 1 Model 2 Model 3 Model 4 Model 5 Model 6 Model 7Control variablesPeriod –1 -2.140(1.797) -2.432(1.823) -2.434(1.847) -4.294**(2.099) -5.355**(2.101) -5.580**(2.201) -4.729**(2.044)Period – 2 -.320(1.834) -.654(1.861) -.656(1.875) -2.436(2.099) -3.479*(2.108) -3.677*(2.205) -2.822(2.047)Period –3 .498(1.834) .165(1.856) .164(1.870) -1.615(2.080) -2.513(2.085) -2.687(2.194) -1.830(2.037)Period –4 1.503(1.890) 1.174(1.911) 1.173(1.922) -.568(2.109) -1.405(2.104) -1.557(2.204) -.731(2.0 61)Period- -5 1.452(1.978) 1.125(1.994) 1.124(2.008) -.595(2.183) -1.328(2.184) -1.510(2.281) -.719(2.150)Period- 6 1.991(2.040) 1.743(2.054) 1.741(2.071) .058(2.235) -.819(2.226) -1.078(2.326) -.251(2.193)
Existing ware 2.617***(.816) 2.636***(.815) 2.637***(.824) 2.737***(.823) 3.168***(.834) 2.872***(.980) 2.341***(.858)Budget -.749***(.246) -.706***(.249) -.705***(.252) -.561**(.262) -.656**(.258) -.663**(.278) -.728***(.272)Team tenure -.048(.041) -.032(.042) -.032(.02) -.034(.045) -.025(.044) -.018(.047) -.016(.047)Product .395(.499) .236(.503) .235(.531) .395(.536) .608(.568) .603(.625) .627(.621)Divisional sale (log) -.269(.200) -.261(.199) -.261(.201) -.102 (.210) -.176(.206) -.148(.209) -.119(.210)No. respondents -.255*(.140) -.257*(.138) -.257*(.138) -.274*(.140) -.223*(.134) -.213(.141) -.186(.140)Within-team density -.386(.493) -.381(.485) -.380(.506) -.617(.530) -.726(.535) -.829(.550) -.846(.542)Exploitation1 .131(.192) .213(.207) .214(.213) .112(.237) .213(.248) .391(.565) .095(.485)
Network Richness(direct ties)Advice size1 .691***(.212) .782***(.222) .782***(.230) .867***(.228) .606**(.253) .664**(.277) .671**(.271)Tie strength1 .334*(.194) .326*(.192) .325(.245) .512*(.272 .605**(.291) .642**(.297) .632**(.288)Reciprocity1 -.301*(.177) -.519**(.239) -.519**(.249) -.639**(.267) -.636**(.251) -.632**(.271) -.538**(.251)Tie strength*exploitation -.331*(.187) -.330*(.194) -.628**(.262) -.798***(.286) -.821***(.282) -.737***(.260)Reciprocity*exploitation -.001(.225) .119(.235) .136(.244) .153(.251) .188(.247)Advice size*exploitation -.510**(.248) -.750***(.280) -.895**(.360) -1.023***(.336)
Network Sparseness(indirect ties)Sparseness1 -.069(.155) -.137(.162) -.137(.163) -.052(.168) 2.015**(.847)Sparseness-squared -.583**(.230)
Sparseness*exploit 1st 2.030(1.441) .399†(.290)Sparseness-squared * exploit 1st -.495(.414)
Sparseness *exploit 2nd 1.886*(1.119) 1.261(.961)Sparseness-squared * exploit 2nd -.540*(.319) -.384(.288)
Sparseness *exploit 3rd 2.250*(1.175) 2.380**(1.137)Sparseness-squared * exploit 3rd -.663*(.351) -.726**(.341)
Log-likelihood -356.3 -354.7 -354.7 -352.6 -349.2 -348.7 -349.4Chi square (d.f.) †† 3.2*(1) 3.2 (2) 7.4*(3) 14.2***(4) 15.2*(8) 13.8*(7)1Variables are standardized (see table 2).*p < .10, **p < .05, and ***p < .01 (two-tailed test for variable coefficients) ; †p<.10 (one-tailed test).†† Compared with model 1.

48
Figure 4. Plot of hazard rate for tie strength and degrees of exploitation
Weak tie strength (st.dev from mean) Strong
Note: estimates based on model 7. Formulas were:
Exploitation (+1 st.dev): Rate = exp [0.632*tie strength – tie strength*(0.737*(+1)) ].
Exploration (-1 st.dev): Rate = exp [0.632*tie strength – tie strength*(0.737*(-1)) ].
0
1
2
3
4
5
-2.5 -2 -1.5 -1 -0.5 0 0.5 1 1.5 2
Mul
tiplie
r of
the
Rat
e
Exploration
Exploitation

49
Figure 5. Plot of hazard rate for network size and degrees of exploitation
Small Network size (st.dev. from mean) Large
Note: estimates based on model 7. Formulas were:
Exploitation (+1 st.dev): Rate = exp [0.671*network size– tie strength*(1.023*(+1)) ].
Exploration (-1 st.dev): Rate = exp [0.671*tie strength – tie strength*(01.023*(-1)) ].
0
2
4
6
8
10
12
14
-2.5 -1.5 -0.5 0.5 1.5 2.5
exploration
exploitation

50
Figure 6. Plot of hazard rate for network sparseness and degrees of exploitation
Network sparseness (st.dev. from mean)*
Note: estimates based on model 7. Formulas were:
Exploitation (upper third on scale): Rate = exp [2.380*sparseness –0.726*sparseness-squared].
Exploration (lower third on scale): Rate = exp [0.399*sparseness].
*) Sparseness variable was rescaled from prior range (-1.91,1.21) to positive range (0, 3.12) in models 6 and 7.
0
1
2
3
4
5
6
7
8
-2.5 -1.5 -0.5 0.5 1.5 2.5
exploration
exploitation

51
1 Although exploration tasks are likely to contain more tacit knowledge than exploitation tasks, we do not
argue that there is a one-to-one relationship between exploration and tacitness of knowledge involved. For
example, many exploitation tasks involve tacit knowledge, including psycho-motor skills such as riding a
bike.
2 It may be in the focal actor’s long-term interest to help others because of other concerns. For example,
even though helping others may hamper a person’s work performance in the short-term, it may be
beneficial to do so for career advancement because he or she is likely to be seen as a helpful colleague.
But this possibility does not mitigate the short-term problem that time spent helping others is time not
spent on one’s own work.
3 A number of team members naturally had relations outside the focal division, including ties to engineers
in other divisions and to peers outside the company. We controlled for the potential bias by including a
variable measuring a team’s number of ties to members of other divisions in the company. Because this
variable did not alter results, we excluded it from the final statistical analysis.
4 We set the limit to five network contacts because of the difficulties of asking for ties between contacts
when many contacts were named. This approach restricts the upper range of network size. However, only
20% of respondents listed five relations in their network, with a majority (40%) listing three relations.
Thus, this restriction is not likely to substantially bias the network measures.
5 These duplicate ties can be seen as a form of contact redundancy, which may benefit exploratory teams.
We ran separate models including duplicate ties in the network size variable, but these did not alter the
results, and we therefore do not report this additional analysis.
6 Because some scholars have found that these two measures of tie strength represent different dimensions
(e.g., Marsden and Campbell, 1984), we also ran models with frequency and closeness entered separately.

52
7 We chose thirds instead of quartiles to be able to have enough projects in each sub-sample. We
experimented by slightly altering the cut-off values for the boundaries between the thirds, but this did not
change the results. The results are therefore not sensitive to arbitrary boundaries between the three
segments of degree of exploitation.
8 Because the biggest budget item was engineering hours, we did not include a separate control for the
number of team members (the correlation between budget size and number of team members was 0.80).
9 Inspection of the survivor function revealed that the hazard rate is non-monotonic, suggesting that an
exponential model without specific time intervals is not an appropriate functional form for this data set.
10 We use the coefficient estimates from model 7 to assess the magnitude of the effects and plot the
results, because this model is the most specified one and allows for a comparison of the effects for the
various independent variables.
11 The magnitude of the negative coefficient for the interaction term is lower in model 4, meaning that
teams had to be highly exploitative (1.5 standard deviations above the mean value on the exploitation
scale) for the combined effect to turn negative. Regardless of which model is considered, however, results
show that highly exploitative teams with large networks took longer time to complete their projects.
12 We rescaled the standardized network sparseness variable from the original range (-1.91 to 1.21) to a
range with positive values (0 to 3.12), because having only positive values makes it easier to interpret the
combined impact of the main effect and the squared term. Results remained the same before and after
rescaling the variable.