S~ND2000-2386 y>; g+ q~ ‘~&mprehens~e Testing to Measure ...
56
I (1) IL=wi -17 ~ ,! ~sk SANDIA REPORT S~ND2000-2386 Un[im~ed Release P@ed October 2000 ) y>; g+ q~ ‘~&mprehens~e Testing to Measure the .Responge of)Styrenex.Butadiene Rubber ~kkanfd%i T~#k Wa&te Sirndant . .=x ~ Sa~~a-N%ona~{boratories / Albuquerque7New Mexico 87185 and)ivermore, California 94550 Sandia is a’multiprogram laborato~’operated by Sandia Corporation, a Lockhe6d Martin Company, fofihe United States Department of ~Energ$ under Contract DE-AC04-94AL85000. 7-=---J -- Approved fo<pubiic release; further dissemination unlimited. / Sandia National laboratories ! / /‘“ .’ —..—.
Transcript of S~ND2000-2386 y>; g+ q~ ‘~&mprehens~e Testing to Measure ...

I
(1) IL=wi -17 ~ ,! ~sk
SANDIA REPORTS~ND2000-2386Un[im~ed ReleaseP@ed October 2000
)
y>; g+ q~
‘~&mprehens~e Testing to Measure the.Responge of)Styrenex.Butadiene Rubber
~kkanfd%i T~#k Wa&te Sirndant..=x
~ Sa~~a-N%ona~{boratories /Albuquerque7New Mexico 87185 and)ivermore, California 94550
Sandia is a’multiprogram laborato~’operated by Sandia Corporation,a Lockhe6d Martin Company, fofihe United States Department of
~Energ$ under Contract DE-AC04-94AL85000.
7-=---J --
Approved fo<pubiic release; further dissemination unlimited.
/
Sandia National laboratories
!
/
/‘“
.’—..—.

Issued by Sandia National Laboratories, operated for the United StatesDepartment of Energy by Sandia Corporation.
NOTICE This report was prepared as an account of work sponsored by anagency of the United States Government. Neither the United States Government,nor any agency thereof, nor any of their employees, nor any of their contractors,subcontractors, or their employees, make any warranty, express or implied, orassume any legal liability or responsibility for the accuracy, completeness, orusefulness of any information, apparatus, product, or process disclosed, orrepresent that its use would no-t infringe privately owned rights.’ Reference hereinto any specflc commercial product, process, or service by trade name,
trademark, manufacturer, or otherwise, does not necessarily constitute or implyits endorsement, recommendation, or favoring by the United States Government,any agency thereof, or any of their contractors or subcontractors. The views andopinions expressed herein do not necessarily state or reflect those of the UnitedStates Government, any agency thereof, or any of their contractors.
Printed in the United States of America. This report has been reproduced directlyfrom the best available copy.
Available to DOE and DOE contractors fromU.S. Department of EnerWOffice of Scientific and Technical InformationP.O. BOX 62Oak Ridge, TN 37831.. .
Telephone: (865)576-840 1Facsimile: (865)576-5728E-Maik ‘ reports@,adonis.osti. gov
Online ordering http:/ /www.doe.gov/bridge
Available to the public fromU.S. Department of CommerceNational Technical Information Service5285 port Royd RdSpringfield, VA 22161
Telephone: (800)553-6847Facsimile: (703)605-6900E-MaiL orders@??tis.fedworld.gov
Online ordex http:j /www.ntis.gov/ordering. htm

DISCLAIMER
Portions of this document may be illegiblein electronic image products. Images areproduced from the best available originaldocument.
I
-.— .... ,. =.-—.- .—. - ....= .....
SAND2000-2386Unlimited Release
Printed October 2000
Comprehensive Testing to Measure theResponse of Styrene Butadiene Rubber
to Hanford Tank Waste Simulant
P. J. NigreyTransportation Safety & Security Analysis Department
Sandia National LaboratoriesP.O. BOX 5800,.
Albuquerque, NM 87185-0718
Abstract
This report presents the findings of the Chemical Compatibility Programdeveloped to evaluate plastic packaging components that may be incorporated inpackaging mixed-waste forms for transportation. Consistent with themethodology outlined in this report, we pefiormed the second phase of thisexperimental program to determine the effects of sirnulant Hdord tank mixedwastes on packaging seal materials. That effort involved the comprehensivetesting of five plastic liner materials in an aqueous mixed-waste simulant. Thetesting protocol involved exposing the materials to -143, 286, 571, and 3,670krad of gamma radiation and was followed by 7-, 14-, 28-, 180-day exposures tothe waste simulant at 18,50, and 60”C. Styrene Butadiene Rubber (SBR) samplessubjected to the same protocol were then evaluated by measuring seven materialproperties: specific gravity, dimensional changes, mass changes, hardness,compression set, vapor transport rates, and tensile properties. From the analyses,we determined that SBR has relatively good resistance to radiation, this simulant,and a combination of these factors. These results suggest that SBR is a relativelygood seal material to withstand aqueous mixed wastes having similar compositionto the one used in this study.
1 I
.---— —..—.,,, .!,.,.. ..t.,.. .. <..,.. . . .. . . . . . ., . . ...!.. .. . . . . . . . . .. . . . . . ~r.:.-.., ,;,:*: , ,:, 3X > -.* .,.-c .. - — ——‘ . . . .-M.. .,. ; ,
~- 1

ACKNOWLEDGMENTS
The support of our sponsor, the U.S. Department of Energy, OffIce of Transportation (EM-24), isgratefully appreciated. Specifically, the encouragement provided by Arnie Justice and MonaWilliams in the DOE National Transportation Program Office is acknowledged. The technicalassistance provided by Tatianna G. Dickens was responsible for the timely completion of thiswork.

CONTENTS
ACKNOWLEDGMENTS ...................................................................~~......................................... 2
INTRODUCTION ........................................................................................................................... 5
Seals ‘;............................................................................................................................................ 5Liners .......................................................................................................................................... 5
TEST DESCRIPTION .................................................................................................................... 8
Materials ..................................................................................................................................... 8%.rnulantPreparation ................................................................................................................... s
Sample Preparation ..................................................................................................................... 8Sample Quantities ................................................................................................................... 9
Sample Irradiation ..................................................................................................................... 10Sample Exposure to Stiulmt ............................................................................................... 10
Experimental Approach ............................................................................................................ 11
RESULTS ...........................~......................................................................................................... 14
Specific tiavi~ ........................................................................................................................ 14Dimensional Properties ............................................................................................................. 15Hardness Properties .................................................................................................................. 18Compression Set ....................................................................................................................... 20
23Vapor Transport Rates ..............................................................................................................1Tensile Properties ...................................................................................................................... 26
Tensile Streng@ ..... ............................................................................................................... 26Elongation at Break or Ultimate Elongation 79......................................................................... -Tensile Stress or 100% Modulus .......................................................................................... 31
DISCUSSION ............................................................................................................................... 35
CONCLUSIONS ........................................................................................................................... 39
REFERENCES ............................................................................................................................. 40
APPENDIX A SBR Material Momation .................................................................................... 42
APPENDIX B SBR Specific Gravity Data* ................................................................................. 43
APPENDH “C– SBR Mass Data .................................................................................................. 44
APPENDIX D – SBR Dimensional Data ..................................................................................... 45
APPENDIX E – SBR Hardness Data ........................................................................................... 47
APPENDIX F – SBR Compression Set Data ............................................................................... 48
APPENDIX G– SBRVapor Transport Rate Dati ....................................................................... 49
APPENDIX H – SBR Tensile Strength Data ................................................................................ 50
APPENDIX I – SBR Ultimate Elongation Data ........................................................................... 51
APPENDIX J – SBR Tensile Stress Data ..................................................................................... 52
DISTRIBUTION ........................................................................................................................... 53
3
-. — .—— —— .—.—

.
LIST OF FIGURES
Figure 1. Comprehensive seal testing strategy. ........................................................................ 13Figure 2. Specific gravity (S. G.) changes in SBR after exposure to -O, 143,286,571,
and 3,670 krad of gamma radiation followed by exposure for (a) 7 days, (b) 14 days,(c) 28 days, and (d) 180 days to the aqueous simulant waste at 18,50, and 60”C. ..............14
Figure 3. Mass changes in SBR after exposure to -O, 143,286,571, and 3,670 kradof g~a radiation followed by exposure for (a) 7 days, (b)14 days, (c) 28 days, and
(d)180 days to the aqueous simukmt waste at 18,50, and 60°C. .......................................... 16Figure 4. Volume (Vol.) changes in SBR after exposure to -O, 143,286,571, and
3,670 krad of gamma radiation followed by exposure for (a) 7 days, (b) 14 days,(c) 28 days, and (d) 180 days to the aqueous simukmt waste at 18,50, and 60”C. ..............17
Figure 50 Hardness (Hard.) changes in SBR after exposure to -O, 143,286,571, and3,670 krad of gamma radiation followed by exposure for (a) 7 days, (b) 14 days,(c) 28 days, and (d) 180 days to the aqueous simulant waste at 18,50, and 60”C. ..............19
Figure 6. Compression set fixture: (a) a partly assembled fixture with the 4.5 mmspacer bars and butyl rubber samples, and (b) an assembled fixture with SBR samples......21
Figure 7. Compression set (C. S.) changes in SBR after exposure to -143,286,571,and 3,670 Icradof gamma radiation followed by exposure for (a) 7 days, (b) 14 days,(c) 28 days, and (d) 180 days at 18,50, and 60”C. ............................................................... 22
Figure 8. Compression set (C. S.) changes in SBR after exposure to -O, 143,286,571,and 3,670 krad of gamma radiation followed by exposure for (a) 7 days, (b) 14 days,(c) 28 days, and (d) 180 days to the aqueous simulant waste at 18,50, and 60”C. ..............23
Figure 9. VTR cells. ................................................................................................................. 24Figure 10. VTR for SBR after exposure to -O, 143,286,571, and 3,670 krad of gamma
radiation followed by exposure for (a) 7 days,(b) 14 days, (c) 28 days, and(d) 180 days to the aqueous simukmt waste at 18,50, and 60°C .......................................... 25
Figure 11. Tensile strength (T. S.) changes in SBR after exposure to -143,286, 571, and3,670 krad of gamma radiation followed by exposure for (a) 7 days, (b) 14 days,(c) 28 days, and (d)180 days at 18,50, and 60”C. ................................................................ 27
Figure 12. Tensile strength (T. S.) changes in SBR after exposure to -O, 143,286,571,and 3,670 krad of gamma radiation followed by exposure for (a) 7 days, (b) 14 days,(c) 28 days, and (d)180 days to the aqueous simulant waste at 18,50, and 60”C. ...............28
Figure 13. Ultimate Elongation (U. EL.) changes in SBR after exposure to -143,286,571, and 3,670 krad of gamma radiation followed by exposure for (a) 7 days,(b) 14 days, (c)28 days, and (d) 180 days at 18,50, and 600C............................................. 30
Figure 14. Ultimate elongation (U. EL.) changes in SBR after exposure to -O, 143,286,571, and 3,670 krad of gamma radiation followed by exposure for (a) 7 days, (b) 14 days,(c) 28 days, and (d) 180 days to the aqueous simulant waste at 18,50, and 60”C. ..............31
Figure M. Tensile stress (T. ST.) changes in SBR after exposure to -143,286,571,and 3,670 krad of gamma radiation followed by exposure for (a) 7 days, (b) 14 days,(c) 28 days, and (d) 180 days at 18,50, and 60”C. ............................................................... 33
Figure 16. Tensile stress (T. ST.) changes in SBR after exposure to -O, 143,286,571,and 3,670 krad of gamma radiation followed by exposure for (a) 7 days, (b) 14 days,(c) 28 days, and (d) 180 days to the aqueous simulant waste at 18,50, and 60”C. ..............34
4

IINTRODUCTION
Hazardous and radioactive materials packaging is designed to facilitate the transport and storingof materials without posing a threat to the health or property of the general public. .U.S.regulations establish general design requirements for such packaging. While no regulationshave been written specifically for mixed waste packaging, regulations for the constituents ofmixed wastes, that is, hazardous and radioactive substances, have been codified by the U.S.Department of Transportation (U.S. DOT, 49 CFR 173) and the U.S. Nuclear RegulatoryCommission (NRC, 10 CFR 71). The packaging materials and contents must be chemicallycompatible. Furthermore, Type A [49 CFR 173.412 (g)] and Type B (1O CFR 71.43) packagingdesign requirements stipulate that there be no significant chemical, galvanic, or other reactionbetween the materials and contents of the package.
Based on the federal requirements, a Chemical Compatibility Testing Program was developed inthe Transportation Technology Department at Sandia National Laboratories/New Mexico(SNL/NM). The program attempts to assure any regulatory body that the issue of certainpackaging material compatibility towards hazardous and radioactive materials has beenaddressed. This program was detailed in a 1993 milestone reportl submitted to the Departmentof Energy (DOE). The results of this program were reported to the DOE in various unpublishedmilestone documents and in a number of externally published papers.2%
The milestone report Chemical Compatibility Test Plan and Procedure Report (CCTP&PR)describes a program to evaluate plastic transportation packaging components that maybe used intransporting mixed waste forms. Consistent with the methodology in the CCTP&P~ the firstphase of this experimental program has been com leted. This effort involved screening tenplastic materials in four simulant mixed waste types.Y All materials that include “rubber” in theirnames are used as seals; the others are used as liners. These plastics were as follows:
Seals
. butadiene-acrylonitrile copolymer rubber (Nitrile),● epichlorohydrin rubber (EPI),. isobutylene-isoprene copolymer rubber (13utyl),. ethylene-propylene rubber (EPDM),● fluorocarbon (FKM) rubber, and● styrene-butadiene rubber (SBR).
Liners
. cross-linked polyethylene (XLPE),
. high-density polyethylene (HDPE),
. fluorocarbon (Kel-F~,
. polytetralluoroethylene (Generically PTFE or Teflon@),
. polypropylene (PP).
I
I
5 I
.. --7-_-,.=>.,,.,., - .,..,,.,..........,,. . —v-. . . . . . . . . . . . . . . . ... -—. . ------ I

——
The selected simulant mixed wastes were
(1) an aqueous alkaline mixture of sodium nitrate and sodium nitrite;(2) a chlorinated hydrocarbon mixture;(3) a simulant liquid scintillation fluid; and(4) a mixture of ketones.
The fust phase of testing protocol involved exposing the materials to 286,000 rad (290 krad) ofgamma radiation followed by 14-day exposures to the waste types at 60°C. After radiation andchemical exposure, the seal materials or rubbers were tested using Yapor lransport Bate (VTR)measurements, while the liner materials were tested using specific gravity. For these tests,screening criteria of about 1 g/hr/mz for VTR and a specific gravity change of 10°/0were used.Materials that failed to meet these criteria for all four waste types were judged to have failed thescreening tests and were excluded in the next phase of this experimental program. Based on thiswork, it was concluded that while all seal materials passed exposure to the aqueous simulantmixed waste, EPDM and SBR had the lowest VTRS. In the chlorinated hydrocarbon simulantmixed waste, only FKM rubber passed the screening tests. This means that only FKM robberwould be selected for fi.uther testing ~in the chlorinated hydrocarbon sirnukmt. In both thesimulant scintillation fluid mixed waste and the ketone mixture simulant mixed waste, none ofthe seal materials met the screening criteria. For specific gravity testing of liner materials, thedata showed that while all materials passed the screening criteria in the aqueous sirnulant, Kel-F~, HDpE, and XLpE were found to offer the greatest resistance to the combination of radiationand chemicals.
Following the completion of these screening tests, the next phase of this program (i.e., thecomprehensive testing of liner materials in the aqueous simukmt mixed waste) began. Sincescreening tests showed that all liner materials met the screening criteria when exposed to theaqueous simulant mixed waste, the five liner materials were subjected to comprehensive testing.The five materials evaluated consisted of HDPE, XLPE, PP, Kel-FW, and Teflon”. The testingprotocol involved exposing the respective materials to approximately 143, 286, 571, and3,670 krad of gamma radiation followed by 7-, 14-, 28-, 180-day exposures, respectively, to thewaste simukmt at 18, 50, and 60°C. The radiation exposure values were calculated based ony-ray dose rate data available to us for the components of a pump submerged in a specific storagetank at Westinghouse Hanford Company. These data indicate a maximum y-ray dose rate in thermge of 75o to 850 R/hour. The maximum dose rate of 850 rad/hour was used in calculating thedose that container materials will receive from a ‘°Co source at Sandia National Laboratories.Using this dose rate, the four doses described above were calculated for 7-, 14-, 28-, 180-dayexposures, respectively. From the data analyses, the fluorocarbon Kel-Fm was identified ashaving the greatest chemical durability after exposure to gamma radiation followed by exposureto the Hanford tank simulant mixed waste. The most striking observation was the extremelypoor performance of PTFE when exposed to the higher radiation doses. Even at lower radiationexposures, PTFE exhibited significant losses in performance. These results were reported toDOE.*
, I
In this report, we present another part of the second-phase testing. Since all seal materials passedthe screening tests in the aqueous simulant mixed waste, all seal materials would be subjected to
6

comprehensive testing. While earlier studies investigated the response of EPDM and butylrubber, this second-phase study involved the comprehensive testing of SBR. The results ofcomprehensive testing of EPDM and butyl rubber had first been reported to the DOE. Asynopsis of the comprehensive test results for EPDM and butyl rubber was presented at theFourth Biennial Mixed Waste Symposiumg and at PATRAM ‘98.10 The complete results ofcomprehensive testing of EPDM and butyl rubber have also recently been published.l 1-12Thecomprehensive testing protocol involved exposing SBR to a matrix of four gamma radiationdoses (-143, 286, 571, and 3,670 krad), three temperatures (18, 50, and 600C), four exposuretimes (7, 14,28, and 180 days), and the aqueous Hdord tank simukmt. It should be mentionedthat, while some SBR samples were exposed to only the simukmt, other samples were onlyirradiated, and still others were irradiated and then exposed to the simulant to mimic the action ofmixed wastes. Following exposure to these conditions, the SBR samples were evaluated bymeasuring seven material properties. These properties included specific gravity, dimensionalchanges, mass changes, hardness, compression set, VT~ and tensile properties.
I
7 I
..—_, -..—.
, I
TEST DESCRIPTION
In this section, we describe the experimental aspects of the comprehensive phase of this testingprogram for elastomeric materials.
Materials
The selected material, SBR, is an elastomer having known chemical resistance to brake fluids,alcohols, and water. SBR is also known under its old name Buns S or GRS (Government RubberStyrene). The latter term refers to rubber originally made during World War II in U.S.Government-owned plants as a substitute for natural rubber. Appendix A provides additionalinformation on this material including its properties.
Simulant PreparationThe sirnulant mixed waste form used in this testing phase was an aqueous alkaline simukmtHanford tank waste. Three-liter (L) batches of the simulant were prepared by dissolving 536 g(6.3 moles) of sodium nitrate and 150 g (2.2 moles) of sodium nitrite in deionized water(1800 mL) using a 4-L beaker. After these salts had completely dissolved, 246 g (6.2 moles) ofsodium hydroxide were added, stirred, and slightly heated on a magnetic hotplate (Corning,Model PC-320). To this hot (-700C), stirred solution, 51 g (0.30 moles) cesium chloride and48 g (().29moles) stronti~ chloridewere added. Finally, 96 g (0.9 moles) of sodium carbonatedissolved in 800 mL of deionized water were added to the solution. This latter addition resultedin the formation of a copious amount of white precipitate; Based on its insolubility, it wasbelieved to be strontium carbonate. To the resulting mixture, another 400 mL of deionized waterwere added to bring the total volume of water used to 3 L. After cooling to near ambienttemperature, the stirred mixture was stored in amber glass bottles (Fisher Scientific, #03-327-6).All chemicals used in the preparation of the waste sirnulant were American Chemical Societyreagent grade chemicals. The above composition produced a mixture with the followingchemical concentrations:
2.1 Molar (M) sodium nitrate0.7 M sodium nitrite2.1 M sodium hydroxide0.3 M sodium carbonate0.1 M cesium chloride0.1 M strontium chloride
Sample Preparation
Standardized test methods were used to cut, condition, and test the materials. The geome~ ofthe material samples was specified by the test method. The samples were cut using an expulsionpress (Part # 22-16-00) and dies manufactured by Testing Machines Inc., Amityville, NY. Forexample, the rectangular (1 in. x 2 in. x 0.125 in., 2.5 cm x 5.0 cm x 0.318 cm) samples requiredfor specific gravity and hardness measurements were cut in the expulsion press fitted with anExpulsion Straight Edge Die (part #23-1 0-06). Rectangular samples (1 in. x 3 in. x 0.125 in.,
8

2.5 cm x 7.6 cm x 0.318 cm) required for dimensional and mass measurements were cut in theexpulsion press fitted with an Expulsion Straight Edge Die (Rut #23-10-07). Circular discs(0.5-in. diameter x 0.125 in. thick, 1.3 cm diameter x 0.318 cm thick) required for compressionset measurements were cut in the expulsion press fitted with a custom circular cutter from CCSInstruments, Akron, OH. Larger circular discs (2.69-in. diameter x 0.125 in. thick, 6.83 cmdiameter x 0.318 cm thick) required for VTR measurements were cut in the expulsion press fittedwith an expulsion die (part #23-00-00) specifically designed for American Society for Testingand Materials (ASTM) Standard Test Method D 81413 testing. Similarly, the Type C tensilesamples required for tensile testing were cut in the expulsion press fitted with an Expulsion Die(part # 23-14-08) specifically designed for use in the ASTM D 412-Method A.14
The use of a press and dies permitted the cutting of multiple samples having uniform dimensions.For identification of samples, an identification code was developed to uniquely indicate the testtype, sample number, and testing conditions. The black SBR samples were individually labeledusing indelible ink marking pens. As recommended by ASTM D 1349,15 the plastics wereconditioned at a standard temperature of 73.4°F (23“C) and relative humidity of 50°/0for at least24 hours prior to the testing process. This was done by storing the cut samples in a desiccatorfilled with magnesium nitrate hexahydrate (500 g) saturated with water. A humidityhemperaturesensor was used to monitor the conditions in’ the desiccator. Procedures for generating thisconstant relative humidity environment are described in ASTM E 104.16 During conditioning,the samples were stacked atop each other and separated from each other using -1/1 6-in.-thick(-0.16 cm) metal pins. The required samples for each test were bundled together using plasticcable ties by procedures described in a subsequent section.
Sample Quantifies
Some SBR samples were exposed to gamma radiation alone, some to the sinmkmt (chemicals)alone, or to a combination of radiation followed by exposure to the simulant. Since radiation wasexpected to have the greatest effect on the compression set and tensile properties of SBR, weprepared specific samples for radiation exposure alone. These samples were referred to as “RadOnly” samples. The purpose of exposing certain samples to only gamma radiation, while othersamples received exposure to both radiation and chemicals, was to differentiate the effects ofradiation alone from those when two environmental conditions (radiation and sirnukmt) wereapplied.
For “Rad Only” compression set measurements, 48 samples (six specimens per test) were cut forthe matrix of four radiation doses, four exposure times, and three exposure temperatures for atotal of 288 samples. Tensile property measurements (five specimens per test) for “Rad Only”samples required the preparation of 240 samples. A total of 528 samples was needed for thesetwo measurements. In view of the perceived effect of radiation on compression set and tensileproperty measurements, the material properties of SBR were measured prior to exposure to eitherradiation and temperature. The values obtained from these measurements represented the initialmaterial properties. These measurements required the preparation of 11 additional samples.
“Simulant Only” samples, referred to as O had samples (OK in the appendices) in subsequentdiscussions, were required for each of the seven measurements. For specific gravity and
9
... —..-,. .... m .,.,., ,,. ,. ,.-. - ... . . . v.. . . . . . . . . >> ,.. -,., .,- . .
hardness measurements, a total of 12 samples was required. Dimensional and massmeasurements (three per test) required the preparation of nine samples. For VTR measurements(three per test), nine samples were needed. Compression set measurements required 72 samples.Finally, tensile property measurements required 60 samples. Thus, a total of 162 samples wasrequired for all seven “Simulant Only” tests. These samples were exposed to the aqueoussimulant for the four time periods at the three temperatures.
We now turn to the samples required for exposure to the combination of radiation and chemicals.For specific gravity and hardness measurements, a total of 48 samples were cut out for thecombination of three temperatures, four radiation doses, and four time periods. For dimensionaland mass measurements, 36 samples were prepared. Compression set measurements involved288 samples. VTR measurements involved 36 samples, and tensile testing involved 240samples. Thus for all seven measurements, 648 samples were prepared for exposure to the threetemperatures and four radiation doses. For nondestructive tests such as specific gravity,dimensional, mass, hardness, and VTR measurements, the same samples were reused for theother exposure times, i.e., one sample set was used for 7, 14, 28, and 180-day exposures at eachtemperature and for each radiation dose. A total of 1349 SBR samples w“asused to perform thevarious measurements:
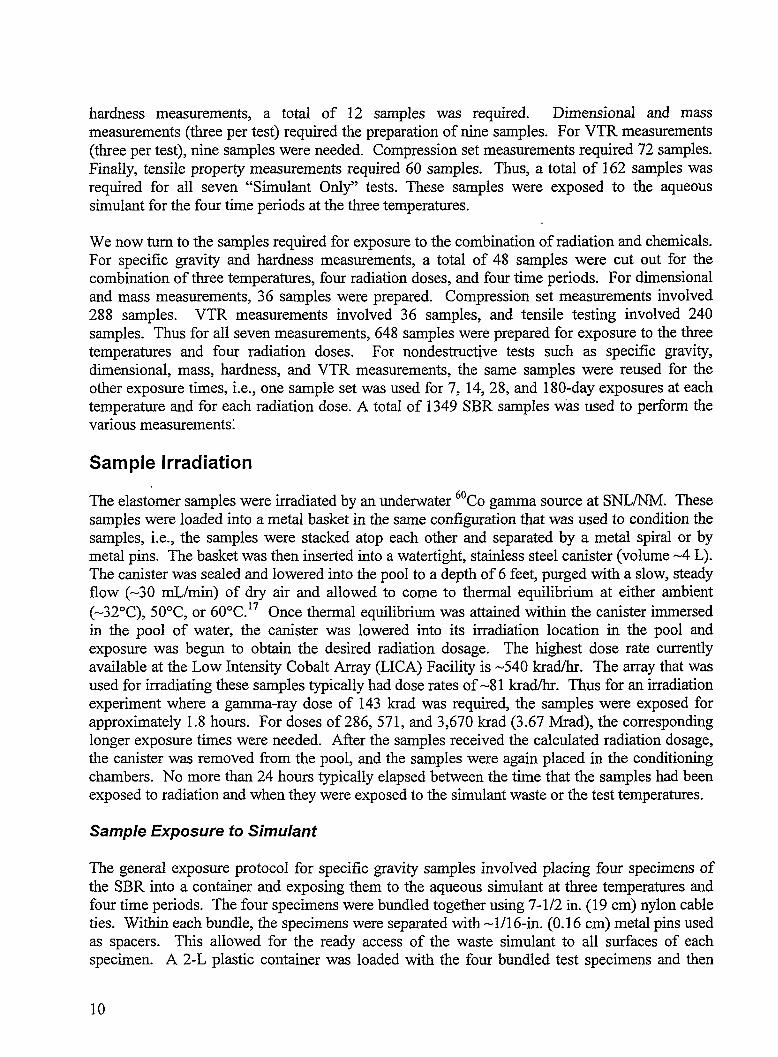
Sample Irradiation
The elastomer samples were irradiated by an underwater ‘°Co gamma source at SNL/NM. Thesesamples were loaded into a metal basket in the same configuration that was used to condition thesamples, i.e., the samples were stacked atop each other and separated by a metal spiral or bymetal pins. The basket was then inserted into a watertight, stainless steel canister (volume -4 L).The canister was sealed and lowered into the pool to a depth of 6 feet, purged with a slow, steadyflow (-30 mL/min) of dry air and allowed to come to thermal equilibrium at either ambient(-320C), 50°C, or 60°C.17 Once thermal equilibrium was attained within the canister immersedin the pool of water, the canister was lowered into its irradiation location in the pool andexposure was begun to obtain the desired radiation dosage. The highest dose rate currentlyavailable at the Low Intensity Cobalt Array (LICA) Facility is -540 krad/hr. The array that wasused for irradiating these samples typically had dose rates of-8 1 krad/hr. Thus for an irradiationexperiment where a gamma-ray dose of 143 krad was required, the samples were exposed forapproximately 1.8 hours. For doses of 286, 571, and 3,670 krad (3.67 Mrad), the correspondinglonger exposure times were needed. After the samples received the calculated radiation dosage,the canister was removed from the pool, and the samples were again placed in the conditioningchambers. No more than 24 hours typically elapsed between the time that the samples had beenexposed to radiation and when they were exposed to the simulant waste or the test temperatures.
Sample Exposure to Simulant
The general exposure protocol for specific gravity samples involved placing four specimens ofthe SBR into a container and exposing them to the aqueous simukmt at three temperatures andfour time periods. The four specimens were bundled together using 7-1/2 in. (19 cm) nylon cableties. Within each bundle, the specimens were separated with -1/1 6-in. (O.16 cm) metal pins usedas spacers. This allowed for the ready access of the waste simulant to all surfaces of eachspecimen. A 2-L plastic container was loaded with the four bundled test specimens and then
10

filled with 1,600 mL of the test solution. Care was taken to ensure that sufficient sirnukmt wastewas present to expose the entire surface area of all the samples. After adding the liquid simulantwaste, the plastic lid was attached to the jar and tightened. The jars were placed in respectiveenvironmental chambers maintained at 18, 50, and 600C. The jars were kept in theseenvironmental chambers for 7, 14, 28, and 180 days. Similar procedures were followed for eachof the other four testing procedures, i.e., dimensional testing, hardness testing, compression settests, and tensile tests. In the case of VTR measurements, each of three 1/2 pint (-236 mL)Mason Jars (Kerr Group, Inc., Los Angeles, CA, Part # 7061O-3) was filled with approximately200 mL of the test solution. The SBR discs were loosely attached to the jars with metal bands.The jars were placed in an upright configuration (SBR and band facing up) into the respectiveenvironmental chambers. The jars were held at the respective test temperatures for one hour toequilibrate. After sealing and weighing them, the jars were placed in the chambers again in aninverted position and held at the specific test temperature for the required time period.
Experimental Approach
The material properties that should be evaluated to assess the suitability of potential elastomericmaterials in mixed waste packaging designs are specific gravity changes, dimensional changes(involving mass and dirnensional.measurements), hardness, compression set, VT% and tensileproperty changes (tensile strength, tensile stress, and ultimate elongation). Since themeasurement of ~ these material properties was expected to be costly and time-consuming,screening tests with relatively severe exposure conditions such as high temperatures and highradiation levels were implemented to quickly reduce the number of possible materials for fullevaluation. It is generally recognized that polymeric materials are susceptible to degradationcaused by high temperature and high radiation doses. The results of these screening studies havebeen previously reported at several technical cotierences 2>6and in a SAND Report.7 From thescreening study, it was found that all of the selected seal materials had passed the screeningcriteria in the aqueous simukmt mixed waste. This then necessitated the testing of these sixmaterials by exposure to a matrix of four radiation doses, three temperatures, and four exposuretimes in the simulant waste. In view of the extensive number of materials and exposureconditions, this second phase of the program was referred to as the Comprehensive TestingPhase.
Because of budget constraints imposed on this program, testing was subdivided intocomprehensive testing on liner materials and seal materials. Additional fimding constraintsrequired still another subdivision of the testing activity that was evaluating individual elastomers.The order of testing for the individual elastomers was established by the degree of response in theaqueous simulant. In other words, the best elastomer was evaluated first while the worstelastomer was evaluated last. From the data given in a previously published report,7 the best-to-worst materials in the aqueous simulant were determined to be EPDM, butyl, SB~ Nitrile,Viton@,and EPI rubber. Accordingly, the first material evaluated was EPDM rubber,ll followedby butyl rubber.12 The next elastomer to be evaluated was SBR.
The evaluation parameters used in this comprehensive testing phase consisted of measuring thespecific gravity, dimensions, mass, hardness, compression set, VT~ and tensile properties of theseal materials. Tensile properties for elastomers included tensile strength, ultimate elongation,and tensile stress. These parameters were evaluated using standardized test methods such as
11
.,. —.-r, ,. ..,.,.,., . . . . .. . . . . .

, I
those developed by the ASTM. For specific gravity measurements, ASTM D 79218was used. Inmeasuring dimensions and mass, ASTM D 54319was used. For hardness measurements, ASTMD 224020 was used. In evaluating compression set, ASTM D 395- Method B21 was used.However, in using ASTM D 395, six samples (3 sets of 2 samples) of 0.125-in. thickness(3.17 mm) each were held at the three temperatures with a spacer bar thickness of 4.5 mm. ForVTR measurements, ASTM D 814 was used. Finally, for evaluating tensile properties, ASTMD412 - Method A was used.
Before describing the results of this study, we will discuss the comprehensive testing strategyused for SBR. This strategy is shown in a flow diagram in Figure 1. The rubber was subjected tofour different protocols (Paths A-D). To determine the intrinsic properties of the materials,“Baseline” property measurements (Path A) were made in each of the seven tests. Theseproperties were measured at ambient laborato~ conditions. In order to differentiate the effectson the materials by radiation and chemicals, one series of samples was exposed to the simukmtalone (path B), while the other series of samples was exposed to both radiation and the simulant(Path C). The first series of these samples is referred to as “Simulant Only” in the flow diagram,while the latter was referred to as “Radiation and Simulant”. It should be noted that both seriesof samples were exposed for $he four time periods (7, 14, 28, and 180 days) at three differenttemperatures (18, 50, and 600C). For two testing protocols, tensile testing (Tensile) andcompression set (Set), where the effects of radiation and temperature alone could have significantimpact on these properties, a series of samples described as “Radiation Only” is shown in theflow diagram (Path D). These samples were irradiated at three temperatures previously givenand then exposed for the four previously given time periods at the three respective temperatures.What may not appear obvious from the flow diagram is the large number of samples being testedin this comprehensive testing phase of the program. A total of 2,126 measurements on 1,349samples was analyzed (Appendices B-J).
12
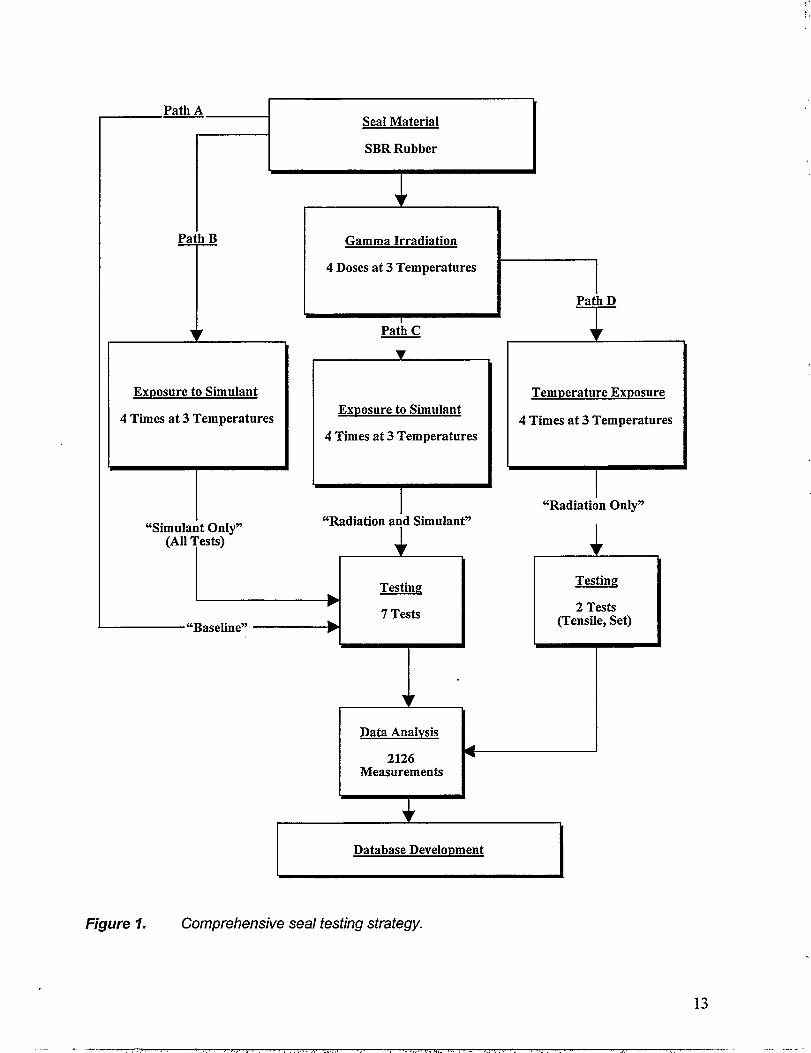
,.?
Path ASeal Material
SBR Rubber
Gamma Irradiation
4 Doses at 3 Temperatures
Path D
Path C
w
Exposure to Simulant
4 Times at 3 Temperatures
Temperature Exposure
4 Times at 3 TemperaturesExposure to Simulant
4 Times at 3 Temperatures
“Radiation Only”“Radiation arid Simulant”“Simulant Only”
(AU Tests)
I
-A I!2&!!g2 Tests
(Tensile, Set).
7 Tests“Baseline” P
Ea-V
Database Development
Figure 1. Comprehensive seal testing strategy.
13
.- ——. .. ,., ,.. . ---- . .. . . .

——. .—.. .. ———..
RESULTS
Specific Gravity
Specific gravity measurements, also known as relative density measurements, measure thedensities of materials under different conditions. A decrease in density of the material canindicate leaching or swelling, and swelling can lead to increases in permeability. Suchindications of increases in permeability in the material will also be confhned by VTRmeasurements. Increases in density are caused by absorption of the test liquid, which leads toincreases in mass of the material and can also lead to higher permeability of the test liquid.
In Figure 2, the effects of exposure time, gamma radiation dose, and exposure temperature of theaqueous simukmt on SBR are shown.
-—
&c-(%)
TCHPEUIUM
(b)
1. G. cnAllGc
m)
-.(5 ‘“ ,. ,8C
o ,43 **6 ~,,3AM
(a)
%G. CIUMGS
(w
TEM?lUTUEI
L4DIA11OM Mss (-)
(c)
s. G. CI!ANCEm
WIA11ON Case (k”d)
(d)
llMW.U71JU
,
Figure 2. Specific gravity (S. G.) changes in SBR after exposure to -O, 743, 286, 571, and3,670 krad of gamma radiation fo/lowed by exposure for (a) 7 days, (b) 14 days,(c) 28 days, and (d) 180 days to the aqueous simulant waste at 18, 50, and60 ‘C.
14

These three-dimensional bar graphs provide a plot of radiation dose, exposure temperature, andthe average percent specific gravity change in the x, y, z directions, respectively. Where theradiation dose is indicated as O krad, the samples received no gamma radiation and were onlyexposed to the simulant (i.e., these samples are the “Simukmt Only samples discussed earlier). Itshould be noted that the scale for these specific changes is rather small, e.g., from Oto 10/0,andeither positive or negative. In Figure 2 and all subsequent figures, negative changes can berecognized by the dark bar tops in the x-y plane. These bars project into the negative portion ofthe graph. The sign of the specific gravity indicates whether specific gravity has increased ordecreased when compared to the pristine material, i.e., the specific gravity of SBR at ambientconditions. Therefore, changes in the magnitude and the sign of specific gravity values indicatechanges in this property. The greater the absolute values of the changes, the more the materialsare affected by the specific set of environmental conditions. Since properly engineeredpackaging components are not expected to be affected by contents of the package, such asaqueous mixed wastes, elastomers exhibiting the smallest changes in specific gravity should beselected as packaging components. From an overall perspective, the data in Figure 2 show thattemperature of the sirnulant, the radiation dose, and the exposure time have some slight effectson the specific gravity of SBR. With increased temperatures, increased radiation exposure, andlonger exposure time, increased specific gravity changes were observed. Radiation exposurealone appears not to exhibit a significant effect on the specific gravity SBR. However, sincethese changes are only at the 1’%levels, these results are consistent with the known chemicalresistance of this elastomer and demonstrates that SBR is a suitable elastomer for use under theseconditions if specific gravity is the determiningg package design criterion. While the precisespecific gravity values are not obvious from the data in the previous figure, their actual valuescan be found in Appendix B of this report.
In the following section, we will present the results of the effects of only the simukmt waste anda combination of radiation and the simulant on the dimensional properties of SBR.
Dimensional Properties
Similar to specific gravity measurements, or density changes, the dimensional propertymeasurements can provide important information about the effects of different environmentalconditions on materials. Specifically, the swelling of the material or leaching of components ofthe material may be manifested by increases or decreases in the dimensions of the material. Thedimensional properties measured and reported in this section include changes in length, width,and thickness of the material. Since the standard test method (ASTM D 543) used to measuredimensional properties includes the determination of mass as part of the test, this property wasalso measured. Dimensional changes are described by evaluating the product of.these changes,i.e., volume (length .x width x thickness). The technical justification for using this approach isthat, while length and width changes have generally been much smaller than thickness changes,the product of these changes encompasses individual components into one general dimensionalproperty, the volume of the materials. The effect of the different environmental conditions onsample mass changes will be presented first.
,,I
15 I

,
To measure the effect of exposure time and exposure temperature of the aqueous simulant onSBR, the mass of the samples was measured before and after exposure to only the surrogatewaste. The results are given in Figure 3 (a) - (d) above in the Okrad data field. Similar to datashown in the previous section, the scale for average 0/0mass change is very small, e.g., from Oto3%. The sign of the mass changes indicates whether the mass of the material has increased ordecreased when compared to the pristine material, i.e., the material’s mass at ambient conditions.Therefore, changes in the magnitude and the sign (positive or negative) of ‘%0 mass change valuescan vary in these measurements. The greater the absolute values of these changes, the more thematerial is tiected by this set of environmental conditions. Since properly engineered packagingcomponents are not expected to be effected by contents of the package, i.e., the mixed wastes,materials exhibiting the smallest changes in mass should be selected as packaging components.From an overall perspective, the data in Figure 3 show that temperature of the simulant andexposure time have a slight effect on the changes in mass of the material. For both of theseenvironmental conditions, a slight but perceptible decrease in mass was observed. After 180-dayexposures, mass losses in excess of 10/0were observed at 50 and 600C. At higher temperatures,th~ greater mass losses were observed. While the exact mass values are not obvious fromdata in the previous figure, their precise values can be found in Appendix C of this report.
IulsCnNla w Cluncz(%) (%)
7tM,tuT”u ?U4PIEANU
WIATWM DOSt (k”4 rtmAmON w (M)
(a) (b)
14As cluNGE
w Cluncl (%)
(%)
Tn’l?i@ANBl
Tm?[unlui
uAOIAmON DOx (H)EADIATION DOSE (bad)
(c) (d)
the
Figure 3. Mass changes in SBR after exposure to -O, 143, 286, 571, and 3,670 krad ofgamma radiation followed by exposure for (a) 7 days, (b) 14 days, (c) 28 days,and (d) 180 days to the aqueous simulant waste at 18, 50, and 60 C.
16
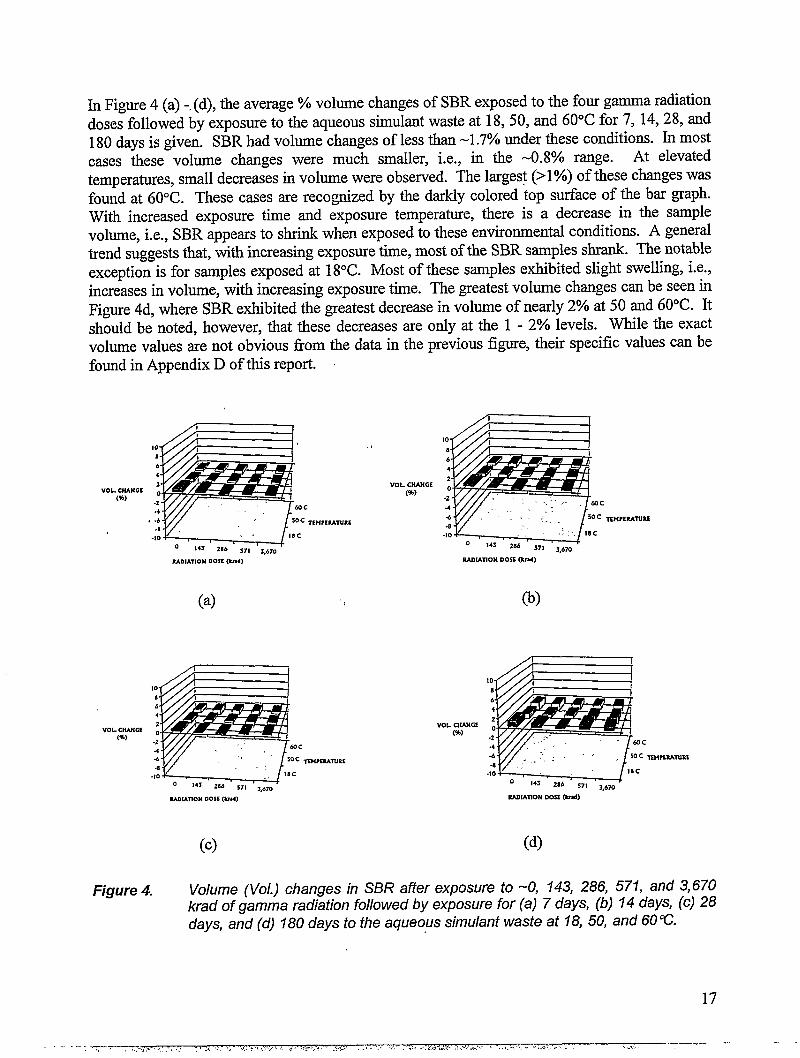
In Figure 4 (a) -.(d), the average YOvolume changes of SBR exposed to the four gamma radiationdoses followed by exposure to the aqueous sinmlant waste at 18,50, and 600C for 7, 14,28, and180 days is given. SBR had volume changes of less than-1.7% under these conditions. Inmostcases these volume changes were much smaller, i.e., in the -0.8°/0 range. At elevated
temperatures, small decreases in volume were observed. The largest (>1Yo)of these changes wasfound at 600C. These cases are recognized by the darkly colored top surface of the bar graph.With increased exposure time and exposure temperature, there is a decrease in the samplevolume, i.e., SBR appears to shrink when exposed to these environmental conditions. A generaltrend suggests that, with increasing exposure time, most of the SBR samples shrank. The notableexception is for samples exposed at 180C. Most of these samples exhibited slight swelling, i.e.,increases in volume, with increasing exposure time. The greatest volume changes can be seen inFigure 4d, where SBR exhibited the greatest decrease in volume of nearly 2% at 50 and 600C. Itshould be noted. however, that these decreases are only at the 1 - 2’%0levels. While the exactvolume values are not obvious fromfound in Appendix D of this report.
the data in the previous figure, their specific values can be
I .,
VOL. CHAMGCvol. CNANGE
(%)(%)
73M?trx3Lm3T3M?EP.ANB.I
EADINION DOSE (kd) wm,4m0t6 Don (bd)
(a) (b)
vol.. CNANGC(%)
I
1334Pm.Al’uRE
1
VOL CHANCE(%)
&c
-K&L-M~=””571 3,670
EAmAno)l 00s1 (krM) WDIATlON DOS (-61
(c) (d)
Figure 4. Volume (Vol.) changes. in SBR after exposure to -O, 143, 286, 571, and 3,670krad of gamma radiation followed by exposure for(a) 7 days, (b) 74 days, (c) 28days, and (d) 180 days to the aqueous simulant waste at 18, 50, and 60 C.
17
. ...—.,.- ~-., ,. ‘. , ... . .<,.,.,, ...,.-.,>..,7,,..>,,f - ..?,.. .,.<., .< ,, -.. .,.:..-.i...~-c.,:.“------. ........- .J.JJ,.-“,- —.. .—..... . .. .-...,,,

Hardness Properties
The measurement of changes in the hardness of materials can provide important clues about theeffects of environmental conditions on the material. If the hardness of the material is decreasing,swelling of the material may have occurred. Alternatively, the polymeric constituents of theelastomer may have substantially degraded. Conversely, if the hardness of the material isincreasing, additional cross-linking of the polymer may have resulted. The results of thesemeasurements, in addition to providing important data, may complement other measurementssuch as specific gravity, dimensional, and tensile properties.
The measurement of hardness involves the use of a standard instrument manufactured by ShoreInstrument Company lmown as a Shore durometer. The degree of hardness that the plasticmaterial exhibits will dictate the type of durometer used. For elastomers, which in relative termstend to be rather soft, a Type A durometer is used. Similar to the approach used for thepreviously described property measurements, the initial hardness values (-63 Shore A hardnesspoints) were determined for pristine samples, i.e., samples not exposed to anything. Using theseinitial hardness values, 0/0hardness changes were measured for samples that were exposed to thesimulant alone (see Okrad data field in Fig. 5 (a) - (d) at the three temperatures and four exposuretimes) and to a combination of radiation and simulant at these temperatures and exposure times.We will now present the results of these measurements.
To measure the effect of exposure time and exposure temperature of the aqueous simulant onSBR, hardness testing was performed on the materials exposed to the surrogate waste alone at thethree temperatures and four time periods. The results of these measurements are given inFigure 5 (a) - (d) in the Okrad data field. The sign of the hardness changes indicates whether thehardness of the material has increased or decreased when compared to the pristine material.Decreasing hardness indicates that the material has become softer as a consequence of theexposure conditions. As was previously mentioned, properly engineered plastic packagingcomponents are not expected to be affected by the packaging contents. An elastomer exhibitingthe smallest changes in hardness should be considered a good candidate as a packagingcomponent.
/ I
18

HARD. cNANGE(%)
w. CHANGE(%)
!
-lo-!’ , : . t8C
o I 43 286 571 3,~7!3
RAoIATION MSE (kmi)
NAUO. CNANGE(%)
1
TE14PERANRE
.--10 ,,. ., i8C
0 143 206 571 3,6m
RADIATION 00SE (kd)
(a) (b)
c
-K++it~-p’”””571 7 /.7n
NARD. alANGE
(%)
1
TEMPE9ANRE
.,---RAOIATION DOSE (Iuad)
RADIATIoN DOSZ (krds
(c) (d)
Figure 5. Hardness (Hard.) changes in SBR after exposure to -O, 143, 286, 571, and3,670 krad of gamma radiation followed by exposure for (a) 7 days, (b) f4 days,(c) 28 days, and (d) 180 days to the aqueous simulant waste at 18, 50, and60 C
An inspection of the results in Figures 5 (a) - (d) reveals that, in general, the hardness of SBRessentially remained unchanged for exposures up to 28 days. Under these conditions, some ofthe samples became harder, and other samples exhibited decreases in hardness, i.e., becamesomewhat softer. The notable exceptions were samples exposed at 180C. These samplesconsistently became slightly harder with increasing radiation doses. When SBR samples wereexposed for 180 days (Figure 5d), all the samples which received a combination of radiation andchemical exposure exhibited a 2 to 3°/0 increase in hardness. The hardness changes were notstrongly a.ilected by radiation dose or temperature. The largest hardness change was observed insamples that received radiation doses of571 krad and 180 day exposures to the 600C simukmt.These results suggest that prolonged exposure to this oxidizing simulant results in somehardening of SBR. Since decreases in volume under these conditions (Figure 4) were observed,this hardening appears to be caused by contraction of the material. An alternative explanation forthe increasing hardness is the loss of the plasticizer component in the rubber. Since decreases in
19
. .. . .— —— ---
mass were also observed under these conditions (Figure 3d), the increasing hardness couldpossibly also be explained by losses in elasticity of the material. While the actual hardnessvalues are not obvious from the data in the previous figure, their precise values can be found inAppendix E of this report.
Compression Set
Compression set tests are used to measure the ability of elastomers to retain elastic propertiesafter prolonged action of compressive stresses. Set is usually determined in air and reported asthe percent of deflection by which the elastomer fails to recover after a fixed time and under aspecified compression and temperature. In these experiments, the time period of compressionwas 22 hours at 18, 50, and 600C. A complete return by the elastomer to its original thickness,after the compressive stresses are removed, results in a calculated set of OYO.For a situationwhere the elastomer does not return to its original thickness but remains at the thickness undercompression (in this case a 4.5 mm deflection), a set of 100% is calculated. These values,therefore, represent a percentage of the original deflection. The practical aspect of such asituation is that the elastomer just contacts the matting stiace of the device that contains theelastomer. In the case of O-rings seals, this situation could lead to seal ftilure since theelastomeric seal makes minimum contact with the sealing surface. It should be obvious from theprevious discussions that materials having a low set value are desirable. To measure set, we haveused the standardized test method, ASTM D 395. Using this method, the SBR samples wereheld in the compression set device at three temperatures. Figure 6 shows an example of theexperimental conf@ration used for the compression set tests.
In order to understand effects of radiation alone on set values, a portion of the SBR samples wereexposed to only the four radiation doses (i.e., no chemical exposure), the three temperatures, andthe four exposure times. Similarly, the effects of the simukmt alone were studied under theseconditions. Finally, samples exposed to a combination of radiation and simukmt were studied.We will now proceed to discuss the results of these different measurements. It is important tomention that the results shown in Figures 7 and 8 plot changes in compression set versusradiation dose and temperature. These changes represent the difference in the set observed underthe specific environmental conditions and the set of pristine SBR samples. Because set valuesare expressed in percent, the change in set is the difference of these values in percent.
20

..-,,..
(a)
Figure 6. Compression set fixture: (a) a
,-::.,-...
...“, - . .,,,, ->--’ “, ,, ...”, ..
... . . . . ., .,, .
(b)
partly assembled fixture with the 4.5 mm spacer
I
bars and butyl rubber samples, and (b) an assembled fixture with SBR samples.
In Figure 7 (a) - (d), the set changes for SBR samples exposed to four gamma ray doses followedby 7-, 14-,28-, and 180-day exposures at the three temperatures are provided. The data in Figure7 represents a situation where SBR has only been exposed to gamma radiation. The importantpoint to keep in mind for these measurements is that the set was measured after being held for 22hours at the three temperatures. Another way to express this important experimental detail is thatonly the samples themselves saw the different radiation doses, exposure times, and exposuretemperature. The compression set measurements were performed at one time and threetemperatures. These compression set measurements on SBR were thus different fi-om themeasurements on EPDM and butyl rubber where measurements were performed at one time andone temperature (ambient).
The results show that while several samples exhibited an increase of the set in the range of-O to 0.2%, most samples had decreases of the set in the range of -O to 3%. Decreases forchanges in the set indicate that the samples after exposure to these environmental conditions hada smaller set than the unexposed samples, i.e., these samples were more elastic than theunexposed samples. Most decreases in set were observed in samples with larger gammaradiation dose exposures a.dor longer exposure times. However, systematic trends in samplesexposed to increasing radiation doses, exposure time, and exposure temperatures are not verypronounced. These results suggest that these set changes are not very large and possibly withinthe experimental variability of the test results. However, an overall decrease in set was detectedwith increasingly severe environmental conditions of dose, time, and temperature.
I
21
->--....,, -T-, ,. ... . ... .<,., ,, -..,.,,4=:........ . , ~- s..., , .... ., , ., .. .,,,,....,.4-A<.,:..,.,..,-.. -,......... .~..,..-.- .,,,

. .. .
C.s
c. s.
CHAMGE(%)
CHANGE(%)
1
c
I’EMPEEANRE
RADIATION DOSE wad)
(a)
r
c
lwiPmANKE
(c)
c. s. chum(%)
c. s. CHANGE(%)
1
c
7EM?W.ATU?S
RADIATION DOSE (kti)
(b)
c
‘KHPEDATUU
(d)
Figure 7. Compression set (C. S.) changes in SBF? after exposure to -143, 286, 57~, and3,670 krad of gamma radiation followed by exposure for(a) 7 days, (b) 14 days,
(c) 28 days, and (d) 180 days at 18, 50, and 60’C.
Fibme 8 (a) - (d) shows the set changes for SBR samples exposed to a combination of the fourgamma ray doses followed by 7-, 14-,28-, and 180-day exposures to the aqueous simukmt at thethree temperatures. Similar to the samples exposed to gamma radiation alone, the set changesexhibited by samples exposed to a combination of radiation and the aqueous simulant wereminimal, i.e., in the range of -2 to 2°/0. The set in SBR samples exposed to only the simukmt(O krad data field) generally also decreased with increased temperature and increased exposuretime. The combination of radiation followed by exposure to the simulant has a beneficial effectby resulting in lower compression sets, i.e., the samples became more elastic. The greatestretention of deformation was noted in samples exposed to radiation and the simulant for 180 daysat 18”C.
22

I
c. s. cluslGrc, s. CHANGE
(%)(%)
‘K14PE?ATUBJ-SW?CSATUU.
?.AOIAllOM DOSE(kzti)WIA7SON DOSE (M)
(a)
I
c s. CHANGE(%)
?EWEktnlsz
u.ummoti DOx (w)
(c)
1
c
TEn?lcxllms
(d)
Figure 8. Compression set (C. S.) changes in SBR after exposure to -O, 143, 286, 571,and 3,670 krad of gamma radiation followed by exposure for (a) 7 days, (b) 14days, (c) 28 days, and (d) 180 days to the aqueous simulant waste at 18, 50,and 60 C.
To summarize, SBR is not al%ectedgreatly by radiation, the sirnulant, or a combination of thesetwo environmental conditions. While the precise set values are not obvious from the data in theprevious figure, the specific values can be found in Appendix F of this report.
Vapor Transport Rates
VTR measurements provide a measure of the permeability of various chemical agents inelastomers. The rate of transmission of a liquid through an elastomer that acts as a barrier isimportant in elastomer seal performance. This transmission is referred to as vapor transmissionsince the liquid diffuses through the elastomer in a molecular sense and escapes into thesurrounding atmosphere in vapor form. This type of testing provides a steady-state measure ofthe rate of vapor and liquid transmission through relatively thin elastomers. While the calculatedvalues of VTR cannot be directly converted to traditional permeability values, the VTR valuescan be used to provide an indication of permeability.
23
--..—

The VTR measurements were performed at three temperatures and four exposure times. In theseexperiments, one set of SBR samples was exposed to only the simukmt aqueous waste, while theremaining samples were exposed to a combination of radiation and the simukmt. To measureVTR, we have used the standardized test method, ASTM D 814. Using this method, the SBRsamples were sealed to a ground-glass surface using a metal screw band. It should be noted thatVTR experiments by this method with SBR samples exposed to ~ gamma radiation are notpossible since the testing method requires the presence of a chemical agent. Figure 9 shows agroup of cells used for VTR measurements.
For VTR measurements, it is not possible to describe these data in terms of VTR changes. Thereason for this inability to determine VTR change is that it is not possible to determine .VTR onpristine SBR. The pristine property value of the material was used to calculate changes in thatproperty. For example, in the previous section the compression set value of SBR that had notbeen exposed to radiation, the sirnukmt, or the combination of radiation and simukmt was used todefine the compression set of pristine SBR, i.e., its initial value. In VTR measurements,however, a similar VTR value for pristine SBR is not possible since its determination willrequire exposure to a simukmt. However, one could show VTR changes between SBR sarnplesexposed to only the simukmt and samples exposed to the combination of radiation and simukmt.Because all the previously described measurements included data for SBR samples exposed tothe sirnulant alone, we retained this data format here. We will provide the VTR values, in@hr/mz, rather than changes in VTR.
Figure 9. VTR cells.
24

Figure 10 (a) - (d) shows VTR for SBR samples exposed to a combination of the four gamma raydoses followed by 7-, 14-, 28-, and 180-day exposures to the aqueous simulant at the threetemperatures.
v-m
W/mZ)
Tu4PmAmJRf
143 286 57! ~,b,~ ‘
rmmON Mm (w)
(a)
8AmAn0N DOSE (kd)
(c)
VrR
(21bt/m2)
v-m(rmr/92)
8ADU7’IOM mm (knd)
zAMAnON m5E (w)
(d)
Figure 10. VTR for SBR after exposure to -O, 143, 286, 571, and 3,670 krad of gammaradiation followed by exposure for (a) 7 days, (b) 14 days, (c) 28 days, and (d)
f80 days to the aqueous simu/ant waste at f8, 50, and 60’C.
The data shown for the Okrad dose represents samples exposed only to the simulant for the fourexposure times and temperatures. All samples exhibited VTR values below 1 gh.dmz. In fact,most of the VTRS for these samples are below 0.3 @.r/mz. The SBR samples that had only beenexposed to the simulant generally exhibited higher VTR at all temperatures than did samplesexposed to the radiation. These effects are easily seen for the 600C data points inFigure 10 a - d. It can also be seen that the VTR for SBR samples generally increased withincreased temperature and decreased with increasing exposure time. The effects of increasingradiation dose on VTR are less clear. At both 18 and 60”C, minimum VTR is observed for SBR
samples that received gamma-ray doses between 286 and 571 krad. While the specific VTRvalues are not obvious from the data in the figure, their precise values can be found in AppendixG of this report.
25
..—y ,,:,,,,,, ...,,, ,... ....>+,,.,,.,,,. ,,, ,,,., .,..,., .,.,.* . ......r..y.... ... .........,,-. . ....... .. —.. -,,

Tensile Properties
Tensile properties, also known as mechanical properties, are the properties associated with amaterial’s response to mechanical forces. A quantity more usefid than force is the engineeringstress (a), which is the ratio of the magnitude of a force to the magnitude of the originallyundeformed area of the body upon which it is acting. True stress is therefore defined as O= F/A,where A is the cross-sectional area at the time that force (1?)is ap lied. The most common
Yengineering units of stress are pounds’ of force per square inch (lb/in. or psi). These units maybe converted to the corresponding S1 unit, the PascaI (Newton/meter) by mukiplying the psivalue by 6895. However, we are always calculating the 0/0 changes in properties, and the unitsare irrelevant. The actual values in Mega Pascal (MPa) are reported in Appendix H.
Another important tensile property to consider is strain. A stressed material undergoesdeformation or strain (~), defined quantitatively as either the incremental deformation divided bythe initial dimension or the percent of the original dimension. Since strain is a dimensionlessquantity, the precise choice of units is not important. In this study, a l-inch gage length wasused, and the units of strain are therefore inckdinch. Two fundamentally different types of strainare observed. The fust type is elastic strain or elastic deformation, where strain is recoverableupon the release of stress. In other words, when a causal stress is removed, the resultant strainvanishes, and the original dimensions of the object are recovered. A practical example of thistype of strain is the stretching of a rubber band. Since SBR is a specific type of rubber, thismaterial exhibits this type of strain. The second type of strain is plastic strain. This occurs whenstress is increased, and a value is eventually reached where permanent deformation of the objecthas occurred. An example of this property is the bending of wire with the fingers. Note that“plastic strain” does not necessarily mean that the deformed material is a plastic.
For many plastic materials that might be suitable as packaging components such as seals andliners, high strengths and high strains are expected horn the material. The strains exhibitedshould also be elastic in nature. In certain instances, however, other specific tensile propertiesare desirable, i.e., high strength and low strain. It was the purpose of this study to determine thetensile properties of the pristine material and then determine the effects of radiation alone, thesimulant alone, and a combination of these environmental conditions on the tensile properties ofSBR.
Tensile Strength
The tensile or ultimate strength of a material is calculated by dividing the observed maximumload placed on the material during the tensile test by the original cross-sectional area of thematerial. While many polymeric materials exhibit stress-strain curves having an initialmaximum followed by lower stresses, this is not the case for elastomers. The maximum loadvalue in elastomers is typically observed at the break point of the material.
The measurement of tensile properties involves the use of tensile testing equipment that canapply controlled tensile loads to test specimens. The equipment is capable of varying the speedof load (stress) and accurately measuring the forces (strains) and elongation applied to thespecimens. In this study, an Applied Test System, Inc. Universal Testing Machine, Series 1400,was used. This computer-controlled testing equipment was able to perform the required testswith user-developed testing methods. These methods prescribe the strain rates and breakingpoints along with many other experimentally important variables. The selection of these
26

experimental variables was based on the standard test method ASTM D 412. For thedetermination of the tensile strength of elastomers, the use of a high elongation extensometer andhigh rates of grip separation (50 mmhnin, 20 in.hnin) were used. The acquired data wereanalyzed with software developed by this mantiacturer. The software calculates n~eroustensile properties. The data discussed in this subsection require a determination of tensilestrength. This can be calculated as described previously, using peak loads and cross-sectionalarea. In addition, the software also calculates ultimate elongation and tensile stress values. Inthis subsection, tensile strength values were of interest.
Since an understanding of the effect of mixed waste environments is not possible withoutunderstanding the effects of radiation and simukmt alone, the latter experimental conditions werealso investigated. The results of tensile strength changes in the materials exposed to gammaradiation at the three temperatures and four exposure times are provided in Figure 11. InFigure 11 (a) - (d), the average ‘%0tensile strength changes of SBR exposed to gamma radiationalone at 18, 50, and 600C for 7, 14, 28, and 180 days is shown. Similar to previous propertymeasurements, ~ese ‘A changes were determined by measuring the change in tensile strengthfrom that of the pristine material (12.6 MPa). When the change in tensile strength (expressed asa percentage ) was a positive value, the material tensile strength had increased under the specificexposure conditions. Negative values indicate decreases in tensile strength.
T. S. CIIAIKE
(%) c
TnlPEBAluRE
RADIATION DOSE (M)
(a)
T. S. CHNUZ
(%)
T. S.- 7. s. alucz
(%) c(s) c
lm?mANElZIH?lIATUU
wunon DOSE(id)Wunoll Wsz (k”a
(c) (d)
Figure 11. Tensile strength (T. S.) changes in SBR after exposure to -143, 286, 571, and3,670 krad of gamma radiation followed by exposure for(a) 7 days, (b) 14 days,
(c) 28 days, and (d)f80 days at 18, 50, and 60’C.
27
-— . .. — —.. .-—

From a general perspective, Figure 11 shows no significant effect on the tensile strength for mostradiation doses, exposure times, and exposure temperatures tested. A notable exception is SBRsamples exposed to 571 and 3,670 krad at higher temperatures and longer exposure times. Underthese conditions, the changes in tensile strength for these samples were in the range of 10’XOto20%. However, for most of the other exposure conditions, many of these changes appear to be inthe range off 1- 7’XO. At the longest exposure time (180 days, 500C) and the highest radiationdose, the tensile strength of SBR appears to have decreased considerably (-20%).
Figure 12 shows the average values of percentage of tensile strength changes of SBR exposed tothe four gamma radiation doses followed by exposure to the aqueous simulant waste at 18, 50,and 600C for 7, 14, 28, and 180 days. SBR samples that were only exposed to the simulant waste(O krad data field) only showed a decrease in tensile strength at the higher temperatures andlongest exposure time (180 day). For SBR samples exposed to both radiation and the simulant,the general trend is that neither of these environmental factors have a significant effect on thetensile strength of the material.
T. 5. QUXGE
(%]
T. 5. CHANGE
(%)
T. s. CHANGE
(%)
TEMPEM7UEI IU4?[EANEI
aAmAnON nom (knd) uADIAnON 00s1 (w)
(a) (b)
‘KM? fmATuRE
‘r. s. CU4NGE(!4)
IEMPEWNM
EAmAnoll casE (knd) mm4n0N mm (krd)
(c) (d)
Figure 12. Tensile strength (T. S.) changes in SBR after exposure to -O, 143, 286, 57f, and3,670 krad of gamma radiation followed by exposure for (a) 7 days, (b) 14 days,
(c) 28 days, and (d)180 days to the aqueous simulant waste at 18, 50, and 60’C.
28

With increasing radiation dose, the tensile strength of SBR did not increase or decrease by morethan 12%. Only at the highest radiation dose (3,670 krad) did the tensile strength decrease to11VOwith increasing exposure time and increasing temperature. From these results, it appearsthat elevated temperatures and exposure times of more than 28 days also have slight effects onthe tensile strength of SBR. After 180 days of exposure, most of the SBR samples onlydecreased in the range of 1- 7%. These results indicate that the tensile strength of SBR is notaffected by either radiation, the simuhmt of the combination of both conditions. While thespecific tensile strength values are not obvious from the data in the figure, their precise valuescan be found in Appendix H of this report.
Elongation at Break or Ultimate Elongation
As discussed previously, the stress-strain diagrams of linear polymers exhibit an initial maximumstress value. This maximum stress value occurs at the yield point of the material. At this point,deformation starts to localize in the material, forming a “neck”, and the material is said toundergo “necking”. However, since elastomers are extremely elastic, necking is not observed inthese materials. The determination of elongation at yield in elastomeric materials, as opposed tothermoplastic materials, is not possible. In elastomers, the maximum stress value occurs at thebreak point of the material. The amount of elongation that the material exhibits at this point isknown as the elongation at break. For elastomers, the term ultimate elongation is used ratherthan elongation at break. The ultimate elongation of an elastomer is defined by Eq. 1 as
Ultimate Elongation = [~ - LO)/LO]x 100 Eq. 1
where Lois the initial gage length (1 in. in this study), and Lf is the gage length at the breakpoint.These ultimate elongation values are expressed as a percent. It should be clear that increasingvalues of ultimate elongation equate to increasing elasticity in the material, while decreasingvalues represent decreasing elasticity. The data presented in the following sections will describethe change in elongation. These values were obtained by subtracting the ultimate elongation ofthe pristine material (25 1%) from the ultimate elongation observed in the material at the specificenvironmental conditions. As in previous measurements, positive and negative values forchanges in ultimate elongation are possible. Values are provided in Appendix I.
In Figure 13 (a) - (d), the average changes in ultimate elongation of SBR exposed to the fourgamma radiation doses followed by exposure at 18, 50, and 600C for 7, 14,28, and 180 days aregiven. It should be mentioned that the scale for ultimate elongation changes is considerablylarger than shown in previous figures. In this section, the scale ranges from -100% to 100Y0.Since the pristine elongation of SBR is 251%, this range corresponds to an ultimate elongationrange of-1 510/0to 351O/O.While the scale is larger than in previous property measurements, it isstill less than observed7>8for thermoplastics. For the latter thermoplastic materials, the scalesranged from -600°/0to 10OOO/O.These results suggest that the necking observed in thermoplasticsplay an important role for accommodating deformation.
29

-- .— .— __...
,
ulLQiAwil(%)
U. lL CllNIGf
(%)
~~
1
c
Tm?mN’uEE
RADIAnON mm (M)
(a)
I
c
TmPmAnlRf
u. EL CHANGE(%)
u. & CHANGE
(%)
1
c
TEM?UM’IIU
uADIAnON cost {krM)
(b)
(c) (d)
Figure 13. Ultimate Elongation (U. EL.) changes in SBR after exposure to -143, 286, 571,and 3,670 krad of gamma radiation followed by exposure for (a) 7 days, (b) 14days, (c) 28 days, and (d) 180 days at 18, 50, and 60 W.
The data generally show a 4% decrease in ultimate elongation. With increasing exposure time,there is a net decrease in ultimate elongation, but as a whole the ultimate elongation remainedunchanged. At the longest exposure time of 180 days, the greatest changes in ultimate elongationwere observed. For this exposure time, decreases in ultimate elongation of 10 to 24°/0 wereobserved. With increasing temperatures, decreases in ultimate elongation in the 10°/0range wereobserved. No general trends can be detected from the data for SBR exposed to increasingradiation doses. These results indicate that the elasticity of SBR is not strongly affected bygamma radiation.
Figure 14 shows the average changes in ultimate elongation for SBR exposed to the four gammaradiation doses followed by exposure to the aqueous simulant waste at 18, 50, and 600C for 7, 14,28, and 180 days. Similar to the SBR exposed only to gamma radiation, there is a generaldecrease in ultimate elongation with increased exposure time. The decreases in ultimateelongation are in the 1 to 110/0range. The SBR samples exposed to only the aqueous simukmt(Okrad radiation dose) also follow this trend but to a lesser degree. These results suggest that thesimukmt alone does not result in a strong decrease in ultimate elongation in SBR, i.e., SBR is
30 ‘

relatively resistant to the chemical effects of this simulantexhibited slight decreases in ultimate elongation values.
With increasing exposure times, SBRHowever, these decreases are only in
the range of iO’?40.Upon exposure for 180 days, most SBR samples showed a net loss in ultimateelongation. These results indicate that when SBR receives a longer exposure to the simukmt, itselasticity decreases somewhat. The specific ultimate elongation values are provided in AppendixI of this report.
u. CL ClIN(cl
(%)
u. F.!- CJIANGE
(%)
A f
u. w CHANCE
(%)
MIATlON COSI (M)
(a)
u. u.. CliAxcf
(%)
)C
(c)
nl’mIANu
mmAnON mm (krd)
(d)
Figure 14. Ultimate elongation (U. EL.) changes in SBR after exposure to -O, 143, 286,571, and 3,670 krad of gamma radiation followed by exposure for(a) 7 days, (b)14 days, (c) 28 days, and (d) 180 days to the aqueous simulant waste at 18, 50,and 60 C
Tensile Stress or 100% Modulus
For most materials, the initial portion of a stress-strain diagram is linear. This implies that strainis proportional to stress. The proportionality constant (slope of this linear region) is called themodulus of elasticity. The modulus of elasticity, or Young’s modulus, is a property of thestressed material. Jn fact, the magnitude of the modulus can be related to the nature of thechemical bonds existing in the material. Therefore, the modulus provides a measure of thebonding strength in the material being investigated. High values of modulus indicate that strong
31

bonding is present in the material. As one might surmise from the previous discussion, materialshaving strong covalent bonding have the highest modulus values. Thus, the larger the value formodulus, the stronger the bonding is expected to be in the material. Modulus has the same unitsas stress (psi or MPa). The rubber industry also refers to the modulus of a compound. They giveit a specific designation such as 100% modulus or 300°/0modulus. This is due to the fact that thevalue generated is not an engineering modulus as mentioned previously, but rather is the stressrequired to obtain a given strain. Therefore, the 100°/0modulus, is simply the stress (a) requiredto elongate the elastomer to twice its reference gage lenbfi. Rather than representing the slope ofa region in a stress-strain curve, the 100°/0modulus represents a single data point on the curve.The 100% modulus or tensile stress of an elastomer has identical units as the engineeringmodulus. Since we are interested in measuring changes in the tensile stress of the exposedmaterial from that of unexposed or pristine material (3.51 MPa), we will discuss the 0/0change intensile stress of the materials. This is calculated fi-omthe relationship given in Eq. 2:
Eq. 20/0Change in Tensile Stress = (af - ao)i 00 X 100
~rhere of is fie meas~ed tensile s~ess~der the specificenvironmental conditions at 10OO/o
elongation, and Gois the tensile stress of the pristine material at 100°/0elongation. The 100°/0modulus changes can be a positive or negative value depending on the magnitude of either of orcro. Positive changes in ?40tensile stress indicate that the material of interest required greaterapplication of stress to elongate the elastomer 100% than for pristine material. Negative valuesindicate that the material of interest required less application of stress than the pristine material.Appendix J provides the actual tensile stress values of SBR under the different environmentalconditions and the 0/0change.
In Figure 15 (a) - (d), the average % change in tensile stress of SBR exposed to the four gammaradiation doses followed by exposure at 18, 50, and 600C for 7, 14, 28, and 180 days is given.Increasing exposure to gamma radiation doses does not result in large increases or decreases intensile stress. Similarly, increasing the exposure temperatures has no dramatic effect on thetensile stress of SBR. The changes ranged from -17% to just over 19’%0.Even though some ofthe samples exhibited a slight decrease in tensile stress, other samples had slight increases intensile stress. At higher radiation dose and temperatures, there was a general trend towarddecreasing tensile stress. Consistent with previous tensile property measurements, the largerchanges were observed for samples exposed to the highest radiation dose (3,670 krad). Over thefour exposure times the decreases in tensile stress ranged from 3 to 17Y0. These trends aregenerally consistent with softening in the material, i.e., increased plasticity of the polymer chains.The latter observation is in agreement with a decrease in the rubbery qualities of the material,which has been confined by decreases in hardness (l?igure 5), and decreases in tensile strength(Figure 12), and slightly increasing ultimate elongation (Figure 13).
32

T. SZ CHANGE
l%)
9.MunON mm (kn.o
(a)
T. m. C14AMGF.
(%)
?FMPIRA7W.E
(c)
‘r. s. auNGE
(%)
T. SL CHANGE
(%)
c
mmrc8AmRE
RADIATION DOSE (MA)
(b)
c
lEm?lnAmRI
(d)
Figure 15. Tensile stress (T. ST.) changes in SBR after exposure to -143, 286, 571, and3,670 krad of gamma radiation followed by exposure for (a) 7 days, (b) 14 days,(c) 28 days, and (d) 180 days at 18,50, and 60’C.
Fi~e 16 (a) - (d) shows the average percentage of change in tensile stress of SBR exposed tothe four gamma radiation doses followed by exposure at 18, 50, and 600C to the aqueoussirnukmt waste for 7, 14, 28, and 180 days. Similar to the “Rad Only” data in Figure 15, thelarger changes in tensile stress are observed in samples exposed to the highest (3,670 krad)radiation doses. The largest of these are on the order of - -25Y0. At this radiation dose, thetensile stress values ranged fi-om - -3% to -25% of the pristine SBR’S tensile stress values.Comparing the results of Figures 15 and 16, SBR exposed to both radiation and the sirnulantwaste had slightly lower tensile stress values at the higher radiation doses. Since tensile stress isa measurement of the stiffhess 23 of the elastomer, the combination of radiation and chemicalexposure has resulted in a slight decrease in the stiffhess of the material.
33
---

— —
, I
r. sl CIUNG1
(%)
T. S1. CHANGE
(%)
EADIAnON DOSE W4)
(a)
‘i’ni?EEAnlal
EADIAnON DOSE (kId)
(c)
T. St’. CHANGE
(%)
T. ST. CHANGE
(%)
RADIATION DOSE (H)
EADUT!ON DOSE (W)
(d)
Figure 76. Tensile stress (T. ST.) changes in SBR after exposure to -O, 143, 286, 571, and3,670 krad of gamma radiation followed by exposure for (a) 7 days, (b) 14 days,(c) 28 days, and (d) 180 days to the aqueous simulant waste at 18, 50, and60 W.
These results suggest that the simukmt has counteracted the embrittling action of radiation, i.e.,the simulant appears to cause some plasticizing action. It should be mentioned that plasticizingagents are compounding ingredients in rubber formulations that contribute to the rubberyproperties of elastomers. The action of the simulant under these environmental conditionsappears to result in some plasticization of SBR. With increasing exposure time, the tensile stressvalues appear to decrease somewhat initially and then increase somewhat. This points to aninitial loss in stiffhess of the elastomer followed by in increase in the stiffness. The results inFigure 16 also show that increased exposure temperatures generally do not have any significanteffect on tensile stress. It appears that SBR is remarkably resistant to the effects of low radiationdoses, the simuhmt, and both environmental conditions. However, at the highest radiation dosesof 3,670 krad, some loss of tensile stress in SBR was evident.
34

DISCUSSION
The purpose of the Chemical Interaction Program, previously referred to as the ChemicalCompatibility Program, is to provide a scientifically defensible methodology for measuring thechemical interactions of polymeric liner and seal materials with hazardous wastes. Thesepolymeric materials are those that may be used in current and future container designs for thetransportation of hazardous and mixed wastes throughout the DOE complex.
With the completion of the screening phase of the program several years ago, the comprehensivephase of this program has been in progress. Since all seal and liner materials passed thescreening tests when exposed to the simulant Hdord tank waste, ten materials needed to besubjected to the test matrix. This results in an extremely large sample and test set. In view ofmanpower and budget constraints, the comprehensive testing phase of the program wassubdivided into the testing of liner materials and seal materials. The results of liner testing is thesubject of a previous milestone7 report. Because of fimther funding constraints, thecomprehensive testing of seal materials was subdivided into the testing of individual elastomers.In previous reports,ll’12 we discussed the results from testing of the first two elastomeric sealmaterials, EPDM and butyl rubber. This report describes the testing results from the nextelastomeric seal material, SBR. Subsequent reports will discuss the testing results for afluorocarbon elastomer exposed to simulant Hadord tank waste. We will now proceed todiscuss the results obtained for each of the properties measured starting with specific gravity andending with tensile stress of SBR.
From an overall perspective, the specific gravity data show that simulant temperature, radiationdose, and the exposure time have slight effects on the specific gravity of SBR. These results areconsistent with the known chemical resistance of this elastomer and demonstrate that SBR is asuitable elastomer for use under these conditions if specific gravity is the determiningg designcriterion for selection of packaging seal components. Increasing exposure times, radiation doses,and exposure temperatures generally caused increases in specific gravity of less than 10/o. Thegreatest changes were noted for the samples exposed to the most extreme exposure conditions,i.e., at 3,670 krad and 600C. SBR samples that were not irradiated in most sometimes displayedsmaller increases in specific gravity than samples exposed to both radiation and the simukmt.However, with longer exposure times, specific gravity values similar to combination conditionswere observed. These results indicate that SBR may be affected to a greater extent by thecombination of radiation and chemical exposure and that SBR is less resistant to radiationexposure.
The mass of SBR decreased slightly after exposure to the sinmlant or the combination ofradiation and simulant at increasing exposure times and exposure temperatures. These decreasesin mass were observed only at the elevated temperatures of 50 and 600C. At 180C, SBRexhibited slight (-0.2°/0) weight gains. The largest decreases in mass of-1 .3°/0were observedafter 180-day exposures. Since the mass changes are not very large, the slight increases inspecific gravity noted earlier could be caused by a combination of mass and dimensionalchanges. Specifically, the volume of the SBR could decrease to a greater degree than itsincreases in mass, resulting in a net increase in specific gravity. In fact, this is exactly what wasobserved. For most sample volumes, decreases in volume were observed. As will be recalled,
35

the volume of the samples was calculated through multiplication of its dimensions. A furtherinspection of the changes in dimensions revealed that, while the length and width of mostsamples decreased, the sample thickness generally increased. Since thickness measurements aremore accurate than measurements of sample length or width, increasing thickness indicates slightswelling of the material. It should, however, be kept in mind that this swelling is relatively small(-O to 0.3%). Since these dimensional changes are not isotropic in the rectangular geometry ofthe samples, large changes in one of the sample dimensions may dominate changes in volume. Inactual packaging, seals are in the form of O-rings. O-rings with their circular geometry mayexhibit more isotropic behavior. Thus the relatively small anisotropic changes in dimension maybe even smaller in O-rings where isotropic behavior is expected. The practical implication ofthese results is that SBR O-rings, even when directly exposed to a Hanford Tank waste undersimilar conditions as used in this study, are not expected to change dimensionally very much.
As was previously discussed for dimensional property changes, the hardness of SBR increaseswith increasing exposure time to both radiation and the simulant. For samples exposed to onlythe simukmt, the hardness does not change significantly. Additionally, certain radiation levelsappear to exert a beneficial effect on the retention of hardness by SBR. This was found to beespecially true for the case where SBR was exposed for 180 days. Under these conditions, mostof the SBR samples for all radiation doses have become harder after previously becoming softerat the lower exposure times. Since SBR contracted slightly under these conditions, the observedhardening of the material at these severe conditions could be ascribed purely to a shrinkagephenomenon. Hardening in the presence of shrinkage could be due to chain cross-linking in thepolymer. Confirmation of this process will require additional tests. The observation thatradiation in combination with chemical exposure may have a beneficial effect on hardnesssuggests that the cross-linking and chain scission (breaking) processes are occurringsimultaneously. Possibly the combination of processes leads to a polymeric structure havinggenerally shorter polymer segments that are cross-linked byradiation and chemical reactions.
Compression set measures the retention of elastic properties of material after exposure tocompressive stresses. When SBR samples were exposed to only gamma radiation, set changes inthe range of-3.4 to 0.16% were found. For samples exposed to both radiation and the simulant,the compression set change range of values increased slightly fi-om -1.8 to 3.2’?40.The combinedeffects of radiation and chemical exposure resulted in increased compression sets, i.e., thematerial became more deformed, or less rubbery. These deformations are most pronounced insamples to the simukmt at 180C. Compared with the hardness results, the SBR became slightlyharder at the longest exposure time. Its elastic properties, however, appear to have suffered underthese conditions. As previously discussed, perhaps the competition between cross-linking andchain scission reactions could offer an explanation. However, other factors such as theinteraction of the other constituents of elastomers (oils, vulcanizing aids, fillers, etc.) at theseenvironmental conditions would need to be considered.
36

The VTR of SBR changed very litde when exposed to radiation and the aqueous simulant. Mostof the VTRS for SBR samples were less than 0.3 g/hr/m2. These results are not unexpected sincethe permeation of water molecules through this polymeric network is expected to be slow. Thatthis process is temperature dependent is confiied by the results. As temperature is increased,the VTRS also increased. The interesting aspect of the results is that the VTRS appear todecrease with increased exposure time. A possible explanation is that the presence of theinorganic salts, especially the precipitate found in the simulant, may clog microscopic pores inthe SB~ thereby reducing the transport of water vapor. –
The tensile strength of SBR also exhibits small changes when exposed to radiation, the simulant,and both radiation and simulant. For samples exposed to only radiation, decreases in tensilestrength of less than 180/0were noted. Many of these samples decreased less than 7°/0in tensilestrength. The combination of high radiation doses and chemical exposure resulted in only 110/0decreases in tensile strength. At-the highest radiation dose, the scission of polymeric chains maydominate as the determining process that leads to lower strength. While the material’s strengthmay be retained at the less severe environmental conditions, the material’s elasticity decreased.This is supported by the data for ultimate elongation discussed b~lew., ~‘-
The, elastic property of materials can be measured by evaluating their degree of ul~ateelongation. For SBR samples exposed to only gamma radiation,, a general decrease in elongationwas observed with increasing exposure time. These results indicate that the material is moreelastic at shorter exposure-times and-less elastic at longer exposure time. However, because mostSBR samples were still rather elmtici-i.e., stretching more than= 200Y0,a change of-10% stillresults in rather elastic material. For SBR exposed to both radiation and simukmt, while there isa general decrease in elongation, the material still retained similar elasticity compared withsamples only exposed to radiation. These results again point to the plasticizing effects of thesimulant.
Finally, ~e tensile stress properties of SBR will be discussed. Tensile stress or 100% modulusmeasurements provide a measure of the stiffhess of the elastomer. A greater tensile stress valueindicates that the elastomer is more likely. to recover from localized forces and thereby resistextrusion. The effect of radiation on the tensile stress values of SBR did not increase by morethan 20Y0,nor did they decrease by more than 17%, i.e., tensile stress increases of 20% anddecreases of 17’%were observed. The effects of radiation alone on SBR resulted in slightlystiffer material. For samples exposed to only the simulant or to a combination of both radiationand simulant, decreases in tensile stress of up to 9°/0 and 25°/0, respectively, were observed.These results suggest that the simukmt somewhat counteracted the effect of radiation to reducethe stiffness., Similar to previous observations, the simukmt appears to act as a plasticizing agent.Alternatively, the combination of radiation and simulant exposure resulted in SBR becoming lesselastic and assuming a more plastic character. The observation that decreases in hardness, tensilestrength, ultimate elongatio~ and tensile stfess were observed under radiation and chemicalexposures, while compression set increased, suggests that SBR indeed has lost some of its elasticproperties and become more plastic. SBR exposed to higher radiation doses may exhibitincreased plasticity, i.e., the material’s original dimensions under an applied load are notrecovered when the load is removed.
37
—- —. —... —

In summary, the measurement of changes in specific gravity, mass, volume, hardness,compression set, and VTR indicated that SBR is remarkably resistant to the effects of radiationand the aqueous simulant at the temperatures and exposure times tested. From the tensile testingresults, consisting of tensile strength, ultimate elongation, and tensile stress measurements, SBRappears to be more susceptible to the effects of radiation and the aqueous simulant. Whencompared to the previously obtained tensile testing results for EPDM rubber and butyl rubber,SBR appears to be comparable to EPDM rubber and somewhat more resistant than butyl rubberunder these environmental conditions. The beneficial effect of both radiation and the sirnulant inhelping to reduce the changes in some material properties was noted. These results suggest thatthis particular aqueous mixed waste has relatively small effects on SBR.
38

CONCLUSIONS
Sandia has developed a program for studying the chemical interactions of plastic packagingcomponents that may be used in packaging for transporting mixed waste forms. Consistent withthe methodology’ outlined in this report, the second phase of this experimental program wasperformed to determine the effects of simukmt Hanford Tank mixed wastes on a packaging .sealmaterial, SBR. This effort involved the comprehensive testing of SBR with an aqueous mixedwaste simulant. The testing protocol involved exposing the respective materials to -143, 286,571, and 3,670 kratl of gamma radiation followed by 7-, 14-,28-, 180-day exposures to the wastesirnulant at 18, 50, and 60”C. From the an@yses performed, we determined that SBR has verygood resistance to ‘radiatioq this simuhint, and a combination of both environmental factors.These results suggest that SBR is a relatively good seal-material to withstand aqueous mixedwastes having similar composition to the one used in this study. SBR appears to respondcomparably to EPDM rubber when exposed to the simukmt used in this study. Both of theseelastomers appear to be superior in performance when compared to bulyl rubber.
.(“,
.-
.,..
,’
—
.
39
,.–.. —

REFERENCES
1. P. J. Nigrey. “Chemical Compatibility Test Plan & Procedure Report;’ September 29, 1993,Sandia National Laboratories, Albuquerque, NM, unpublished (1993).
2. P-J. Nigrey, M. Conroy, and L. B. Bkdock. “Mixed Waste Chemical Compatibility withPackaging Components,” in Proc. of SPECTRUM ’94,Nuclear and Hazardous Waste
Management International Topical Meeting, Vol.1, pp. 386-391, American NuclearSociety, La Grange Park, Illinois (1994).
3. P. J. Nigrey and T. G. Dickens. “Effects of Mixed Waste Simulants on TransportationPackaging Plastic Components,” Paper 95-TP-68.02, Presented at the 88th Annual Meeting& Exhibition of the Air& Waste Management Association San Antonio, TX (1995).
4. P. J. Nigrey. “Mixed Waste Chemical Compatibility: A Testing Program for PlasticPackaging Components,” in Proc. of PA TMA4 ’95, The I Ith International Symposium onthe Packaging and Transportation of Radioactive Materials, Vol. III, pp. 1372-1379(1996).
5. P. J. Nigrey and T. G. Dickens. “Effects of Hdord Tank Simulant Waste on PlasticPackaging Components:’ in Proc. of PATMM ’95, The Ilth International Symposium onthe Packaging and Transportation of Radioactive Materials, Vol. III, pp. 1210-1216(1996).
6. P. J. Nigrey and T. G. Dickens. “Chemical Compatibility Screening Results of PlasticPackaging Components to Mixed Waste Simulants~’ in Proc. of PA TRAM ’95, The IlthInternational Symposium on the Packaging and Transportation of Radioactive Materials,Vol. III, pp. 1202-1209 (1996).
7. P. J. Nigrey and T. G. Dickens. Chemical Compatibility Screening Test Results, SAND97-3104, Sandia National Laboratories, Albuquerque, NM (1997).
8. P. J. Nigrey and T. G. Dickens. Comprehensive Testing to Measure the Response of LinerMaterials to Hanford Tank Waste Simulant, SAND99-0419, Sandia National Laboratories,Albuquerque, NM (1999).
9. P. J. Nigrey and T. G. Dickens. “A Testing Program to Evaluate the Effects of SimulantMixed Wastes on Plastic Transportation Packaging Components,” Technology: Journal ofthe Franklin Institute, Vol. 334A, pp. 337-349 (1997).
10. P. J. Nigrey and T. G. Dickens. “Effects of Simukmt Mixed Waste on EPDM and ButylRubber” in Proc. of PA TMM’98, The 12th International Symposium on the Packaging andTransportation of Radioactive Materials, Vol. 1, pp. 423-428 (1998].
40

11.
12.
L
13,
14.
15.
16.
17.
18.
19:
20.’‘
21.
23.
P. J. Nigrey. Comprehensive Testing to Measure the Response of Ethylene Propylene Diene(EPD~ to Hanford Tank Waste Simulant, MND2000-0466, Sandia NationalLaboratories, Albuquerque, NM (2000).
l?. J. Nigrey. Comprehensive Testing to Measure the Response of Butyl Rubber to HanfordTank Waste Simulant, SAND2000-0483, Sandia National Laboratories, Albuquerque, NM(2000). .. .,
ASTM D 814-86, Standard Test Method for Rubber Property - Vapor Transmission ofVolatile Liquids, American Society for Testing and Materials, Philadelphi~ PA (1991).
-.ASTM I) 412-8’7,Standard Test Method for Rubber Properties in Tension, AmericanSociety for Testing and Materials, Philadelphi~ PA,(1987)... ., ~~
ASTM h 1349-87, Standard Practice for Rubber - Standard Temperatures for Testing,American Society for Testing and Materials, Philadelphi~ PA (1987). —
ASTM E-104- 85, Standard Practice for Maintaining Constant Relative Humidity byMeans ofAqueous Sol~tions, Americti Society for Testing and Materials, Philadelphia, PA(1991).
K. T. Gillen, R. L. Clough, and L. H-.Jones. “Investigati~n of Cable Deterioration in theContainment Building of Savannah River Nuclear Reactor~’ Sandia Nation~ LaboratoriesReport, SAND 81-2613 (1982). -:.
ASTM D792;91, Standard Test Method for Densi@ and Spec@c Gravity (RelativeDensi~) of Plastics by Displacement, American Society for Testing and Materials,Philadelphi~ PA (1991). - - -
A~TM D 543-87, Standard Test Method for Resistance of Plastics. to Chemical Reagents,American Society for Testing and Materia!s, Philadelphi~ PA (1987).
ASTM D 2240-91, Standard Test Method for Rubber Property - Durometer Hardness, -AmericanSociety for Testing and Materials, Philadelphi~ PA (1991).
ASTM D 395-89, Standard Test A4ethodfor Rubber Property - Compression Set, AmericanSociety for Testing and Materials, Philadelphi~ PA (1989).
R. J. Del Vecchio. “Tensile Testing of Elastomers;’ in Tensile Testing (P. Han, cd.), ASMInternational, The Materials Wormation Society, Materials Park, Ohio (1992), pp. 136-146.
41
-...— . —

Material Supplier:
Measurement
Specific Gravity
Dimensional
MassNA
Hardness (Shore A)
Compression Set
Vapor Transport Rates
Tensile Property
Tensile [email protected]
APPENDIX ASBR Material Information
Parker Seal GroupaO-Ring Division2360 Palurnbo DriveP.O. Box 11751Lexington, KY 40512(606) 269-2351
Initial Value Cure Dateb
1.195 CD 1Q95
NA CD 1Q95
CD 1Q95 B316566
62.7 points CD 1Q95
5.67 CD 1Q96
NA CD IQ95
CD1Q95CD1Q96
12.6 MPa
Batch Number
B316566
B316566
B316566
B320139
B3 16566
B316566B320139
Ultimate Elongation 251%Tensile Stress 3.51 MPa
a- Procured from Parker Seal Group (G0244-70) through Southwest Seal and Supply, 1413 1stStreet NW, Albuquerque, NM 87102-1533, (505) 247-0265. This material was obtained inthe form of molded sheets. The 12” (30.5 cm) square sheets were -0.125” (0.317 cm) thick.Cost: -!$46/ft2 (- $0.049/cm2)
b. Cure Date (CD) nomenclature indicates the quarter and year in which the rubber wasprepared. For example, 1Q95 represents material prepared during the first quarter of 1995.
42

APPENDIX BSBR Specific Gravity Data*
I AVERAGESPECIFICGRAVITY(SP.GR.) AND ‘+’0 CHANGE SBR I18 C lNITJAL 7 DAYS $ 14“DAYS 28 DAYS 180 DAYSRAD DOSE SP. GR. SP. GR. % CHANG . SP. GR. % CHANG , SP. GIL. % CHANG SP. GR. 9’.CHANGOK 1.1960 1.1950 -0.08 1.1971 0.09 1.1980 0.17 1.1972 0.10143K 1.1960 1.1965 0.04 1.1966 0.05 1.1983 0.19 1.1983 0.19286K 1.1950 1.1980 -0.25 1.1975 0.21 1.1983 - 0.28 1.1987 0.31571K 1.1961 1.1974 0.11 1.1972 0.09 1.1983 0.18 1.1982 0.183670K 1.1963 1.1981 0.15 1.1988 0.21 1.1989 0.22 1.1988 0.21
50 c INITIAL 7 DAYS 14 DAYS 28 DAYS 180 DAYSRAD DOSE SP. GR. SP. GR. % CHANG : SP. GR. % CHANGt SP. GR. ?JoCHANG z SP. GR. VoCHANG,OK 1.1947 1.1976 0.24 1.1981 0.28 1.1979 0.27 1.1980 0.28143K 1.1961 1.1965 0.03 1.1975 0.12 1.1972 0.09 1.1953 -0.07286K 1.1957 1.1975 0.15 1.1972 0.13 1.1979 0.18 1.1977 0.17571K 1.1961 1.1976 0.13 ..1.1971 0.08 1.1978 “ 0.14 1.1970 0.083670K 1.1949 1.1978 0.24 1:1982’ 0.28 1.1985 0.30 1.1974 0.21
60 C INITIAL 7 DAYS “L- 14 DAYS 28’ DAYS 180 DAYSMD DOSE SP. GR. SP. GR. % CHANG# SP. GR. 9’oCHANG . SP. GR. YoCHANG# SP. GR. ?40CHANGOK 1.1957 1.1982 0.21 1.1983 0.22 1.1980 0.19 1.1996 0.34143K 1.1965 .’1.1956 -0.08 1.1973 0.07 1.1973 0.07 1.1981 0.13286K 1.1944 .$1.1977 0.28 1.1974 0.25 1.1977 0.28 1.1985 0.34571K 1.1931 1.1974 0.36 1.1970 0.33 1.1982 0.43 1.1981 0.423670K 1.1903 1.1982 0.66 1.1985 0.69 1.1989 0.72 1.1984 0.68
* In all appendices, the data in the “OK” represents samples exposed to only the simulant (i.e.,Simzdant Only samples) while the other data represents samples that received both radiation andsi,mulant exposure.
43
-.— -., . . . . .. ., —- -.

APPENDIX CSBR Mass Data
MASS (g) AND Y. CHANGE SBR
18C INITIAL 7 DAYS 14 DAYS 28 DAYS 180 DAYS
RAD DOSE WEIGHT WEIGHT YoCHANGI WEIGHT YoCHANGE WEIGHT YoCHANGd WEIGHT YoCHANGE
OK 7.0711 7.0711 0.00 7.0732 0.03 7.0755 0.06 7.1344 0.90
143K 7.5511 7.5528 0.02 7.5550 0.05 7.5608 0.13 7.5924 0.55
286K 7.4729 7.4764 0.05 7.4756 0.04 7.4822 0.12 7.5252 0.70
571K 7.5246 7.5275 0.04 7.5276 0.04 7.5348 0.14 7.5657 0.55
3670K 7.5232 7.5280 0.06 7.5271 0.05 7.5333 0.13 7.5864 0.84
50 c INITIAL 7 DAYS 14 DAYS 28 DAYS 180 DAYS
RAD DOSE WEIGHT WEIGHT ?XOCHANGd WEIGHT % CHANGd WEIGHT YoCHANGE WEIGHT % CHANG [
OK 7.5008 7.4922 -0.11 7.4823 -0.25 7.4728 -0.37 7.4716 -0.39
143K 7.6323 7.6116 -0.27 7.6024 -0.39 7.5963 -0.47 7.5431 -1.17
286K 7.4578 7.4435 -0.19 7.4259 -0.43 7.4193 -0.52 7.3686 -1.20
571K 7.4565 7.4410 -0.21 7.4286 -0.37 7.4204 -0.48 7.3571 -1.33
3670K 7.3741 7.3625 -0.16 7.3453 -0.39 7.3377 -0.49 7.2768 -1.32
60 C INITIAL 7 DAYS 14 DAYS 28 DAYS 180 DAYS
RAD DOSE WEIGHT WEIGHT % CHANGE WEIGHT YoCHANGd WEIGHT VoCHANG E WEIGHT YoCHANG E
OK 7.6707 7.6325 -0.50 7.6143 -0.74 7.5907 -1.04 7.5427 -1.67
143K 7.3638 7.3209 -0.58 7.2976 -0.90 7.2825 -1.10 7.2328 -1.78
286K 7.1222 7.0866 -0.50 7.0739 -0.68 7.0636 -0.82 7.0298 -1.30
571K 7.1293 7.0778 -0.72 7.0632 -0.93 7.0529 -1.07 7.0096 -1.68
3670K 7.3871 7.3537 -0.45 7.3442 -0.58 7.3319 -0.75 7.3032 -1.14
44

APPENDIX DSBR Dimensional Data
I VOLUME (mm”3) AND 9’. CHANGE: SBR Ii i I 1 1 I
IRAD DOSE [ VOLUME I VOLUME I 9’oCHANGd ‘18C I INITIAL I 7 DAYS I 14 DAYS I 28 DAYS I 180 DAYS
VOLUME YoCHANGd VOLUME % CHANGd VOLUME ?JOCHANG
OK 1–- -5757 I 5799 I 0.73 I 5793 0.63 5779 0.38 5823 1.15
143K 6181 6209 0.45 6182 0.02 6176 “ -0.08 6225 0.716119 -0.42 6129 -0.26 6158 0.21
70 6175 0.29 6221 1.04286K 6145 6115 -0.49571 K 6157 6170 0.21 6200 0.73670K 6163 6177 0.23 6177 0.23 I 6175 I 0.19 I 6211 I 0.78
I
50 c INITIAL 7 DAYS 14 DAYS I 28 DAYS I 180 DAYS
RAD DOSE VOLUME VOLUME Y. CHANG. VOLUME % CHANGd VOLUME Yo CHANGIj VOLUME Y. CHANGI
OK 6160 6125 -0.57 6113 -0.76 6106 -0.88 6094 -1.07
143K 6263 6248 -0.24 6220 -0.69 6227 -0.57 6217 -0.73
286K 6118 6086 -0.52 6094 -0.39 6086 -0.52 6068 -0.82
571K 6132 6091 -0.67 6123 -0.15 6082 -0.82 6080 -0.85
3670K 6045 6015 -0.50 6008 -0.61 6009 -0.60 5957 -1.46
I LENGTH (mm) AND V. CHANGE SBR I
50 c INITIAL 7 DAYS I 14 DAYS I 28 DAYS I 180 DAYS
,RAD DOSE LENGTH LENGTH ‘h CHANGIj LENGTH %’oCHANGI! LENGTH Yo CHANGlj LENGTH %’oCHANG1
OK 75.34 75.29 -0.07 75.27 -0.09 75.16 -0.24 74.99 -0.46
143K 75.27 75.15 -0.16 75.11 -0.21 75.07 -0.27 74.84 -0.57
286K 75.34 75.23 -0.15 75.17 -0.23 75.07 -0.36 74.87 -0.62571K 75.38 75.26 -0.16 75.24 -0.19 75.14 -0.32 74.95 -0.57
3670K 75.30 75.21 -0.12 75.15 -0.20 75.09 -0.28 74.88 -0.56
45
... ., ..-<,,,.., .,, ,..< ........”-.,. ...?... ... . . . . . . ....? s, ..,. .. !.,. .. ........? ,.., ... ..

APPENDIX DSBR Dimensional Data (continued)
7 DAYS I 14 DAYS IWIDTH I Vo CHANGti WIDTH I ‘XOCHANGd
28
WIDTH
WIDTH (mm) AND %’. CHANGE SBR
I 1 I
18C INITIAL DAYS 180 DAYS
RAD DOSE WIDTH I %’oCHANGE WIDTH L?LOCHANG[
OK 28 25.29 0.48
143K 25.1 08 25.28 0.36
286K 25.22 25.20 -0.08 25.25 0.12
571K 25.20 25.24 0.16 25.33 0.52- ,---- ..- a.-. OK 9L nlA 9C 7A n 4R
: I 25.17 I 25.29 0.48 I 25.27 I “0.40 I 25.24 I 0.
19 25.25 0.24 25.21 0.08 25.17 .0.{
25.20 -0.08 25.2125.25 I 0.20 25.30“,-”” n no or .-)7
c... I 25.31 25.15 -0.63 25.14 -0.67 25.15 -(
2s.22 25.21 -0.04 25.16 -0.24 25.18 -0.16
19 25.19 0.00 25.21 0.08 25.19 0.00 25.13
-0.20 25.2”6 0.00 25.16 -0.40 25.19
).04 25.15 -0.12 25.13 -0.20 25.04
50 c I INITIAL 1 7 DAYS I 14 DAYS I 28 DAYS I 180 DAYS
RAD DOSE I WIDTH WIDTH t ‘/o CHANG WIDTH 1 9L0CHANGd WIDTH I 9’oCHANGd WIDTH o/oCHANG[
OK 0.63” 25.06 -0.99
143K ! 25.13 -0.36
286K 25. ” -0.24
571K 25.26 25.21 -0.28
3670K 25.18 25.17 I -o -0.56
1 14 DAYS J 28 DAYS
ANGd WIDTH 70 CHANGEj WIDTH 0/0(:8 25.17 -0.32 25.12 4
+3K I 25.22 I 25.14 -0.32 25.10 -0.48 25.C
25.2~[ 25.13 -0.32 25.13 -0.32 25.13 -0.32 I25.13 -0.16 25.11 -0.24 25.05 -0.48 25.07 I
3670K I 25.25 I 25.20 -0.20 25.19 -0.24 25.17 -0.32 I 25.14 -0.44 I
60 C INITIAL 7 DAYS
RAD DOSE WIDTH WIDTH I ’10CH
OK 25.25 25.18 -0.2
14286K571K I 25.17 I
I 180 DAYS
CHANG~ WIDTH Yo CHANG
‘0.51 25.01 -0.95
08 I -0.56 25.02 -0.7925.08 -0.52
-0.40
THICKNESS (mm) AND %’.CHANGE SBR
18C INITIAL 7 DAYS I 14DAYS 28 DAYS I 180DAYS
RAD DOSE THICKNESS THICKNESS ?JOCHANGd THICKNESS YO CHANGf THICKNESS cxoCHANGd THICKNESS YOCHANGE
OK 3.04 3.04 0.00 3.04 0.00 3.04 0.00 3.05 0.33
143K 3.25 3.26 0.31 3.25 0.00 3.25 0.00 3.26 0.31
286K 3.23 3.22 -0.31 3.22 -0.31 3.22 -0.31 3.23 0.00
571K 3.24 3.24 0.00 3.25 0.31 3.25 0.31 3.25 0.31
3670K 3.24 3.25 0.31 3.24 0.00 3.25 0.31 3.25 0.31
50 c INITIAL 7 DAYS 14 DAYS 28 DAYS 180 DAYS
RAD DOSE THICKNESS THICKNESS Yo CE-EANGI THICKNESS ~0 cHANG~ THICKNESS % CHANGE ‘THICKN=S ~0 CHANG E
OK 3.23 3.23 0.00 3.23 0.00 3.23 0.00 3.24 0.31
143K 3.30 3.30 0.00 3.29 -0.30 3.29 -0.30 3.31 0.30
286K 3.22 3.21 -0.31 3.22 0.00 3.22 0.00 3.23 0.31
571K 3.22 3.21 -0.31 3.22 0.00 3.22 0.00 3.22 0.00
3670K 3.19 3.18 -0.31 3.18 -0.31 3.18 -0.31 3.18 -0.31
60 C INITIAL 7 DAYS 14 DAYS 28 DAYS 180 DAYS
RAD DOSE THICKNESS THICKNESS ’10 CE+ANG I THICKNESS Yo CHANGd THICKNE5S YO CHANG E THICKNESS OfOCHANG E
OK 3.30 3.31 0.30 3.30 0.00 3.30 0.00 3.30 0.00
143K 3.18 3.17 -0.31 3.17 -0.31 3.17 -0.31 3.18 0.00
286K 3.08 3.07 -0.32 3.08 0.00 3.08 0.00 3.08 0.00
571K 3.07 3.06 -0.33 3.07 0.00 3.07 0.00 3.08 0.33
3670K 3.19 3.19 0.00 3.19 0.00 3.19 0.00 3.20 0.31
46

APPENDIX ESBR Hardness Data
AVERAGE HARDNESS (TYPE A) AND yO CHANGE SBR
18 C INITIAL 7 DAYS 14 DAYS 28 DAYS 180 DAYSMD DOSE HARDNESS HARDNESS Yo CHANG ;HARDNESS 9’o CH#JKi : HMU)FJESS ‘+’o CHANG , HARDIWSS YO (34AM
OK 62.9 63.1 0.3 63.0 0.2 63.0 0.2 62.3 -1.0143K 62.7 63.4 1.1 63.1 0.6 62.9 0.3 64.4 2.7286K 62.8 63.4 1.0 63.5 1.1 63.1 0.5 64.2 2.2\571K 62.5 63.2 1.1 63.1 1.0 62.8 0.5 63.7 1.93670K 62.6 63.7 1.8 63.5 1.4 63.3 1.1 64.0 2.2
50 c INITIAL 7 DAYS 14 DAYS 28 DAYS 180 DAYSRAD DOSE HARDNESS HARDNESS CXOCHANG ;HARDNESS CYo CH.M4G . HARDNESS YO CHANG . HARDNESS Vo CHAIQG
OK 62.5 62.5 0.0 62.5 0.0 62.8 0.5 61.8 -1.1143K 63.3 62.3 -1.6 62.7 -0.9 62.9 -0.6 64.6 2.1286K 62.6 62.2 -0.6 62.8 0.3 62.6 0.0 63.9 2.1.571K 62.9 62.5 -0.6 62.9 0.0 62.8 -0.2 64.4 2.43670K 63.4 61.9 -2.4 63.2 -0.3 63.2 -0.3 64.3 1.4
60 c INITIAL 7 DAYS 14 DAYS 28 DAYS 180 DAYSRAD DOSE HARDNESS HARDNESS V. CHANG ,HARDNESS{O/oCHANG ,HARDNESS YO CHANG WJU)NESS YO CMFJG
OK 62.1 62.2 0.2 62.2 0.2 62.3 0.3 62.5 0.6143K 62.8 61.8 -1.6 62.7 -0.2 62.5 -0.5 64.7 3.0286K 63.0 62.5 -0.8 62.7 -0.5 62.5 -0.8 64.4 2.2571K 62.4 62.3 -0.2 62.5 0.2 62.4 0.0 64.4 3.23670K 62.6 62.3 -0.5 62.6 0.0 62.3 -0.5 63.7 1.8
47
——.

— .—
APPENDIX FSBR Compression Set Data
I COMPRESS1ONSET (SET, ‘%.) AND CHANGE: SBR I18C INITIAL 7 DAYS 14 DAYS 28 DAYS 180 DAYS
RAD DOSE SET SET CHANGE SET CHANGE SET CHANGE SET
OK
CHANGE
5.67 7.07 I 1.40 6.55 0.88 7.46 1.79 8.89 3.22
30 0.13 7.54 1.87 4.61 -1.06
1.40 6.78 1.11 7.35 1.680.09 6.54 0.87
143K 5.67 5.94 0.27 5.8286K 5.67 6.20 0.53 7.07571K 5.67 5.15 -0.52 5.96 0.29 I 5.76 I3670K 5.67 6.02 0.35 5.59 -0.08 5.80 0.13 I 6.70 I 1.03
1
SET SET CHANGE SE. 5.67 6.75 1.08 6.06 I 0.39 I 5.32 I13K 5.67 6.32 0.65 5.14 -0.53 6.25
50 c INITIAL I 7 DAYS I 14 DAYS 28 DAYS 180 DAYS
RAD DOSE ;T I CHANGE SET I CHANGE SET
~
CHANGE-0.35 6.12 0.45
14 0.58 4.16 -1.51
286K 5.67 6.11 0.44 5.60 -0.07 5.54 -0.13 5.16 -0.51
571K 5.67 4.43 -1.24 4.46 -1.21 4.59 -1.08 5.29 -0.38
3670K 5.67 4.49 -1.18 6.08 0.41 5.04 -0.63 4.78 -0.89
5.24 -0.43 5.15.45 -0.22 3.87 I
~286K I 5.67 5.91 0.24 4.89 -o.:
60 C INITIAL I 7 DAYS I 14 DAYS 28 DAYS 180 DAYS
RAD DOSE SET SET CHANGE I SET CHANGE SET CHANGE SET
,OK
CHANGE
5.67 10 ! -0.57 3.97 -1.70 6.54 0.87
143K 5.67 -1.80 4.51 -1.16 3.88 -1.79
78 3.99 -1.68 4.68 -0.99
1571K I 5.67 I 4.08 -1.59 I 4.19 I -1.48 4.53 -1.14 4.81 -0.86 i3670K 1 5.67 I 4.28 I -1.39 I 5.15 I -0.52 I 4.60 I -1.07 I 4.93 I -0.74
I18 C, RAD ONLY INITIAL 7 DAYS 14 DAYS 28 DAYS -180 DAYS
MD DOSE SET SET CHANGE SET CHANGE SET CHANGE SET CHANGE
143K 5.67 5.4 -0.27 4.69 -0.98 5.44 -0.23 3.13 -2.54
286K 5.67 5.82 0.15 5.20 -0.47 5.83 0.16 5.06 -0.61
571K 5.67 4.25 -1.42 4.96 -0.71 4.99 -0.68 5.23 -0.44
3670K 5.67 5.22 -0.45 4.44 -1.23 4.52 -1.15 5.09 -0.58
50 C, RAD ONLY INITIAL 7 DAYS 14 DAYS 28 DAYS 180 DAYS
MD DOSE SET SET CHANGE SET CHANGE SET CHANGE SET CHANGE
143K 5.67 4.21 -1.46 3.56 -2.11 3.82 -1.85 3.39 -2.28
286K 5.67 5.15 -0.52 4.30 -1.37 4.01 -1.66 3.48 -2.19
571K 5.67 4.01 -1.66 3.69 -1.98 3.44 -2.23 4.10 -1.573670K 5.67 3.69 -1.98 4.87 -0.80 4.17 -1.50 4.27 -1.40
60 C, RAD ONLY INITIAL 7 DAYS 14 DAYS 28 DAYS 180 DAYS
RAD DOSE SET SET CHANGE SET CHANGE SET CHANGE SET CHANGE143K 5.67 4.07 -1.60 2.75 -2.92 3.92 -1.75 2.27 -3.40286K 5.67 4.47 -1.20 3.55 -2.12 2.86 -2.81 3.19 -2.48
571K 5.67 3.9 -1.77 3.29 -2.38 3.62 -2.05 4.44 -1.23
3670K 5.67 3.5 -2.17 4.11 -1.56 3.75 -1.92 3.69 -1.98
.
48

APPENDIX GSBR Vapor Transport Rate Data
VAPORTRANSM1SS1ONRATE (g/hr/mA2): SBR
18C 7 DAYS 14 DAYS 28 DAYS 180 DAYS
RADIATION DOSE VAPOR TRANSMISSION VAPOR TRANSMISSION VAPOR TkiNSMISSION VAFQR TRANSMISSION
-OK 0.1462 0.1150 0.0910 0.0325143K 0.0961 0.1225 0.0846 “ 0.0246286K 0.0406 0.0277 0.0189 0.0063571K 0.0081 0.0074 0.0095 0.00543670K 0.0961 0.0717 0.0501 0.0168
50 c 7 DAYS 14 DAYS 28 DAYS 180 DAYSIUDIATION DOSE VAPOR TRANSMISSION VAPOR TRANSMISSION VfQOR TRANSMISSION VAPOR TRANsM]ssIO~
OK 0.3803 0.2409 0.1475 0.0725143K 0.3641 0.2375 0.1495 0.0723286K 0.7010 0.3959 0.2247 0.0671571K 0.0947 0.0724 0.0572 0.03783670K 0.1705 0.1123 0.0758 0.0411
60 C 7 DAYS 14 DAYS 28 DAYS 180 DAYSIUDIATION DOSE VAPOR TRANSMISSION VAPOR TRANSMISSIC)N VAPOR TRANSMISSION VAPOR TwNsM]sslO~
OK 0.6564 0.6909 0.5657 0.2601143K 0.4128 0.2646 0.1770 0.1203286K 0.2463 0.1712 0.1303 0.0892571K 0.2883 0.2226 0.1563 0.10343670K 0.4764 0.2971 0.2020 0.0988
49
-.—.- “ —.

APPENDIX HSBR Tensile Strength Data
TENSILE STRENGTH (TENS. STR., Mpa) AND ‘Yo CHANGE SBR
18C INITIAL 7 DAYS 14 DAYS 28 DAYS 180 DAYS
RAD DOSE TENS. STR. TENS. STR. VO CE-EANGd TENS. STR. YO CHANGE TENS. STR. VO CHANGI TENS. ST’R. ~0 ~ANGE
OK 12.6 12.7 0.5 12.7 0.5 13.7 8.2 13.7 8.7
143K 12.6 12.8 1.6 I 3.7 8.7 13.7 8.2 13.3 5.5
286K 12.6 13.0 3.3 12.9 2.2 12.9 2.2 13.4 6.0
571K 12.6 13.0 3.3 13.4 6.6 13.4 6.6 12.7 0.5
3670K 12.6 13.2 4.4 13.0 3.3 13.4 6.0 12.5 -0.5
50 c INITIAL 7 DAYS 14 DAYS 28 DAYS “180 DAYS
.RAD DOSE TENS. STR. TENS.STR. YoCHANG~TENS. STR. O/oCHANGE TENS. STR. YoCHANGE TENS.STR. YoCHANG I
OK 12.6 12.3 -2.2 12.2 -3.3 13.3 5.5 12.5 -0.5
143K 12.6 13.2 4.4 13.1 3.8 12.5 -1.1 11.9 -6.0
286K 12.6 12.2 -3.3 12.9 2.2 13.3 5.5 12.8 1.1
571K 12.6 12.3 -2.7 13.2 4.4 13.2 4.4 13.1 3.8
3670K 12.6 12.2 -3.3 12.3 -2.7 11.7 -7.3 11.8 -6.5
60 C INITIAL 7 DAYS 14 DAYS 28 DAYS 180 DAYS
-RAD DOSE TENS.STR. TENS.STR. 9’oCHANGflTENS. STR. YoCHANG E TENS.STR. YoCHANGEjTENS. STR. ‘h CHANG E
,OK 12.6 12.8 1.6 13.2 4.9 13.3 5.5 12.4 -1.6
143K 12.6 12.1 -3.8 13.0 2.7 13.4 6.6 12.4 -1.6
286K 12.6 12.6 0.0 13.0 2.7 13.4 6.0 12.5 -0.5
571K 12.6 12.8 1.1 12.5 -0.5 13.3 5.5 12.8 1.6
3670K 12.6 12.1 -3.8 11.7 -7.3 11.4-- -9.3 11.2 -11.2
18C,RADONLY lNITiAL 7 DAYS 14 DAYS -28DAYS 180 DAYS
RAD DOSE TENS.STR. TENS.STR. YoCHANG~TENS. STR. q. CHANG E TENS. STR. % CHANGE TENS.STR- % CE-EANGI
143K 12.6 13.0 3.3 12.8 1.1 13.3 5.5 12.7 0.5
286K 12.6 13.3 5.5 11.8 -6.6 13.0 3.3 13.0 3.3
,571K 12.6 13.2 4.9 13.4 6.0 14.3 13.1 13.9 10.4
3670K 12.6 13.0 3.3 12.4 -1.6 13.5 7.1 13.0 2.7
50 C, RAD ONLY INITIAL 7 DAYS 14 DAYS 28 DAYS 180 DAYS
RAD DOSE TENS. STR. TENS. STR. YoCHANGd TENS. STR. 9’. CHANG~ TENS. STR. YoCHANG q TENS. STR. % CHANG I
143K 12.6 13.5 7.1 12.7 0.5 13.3 5.5 12.8 1.1
286K 12.6 13.4 6.0 12.3 -2.7 13.3 5.5 11.9 -6.0
571K 12.6 12.6 0.0 12.3 -2.7 13.0 2.7 10.3 -18.0
3670K 12.6 13.2 4.4 12.6 0.0 11.7 -7.1 10.5 -16.8
60 C, RAD ONLY INITIAL 7 DAYS 14 DAYS 28 DAYS 180 DAYS
,RAD DOSE TENS. STR. TENS. STR. YoCHANGE TENS. STR. YoCHANGg TENS. STR. ‘Y.CHANGE TENS. STR. YoCHAN GE
143K 12.6 12.3 -2.7 13.3 5.5 14.1 11.5 13.0 3.3
286K 12.6 14.1 11.5 14.3 13.7 13.8 9.3 13.9 10.4
571K 12.6 12.8 1.1 12.7 0.5 14.1 11.5 12.4 -1.6
3670K 12.6 11.9 -6.0 12.4 -1.6 11.4 -9.7 11.0 -12.8
.
50

APPENDIX ISBR Ultimate Elongation Data
I ULTIMATE ELONGATION (ELONG., 9’.) AND CHANGE SBR I
18C INITIAL 7 DAYS 14 DAYS 28 DAYS 180 DAYS
,RAD DOSE ELONG. ELONG. CHANGE ELONG. CHANGE ELONG. CHANGE ELONG.OK 251
CHANGE235 -6 239 -5 252 0 273 9
143K 251 2?’ * “,7 , 4’)”” , *“I-I ,
286K 251 269 7 248 -1 243 -3 259 3
,571K 251 248 -1 257 2 271 8 239 -5
3670K 251 256 2 262 4 254 1 242 -4
1=18 C,RADRAD DOSE143K286KC71 V
=&&k 7ELONG
.-lCnLLl 1 L3U
251 247211; 251 260 7 I L>u I u I Loo 1 I La-t I
3670K 251 262 4 258 3 278 l’1 284 1:I I I I
50 C, RAD ONLY INITIAL 7 DAYS 14 DAYS 28 DAYS 180 DAYS
RAD DOSE ELONG. ELONG. CHANGE ELONG. CHANGE ELONG. CHANGE ELONG. CHANGE143K 251 260 4 246 -2 254 1 239 -5286K 251 256 2 247 -2 254 1 213 -15571K 251 242 -4 242 -4 236 -6 191 -247A7nu 9KI 9LQ 7 9L7 r 9C7 9 99r -in4“, ”,. I .G4 , I z“ “ I , I L“.) , J 1 La, l-= I L,z.1 I -z”
IINITIAL
ELONG.143K I 251 I 245 I -2 [ 248 I--,,. 251 251
. . .I a,-. 1 . . . Ik
7 DAYS I 14 DAYS 28 DAYS 180 DAYSELONG. CHANGE I ELONG. CHANGE ELONG. CHANGE ELONG. CHANGE
-1 249 -1 230 -8L>> 2 238 -5 225 -lo
Lw I .: 236 -6 256 2 213 -15280 12 278 11 279 11 251 0
51
m, .... .......,, .,.. .,. ,/ . . .... ......... .. ... . ...—. ., —.

APPENDIX JSBR Tensile Stress Data
I TENSILE STRESS (STRESS, MPa) AND V. CHANGE SBR IRAD DOSE I s-fOK 3.51 u
18C I INITIAL 7 DAYS 14 DAYS 28 DAYS I 180 DAYS
rRESS STRESS ?ioCHANGI STRESS Yo CHANGE STRE5S 9’oCHANG1 STRESS ‘/o CHANG~
75 6.88 3.84 9.4 3.74 6.68 3.25 -7.3
143K 3.51 3.43 -2.36 3.45 -1.57 3.56 1.57 3.65 3.93
286K 3.51 3.23 -8.06 3.38 -3.73 3.61 2.95 3.43 -2.36
571K 3.51 3.45 -1.6 3.41 -2.9 3.33 -5.1 3.52 0.4
3670K 3.51 3.38 -3.7 3.16 -10.0 3.33 -5.1 3.48 -0.8
50 c INITIAL 7 DAYS 14 DAYS 28 DAYS 180 DAYS
RAD DOSE STRE5S STRESS ‘/o CHANGf STRESS YoCHANGI STRESS Yo CHANGI STRESS o/oCHANG1
19 I 9.45 3.77 7.47 3.20 -8.84 3.40 -3.14
15 -10.22 3.63 3.34 3.52 0.20 3.46 -1.38
17 -9.63 3.36 -4.13 3.54 1.0 3.58 2.0
28 -6.5 3.26 -7.1 3.74 6.5 3.92 11.8-- ..- -.. .,. ,,571K 3.51 3.i
3670K 3.51 3.01 I -14.1 I 3.03 I -13.6 I 2.99 I -14.1 I 5.14 I -1U.o I60 C INITIAL 7 DAYS l-” 14 DAYS I 28 DAYS 1 180 DAYS
RAD DOSE STRESS STRESS ‘/o CHANGd STRESS VoCHANGd STRESS Yo CHANGd STRESS % CHANGI
OK 3.51 3.33 -5.11 3.41 -2.75 3.23 -7.9 3.95 12.57
143K 3.51 3.12 -11.20 3.26 -7.1 3.62 3.14 3.85 9.63
286K 3.51 3.74 6.68 3.43 -2.2 3.56 1.4 3.61 2.8
571K 3.51 3.29 -6.3 3.41 -2.9 3.39 -3.5 3.81 8.6
3670K 3.51 2.63 -25.0 2.70 -23.0 2.76 -21.4 . 3.19 -9.0
18 C, RAD ONLY INITIAL 7 DAYS I 14 DAYS I 28 DAYS I 180 DAYS
RAD DOSE- STRE5S STRESS Yo CHANGd STRESS 9’oCHANGd STRESS % CHANGlj STRESS ‘/o CHANG,
143K 3.51 3.64 3.73 3.28 -6.68 3.81 8.6 3.96 13.0
286K 3.51 3.73 6.29 3.86 10.02 3.82 8.84 3.66 4.32
571K 3.51 3.31 -5.70 3.66 4.32 3.54 0.79 3.68 4.72
3670K 3.51 2.93 -16.5 3.11 -11.4 3.11 -11.4 3.27 -6.91
50 C, RAD ONLY INITIAL 7 DAYS 14 DAYS 28 DAYS I 180 DAYS
MD DOSE STRESS STRESS Yo CHANG. STRESS 9’oCHANGI STRESS ?LoCHANGi STRESS Yo CHANGI
143K 3.51 3.65 4.1 3.63 3.5 3.49 -0.6 3.79 7.86
286K 3.51 3.70 5.30 3.85 9.82 3.71 5.70 4.11 17.09
571K 3.51 3.31 -5.70 3.55 1.18 3.92 11.59 4.14 17.88
3670K 3.51 3.00 -14.5 3.07 -12.6 3.10 -11.8 3.42 -2.6
I I I I I I I. ..-
143K 3.51 3.48286K 3.51 3.88571K 3.51 3.553670K 3.51 2.96 -15.7 [ 3.10 I
w =+
ONLY
=-t
DAYS I 14 DAYS I 28 DAYS 1 180 DAYS
I Yo CHANGd STRESS % CHANGd STRESS Yo CHANGI! STRESS !/o CHANG
-1.0 3.63 3.3 3.74 6.48 3.97 13.2
10.61 3.65 4.13 3.77 7.47 4.20 19.65
1.18 3.69 5.11 3.50 -0.20 3.96 12.77
-11.8 3.24 -7.7 3.41 -2.9
, I
52

DISTRIBUTION
3
1
3
51311211
U.S. Department of EnergyAlbuquerque Field OfficeAttn: A. Justice
A. KapoorS. Hamp
Mail Stop 1396P.O. Box 5400Albuquerque, NM 87185-1396
Prof. Donald RileySchool of EngineeringWalla Walla College111 SW3rdCollege Place, WA 99324
Waste Management Nuclear ServicesNorthwest OperationsAttn: J. Greg Field
J. C. McCOyR. J. Smith, P.E.
345 Hills StreetRichland, WA 99352
MS 0717MS 0718MS 0718MS 0766MS 1407MS 0899MS 9018MS 0612
TTC Library, 6141K. B. Sorenson, 6141P. J. Nigrey, 6141P. B. Davies, 6100M.R. Keenan, 1824Technical Library, 9616Central Tech Files, 8945-1Review & Approval Desk, 9612
For DOE/OSTI
53
..-. —--~.T,-,-.n.:.,,.! ...T-. . $—,.-..-.,,- .- .. ... ... .