Smoke Event Public EPA 1. 2. 3. NAAQS Exc. Events States: AQ Warning NOAA Travel Advisories AQ...
16
Smoke Event Public EPA 1. 2. 3. NAAQS Exc. Events States: AQ Warning NOAA Travel Advisories AQ Forecasting FAA Flight Advisories NASA Earth Obs: Public SatModis Mod Vis PM25 SatTOMS SatGOES Chem
-
Upload
baldric-green -
Category
Documents
-
view
214 -
download
1
Transcript of Smoke Event Public EPA 1. 2. 3. NAAQS Exc. Events States: AQ Warning NOAA Travel Advisories AQ...

Smoke Event
Public
EPA
1.
2.
3.
NAAQS Exc. Events
States: AQ Warning
NOAATravel Advisories
AQ Forecasting
FAAFlight Advisories
NASAEarth Obs: Public
SatModis
Mod
Vis
PM25
SatTOMS
SatGOES
Chem

The Network Effect:Less Cost, More Benefits through Data Multi-Use
ProgramPublic
Data Organization
Data
Data Program
Program
OrganizationData
Data
ProgramData
Orgs Develop Programs
Programs ask/get Data Public sets
up Orgs
Pay only once Richer content
Less Prog. Cost More Knowledge
Less Soc. Cost More Soc. Benefit
Data Re-Use Network Effect
Data are costly resource – should be reused (recycled) for multiple applications
Data reuse saves $$ to programs and allows richer knowledge creation
Data reuse, like recycling takes some effort: labeling, organizing, distributing

Data Re-Use and Synergy
• Data producers maintain their own workspace and resources (data, reports, comments). • Part of the resources are shared by creating a common virtual resources.• Web-based integration of the resources can be across several dimensions:
Spatial scale: Local – global data sharing
Data content: Combination of data generated internally and externally
• The main benefits of sharing are data re-use, data complementing and synergy.• The goal of the system is to have the benefits of sharing outweigh the costs.
Content
Content
User
User
User
LocalLocal
GlobalGlobal
Virtual Shared Resources
Data, KnowledgeTools, Methods
User
User
Shared part of resources

Federated Information System
• Data producers maintain their own workspace and resources (data, reports, comments). • However, part of the resources are shared through a Federated Information System.• Web-based integration of the shared resources can be across several dimensions:
Data sharing federations: • Open GIS Consortium (GIS data layers)• NASA SEEDS network (Satellite data)• NSF Digital Government • EPA’s National Env. Info Exch. Network.
VIEWSRPO
NASANAAPS
RPO Federated Data System
Data, Tools, Methods
SharedPrivate
RPO
Other Federations
Applications
PM Policy
Regulation
Mitigation

Federated Information System
• Data producers maintain their own workspace and resources (data, reports, comments). • However, part of the resources are shared through a Federated Information System.• Web-based integration of the shared resources can be across several dimensions:
Data sharing federations: • Open GIS Consortium (GIS data layers)• NASA SEEDS network (Satellite data)• NSF Digital Government • EPA’s National Env. Info Exch. Network.
VIEWSRPO
RPO Federated Data System
Data, Tools, Methods
SharedPrivate
RPO
Other Federations
Applications
PM Policy
Regulation
Mitigation
Unidata Portal
ESIP Portal
Portal
Data to be “dispersed” to multiple “portals”
This brings data closer to the user
Each portal can serve different clientele
Conditions is open architecture so that the resources can be reconfigured into many different “views” through the different portals
User communities
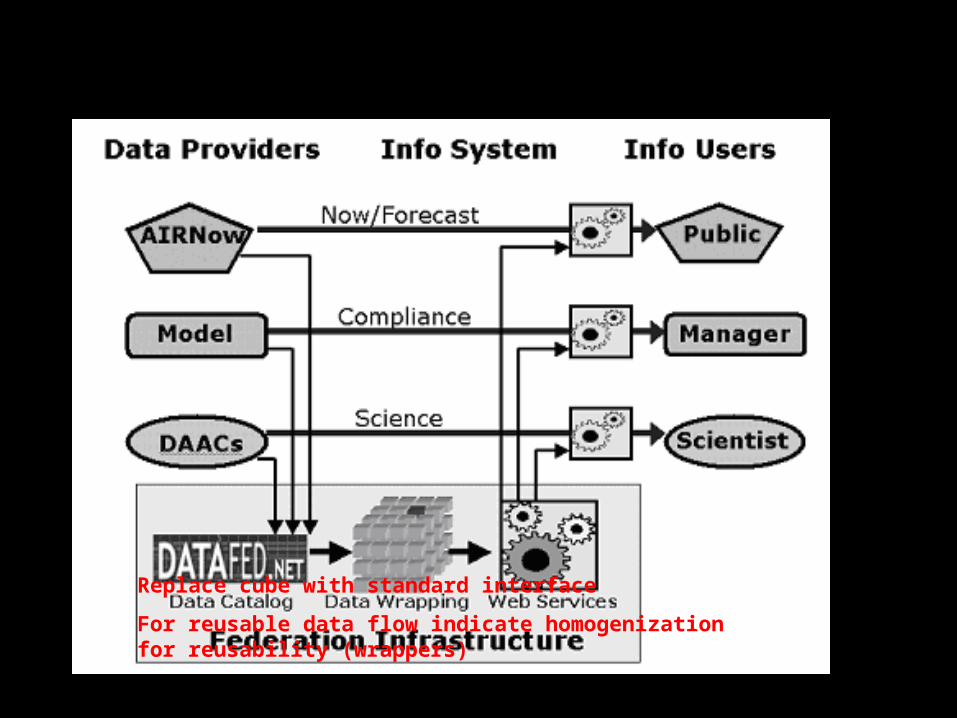
Replace cube with standard interface
For reusable data flow indicate homogenization for reusability (wrappers)

Integration for Global-Local Activities
Global Activity Local Benefit
Global data, tools => Improved local productivity
Global data analysis => Spatial context; initial analysis
Analysis guidance => Standardized analysis, reporting
Local Activity Global Benefit
Local data, tools => Improved global productivity
Local data analysis => Elucidate, expand initial analysis
Identify relevant issues => Responsive, relevant global work
• AQ data analysis needs to be performed at both global and local levels• The ‘global’ view (regional & global) establishes the larger-scale context• ‘Local’ perspective focuses on the specific and detailed local features• Global-local information exchange is needed for effective management.

Data Acquisition and Usage Activities
Need similar generic pic for
analysis
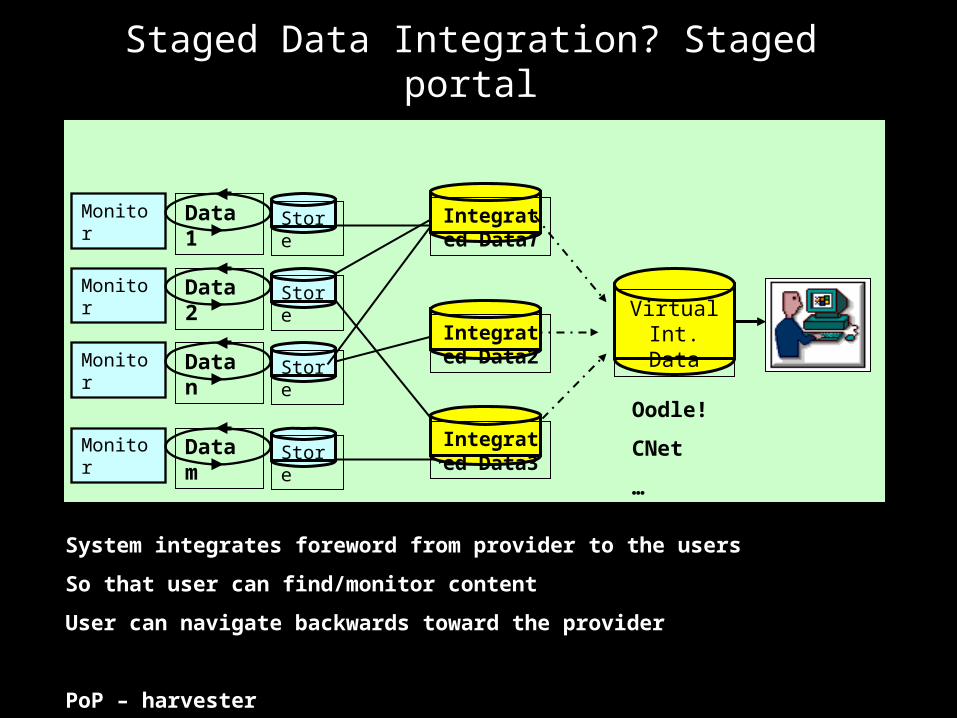
Staged Data Integration? Staged portal
Monitor StoreData 1
Monitor StoreData 2
Monitor StoreData n
Monitor StoreData m
Integrated Data1
Virtual Int. DataIntegrated
Data2
Integrated Data3
System integrates foreword from provider to the users
So that user can find/monitor content
User can navigate backwards toward the provider
PoP – harvester
Oodle!
CNet
…

AQ Management: Sensory-Motor System
AirQuality
AssessmentCompare to GoalsPlan ReductionsTrack Progress
Controls (Actions)
Monitoring(Sensing)
Set GoalsCAAA
NAAQS
Assessment turns data into knowledge for decision making & actions through analysis (science & engineering)
Monitoring collects multi-sensory data from surface and satellite platforms and
NASA ESE data, tools and methods can benefit air quality (AQ) management through extended monitoring, data sharing tools and better science.
The proposed project focuses on air quality management of particulate matter (aerosols).

Sensory-Motor Response to Changes
Regardless whether the Earth is considered ‘healthy’ or ‘sick’, the inevitable and unforeseeable environmental changes require response to these changes: The response includes the following major steps:
The above three steps are the necessary conditions for sustainable development. This is logical since all living organisms use this type of sensory-motor feedback to maintain their existence.
Sensing and recognition (monitoring)
Reasoning and explaining (sciences)
Decision making, action (management)

Instrument Builders
Information Specialists
(ESIP)Scientists
Curriculum Developers Teachers
Decision Analysts
Decision Makers
Reports
From Kim Kastens
Value Chain for Decision Support Systems
Same as for Education
Divide Characterization/Tailoring
DSS-Specific
Processes supported by AQ Cluster

Air Quality “Core” Network
• Core network abides core functionality• Consists of a modest number of stable nodes • Nodes are willing and eager network participants.• Core nodes are connected to produce value through
compound services. • Core robustness arises from redundancy, practice,…
Candidate Nodes:
Unidata
NCDC
HMS
VIEWS
AirNOW
OnEarth
Chem Models

Intellectual Mashup
Meteorologist
Chemists
Health
Remote Sensing
Analytical Monitors
Unidata-Air Pollution

• Decision-Making Groups: – Policy– Management – Public
• Use Cases: – Policy: Hemispheric transport – Management: Smoke Event– Public: Smoke Event
• Infosystem: – Architecture – Engineering– Technology
• GEOSS Support to Air Quality– Data. Services– Sharing/Harvesting Infrastructure– Intellectual Resources
• Air Quality Support to GEOSS– Well-defined Management Structure– Use Cases for GEOSS architecture

GEOSS and National/Local Air Quality Assessment
GEOSS Contr. Local Air Quality BenefitGlobal data, tools => Broader context, cost savings
Global analysis => Spatial context, Characterization
Intellectual Resources => Collaboration, Analysis
Local AQ Contr. GEOSS BenefitLocal data, tools => Enriched global resource pool
Local data analysis => More detail, insights,
Intellectual Resources => Collaboration, Analysis
• The GEOSS view (regional & global) establishes the larger-scale context• ‘Local’ perspective focuses on the specific and detailed characterization of local features
• AQ data analysis needs to be performed at both through GEOSS and national/local programs• GEOSS Information Architecture needs to support Global-local information exchange.
Air Quality Contributions to GEOSS: Use cases for demonstrating GEOSS architecture


![pc pc 2012 - examenbac.com · NS28 / (aq) (s) (s) (aq) 10 —2 + = ] (aq) i 4(aq) mol. L; 1 + = ' (aq) i (aq) 4(aq) 7m +Cu2+ + 4....*àA.Z = 5.1036 F = 9, 65.104 C.mol- —2](https://static.fdocuments.us/doc/165x107/5b9bedcb09d3f29b498bc24a/pc-pc-2012-ns28-aq-s-s-aq-10-2-aq-i-4aq-mol-l-1-.jpg)