SMMT MOTOR INDUSTRY FACTS 2017 · CONTENTS UK AUTOMOTIVE AT A GLANCE 4-5 UK AUTOMOTIVE INDUSTRY 6...
30
SMMT MOTOR INDUSTRY FACTS 2017
Transcript of SMMT MOTOR INDUSTRY FACTS 2017 · CONTENTS UK AUTOMOTIVE AT A GLANCE 4-5 UK AUTOMOTIVE INDUSTRY 6...

SMMT MOTOR INDUSTRY FACTS 2017

WHAT IS SMMT?
The Society of Motor Manufacturers and Traders (SMMT) is one of the largest and most influential trade
associations in the UK. Its resources, reputation and unrivalled automotive data place it at the heart of
the UK automotive industry. It undertakes a variety of activities to support and represent the interests
of the industry and has a long history of achievement.
Working closely with member companies, SMMT acts as the voice of the UK motor industry, supporting
and promoting its interests at home and abroad to government, stakeholders and the media.
SMMT represents more than 700 automotive companies in the UK, providing them with a forum to voice
their views on issues affecting the automotive sector, helping to guide strategies and build positive
relationships with government and regulatory authorities.
To find out how to join SMMT and for more information,
visit www.smmt.co.uk/memberservices or e-mail [email protected]
WH
AT IS SMM
T?
02

CONTENTS
UK AUTOMOTIVE AT A GLANCE 4-5
UK AUTOMOTIVE INDUSTRY 6UK automotive employment 6UK Automotive: background 7
MANUFACTURING 8UK automotive manufacturing 8Global automotive manufacturing 9UK car manufacturing 10UK car exports 11Map: UK automotive manufacturing sites 12–14Commercial vehicles and engines 15UK automotive aftermarket 16
UK AUTOMOTIVE SUPPLY CHAIN 17
REGISTRATIONS 18New car registrations 18Registrations by colour 19 Registrations by sales type 20Registrations by segment 21–23Commercial vehicle registrations 24Global car registrations 25
CONNECTED CARS 26
DIGITALISATION OF AUTOMOTIVE MANUFACTURING 27
VEHICLES ON THE ROAD 28–29
ENVIRONMENT AND AIR QUALITY 30-31
UK AUTOMOTIVE AND THE EU 32
SMMT GROUP 33
CON
TENTS
03

UK AUTOMOTIVE AT A GLANCEU
K AUTO
MO
TIVE AT A GLAN
CE
Suppliers2,500
Commercial vehicle manufacturers
Cars built in 2016
1,722,698
Engines built in 2016
2,545,608
Commercial vehicles built in 2016
93,924
People employed across UK Auto
814,000
Countries importing UK-built vehicles
UK automotive turnover
£77.5 billion
Cars currently on UK roads
Over 34.4 million
Vehicles exported in 2016
1,354,216
New cars registered in 2016
2,692,237
160
Engine manufacturers
05
04

UK AUTOMOTIVE EMPLOYMENTU
K AU
TOM
OTIV
E EMPLO
YMEN
T
25,000new jobs to be
created in automotive manufacturing to
build connected and autonomous vehicles
41,000 people employed
in UK motorsport – 25,000 are engineers
(Motorsport Industry
Association)
169,000people employed in manufacturing
814,000 people employed
across UK Automotive
78,480 young people
began engineering and manufacturing
apprenticeships in 2015/6
(Semta)
06

UK A
UTO
MO
TIVE: B
ACKGR
OU
ND
UK AUTOMOTIVE: BACKGROUND
In 2016 the UK automotive manufacturing industry…
Turned over £77.5 billion
Invested £2.75 billion in R&D
Exported products worth £40.1 billion, accounting for 13% of the UK’s total export goods
Invested £4 billion net capital
Added £22 billion in value to the UK economy
07

UK A
UTO
MO
TIVE M
AN
UFA
CTURIN
GUK AUTOMOTIVE MANUFACTURING
Commercial vehicles by brandMake Volume
Vauxhall 73,615
Leyland Trucks 14,729
Alexander Dennis 2,228
Land Rover 1,820
Dennis Eagle 723
Cars by brandMake Volume
Jaguar Land Rover 544,401
Nissan 507,444
BMW 210,973
Toyota 180,425
Honda 134,146
Cars by modelModel Volume
Nissan Qashqai 309,893
Toyota Auris 144,674
Nissan Juke 109,968
Land Rover Evoque 96,498
Land Rover Discovery Sport 89,004
Top fives in production – 2016
08

GLOB
AL A
UTO
MO
TIVE M
AN
UFA
CTURIN
GGLOBAL AUTOMOTIVE MANUFACTURING
Top 10 European automotive manufacturers in 2016Rank Country Cars Commercial
Vehicles Total % change
1 Germany 5,746,808 315,754 6,062,562 0.50%
2 Spain 2,354,117 531,805 2,885,922 5.60%
3 France 1,626,000 456,000 2,082,000 5.60%
4 UK 1,722,698 93,924 1,816,622 8.00%
5 Czech Rep. 1,344,182 5,714 1,349,896 8.30%
6 Italy 713,182 390,334 1,103,516 8.80%
7 Slovakia 1,040,000 0 1,040,000 0.10%
8 Poland 554,600 127,237 681,837 3.20%
9 Hungary 472,000 0 472,000 -4.70%
10 Belgium 354,003 45,424 399,427 -2.40%
Source: OICA 2017
*See page 12 for 2016 UK car manufacturing data
Top 15 global automotive manufacturers in 2016Rank Country Cars Commercial
vehicles Total % change
1 China 24,420,744 3,698,050 28,118,794 14.50%
2 USA 3,934,357 8,263,780 12,198,137 0.80%
3 Japan 7,873,886 1,330,704 9,204,590 -0.80%
4 Germany 5,746,808 315,754 6,062,562 0.50%
5 India 3,677,605 811,360 4,488,965 7.90%
6 South Korea 3,859,991 368,518 4,228,509 -7.20%
7 Mexico 1,993,168 1,604,294 3,597,462 0.90%
8 Spain 2,354,117 531,805 2,885,922 5.60%
9 Canada 802,057 1,568,214 2,370,271 3.80%
10 Brazil 1,778,464 377,892 2,156,356 -11.20%
11 France 1,626,000 456,000 2,082,000 5.60%
12 Thailand 805,033 1,139,384 1,944,417 1.80%
13 UK 1,722,698 93,924 1,816,622 8.00%14 Turkey 950,888 535,039 1,485,927 9.40%
15 Czech Rep. 1,344,182 5,714 1,349,896 8.30%
09

UK CA
R MA
NU
FACTU
RING
UK CAR MANUFACTURING
10
UK car manufacturing
UK car manufacturing – 2016 vs 20152016 2015 % Change
Total 1,722,698 1,587,677 8.5%
Home 368,482 359,796 2.4%
Export 1,354,216 1,227,881 10.3%
% export 78.8% 77.3%
UK car production reached its HIGHEST LEVEL in
17 years in 2016
2,000,000
1972 2009 2012 2013 2014 2015 20160
1,000,000
500,000
1,500,000
RECO
RD H
IGH
UK CA
R EXPORTS
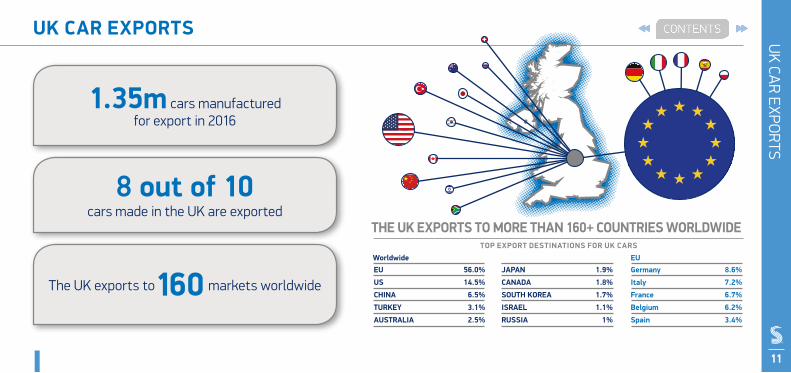
UK CAR EXPORTS
1.35m cars manufactured for export in 2016
8 out of 10 cars made in the UK are exported
The UK exports to 160 markets worldwide
11
TOP EXPORT DESTINATIONS FOR UK CARS
THE UK EXPORTS TO MORE THAN 160+ COUNTRIES WORLDWIDE
EU 56.0%
US 14.5%
CHINA 6.5%
TURKEY 3.1%
AUSTRALIA 2.5%
JAPAN 1.9%
CANADA 1.8%
SOUTH KOREA 1.7%
ISRAEL 1.1%
RUSSIA 1%
Germany 8.6%
Italy 7.2%
France 6.7%
Belgium 6.2%
Spain 3.4%
Worldwide EU

1
2 30 31
7
1220
23
8
99 10
21
5
4
3
14
27
12
13
28
32
29
15
2411
6
25
26
22
1617
1
18
11
19
UK AUTOMOTIVE MANUFACTURINGU
K AU
TOM
OTIV
E MA
NU
FACTU
RING
In 2016 UK automotive manufacturers produced
1,816,622 vehicles
In 2016 2,545,608 engines were built in the UK
There are more than 2,500 automotive component providers
in the UK
Key UK manufacturing sitesKey Manufacturer Location Sector Model
1 Alexander Dennis
Falkirk and Guildford
Bus and coach Enviro bus range
2 Aston Martin Gaydon CarComet, DB9, DB11, Rapide, Vantage, Vanquish.
3 Bentley Crewe Car and engine
Bentayga, Continental and Mulsanne
4 BMW Hams Hall Engine Engine range
5 Caterham Dartford Car Seven
6 Cummins Darlington Engine Engine range
7 Dennis Eagle Warwick CV N and W truck range
8 Euromotive Hythe Bus and coach Minibus range
9 Ford Bridgend and Dagenham Engine Engine range
10 Honda Swindon Car and engine Civic, CR-V and Jazz
11 Infiniti Sunderland Car Infiniti Q30
12 Jaguar Land Rover
Castle Bromwich & Wolver-hampton
Car and engine
Engine range Jaguar: F-Pace F-Type, XE, XJ and XF
13Jaguar Land Rover
Solihull and Halewood Car
Land Rover: Discovery, Discovery Sport, Range Rover, Range Rover Sport, and Evoque.
14John Dennis Coachbuilders
Guildford Bus and coach Fire vehicles
15 Leyland Trucks Leyland CV DAF CF, LF and XF truck range
16 Lotus Norwich Car Elise, Evora and Exige
17 LTC Coventry CV TX Taxi
18 McLaren Automotive Woking Car 540, 570, 650, 675
and P1
19 Mellor Rochdale Bus and coach
Accessible coach range
20 MG Motors Longbridge Car MG3 and MG GS
21 MINI Oxford Car
MINI 3-Door Hatch, MINI 5-Door Hatch, MINI Convertible, MINI Clubman, MINI Coupé, and MINI Roadster
22 Minibus Options Whaley Bridge Bus and
coach Minibus range
23 Morgan Malvern Car
Aero, Aero Supersport, Aero Coupe, 4/4, Plus 4, Plus 8, Roadster, 4 Seater and 3 Wheeler
24 Nissan Sunderland Car and engine
Juke, LEAF, Note and Qashqai, Infiniti Q30
25 Optare Leeds Bus and coach
Solo, Tempo and Versa bus range
26 Plaxton Scarborough Bus and coach
Cheetah, Elite, Panther, Paragon coach bodies and Enviro bus range
27 Rolls-Royce Goodwood Car Ghost, Phantom and Wraith
28 Toyota Burnaston Car and engine Auris and Avensis
29 Vauxhall Ellesmere Port
Car, CV and bus and coach
Astra 5-Door HatchAstra Sports Tourer
30 Vauxhall Luton CV Vivaro van
31 Warnerbus Dunstable Bus and coach Minibus range
32 Wrightbus Ballymena (NI) Bus and coach Bus range
14
13
12

2016 2015 % Change
Total 93,924 94,479 -0.6%
Home 39,102 47,300 -17.3%
Export 54,842 47,179 16.2%
% export 58.4% 49.9%
201388,110
201470,869
201594,479
201693,924
CV AN
D EN
GINE M
AN
UFA
CTURIN
GCV AND ENGINE MANUFACTURING
UK Commercial Vehicle manufacturing volumes:2013 to 2016
UK Commercial Vehicle manufacturing – 2016 vs 2015
15
UK engine manufacturing volumes – 2016
2,545,608 engines
built in 2016
10.1%
0.5%
25.9%
30.7%
5.2%
7.9%
9.4%
10.4%
JaguarLand Rover Toyota
NissanHondaFord (Bridgend)
Ford (Dagenham)BMW
Bentley

UK A
UTO
MO
TIVE A
FTERM
AR
KE
TUK AUTOMOTIVE AFTERMARKET
£12.5 billion contribution to UK economy
347,000 jobs supported
£706.71average annual spend per car
£21.6 billion revenue of UK a�ermarket
Services more than
30 millionvehicles a year
The Importance of the Aftermarket to the UK Economy
16Source: Frost & Sullivan

UK A
UTO
MO
TIVE SU
PPLY CHA
INUK AUTOMOTIVE SUPPLY CHAIN
BODY PAINT POWERTRAIN ASSEMBLY INSPECTION
£4bn of unfulfilled opportunities for
domestic Tier 1 suppliers
18 of the world’s 20 biggest
automotive suppliers have a UK base
44% average UK content in British-built
cars – up from 36% since 2011 78,000 people
employed in the UK supply chain
£4.3bn added value generated by
UK automotive suppliers each year
17
2,500+ automotive
suppliers in the UK

REGISTRATIO
NS
NEW CAR REGISTRATIONS
Model Volume
1 Ford Fiesta 120,525
2 Vauxhall Corsa 77,110
3 Ford Focus 70,545
4 Volkswagen Golf 69,492
5 Nissan Qashqai 62,682
6 Vauxhall Astra 60,719
7 Volkswagen Polo 54,448
8 MINI 48,328
9 Mercedes-Benz C Class 44,184
10 Audi A3 43,808
3,000,000
’00 ’01 ’02 ’03 ’04 ’05 ’06 ’07 ’08 ’09 ’10 ’11 ’12 ’13 ’14 ’150
2,000,000
1,500,000
1,000,000
500,000
2,500,000
’16
2,692,786
Annual New Car Registrations – 2000 to 2016
Top 10 UK sellers in 2016
18
New car registrations by fuel type – 2016 vs 2007
2007
2016
1,285,160
1,318,707
88,919
16,641
DIES
ELPE
TROL
AFV
DIES
ELPE
TROL
AFV
967,413
1,419,953

REGISTRATIO
NS BY CO
LOU
RREGISTRATIONS BY COLOUR
Changing tastes in car colour: Top 5 1996-2016
19
The change in segment registrations – 2016 vs 2006
MINI +228.9%
UPPER MEDIUM-34.8%
SPECIALIST SPORTS -23.5%
SUPER MINI +15.8%
EXECUTIVE +27.4%
DUAL PURPOSE +149.1%
LOWER MEDIUM+5.8%
LUXURY SALOON -20.6%
MULTI PURPOSE+0.5%
1
2
34
5
1996
1997
1998
1999
2000
2001
2002
2003
2004
2005
2006
2007
2008
2009
2010
2011
2012
2013
2014
2015
2016

REGISTR
ATION
S BY SA
LES TYPEREGISTRATIONS BY SALES TYPE
FleetModel Volume
Ford Fiesta 46,840
Volkswagen Golf 43,393
Vauxhall Astra 43,144
Ford Focus 43,037
Nissan Qashqai 36,381
PrivateModel Volume
Ford Fiesta 73,684
Volkswagen Polo 37,362
Vauxhall Corsa 32,072
MINI 28,483
Ford Focus 27,505
Top five new car registrations in 2016 by sales type
BusinessModel Volume
Vauxhall Corsa 15,373
Vauxhall Viva 7,840
Vauxhall Astra 5,881
Mitsubishi Outlander 3,919
Nissan Note 3,497Business
3.9%
51.3%
44.8%
2016 registrations by sales type
Business If the vehicle is being registered by a company that operates up to 24 vehicles, it is designated a business sale. This includes dealer demonstrators.
Fleet If the vehicle is being registered by a company that operates a fleet of 25 or more vehicles, it is designated a fleet sale. This includes dealer demonstrators and Motability-leased vehicles. Private If the vehicle is being registered primarily for the personal use of a private individual, it is designated a private sale.
20
Fleet
Private

REGISTR
ATION
S BY SEGM
ENT
REGISTRATIONS BY SEGMENT
Supermini
Lower M
edium
Model Volume Segment share
Hyundai i10 23,657 30.9%
Vauxhall Viva 14,297 18.7%
Volkswagen up! 13,245 17.3%
Suzuki Celerio 8,420 11.0%
Skoda Citigo 8,140 10.6%
Segment total: 76,616
Model Volume Segment share
Ford Fiesta 120,525 13.8%
Vauxhall Corsa 77,110 8.8%
Volkswagen Polo 54,448 6.2%
MINI 48,328 5.5%
Nissan Juke 38,803 4.5%
Segment total: 872,936
Model Volume Segment share
Ford Focus 70,545 9.6%
Volkswagen Golf 69,492 9.5%
Nissan Qashqai 62,682 8.5%
Vauxhall Astra 60,719 8.3%
Audi A3 43,806 6.0%
Segment total: 734,825
Mini
Top cars registered by segment
21

REGISTRATIONS BY SEGMENTR
EGISTRATIO
NS B
Y SEGMEN
T
Top cars registered by segment
Model Volume Segment share
Mercedes-Benz C Class 44,184 34.6%
Mercedes-Benz E Class 25,537 12.0%
BMW 5 Series 19,621 15.4%
Audi A6 18,698 14.6%
Jaguar XF 9,619 7.5%
Segment total: 127,804
Executive
Model Volume Segment share
BMW 3 Series 36,732 14.3%
Audi A4 26,686 10.4%
Vauxhall Insignia 25,095 9.8%
BMW 4 Series 23,479 9.1%
Skoda Octavia 23,068 9.0%
Segment total: 256,924
Upper M
edium
Model Volume Segment share
Mercedes-Benz S Class 3,339 31.8%
BMW 7 Series 2,076 19.8%
Jaguar XJ 1,206 11.5%
Audi A8 1,060 10.1%
Bentley Continental 1,033 9.8%
Segment total: 10,500
Luxury
22

REGISTR
ATION
S BY SEGM
ENT
REGISTRATIONS BY SEGMENT
Top cars registered by segment
Specialist Sports
Dual Purpose
MPV
23
Model Volume Segment share
Audi TT 9,836 19.8%
Volkswagen Scirocco 5,729 11.5%
Mazda MX-5 4,229 8.5%
Ford Mustang 3,257 6.5%
Other British 2,593 5.2%
Segment total: 49,774
Model Volume Segment share
Kia Sportage 40,083 9.2%
Ford Kuga 35,481 8.1%
Range Rover Evoque 27,161 6.2%
Hyundai Tucson 25,242 5.8%
Land Rover Discovery Sport 23,796 5.4%
Segment total: 437,931
Model Volume Segment share
Ford C-MAX 18,196 14.5%
Citroen C4 Picasso 15,773 12.6%
Vauxhall Zafira Tourer 12,444 9.9%
Ford S-MAX 7,794 6.2%
Ford B-MAX 7,468 6.0%
Segment total: 125,476

COM
MER
CIAL V
EHICLE R
EGISTRATIO
NS
COMMERCIAL VEHICLE REGISTRATIONS
Van registrations – 2010 to 2016 2016 commercial vehicle registrations
LCVs up to 3.5t Rigids Artics Bus and coach
Volume 375,687 26,882 19,346 8,779
% change on 2015
1.0% 17.0% -7.5% 8.0%
0
100,000
200,000
300,000
400,000375,687
20142013201220112010 2015 2016
19.6%
16.7%-7.9%
13.1%
18.7%
15.6% 1.0%
430,694 commercial vehicles
were registered in 2016
24

Country Volume
China 24,376,902
EU28 17,291,819
US 6,872,729
Japan 4,146,459
Germany 3,351,607
India 2,966,637
UK 2,692,786
France 2,015,177
Italy 1,824,968
Brazil 1,676,722
South Korea 1,533,813
Iran 1,320,300
GLOB
AL CA
R REGISTR
ATION
SGLOBAL CAR REGISTRATIONS
Source: OICA 2017 Figures include passenger cars only. LCVs (including pick-ups) are not included and may represent significant sales volumes in some markets
International new car registrations – 2016
69,464,432
new cars were registered globally in 2016
25

£51 BillionValue added annually
(at 2014 prices)
Top 5 benefits of CAVs
• Reduced stress of driving• Ability to rest on longer journeys• Fewer accidents• Lower insurance costs• Ability to travel at preferred times
320,000Additional jobs created
25,000Jobs in automotive
manufacturing created
2,500Lives saved
6/10 people*with limited mobility will have
an improved quality of life*when surveyed
1 millionmore people with access
to further education
25,000Serious accidents prevented
CONNECTED CARSCO
NN
ECTED CA
RS
UK social and economic impact of connected and autonomous vehicles
26

DIGITA
LISATION
OF M
AN
UFA
CTURIN
GDIGITALISATION OF AUTOMOTIVE MANUFACTURING
27
MACHINE DOWNTIMEREDUCED BY UP TO
40%
TIME TO MARKETREDUCED BY UP TO
30%
REDUCED PARTS INVENTORY BY UP TO
30%
INCREASED PRODUCTIVITY BY UP TO
5%
TOTAL CUMULATIVE ECONOMIC BENEFIT BY 2035
£74 billion
BENEFIT TO WIDER ECONOMY
£1.7 billion
BENEFIT TO VEHICLE MANUFACTURERS
£4.3 billion
BENEFIT TO SUPPLIERS
£2.6 billion

VEHICLES ON THE ROADV
EHICLES O
N TH
E RO
AD
2.5% 4.3% -0.5%2.4%
VANS4,178,733 BUS & COACH
87,778
TRUCKS595,542
CARS34,378,386
Year Cars (millions)
2006 30.8
2007 31.1
2008 31.3
2009 31.0
2010 31.3
2011 31.4
2012 31.5
2013 31.9
2014 32.6
2015 33.5
2016 34.4
28
29
39,240,439 vehicles on UK roads
There are
69,755plug-in cars in
the UK
More than
8 million
used cars were sold in 2016
A UK RECORD
The Cotswolds and
Peterborough have the highest
proportion of
plug-in cars at 1.8%
The average car on
the road in the UK is
silver from the
Supermini segment and
7.8 years old

ENVIRONMENT – CO2EN
VIRO
NM
ENT
Emissions reduction
CO2 emissions from all cars in use
-7.6%
2015
2000
69
75
Mt CO2
-8.9%
CO2 emissions from all cars in use
-7.6%
2015
2000
69
75
Mt CO2
-8.9%
A new car in 2016
is typically
19.5% more fuel-efficient
than one bought in 2010
30

ENVIR
ON
MEN
TENVIRONMENT – AIR QUALITY
A Euro-VI bus emits
95% less NOx on the road than a
Euro-V busSource: Transport for London
0.5 g/km 0.08 g/km
Reduction in diesel car NOx emissions
31

UK AUTOMOTIVE AND THE EUU
K AU
TOM
OTIV
E AN
D TH
E EU
32
AT LEAST
10% OF PEOPLE
EMPLOYED IN THE UK
AUTOMOTIVE MANUFACTURING
SECTOR ARE FROM
ELSEWHERE IN THE EU
£2.7bnCOST
ON IMPORTScar imports from the EU only
WTOWORLD TRADE ORGANISATION
ON EXPORTS
£1.8bnCOST
car exports to the EU only
WTOWORLD TRADE ORGANISATION
The European automotive industry is deeply integrated with:
69% of UK car imports coming
from the EU
56% of UK car exports heading to the EU
79% of imported components
coming from the EU
65% of British-built components
exported to the EU

SMMT Industry ForumIndustry Forum was formed
in 1994, initially as a unique
collaboration between leading
vehicle manufacturers, SMMT
and government to improve the
performance and competitiveness of
the UK’s automotive supply chain.
Continued measurable success has led to
sustained growth into many other sectors including
aerospace, construction, domestic appliances,
electronics and food. Industry Forum now provides
support to blue chip organisations in more than 30
countries across five continents.
www.industryforum.co.uk
The Motor OmbudsmanThe Motor Ombudsman is the
automotive dispute resolution
body. Fully-impartial, it is the
first ombudsman to be focused
solely on the automotive
sector, and self-regulates
the UK’s motor industry through its comprehensive
Motor Industry Codes of Practice which have each
been approved by the Chartered Trading Standards
Institute’s Consumer Codes Approval Scheme (CCAS).
www.themotorombudsman.org
SMM
T GROU
PSMMT GROUP
33
DIS C L A IM E R
This publication contains general in for mat ion
a n d , a lt h o u g h S M M T endeavours to ensure
that the content is accurate and up-to-date
at the date of publication, no representation
or warranty, express or implied, is made as to
its accuracy or completeness and therefore
the infor mat ion in th is publ icat ion should
not be rel ied upon. Readers should always
seek appropr iate ad v ice f rom a su it ably
qualif ied expert before taking, or refraining
f rom tak ing, any ac t ion . The content s of
th is publ icat ion should not be constr ued
as advice or guidance and SMMT disclaims
l iabil i t y for any loss, howsoever caused,
ar is ing direc tly or indirec tly f rom rel iance
on the information in this publicat ion. Any
use of data should be credited to SMMT.

THE SOCIETY OF MOTOR MANUFACTURERS AND TRADERS LIMITED71 Great Peter Street, London, SW1P 2BNTel: +44 (0)20 7235 7000E-mail: [email protected]
:@SMMT :SMMT
www.smmt.co.uk
July 2017