Smile Survey 2020 - Department of Public Health
48
The Oral Health of Los Angeles County’s Children DECEMBER 2020 LOS ANGELES COUNTY DEPARTMENT OF PUBLIC HEALTH ð ORAL HEALTH PROGRAM Smile Survey2020
Transcript of Smile Survey 2020 - Department of Public Health

The Oral Health of Los Angeles County’s Children
DECEMBER 2020
LOS ANGELES COUNTY DEPARTMENT OF PUBLIC HEALTH ð ORAL HEALTH PROGRAM
Smile Survey�2020
SMILE SURVEY 2020
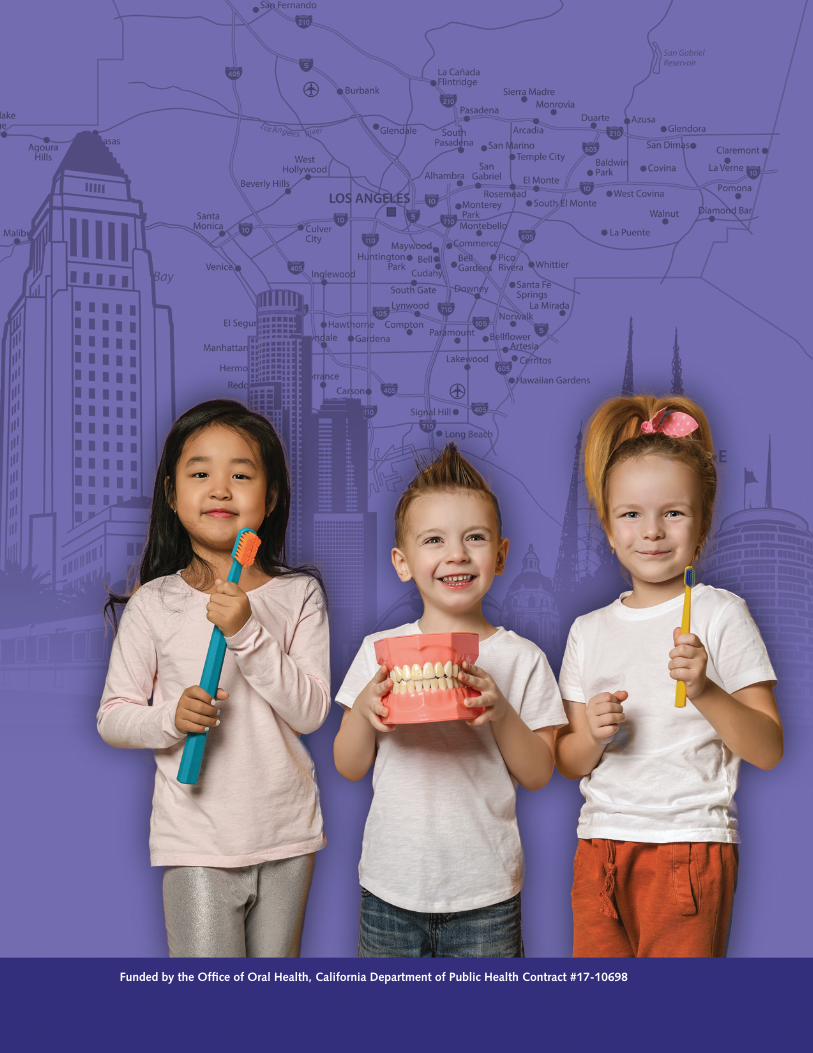
Funded by the Office of Oral Health, California Department of Public Health Contract #17-10698
ORAL HEALTH OF LOS ANGELES COUNTY’S CHILDREN i
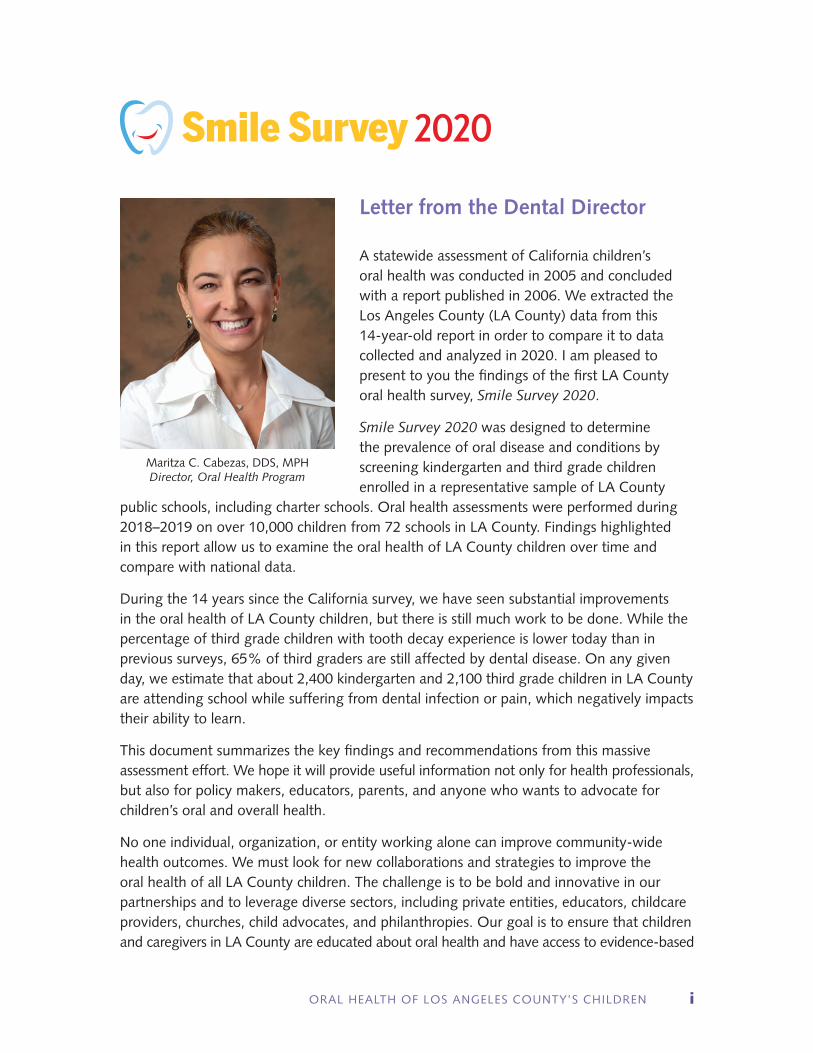
Letter from the Dental Director
A statewide assessment of California children’s oral health was conducted in 2005 and concluded with a report published in 2006. We extracted the Los Angeles County (LA County) data from this 14-year-old report in order to compare it to data collected and analyzed in 2020. I am pleased to present to you the findings of the first LA County oral health survey, Smile Survey 2020.
Smile Survey 2020 was designed to determine the prevalence of oral disease and conditions by screening kindergarten and third grade children enrolled in a representative sample of LA County
public schools, including charter schools. Oral health assessments were performed during 2018–2019 on over 10,000 children from 72 schools in LA County. Findings highlighted in this report allow us to examine the oral health of LA County children over time and compare with national data.
During the 14 years since the California survey, we have seen substantial improvements in the oral health of LA County children, but there is still much work to be done. While the percentage of third grade children with tooth decay experience is lower today than in previous surveys, 65% of third graders are still affected by dental disease. On any given day, we estimate that about 2,400 kindergarten and 2,100 third grade children in LA County are attending school while suffering from dental infection or pain, which negatively impacts their ability to learn.
This document summarizes the key findings and recommendations from this massive assessment effort. We hope it will provide useful information not only for health professionals, but also for policy makers, educators, parents, and anyone who wants to advocate for children’s oral and overall health.
No one individual, organization, or entity working alone can improve community-wide health outcomes. We must look for new collaborations and strategies to improve the oral health of all LA County children. The challenge is to be bold and innovative in our partnerships and to leverage diverse sectors, including private entities, educators, childcare providers, churches, child advocates, and philanthropies. Our goal is to ensure that children and caregivers in LA County are educated about oral health and have access to evidence-based
Smile Survey 2020
Maritza C. Cabezas, DDS, MPHDirector, Oral Health Program
SMILE SURVEY 2020ii
dental care and oral health information. We believe that the well-being of our children is key to the success of families, communities, and businesses.
This project could not have been completed without the financial support generated by the California Healthcare, Research and Prevention Tobacco Tax Act of 2016 (Proposition 56). These data will guide all aspects of the decision-making process regarding oral health. I am also grateful for the support of the Los Angeles County Board of Supervisors; Dr. Barbara Ferrer, Los Angeles County Department of Public Health Director; Dr. Jayanth Kumar, California Department of Public Health Dental Director; and the many partners who collaborated on the development of this survey.
We hope that these findings will cause a ripple effect that leads to stronger policies, more robust school and community programs, and collaborative efforts to reduce oral health disparities and the number of children suffering from tooth decay.
Our children depend on us to make a difference.
Maritza C. Cabezas, DDS, MPH
Director, Oral Health ProgramDepartment of Public HealthLos Angeles County
ORAL HEALTH OF LOS ANGELES COUNTY’S CHILDREN iii
i Letter from the Dental Director
iv Definitions
1 Executive Summary
5 Importance of Oral Health and Starting Prevention Early in Life
11 Key Finding 1: The oral health of Los Angeles County’s children has improved.
13 Key Finding 2: Despite improvements in the oral health of
Los Angeles County’s children, disparities persist.
17 Key Finding 3: By the time Los Angeles County’s children enter kindergarten, almost half have experienced tooth decay.
19 Key Finding 4: Too few children are protected by dental sealants—a safe,
simple, cost effective way to prevent decay in molar teeth.
21 Key Finding 5: Some children in Los Angeles County experience severe tooth decay.
23 Strategic Priorities to Improve Oral Health
27 Survey Methods
29 References
30 Results-at-a-Glance
32 Data Tables
37 Acknowledgments
39 Participating Schools
40 Appendix: Service Planning Area Map
Smile Survey 2020
Contents
SMILE SURVEY 2020iv
definitions
Decay experience: Decay experience means that a child has had tooth decay at some point during his or her lifetime. Decay experience can include evidence of past treatment (e.g., fillings, crowns, or teeth that have been extracted because of decay) or evidence of untreated decay at the present time (e.g., untreated cavities).
Dental sealants: Dental sealants are plastic-like coatings that are applied to the chewing surfaces of teeth with pits and fissures (grooves). The applied sealant bonds to tooth structure and fills the grooves of teeth to form a protective barrier to decay.
Socioeconomically disadvantaged (SED): Children identified as being a migrant, a foster child, or homeless at any time during the academic year; being eligible for the National School Lunch Program at any time during the academic year; or having parents who did not receive a high school diploma.
Untreated decay: Untreated decay is defined as evidence of tooth decay (e.g., one or more cavities) that has not received treatment.
Urgent need for dental care: The child had a toothache, infection and/or swelling (abscess) at the time of the dental screening.
ORAL HEALTH OF LOS ANGELES COUNTY’S CHILDREN 1
With Smile Survey 2020, the Los Angeles County Department of Public Health Oral Health Program takes an in-depth look at the oral health of elementary school children in Los Angeles County (LA County). From October 2018 to November 2019, Smile Survey 2020 screened 10,489 children (5,897 kindergartners and 4,592 third graders) in a representative sample of 72 public elementary schools. This report highlights five key findings from the survey and calls for concerted strategic actions to further improve the oral health of LA County children and reduce oral health disparities.
In order to assess trends, we compared LA County data from a 2005 statewide oral health survey with Smile Survey 2020 to answer the question: What progress has LA County made in the intervening years? In the past 14 years, we have made significant progress. The percentage of LA County kindergartners and third graders with evidence of current or previous tooth decay has decreased from 66% to 55% — a relative improvement of 17%. Similarly, the percentage of children with untreated decay decreased from 26% to 20% — a relative improvement of 23%. The proportion of third grade children with at least one protective dental sealant has increased from 21% to 31% — a relative improvement of 48%.
Despite these improvements, tooth decay continues to be a common problem for LA County children, especially for socioeconomically disadvantaged children and for Asian, Black/African American, and Latinx children. Socioeconomically disadvantaged children are almost twice as likely to have tooth decay experience, and are more likely to have untreated decay compared to those who are not socioeconomically disadvantaged. Nearly two out of three Latinx children and more than one out of two Black/African American and Asian children have decay experience, substantially higher rates than for White children (32%). Untreated decay is more common among Black/African American and Latinx children (23% and 21%, respectively) than among White children (14%).
Taken together, these findings demonstrate substantial progress toward improving the oral health of LA County children, but at the same time underscore the need for new strategic targeted initiatives to accelerate future improvements and reduce disparities. Oral health disparities are caused by a variety of underlying societal conditions. To address these disparities, we need to consider changes to systems and policies that will enable families to have access to needed dental care and the opportunity to engage in healthy habits. Key findings from Smile Survey 2020 will help us identify and prioritize where future efforts and resources should be focused and will serve as benchmarks for assessing the effectiveness of future initiatives.
Smile Survey 2020
Executive Summary
SMILE SURVEY 20202
Several key strategies have been identified to improve the oral health of children in LA County. These strategies are grouped into three general categories: community-based prevention programs, screening and referral services, and restorative dental care. Teeth develop before birth and start to appear in the mouth when a child is about 6 months of age. Therefore, the strategies listed below include efforts to prevent tooth decay starting from the prenatal period and continuing throughout childhood.
COMMUNITY-BASED PREVENTION PROGRAMS
ð Incorporate oral health promotion and preventive services, such as parental education and fluoride varnish, into well-child visits; Women, Infants, Children (WIC); Early Head Start; Head Start; and other early childhood programs geared toward children 0–5 years of age.
ð Expand school-based oral health prevention programs at schools that serve children at greatest risk to include, at a minimum, the placement of dental sealants, the application of topical fluorides, and oral health education.
ð Conduct ongoing and targeted educational campaigns to 1) encourage the first dental visit by age 1; 2) increase oral health literacy and awareness; 3) promote the importance of oral health as part of general health and well-being; and 4) promote the benefits of water fluoridation and other fluorides for the reduction of dental disease.
SCREENING AND REFERRAL SERVICES
ð Expand oral health screening and referral services in programs/schools that serve children at greatest risk to help assure that all children receive their required kindergarten oral health assessment.
ð Expand case management systems that help parents navigate the complex dental care delivery and payment system to assure that children obtain the dental care they need.
RESTORATIVE DENTAL CARE
ð Increase Medi-Cal Dental participation among private dentists by actively assessing enrollment and utilization data.
ð Advocate for the expansion of dental services that target high-risk populations.
Executive Summary (continued)
Key Findings
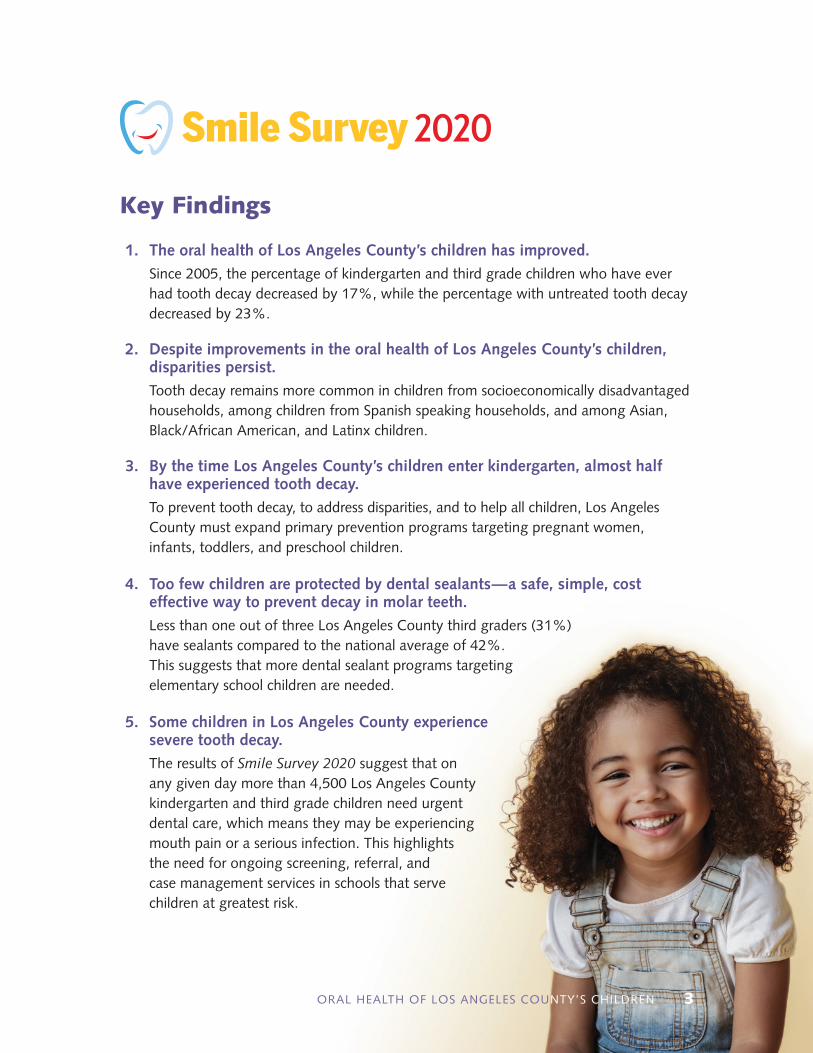
1. The oral health of Los Angeles County’s children has improved. Since 2005, the percentage of kindergarten and third grade children who have ever
had tooth decay decreased by 17%, while the percentage with untreated tooth decay decreased by 23%.
2. Despite improvements in the oral health of Los Angeles County’s children, disparities persist.
Tooth decay remains more common in children from socioeconomically disadvantaged households, among children from Spanish speaking households, and among Asian, Black/African American, and Latinx children.
3. By the time Los Angeles County’s children enter kindergarten, almost half have experienced tooth decay.
To prevent tooth decay, to address disparities, and to help all children, Los Angeles County must expand primary prevention programs targeting pregnant women, infants, toddlers, and preschool children.
4. Too few children are protected by dental sealants — a safe, simple, cost effective way to prevent decay in molar teeth.
Less than one out of three Los Angeles County third graders (31%) have sealants compared to the national average of 42%. This suggests that more dental sealant programs targeting elementary school children are needed.
5. Some children in Los Angeles County experience severe tooth decay.
The results of Smile Survey 2020 suggest that on any given day more than 4,500 Los Angeles County kindergarten and third grade children need urgent dental care, which means they may be experiencing mouth pain or a serious infection. This highlights the need for ongoing screening, referral, and case management services in schools that serve children at greatest risk.
1
2
3
4
5
Smile Survey 2020
ORAL HEALTH OF LOS ANGELES COUNTY’S CHILDREN 3
SMILE SURVEY 20204
Children with poor oral health miss more school and receive lower grades than those with better oral health.
“”
The Importance of Oral Health and Starting Prevention Early in Life
Smile Survey 2020
ORAL HEALTH OF LOS ANGELES COUNTY’S CHILDREN 5
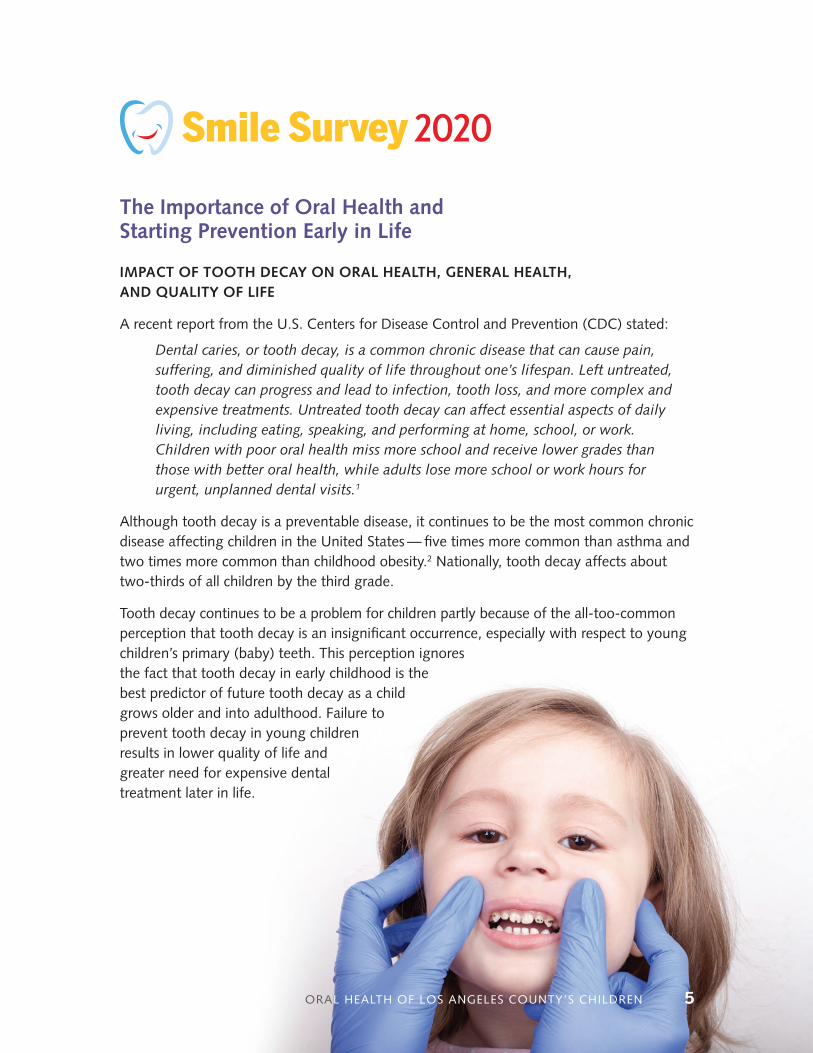
IMPACT OF TOOTH DECAY ON ORAL HEALTH, GENERAL HEALTH, AND QUALITY OF LIFE
A recent report from the U.S. Centers for Disease Control and Prevention (CDC) stated:
Dental caries, or tooth decay, is a common chronic disease that can cause pain, suffering, and diminished quality of life throughout one’s lifespan. Left untreated, tooth decay can progress and lead to infection, tooth loss, and more complex and expensive treatments. Untreated tooth decay can affect essential aspects of daily living, including eating, speaking, and performing at home, school, or work. Children with poor oral health miss more school and receive lower grades than those with better oral health, while adults lose more school or work hours for urgent, unplanned dental visits.1
Although tooth decay is a preventable disease, it continues to be the most common chronic disease affecting children in the United States — five times more common than asthma and two times more common than childhood obesity.2 Nationally, tooth decay affects about two-thirds of all children by the third grade.
Tooth decay continues to be a problem for children partly because of the all-too-common perception that tooth decay is an insignificant occurrence, especially with respect to young children’s primary (baby) teeth. This perception ignores the fact that tooth decay in early childhood is the best predictor of future tooth decay as a child grows older and into adulthood. Failure to prevent tooth decay in young children results in lower quality of life and greater need for expensive dental treatment later in life.
SMILE SURVEY 20206
If left untreated, tooth decay has significant consequences for children, their families, and society including:3
ð Pain: Tooth decay can cause acute or chronic pain. Many children are not aware that teeth are not supposed to hurt.
ð Infection: Infected teeth are reservoirs of bacteria that flood the rest of the body, leaving children prone to many other childhood infections, such as ear and sinus infections. Development of secondary infections, in more severe cases, may require emergency care or hospitalization.
ð Nutrition Problems: Chronically painful and infected teeth make chewing and swallowing uncomfortable and difficult. Children with dental disease may not get the nutrition they need to grow.
ð Tooth and Space Loss: Chronic childhood tooth decay often results in the early loss of “baby” teeth. This can result in space loss due to movement of remaining teeth, leaving insufficient room for the adult teeth to come into the mouth.
ð Attention Problems: Children with infected and painful teeth have a hard time relaxing, sitting still, and paying attention in class.
ð Missed School Days: Children with infected and painful teeth miss more school days than other children, disrupting their educational and social experiences. In Los Angeles County, a study of children from schools in lower-income communities found that students with a toothache in the past six months were more than five times more likely to miss school compared to students without toothaches.4
ð Increased Cost of Dental Care: As tooth destruction progresses, the treatment costs for families and the public increase considerably.
Tooth decay in children destroys more than just a smile. Untreated decay compromises the child’s ability to eat well, sleep well, and function well at home and at school. In addition, the unpleasant appearance of untreated decay can compromise a child’s self-esteem and social development. Untreated tooth decay in children can be painful and without appropriate treatment can lead to infection of the teeth and gums. Although rare, infections due to untreated tooth decay can lead to severe illness and even death.
Importance of Oral Health and Prevention (continued)
ORAL HEALTH OF LOS ANGELES COUNTY’S CHILDREN 7
PREVENTING TOOTH DECAY USING CURRENT EVIDENCE AND NEW STRATEGIES
Most tooth decay is preventable. A broad body of scientific evidence has documented the positive effects of many strategies in reducing the onset, progression, and severity of tooth decay. Evidence-based strategies for preventing tooth decay in children include:
ð Brushing with Fluoride Toothpaste: Brushing with fluoride toothpaste twice a day as soon as teeth appear in the mouth helps prevent tooth decay. Children less than 8 years old generally need be supervised or have their teeth brushed by a parent or caregiver.
ð Fluoride Varnish: Application of fluoride varnish twice a year to the teeth of all infants and children, and more frequently for children at higher risk for dental decay, starting when the first tooth comes into the mouth at about 6 months of age, has been shown to prevent tooth decay. Fluoride varnish can be applied at medical and dental clinics and in community settings, such as schools or in Head Start and WIC programs.
ð Community Water Fluoridation: Water fluoridation has been shown to be a safe, cost effective way to prevent tooth decay in both children and adults. Many, though not all, areas of Los Angeles County receive tap water that contains fluoride.
ð Good Eating Habits: Limiting food and drinks with added sugars will help prevent tooth decay and other chronic diseases and conditions, such as obesity and diabetes.
ð Early and Regular Dental Visits: All children should have their first dental visit between 6 months of age, when their first teeth usually come in, and their first birthday to establish a dental home. Following that initial visit, most children should have a dental examination at least once a year; some high-risk children may need more frequent examinations.
ð Dental Sealants: Dental sealants are placed to protect the chewing surfaces of permanent molars soon after they come into the mouth around age 6 (first molars) and age 12 (second molars).
ð Improved Family Oral Health: Decreasing dental disease among a child’s caregivers benefits the oral health of the child and other family members. Routine oral health care and early education regarding infant oral health for pregnant women can help reduce dental disease in both mothers and children.
SMILE SURVEY 20208
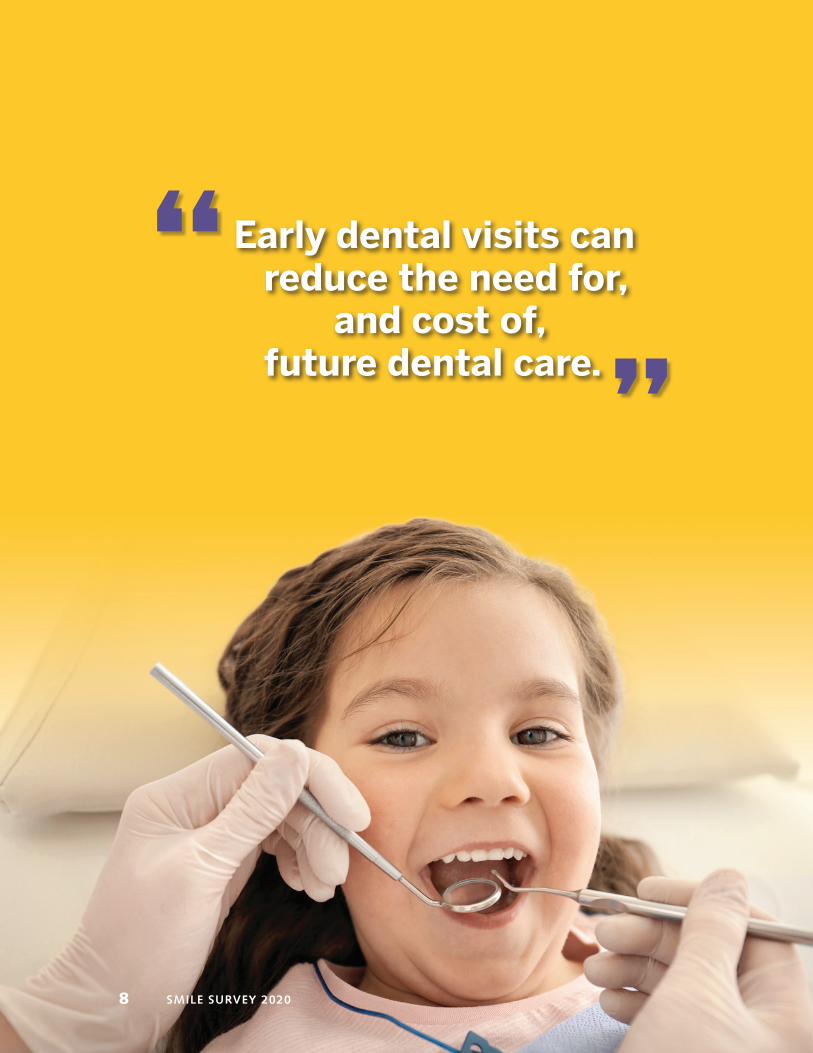
Early dental visits can reduce the need for, and cost of, future dental care.
“”

Preventing tooth decay keeps a child from having costly dental care, which means that avoiding cavities saves money for both the family and society. Annual spending on dental care in the U.S. is well over $100 billion, accounting for almost 20% of children’s overall health spending.5 Medicaid-enrolled children who received their first preventive dental visit by age 1 had 40% lower dental care costs over five years than children who received their first preventive visit at a later age.6 This highlights the fact that early dental visits can reduce the need for, and cost of, future dental care.
Like many other diseases that start in childhood, such as diabetes and obesity, tooth decay is a chronic disease. Approaches to preventing or managing chronic diseases rely on strategies that focus on healthy habits — eating healthy foods, limiting sugar-containing foods and drinks, and in the case of tooth decay, daily brushing with fluoride toothpaste. Because of this, community programs that regularly engage with high-risk children and families (e.g., Head Start, WIC, schools, etc.) play a vital role in addressing chronic diseases, including tooth decay, by addressing the underlying conditions that cause disparities and helping children get off to a healthy start in life.
Health literacy is another critical factor in strategies to improve the health of children. More must be done to educate children and parents about the causes of tooth decay and ways to reduce its negative impacts. Culturally sensitive health education campaigns, which have been shown to be effective in improving health literacy and reducing levels of chronic diseases, could help reduce tooth decay in those who are at greatest risk.
In summary, early dental care plus regular and consistent prevention are key to improving the oral health and overall health of children in Los Angeles County. There is no better investment in the future than supporting the health and well-being of our children.
ORAL HEALTH OF LOS ANGELES COUNTY’S CHILDREN 9
Importance of Oral Health and Prevention (continued)

SMILE SURVEY 202010
ORAL HEALTH OF LOS ANGELES COUNTY’S CHILDREN 11
Key Finding 1
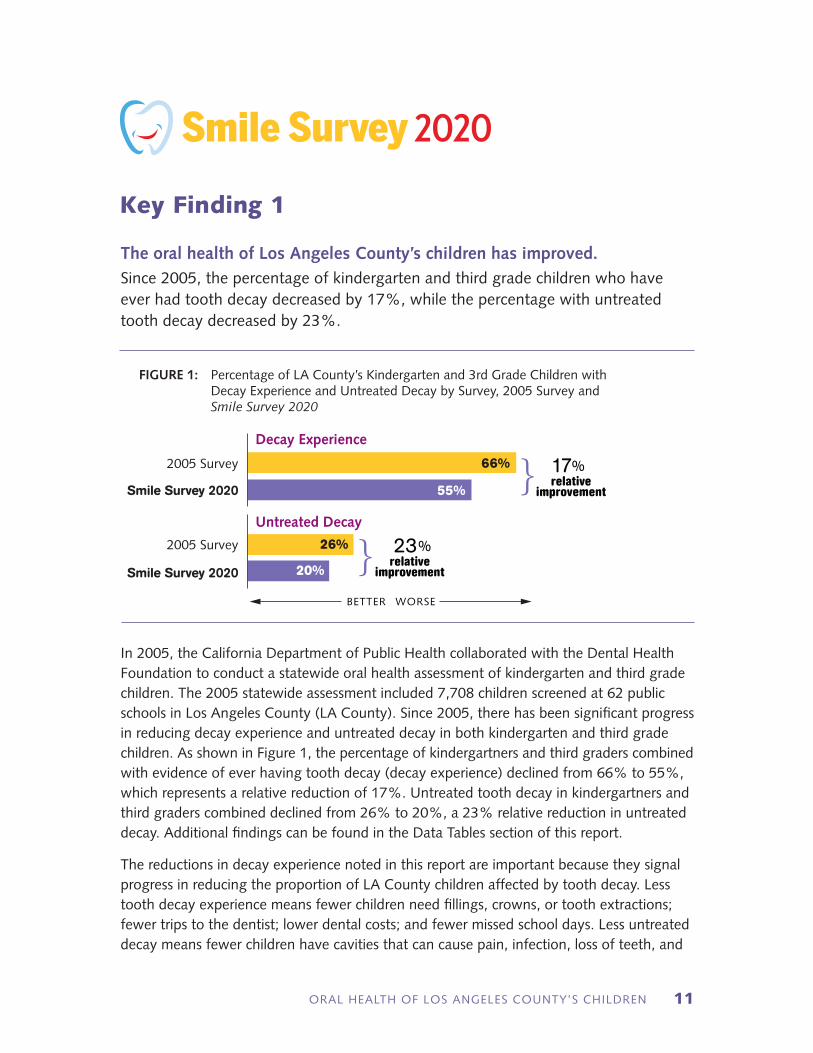
The oral health of Los Angeles County’s children has improved. Since 2005, the percentage of kindergarten and third grade children who have ever had tooth decay decreased by 17%, while the percentage with untreated tooth decay decreased by 23%.
In 2005, the California Department of Public Health collaborated with the Dental Health Foundation to conduct a statewide oral health assessment of kindergarten and third grade children. The 2005 statewide assessment included 7,708 children screened at 62 public schools in Los Angeles County (LA County). Since 2005, there has been significant progress in reducing decay experience and untreated decay in both kindergarten and third grade children. As shown in Figure 1, the percentage of kindergartners and third graders combined with evidence of ever having tooth decay (decay experience) declined from 66% to 55%, which represents a relative reduction of 17%. Untreated tooth decay in kindergartners and third graders combined declined from 26% to 20%, a 23% relative reduction in untreated decay. Additional findings can be found in the Data Tables section of this report.
The reductions in decay experience noted in this report are important because they signal progress in reducing the proportion of LA County children affected by tooth decay. Less tooth decay experience means fewer children need fillings, crowns, or tooth extractions; fewer trips to the dentist; lower dental costs; and fewer missed school days. Less untreated decay means fewer children have cavities that can cause pain, infection, loss of teeth, and
FIGURE 1: Percentage of LA County’s Kindergarten and 3rd Grade Children with Decay Experience and Untreated Decay by Survey, 2005 Survey and Smile Survey 2020
2005 Survey 26%
2005 Survey 66%
Smile Survey 2020
Smile Survey 2020 20%
55%
Decay Experience
Untreated Decay
BETTER WORSE
}
}
17%relative
improvement
23%relative
improvement
Smile Survey 2020
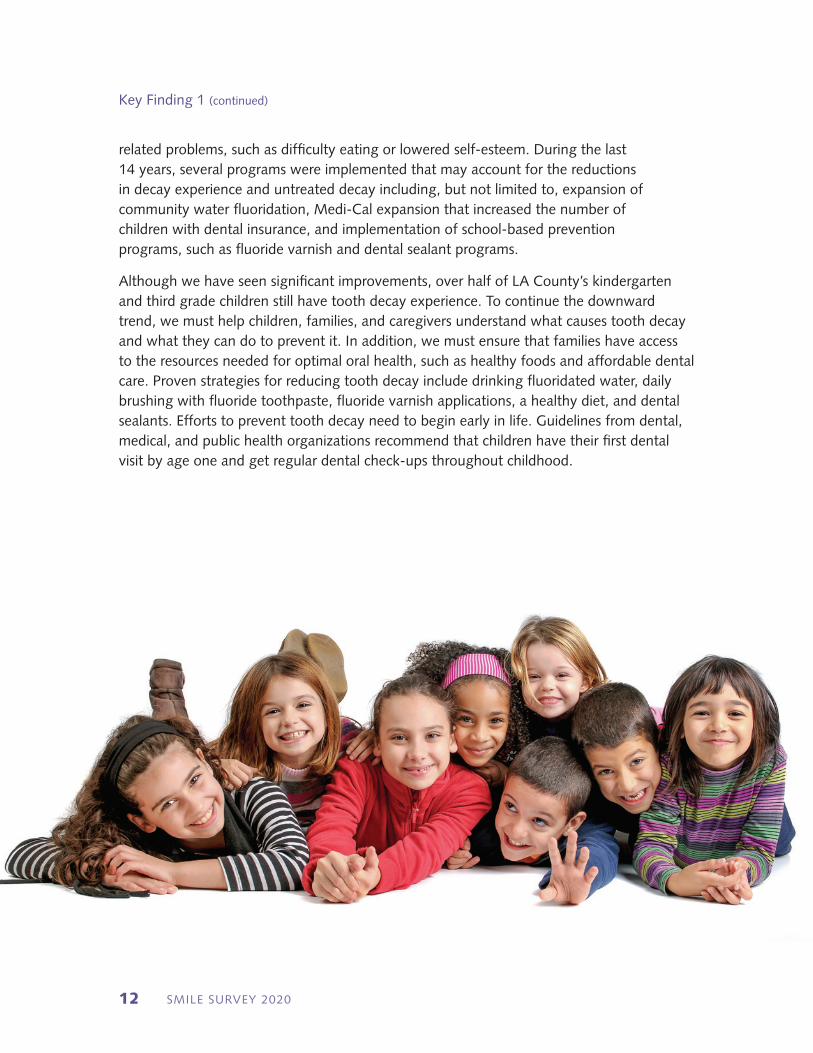
related problems, such as difficulty eating or lowered self-esteem. During the last 14 years, several programs were implemented that may account for the reductions in decay experience and untreated decay including, but not limited to, expansion of community water fluoridation, Medi-Cal expansion that increased the number of children with dental insurance, and implementation of school-based prevention programs, such as fluoride varnish and dental sealant programs.
Although we have seen significant improvements, over half of LA County’s kindergarten and third grade children still have tooth decay experience. To continue the downward trend, we must help children, families, and caregivers understand what causes tooth decay and what they can do to prevent it. In addition, we must ensure that families have access to the resources needed for optimal oral health, such as healthy foods and affordable dental care. Proven strategies for reducing tooth decay include drinking fluoridated water, daily brushing with fluoride toothpaste, fluoride varnish applications, a healthy diet, and dental sealants. Efforts to prevent tooth decay need to begin early in life. Guidelines from dental, medical, and public health organizations recommend that children have their first dental visit by age one and get regular dental check-ups throughout childhood.
Key Finding 1 (continued)
SMILE SURVEY 202012
ORAL HEALTH OF LOS ANGELES COUNTY’S CHILDREN 13
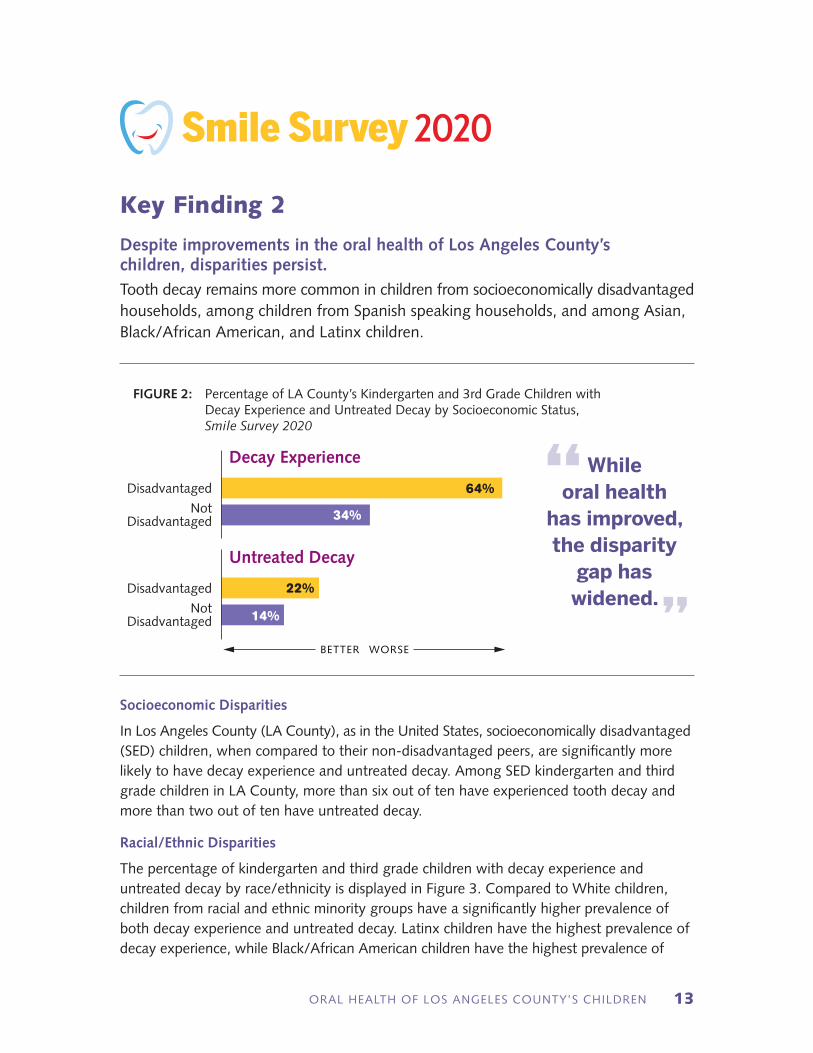
Socioeconomic Disparities
In Los Angeles County (LA County), as in the United States, socioeconomically disadvantaged (SED) children, when compared to their non-disadvantaged peers, are significantly more likely to have decay experience and untreated decay. Among SED kindergarten and third grade children in LA County, more than six out of ten have experienced tooth decay and more than two out of ten have untreated decay.
Racial/Ethnic Disparities
The percentage of kindergarten and third grade children with decay experience and untreated decay by race/ethnicity is displayed in Figure 3. Compared to White children, children from racial and ethnic minority groups have a significantly higher prevalence of both decay experience and untreated decay. Latinx children have the highest prevalence of decay experience, while Black/African American children have the highest prevalence of
Key Finding 2
Despite improvements in the oral health of Los Angeles County’s children, disparities persist. Tooth decay remains more common in children from socioeconomically disadvantaged households, among children from Spanish speaking households, and among Asian, Black/African American, and Latinx children.
FIGURE 2: Percentage of LA County’s Kindergarten and 3rd Grade Children with Decay Experience and Untreated Decay by Socioeconomic Status, Smile Survey 2020
Disadvantaged
Not Disadvantaged
Disadvantaged
Not Disadvantaged
Decay Experience
Untreated Decay
BETTER WORSE
64%
22%
34%
14%
While oral health
has improved, the disparity
gap has widened.
“
”
Smile Survey 2020

SMILE SURVEY 202014
untreated decay. It should be noted that in LA County, children from racial and ethnic minority groups are substantially more likely to be socioeconomically disadvantaged. Twenty-nine percent (29%) of White children are disadvantaged compared to 38%, 83%, and 84% of Asian, Black/African American, and Latinx children, respectively (Data Table 4). Due to small sample sizes, information on other racial/ethnic groups is not available.
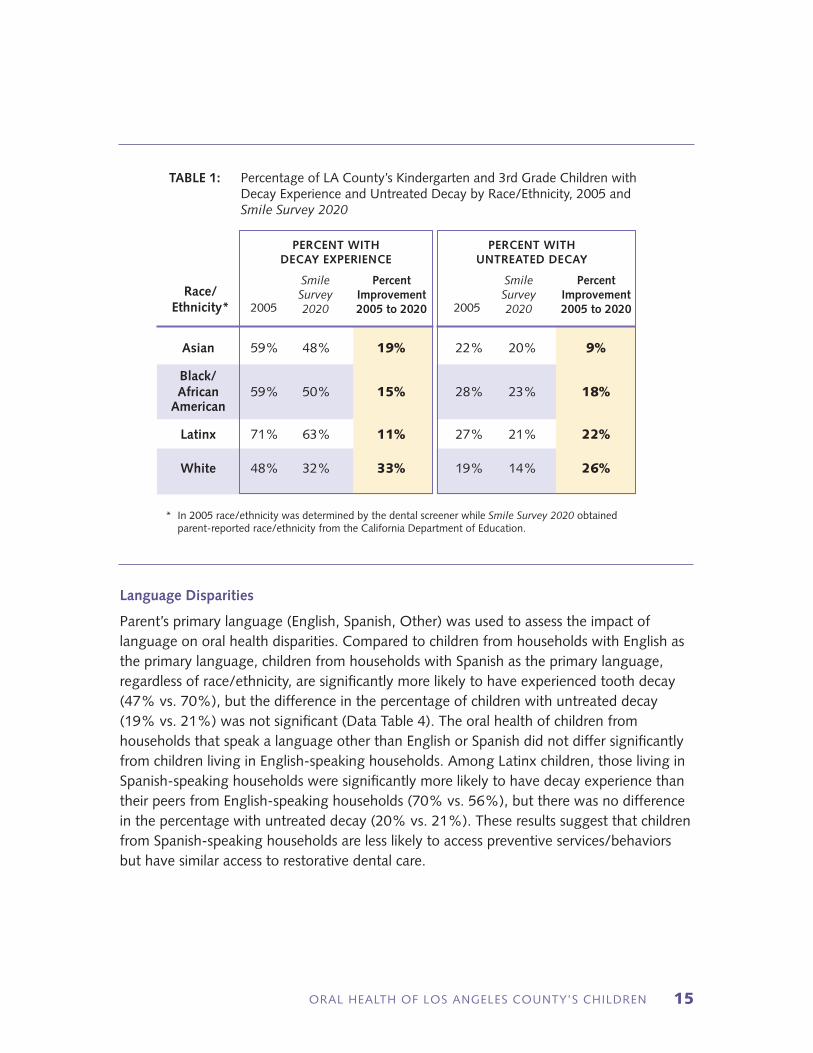
To assess trends in racial/ethnic disparities, we compared data from LA County’s 2005 oral health assessment with data from Smile Survey 2020 (Table 1). Every racial/ethnic group in LA County has seen improvements in both decay experience and untreated decay. For example, the percentage of Latinx children with untreated decay has dropped from 27% to 21%, which represents a relative reduction of 22%.
Although all population groups have seen improvements, the percentage improvements have been largest for White children. This means that while oral health has improved, the disparity gap has widened. In 2005, Latinx children were one and one-half (1.5) times more likely than White children to have decay experience but in Smile Survey 2020 they are almost two times more likely to have decay experience.
FIGURE 3: Percentage of LA County’s Kindergarten and 3rd Grade Children with Decay Experience and Untreated Decay by Race/Ethnicity, Smile Survey 2020
Asian
Black/African American
Latinx
White
Asian
Black/African American
Latinx
White
Decay Experience
BETTER WORSE
Untreated Decay
48%
50%
63%
32%
20%
23%
21%
14%
Key Finding 2 (continued)
ORAL HEALTH OF LOS ANGELES COUNTY’S CHILDREN 15
Language Disparities
Parent’s primary language (English, Spanish, Other) was used to assess the impact of language on oral health disparities. Compared to children from households with English as the primary language, children from households with Spanish as the primary language, regardless of race/ethnicity, are significantly more likely to have experienced tooth decay (47% vs. 70%), but the difference in the percentage of children with untreated decay (19% vs. 21%) was not significant (Data Table 4). The oral health of children from households that speak a language other than English or Spanish did not differ significantly from children living in English-speaking households. Among Latinx children, those living in Spanish-speaking households were significantly more likely to have decay experience than their peers from English-speaking households (70% vs. 56%), but there was no difference in the percentage with untreated decay (20% vs. 21%). These results suggest that children from Spanish-speaking households are less likely to access preventive services/behaviors but have similar access to restorative dental care.
TABLE 1: Percentage of LA County’s Kindergarten and 3rd Grade Children with Decay Experience and Untreated Decay by Race/Ethnicity, 2005 and Smile Survey 2020
* In 2005 race/ethnicity was determined by the dental screener while Smile Survey 2020 obtained parent-reported race/ethnicity from the California Department of Education.
Asian 59% 48% 19% 22% 20% 9%
Black/ African 59% 50% 15% 28% 23% 18% American
Latinx 71% 63% 11% 27% 21% 22%
White 48% 32% 33% 19% 14% 26%
PERCENT WITH DECAY EXPERIENCE
PERCENT WITH UNTREATED DECAY
2005 2005
Smile Survey 2020
Smile Survey 2020
Percent Improvement 2005 to 2020
Percent Improvement 2005 to 2020
Race/ Ethnicity*
SMILE SURVEY 202016
Special Education Disparities
There were no differences in the prevalence of decay experience or untreated decay between those children receiving special education services and those not receiving special education services (Data Table 4).
Our findings demonstrate that, despite overall improvements in children’s oral health, disparities persist and have increased for large numbers of children. Addressing disparities in oral health is important not only from an equity standpoint, but also for improving overall population health, especially as LA County’s population becomes more diverse. To make strides towards better oral health, we must recognize the underlying societal conditions at the core of these disparities, including unequal access to resources such as healthy foods and preventive dental care. By assessing and documenting disparities, we can prioritize strategies and activities for prevention and treatment of dental disease for targeted groups of children.
These findings point to the need for additional targeted strategies to reduce decay experience and untreated decay among socioeconomically disadvantaged children and among racial and ethnic minority populations with special emphasis on children from Spanish-speaking households. Examples include expansion of school-based, school-linked, and preschool oral health programs in areas with high numbers of higher risk families.7 In addition, efforts should be directed toward gaining a better understanding of the factors underlying disparities and developing culturally informed interventions for reducing disparities. Examples include targeted oral health literacy campaigns with messaging in both Spanish and English and greater use of community health workers.
Key Finding 2 (continued)
ORAL HEALTH OF LOS ANGELES COUNTY’S CHILDREN 17
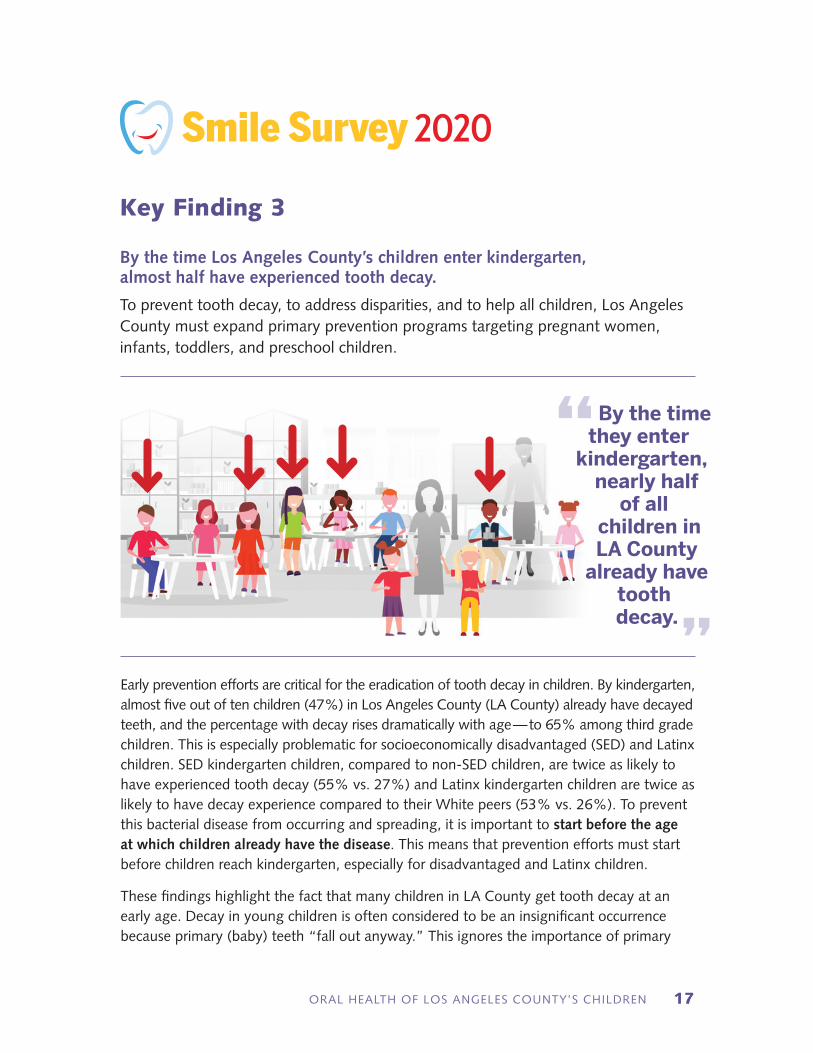
Early prevention efforts are critical for the eradication of tooth decay in children. By kindergarten, almost five out of ten children (47%) in Los Angeles County (LA County) already have decayed teeth, and the percentage with decay rises dramatically with age — to 65% among third grade children. This is especially problematic for socioeconomically disadvantaged (SED) and Latinx children. SED kindergarten children, compared to non-SED children, are twice as likely to have experienced tooth decay (55% vs. 27%) and Latinx kindergarten children are twice as likely to have decay experience compared to their White peers (53% vs. 26%). To prevent this bacterial disease from occurring and spreading, it is important to start before the age at which children already have the disease. This means that prevention efforts must start before children reach kindergarten, especially for disadvantaged and Latinx children.
These findings highlight the fact that many children in LA County get tooth decay at an early age. Decay in young children is often considered to be an insignificant occurrence because primary (baby) teeth “fall out anyway.” This ignores the importance of primary
Key Finding 3
By the time Los Angeles County’s children enter kindergarten, almost half have experienced tooth decay.
To prevent tooth decay, to address disparities, and to help all children, Los Angeles County must expand primary prevention programs targeting pregnant women, infants, toddlers, and preschool children.
By the time they enter
kindergarten, nearly half
of all children in LA County
already have tooth
decay.
“
”
Smile Survey 2020
SMILE SURVEY 202018
prevention of dental disease and studies which show that the best predictor of decay in permanent (adult) teeth is tooth decay in primary teeth. It also ignores the consequences of severe decay in some young children — including pain, infection, and the substantial cost of providing dental care. Due to their young age, treatment of preschool children with decay is often provided in a hospital-based operating room or surgical center under general anesthesia. Because of this, the cost of treatment can be enormous and the risk to the child can be substantial. On average, the total cost of treating a child’s dental disease at a surgery center under general anesthesia in 2004–2008 was $4,800 to $6,300 per child.8 Anecdotal information suggests that the current cost of treating a child’s dental disease in a hospital or surgery center setting ranges from $6,000 to $12,000 per child.
Efforts to increase awareness of the importance of early decay prevention practices need to be developed, especially for families with children who are at high risk for tooth decay. Teaching parents about the importance of daily brushing of young children’s teeth with fluoride toothpaste, beginning when teeth first come in, would be extremely beneficial. Greater attention to oral health, including fluoride varnish applications, as part of medical well-child visits in preschoolers (as recommended by the U.S. Preventive Services Task Force) would help reduce decay. Effective health promotion messages focusing on limiting sugar-containing foods and drinks would not only help fight tooth decay, but also help address childhood obesity and diabetes. Early visits to the dentist (starting by age 1) can help create healthier children, better dental experiences for children and families, and lower dental care costs.9
Key Finding 3 (continued)
ORAL HEALTH OF LOS ANGELES COUNTY’S CHILDREN 19
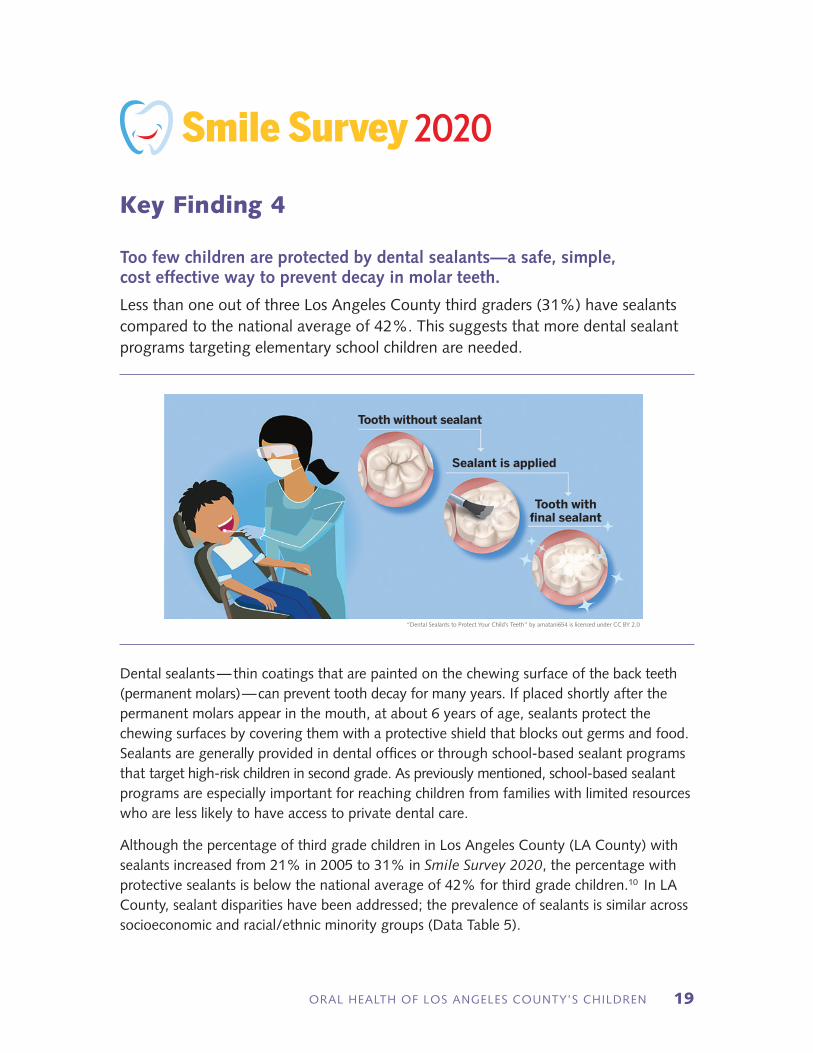
Dental sealants — thin coatings that are painted on the chewing surface of the back teeth (permanent molars) — can prevent tooth decay for many years. If placed shortly after the permanent molars appear in the mouth, at about 6 years of age, sealants protect the chewing surfaces by covering them with a protective shield that blocks out germs and food. Sealants are generally provided in dental offices or through school-based sealant programs that target high-risk children in second grade. As previously mentioned, school-based sealant programs are especially important for reaching children from families with limited resources who are less likely to have access to private dental care.
Although the percentage of third grade children in Los Angeles County (LA County) with sealants increased from 21% in 2005 to 31% in Smile Survey 2020, the percentage with protective sealants is below the national average of 42% for third grade children.10 In LA County, sealant disparities have been addressed; the prevalence of sealants is similar across socioeconomic and racial/ethnic minority groups (Data Table 5).
“Dental Sealants to Protect Your Child’s Teeth” by amatani654 is licensed under CC BY 2.0
Tooth without sealant
Sealant is applied
Tooth with final sealant
Smile Survey 2020
Key Finding 4
Too few children are protected by dental sealants—a safe, simple, cost effective way to prevent decay in molar teeth.
Less than one out of three Los Angeles County third graders (31%) have sealants compared to the national average of 42%. This suggests that more dental sealant programs targeting elementary school children are needed.
SMILE SURVEY 202020
Sealants are a highly effective but underutilized method for preventing decay on the chewing surfaces of permanent molars: they are cheaper than fillings and can be done quickly with less equipment than fillings. Protecting permanent molar teeth from decay is a critical goal for children’s oral health because these molars must last a lifetime. Permanent molars account for a high percentage of decayed teeth; and sealants can reduce decay in these vulnerable, important teeth by 50%–80%.11
In LA County, significantly more disadvantaged children have permanent molar decay compared to non-disadvantaged children (23% vs. 9%), and Latinx third graders have significantly more permanent molar decay than White third grade children (23% vs. 9%). By expanding school-based sealant programs in schools with high numbers of socioeconomically disadvantaged and/or Latinx children, the prevalence of tooth decay among this vulnerable population could be substantially reduced. Efforts to create greater awareness of the importance of the application of sealants as a key preventive measure need to be developed, especially for families of children who are at high risk for tooth decay. In addition, efforts should be made to encourage or incentivize dentists who serve high-risk children to place sealants on permanent molars.
Key Finding 4 (continued)
ORAL HEALTH OF LOS ANGELES COUNTY’S CHILDREN 21
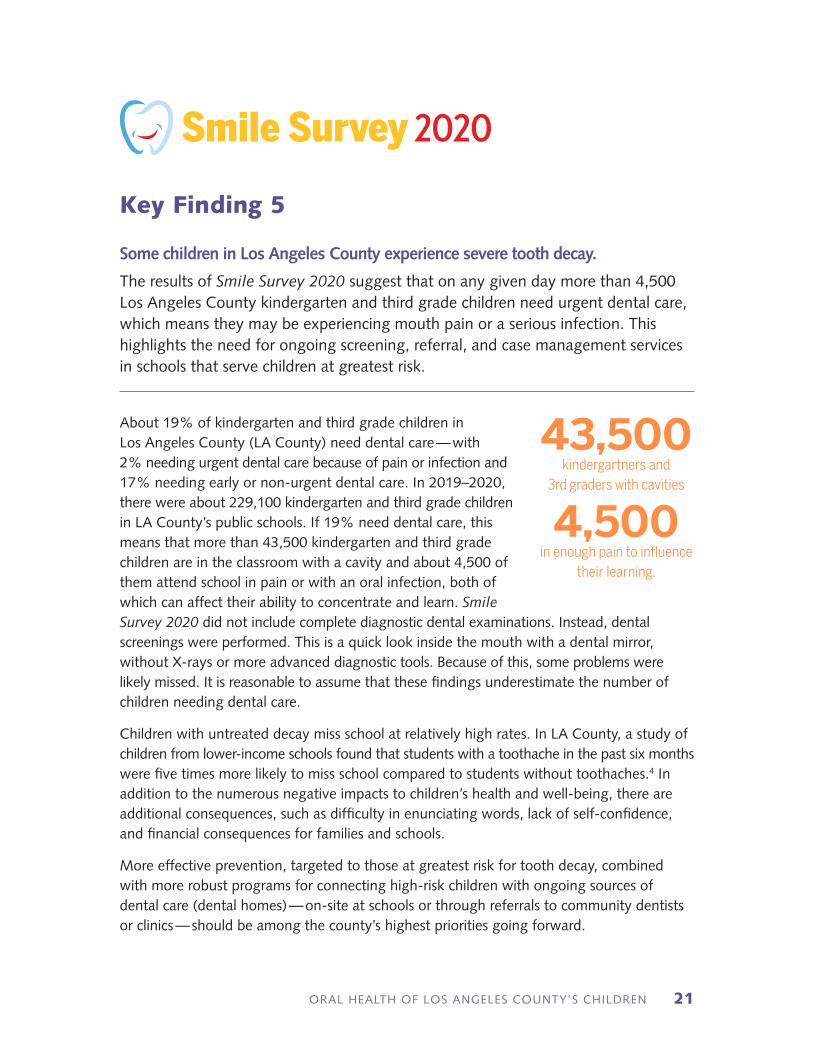
Some children in Los Angeles County experience severe tooth decay.
The results of Smile Survey 2020 suggest that on any given day more than 4,500 Los Angeles County kindergarten and third grade children need urgent dental care, which means they may be experiencing mouth pain or a serious infection. This highlights the need for ongoing screening, referral, and case management services in schools that serve children at greatest risk.
About 19% of kindergarten and third grade children in Los Angeles County (LA County) need dental care — with 2% needing urgent dental care because of pain or infection and 17% needing early or non-urgent dental care. In 2019–2020, there were about 229,100 kindergarten and third grade children in LA County’s public schools. If 19% need dental care, this means that more than 43,500 kindergarten and third grade children are in the classroom with a cavity and about 4,500 of them attend school in pain or with an oral infection, both of which can affect their ability to concentrate and learn. Smile Survey 2020 did not include complete diagnostic dental examinations. Instead, dental screenings were performed. This is a quick look inside the mouth with a dental mirror, without X-rays or more advanced diagnostic tools. Because of this, some problems were likely missed. It is reasonable to assume that these findings underestimate the number of children needing dental care.
Children with untreated decay miss school at relatively high rates. In LA County, a study of children from lower-income schools found that students with a toothache in the past six months were five times more likely to miss school compared to students without toothaches.4 In addition to the numerous negative impacts to children’s health and well-being, there are additional consequences, such as difficulty in enunciating words, lack of self-confidence, and financial consequences for families and schools.
More effective prevention, targeted to those at greatest risk for tooth decay, combined with more robust programs for connecting high-risk children with ongoing sources of dental care (dental homes) — on-site at schools or through referrals to community dentists or clinics — should be among the county’s highest priorities going forward.
43,500kindergartners and
3rd graders with cavities
4,500in enough pain to influence
their learning.
Smile Survey 2020
Key Finding 5
SMILE SURVEY 202022
ORAL HEALTH OF LOS ANGELES COUNTY’S CHILDREN 23
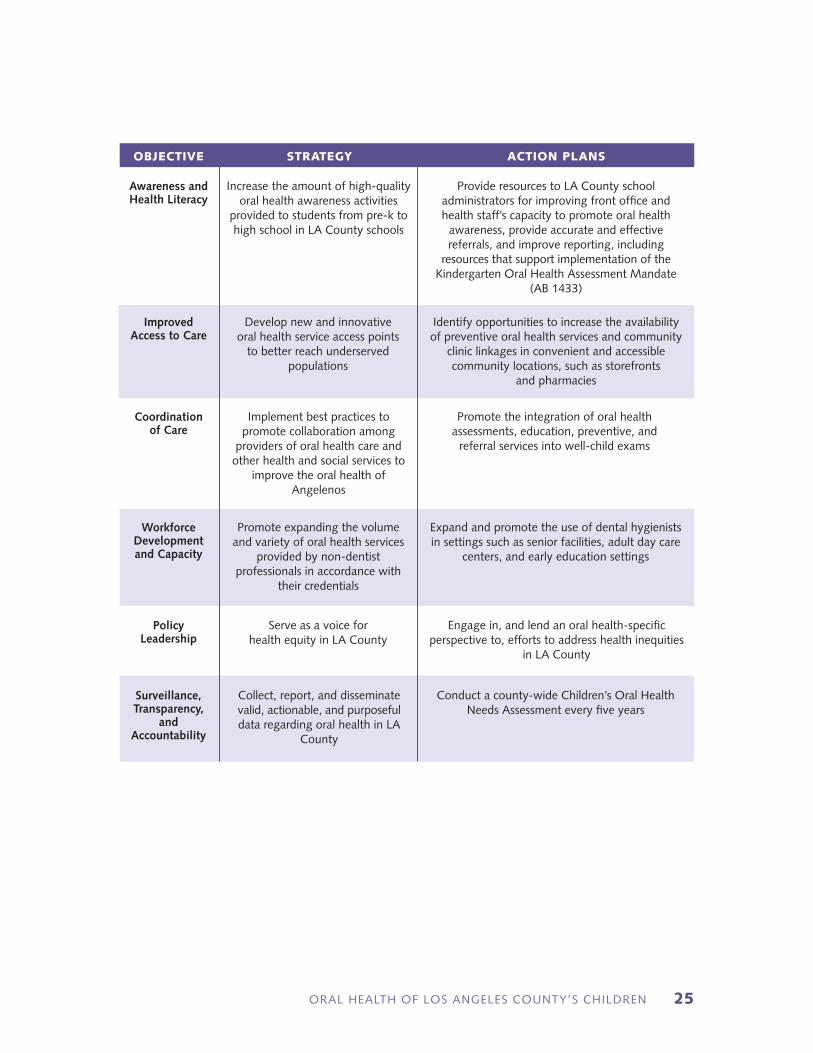
Improving oral health in an area as large and diverse as Los Angeles County (LA County) requires strategic planning, engagement of a broad array of community stakeholders, and resources to organize and expand model programs. In 2019, the Los Angeles County Department of Public Health Oral Health Program released its first community oral health strategic plan, also known as the Community Oral Health Improvement Plan (COHIP). The Oral Health Program brought together over 60 local oral health stakeholders who, over the course of a year, spent over 2,000 hours of work to produce the COHIP. With consensus, they laid out a roadmap to improve the oral health of LA County residents. This five-year plan includes six objectives, with associated strategies and activities, to address the oral health needs of LA County’s residents.12
The COHIP provides a framework for action over the next five years. It considers the social determinants of health, current existing data in dental access to care, and the experiences of community organizations and stakeholders. It envisions a healthier LA County in which more residents establish a dental home, fewer young children experience tooth decay, and children and their families can access quality care in their communities. The COHIP also provides strategies and calls on community partners to provide more oral health resources in a linguistic and culturally sensitive and competent manner.
The Oral Health Program (OHP) created six workgroups, one for each COHIP objective. Each workgroup is comprised of OHP staff and community stakeholders, working together to implement the activities outlined in the report. The OHP also executed a competitive contract for the Oral Health Collaborative Consortium with the UCLA Center for Health Policy Research to implement many of the activities highlighted by the COHIP.
The COHIP has six objectives which address the five key findings of Smile Survey 2020:
ð Awareness and Health Literacy: Increase awareness of the importance and contribution of optimal oral health and well-being across the lifespan
ð Improved Access to Care: Improve access to oral health care by increasing providers’ cultural and technical capacities, fostering trust between patients and providers, and reducing logistical barriers to care
ð Coordination of Care: Strengthen systems of care by effectively integrating and coordinating oral health with other health and social services
ð Workforce Development and Capacity: Increase the number of oral health sector workers to meet the needs of LA County’s economically and culturally diverse communities
Strategic Priorities to Improve Oral Health
Smile Survey 2020
SMILE SURVEY 202024
ð Policy Leadership: Develop and influence federal, state, and local policies and resources that will promote equitable access to oral health services
ð Surveillance, Transparency, and Accountability: Track oral health determinants and outcomes in LA County. Data collected will be made available for research and analysis, policy development and implementation, and public dissemination
Through collaborative efforts with oral health stakeholders, we anticipate that by the next oral health assessment we will see a further reduction in the prevalence of tooth decay and untreated tooth decay in kindergarten and third grade children. We will work toward increasing the percentage of children who provide proof of a dental assessment in accordance with the California Kindergarten Oral Health Assessment (KOHA) mandate. The results from Smile Survey 2020 indicate that KOHA is a great opportunity to gauge the oral health status of a child in the kindergarten age group and to link a child to a dental home. Organizations that routinely work with young children and families can incorporate KOHA as part of their care package. We also look to work with policy advocates in eliminating the opt-out option of this assessment. By eliminating the opt-out choice, we can reach all kindergartners in LA County that are in need of oral health treatment and prevention, further resulting in earlier intervention, and ultimately moving toward a decrease in dental decay among this age group.
One of our goals is to increase the percentage of third grade children with sealants. It is essential that school-based clinics or organizations include this activity in their scope of work. Only then will we see an increase in the application of this easy, preventive treatment aimed to decrease decay of the permanent teeth.
A bolder goal is to increase the number of LA County residents receiving optimally-fluoridated water. It is essential to partner with community oral health leaders and promoters to educate community residents on the benefits of fluoride use. We want to empower Angelenos to understand the oral health benefits of fluoridated water and to advocate for optimally-fluoridated water to achieve the best oral health for themselves and their families.
Findings from Smile Survey 2020 will guide the OHP, oral health stakeholders, and community partners to make informed decisions on the areas of most oral health need and where we should focus activities and program development. We recognize that it is essential for organizations to work together if we are to implement all six objectives and their associated strategies and activities. We need partnerships with non-profit organizations, private businesses, schools, primary care providers, and more. Through these partnerships, we aim to see improvements in our outcomes and to move LA County toward better oral health for the children of our communities.
Strategic Priorities (continued)
ORAL HEALTH OF LOS ANGELES COUNTY’S CHILDREN 25
OBJECTIVE STRATEGY ACTION PLANS
Awareness and Health Literacy
Improved Access to Care
Coordination of Care
Workforce Development and Capacity
Policy Leadership
Surveillance, Transparency,
and Accountability
Increase the amount of high-quality oral health awareness activities
provided to students from pre-k to high school in LA County schools
Develop new and innovative oral health service access points
to better reach underserved populations
Implement best practices to promote collaboration among
providers of oral health care and other health and social services to
improve the oral health of Angelenos
Promote expanding the volume and variety of oral health services
provided by non-dentist professionals in accordance with
their credentials
Serve as a voice for health equity in LA County
Collect, report, and disseminate valid, actionable, and purposeful data regarding oral health in LA
County
Provide resources to LA County school administrators for improving front office and health staff’s capacity to promote oral health
awareness, provide accurate and effective referrals, and improve reporting, including
resources that support implementation of the Kindergarten Oral Health Assessment Mandate
(AB 1433)
Identify opportunities to increase the availability of preventive oral health services and community
clinic linkages in convenient and accessible community locations, such as storefronts
and pharmacies
Promote the integration of oral health assessments, education, preventive, and
referral services into well-child exams
Expand and promote the use of dental hygienists in settings such as senior facilities, adult day care
centers, and early education settings
Engage in, and lend an oral health-specific perspective to, efforts to address health inequities
in LA County
Conduct a county-wide Children’s Oral Health Needs Assessment every five years
SMILE SURVEY 202026

ORAL HEALTH OF LOS ANGELES COUNTY’S CHILDREN 27
Smile Survey 2020 screened kindergarten and third grade children at a representative sample of public elementary schools in Los Angeles County (LA County). The sampling frame included all in-person public and public charter schools with at least 25 children in third grade. Because of unique circumstances associated with working with the Los Angeles Unified School District (LAUSD), the sampling frame was ordered by LAUSD (no/yes), then by geographic location (service planning area) and, finally, by percent of students eligible for the National School Lunch Program (NSLP). A systematic probability proportional to size sampling scheme was used to select 70 schools with third grade. Of the selected schools, two did not have kindergarten students so the appropriate kindergarten feeder schools were added to the sample, resulting in 72 schools representing 70 sampling intervals. The selected schools included 33 schools (31 sampling intervals) in LAUSD and 39 schools (39 sampling intervals) in districts other than LAUSD. If a school declined to participate, a replacement school from the same sampling interval was selected. A systematic sampling process with implicit stratification by school district (LAUSD vs. non-LAUSD), geographic region, and NSLP participation helped to ensure that the sample was representative of the County in terms of geographic location and socioeconomic status.
The Los Angeles County Department of Public Health contracted with the UCLA School of Dentistry to complete the screenings and conduct the statistical analyses. Screenings were completed during the 2018–2019 and 2019–2020 school years (October 2018 to November 2019). A combination of active and passive consent was used. Active consent was used by two school districts (LAUSD and one non-LAUSD district) while all other districts used passive consent. Among schools using active consent, the response rate was 62%, while the response rate among schools using passive consent was 84%, resulting in an overall response rate of 74%. Trained dental examiners completed the screenings using gloves, penlights, and disposable mouth mirrors. The training consisted of a two-hour didactic session followed by a two-hour clinical training session. Inter- and intra-rater reliability were not determined. The diagnostic criteria outlined in the Association of State and Territorial Dental Director’s publication Basic Screening Surveys: An Approach to Monitoring Community Oral Health were used.13 The oral health measures collected included number of teeth with untreated decay, number of teeth with treated decay, status of each permanent first molar (decayed, filled, sealed, sound, unerupted) and urgency of need for dental care (none, early, urgent). In addition to the oral health indicators, we also measured a child’s height and weight. Information obtained using the height/weight measures will be presented in a subsequent one-page summary report.
Survey Methods
Smile Survey 2020

SMILE SURVEY 202028
Child level information on sex (female, male, unknown), parent-reported race/ethnicity (Asian, Black/African American, Hispanic/Latinx, White, other, unknown), socioeconomic status (socioeconomically disadvantaged, not socioeconomically disadvantaged), parent’s primary language (English, Spanish, other, unknown), and special education status (no, yes, unknown) was obtained from the California Department of Education (CDE) through a memorandum of understanding and data use agreement with the California Department of Public Health. CDE considers a child to be socioeconomically disadvantaged if they are identified as being a migrant, a foster child, or homeless at any time during the academic year; being eligible for the National School Lunch Program at any time during the academic year; or having parents who did not receive a high school diploma. CDE obtains information on parent’s primary language, also known as “native language,” from the Home Language Survey. All unique identifiers were removed from the dataset so that anonymity was maintained.
Raking14, a model-based approach using known population totals, was used to generate weights to ensure that the survey totals matched the known population totals in terms of geographic location (SPA), race/ethnicity, and socioeconomic status. Raking weights were created using R (R Foundation for Statistical Computing, Vienna, Austria). All statistical analyses were performed using SAS complex survey procedures (Version 9.4; SAS Institute Inc., Cary, NC). A total of 10,489 children received a dental screening; however, due to missing demographic data needed to calculate weights, 97 children were excluded from all the analyses. All analyses are limited to the 10,392 children with demographic data.
2005 Survey Methods: The sampling frame for the 2005 California oral health assessment included public schools with at least 25 children in kindergarten and/or third grade. A systematic probability proportional to size sampling scheme with implicit stratification by geographic region and percent of students eligible for the National School Lunch Program was used to select 204 schools throughout California including 54 schools in LA County. To ensure that results were representative of populations served by the three health jurisdictions in LA County, an additional eight schools were added to the state sample. A total of 7,708 kindergarten and third grade children in 62 LA County schools were screened during the 2004–2005 school year. The 2005 survey used the same diagnostic criteria as Smile Survey 2020. In 2005, race/ethnicity was determined by the dental screener.
Survey Methods (continued)
ORAL HEALTH OF LOS ANGELES COUNTY’S CHILDREN 29
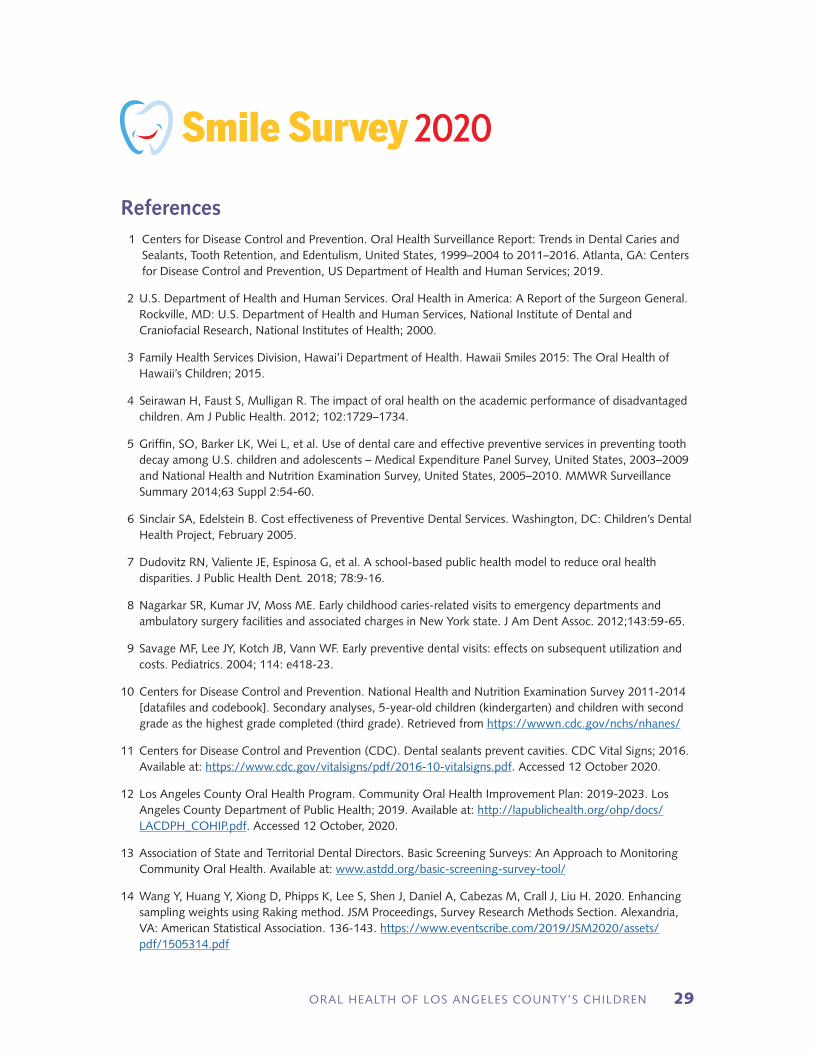
1 Centers for Disease Control and Prevention. Oral Health Surveillance Report: Trends in Dental Caries and Sealants, Tooth Retention, and Edentulism, United States, 1999–2004 to 2011–2016. Atlanta, GA: Centers for Disease Control and Prevention, US Department of Health and Human Services; 2019.
2 U.S. Department of Health and Human Services. Oral Health in America: A Report of the Surgeon General. Rockville, MD: U.S. Department of Health and Human Services, National Institute of Dental and Craniofacial Research, National Institutes of Health; 2000.
3 Family Health Services Division, Hawai’i Department of Health. Hawaii Smiles 2015: The Oral Health of Hawaii’s Children; 2015.
4 Seirawan H, Faust S, Mulligan R. The impact of oral health on the academic performance of disadvantaged children. Am J Public Health. 2012; 102:1729–1734.
5 Griffin, SO, Barker LK, Wei L, et al. Use of dental care and effective preventive services in preventing tooth decay among U.S. children and adolescents – Medical Expenditure Panel Survey, United States, 2003–2009 and National Health and Nutrition Examination Survey, United States, 2005–2010. MMWR Surveillance Summary 2014;63 Suppl 2:54-60.
6 Sinclair SA, Edelstein B. Cost effectiveness of Preventive Dental Services. Washington, DC: Children’s Dental Health Project, February 2005.
7 Dudovitz RN, Valiente JE, Espinosa G, et al. A school-based public health model to reduce oral health disparities. J Public Health Dent. 2018; 78:9-16.
8 Nagarkar SR, Kumar JV, Moss ME. Early childhood caries-related visits to emergency departments and ambulatory surgery facilities and associated charges in New York state. J Am Dent Assoc. 2012;143:59-65.
9 Savage MF, Lee JY, Kotch JB, Vann WF. Early preventive dental visits: effects on subsequent utilization and costs. Pediatrics. 2004; 114: e418-23.
10 Centers for Disease Control and Prevention. National Health and Nutrition Examination Survey 2011-2014 [datafiles and codebook]. Secondary analyses, 5-year-old children (kindergarten) and children with second grade as the highest grade completed (third grade). Retrieved from https://wwwn.cdc.gov/nchs/nhanes/
11 Centers for Disease Control and Prevention (CDC). Dental sealants prevent cavities. CDC Vital Signs; 2016. Available at: https://www.cdc.gov/vitalsigns/pdf/2016-10-vitalsigns.pdf. Accessed 12 October 2020.
12 Los Angeles County Oral Health Program. Community Oral Health Improvement Plan: 2019-2023. Los Angeles County Department of Public Health; 2019. Available at: http://lapublichealth.org/ohp/docs/LACDPH_COHIP.pdf. Accessed 12 October, 2020.
13 Association of State and Territorial Dental Directors. Basic Screening Surveys: An Approach to Monitoring Community Oral Health. Available at: www.astdd.org/basic-screening-survey-tool/
14 Wang Y, Huang Y, Xiong D, Phipps K, Lee S, Shen J, Daniel A, Cabezas M, Crall J, Liu H. 2020. Enhancing sampling weights using Raking method. JSM Proceedings, Survey Research Methods Section. Alexandria, VA: American Statistical Association. 136-143. https://www.eventscribe.com/2019/JSM2020/assets/pdf/1505314.pdf
References
Smile Survey 2020

SMILE SURVEY 202030
RESULTS-AT-A-GLANCE
GRADE/INDICATOR SMILE SURVEY 2020 FINDINGSNATIONAL AVERAGE10
Kindergarten
Third grade
Kindergarten & 3rd grade combined
Among kindergarten children surveyed in 2018–2019:
Among 3rd grade children surveyed in 2018–2019:
Among kindergarten & 3rd grade children surveyed in 2018–2019:
Decay experience
Decay experience
Decay experience
Untreated decay
Untreateddecay
Untreated decay
Need for urgent dental care
Need for urgent dental care
Need for urgent dental care
Dental sealants
Dental sealants
Dental sealants
n 47% have experienced tooth decay compared to 56% of those screened in 2005 (16% improvement)
n 65% have experienced tooth decay compared to 74% of those screened in 2005 (12% improvement)
n 55% have experienced tooth decay compared to 66% of those screened in 2005 (17% improvement)
n 19% have untreated decay compared to 25% of those screened in 2005 (24% improvement)
n 21% have untreated decay compared to 27% of those screened in 2005 (22% improvement)
n 20% have untreated decay compared to 26% of those screened in 2005 (23% improvement)
n 2% need urgent dental care because of pain or infection compared to 4% of those screened in 2005 (50% improvement)
n 2% need urgent dental care because of pain or infection compared to 4% of those screened in 2005 (50% improvement)
n 2% need urgent dental care because of pain or infection compared to 4% of those screened in 2005 (50% improvement)
n Not applicable; kindergarten children do not have permanent molars
n 31% have protective dental sealants on a permanent molar compared to 21% of those screened in 2005 (48% improvement)
n Not applicable – kindergarten children do not have permanent molars
42%
62%
NA
22%
22%
NA
NA
NA
NA
NA
42%
NA
NA = Not Available
ORAL HEALTH OF LOS ANGELES COUNTY’S CHILDREN 31
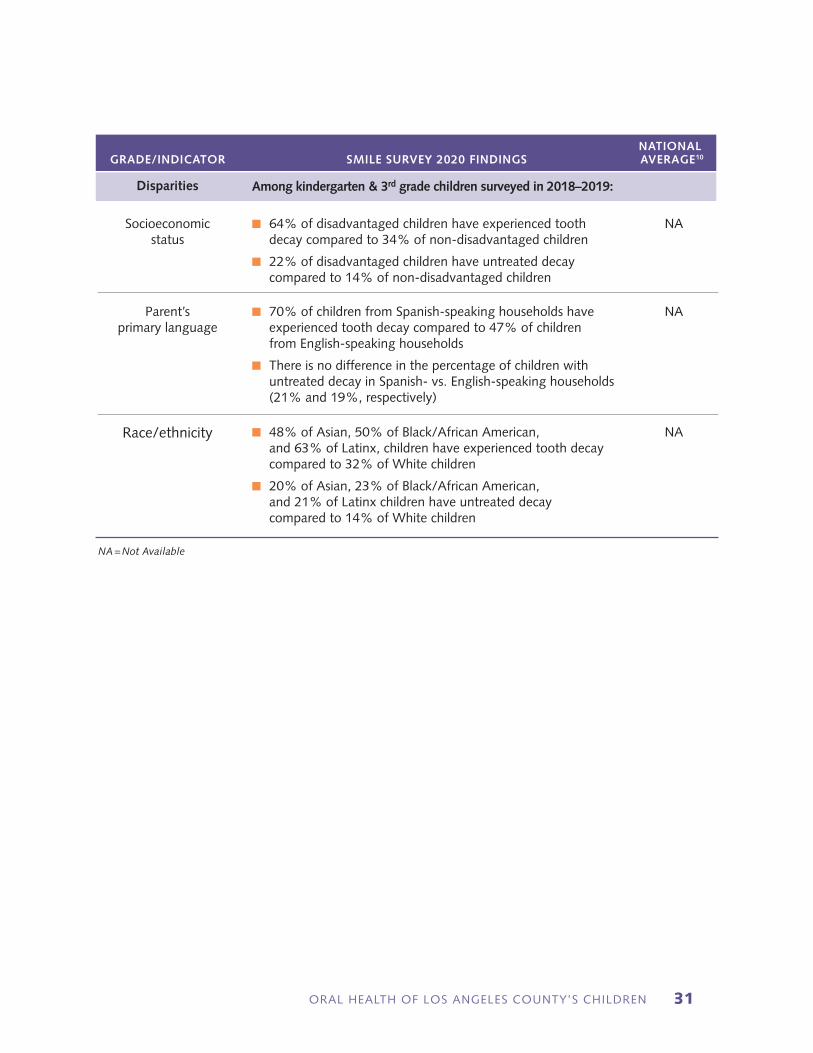
GRADE/INDICATOR SMILE SURVEY 2020 FINDINGSNATIONAL AVERAGE10
Disparities Among kindergarten & 3rd grade children surveyed in 2018–2019:
NA = Not Available
Socioeconomic status
Parent’s primary language
Race/ethnicity
n 64% of disadvantaged children have experienced tooth decay compared to 34% of non-disadvantaged children
n 22% of disadvantaged children have untreated decay compared to 14% of non-disadvantaged children
n 70% of children from Spanish-speaking households have experienced tooth decay compared to 47% of children from English-speaking households
n There is no difference in the percentage of children with untreated decay in Spanish- vs. English-speaking households (21% and 19%, respectively)
n 48% of Asian, 50% of Black/African American, and 63% of Latinx, children have experienced tooth decay compared to 32% of White children
n 20% of Asian, 23% of Black/African American, and 21% of Latinx children have untreated decay compared to 14% of White children
NA
NA
NA
SMILE SURVEY 202032
Grade
Kindergarten 5,829 54.4 53.7 - 55.2
3rd 4,563 45.6 44.8 - 46.3
Sex
Female 5,121 49.4 48.4 - 50.5
Male 5,239 50.3 49.2 - 51.3
Missing/Unknown 32 0.3 0.1 - 0.5
Race/Ethnicity
Asian 1,393 9.7 6.3 - 13.1
Black/African American 783 7.3 4.6 - 10.0
Latinx 6,682 65.7 59.1 - 72.4
White 1,132 14.1 9.1 - 19.1
Other 402 3.2 2.2 - 4.1
Parent’s Primary Language
English 6,033 59.8 55.2 - 64.4
Spanish 3,236 32.3 27.3 - 37.3
Other* 1,087 7.6 5.1 - 10.2
Missing/Unknown 36 0.3 0.2 - 0.4
Socioeconomically Disadvantaged
No 3,101 29.6 22.8 - 36.4
Yes 7,291 70.4 63.6 - 77.2
Special Education
No 9,306 89.0 87.7 - 90.3
Yes 1,022 10.3 9.1 - 11.6
Missing/Unknown 64 0.6 0.4 - 0.9
Service Planning Area (SPA)
SPA 1 824 5.3 0.2 - 10.4
SPA 2 1,874 20.7 11.1 - 30.4
SPA 3 1,499 16.7 8.4 - 25.0
SPA 4 614 9.0 2.3 - 15.7
SPA 5 513 4.4 0.0 - 9.3
SPA 6 1,299 13.5 5.6 - 21.4
SPA 7 1,464 14.9 6.2 - 23.7
SPA 8 2,305 15.5 6.9 - 24.1
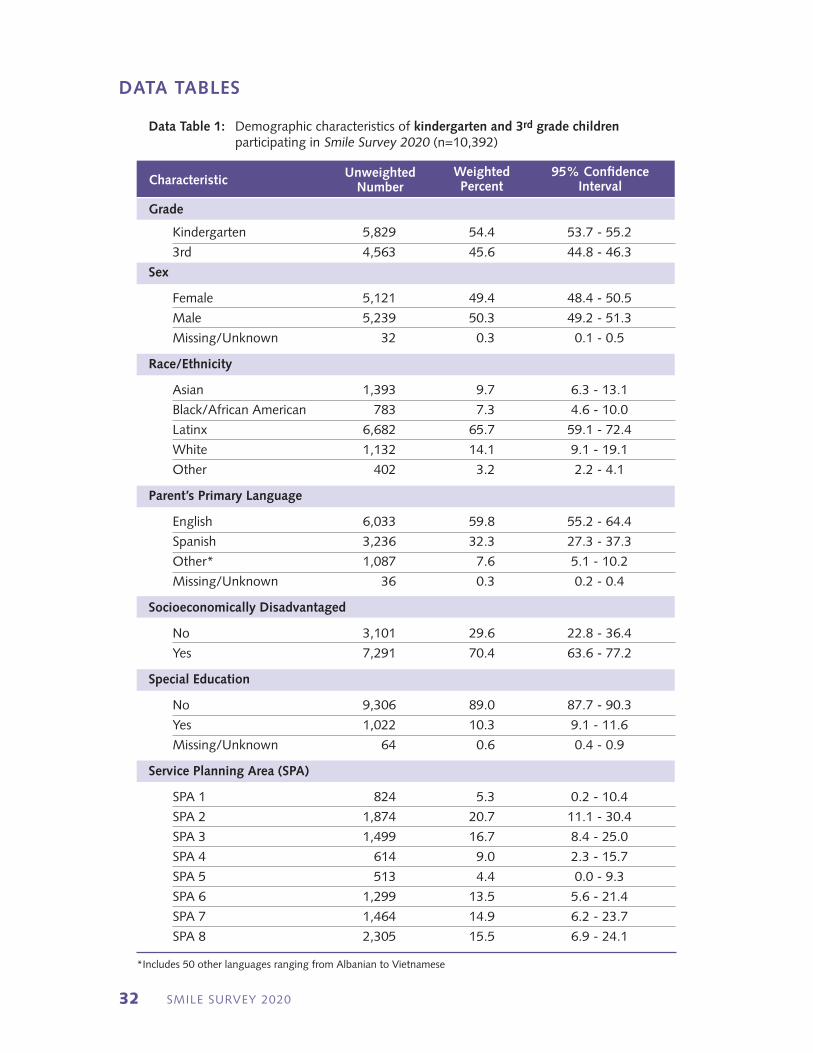
Data Table 1: Demographic characteristics of kindergarten and 3rd grade children participating in Smile Survey 2020 (n=10,392)
Characteristic95% Confidence
IntervalWeighted Percent
UnweightedNumber
*Includes 50 other languages ranging from Albanian to Vietnamese
DATA TABLES
ORAL HEALTH OF LOS ANGELES COUNTY’S CHILDREN 33
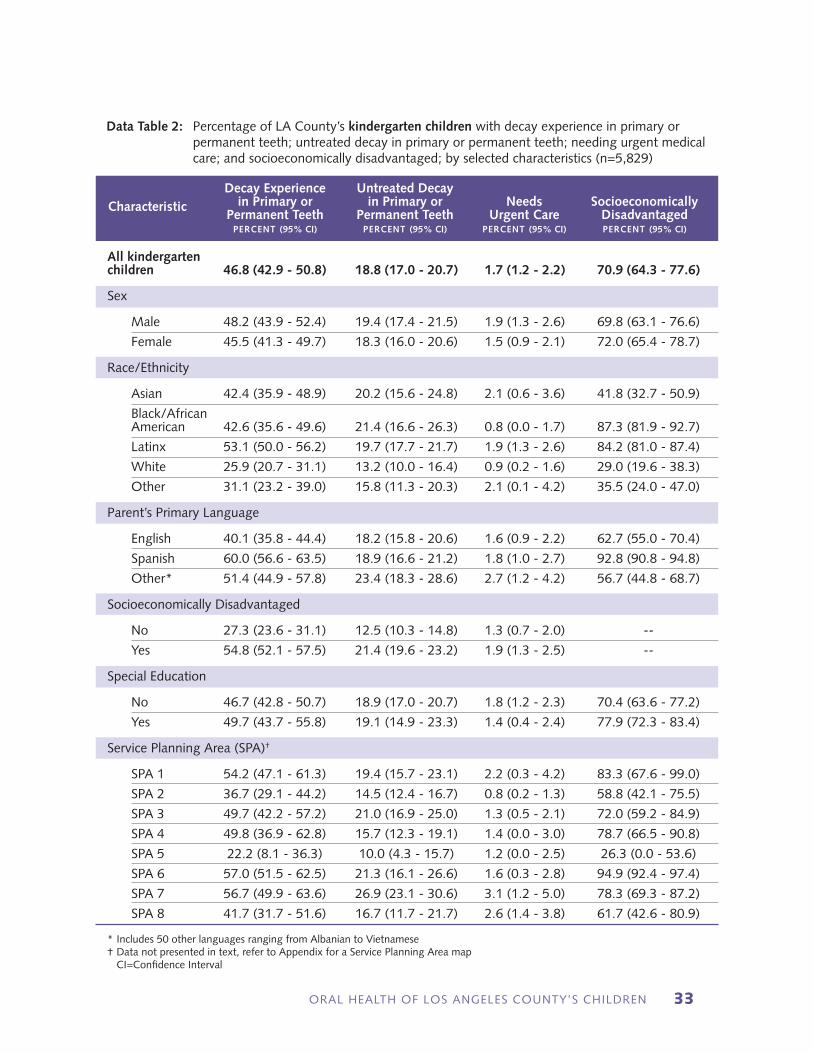
Data Table 2: Percentage of LA County’s kindergarten children with decay experience in primary or permanent teeth; untreated decay in primary or permanent teeth; needing urgent medical care; and socioeconomically disadvantaged; by selected characteristics (n=5,829)
CharacteristicDecay Experience
in Primary or Permanent Teeth
percent (95% CI)
Untreated Decay in Primary or
Permanent Teethpercent (95% CI)
Needs Urgent Care
percent (95% CI)
SocioeconomicallyDisadvantagedpercent (95% CI)
All kindergartenchildren 46.8 (42.9 - 50.8) 18.8 (17.0 - 20.7) 1.7 (1.2 - 2.2) 70.9 (64.3 - 77.6)
Sex
Male 48.2 (43.9 - 52.4) 19.4 (17.4 - 21.5) 1.9 (1.3 - 2.6) 69.8 (63.1 - 76.6)
Female 45.5 (41.3 - 49.7) 18.3 (16.0 - 20.6) 1.5 (0.9 - 2.1) 72.0 (65.4 - 78.7)
Race/Ethnicity
Asian 42.4 (35.9 - 48.9) 20.2 (15.6 - 24.8) 2.1 (0.6 - 3.6) 41.8 (32.7 - 50.9)
Black/African American 42.6 (35.6 - 49.6) 21.4 (16.6 - 26.3) 0.8 (0.0 - 1.7) 87.3 (81.9 - 92.7)
Latinx 53.1 (50.0 - 56.2) 19.7 (17.7 - 21.7) 1.9 (1.3 - 2.6) 84.2 (81.0 - 87.4)
White 25.9 (20.7 - 31.1) 13.2 (10.0 - 16.4) 0.9 (0.2 - 1.6) 29.0 (19.6 - 38.3)
Other 31.1 (23.2 - 39.0) 15.8 (11.3 - 20.3) 2.1 (0.1 - 4.2) 35.5 (24.0 - 47.0)
Parent’s Primary Language
English 40.1 (35.8 - 44.4) 18.2 (15.8 - 20.6) 1.6 (0.9 - 2.2) 62.7 (55.0 - 70.4)
Spanish 60.0 (56.6 - 63.5) 18.9 (16.6 - 21.2) 1.8 (1.0 - 2.7) 92.8 (90.8 - 94.8)
Other* 51.4 (44.9 - 57.8) 23.4 (18.3 - 28.6) 2.7 (1.2 - 4.2) 56.7 (44.8 - 68.7)
Socioeconomically Disadvantaged
No 27.3 (23.6 - 31.1) 12.5 (10.3 - 14.8) 1.3 (0.7 - 2.0) --
Yes 54.8 (52.1 - 57.5) 21.4 (19.6 - 23.2) 1.9 (1.3 - 2.5) --
Special Education
No 46.7 (42.8 - 50.7) 18.9 (17.0 - 20.7) 1.8 (1.2 - 2.3) 70.4 (63.6 - 77.2)
Yes 49.7 (43.7 - 55.8) 19.1 (14.9 - 23.3) 1.4 (0.4 - 2.4) 77.9 (72.3 - 83.4)
Service Planning Area (SPA)†
SPA 1 54.2 (47.1 - 61.3) 19.4 (15.7 - 23.1) 2.2 (0.3 - 4.2) 83.3 (67.6 - 99.0)
SPA 2 36.7 (29.1 - 44.2) 14.5 (12.4 - 16.7) 0.8 (0.2 - 1.3) 58.8 (42.1 - 75.5)
SPA 3 49.7 (42.2 - 57.2) 21.0 (16.9 - 25.0) 1.3 (0.5 - 2.1) 72.0 (59.2 - 84.9)
SPA 4 49.8 (36.9 - 62.8) 15.7 (12.3 - 19.1) 1.4 (0.0 - 3.0) 78.7 (66.5 - 90.8)
SPA 5 22.2 (8.1 - 36.3) 10.0 (4.3 - 15.7) 1.2 (0.0 - 2.5) 26.3 (0.0 - 53.6)
SPA 6 57.0 (51.5 - 62.5) 21.3 (16.1 - 26.6) 1.6 (0.3 - 2.8) 94.9 (92.4 - 97.4)
SPA 7 56.7 (49.9 - 63.6) 26.9 (23.1 - 30.6) 3.1 (1.2 - 5.0) 78.3 (69.3 - 87.2)
SPA 8 41.7 (31.7 - 51.6) 16.7 (11.7 - 21.7) 2.6 (1.4 - 3.8) 61.7 (42.6 - 80.9)
* Includes 50 other languages ranging from Albanian to Vietnamese† Data not presented in text, refer to Appendix for a Service Planning Area map CI=Confidence Interval

SMILE SURVEY 202034
Data Table 3: Percentage of LA County’s 3rd grade children with decay experience in primary or permanent teeth; untreated decay in primary or permanent teeth; needing urgent medical care; and socioeconomically disadvantaged; by selected characteristics (n=4,563)
CharacteristicDecay Experience
in Primary or Permanent Teeth
percent (95% CI)
Untreated Decay in Primary or
Permanent Teethpercent (95% CI)
Needs Urgent Care
percent (95% CI)
SocioeconomicallyDisadvantagedpercent (95% CI)
All 3rd gradechildren 64.7 (60.1 - 69.4) 20.7 (18.2 - 23.2) 2.1 (1.5 - 2.7) 69.7 (62.5 - 77.0)
Sex
Male 63.5 (58.6 - 68.5) 19.5 (16.8 - 22.1) 2.1 (1.5 - 2.8) 69.1 (61.5 - 76.7)
Female 65.9 (61.0 - 70.8) 21.9 (18.8 - 25.0) 2.0 (1.3 - 2.8) 70.5 (63.4 - 77.7)
Race/Ethnicity
Asian 55.1 (49.7 - 60.5) 18.9 (14.0 - 23.8) 0.9 (0.0 - 1.8) 33.3 (24.0 - 42.7)
Black/African American 58.5 (52.9 - 64.1) 24.6 (19.6 - 29.6) 2.5 (1.1 - 3.9) 77.9 (72.7 - 83.1)
Latinx 73.8 (70.5 - 77.0) 22.1 (19.4 - 24.9) 2.6 (1.8 - 3.3) 84.7 (80.8 - 88.6)
White 38.0 (29.0 - 47.0) 15.0 (10.5 - 19.5) 0.6 (0.0 - 1.4) 28.4 (18.7 - 38.1)
Other 41.4 (31.0 - 51.9) 12.9 (7.1 - 18.8) 0.7 (0.0 - 2.2) 36.6 (24.3 - 48.8)
Parent’s Primary Language
English 57.0 (51.4 - 62.5) 20.1 (17.3 - 22.9) 1.9 (1.3 - 2.6) 58.5 (50.2 - 66.8)
Spanish 78.7 (75.7 - 81.7) 21.9 (18.7 - 25.2) 2.2 (1.2 - 3.3) 91.9 (89.1 - 94.8)
Other* 55.9 (48.7 - 63.0) 19.6 (13.8 - 25.4) 2.1 (0.2 - 4.0) 45.7 (33.6 - 57.9)
Socioeconomically Disadvantaged
No 41.8 (35.7 - 48.0) 16.1 (12.3 - 19.9) 1.1 (0.4 - 1.8) --
Yes 74.6 (72.2 - 77.1) 22.7 (20.1 - 25.3) 2.5 (1.8 - 3.2) --
Special Education
No 64.3 (59.6 - 69.1) 20.7 (18.1 - 23.4) 2.0 (1.4 - 2.6) 69.4 (62.1 - 76.8)
Yes 68.3 (62.0 - 74.6) 20.1 (16.0 - 24.3) 2.7 (1.2 - 4.1) 73.9 (65.6 - 82.1)
Service Planning Area (SPA)†
SPA 1 64.6 (57.5 - 71.7) 17.4 (12.1 - 22.7) 1.2 (0.0 - 2.7) 80.4 (66.0 - 94.9)
SPA 2 53.0 (43.5 - 62.6) 16.9 (12.4 - 21.4) 1.3 (0.1 - 2.5) 55.4 (38.6 - 72.2)
SPA 3 69.1 (60.3 - 78.0) 25.4 (19.7 - 31.1) 3.0 (1.4 - 4.6) 73.9 (60.4 - 87.4)
SPA 4 66.9 (54.9 - 78.8) 16.6 (12.7 - 20.5) 2.9 (1.1 - 4.6) 78.2 (58.9 - 97.5)
SPA 5 39.7 (20.4 - 59.1) 13.5 (12.4 - 14.6) 0.8 (0.0 - 2.0) 23.2 (0.0 - 48.4)
SPA 6 78.3 (74.2 - 82.3) 23.7 (17.5 - 29.8) 2.6 (0.9 - 4.3) 91.6 (88.8 - 94.4)
SPA 7 77.5 (71.1 - 83.9) 25.6 (18.4 - 32.7) 2.1 (0.5 - 3.7) 79.5 (65.6 - 93.4)
SPA 8 57.3 (44.0 - 70.5) 18.9 (11.7 - 26.1) 1.8 (0.7 - 3.0) 60.7 (40.0 - 81.5)
* Includes 50 other languages ranging from Albanian to Vietnamese† Data not presented in text, refer to Appendix for a Service Planning Area map CI=Confidence Interval
DATA TABLES (continued)
ORAL HEALTH OF LOS ANGELES COUNTY’S CHILDREN 35
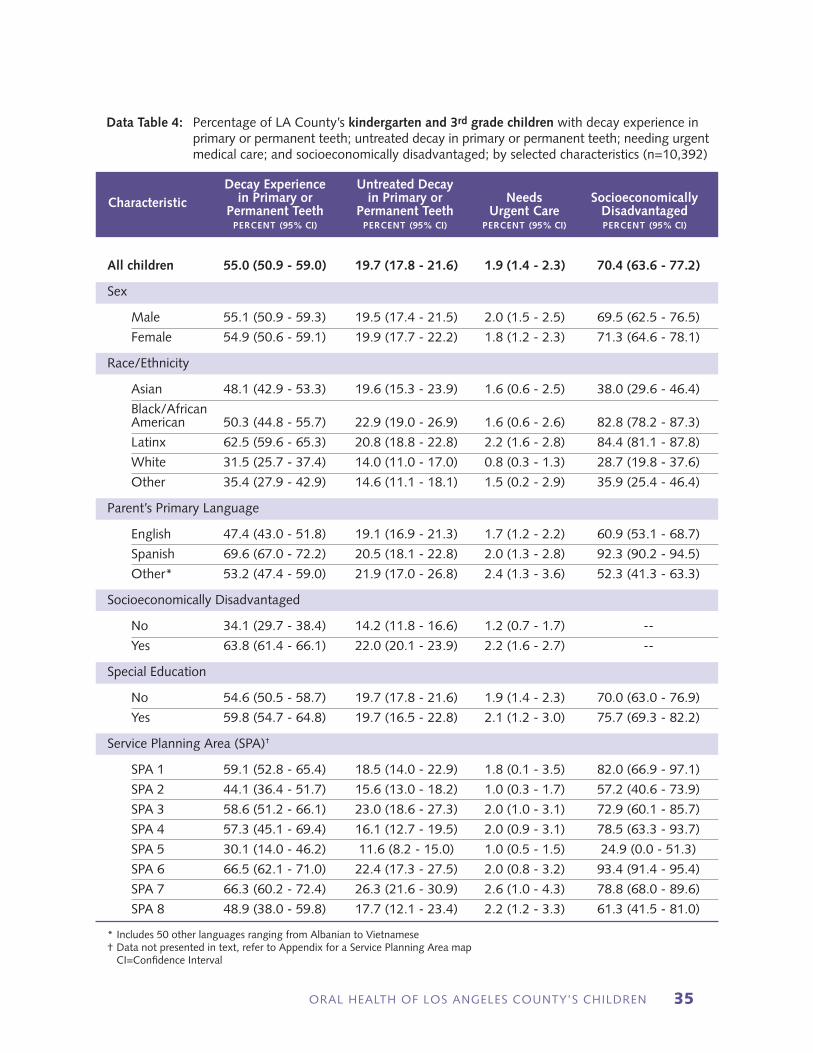
Data Table 4: Percentage of LA County’s kindergarten and 3rd grade children with decay experience in primary or permanent teeth; untreated decay in primary or permanent teeth; needing urgent medical care; and socioeconomically disadvantaged; by selected characteristics (n=10,392)
CharacteristicDecay Experience
in Primary or Permanent Teeth
percent (95% CI)
Untreated Decay in Primary or
Permanent Teethpercent (95% CI)
Needs Urgent Care
percent (95% CI)
SocioeconomicallyDisadvantagedpercent (95% CI)
All children 55.0 (50.9 - 59.0) 19.7 (17.8 - 21.6) 1.9 (1.4 - 2.3) 70.4 (63.6 - 77.2)
Sex
Male 55.1 (50.9 - 59.3) 19.5 (17.4 - 21.5) 2.0 (1.5 - 2.5) 69.5 (62.5 - 76.5)
Female 54.9 (50.6 - 59.1) 19.9 (17.7 - 22.2) 1.8 (1.2 - 2.3) 71.3 (64.6 - 78.1)
Race/Ethnicity
Asian 48.1 (42.9 - 53.3) 19.6 (15.3 - 23.9) 1.6 (0.6 - 2.5) 38.0 (29.6 - 46.4)
Black/African American 50.3 (44.8 - 55.7) 22.9 (19.0 - 26.9) 1.6 (0.6 - 2.6) 82.8 (78.2 - 87.3)
Latinx 62.5 (59.6 - 65.3) 20.8 (18.8 - 22.8) 2.2 (1.6 - 2.8) 84.4 (81.1 - 87.8)
White 31.5 (25.7 - 37.4) 14.0 (11.0 - 17.0) 0.8 (0.3 - 1.3) 28.7 (19.8 - 37.6)
Other 35.4 (27.9 - 42.9) 14.6 (11.1 - 18.1) 1.5 (0.2 - 2.9) 35.9 (25.4 - 46.4)
Parent’s Primary Language
English 47.4 (43.0 - 51.8) 19.1 (16.9 - 21.3) 1.7 (1.2 - 2.2) 60.9 (53.1 - 68.7)
Spanish 69.6 (67.0 - 72.2) 20.5 (18.1 - 22.8) 2.0 (1.3 - 2.8) 92.3 (90.2 - 94.5)
Other* 53.2 (47.4 - 59.0) 21.9 (17.0 - 26.8) 2.4 (1.3 - 3.6) 52.3 (41.3 - 63.3)
Socioeconomically Disadvantaged
No 34.1 (29.7 - 38.4) 14.2 (11.8 - 16.6) 1.2 (0.7 - 1.7) --
Yes 63.8 (61.4 - 66.1) 22.0 (20.1 - 23.9) 2.2 (1.6 - 2.7) --
Special Education
No 54.6 (50.5 - 58.7) 19.7 (17.8 - 21.6) 1.9 (1.4 - 2.3) 70.0 (63.0 - 76.9)
Yes 59.8 (54.7 - 64.8) 19.7 (16.5 - 22.8) 2.1 (1.2 - 3.0) 75.7 (69.3 - 82.2)
Service Planning Area (SPA)†
SPA 1 59.1 (52.8 - 65.4) 18.5 (14.0 - 22.9) 1.8 (0.1 - 3.5) 82.0 (66.9 - 97.1)
SPA 2 44.1 (36.4 - 51.7) 15.6 (13.0 - 18.2) 1.0 (0.3 - 1.7) 57.2 (40.6 - 73.9)
SPA 3 58.6 (51.2 - 66.1) 23.0 (18.6 - 27.3) 2.0 (1.0 - 3.1) 72.9 (60.1 - 85.7)
SPA 4 57.3 (45.1 - 69.4) 16.1 (12.7 - 19.5) 2.0 (0.9 - 3.1) 78.5 (63.3 - 93.7)
SPA 5 30.1 (14.0 - 46.2) 11.6 (8.2 - 15.0) 1.0 (0.5 - 1.5) 24.9 (0.0 - 51.3)
SPA 6 66.5 (62.1 - 71.0) 22.4 (17.3 - 27.5) 2.0 (0.8 - 3.2) 93.4 (91.4 - 95.4)
SPA 7 66.3 (60.2 - 72.4) 26.3 (21.6 - 30.9) 2.6 (1.0 - 4.3) 78.8 (68.0 - 89.6)
SPA 8 48.9 (38.0 - 59.8) 17.7 (12.1 - 23.4) 2.2 (1.2 - 3.3) 61.3 (41.5 - 81.0)
* Includes 50 other languages ranging from Albanian to Vietnamese† Data not presented in text, refer to Appendix for a Service Planning Area map CI=Confidence Interval

SMILE SURVEY 202036
Data Table 5: Percentage of LA County’s 3rd grade children with decay experience; untreated decay; and dental sealants in permanent molars; by selected characteristics (limited to the 4,523 3rd grade children with at least one permanent molar)
CharacteristicDecay Experience
in Permanent Molarspercent (95% CI)
Untreated Decay in Permanent Molars
percent (95% CI)
Dental Sealants in Permanent Molars
percent (95% CI)
All 3rd grade children 18.9 (16.3 - 21.4) 5.5 (4.2 - 6.8) 30.5 (27.5 - 33.4)
Sex
Male 16.5 (13.8 - 19.2) 4.8 (3.4 - 6.2) 30.4 (27.1 - 33.7)
Female 21.2 (18.0 - 24.4) 6.1 (4.6 - 7.6) 30.6 (27.4 - 33.9)
Race/Ethnicity
Asian 11.3 (7.0 - 15.5) 4.0 (0.8 - 7.3) 28.7 (23.2 - 34.2)
Black/African American 15.6 (11.7 - 19.4) 4.9 (2.6 - 7.2) 30.7 (19.6 - 41.8)
Latinx 22.9 (20.1 - 25.6) 6.4 (5.0 - 7.8) 29.6 (26.7 - 32.6)
White 9.1 (5.8 - 12.5) 3.2 (1.2 - 5.3) 34.1 (27.5 - 40.7)
Other 10.9 (4.7 - 17.2) 2.9 (0.0 - 6.5) 36.3 (26.8 - 45.9)
Parent’s Primary Language
English 14.4 (11.7 - 17.1) 4.3 (3.0 - 5.5) 30.5 (26.8 - 34.2)
Spanish 26.8 (23.7 - 29.9) 7.5 (5.5 - 9.5) 30.2 (26.7 - 33.8)
Other* 13.9 (9.6 - 18.3) 5.0 (1.2 - 8.9) 30.8 (23.8 - 37.8)
Socioeconomically Disadvantaged
No 9.2 (6.8 - 11.6) 3.6 (1.8 - 5.5) 30.9 (26.3 - 35.6)
Yes 23.0 (20.4 - 25.6) 6.3 (4.9 - 7.7) 30.3 (27.0 - 33.5)
Special Education
No 18.6 (16.1 - 21.2) 5.6 (4.3 - 6.8) 30.2 (27.3 - 33.2)
Yes 20.7 (15.9 - 25.5) 5.0 (2.8 - 7.3) 31.6 (25.9 - 37.2)
Service Planning Area (SPA)†
SPA 1 15.7 (11.0 - 20.3) 3.5 (1.0 - 6.1) 31.2 (21.8 - 40.6)
SPA 2 14.5 (10.2 - 18.8) 3.2 (1.5 - 4.8) 32.8 (27.1 - 38.6)
SPA 3 20.3 (13.7 - 26.8) 7.6 (4.1 - 11.0) 27.0 (21.4 - 32.7)
SPA 4 26.1 (14.4 - 37.8) 6.9 (2.3 - 11.6) 20.9 (17.7 - 24.0)
SPA 5 9.7 (2.6 - 16.8) 5.0 (0.0 - 10.2) 20.8 (1.1 - 40.5)
SPA 6 23.5 (18.7 - 28.2) 6.5 (2.1 - 10.8) 36.1 (24.1 - 48.2)
SPA 7 19.0 (12.4 - 25.7) 6.7 (3.9 - 9.4) 29.5 (23.8 - 35.2)
SPA 8 18.7 (12.0 - 25.3) 4.4 (1.5 - 7.4) 34.9 (28.1 - 41.6)
* Includes 50 other languages ranging from Albanian to Vietnamese† Data not presented in text, refer to Appendix for a Service Planning Area map CI=Confidence Interval
DATA TABLES (continued)

ORAL HEALTH OF LOS ANGELES COUNTY’S CHILDREN 37
Acknowledgments
Smile Survey 2020 was an enormous collaborative undertaking and the Los Angeles County Department of Public Health Oral Health Program extends our sincere thanks to the California Department of Education, California Department of Public Health, Los Angeles County Office of Education, Los Angeles Trust for Children’s Health, Los Angeles Unified School District, and the University of California, Los Angeles (UCLA). We would like to acknowledge and thank all the schools and students who participated in this project. We particularly want to thank the school administrators, school nurses, and volunteers who assisted our staff with distributing parental consents, organizing screening days, and helping to facilitate the screening process. Thank you also to New Lexington School and Cherrylee School for their assistance in dental screener training. Without the cooperation of the schools, this project would not have been possible. A special thank you goes to the following individuals:
(Names listed in alphabetical order)
n california department of education
Jonathan Isler, PhD
n california department of public health
Brendan Darsie, MPH
n los angeles county department of public health oral health program
Maritza Cabezas, DDS, MPH Lin Chan, DDS Rita Chen, DDS Abrey Daniel, DDS Kathy Phipps, DrPH
n los angeles county office of education
Susan Chaides, MEd, BSN, RN, CPNP Maggie Iniguez
n the los angeles trust for children’s health
Michel’le Bailey Matilde Gabriela Stella Kim, MPP Maryjane Puffer, BSN, MPA Esther Yepez, RDA
n los angeles unified school district
Janis Lake, RN Ron Tanimura, EdD Gloria E. Velasquez, RN, BSN, PHN, MEd
n university of california, los angeles (ucla)
James J. Crall, DDS, ScD Yilan Huang, BS Steve Y. Lee, DDS Honghu Liu, PhD Tu Nguyen, DDS Nadereh Pourat, PhD Jie Shen, PhD Vladimir W. Spolsky, DMD Yan Wang, PhD Di Xiong, MS Tianle Zhu, BS
Smile Survey 2020

SMILE SURVEY 202038
ORAL HEALTH OF LOS ANGELES COUNTY’S CHILDREN 39
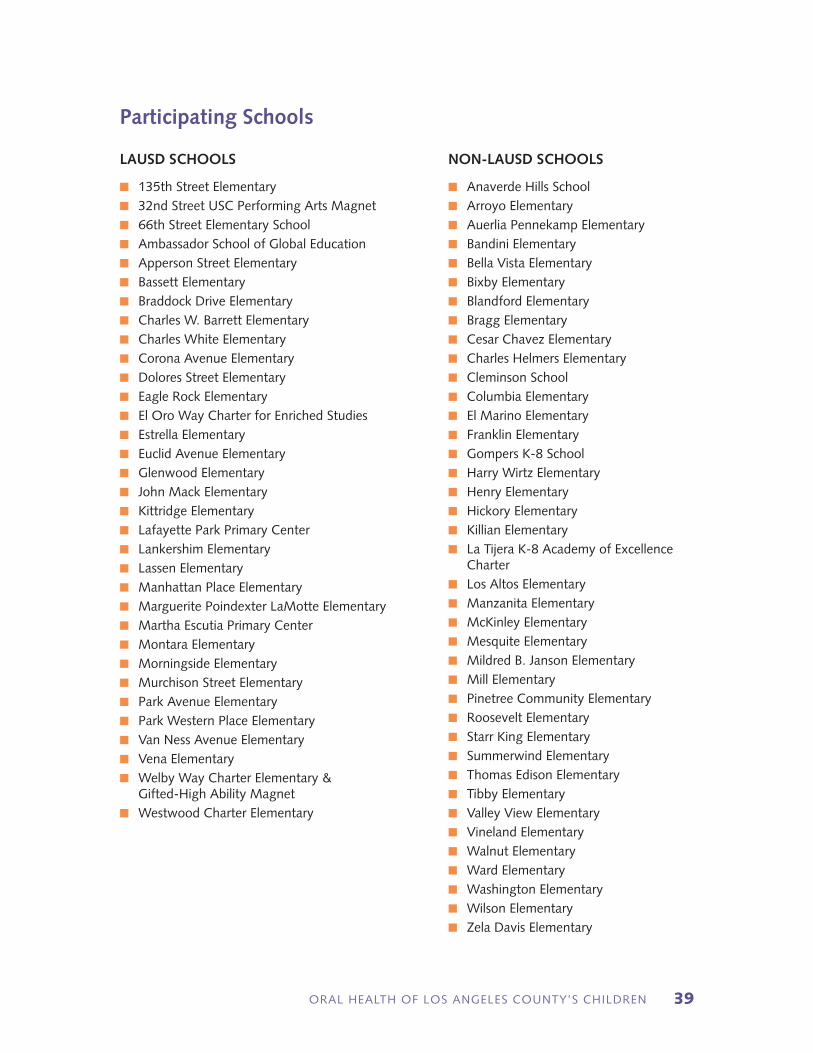
Participating Schools
n 135th Street Elementaryn 32nd Street USC Performing Arts Magnetn 66th Street Elementary Schooln Ambassador School of Global Educationn Apperson Street Elementaryn Bassett Elementaryn Braddock Drive Elementaryn Charles W. Barrett Elementary n Charles White Elementaryn Corona Avenue Elementaryn Dolores Street Elementaryn Eagle Rock Elementaryn El Oro Way Charter for Enriched Studiesn Estrella Elementaryn Euclid Avenue Elementaryn Glenwood Elementaryn John Mack Elementaryn Kittridge Elementaryn Lafayette Park Primary Centern Lankershim Elementary n Lassen Elementaryn Manhattan Place Elementaryn Marguerite Poindexter LaMotte Elementaryn Martha Escutia Primary Centern Montara Elementaryn Morningside Elementaryn Murchison Street Elementaryn Park Avenue Elementaryn Park Western Place Elementaryn Van Ness Avenue Elementaryn Vena Elementaryn Welby Way Charter Elementary &
Gifted-High Ability Magnetn Westwood Charter Elementary
n Anaverde Hills Schooln Arroyo Elementaryn Auerlia Pennekamp Elementaryn Bandini Elementaryn Bella Vista Elementaryn Bixby Elementaryn Blandford Elementaryn Bragg Elementaryn Cesar Chavez Elementaryn Charles Helmers Elementaryn Cleminson Schooln Columbia Elementaryn El Marino Elementaryn Franklin Elementaryn Gompers K-8 Schooln Harry Wirtz Elementaryn Henry Elementaryn Hickory Elementaryn Killian Elementaryn La Tijera K-8 Academy of Excellence
Chartern Los Altos Elementaryn Manzanita Elementaryn McKinley Elementaryn Mesquite Elementaryn Mildred B. Janson Elementaryn Mill Elementaryn Pinetree Community Elementaryn Roosevelt Elementaryn Starr King Elementaryn Summerwind Elementaryn Thomas Edison Elementaryn Tibby Elementaryn Valley View Elementaryn Vineland Elementaryn Walnut Elementaryn Ward Elementaryn Washington Elementaryn Wilson Elementaryn Zela Davis Elementary
LAUSD SCHOOLS NON-LAUSD SCHOOLS
SMILE SURVEY 202040
APPENDIX: Service Planning Areas (SPAs) Map
1
3
4
76
5
2
8
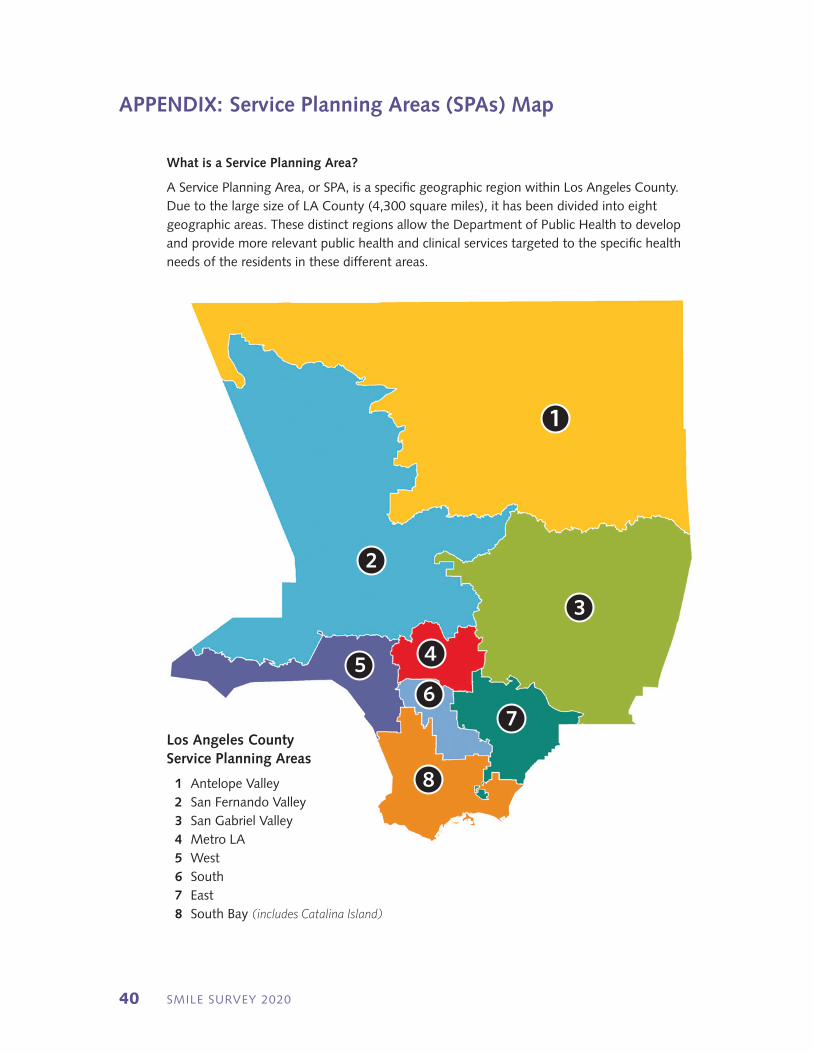
Los Angeles County Service Planning Areas
1 Antelope Valley 2 San Fernando Valley 3 San Gabriel Valley 4 Metro LA 5 West 6 South 7 East 8 South Bay (includes Catalina Island)
What is a Service Planning Area?
A Service Planning Area, or SPA, is a specific geographic region within Los Angeles County. Due to the large size of LA County (4,300 square miles), it has been divided into eight geographic areas. These distinct regions allow the Department of Public Health to develop and provide more relevant public health and clinical services targeted to the specific health needs of the residents in these different areas.

Our Vision for Los Angeles CountyA community where oral health is recognized
as essential for overall health, and where everyone has the opportunity to achieve optimal health
and well-being.
Los Angeles County Department of Public Health | Oral Health Program
3530 Wilshire Blvd., Suite 1010, Los Angeles, CA 90010
phone: (213) 351-1270 fax: (213) 387-3045email: [email protected]
web: http://publichealth.lacounty.gov/ohp
Funded by the Office of Oral Health, California Department of Public Health Contract 17-10698