SMF Q4 Report 2014
19
Business Tagline or Motto INTRIERI FAMILY STUDENT MANAGED FUND Fourth Quarter Report February 16, 2015
-
Upload
conor-chadwick -
Category
Documents
-
view
79 -
download
0
Transcript of SMF Q4 Report 2014
Business Tagline or Motto
INTRIERI FAMILY
STUDENT MANAGED FUND
Fourth Quarter Report
February 16, 2015

The students participating in the Intrieri Family Student Managed Fund would like to thank the Fund's Advisory Board for their support and guidance.
Mr. Vince Intrieri, 2011 Alumni Fellow senior managing director, Icahn Capital Management Dr. Greg Filbeck, CFA, FRM, PRM, CAIA department chair, Finance and Economics Samuel P. Black III Professor of Insurance and Risk Management Dr. Timothy Krause assistant professor of Finance Intrieri Family Student Managed Fund Advisor Mr. Eric Robbins, MBA, CFA
lecturer in Finance
Mr. Rick Hedderick, MBA, CFP
lecturer in Business
Fourth Quarter Report
Intrieri Family Student Managed Fund
President’s Message 2-4
Advisor’s Message 5
Market/Economic Analysis 6
Financial Reporting 7
Risk Management 8
Sector Analysis 9-16
End Note 17
Portfolio Holdings 18
In this report:

Annual Fund Performance
This report examines the fund’s performance over the Fourth Quarter of 2014, from September 30, 2014 through December 31, 2014, as well as the fund’s annual perfor-mance for 2014. We closed out 2014 with an annual return of 7.24%, underperforming the S&P 500 index return of 13.46% return. This was a very volatile year for the equity markets, with two minor market corrections in April and October. While a return that is dramatically below our benchmark index is disappointing, it is in alignment with many actively managed funds with a similar benchmark. According to a recent article in Barron’s magazine titled “Return of the Stock Pickers,” Sarah Max points out that eighty percent of active managers failed to beat their benchmarks. Of the ten largest actively managed funds in 2014, seven of them were benchmarked to the S&P 500, and all of them underperformed their index by a large margin (see table below). Despite faculty and analyst turnover as well as a significant cash position, we were able to perform very similarly to these funds. The article goes on to link the decade-long decline in active management performance to a concurrent steady decline in interest rates. When interest rates rise, the stock market often suffers, such that active management becomes more valuable (as long as it is done effectively). So looking forward, our relative prospects may be improving.
Fourth Quarter Report
Intrieri Family Student Managed Fund president, Aaron Filbeck
Intrieri Fund President’s Message
2

Quarterly Fund Performance
The Intrieri Family Student Managed Fund returned a positive 4.82% during the fourth quarter, slightly under-performing the S&P 500’s 4.90% return. The primary reason for performance drag was an increase in cash from the end of the third quarter, from 4.56% to 5.83%. As of the start of the first quarter of 2015, we are now fully invested to eliminate this drag on performance in the future. Our top performing sector was Consumer Staples, which returned 14.24% during the fourth quarter. In general, the sector performed very well in line with the strengthening of the United States economy. However, our performance is mostly due to our stock selection, as our holdings actually outperformed the sector ETF by over 6%. As the economy continues to strengthen, we will continue to look for invest-
ment opportunities within the industry. Our bottom performing sector was Energy, which returned -9.90% during the fourth quarter. This is mostly due to the price of crude oil, which plummeted from $112/bbl. in June to roughly $59/bbl. by the end of December. Many of our holdings in Energy, especially oil production companies, are directly affect-ed with the price of oil, and so a collapse of this magnitude caused these hold-ings to experience high negative returns. Fortunately, the IFSMF was under-weighted in the energy sector for most of the fourth quarter.
Additionally, our Investment Policy Statement currently gives us the option to invest in either Growth and Value stocks, or a blend of Value-Investing and Growth at a Reasonable Price (GRP). From a Morningstar style-box perspective, 36% of our portfolio has remained in value stocks over the past two quarters. However, we have decreased our holdings in Growth and slightly increased our holdings in Core stocks (i.e. stocks that hold both Value and Growth characteristics). So while we have remained true to our investment objectives, we have shifted a portion of our allocation away from Growth. We are continuing to implement our bottom-up approach to investing, focusing primarily on selecting the best undervalued securities and worrying less about asset allocation. Since our last quarterly report, our analysts have successfully generated price targets for almost every holding in our fund, which has allowed us to monitor our holdings more closely and make decisions when they reach their predetermined intrinsic value. Moving into 2015, we have already begun to implement better infrastruc-ture for monitoring performance to ensure we make investment decisions quickly and effectively. This quarter also marks the first full quarter that our analysts have been following to the quantitative evaluation methodology that was implemented at the beginning of the quarter, and I am very pleased to see our performance reflect these efforts by al-most matching the benchmark. Moving into the first quarter of 2015, our team will focus on performing additional valuations on a few of our stocks, as some of them have reached their intrinsic values. We want to quickly determine which holdings are still undervalued, and make new buy and sell recommendations where necessary. As we continue to perfect the methodology and infrastructure that was set in place this past quarter, Dr. Krause will also be introducing more methods for in depth analysis, such as Quantitative Equity Portfolio Management (QEPM).
Fourth Quarter Report
Intrieri Fund President’s Message
3
September 30, 2014 December 31, 2014

Moving Forward
I will be working more closely with the Ryan Mitcheltree and Amanda Myers, both of whom are Officers of Market Analysis, to begin determining appropriate sector allocations based on macroeconomic factors. Now that we have successfully implemented the stock selection process, this allows us to begin taking active bets on sector performance. We will also be moving towards aligning our portfolio allocation with the mandated benchmark in the Investment Policy Statement. Since the inception of the fund, the portfolio’s performance has been benchmarked solely to the S&P 500, despite the fact that the original Investment Policy Statement (IPS) set a benchmark of 80% S&P 500, 10% small-cap value, and 10% International. We are working to ad-just the portfolio’s exposure to small cap and international stocks in order to diversify away from the S&P 500 Index in some small part and to comply with the original mandate of the IPS. During this past year, we cannot ignore our underperformance to the benchmark even though active managers had a rough time in 2014. However, by the end of 2015, our analysts will have a full-year of using this new methodology, and I am confident with our current and future analysts and their ability to continue this positive trajectory that we witnessed at the end of the year. Regards,
Aaron Filbeck, President & Chief Investment Strategist
Fourth Quarter Report
Intrieri Fund President’s Message
4
Cash, 5.83%, 5.83%
Consumer Staples, 9.56%, -0.24%
Healthcare, 6.09%, -8.11%
Utilities, 6.14%, 2.94%
Communication Services, 3.02%, 0.72%
Financial Services, 6.61%,
-10.09%
Consumer Discretionary, 9.29%, -2.81%Industrials, 19.92%,
9.52%
Technology, 20.23%,
0.53%
Basic Materials, 5.00%, 1.80%
Energy, 8.32%, -0.08%
Fund Allocation as of 12/31/2014Sector Portfolio Weights and Relative Over/Under Weight as
compared to S&P 500

Continued Improvement
Dear Benefactors and Supporters of the Intrieri Family Student Managed Fund,
First of all I would again like to thank Aaron and the Sr. Leadership team for putting
together this report in a timely fashion. We have continued to make progress in
terms of both process and performance, and the efforts of the students have made
these results possible. While the fund’s performance lagged the S&P 500 during
most of 2014 (as did most professional active managers, as noted previously by Aa-
ron), we matched this benchmark during Q4 and have put in place processes and
techniques that should help us outperform in the future.
The Student Officers, Lead Analysts, and FIN 461 students have done an excellent
job in evaluating the fundamental intrinsic value of almost all of the stocks in the
Fund. This process will be completed for the few remaining stocks in short order,
and we will be much more confident in the value of the stocks in our portfolio.
I am quite pleased with the efforts of the Fund Officers to provide further enhancements to the Fund’s operations.
Aaron has been leading efforts to ensure that our sector and style decisions are consistent with the Fund’s Investment
Policy Statement. Justin has been instrumental in improving the reporting processes that will help our analysts evalu-
ate the value of stocks in their respective sectors on a near ‘real-time’ basis.
As Aaron notes, the original Investment Policy Statement for the IFSMF called for a benchmark composed of 80%
S&P 500, 10% EAFE, and 10% Russell 2000. However, as a practical matter, the benchmark used in previous reports
has been 100% S&P 500 since our portfolio most resembled that index. But this semester one of our goals is to seek
out undervalued stocks in the small-cap and international sectors so that we may use the benchmark that was originally
mandated at the inception of the Fund.
Please feel free to contact me at any time with questions, comments, and/or suggestions for improvement!
Best Regards,
Dr. Tim Krause
Faculty Advisor to the Intrieri Family Student Managed Fund
Fourth Quarter Report Intrieri Fund Faculty Advisor’s Message
Intrieri Family Student Managed Fund Advisor, Dr. Tim Krause
5
FINANCIAL REPORTING
THE GLOBAL ECONOMY
The European economy continues to struggle, as inflation fell to -0.2% in December 2014 compared to 0.3% in No-vember 2014, and Greece suffered the lowest annual inflation rate of -2.5%. In an attempt to stimulate the European econ-omy, the European Central Bank has issued a stimulus pro-gram worth $1.3 trillion (Reuters Thompson). This is the first time the bond buying program will cover bonds issued by the euro-zone governments. Junk bonds from struggling economies, such as Greece, still meet the parameters of the stimulus package. Purchases will begin in March 2015 and will start at $70 billion a month, and will continue until September 2016. Mario Draghi, the president of the ECB, stated the stimulus would continue if the Bank’s inflation target of 2.0% is not reached. The ECB announcement of the stimulus caused a sharp decline in the Euro against the USD. Recently, the Euro fell to around $1.14 against the dollar, which is its low-est level since November 2003. Despite OPEC’s statement to continue their current supply of oil production, crude oil prices have continued to fall, and as a result, gas prices are falling and energy companies are suffering. OPEC has also increased their production in order to increase their market share with US oil companies. Oil prices have fallen more than 50% since June 2014 to their lowest level in six years. The massive decline in oil prices is having a massive impact on oil companies, such as Royal Dutch Shell, which will cut $15 billion of investment due to the crash in oil prices. The company missed earnings esti-mates in the fourth quarter profit due to the slide in oil pric-es.
THE UNITED STATES ECONOMY
In contrast to the rest of the world, the United States econo-my is growing. US consumers are benefiting from global disinflation and The Federal Reserve did not appear to be
flustered with the plummeting oil prices or the turbulence in international markets.
US unemployment continues to fall and reached its lowest rate since 2008, fluctuating around 5.7% over Q4. This is a dramatic decline from 7.0% to 5.6% over the span of the last year. The U6 unemployment rate fell proportionally from Q3’s 11.7% to 11.2% ending in December 2014. Labor Par-ticipation showed minor fluctuations, but remained around 62.8, the lowest level in nearly forty years. The positive in-crease in employment and strong job growth is projected to improve further into 2015.
Despite the somewhat encouraging development in employ-ment, the Federal Reserve has continued to keep interest rates low, although they have stated they will raise them in the second half of 2015 This is mostly due to low inflation. In Q4, the US saw the lowest inflation rate in a year, drop-ping to 0.8% in November. The drop is most likely a reflec-tion of plunging energy prices.
The Standard & Poor’s 500 Index (S&P 500), which currently serves as the primary benchmark for the fund, experienced extensive fluctuation toward the end of 2014. The lowest period was 1862.49 points in mid-October, which increased steadily until December, peaking at 2090.15. December brought fluctuations along with year record highs that marked the fastest growth of the US economy in recent his-tory.
Gross Domestic Product (GDP) grew in Q4 by 3.2% at an annualized rate, slightly down from a 4.1% growth rate in the previous quarter. According to the Bureau of Economic Analysis, the growth reflected positive contributions in part from personal consumption, private inventory investment, exports, and spending by state and local governments. The deceleration in GDP growth is attributed to an increase in imports and a downturn in federal government spending.
Over Q4, the United States economy remained mid-cycle with peaking growth and neutral policy measures. At this stage in the business cycle, the fund should continue under-weighting Utilities and Materials, which tend to be more sen-sitive to interest rates. For the overweighed sectors, capital goods producers included in Information Technology and Industrials sectors are in a good position as GDP continues to expand.
Looking forward, it does not seem likely that the Fed will be raising interest rates until April at the earliest. Despite the significant improvement in the unemployment rate, the Fed looks instead to the slowly growing rate of inflation as a rea-son to keep interest rates near zero for a little while longer.
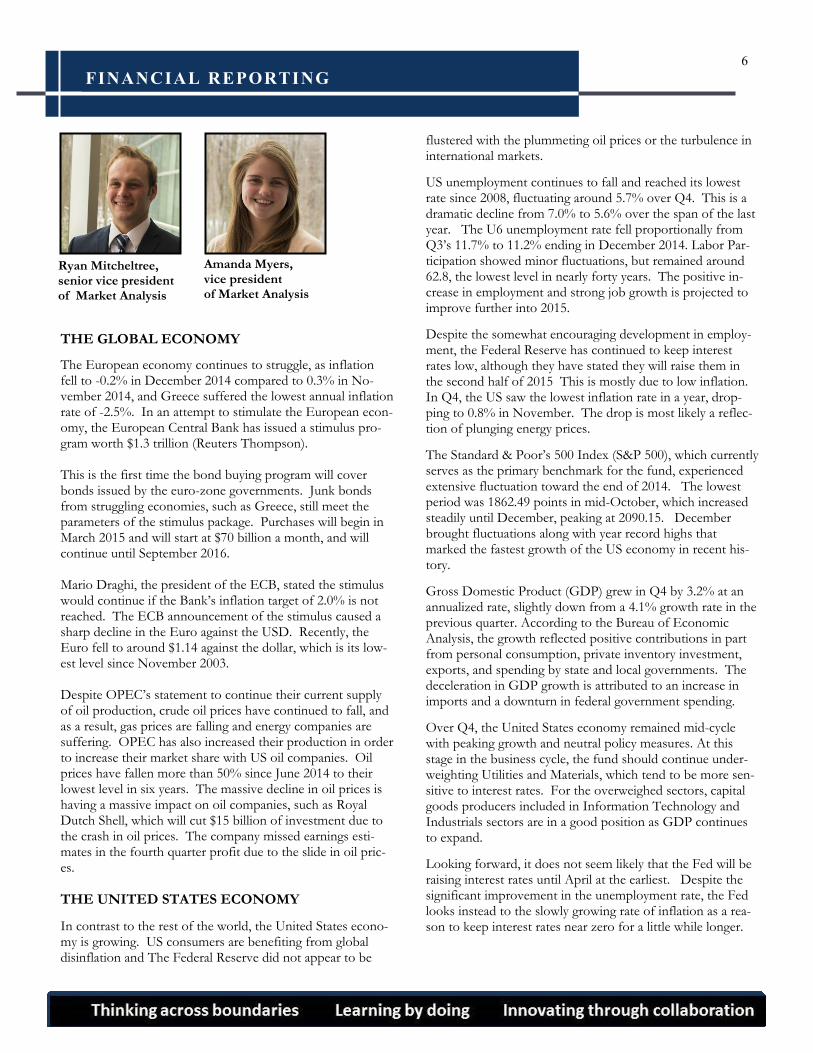
Ryan Mitcheltree, senior vice president of Market Analysis
Amanda Myers, vice president of Market Analysis
6

FINANCIAL REPORTING & LOOKING FORWARD
FINANCIAL REPORTING
This past semester introduced a lot of new organizational, infra-structure, and valuation methodologies, which has allowed us to begin increasing efficiency in our reporting and monitoring of the fund. I am proud to announce the creation of a series of re-ports that will be sent to lead analysts. Building off of the Price Target spreadsheet, I have been able to introduce macros in the Excel workbook that now are able to retrieve the current prices from the Yahoo! Finance and automatically update them in the workbook. This will create an easy process for analysts to monitor the portfolio, as well as the specific stocks in their sector. To further promote active monitoring of sectors, we began implementing new reporting methods, in the form of a weekly email to the lead analysts of each semester. These reports will contain the holdings within for their sector, the performance of the sec-tor and holdings over the past week, the sector’s relative performance to their benchmark ETF, and the current potential appre-ciation for each sector. All of the reports include graphs to help visualize the data. The first graph shows each sector’s performance, relative to the ETF benchmark and compares it against the other sectors in the fund. This will be useful for showing an adjusted performance against the select Sector ETFs. The second chart shows the potential appreciation or each sector. This report is currently being sent out every week manually, but I am working to have it sent out automatically once the database is set up. Our financial reporting database will continually be updated as we continue to look into additional reports to be sent out to ana-
lysts. These reports will differ from performance reports, so they will not be sent out as frequently. Currently, I am working on
having a report that will alert an analyst if one of their holdings falls below an 8% appreciation potential level. This will serve as a
safety net for lead analysts that are not activity managing there sectors. Additionally, another report that we are considering pro-
vides an alert that tells each lead sector Analyst if an unpurchased, but previously evaluated stock has depreciated below an 8%
potential appreciation.
Dr. Krause, Aaron, and I are very excited about having these reports in place. As I am developing these reports on an iterative
basis, the repots will continue to improve as I take suggestions from our team. We hope the reports will lead to more monitor-
ing of our current holdings. I have been working with Excel Access, Visual Cut, and Crystal reports for the implementation of
these reports. My goal is to have these reports run automatically before I leave the fund in May. This will only require future
members to update the Price Target Sheet for the reports to run. I would like to give a special thanks to Dr. Ido Millet for assist-
ing me in the creation of the reports.
In the interest of further improvement and visibility, we have now included the full portfolio holdings of the Fund in this new
iteration of the quarterly report (on page 18). Finally, I would like to mention that this is the fund’s first semester with an analyst
in my position as SVP of Financial Reporting. This position replaces the former VP of Quality Control since we now have many
quality control processes in place, and we are moving towards providing more sophisticated financial reporting and analysis.
Justin Staab, senior vice president of Financial Reporting
7
RISK MANAGEMENT & SE CTOR ANALYSIS
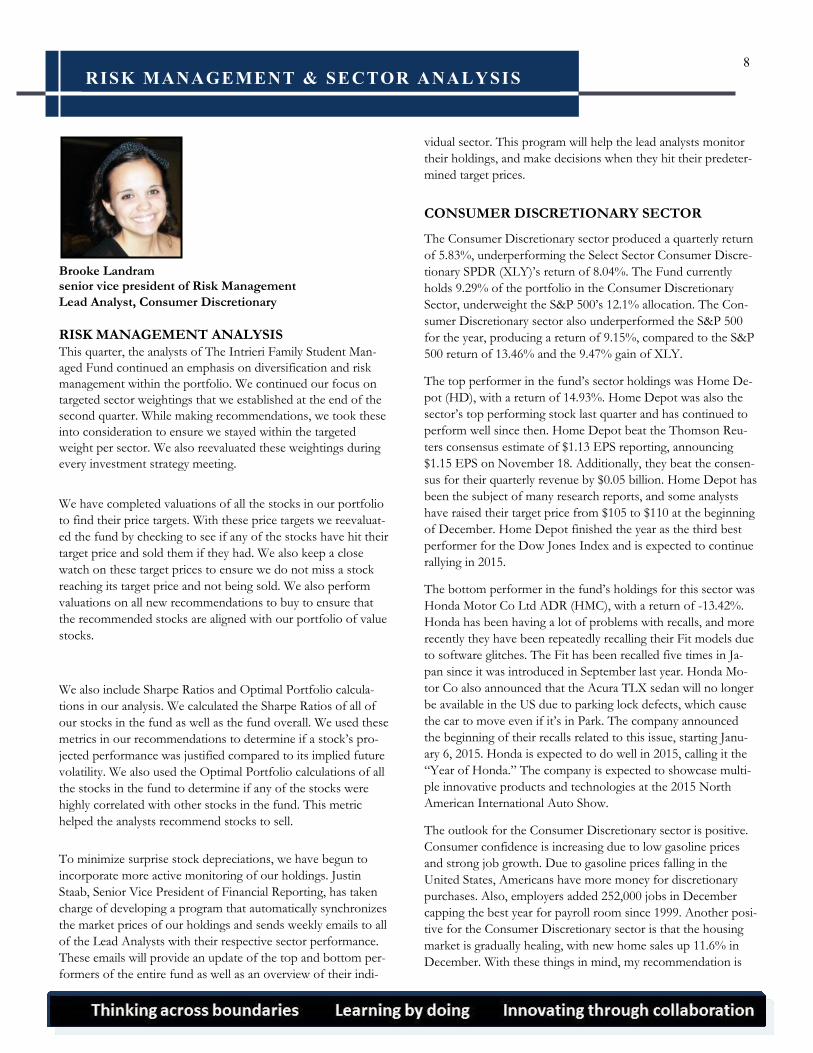
Brooke Landram senior vice president of Risk Management
Lead Analyst, Consumer Discretionary
RISK MANAGEMENT ANALYSIS This quarter, the analysts of The Intrieri Family Student Man-
aged Fund continued an emphasis on diversification and risk
management within the portfolio. We continued our focus on
targeted sector weightings that we established at the end of the
second quarter. While making recommendations, we took these
into consideration to ensure we stayed within the targeted
weight per sector. We also reevaluated these weightings during
every investment strategy meeting.
We have completed valuations of all the stocks in our portfolio
to find their price targets. With these price targets we reevaluat-
ed the fund by checking to see if any of the stocks have hit their
target price and sold them if they had. We also keep a close
watch on these target prices to ensure we do not miss a stock
reaching its target price and not being sold. We also perform
valuations on all new recommendations to buy to ensure that
the recommended stocks are aligned with our portfolio of value
stocks.
We also include Sharpe Ratios and Optimal Portfolio calcula-
tions in our analysis. We calculated the Sharpe Ratios of all of
our stocks in the fund as well as the fund overall. We used these
metrics in our recommendations to determine if a stock’s pro-
jected performance was justified compared to its implied future
volatility. We also used the Optimal Portfolio calculations of all
the stocks in the fund to determine if any of the stocks were
highly correlated with other stocks in the fund. This metric
helped the analysts recommend stocks to sell.
To minimize surprise stock depreciations, we have begun to
incorporate more active monitoring of our holdings. Justin
Staab, Senior Vice President of Financial Reporting, has taken
charge of developing a program that automatically synchronizes
the market prices of our holdings and sends weekly emails to all
of the Lead Analysts with their respective sector performance.
These emails will provide an update of the top and bottom per-
formers of the entire fund as well as an overview of their indi-
vidual sector. This program will help the lead analysts monitor
their holdings, and make decisions when they hit their predeter-
mined target prices.
CONSUMER DISCRETIONARY SECTOR
The Consumer Discretionary sector produced a quarterly return
of 5.83%, underperforming the Select Sector Consumer Discre-
tionary SPDR (XLY)’s return of 8.04%. The Fund currently
holds 9.29% of the portfolio in the Consumer Discretionary
Sector, underweight the S&P 500’s 12.1% allocation. The Con-
sumer Discretionary sector also underperformed the S&P 500
for the year, producing a return of 9.15%, compared to the S&P
500 return of 13.46% and the 9.47% gain of XLY.
The top performer in the fund’s sector holdings was Home De-
pot (HD), with a return of 14.93%. Home Depot was also the
sector’s top performing stock last quarter and has continued to
perform well since then. Home Depot beat the Thomson Reu-
ters consensus estimate of $1.13 EPS reporting, announcing
$1.15 EPS on November 18. Additionally, they beat the consen-
sus for their quarterly revenue by $0.05 billion. Home Depot has
been the subject of many research reports, and some analysts
have raised their target price from $105 to $110 at the beginning
of December. Home Depot finished the year as the third best
performer for the Dow Jones Index and is expected to continue
rallying in 2015.
The bottom performer in the fund’s holdings for this sector was
Honda Motor Co Ltd ADR (HMC), with a return of -13.42%.
Honda has been having a lot of problems with recalls, and more
recently they have been repeatedly recalling their Fit models due
to software glitches. The Fit has been recalled five times in Ja-
pan since it was introduced in September last year. Honda Mo-
tor Co also announced that the Acura TLX sedan will no longer
be available in the US due to parking lock defects, which cause
the car to move even if it’s in Park. The company announced
the beginning of their recalls related to this issue, starting Janu-
ary 6, 2015. Honda is expected to do well in 2015, calling it the
“Year of Honda.” The company is expected to showcase multi-
ple innovative products and technologies at the 2015 North
American International Auto Show.
The outlook for the Consumer Discretionary sector is positive.
Consumer confidence is increasing due to low gasoline prices
and strong job growth. Due to gasoline prices falling in the
United States, Americans have more money for discretionary
purchases. Also, employers added 252,000 jobs in December
capping the best year for payroll room since 1999. Another posi-
tive for the Consumer Discretionary sector is that the housing
market is gradually healing, with new home sales up 11.6% in
December. With these things in mind, my recommendation is
8

SECTOR ANALYSIS
BASIC MATERIALS
The Basic Materials sector had a quarterly return of
1.88%, outperforming the Materials Select Sector SPDR
ETF (XLB) return of -1.35%. Basic Materials comprises
5.0% of the overall portfolio, which is slightly less than
last quarter’s weight of 5.2%. However, it is still over-
weight relative to the S&P 500 index’s weight of 3.2%.
Despite our performance, my recommendation is to re-
duce the weight to closer match the benchmark.
Our best performing stock was Monsanto Co (MON)
with a 6.2% return in the fourth quarter. Despite this, we
will estimate a potential appreciation of 9.4% and a price
target of $131.27. The consensus price target as reported
by Analyst Ratings Network is $125.49, with an overall
consensus rating of Buy. Monsanto reported a 34% de-
cline in profits, however this was still better than analysts
expected. I think we should continue to hold this stock,
but as it draws nearer to its estimated valuation we will
look for alternatives that offer a higher risk-adjusted re-
turn. Despite Monsanto facing a lot of criticism for its
involvement with genetically modified foods, or GMO’s, it
still reported growth in seed sales, especially in South
America and other international markets. MON is experi-
encing positive benefits from the fall of oil costs, which
translates to the reduction of food costs and ultimate in-
crease of demand for Monsanto’s products. Looking for-
ward, one risk MON faces is the growing strength of the
dollar, which could hurt their international sales and leave
them victim to foreign currency fluctuations.
The worst performing stock in the sector was DOW
Chemical Co (DOW) with a return of -13.0% in the
fourth quarter. We have a price target of $58.80 listed for
DOW, which means its current potential appreciation is
31.9%. Dow announced EPS of $0.85 on January 29, out-
performing Thomson Reuters consensus estimates of
$0.65 EPS. This change sparked Gilford securities to up-
grade them to a neutral status while Analysts at Nomura
and Deutsche Bank maintain a buy status with valuations
at $57.00 and $55.00, respectively. One of the major rea-
sons for DOW’s performance is the collapse of oil prices.
One of Dow’s main products is ethylene, which is used to
create energy, and accounts for nearly 25% of DOW’s
revenue. On the positive side DOW is expanding into new
sectors to reduce their dependence on energy, and man-
agement has committed to a $7-8.5 billion asset divestiture
program. Right now, the biggest risk DOW faces is the
continued fall of the price of oil, which we will take into
account when we perform a new valuation.
We will continue to closely examine our holdings in this
sector to determine whether or not the stocks we own are
still undervalued and viable holdings. The Materials sector
is estimated, by Business Insider, to have a first-quarter
profit expectations growth of 4.3%. This is down from
initial expectations due to the stronger dollar hurting the
U.S. multinationals within the sector.
I recommend an underweighting of this sector to reflect
the poor growth prospects and slight overweight that cur-
rently exists. According to Fidelity Research, the U.S.
economy remains in the mid-cycle expansion phase of the
business cycle. Historically, The Basic Materials sector has
underperformed in this phase of the cycle. Sectors that
typically perform well in mid-cycle expansion phase are
Industrials and Information technology. Reallocating capi-
tal to these sectors could prove to be more beneficial.
Andrew Dylewski Lead Analyst, Basic Materials
9

SECTOR ANALYSIS
CONSUMER STAPLES
In fourth quarter of 2014, the fund’s Consumer Staples
holdings yielded a return of 14.24%, the highest return in
the portfolio. Additionally, our holdings in this sector out-
performed the SPDR Consumer Staples (XLP) ETF’s re-
turn of 8.16%. This sector was able to bounce back from
the third quarter as a result from the lackluster perfor-
mance of the United States economy.
The top performing stock in our sector was Kroger (KR),
with a return of 23.84%. This is due to their record-setting
third quarter results and beat Wall Street’s target. Kroger
was able to beat Whole Foods’ same store comps gain and
outgrew both Target and Wal-Mart. This was due to ex-
pense control and strong sales leverage. Concerning their
performance, Rodney McMullen CEO, said, “results were
driven by strong sales and core business performance, and
helped by higher fuel margins.” One potential risk for
Kroger is their level of debt. The $11.5 billion in debt is a
result of the recent acquisitions of Harris Teeter and Vita-
cost. These acquisitions were made to help Kroger expand
their network of stores and add more organic food op-
tions. The company hopes to have a healthier debt level by
the end of this year as reported by Motley Fool. In the
third quarter, Kroger bought back 600,000 shares totaling
$29 million.
The sector’s bottom performing stock was Procter &
Gamble (PG), with a return of 9.62%. This is due to
P&G’s plan to streamline their portfolio. “It plans to focus
on 70 to 80 core brands that make up 95% of current
profits and 90% of sales” as reported by Investor’s Busi-
ness Daily. This is a good idea. By doing this P&G will be
able to focus on their core brands and improve business
functions. In the process of streamlining, P&G and Berk-
shire Hathaway were able to agree to a deal that includes
an exchange of P&G shares. In addition, P&G agreed to
sell some of their soap brands to Unilever. A report pro-
duced by The Street rates P&G a buy.
Yahoo! Finance claims that “Consumer Staples stocks
stand to benefit in the current uncertain market environ-
ment given their defensive attributes.” Currently, our port-
folio holds 9.56% in Consumer Staples, slightly under-
weight the S&P 500 Index’s weight of 9.75%. In regard to
our current holdings, Constellation Brands and Kroger are
overvalued. Therefore, my top priority will be to find via-
ble replacements. I will continue to evaluate our holdings
within this sector and will make sure the proper actions
take place.
Paul Toma
Lead Analyst, Consumer Staples
10

SECTOR ANALYSIS
ENERGY
During the fourth quarter, the portfolio’s holdings in the Energy sector yielded a return of -9.90%, outperforming the Energy Select Sector SPDR ETF (XLE) of -12.10%. As of quarter-end, 8.32% of our portfolio is comprised of Energy stocks, which is slightly underweight compared to the S&P 500 Index’s weighting of 8.44%. Since June of last year, crude oil has declined by 60%! At the end of the year we increased the weight in this sector towards its weight in our benchmark, and recently have taken a slight-ly overweight position.
The top performer in the energy sector was National Fuel Gas Company (NFG), which yielded a -0.66% return. Na-tional fuel didn’t suffer nearly as much as some of the oth-er companies during these dramatic declines in oil prices over 2014. They were able to drive down costs of wells to $6.5 million per well, allowing them to keep 3 rigs active during the quarter, according to CEO Ronald Tanski. In the coming weeks, we will further evaluate this particular stock to determine if we should continue holding it, as it is nearing our current price target of $69.00. Recently, the company reported a $0.68 EPS, $0.10 higher than ex-pected. These factors seem to have had a positive impact on their limited negative return for the quarter.
Our worst performer was Halliburton Co (HAL), with a negative 39.03% return. Our price target for Halliburton Co is $61.92, compared to its current price $40.82, a 51.62% potential appreciation, although this valuation was undertaken with a significantly higher price of oil. Halli-burton underperformed its peers when crude oil started to decrease, but noted that they actually outperformed peers when oil prices were rising, according to Alex Chamberlin from Wall Street. Some of Halliburton’s customers recent-ly reduced their technology budget in order to cut costs, which negatively impacts revenues and profits for Halli-burton. According to Wall Street, energy producers are decreasing production and rig activities. Despite all of this,
they recently proposed a merger with Baker Hughes, creat-ing more value for the company. Large companies with high market power are typically favored in equity markets. So, according to Forbes, this acquisition can prove to be very beneficial to shareholders in the long run. They con-tinue to face some risks of existing competitors, lower oil prices, and operational risks, all of which we will evaluate in the coming weeks.
According to Bloomberg Businessweek, oil prices are at their lowest level since the end of the recession. They also state that large oil and gas companies, including some of our holdings such as ExxonMobil and Chevron, capture a larger share of the increase when oil prices rise. We will continue to monitor and analyze each of the stocks within the sector, and begin replacing stocks, like National Fuel, when they reach their appreciation potential.
Due to the rapid decline in oil prices, the end of 2014 was difficult for the Energy sector. According to Fidelity, com-panies are now paying close attention to cost control, which can be very beneficial for investors. Also, by own-ing a majority of U.S. Exploration and Production compa-nies with prime drilling locations, controlled costs, and low leverage, we have an excellent opportunity to outper-form. Valuations are probably very appealing right now, but we will need adjust our valuations to account for cur-rent oil prices, which are now closer to $50/bbl., rather than $100/bbl. According to Fidelity, the sector has his-torically outperformed the rest of the market as oil prices rebound to their true value.
Conor Chadwick
Lead Analyst, Energy
11

SECTOR ANALYSIS
FINANCIAL SERVICES
The Financial Services sector holdings in the portfolio
returned 6.28% over the duration of the fourth quarter,
slightly underperforming the Financial Select Sector SPDR
ETF’s return of 7.29%. Throughout the quarter, this sec-
tor realized the most security turnover, as a few of the
held stocks appreciated to their intrinsic value.
The top performer in the Financial Services sector was
Visa Inc. (V) with a 22.89% return. Visa saw massive ap-
preciation after their third quarter earnings report, where
adjusted earnings improved 14%, full-year income rose
15%, and earnings per share rose 17% for the quarter. All
of this happened despite ongoing litigations for conspiring
to fix swipe fees. Visa has also experienced an increase in
cross-border transactions, up 10% year-over-year and 5%
increase in transaction revenue. After the end of the year,
and a market surge, Visa’s share price appreciated and
temporarily surpassed my price target of $259.12. Most
recently, Visa’s price did fall in the last week of January
after a surprisingly negative reaction to 4 for 1 stock split
and a solid earnings report. However, I am confident that
it will quickly climb back up to its target. I will continue to
watch this company carefully, perform another valuation
and begin looking for a replacement.
The bottom performer for the fourth quarter was MetLife
(MET), with a return of -2.52%. This primarily is due to
the timing of purchase, which was near the end of the
quarter (December 9, 2014). This was right before the fall-
ing price of oil caused the market to drawback at the end
of the quarter. As the market was starting to recover,
MetLife was designated “systemically important” by the
Financial Stability Oversight Committee. This placed ad-
ditional government oversight on the company, as well as
requiring greater disclosure requirements and higher capi-
tal standards. It has since filed a legal challenge against the
designation, and the case is ongoing. While MET fell
sharply after the designation, it has since rebounded from
its low of $46.50 on January 30th and shown steady
growth for the past week. It’s target price may change
depending on the results of its court case, but as of right
now it still holds a great deal of growth potential.
The portfolio currently holds 8.88% in the Financial Ser-
vices sector, which is considerably underweight than the
S&P 500 weighting of 16.7%. While Aaron wanted to see
our weighting increase of this past quarter, so many of
these stocks hit their intrinsic values and were subsequent-
ly sold, making it difficult to find replacements quickly.
Some of these companies that were sold also held consid-
erably large positions within in our overall portfolio, such
as JPMorgan Chase & Co. (JPM) at 3.81% and Wells Far-
go & Co (WFC) at 4.16%.
I am bullish on this sector, and my hope this that we will
be able to increase the weighting throughout the next
quarter. This industry is especially favorable in a rising
interest rate environment, as it usually signals a strengthen-
ing economy. This means that borrowers are better able to
pay off loans, increasing interest income for banks, and
insurance companies will eventually benefit from higher
returns in the bond market. While the market as a whole
is still weighed down by declining oil prices, financial firms
stand to make significant gains as the price of oil begins to
creep back up.
Most of the stocks in this sector are still significantly un-
dervalued, excluding PNC Financial Services and Visa
Inc., both of which will be my top priority in the coming
quarter.
Joshua McAleer
Lead Analyst, Financial Services
12

SECTOR ANALYSIS
HEALTH CARE
The holdings in the Health care sector produced a quarter-ly return of 13.40% during the fourth quarter, making it the second best performing sector in the portfolio. The holdings also outperformed the Health Care Select Sector SPDR ETF (XLV) return of 7.40%, beating it by 6.00%.
The top performer in the Healthcare sector was Halyard Health, Inc. (HYH) with a 38.59% return. However, this stock comprised less than 1% of the sector and a tiny frac-tion of the fund. This stock entered the portfolio as a re-sult of the decision by Kimberly-Clark (KMB) to spin-off its health care business to focus on their consumer and professional brands. Every shareholder of Kimberly Clark was awarded 1 share of HYH for every 8 shares owned in KMB.
The second best performing stock in Healthcare was CVS Health Corp. (CVS) with a 21.01% return during the quar-ter. Their performance is largely due to an approved 27% increase in its quarterly dividend. Additionally, the perfor-mance was aided by an upgrade to buy status by many ana-lysts and an increase in their price target. The worst per-forming stock in the sector was Cigna Corp. (CI) which posted a 0.56% return over the period, but we owned this stock for a short period in Q4. According to Fidelity In-vestments, there is significant innovation that is expected to continue to occur in the Health Care sector, especially in biotechnology and health care information technology, which will make attractive investment opportunities.
We believe that with the growing age of the population, markets will increase their spending on health care making this an opportune sector. The direction of the aging popu-lation is considered a long term trend that makes this sec-tor unique because its positive performance could remain constant into the future regardless of economic cycles.
One of our areas of focus in this coming quarter are Health Care IT companies that offer the ability for con-sumers to compare prices for prescriptions and for low cost vs. highest quality services, right on their mobile de-vices. This is a relatively young industry, but we see invest-ment opportunities. However, the risks this sector faces primarily include uncertainty around U.S health care re-form and public scrutiny from high prescription costs, which could result in short-term price volatility.
The fund remains underweight in Healthcare, representing 6.36% of the fund compared to the S&P 500 weighting of 14.17%. Based on where we believe the market currently is, the Health Care sector has an opportunity to perform in the future. Historically, it has outperformed the market in the late stage of the business cycle, which leads us to a recommendation to obtain a market weighting of 14.17%.
Two of the stocks in the sector remain overvalued (Biogen and Pfizer). we will continue to search for recommenda-tions to fill these spots in addition to other stocks required to reach a market weighting.
Tyler Brose
Senior Lead Analyst,
Health Care
13
Kevin Pascale
Lead Analyst, Health
Care

SECTOR ANALYSIS
INDUSTRIALS
For the fourth quarter, the Industrial Sector in the fund
produced a return of 5.29%, underperforming compared
to the Industrial Sector ETF (XLI) return of 7.06%.
The top performer in the fund was Union Pacific Corpo-
ration (UNP), where we realized a 9.88% return. Union
Pacific is the largest rail company in North America. The
company is not heavily dependent on crude oil and has
multiple revenue sources. Union Pacific has a diversified
business mix which includes Agricultural Products, Auto-
motive, Chemicals, Coal, and Industrial Products. Rail-
roads are a critical link for the boom in U.S. oil produc-
tion. They are responsible for transporting to and from
shale fields that are beyond the reach of existing pipelines.
Given the important role of railroads, Union Pacific shares
are up 31%. Union Pacific released their EPS of $1.53 per
share and their revenue of $6.18 billion, outperforming
analyst expectations for both.
The bottom performer for the Industrial sector was Gen-
eral Electric (GE). General Electric yielded a -0.51% re-
turn for this quarter which is higher than last quarter’s
performance of -2.51%. General Electric currently has a
high dividend yield of 3.6% compared with an average of
about 2.1% for its peers. However, GE shares are down
10.5% over the past 12 months. In the past weeks the
company promoted its new fridge that has the ability to
brew coffee using a Keurig K-cup. They also confirmed an
order for wind turbines worth $491 million to a Brazilian
renewable energy developer. We evaluated General Elec-
tric using relative value and discounted cash flow analysis
and the results were to “Do Not Own” the stock. There-
fore, it will be my first priority to find a sufficient replace-
ment for this stock.
The current Industrial sector is overweight, 19.92% versus
10.4% in the S&P 500. We recommend holding the cur-
rent weight in the sector and continue to perform valua-
tions on the current stocks. Due to our holding’s under-
performance, we will have to evaluate whether to continue
to have an overweight status on this sector. In terms of
portfolio attribution, Industrials contributed -.12% of ex-
cess performance in the fund and this is composed
of .15% positive contribution from overweighting this
sector. Breaking it down further, our asset allocation deci-
sion contributed .30% to our return, but -0.27% of the
excess was due to stock selection. Therefore, my priority
will be to focus on better stock selection, starting with the
stocks in the industrial fund that are currently overvalued.
These are Westinghouse Air Brake, Union Pacific Corp,
Cummins Engine, and Lockheed Martin.
Abby Luke
Lead Analyst, Industrials
14

SECTOR ANALYSIS
Justin Staab Lead Analyst, Information Technology Lead Analyst, Telecommunications
INFORMATION TECHOLOGY
In the fourth quarter of 2014, our holdings in the Infor-
mation Technology sector returned 2.18%, underperform-
ing the Technology Select Sector SPDR ETF’s return of
5.27%.
The bottom performer was International Business Corpo-
ration (IBM), with a quarterly return of –15.7%. At the
end of the third quarter, we held 23 shares of IBM. How-
ever, in December, our team voted to double the amount
to shares we held, for a total of 46 shares. This was done
due to a recalculated intrinsic value of $178.94. However,
IBM finished the year trading at $160.44. This is the sec-
ond consecutive year that IBM has been the worst stock in
the Dow Jones Industrial. According to Forbes, there are
several reasons why IBM’s stock price has been declining.
IBM has been seeing shrinking margins in their cloud
business, despite continuing to expand features. IBM his-
torically has done well in emerging markets, however, Chi-
na has announced that they wish to be solely reliant on
their own information technology by 2020, which will es-
sentially eliminate IBM’s market share within the Chinese
market. Additionally, since their 142 acquisitions in 2001,
IBM has never realized any goodwill impairment. I will
continue to watch IBM closely in the coming quarter, and
will begin to evaluate their validity within the overall port-
folio.
The top performer was Oracle Corporation (ORCL)., with
a quarterly return of 17.48%. Oracle in an American multi-
national computer technology company, and is ranked the
second largest software company, based on revenue, in the
world. Oracle has recently begun providing software solu-
tions such as Oracle SQL, CRM, ERP, and human re-
sources management services. In 2012, Oracle announced
‘Oracle Cloud,’ which has been integrated into their exist-
ing services. Since the beginning of 2014, Oracle has ac-
quired many cloud based companies and integrating them
into their cloud services as well. I have determined Ora-
cle’s intrinsic value to be $54.00, which is far above its
quarter closing price of $44.97. While there is certainly
room for more appreciation, I will continue to monitor
Oracle throughout the coming quarter.
As of quarter-end, the portfolio holds 19.7% of it’s securi-
ties in Information Technology, slightly overweight the
S&P 500’sweighting of 19.53%. With the almost complet-
ed transition of Internet protocol from IPv4 to Ipv6, and
technology components becoming cheaper, many analysts
believe that the “Internet of things” will experience rapid
growth in 2015. For the first quarter of 2015, we will begin
increasing our weighting in this sector to a more over-
weight status.
TELECOMMUNICATIONS
Our portfolio currently only contains one stock in Tele-
communications: Comcast Corp Class A (CMCSA). Com-
cast produced a quarterly return of 7.78%, outperforming
the SPDR Telecom ETF‘s (XTL) return of 6.33%.
Comcast is attempting to merge with Time Warner Cable
(TWC) in a $45.2 billion acquisition, which is still pending
regulatory approval. The acquisition would merge the
largest and the second largest US cable companies into
one. However, there are growing concerns over customer
preferences moving to more Internet-based video content,
poor customer service reputations from Time Warner and
Comcast, and Net Neutrality. These, along with the poten-
tial merger could have a negative effect on Comcast’s
stock price.
Currently 2.88% of the portfolio is invested in telecommu-
nications, slightly overweight the S&P 500’s weight of
2.45%. Many analysts predict that there might continue to
be a downward trend in this sector throughout 2015. We
will continue to maintain a current market weight, while
attempting to find a replacement for Comcast with better
appreciation potential.
15

SECTOR ANALYSIS
UTILITIES
The Utilities sector experienced a significantly better per-
formance this quarter than the last, with a quarterly return
of 8.63%. However, our holdings underperformed the
Utilities sector ETF (XLU) return of 13.18%. The portfo-
lio’s Utilities sector remains an overweight position of
6.14% relative to the S&P 500, which is 3.2%.
The top performer in the Utilities sector was Duke Energy
(DUK), which yielded a quarterly return of 12.79%. DUK
significantly outperformed the other stocks in the Fund’s
Utilities sector. In recent news, North Carolina courts
upheld a 5.1% rate increase for their utility services, while
DUK stating their rates are still below the national average
and are relatively competitive. The company announced
plans to construct a solar farm at Camp Lejeune, a Marine
Corps camp in North Carolina. The project is expected to
power around 3,000 homes.
The bottom performer of the Utilities sector was the AES
Company, with a return of -2.54%. The company offered
their Q3 Earnings in November, and majorly missed ana-
lysts’ revenue expectations of $4.73 billion, by reporting
revenue at $4.44 billion. A major cause of the revenue
miss was due to poor performance in their Brazilian SBU.
Aside from Brazil, operations in Asia reflected poor per-
formance as well. Additionally, AES’s management de-
creased their EPS target to $1.25 - $1.30, from $1.30 -
$1.40. The company expects their 2015 EPS to be be-
tween $1.30-$1.40, while analysts’ expect their EPS to be
$1.41. The company intends to release their Q4 2014
earnings on February 26, 2015. At this time, I will reevalu-
ate the company to determine whether or not it is still un-
dervalued.
According to Fidelity, utility companies will need to con-
tinue to heavily invest in infrastructure in order to increase
earnings and dividends. By constructing more natural gas
pipelines and electric transmission lines, utility companies
will greatly benefit by being able to deliver more gas and
electricity to their customers than their competitors. Also,
due to advances in fracking, US fracking companies have
made it easier to extract natural gas. This has opened up
an opportunity for natural gas utilities to develop more
pipelines in order to transport natural gas.
However, due to the strong likelihood that the Federal
Reserve will follow through with their plans to raise inter-
est rates in the second half of the year, we will begin to sell
our overvalued stocks and move to a more underweight
status in the portfolio.
Ryan Mitcheltree Lead Analyst, Utilities
16

If you would like to contribute to the growth of
the Intrieri Family Student Managed Fund,
please contact the
Black School of Business at:
Phone: 814-898-6173
Intrieri Family
Student Managed Fund
END NOTE
17

PORTFOLIO HOLDINGS
18
Intrieri Family Student Managed Fund Portfolio Holdings as of December 31, 2014
Name Ticker Stock Sector Shares Price 12/31 Q4 % Change Q4 Divs Q4 Tot Ret Value Weight
Dow Chemical Co DOW Basic Materials 43 45.61 -13.02% 15.91 -12.32% 1,961.23 1.07%
Monsanto Co MON Basic Materials 60 119.47 6.19% 29.4 6.62% 7,168.20 3.93%
Basic Materials Total 45.31 9,129.43 5.00%
Comcast Corp Class A CMCSA Communication Services 95 58.01 7.87% 21.38 8.28% 5,510.95 3.02%
Communication Services Total 21.38 5,510.95 3.02%
Bridgestone Corp ADR BRDCY Consumer Cyclical 168 17.41 5.77% 0 5.77% 2,924.88 1.60%
Ford Motor Co F Consumer Cyclical 333 15.5 4.80% 41.63 5.65% 5,161.50 2.83%
Home Depot Inc HD Consumer Cyclical 12 104.97 14.42% 5.64 14.93% 1,259.64 0.69%
Honda Motor Co Ltd ADR HMC Consumer Cyclical 61 29.52 -13.89% 9.8 -13.42% 1,800.72 0.99%
Macy's Inc M Consumer Cyclical 61 65.75 14.51% 0 14.51% 4,010.75 2.20%
VF Corp VFC Consumer Cyclical 24 74.9 13.43% 7.68 13.92% 1,797.60 0.98%
Consumer Cyclical Total 64.75 16,955.09 9.29%
Kimberly-Clark Corp KMB Consumer Defensive 30 115.54 7.41% 123.63 11.24% 3,466.20 1.90%
Kroger Co KR Consumer Defensive 68 64.21 23.48% 12.58 23.84% 4,366.28 2.39%
Procter & Gamble Co PG Consumer Defensive 41 91.09 8.86% 26.39 9.62% 3,734.69 2.05%
Constellation Brands Inc Class ASTZ Consumer Defensive 60 98.17 12.63% 0 12.63% 5,890.20 3.23%
Consumer Defensive Total 162.6 17,457.37 9.56%
Chevron Corp CVX Energy 26 112.18 -5.91% 27.82 -5.02% 2,916.68 1.60%
Halliburton Co HAL Energy 33 39.33 -39.03% 5.94 -38.75% 1,297.89 0.71%
Helmerich & Payne Inc HP Energy 40 67.42 -18.26% 27.5 -17.43% 2,696.80 1.48%
National Fuel Gas Co NFG Energy 75 69.53 -0.66% 28.88 -0.11% 5,214.75 2.86%
Exxon Mobil Corporation XOM Energy 33 92.45 -1.70% 22.77 -0.97% 3,050.85 1.67%
Energy Total 112.91 15,176.97 8.32%
Capital One Financial Corp COF Financial Services 16 82.55 1.14% 4.8 1.51% 1,320.80 0.72%
MetLife Inc MET Financial Services 64 54.09 -2.52% 0 -2.52% 3,461.76 1.90%
PNC Financial Services Group IncPNC Financial Services 17 91.23 6.60% 8.16 7.16% 1,550.91 0.85%
Visa Inc Class A V Financial Services 7 262.2 22.89% 3.36 23.11% 1,835.40 1.01%
Willis Group Holdings PLCWSH Financial Services 87 44.81 10.07% 0 10.07% 3,898.47 2.14%
Financial Services Total 16.32 12,067.34 6.61%
Biogen Idec Inc BIIB Healthcare 8 339.45 2.61% 0 2.61% 2,715.60 1.49%
Cigna Corp CI Healthcare 28 102.91 0.56% 0 0.56% 2,881.48 1.58%
CVS Health Corp CVS Healthcare 43 96.31 21.01% 11.83 21.35% 4,141.33 2.27%
Halyard Health Inc HYH Healthcare 3 45.47 38.59% 0 38.59% 136.41 0.07%
Pfizer Inc PFE Healthcare 40 31.15 5.34% 10.4 6.22% 1,246.00 0.68%
Healthcare Total 22.23 11,120.82 6.09%
Boeing Co BA Industrials 45 129.98 2.04% 32.85 2.61% 5,849.10 3.20%
Cummins Inc CMI Industrials 23 144.17 9.24% 17.94 9.83% 3,315.91 1.82%
FedEx Corp FDX Industrials 20 173.66 7.56% 0 7.56% 3,473.20 1.90%
General Electric Co GE Industrials 264 25.27 -1.37% 58.08 -0.51% 6,671.28 3.66%
Lockheed Martin Corp LMT Industrials 42 192.57 5.36% 63 6.18% 8,087.94 4.43%
Union Pacific Corp UNP Industrials 16 119.13 9.88% 0 9.88% 1,906.08 1.04%
United Technologies Corp UTX Industrials 25 115 8.90% 14.75 9.46% 2,875.00 1.58%
WABTEC WAB Industrials 48 86.89 7.22% 2.88 7.29% 4,170.72 2.29%
Industrials Total 189.5 36,349.23 19.92%
Apple Inc AAPL Technology 91 110.38 9.56% 42.77 10.02% 10,044.58 5.50%
Google Inc Class C GOOG Technology 3 526.4 -8.83% 0 -8.83% 1,579.20 0.87%
Google Inc Class A GOOGL Technology 3 530.66 -9.81% 0 -9.81% 1,591.98 0.87%
IBM Corp. IBM Technology 45 160.44 -15.48% 25.3 -15.19% 7,219.80 3.96%
MedAssets Inc MDAS Technology 140 19.76 -4.40% 0 -4.40% 2,766.40 1.52%
Microsoft Corp MSFT Technology 105 46.45 0.19% 32.55 0.86% 4,877.25 2.67%
Oracle Corporation ORCL Technology 116 44.97 17.48% 13.92 17.79% 5,216.52 2.86%
SAP SE ADR SAP Technology 52 69.65 -0.16% 0 -0.16% 3,621.80 1.98%
Technology Total 114.54 36,917.53 20.23%
The AES Corporation AES Utilities 95 13.77 -2.89% 4.75 -2.54% 1,308.15 0.72%
Duke Energy Corporation DUK Utilities 74 83.54 11.73% 58.83 12.79% 6,181.96 3.39%
Exelon Corp EXC Utilities 100 37.08 2.26% 0 2.26% 3,708.00 2.03%
Utilities Total 63.58 11,198.11 6.14%
MMDA12 FDIC Ins. DepositCASH$ 10,637.47 1 0.00% 0 0.00% 10,637.47 5.83%
Grand Total 813.12 4.82% 182,520.31 100.00%