SME financing and equity markets -...
59
World Federation of Exchanges SME FINANCING AND EQUITY MARKETS
Transcript of SME financing and equity markets -...
World Federation of Exchanges
SME FINANCING AND EQUITY MARKETS

1
CONTENTS
1 Executive Summary ......................................................................................................................... 3
2 Introduction .................................................................................................................................... 3
2.1 Research question and approach ........................................................................................... 5
3 SMEs and Capital Markets .............................................................................................................. 6
3.1 An SME by any other name – Defining an SME ...................................................................... 6
3.2 SMEs and CAPITAL MARKETS: Challenges and Opportunities ................................................ 7
3.2.1 Global challenges: the availability and cost of equity finance ........................................ 7
3.2.2 Global opportunities: the benefits of equity finance ...................................................... 8
3.2.3 Addressing the challenges/enhancing the opportunities ............................................... 8
4 The survey ..................................................................................................................................... 12
4.1 Description of the questionnaires ........................................................................................ 13
4.1.1 Companies’ questionnaire ............................................................................................ 13
4.1.2 Institutional investors’ questionnaire ........................................................................... 14
4.1.3 Retail investors’ questionnaire ..................................................................................... 14
4.1.4 Market intermediaries’ questionnaire .......................................................................... 14
4.1.5 The ecosystem .............................................................................................................. 14
4.2 Survey design ........................................................................................................................ 15
4.3 Software used ....................................................................................................................... 15
4.4 Target population, samples and weighting ........................................................................... 15
5 Main results .................................................................................................................................. 17
5.1 Ecosystem ............................................................................................................................. 17
5.2 Companies............................................................................................................................. 21
5.3 Investors ................................................................................................................................ 27
5.4 Market Intermediaries .......................................................................................................... 30
5.5 Recommendations ................................................................................................................ 32
6 Role of technology/innovation in altering the dynamics of the ecosystem ................................. 34
6.1 Crowdfunding platforms ....................................................................................................... 35
6.2 Data-analytics and automation ............................................................................................. 38
6.3 Distributed ledger technology .............................................................................................. 40
7 Conclusion ..................................................................................................................................... 40
8 References .................................................................................................................................... 42
9 Appendix 1: Members of the steering committee........................................................................ 45
10 Appendix 2: Individuals interviewed for the report...................................................................... 45
11 Appendix 3 – Statistical discussion of the main results ................................................................ 46
2
11.1 Introduction .......................................................................................................................... 46
11.2 Overview of the results ......................................................................................................... 46
11.2.1 Working definitions to guide survey respondents ........................................................ 46
11.2.2 Responses ..................................................................................................................... 46
11.2.3 Listed companies – statistical issues ............................................................................. 47
11.2.4 Comparison between listed and unlisted companies: statistical issues ....................... 47
11.2.5 Investors data: Statistical issues ................................................................................... 48
11.3 Ecosystem questions ............................................................................................................. 48
11.4 Companies data .................................................................................................................... 52
11.4.1 Descriptive statistics ..................................................................................................... 52
11.4.2 Borrowing constraints ................................................................................................... 53
11.4.3 Ecosystem: listed versus unlisted companies ............................................................... 54
11.5 Retail and Institutional Investors: additional data ................................................................ 57
12 Appendix 4 – Survey cover letter .................................................................................................. 58

3
Exchange-based Financing of Small and Medium Enterprises
1 EXECUTIVE SUMMARY
The World Federation of Exchanges (WFE) recognises the importance of ensuring small and
medium enterprises (SMEs) can access equity market financing. This research identified
globally-consistent barriers and opportunities for enhancing access to equity market finance.
The research results are derived from surveys of companies, investors and market
intermediaries across five developed and emerging market jurisdictions. The primary findings
are:
the company decision to list extends beyond a desire to raise finance;
companies perceive and experience compliance with initial and ongoing listings requirements as burdensome;
investors would value better quality information about SMEs, and
all entities attach importance to secondary market liquidity of company shares.
Based on these findings, the report sets out recommendations about:
how to address the scale and complexity of listing,
enhancing the quality of available information, and
addressing some of the liquidity challenges.
Finally, the report assesses the role of financial innovations such as crowdfunding or
blockchain in meeting these recommendations or positively impacting the economics of the
current ecosystem.
2 INTRODUCTION
Multilateral institutions, governments, policymakers and private sector actors across developed and developing markets remain focused on addressing barriers to growth of small and medium enterprises (SMEs).1 Access to external finance (or lack thereof) is a specific area of concern. A 2016 OECD report on the topic notes that “despite recent improvements in SME
1 There is unfortunately a lack of consistency in the use of terminology across policy-makers, the media, researchers and others. The term ‘SME’ is sometimes used accurately to refer only to small and medium enterprises (i.e. excluding micro enterprises) while in other instances it is used to describe all companies that aren’t large enterprises. Where this report quotes SME statistics from third parties, the quote is replicated precisely even though in some instance – particularly in relation to number of enterprises and employment numbers – it is possible that the figures might include micro-enterprises.

4
lending…many SMEs continue to face credit constraints.” 2 While much of the focus, appropriately, is on enhancing lending to SMEs, there is growing emphasis on the need to diversify the range of financing options that are available to SMEs, and consequently the potential role of capital markets in SME financing.3 This is partly a consequence of the retreat in bank lending post financial crisis, but also a recognition of the impact that an over-reliance on debt finance can have on the ability of firms to withstand economic downturns.4 The 2015 OECD report to G20 Finance Ministers and Central Bank Governors notes that “although full disintermediation of SME financing is neither achievable nor desirable, there is a wider need for use of the capital markets by SMEs.” 5 In Europe, the Capital Markets Union Action Plan6 makes special mention of the need to address barriers to SME access to capital market financing options and in Canada, the TMX Group (owners of the Toronto Stock Exchange) have established an independent working group, to identify mechanisms for increasing company access to growth capital.7
Central to this enthusiasm for SME-enablement is the fact that SMEs globally are significant employers and potential contributors to economic growth. These themes are particularly salient in the low growth, post financial crisis world of the developed markets but resonate equally in developing economies. According to the European Bank for Reconstruction and Development, “SMEs make up over 99% of the total number of businesses”8 in the markets in which they operate; the International Chamber of Commerce states that SMEs represent “around 60% of private sector jobs”; 9 the European Commission estimates that SMEs represented “99.8% of all enterprises in the non-financial business sector” in the EU, accounting for “67% of total employment” 10 ; and the US Small Business Administration suggests that “small businesses provide 55% of all jobs and 66% of all net new jobs since the 1970s” in the United States.11
It is not enough, however, to simply have a large of number of SMEs. While it is true that SMEs (particularly if broadly defined to include micro enterprises) are major employers, it is in transitioning to becoming larger companies that they also become more significant contributors to economic growth. Data from the 2014 IFC MSME 12 database across 21
2 OECD (2016) Financing SMEs and Entrepreneurs 2016: An OECD Scorecard, OECD Publishing, Paris, http://dx.doi.org/10.1787/fin_sme_ent-2016-en, pg. 27 3 See for example Baldock and Mason (2015) on the role of private equity suppliers in the finance escalator for high-growth SMEs 4 This topic is extensively covered in Casey and O’Toole (2014). 5 OECD, Opportunities and Constraints of Market-Based Financing (2015) 6 European Commission, ‘Action Plan on Building a Capital Markets Union’, 30 September 2015, Brussels, Belgium, url: http://ec.europa.eu/finance/capital-markets-union/docs/building-cmu-action-plan_en.pdf 7 Advancing Innovation Roundtable Takes Shape, 4 October 2016, url: https://www.tmx.com/newsroom/press-releases?id=496 8 European Bank for Reconstruction and Development, url: http://www.ebrd.com/what-we-do/sectors-and-topics/why-small-businesses-matter.html 9 International Chamber of Commerce, 2016, TradeMatters, url: http://tradematters.iccwbo.org/smes-small-business.html 10 European Commission, November 2015, url: http://ec.europa.eu/DocsRoom/documents/16341/attachments/2/translations/en/renditions/native 11 US Small Business Administration, 2016, url: https://www.sba.gov/managing-business/running-business/energy-efficiency/sustainable-business-practices/small-business-trends 12 International Finance Corporation, 2014, Micro, Small and Medium Enterprise Country Indicators, url: http://www.ifc.org/wps/wcm/connect/Industry_EXT_Content/IFC_External_Corporate_Site/Industries/Financi
al+Markets/msme+finance/sme+banking/msme-countryindicators
5
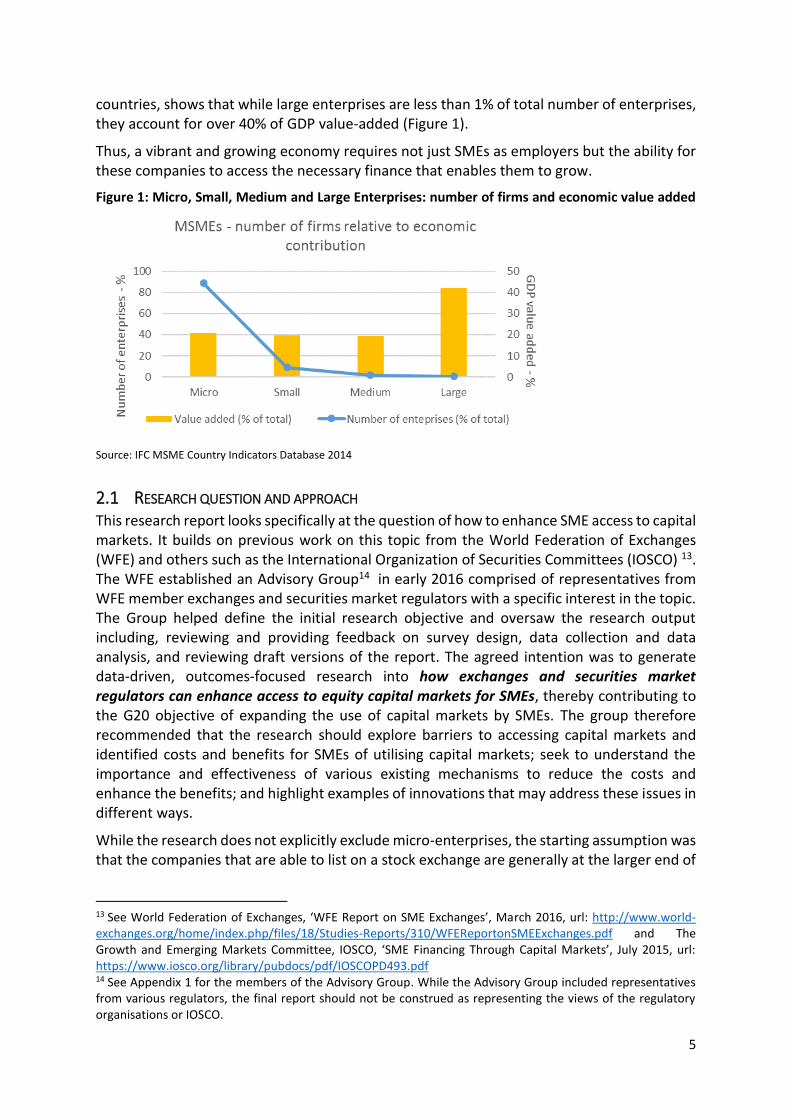
countries, shows that while large enterprises are less than 1% of total number of enterprises, they account for over 40% of GDP value-added (Figure 1).
Thus, a vibrant and growing economy requires not just SMEs as employers but the ability for these companies to access the necessary finance that enables them to grow.
Figure 1: Micro, Small, Medium and Large Enterprises: number of firms and economic value added
Source: IFC MSME Country Indicators Database 2014
2.1 RESEARCH QUESTION AND APPROACH This research report looks specifically at the question of how to enhance SME access to capital markets. It builds on previous work on this topic from the World Federation of Exchanges (WFE) and others such as the International Organization of Securities Committees (IOSCO) 13. The WFE established an Advisory Group14 in early 2016 comprised of representatives from WFE member exchanges and securities market regulators with a specific interest in the topic. The Group helped define the initial research objective and oversaw the research output including, reviewing and providing feedback on survey design, data collection and data analysis, and reviewing draft versions of the report. The agreed intention was to generate data-driven, outcomes-focused research into how exchanges and securities market regulators can enhance access to equity capital markets for SMEs, thereby contributing to the G20 objective of expanding the use of capital markets by SMEs. The group therefore recommended that the research should explore barriers to accessing capital markets and identified costs and benefits for SMEs of utilising capital markets; seek to understand the importance and effectiveness of various existing mechanisms to reduce the costs and enhance the benefits; and highlight examples of innovations that may address these issues in different ways.
While the research does not explicitly exclude micro-enterprises, the starting assumption was that the companies that are able to list on a stock exchange are generally at the larger end of
13 See World Federation of Exchanges, ‘WFE Report on SME Exchanges’, March 2016, url: http://www.world-exchanges.org/home/index.php/files/18/Studies-Reports/310/WFEReportonSMEExchanges.pdf and The Growth and Emerging Markets Committee, IOSCO, ‘SME Financing Through Capital Markets’, July 2015, url: https://www.iosco.org/library/pubdocs/pdf/IOSCOPD493.pdf 14 See Appendix 1 for the members of the Advisory Group. While the Advisory Group included representatives from various regulators, the final report should not be construed as representing the views of the regulatory organisations or IOSCO.
6
the SME scale. Thus, although access to finance is a concern for small businesses at any stage of development, use of public equity finance is more suitable for larger SMEs.
The Research and Public Policy team (“the team”) at the WFE was responsible for conducting the research and writing up the research findings. The team relied on desktop (secondary) research and input from the members of the Advisory Group to define the research focus and the specific research questions. The team also utilised secondary research to identify areas of innovation (covered in Chapter 6 of this report). The bulk of the findings contained in this report are, however, derived from primary research which took the form of online surveys, as well as telephonic and in-person interviews with individuals15 directly involved in various aspects of SME financing in capital markets. The specific details of the survey design and approach are described in Chapter 4 and Appendix 3.
3 SMES AND CAPITAL MARKETS
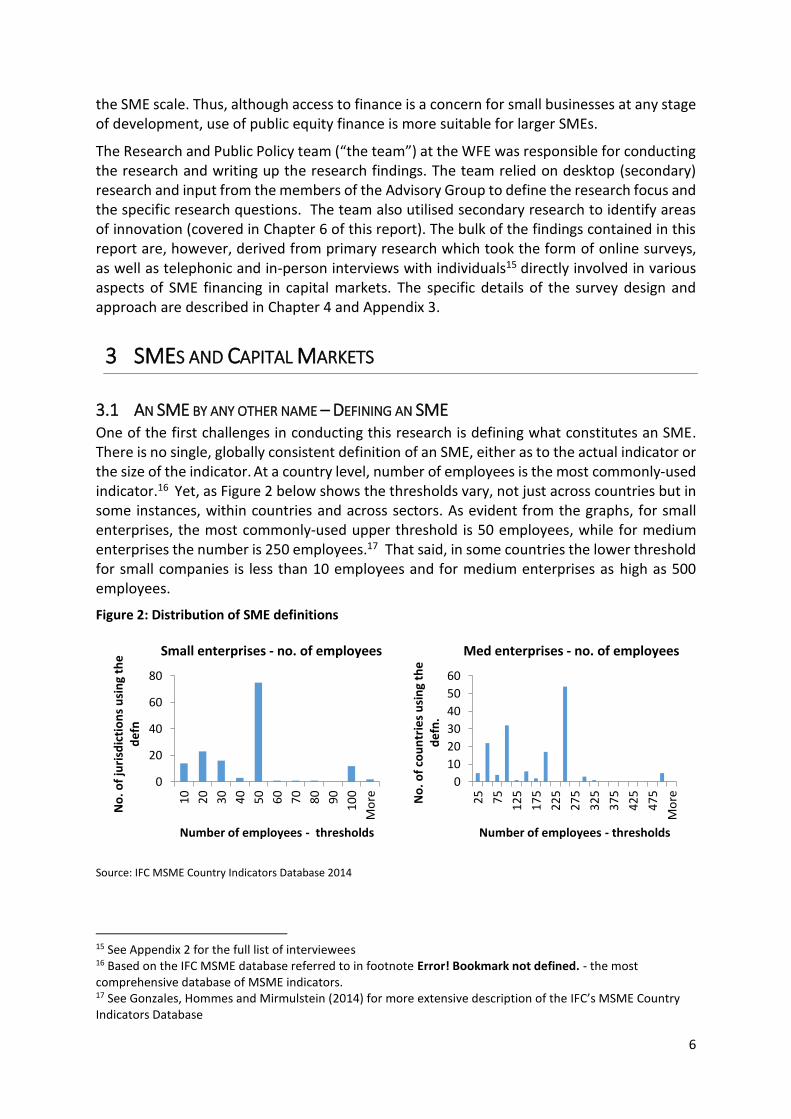
3.1 AN SME BY ANY OTHER NAME – DEFINING AN SME One of the first challenges in conducting this research is defining what constitutes an SME. There is no single, globally consistent definition of an SME, either as to the actual indicator or the size of the indicator. At a country level, number of employees is the most commonly-used indicator.16 Yet, as Figure 2 below shows the thresholds vary, not just across countries but in some instances, within countries and across sectors. As evident from the graphs, for small enterprises, the most commonly-used upper threshold is 50 employees, while for medium enterprises the number is 250 employees.17 That said, in some countries the lower threshold for small companies is less than 10 employees and for medium enterprises as high as 500 employees.
Figure 2: Distribution of SME definitions
Source: IFC MSME Country Indicators Database 2014
15 See Appendix 2 for the full list of interviewees 16 Based on the IFC MSME database referred to in footnote Error! Bookmark not defined. - the most comprehensive database of MSME indicators. 17 See Gonzales, Hommes and Mirmulstein (2014) for more extensive description of the IFC’s MSME Country Indicators Database
0
20
40
60
80
10
20
30
40
50
60
70
80
90
10
0
Mo
re
No
. of
juri
sdic
tio
ns
usi
ng
the
d
efn
Number of employees - thresholds
Small enterprises - no. of employees
0
10
20
30
40
50
60
25
75
12
5
17
5
22
5
27
5
32
5
37
5
42
5
47
5
Mo
reNo
. of
cou
ntr
ies
usi
ng
the
d
efn
.
Number of employees - thresholds
Med enterprises - no. of employees
7
Turnover is the second most commonly-used definition, followed by assets. Again, however definitions vary greatly across and within countries, with upper thresholds for turnover for medium-sized companies ranging from less than US$1m to just under US$75m.
The second challenge lies in translating this into the listed environment. Employee data – even
for listed companies - is not readily available, nor typically referenced by market users. While
turnover and assets are well-understood market-linked indicators, and used for defining
minimum (and in a few cases, maximum) listings criteria, the most commonly used indicator
of listed company size is market capitalisation. However, other than the EU, which defines an
SME as a company with a market capitalisation of less than €200m, the research team was
not able to find another jurisdiction with a market capitalisation-based definition of an SME.
Therefore, for the purposes of targeting the surveys and guiding respondents, we used a
combination of market capitalisation and turnover (see Chapter 4.14.4 and Appendix 3 for
more detailed discussion) and used number of employees for our analyses.18
3.2 SMES AND CAPITAL MARKETS: CHALLENGES AND OPPORTUNITIES There are many factors that impact SME use of external finance and within that, their specific financing choices. These include firm-specific characteristics (Berger & Udell, 2008), sector specific determinants (Degryse et al., 2012), and country-specific factors, such as macroeconomic conditions, the level of financial development or the regulatory framework of the country in which the firm operates (Beck et al., 2008). As this paper focuses specifically on the use and availability of equity market financing options and how to enhance these, we explore the impediments and enablers to accessing public equity markets below.
3.2.1 Global challenges: the availability and cost of equity finance
While it may not be the sole driver of the funding decision, companies looking to access external finance necessarily consider the associated costs and benefits of a particular financing option. The costs of accessing public equity finance can be understood as comprising the ‘cost of capital’ (or the price at which investors are prepared to provide the desired funds) as well as other direct and indirect costs associated with being a public, listed company.
The cost of capital is a function of the return providers of capital (investors) expect to receive for a specific investment. While this is logically linked to expectations about the performance of the firm (and the firm relative to the market overall or alternative investment options), it is also tied to liquidity of the shares19 and the availability of information for investors from which to make an informed assessment about the firm’s prospects.
The company also incurs direct and indirect costs to prepare and maintain the listing. The direct costs include: Costs of preparing for the listing – documentation, change in legal status, preparation of relevant documents;
Costs of sponsor and advisor fees – initial and ongoing;
Costs of ensuring ongoing compliance (audit fees);
Admission and ongoing fees paid to the exchange.
18 Appendix 3 provides more details on the process of determining a market capitalisation definition and the challenges of combining Country and Market level definitions for analysis purposes. 19 Amihud, Y., Mendelson, H. and Pedersen, L.H. Liquidity and Asset Prices, Foundations and Trends in Finance Vol. 1, No 4 (2005) 269–364

8
The indirect and more intangible costs include:
Establishment of requisite governance structures;
The opportunity cost of management time spent on ongoing compliance and investor relations;
Loss/diminution of company control;
Greater public visibility (accountability);
Perceived market short-termism translating into share price volatility.
Many of these costs do not depend on the size of the company. Additionally, as smaller firms are generally younger, less transparent and less collateralised than bigger firms (Moritz, Block and Heinz, 2016) these costs are likely to be relatively more onerous for smaller companies.
In addition to the challenge of costs:
Service providers (underwriting banks, audit firms, legal advisers etc.) are not incentivised to support smaller-sized companies (it is economically less attractive for them to do so);
There is less coverage of smaller-sized companies, and professional investors are therefore less able to make informed investment decisions about them; and
Shares tend to be less liquid than the shares of larger companies, disincentivising investment and intermediation (brokerage, market making) and/or driving up the equity cost of capital.
3.2.2 Global opportunities: the benefits of equity finance
Listing on a public market and accessing equity finance is also associated with several benefits. From a financing perspective, given the access to a wider potential investor base, the cost of equity capital can be lower than other forms of finance. Moreover, once listed, follow-on or secondary offerings are easier to make. Certain types of firms (high growth, low cash flow firms with limited tangible assets) may not be able to access debt finance (Baldock and Mason, 2015). As equity finance (unlike debt finance) does not impose specific repayment requirements, it is less of a financial burden during times of economic stress.
In addition to the specific financing benefits, listing a company also has broader benefits (Pagano, Panetta and Zingales, 1998). These include:
Providing existing shareholders with a means of exiting the firm (Bock and Schmidt, 2015; Mason, 2011);
Enhancing the profile and prestige of the firm with potential employees, suppliers and clients;
Facilitating the use of company shares for future acquisitions through the valuation process.
3.2.3 Addressing the challenges/enhancing the opportunities
The OECD have proposed a range of recommendations to address these challenges (Nassr and Wehinger, 2015). Namely:
Allowing for more tailored listing and ongoing compliance requirements (i.e. a move away from ‘one-size fits all’ regulation);
9
Encouraging market-making or other liquidity enhancement support for smaller-cap stocks;
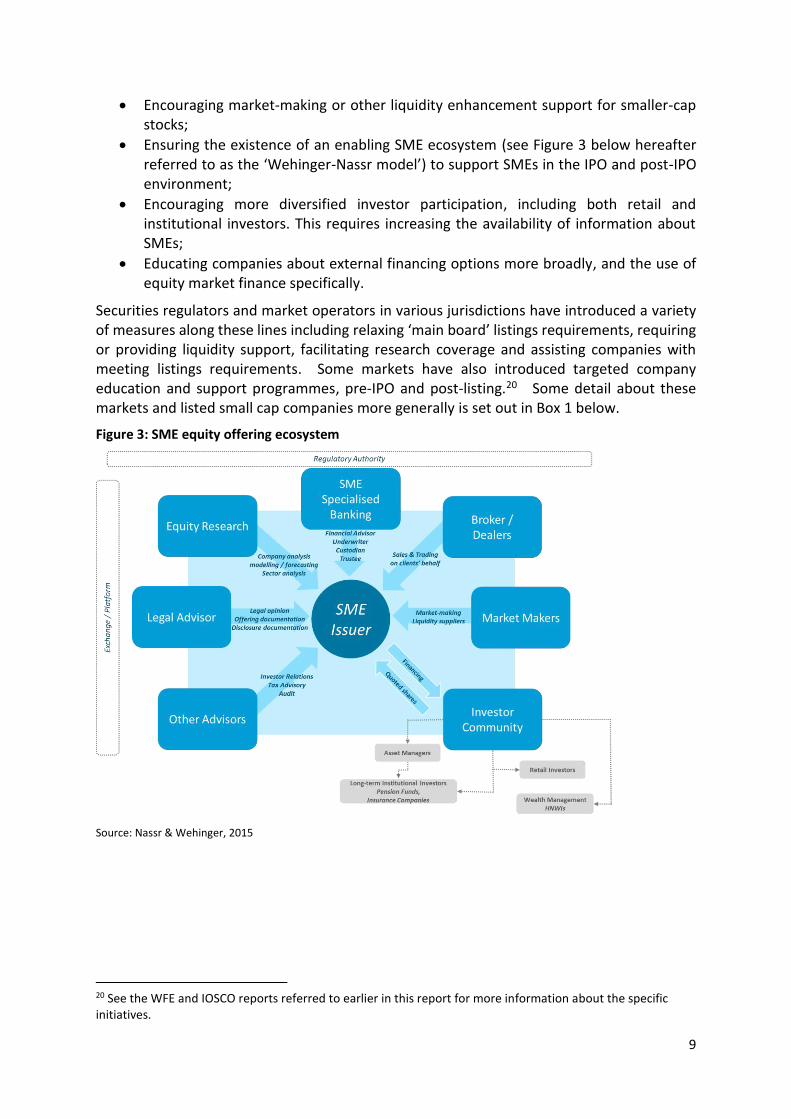
Ensuring the existence of an enabling SME ecosystem (see Figure 3 below hereafter referred to as the ‘Wehinger-Nassr model’) to support SMEs in the IPO and post-IPO environment;
Encouraging more diversified investor participation, including both retail and institutional investors. This requires increasing the availability of information about SMEs;
Educating companies about external financing options more broadly, and the use of equity market finance specifically.
Securities regulators and market operators in various jurisdictions have introduced a variety of measures along these lines including relaxing ‘main board’ listings requirements, requiring or providing liquidity support, facilitating research coverage and assisting companies with meeting listings requirements. Some markets have also introduced targeted company education and support programmes, pre-IPO and post-listing.20 Some detail about these markets and listed small cap companies more generally is set out in Box 1 below.
Figure 3: SME equity offering ecosystem
Source: Nassr & Wehinger, 2015
20 See the WFE and IOSCO reports referred to earlier in this report for more information about the specific initiatives.
10
BOX 1: SME EQUITY MARKETS AND SMALL COMPANY LISTING
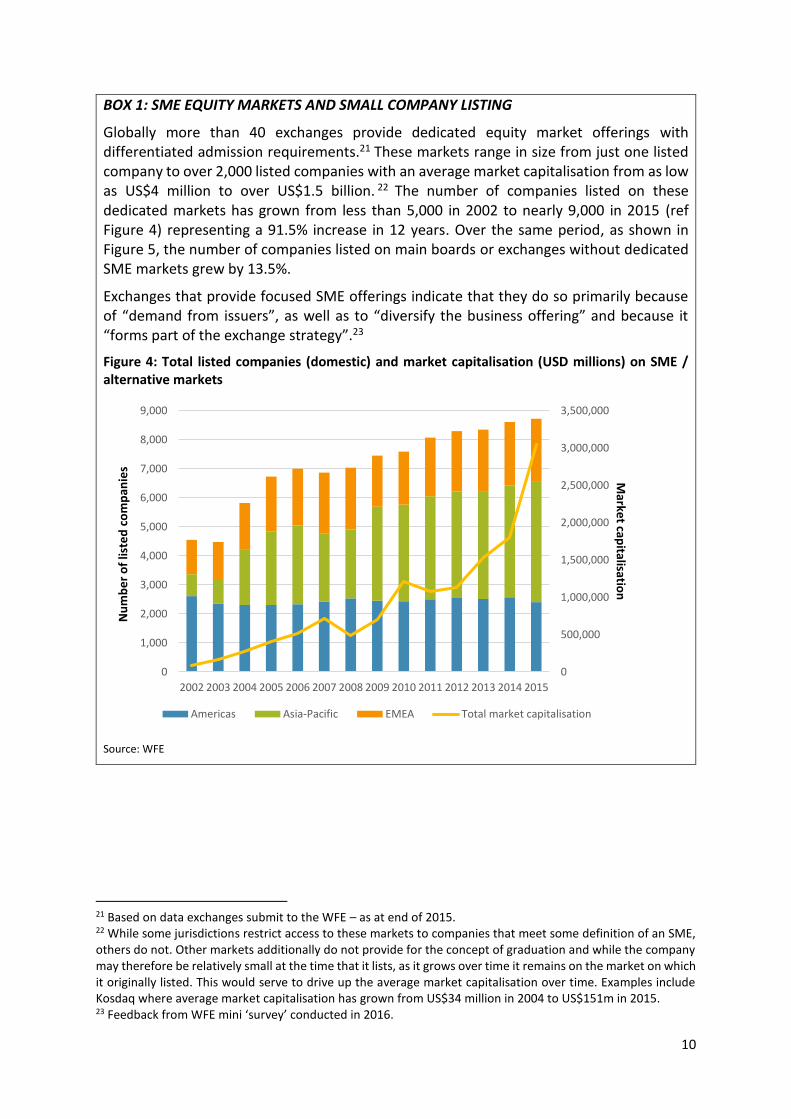
Globally more than 40 exchanges provide dedicated equity market offerings with differentiated admission requirements.21 These markets range in size from just one listed company to over 2,000 listed companies with an average market capitalisation from as low as US$4 million to over US$1.5 billion. 22 The number of companies listed on these dedicated markets has grown from less than 5,000 in 2002 to nearly 9,000 in 2015 (ref Figure 4) representing a 91.5% increase in 12 years. Over the same period, as shown in Figure 5, the number of companies listed on main boards or exchanges without dedicated SME markets grew by 13.5%.
Exchanges that provide focused SME offerings indicate that they do so primarily because of “demand from issuers”, as well as to “diversify the business offering” and because it “forms part of the exchange strategy”.23
Figure 4: Total listed companies (domestic) and market capitalisation (USD millions) on SME / alternative markets
Source: WFE
21 Based on data exchanges submit to the WFE – as at end of 2015. 22 While some jurisdictions restrict access to these markets to companies that meet some definition of an SME, others do not. Other markets additionally do not provide for the concept of graduation and while the company may therefore be relatively small at the time that it lists, as it grows over time it remains on the market on which it originally listed. This would serve to drive up the average market capitalisation over time. Examples include Kosdaq where average market capitalisation has grown from US$34 million in 2004 to US$151m in 2015. 23 Feedback from WFE mini ‘survey’ conducted in 2016.
0
500,000
1,000,000
1,500,000
2,000,000
2,500,000
3,000,000
3,500,000
0
1,000
2,000
3,000
4,000
5,000
6,000
7,000
8,000
9,000
2002 2003 2004 2005 2006 2007 2008 2009 2010 2011 2012 2013 2014 2015
Marke
t capitalisatio
n
Nu
mb
er
of
liste
d c
om
pan
ies
Americas Asia-Pacific EMEA Total market capitalisation
11
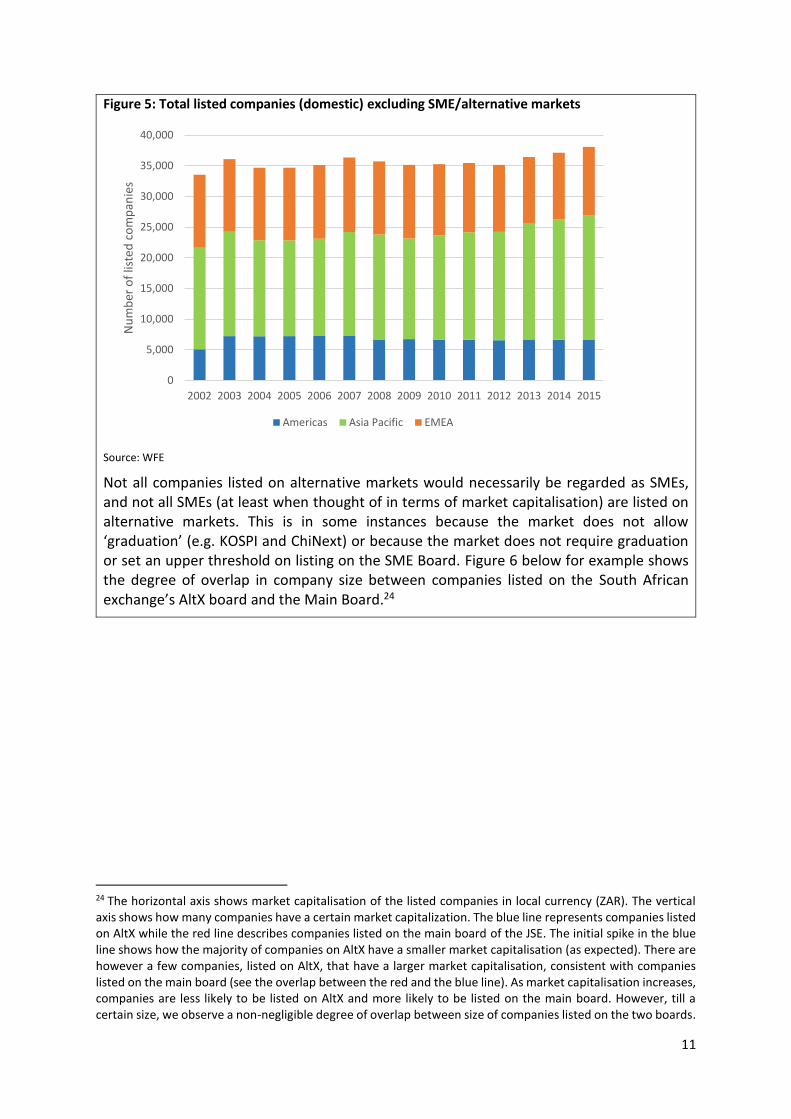
Figure 5: Total listed companies (domestic) excluding SME/alternative markets
Source: WFE
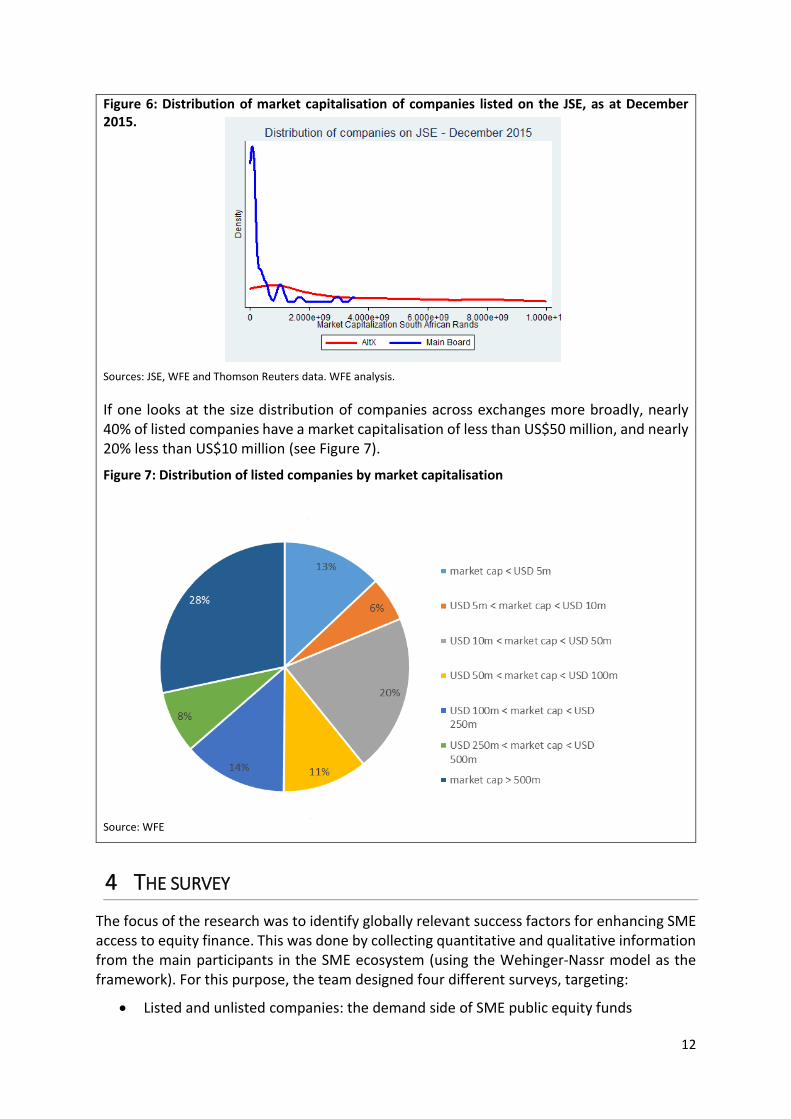
Not all companies listed on alternative markets would necessarily be regarded as SMEs, and not all SMEs (at least when thought of in terms of market capitalisation) are listed on alternative markets. This is in some instances because the market does not allow ‘graduation’ (e.g. KOSPI and ChiNext) or because the market does not require graduation or set an upper threshold on listing on the SME Board. Figure 6 below for example shows the degree of overlap in company size between companies listed on the South African exchange’s AltX board and the Main Board.24
24 The horizontal axis shows market capitalisation of the listed companies in local currency (ZAR). The vertical axis shows how many companies have a certain market capitalization. The blue line represents companies listed on AltX while the red line describes companies listed on the main board of the JSE. The initial spike in the blue line shows how the majority of companies on AltX have a smaller market capitalisation (as expected). There are however a few companies, listed on AltX, that have a larger market capitalisation, consistent with companies listed on the main board (see the overlap between the red and the blue line). As market capitalisation increases, companies are less likely to be listed on AltX and more likely to be listed on the main board. However, till a certain size, we observe a non-negligible degree of overlap between size of companies listed on the two boards.
0
5,000
10,000
15,000
20,000
25,000
30,000
35,000
40,000
2002 2003 2004 2005 2006 2007 2008 2009 2010 2011 2012 2013 2014 2015
Nu
mb
er o
f lis
ted
co
mp
anie
s
Americas Asia Pacific EMEA
12
Figure 6: Distribution of market capitalisation of companies listed on the JSE, as at December 2015.
Sources: JSE, WFE and Thomson Reuters data. WFE analysis.
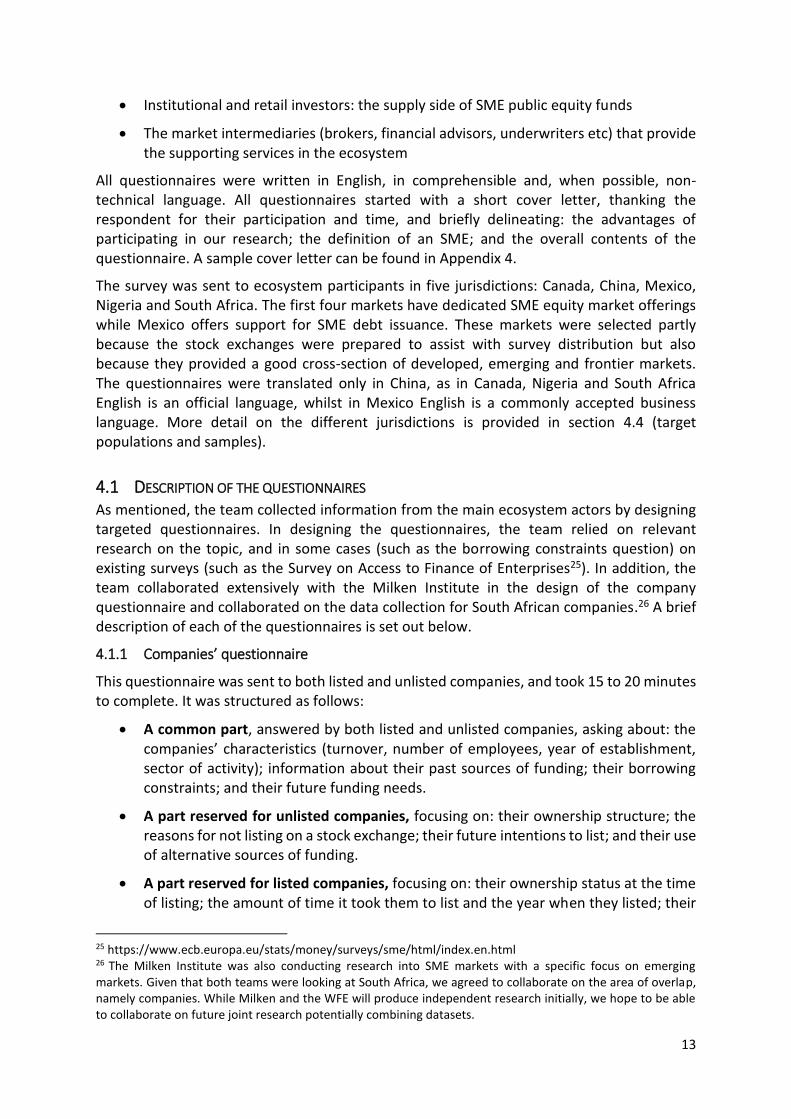
If one looks at the size distribution of companies across exchanges more broadly, nearly 40% of listed companies have a market capitalisation of less than US$50 million, and nearly 20% less than US$10 million (see Figure 7).
Figure 7: Distribution of listed companies by market capitalisation
Source: WFE
4 THE SURVEY
The focus of the research was to identify globally relevant success factors for enhancing SME access to equity finance. This was done by collecting quantitative and qualitative information from the main participants in the SME ecosystem (using the Wehinger-Nassr model as the framework). For this purpose, the team designed four different surveys, targeting:
Listed and unlisted companies: the demand side of SME public equity funds
13
Institutional and retail investors: the supply side of SME public equity funds
The market intermediaries (brokers, financial advisors, underwriters etc) that provide the supporting services in the ecosystem
All questionnaires were written in English, in comprehensible and, when possible, non-technical language. All questionnaires started with a short cover letter, thanking the respondent for their participation and time, and briefly delineating: the advantages of participating in our research; the definition of an SME; and the overall contents of the questionnaire. A sample cover letter can be found in Appendix 4.
The survey was sent to ecosystem participants in five jurisdictions: Canada, China, Mexico, Nigeria and South Africa. The first four markets have dedicated SME equity market offerings while Mexico offers support for SME debt issuance. These markets were selected partly because the stock exchanges were prepared to assist with survey distribution but also because they provided a good cross-section of developed, emerging and frontier markets. The questionnaires were translated only in China, as in Canada, Nigeria and South Africa English is an official language, whilst in Mexico English is a commonly accepted business language. More detail on the different jurisdictions is provided in section 4.4 (target populations and samples).
4.1 DESCRIPTION OF THE QUESTIONNAIRES As mentioned, the team collected information from the main ecosystem actors by designing targeted questionnaires. In designing the questionnaires, the team relied on relevant research on the topic, and in some cases (such as the borrowing constraints question) on existing surveys (such as the Survey on Access to Finance of Enterprises25). In addition, the team collaborated extensively with the Milken Institute in the design of the company questionnaire and collaborated on the data collection for South African companies.26 A brief description of each of the questionnaires is set out below.
4.1.1 Companies’ questionnaire
This questionnaire was sent to both listed and unlisted companies, and took 15 to 20 minutes to complete. It was structured as follows:
A common part, answered by both listed and unlisted companies, asking about: the companies’ characteristics (turnover, number of employees, year of establishment, sector of activity); information about their past sources of funding; their borrowing constraints; and their future funding needs.
A part reserved for unlisted companies, focusing on: their ownership structure; the reasons for not listing on a stock exchange; their future intentions to list; and their use of alternative sources of funding.
A part reserved for listed companies, focusing on: their ownership status at the time of listing; the amount of time it took them to list and the year when they listed; their
25 https://www.ecb.europa.eu/stats/money/surveys/sme/html/index.en.html 26 The Milken Institute was also conducting research into SME markets with a specific focus on emerging markets. Given that both teams were looking at South Africa, we agreed to collaborate on the area of overlap, namely companies. While Milken and the WFE will produce independent research initially, we hope to be able to collaborate on future joint research potentially combining datasets.

14
reasons for listing; their preferences towards the SME or the main board (when relevant); their access to equity funding through the stock exchange; the use they made of services provided by the stock exchange and market intermediaries; and their expectations regarding their listing experience.
4.1.2 Institutional investors’ questionnaire
This questionnaire was sent to institutional investors only, broadly defined as mutual funds, pension funds, insurance companies and hedge funds who might either invest or not in listed and unlisted SMEs. It took 10 minutes to complete. The questionnaire was structured as follows:
A common part, answered by all institutional investors, asking about demographics (investor type and assets under management);
A part targeting investors participating in listed SMEs, focusing on their reasons to invest and on what would induce them to invest more in listed SMEs;
A part targeting investors not participating in listed SMEs, focusing on their reasons for not investing in listed SMEs;
A part targeting investors participating in unlisted SMEs, focusing on their reasons to invest and on the means they use to invest in unlisted SMEs;
A part targeting investors not participating in unlisted SMEs, focusing on their reasons for not investing in unlisted SMEs.
4.1.3 Retail investors’ questionnaire
Due to the difficulty in reaching retail investors directly, this questionnaire was sent to brokers managing retail accounts, and collected their opinion on retail investors’ preferences and behaviour. It took 10 minutes to complete. The questionnaire was structured almost identically to the institutional investors’ questionnaire, and we refer to the previous subsection for its description.
4.1.4 Market intermediaries’ questionnaire
This questionnaire was sent to market intermediaries and took 5 to 10 minutes to complete. The questionnaire was structured as follows:
A common part, answered by all market intermediaries, asking about the intermediary type: broker, legal advisor, financial advisor, investment bank;
A part targeting intermediaries providing services to SMEs, focusing on: the services they provide; their reasons for providing services to SMEs; their adoption of thresholds for investment in SMEs;
A part targeting intermediaries not providing services to SMEs, focusing on their reasons for not providing services to SMEs.
4.1.5 The ecosystem
All questionnaires contained a final question in which respondents were asked to rate the importance of 15 different characteristics of the SME ecosystem. The answers were used for cross-comparison across the different surveyed categories.
15
4.2 SURVEY DESIGN The questionnaires made use of the following question types, briefly described:
Open-ended questions, used for two purposes: to collect demographic information, and to collect qualitative data when we felt that respondents could give more meaningful information if left free to state their opinion;
Rating questions, used to make respondents rate the usefulness or the importance of certain features. Grid questions generally made use of an even scale from 1 to 4 to make respondents take a position. Options were randomised to avoid order bias in the responses;
Multiple choice ‘all that apply’ questions, used to make respondents choose among factors (generally) related to their decisions regarding SMEs equity finance. Options were randomised to avoid order bias in the responses. When relevant, the option ‘Other, please specify’ was provided to collect qualitative information;
Multiple and dichotomous forced-choice questions, used to ask precise and objective information to the respondents, and/or to branch the questionnaires. Options were randomised to avoid order bias in the responses. When relevant, the option ‘I don’t know’ was provided to avoid forcing the respondents to select an option when not sure.
4.3 SOFTWARE USED The team used software provided by Survey Monkey, a widespread platform for survey design used by academics, private sector researchers and practitioners. Specifically, the team used the ‘Platinum’ subscription, which allows the highest degree of flexibility in designing the survey.
4.4 TARGET POPULATION, SAMPLES AND WEIGHTING As mentioned there does not appear to be a globally-accepted, market-based definition of a
listed SME. The research team therefore had to develop a definition that could be used to
guide survey respondents and to give entities that were distributing the surveys on our behalf
an easily implementable means of determining which companies to target for survey and data
collection purposes.27 We recognised that our company targeting approach would result in us
collecting data from companies that might fall outside an accepted definition of an SME, but
we dealt with this by restricting the analysis to companies falling within certain ‘number of
employees’ thresholds.
More specifically, for targeting listed companies, we asked exchanges to distribute the survey
to all companies listed on the SME Board and where this universe was small, to additional
companies listed on the main board of the exchange. Where the exchange did not have an
SME Board, we asked them simply to distribute the surveys and we filtered responses as
mentioned above. Where possible for unlisted companies, we specified that surveys should
be targeted to companies that fell below the upper threshold of the national turnover
27 As mentioned, most market users would not think of a company as an SME by referencing the number of employees, nor is this data readily available.
16
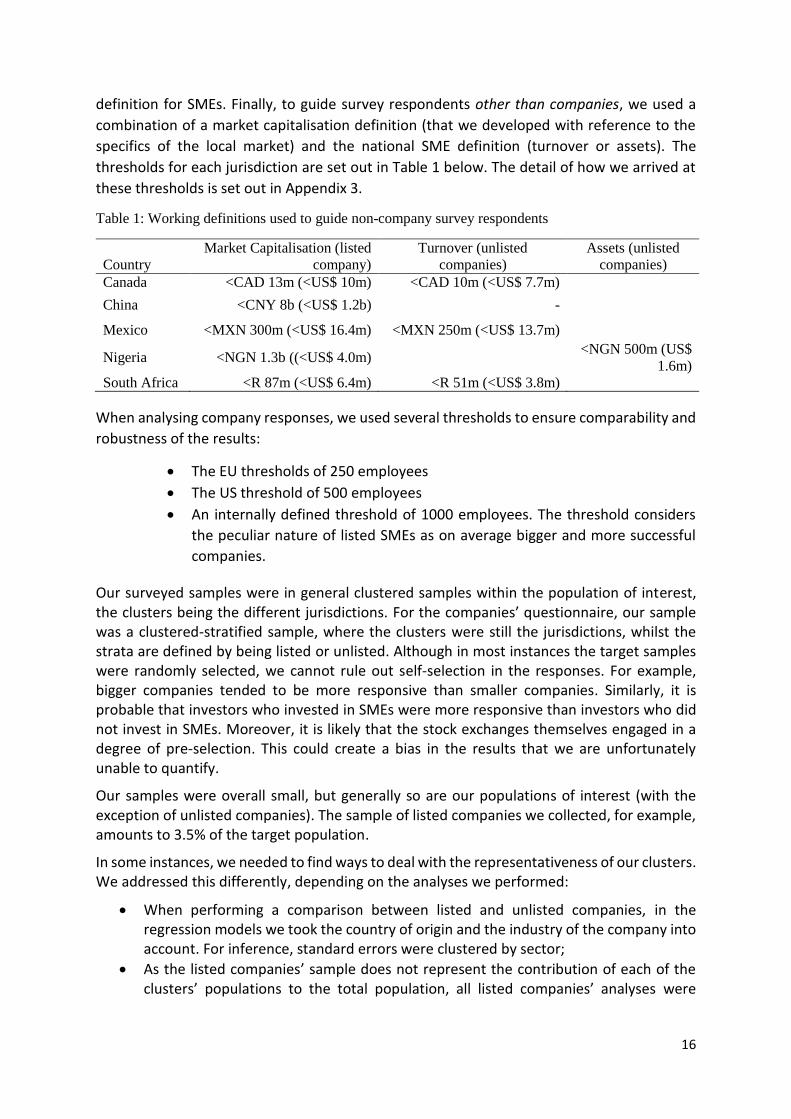
definition for SMEs. Finally, to guide survey respondents other than companies, we used a
combination of a market capitalisation definition (that we developed with reference to the
specifics of the local market) and the national SME definition (turnover or assets). The
thresholds for each jurisdiction are set out in Table 1 below. The detail of how we arrived at
these thresholds is set out in Appendix 3.
Table 1: Working definitions used to guide non-company survey respondents
Country
Market Capitalisation (listed
company)
Turnover (unlisted
companies)
Assets (unlisted
companies)
Canada <CAD 13m (<US$ 10m) <CAD 10m (<US$ 7.7m)
China <CNY 8b (<US$ 1.2b) -
Mexico <MXN 300m (<US$ 16.4m) <MXN 250m (<US$ 13.7m)
Nigeria <NGN 1.3b ((<US$ 4.0m) <NGN 500m (US$
1.6m)
South Africa <R 87m (<US$ 6.4m) <R 51m (<US$ 3.8m)
When analysing company responses, we used several thresholds to ensure comparability and
robustness of the results:
The EU thresholds of 250 employees
The US threshold of 500 employees
An internally defined threshold of 1000 employees. The threshold considers
the peculiar nature of listed SMEs as on average bigger and more successful
companies.
Our surveyed samples were in general clustered samples within the population of interest, the clusters being the different jurisdictions. For the companies’ questionnaire, our sample was a clustered-stratified sample, where the clusters were still the jurisdictions, whilst the strata are defined by being listed or unlisted. Although in most instances the target samples were randomly selected, we cannot rule out self-selection in the responses. For example, bigger companies tended to be more responsive than smaller companies. Similarly, it is probable that investors who invested in SMEs were more responsive than investors who did not invest in SMEs. Moreover, it is likely that the stock exchanges themselves engaged in a degree of pre-selection. This could create a bias in the results that we are unfortunately unable to quantify.
Our samples were overall small, but generally so are our populations of interest (with the exception of unlisted companies). The sample of listed companies we collected, for example, amounts to 3.5% of the target population.
In some instances, we needed to find ways to deal with the representativeness of our clusters. We addressed this differently, depending on the analyses we performed:
When performing a comparison between listed and unlisted companies, in the regression models we took the country of origin and the industry of the company into account. For inference, standard errors were clustered by sector;
As the listed companies’ sample does not represent the contribution of each of the clusters’ populations to the total population, all listed companies’ analyses were
17
weighted to take this into account. Chinese companies were over-represented and hence down-weighted, and the opposite for Canadian companies;
For the investors’ analyses, as Chinese responses represent more than 60% of total responses, we limited their number by randomly selecting 10 retail and 10 institutional investors among them;
For the market intermediaries’ analyses, we believe we managed to obtain a good balance between country of origin of the responses, and hence we took no further action.
We note that despite the statistical limitations mentioned above, the survey results are in line
with theory and the empirical evidence on the topic, and provide consistent and robust
results. We believe the results are of general interest, and expanding the dataset of responses
over time across all categories will confirm and expand the initial insights provided in this
paper.
5 MAIN RESULTS
This section describes the main empirical results of our survey. For technical details the
section overall refers to Appendix 3, unless necessary to understand the result itself, in which
case we included an extract of the data in the body of the report. Where possible, we cross
check whether the data is consistent overall with our starting assumptions, and with the
academic and technical literature on the topic. Chapter 5.1 comments on the ecosystem
question; Chapter 5.2 provides details on the companies’ responses; Chapter 5.3
concentrates on investors; Chapter 5.4 focuses on market intermediaries. We reproduce the
specific survey question that was put to the respondents in the relevant table header.
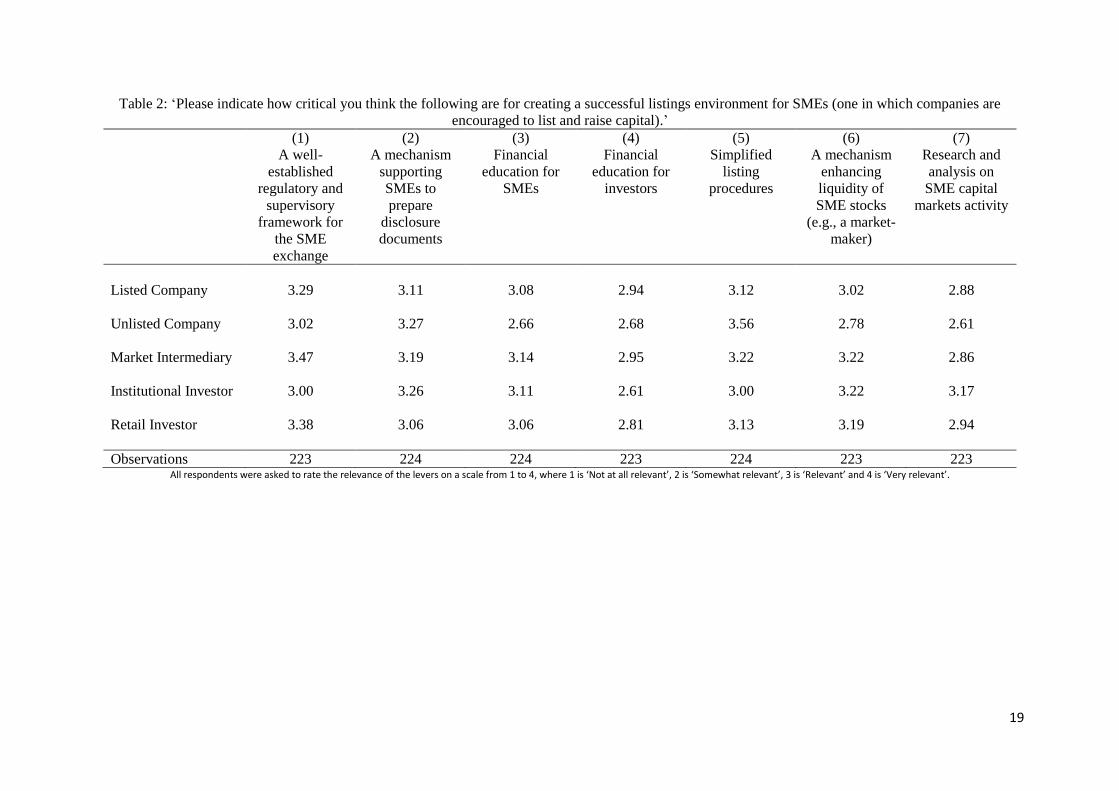
5.1 ECOSYSTEM All respondent categories were asked to rate the relevance of 15 different levers as ways to
enhance the listings environment for SMEs (see Table 2 below). As all respondents had to
answer this question, we can assess how the five categories differ in evaluating the proposed
levers, and whether the emphasised points of agreement or disagreement are consistent with
the rest of the responses. Table A3 in Appendix 3 shows the same results displayed below,
but with more statistical details. In the following, we highlight which levers were considered
the most critical by our respondents and/or that showed significant points of disagreement:
“A well-established regulatory and supervisory framework for the SME exchange”:
respondents on average considered this lever more than ‘Relevant’. This result supports the
idea that stakeholders of the SME ecosystem see the stock exchange as more than simply a
platform to invest or to obtain funding.
“A mechanism supporting SMEs to prepare disclosure documents”: respondents on average
considered this lever more than ‘Relevant’. The surveyed categories do not statistically differ
in their assessment.
“A mechanism enhancing liquidity of SME stocks (e.g., a market-maker requirement)”:
respondents on average agreed that this was an important lever, apart from unlisted

18
companies, which seemed to overlook the importance of liquidity, perhaps showing a lack of
understanding of the functioning of stock markets.
“Research and analysis on SME capital markets activity”: while institutional investors
regarded this lever as slightly more than ‘Relevant’, all other respondents saw it as slightly
less than ‘Relevant’. Surprisingly, retail investors and market intermediaries valued this lever
less, without, however, showing substantial disagreement (as instead unlisted companies do).
“Tax incentives for investors”: respondents on average considered this lever to be ‘Relevant’
or slightly less than ‘Relevant’. Surprisingly, institutional investors were not the most
supportive category of this lever. Although not considered unimportant, respondents did not
regard this lever as being most critical to creating a successful listings environment.
“Tax incentives for issuers”: respondents on average considered this lever to be ‘Relevant’ or
slightly less than ‘Relevant’. As may be expected, listed companies were the most supportive
of this lever. Although not considered unimportant, respondents did not regard this lever as
being among the most critical to creating a successful listings environment.
“Simplified disclosure requirements”: considered more than ‘Relevant’ by listed and unlisted
companies. Naturally, we observe a contrast between the opinion of investors (and in
particular, institutional investors) and companies in this regard. Interestingly, market
intermediaries are aligned with investors on this lever.
19
Table 2: ‘Please indicate how critical you think the following are for creating a successful listings environment for SMEs (one in which companies are
encouraged to list and raise capital).’
(1) (2) (3) (4) (5) (6) (7)
A well-
established
regulatory and
supervisory
framework for
the SME
exchange
A mechanism
supporting
SMEs to
prepare
disclosure
documents
Financial
education for
SMEs
Financial
education for
investors
Simplified
listing
procedures
A mechanism
enhancing
liquidity of
SME stocks
(e.g., a market-
maker)
Research and
analysis on
SME capital
markets activity
Listed Company 3.29 3.11 3.08 2.94 3.12 3.02 2.88
Unlisted Company 3.02 3.27 2.66 2.68 3.56 2.78 2.61
Market Intermediary 3.47 3.19 3.14 2.95 3.22 3.22 2.86
Institutional Investor 3.00 3.26 3.11 2.61 3.00 3.22 3.17
Retail Investor
3.38
3.06
3.06
2.81
3.13
3.19
2.94
Observations 223 224 224 223 224 223 223 All respondents were asked to rate the relevance of the levers on a scale from 1 to 4, where 1 is ‘Not at all relevant’, 2 is ‘Somewhat relevant’, 3 is ‘Relevant’ and 4 is ‘Very relevant’.

20
Table 2 (continued): ‘Please indicate how critical you think the following are for creating a successful listings environment for SMEs (one in which
companies are encouraged to list and raise capital).’
(8) (9) (10) (11) (12) (13) (14) (15)
Tax incentives
for investors
Tax incentives
for issuers
Raising funds
speedily for
SMEs
Quality,
affordable
advisory
services
Low cost of
listing &
maintenance for
SMEs
Simplified
disclosure
requirements
More retail
investors
More
institutional
investors
Listed Company 3.05 3.02 3.17 3.03 3.20 3.14 2.68 2.94
Unlisted
Company 2.93 2.80 3.10 3.17 3.24 3.39 2.90 2.68
Market
Intermediary 2.75 2.82 3.20 2.93 3.13 2.83 2.69 3.08
Institutional
Investor 2.89 2.53 2.68 2.78 2.89 2.56 2.74 2.89
Retail Investor 2.94 2.81 3.13 2.69 3.25 2.88 3.13 2.94
Observations 223 224 224 223 223 223 224 224 All respondents were asked to rate the relevance of the levers on a scale from 1 to 4, where 1 is ‘Not at all relevant’, 2 is ‘Somewhat relevant’, 3 is ‘Relevant’ and 4 is ‘Very relevant’.
21
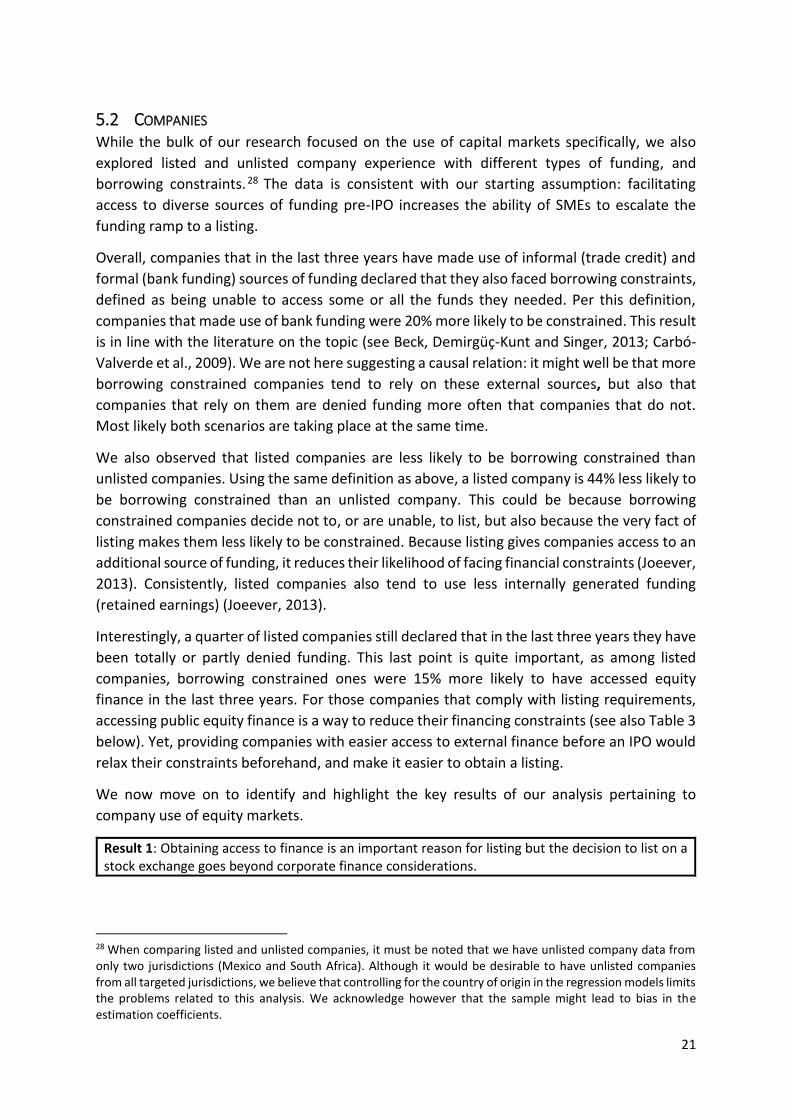
5.2 COMPANIES While the bulk of our research focused on the use of capital markets specifically, we also
explored listed and unlisted company experience with different types of funding, and
borrowing constraints. 28 The data is consistent with our starting assumption: facilitating
access to diverse sources of funding pre-IPO increases the ability of SMEs to escalate the
funding ramp to a listing.
Overall, companies that in the last three years have made use of informal (trade credit) and
formal (bank funding) sources of funding declared that they also faced borrowing constraints,
defined as being unable to access some or all the funds they needed. Per this definition,
companies that made use of bank funding were 20% more likely to be constrained. This result
is in line with the literature on the topic (see Beck, Demirgüç-Kunt and Singer, 2013; Carbó-
Valverde et al., 2009). We are not here suggesting a causal relation: it might well be that more
borrowing constrained companies tend to rely on these external sources, but also that
companies that rely on them are denied funding more often that companies that do not.
Most likely both scenarios are taking place at the same time.
We also observed that listed companies are less likely to be borrowing constrained than
unlisted companies. Using the same definition as above, a listed company is 44% less likely to
be borrowing constrained than an unlisted company. This could be because borrowing
constrained companies decide not to, or are unable, to list, but also because the very fact of
listing makes them less likely to be constrained. Because listing gives companies access to an
additional source of funding, it reduces their likelihood of facing financial constraints (Joeever,
2013). Consistently, listed companies also tend to use less internally generated funding
(retained earnings) (Joeever, 2013).
Interestingly, a quarter of listed companies still declared that in the last three years they have
been totally or partly denied funding. This last point is quite important, as among listed
companies, borrowing constrained ones were 15% more likely to have accessed equity
finance in the last three years. For those companies that comply with listing requirements,
accessing public equity finance is a way to reduce their financing constraints (see also Table 3
below). Yet, providing companies with easier access to external finance before an IPO would
relax their constraints beforehand, and make it easier to obtain a listing.
We now move on to identify and highlight the key results of our analysis pertaining to
company use of equity markets.
Result 1: Obtaining access to finance is an important reason for listing but the decision to list on a stock exchange goes beyond corporate finance considerations.
28 When comparing listed and unlisted companies, it must be noted that we have unlisted company data from only two jurisdictions (Mexico and South Africa). Although it would be desirable to have unlisted companies from all targeted jurisdictions, we believe that controlling for the country of origin in the regression models limits the problems related to this analysis. We acknowledge however that the sample might lead to bias in the estimation coefficients.
22
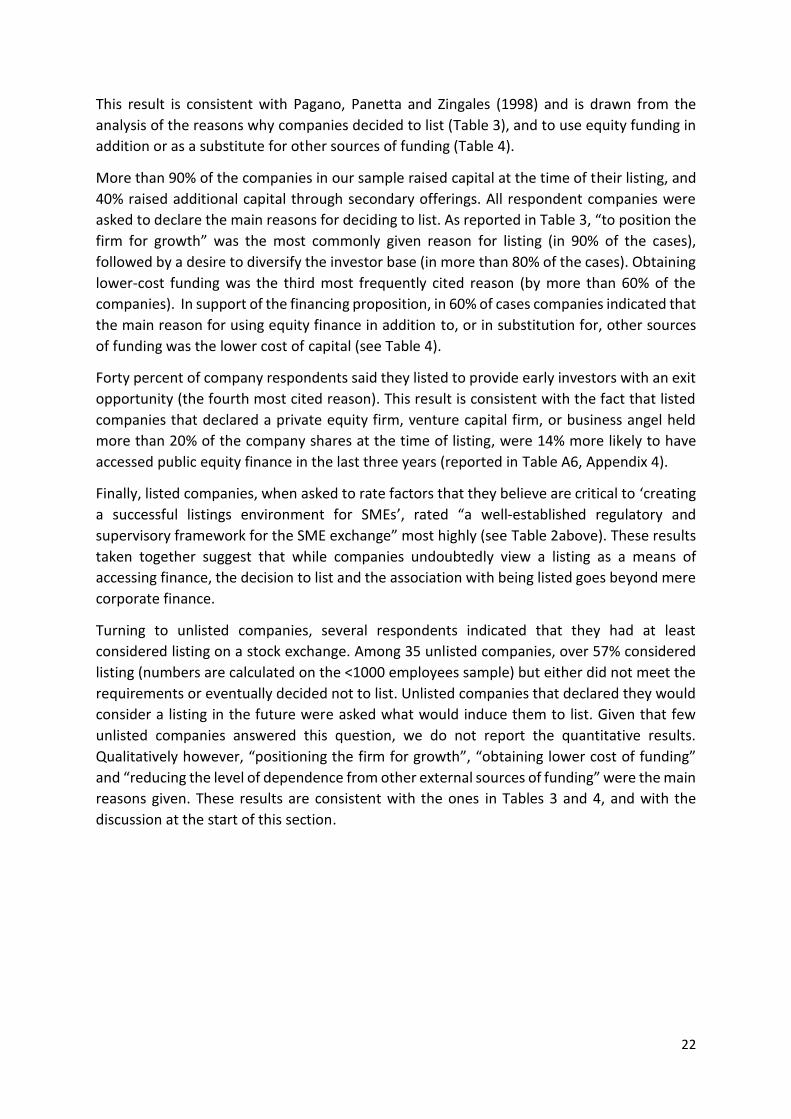
This result is consistent with Pagano, Panetta and Zingales (1998) and is drawn from the
analysis of the reasons why companies decided to list (Table 3), and to use equity funding in
addition or as a substitute for other sources of funding (Table 4).
More than 90% of the companies in our sample raised capital at the time of their listing, and
40% raised additional capital through secondary offerings. All respondent companies were
asked to declare the main reasons for deciding to list. As reported in Table 3, “to position the
firm for growth” was the most commonly given reason for listing (in 90% of the cases),
followed by a desire to diversify the investor base (in more than 80% of the cases). Obtaining
lower-cost funding was the third most frequently cited reason (by more than 60% of the
companies). In support of the financing proposition, in 60% of cases companies indicated that
the main reason for using equity finance in addition to, or in substitution for, other sources
of funding was the lower cost of capital (see Table 4).
Forty percent of company respondents said they listed to provide early investors with an exit
opportunity (the fourth most cited reason). This result is consistent with the fact that listed
companies that declared a private equity firm, venture capital firm, or business angel held
more than 20% of the company shares at the time of listing, were 14% more likely to have
accessed public equity finance in the last three years (reported in Table A6, Appendix 4).
Finally, listed companies, when asked to rate factors that they believe are critical to ‘creating
a successful listings environment for SMEs’, rated “a well-established regulatory and
supervisory framework for the SME exchange” most highly (see Table 2above). These results
taken together suggest that while companies undoubtedly view a listing as a means of
accessing finance, the decision to list and the association with being listed goes beyond mere
corporate finance.
Turning to unlisted companies, several respondents indicated that they had at least
considered listing on a stock exchange. Among 35 unlisted companies, over 57% considered
listing (numbers are calculated on the <1000 employees sample) but either did not meet the
requirements or eventually decided not to list. Unlisted companies that declared they would
consider a listing in the future were asked what would induce them to list. Given that few
unlisted companies answered this question, we do not report the quantitative results.
Qualitatively however, “positioning the firm for growth”, “obtaining lower cost of funding”
and “reducing the level of dependence from other external sources of funding” were the main
reasons given. These results are consistent with the ones in Tables 3 and 4, and with the
discussion at the start of this section.
23
Table 3: ‘What are the main reasons that convinced you to list?’
Listed to: Employees
<500
Employees
<1000
Position firm for growth 93% 95%
Diversify investors 81% 82%
Get lower-cost funding* 63% 62%
Give early inv. an exit 43% 43%
Get better funding terms 23% 27%
Get better reputation 26% 27%
Get competitive adv. 26% 25%
Attract better talent 24% 24%
Get credit-worthiness 21% 21%
Improve financial rep. 12% 12%
Obtain better gov. rel. 9% 1%
Observations 33 63 Companies were asked to choose their reasons for listing. They could tick the four most important options. Variables are binary: equal to 0
if they did not select the option, don’t provide the service, equal to 1 otherwise. *This includes only companies that raised funding at the
time of an IPO. All means are weighted to adjust for representativeness of the samples with respect to their populations.
Table 4: ‘Why did you choose equity finance over or in addition to other sources of funding?’ Raised public equity
funding to:
Employees
<500
Employees
<1000
Lower cost of capital 67% 66%
Difficult access to banks 32% 32%
To reduce level of debt 13% 16%
Observations 31 61 Companies were asked to choose their reasons for accessing equity finance. They could tick as many options as they found relevant options.
Variables are binary: equal to 0 if they did not select the option, equal to 1 if they did. These variables are defined only for companies that
raised funding at the time of an IPO. All means are weighted to adjust for representativeness of the samples with respect to their
populations.
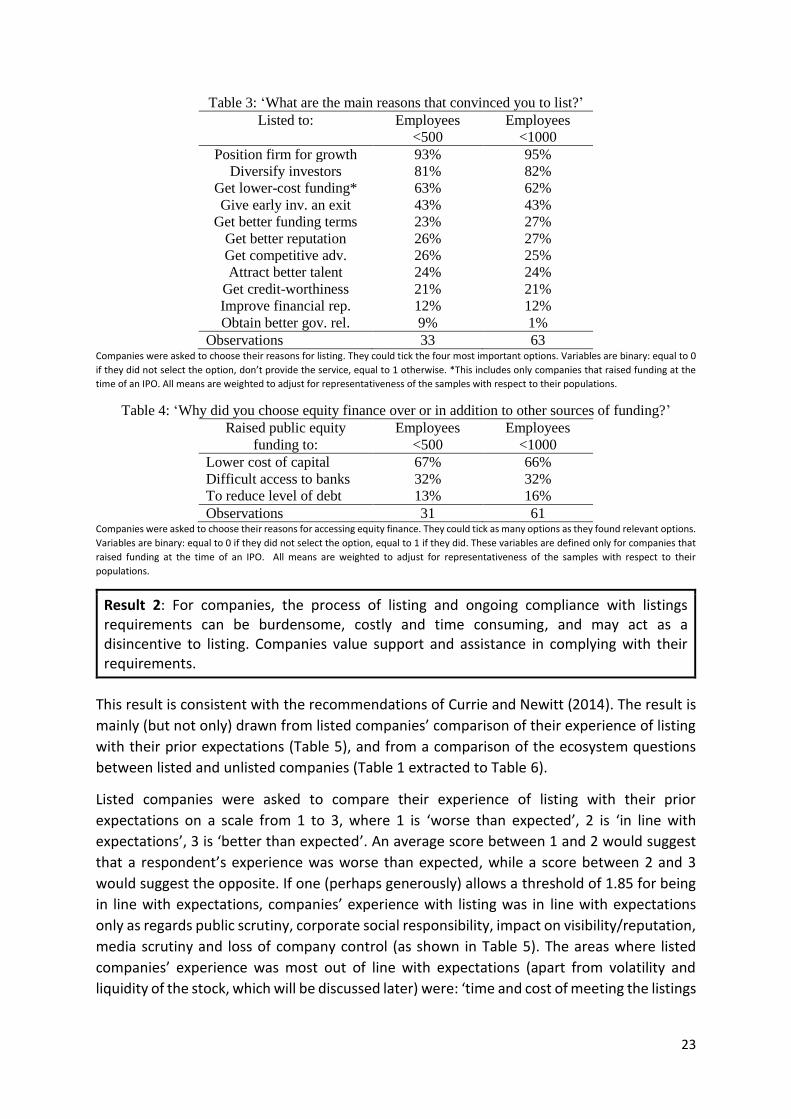
Result 2: For companies, the process of listing and ongoing compliance with listings requirements can be burdensome, costly and time consuming, and may act as a disincentive to listing. Companies value support and assistance in complying with their requirements.
This result is consistent with the recommendations of Currie and Newitt (2014). The result is
mainly (but not only) drawn from listed companies’ comparison of their experience of listing
with their prior expectations (Table 5), and from a comparison of the ecosystem questions
between listed and unlisted companies (Table 1 extracted to Table 6).
Listed companies were asked to compare their experience of listing with their prior
expectations on a scale from 1 to 3, where 1 is ‘worse than expected’, 2 is ‘in line with
expectations’, 3 is ‘better than expected’. An average score between 1 and 2 would suggest
that a respondent’s experience was worse than expected, while a score between 2 and 3
would suggest the opposite. If one (perhaps generously) allows a threshold of 1.85 for being
in line with expectations, companies’ experience with listing was in line with expectations
only as regards public scrutiny, corporate social responsibility, impact on visibility/reputation,
media scrutiny and loss of company control (as shown in Table 5). The areas where listed
companies’ experience was most out of line with expectations (apart from volatility and
liquidity of the stock, which will be discussed later) were: ‘time and cost of meeting the listings
24
requirements’ (1.45), ‘time and cost of reforming the corporate governance structure’ (1.48),
and ‘time and cost of aligning financial statements’ (1.66).
Table 5: ‘How does your company’s experience compare to your expectations prior to listing with
respect to the following?’
(1)
Employees
<500
(2)
Employees
<1000
Time and costs of meeting
ongoing listing
requirements
1.45 1.44
Volatility of the stock 1.46 1.45
Time of reforming
corporate governance 1.48 1.46
Level of liquidity of the
stock 1.57 1.6
Time and costs of aligning
financial statements 1.66 1.67
Time devoted to investor
relations 1.66 1.65
Effect on financial
performance 1.68 1.68
Interest from institutional
investors 1.69 1.7
Coverage of the company's
shares 1.76 1.76
Shareholder pressure 1.77 1.78
Public scrutiny 1.89 1.9
Corporate social
responsibility 1.89 1.88
Impact on
visibility/reputation 1.92 1.95
Media scrutiny 2 1.99
Loss of company control 2.01 2.02
Observations 30 62 Companies were asked to rate how their experience with listing compared with their expectations on a scale from 1 to 3, where 1 is ‘Worse
than expected’, 2 is ‘As expected’, 3 is ‘Better than expected’. All means are weighted to adjust for representativeness of the samples with respect to their populations.
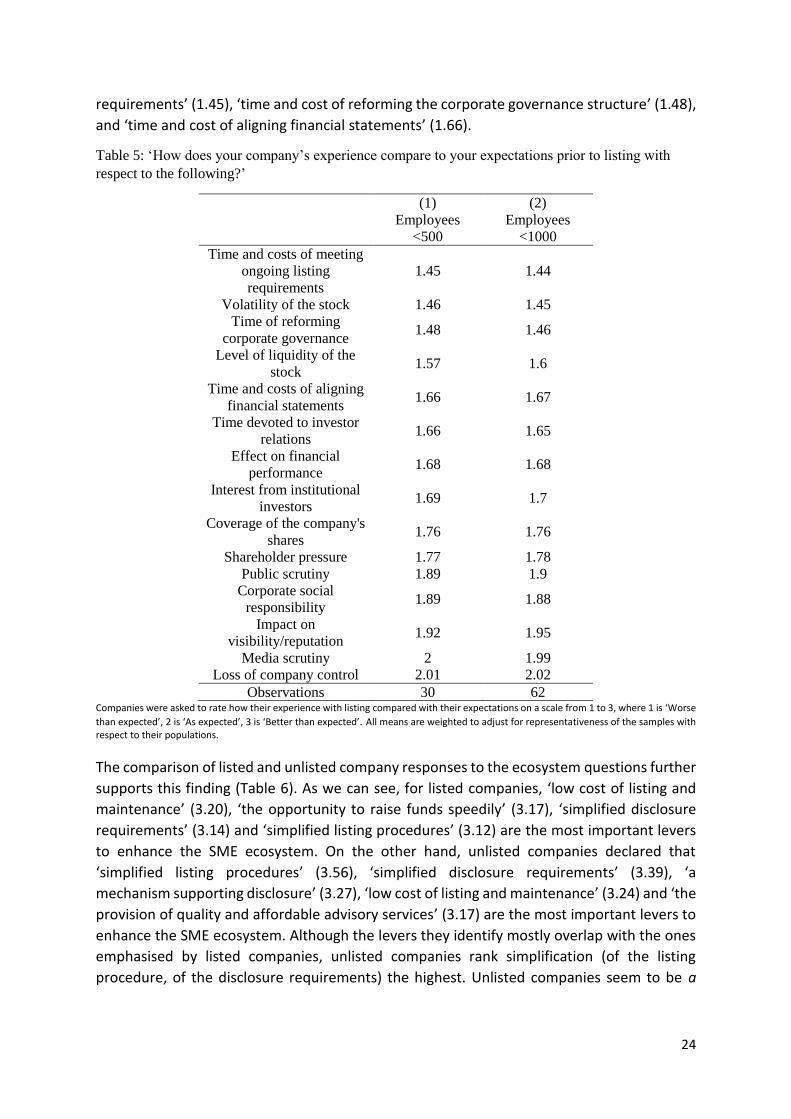
The comparison of listed and unlisted company responses to the ecosystem questions further
supports this finding (Table 6). As we can see, for listed companies, ‘low cost of listing and
maintenance’ (3.20), ‘the opportunity to raise funds speedily’ (3.17), ‘simplified disclosure
requirements’ (3.14) and ‘simplified listing procedures’ (3.12) are the most important levers
to enhance the SME ecosystem. On the other hand, unlisted companies declared that
‘simplified listing procedures’ (3.56), ‘simplified disclosure requirements’ (3.39), ‘a
mechanism supporting disclosure’ (3.27), ‘low cost of listing and maintenance’ (3.24) and ‘the
provision of quality and affordable advisory services’ (3.17) are the most important levers to
enhance the SME ecosystem. Although the levers they identify mostly overlap with the ones
emphasised by listed companies, unlisted companies rank simplification (of the listing
procedure, of the disclosure requirements) the highest. Unlisted companies seem to be a
25
priori more ‘scared’ about the whole procedure, and indeed we observe significant statistical
differences between the two categories (boldface in table).
This is bolstered anecdotally (we have very few responses to this question) by unlisted
company responses to the question of why they decided not to list. The majority declared
“the ongoing cost of compliance was too high”; that “the listing requirements entailed
changing too many processes within the firm”; and that they were “concerned about heavy
and cumbersome requirements”.
These responses seem to confirm that SMEs not only perceived the process of listing as
cumbersome, costly and time consuming (and this perception may discourage SMEs from
listing) but experienced it as such.
Table 6: ‘Please indicate how critical you think the following are for creating a successful listings
environment for SMEs:’
Mean -
Unlisted
Mean -
Listed
Regulatory framework 3.02 3.29
Supporting disclosure 3.27 3.11
Fin. education SMEs 2.66 3.08
Fin. education investors 2.68 2.94
Simplified list proc. 3.56 3.12 Enhancing liquidity 2.78 3.02
Research and analysis 2.61 2.77
Tax incentives for inv 2.93 3.05
Tax incentives for iss. 2.80 3.02
Raising funds speedily 3.10 3.17
Quality advisory serv. 3.17 3.03
Low cost of listing 3.24 3.20
Simplified disclosure 3.39 3.14 More retail investors 2.90 2.68
More institutional inv 2.68 2.94
Observations 41 65 All analyses are calculated on the <1000 employees sample. Companies were asked to rate the relevance of the levers on a scale from 1 to
4, where 1 is ‘Not at all relevant’, 2 is ‘Somewhat relevant’, 3 is ‘Relevant’ and 4 is ‘Very relevant’. All means are weighted to adjust for
representativeness of the samples with respect to their populations.
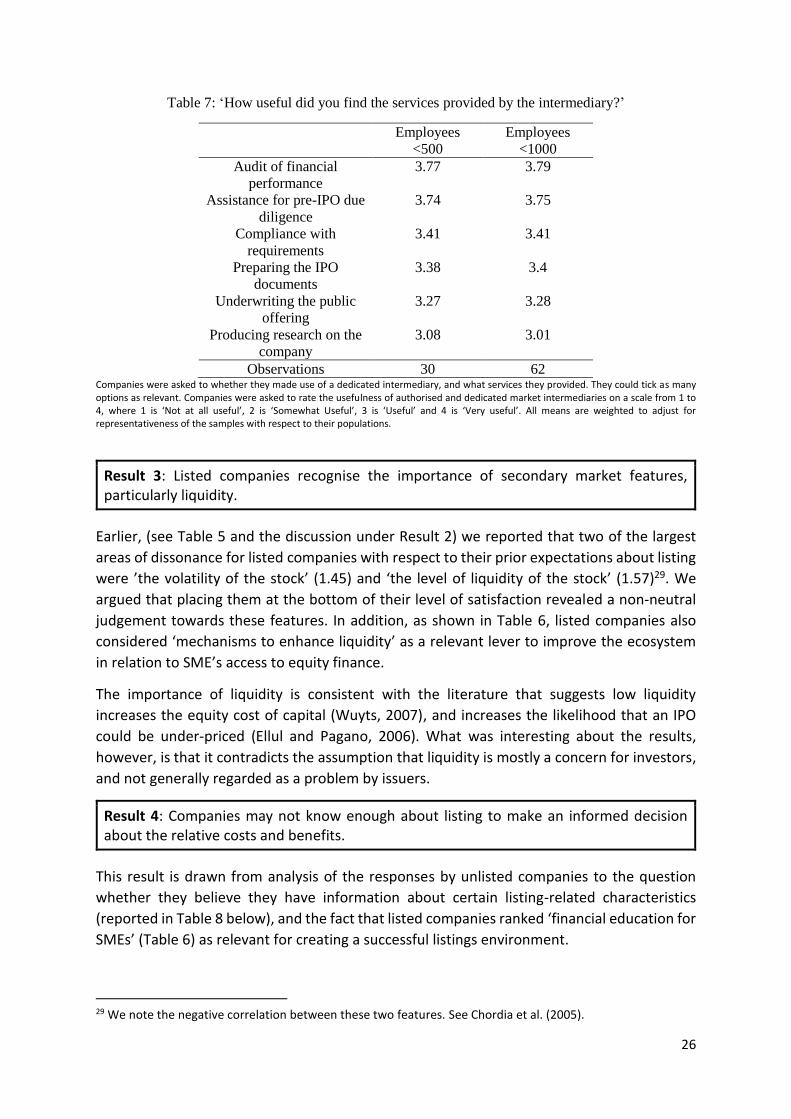
Perhaps because of this, listed companies valued the support and assistance provided by
intermediaries.
The analysis of listed companies’ assessment of the services provided by authorised market
intermediaries (Table 7) shows that companies overall consider the assistance provided by
authorised intermediaries to be of great help. The intermediaries that were considered to be
most useful were those that assisted with preparing for the listing, and ensuring ongoing
compliance. Listed companies, therefore, appeared to value services that made the IPO
process easier, quicker and less burdensome. Underwriting the public offering and producing
research on the company were ranked last, although companies still valued them as useful
services.
26
Table 7: ‘How useful did you find the services provided by the intermediary?’
Employees
<500
Employees
<1000
Audit of financial
performance
3.77 3.79
Assistance for pre-IPO due
diligence
3.74 3.75
Compliance with
requirements
3.41 3.41
Preparing the IPO
documents
3.38 3.4
Underwriting the public
offering
3.27 3.28
Producing research on the
company
3.08 3.01
Observations 30 62 Companies were asked to whether they made use of a dedicated intermediary, and what services they provided. They could tick as many options as relevant. Companies were asked to rate the usefulness of authorised and dedicated market intermediaries on a scale from 1 to 4, where 1 is ‘Not at all useful’, 2 is ‘Somewhat Useful’, 3 is ‘Useful’ and 4 is ‘Very useful’. All means are weighted to adjust for representativeness of the samples with respect to their populations.
Result 3: Listed companies recognise the importance of secondary market features, particularly liquidity.
Earlier, (see Table 5 and the discussion under Result 2) we reported that two of the largest
areas of dissonance for listed companies with respect to their prior expectations about listing
were ’the volatility of the stock’ (1.45) and ‘the level of liquidity of the stock’ (1.57)29. We
argued that placing them at the bottom of their level of satisfaction revealed a non-neutral
judgement towards these features. In addition, as shown in Table 6, listed companies also
considered ‘mechanisms to enhance liquidity’ as a relevant lever to improve the ecosystem
in relation to SME’s access to equity finance.
The importance of liquidity is consistent with the literature that suggests low liquidity
increases the equity cost of capital (Wuyts, 2007), and increases the likelihood that an IPO
could be under-priced (Ellul and Pagano, 2006). What was interesting about the results,
however, is that it contradicts the assumption that liquidity is mostly a concern for investors,
and not generally regarded as a problem by issuers.
Result 4: Companies may not know enough about listing to make an informed decision about the relative costs and benefits.
This result is drawn from analysis of the responses by unlisted companies to the question
whether they believe they have information about certain listing-related characteristics
(reported in Table 8 below), and the fact that listed companies ranked ‘financial education for
SMEs’ (Table 6) as relevant for creating a successful listings environment.
29 We note the negative correlation between these two features. See Chordia et al. (2005).
27
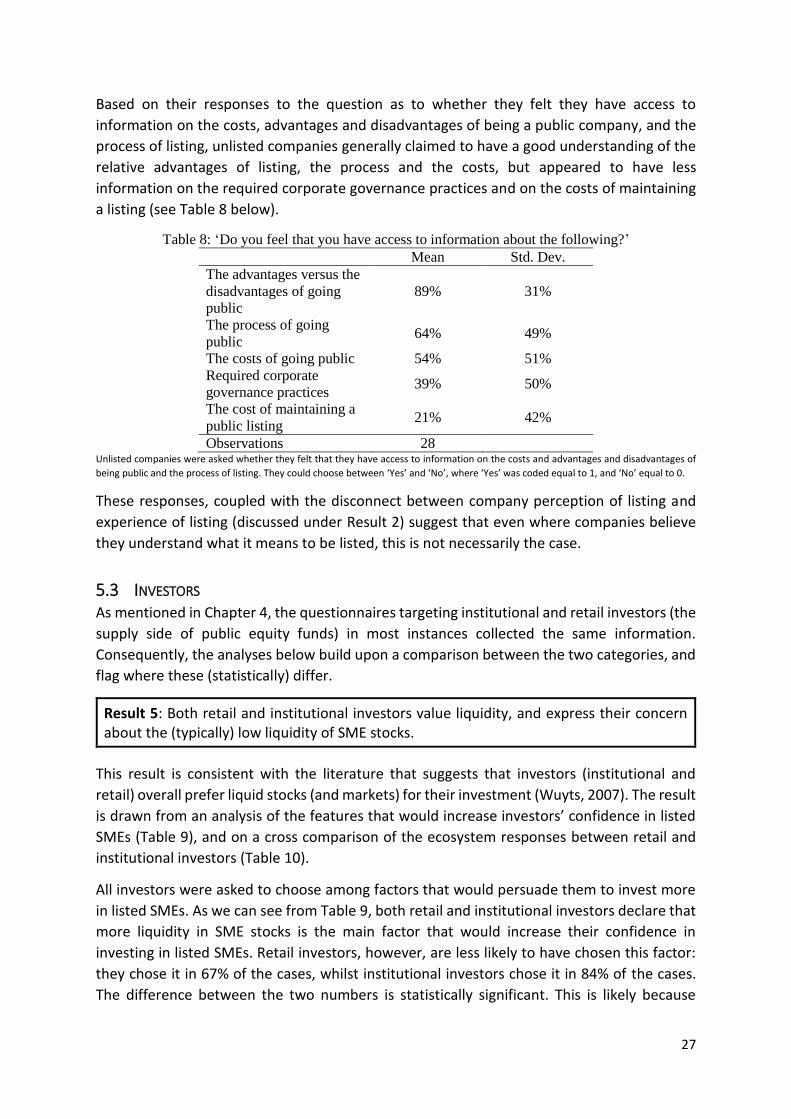
Based on their responses to the question as to whether they felt they have access to
information on the costs, advantages and disadvantages of being a public company, and the
process of listing, unlisted companies generally claimed to have a good understanding of the
relative advantages of listing, the process and the costs, but appeared to have less
information on the required corporate governance practices and on the costs of maintaining
a listing (see Table 8 below).
Table 8: ‘Do you feel that you have access to information about the following?’
Mean Std. Dev.
The advantages versus the
disadvantages of going
public
89% 31%
The process of going
public 64% 49%
The costs of going public 54% 51%
Required corporate
governance practices 39% 50%
The cost of maintaining a
public listing 21% 42%
Observations 28 Unlisted companies were asked whether they felt that they have access to information on the costs and advantages and disadvantages of
being public and the process of listing. They could choose between ‘Yes’ and ‘No’, where ‘Yes’ was coded equal to 1, and ‘No’ equal to 0.
These responses, coupled with the disconnect between company perception of listing and
experience of listing (discussed under Result 2) suggest that even where companies believe
they understand what it means to be listed, this is not necessarily the case.
5.3 INVESTORS As mentioned in Chapter 4, the questionnaires targeting institutional and retail investors (the
supply side of public equity funds) in most instances collected the same information.
Consequently, the analyses below build upon a comparison between the two categories, and
flag where these (statistically) differ.
Result 5: Both retail and institutional investors value liquidity, and express their concern about the (typically) low liquidity of SME stocks.
This result is consistent with the literature that suggests that investors (institutional and
retail) overall prefer liquid stocks (and markets) for their investment (Wuyts, 2007). The result
is drawn from an analysis of the features that would increase investors’ confidence in listed
SMEs (Table 9), and on a cross comparison of the ecosystem responses between retail and
institutional investors (Table 10).
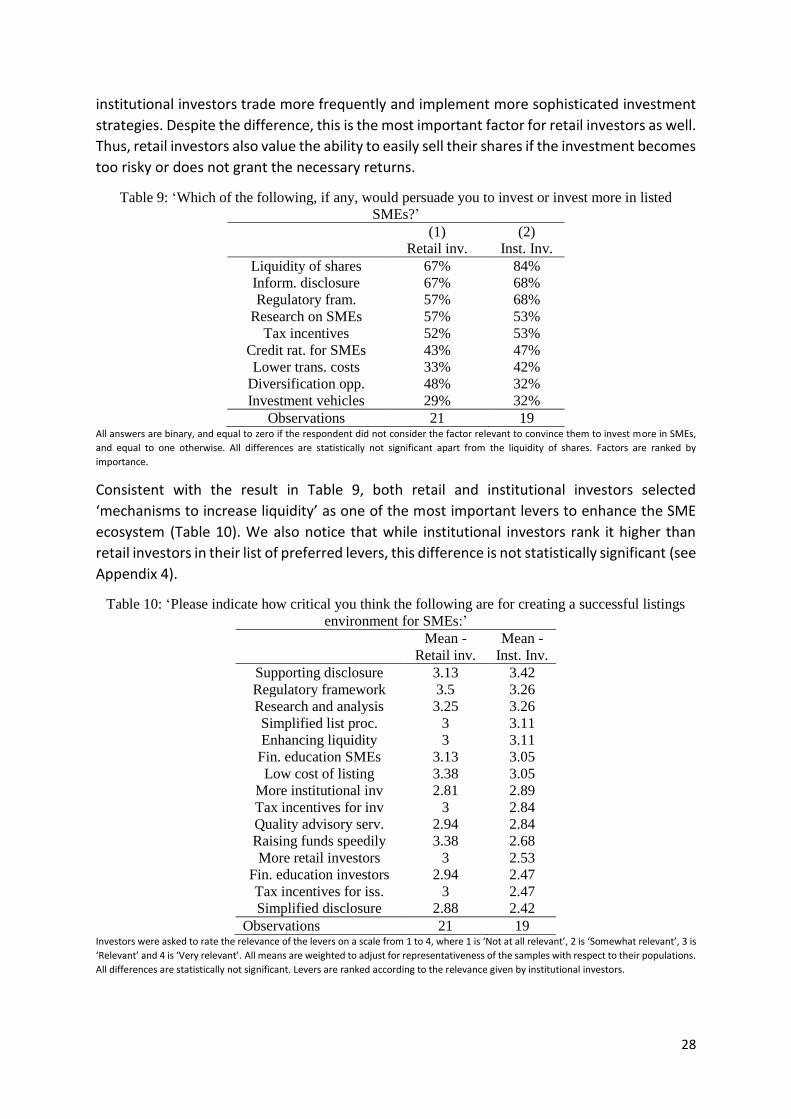
All investors were asked to choose among factors that would persuade them to invest more
in listed SMEs. As we can see from Table 9, both retail and institutional investors declare that
more liquidity in SME stocks is the main factor that would increase their confidence in
investing in listed SMEs. Retail investors, however, are less likely to have chosen this factor:
they chose it in 67% of the cases, whilst institutional investors chose it in 84% of the cases.
The difference between the two numbers is statistically significant. This is likely because
28
institutional investors trade more frequently and implement more sophisticated investment
strategies. Despite the difference, this is the most important factor for retail investors as well.
Thus, retail investors also value the ability to easily sell their shares if the investment becomes
too risky or does not grant the necessary returns.
Table 9: ‘Which of the following, if any, would persuade you to invest or invest more in listed
SMEs?’
(1) (2)
Retail inv. Inst. Inv.
Liquidity of shares 67% 84%
Inform. disclosure 67% 68%
Regulatory fram. 57% 68%
Research on SMEs 57% 53%
Tax incentives 52% 53%
Credit rat. for SMEs 43% 47%
Lower trans. costs 33% 42%
Diversification opp. 48% 32%
Investment vehicles 29% 32%
Observations 21 19 All answers are binary, and equal to zero if the respondent did not consider the factor relevant to convince them to invest more in SMEs,
and equal to one otherwise. All differences are statistically not significant apart from the liquidity of shares. Factors are ranked by
importance.
Consistent with the result in Table 9, both retail and institutional investors selected
‘mechanisms to increase liquidity’ as one of the most important levers to enhance the SME
ecosystem (Table 10). We also notice that while institutional investors rank it higher than
retail investors in their list of preferred levers, this difference is not statistically significant (see
Appendix 4).
Table 10: ‘Please indicate how critical you think the following are for creating a successful listings
environment for SMEs:’
Mean -
Retail inv.
Mean -
Inst. Inv.
Supporting disclosure 3.13 3.42
Regulatory framework 3.5 3.26
Research and analysis 3.25 3.26
Simplified list proc. 3 3.11
Enhancing liquidity 3 3.11
Fin. education SMEs 3.13 3.05
Low cost of listing 3.38 3.05
More institutional inv 2.81 2.89
Tax incentives for inv 3 2.84
Quality advisory serv. 2.94 2.84
Raising funds speedily 3.38 2.68
More retail investors 3 2.53
Fin. education investors 2.94 2.47
Tax incentives for iss. 3 2.47
Simplified disclosure 2.88 2.42
Observations 21 19 Investors were asked to rate the relevance of the levers on a scale from 1 to 4, where 1 is ‘Not at all relevant’, 2 is ‘Somewhat relevant’, 3 is
‘Relevant’ and 4 is ‘Very relevant’. All means are weighted to adjust for representativeness of the samples with respect to their populations.
All differences are statistically not significant. Levers are ranked according to the relevance given by institutional investors.

29
Investors (retail and institutional) who declared they did not invest in listed SMEs were asked
to state the reasons for not investing. Unfortunately, very few investors answered this
question. As a qualitative data point we note that the majority did not invest in listed SMEs
because of “insufficient liquidity to justify an investment”. This result supports the above
findings.
Result 6: Both retail and institutional investors would like to have more and/or better information about SMEs.
This result is consistent with economic theory. Lending and investment relations are generally
characterised by information asymmetries (see for example Stiglitz & Weiss, 1981). Given
their typically younger age and that they tend to have less available information, SMEs are
particularly affected by this problem when looking for external funding (Moritz, Block and
Heinz, 2016). This result is drawn from the analyses in Table 9 and Table 10, and from an
analysis of the factors that affected investor confidence in SMEs (Table 11).
As we can see from Table 9, row 2, both retail and institutional investors regard ‘better
information disclosure requirements’ as the second most important factor that would
persuade them to invest (more) in listed SMEs. Linked to this, institutional investors ranked
‘a mechanism supporting disclosure’ as the most important factor for creating an enabling
environment for SMEs (3.42) while it was one of the most important factors for retail
investors (3.13). Table 11, row 2 further confirms the importance of quality information
disclosure for investors. Having regard to this specific question, although institutional
investors consider ‘information disclosure requirements’ on average as slightly more
important than retail investors, this difference is not statistically significant (see Appendix 4),
and institutional and retail investors regard this as equally important. Referring to Table 10,
both retail and institutional investors ranked ‘research and analysis’ as important
components of a successful SME listings environment. Equally, over 50% of retail and
institutional investors indicated that greater availability of research on SMEs would
encourage them to invest more in SMEs (Table 9).
Table 11: ‘Please rate how much each of the following factors affect your confidence in SMEs:’
(1) (2)
Retail inv. Inst. Inv.
Corp. gov. req. 3.60 3.53
Inform. discl. req. 3.33 3.67
Suitability of directors 3.27 3.73
Rules on party trans. 2.93 3.53
Provisions on dilution 2.80 3.33
Sharehold. rights prot. 2.93 3.67
Age or dev. of SME 3.20 3.33
Revenue growth 3.80 3.27
Observations 15 15 All answers are rated in a scale from 1 to 4, where 1 is ‘Not relevant at all’, 2 is ‘Of little relevance’, 3 is ‘relevant’ and 4 is ‘Very relevant’.
Some respondents also indicated that credit ratings for SMEs may induce them to invest more
in SMEs (a credit rating should be regarded as a data point). Anecdotally, we also report that

30
a few Mexican market intermediaries declared that they use credit ratings to decide whether
to provide services to SMEs.
Finally, we provide evidence from investors (retail and institutional) that do not invest in listed
SMEs, who were asked to state the reasons for not investing. As mentioned, very few
investors answered this question; however, for those who did answer, the majority noted this
was because of “insufficient information to make a risk assessment”. This anecdotal result
supports the above consideration.
5.4 MARKET INTERMEDIARIES As mentioned in Chapter 4, our questionnaires also targeted market intermediaries. The
results below relate to this category of respondents.
Result 7: Market intermediaries service the SME market for a variety of reasons, but not necessarily because it is profitable to do so.
This result is drawn from an analysis of the reasons market intermediaries gave for providing
services to SMEs (Table 12). The most commonly cited reasons for providing services to SMEs
were because of client demand and a niche positioning. Only 58% of respondents said that
the primary motivation was because it was profitable to do so. This lack of profitability
potentially creates problems in ensuring the existence of a sufficiently vibrant and motivated
ecosystem to support SMEs, particularly smaller-sized companies.
Table 12: ‘Why do you provide services to SMEs?’
(1) (2)
Mean Standard Dev.
Clients demand it 71% 46%
It is a niche position 71% 46%
Part of a growth strategy 62% 49%
Profitable to do so 58% 50%
Observations 79 Intermediaries who indicated that they provided services to SMEs were asked select why they provided these services. They could tick as
many options as were relevant. Variables are binary: equal to 0 if they don’t select the option, equal to 1 otherwise.
It appears market intermediaries may associate the lower profitability with the small set of
available SMEs in the equity market space. As per Table 13, market intermediaries most
frequently cited ‘a larger pool of companies’ and ‘earlier opportunity to work with companies’
as factors that would make it more attractive for them to provide services to SMEs.

31
Table 13: ‘What would make servicing this segment of the market more attractive to you?’
(1) (2)
Mean Standard Dev.
A larger pool of
companies to work with 76% 43%
Earlier opportunity to
engage with the companies 75% 44%
Ability to use standardised
listings documents 61% 49%
Ability to use standardised
templates/reporting
methodologies
56% 50%
Observations 79 Intermediaries were asked to choose what services they provide to SMEs. They could tick as many options as the services they provide.
Variables are binary: equal to 0 if they don’t provide the service, equal to 1 otherwise.
Result 8: Market intermediaries also value greater liquidity.
Liquidity is mostly a source of concern for investors, as mentioned before. The literature
agrees, however, that liquidity is an important variable for issuers and market intermediaries
as well (see Wuyts, 2007, page 286). We discuss the fact that listed and unlisted companies
give importance to liquidity in Chapter 5.2. Our survey results confirm that market
intermediaries also consider liquidity to be an important factor to enhance the SME’s listing
environment. We discuss these findings below.
As we can see from Table 2, market intermediaries (together with institutional investors) rate
‘a mechanism enhancing liquidity of SME stocks’ the highest when assessing its importance
for the SME ecosystem. Interestingly this result holds across intermediary types (a provider
of legal services shouldn’t necessarily care about liquidity). An analysis of the type of services
the respondents provided to SMEs however shows most intermediaries provided more than
one service, including services for which liquidity is an important determinant, such as
underwriting or market-making (see Figures 7 and 8). Liquidity is likely to be an important
factor for most intermediaries, at least in the sample considered.
Figure 7: Distribution of the number of services provided by respondent intermediaries when market-making is also provided
1 1
8
24
30 1
0
5
10
15
20
25
30
1 2 3 4 5 6 7
Nu
mb
er o
f re
spo
nd
ents
Number of services provided
Number of services providedwhen market making is also provided
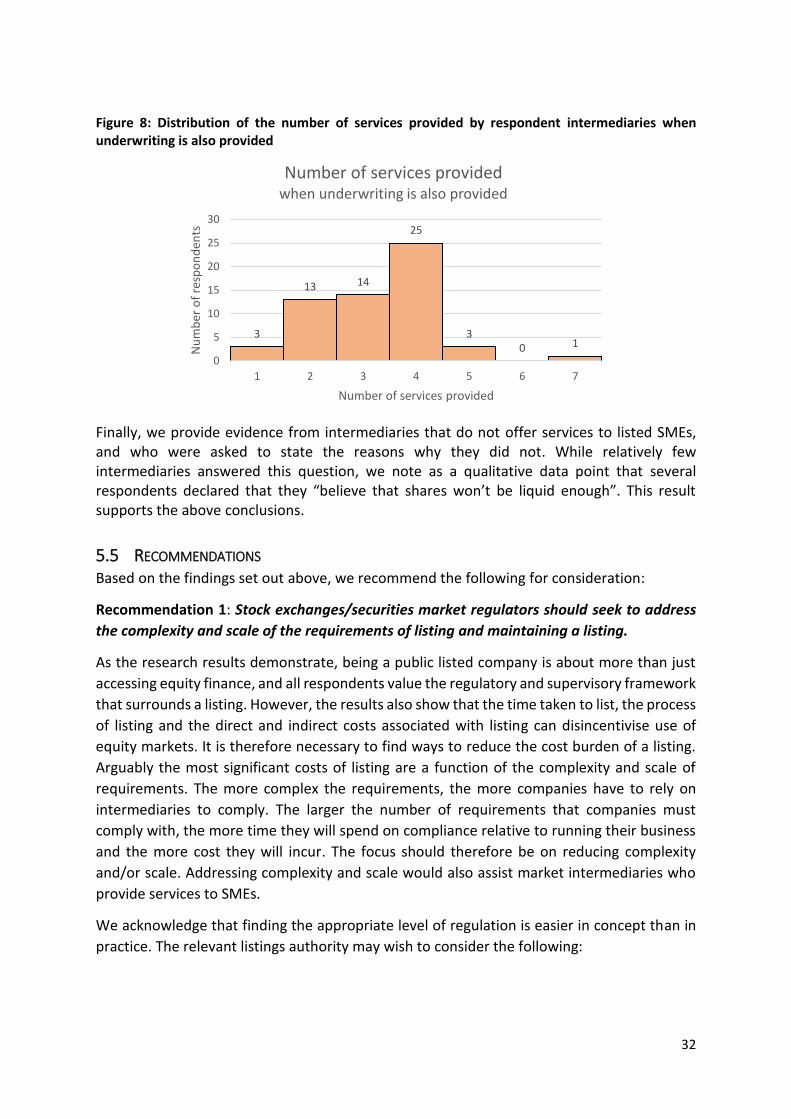
32
Figure 8: Distribution of the number of services provided by respondent intermediaries when underwriting is also provided
Finally, we provide evidence from intermediaries that do not offer services to listed SMEs, and who were asked to state the reasons why they did not. While relatively few intermediaries answered this question, we note as a qualitative data point that several respondents declared that they “believe that shares won’t be liquid enough”. This result supports the above conclusions.
5.5 RECOMMENDATIONS Based on the findings set out above, we recommend the following for consideration:
Recommendation 1: Stock exchanges/securities market regulators should seek to address
the complexity and scale of the requirements of listing and maintaining a listing.
As the research results demonstrate, being a public listed company is about more than just
accessing equity finance, and all respondents value the regulatory and supervisory framework
that surrounds a listing. However, the results also show that the time taken to list, the process
of listing and the direct and indirect costs associated with listing can disincentivise use of
equity markets. It is therefore necessary to find ways to reduce the cost burden of a listing.
Arguably the most significant costs of listing are a function of the complexity and scale of
requirements. The more complex the requirements, the more companies have to rely on
intermediaries to comply. The larger the number of requirements that companies must
comply with, the more time they will spend on compliance relative to running their business
and the more cost they will incur. The focus should therefore be on reducing complexity
and/or scale. Addressing complexity and scale would also assist market intermediaries who
provide services to SMEs.
We acknowledge that finding the appropriate level of regulation is easier in concept than in
practice. The relevant listings authority may wish to consider the following:
3
13 14
25
30 1
0
5
10
15
20
25
30
1 2 3 4 5 6 7
Nu
mb
er o
f re
spo
nd
ents
Number of services provided
Number of services providedwhen underwriting is also provided
33
Soliciting input from investor groups (particularly those who invest in SMEs) to
determine which listings requirements are the most essential for making an informed
investment decision.
Producing listings requirements written in less technical language.
Working with relevant market intermediaries to produce a set of ‘easy-to-understand’
guidelines for listing and ongoing compliance.
Working with relevant market intermediaries to introduce standardised reporting
frameworks or processes.
All participants in the broader financial ecosystem should consider working together to
provide pre- and post-IPO education to SMEs about financing options, suitability of financing
options at various stages of the company life-cycle, the process of listing, what to expect from
listing, and how to derive maximum value from being listed.30
Recommendation 2: Stock Exchanges/securities market regulators should enhance the
quality, not necessarily the quantity of information available about SMEs.
The concept of the informational gap is well-recognised and particularly prevalent for SMEs.
The challenge is two-fold: it includes both information that SMEs disclose as part of their
regulatory compliance, and the availability of third-party information about companies.
As mentioned in the discussion of the results, the information disclosed as part of regulatory
compliance is arguably less about the quantity of information SMEs disclose, than the quality.
The proposals contained in the previous recommendation (more streamlined and simplified
disclosure requirements as well financial education) should not only reduce the burden on
SMEs but also help to address the quality of disclosure. If companies have fewer disclosure
requirements, that they can more easily understand, and they recognise the importance of
ensuring the availability of good information, they are more likely to produce decent
information. Even in a world of simplified requirements, SMEs will still have to rely on market
intermediaries for support in some instances. The exchange and the market regulator should
work with relevant financial intermediaries to ensure that intermediaries are able to support
companies as required. Exchanges can also seek to identify opportunities to reduce the cost
to intermediaries of providing these services (technology may provide some assistance).
Increasing research coverage is potentially more challenging. Some exchanges have
introduced incentives to encourage research houses to produce research while others simply
pay research providers to produce basic research. In the next chapter, we discuss technology
innovations that could further expand the availability of research.
Finally, credit ratings are a potential independent data point for investors which market
regulators/exchanges may wish to consider utilising. As a note of caution: the use of these
should not increase the cost burden for SMEs so careful thought needs to be given to who
carries the cost of obtaining these.
30 An increasing number of exchanges have introduced targeted education programmes for SMEs. See the previous WFE report on SMEs for examples.
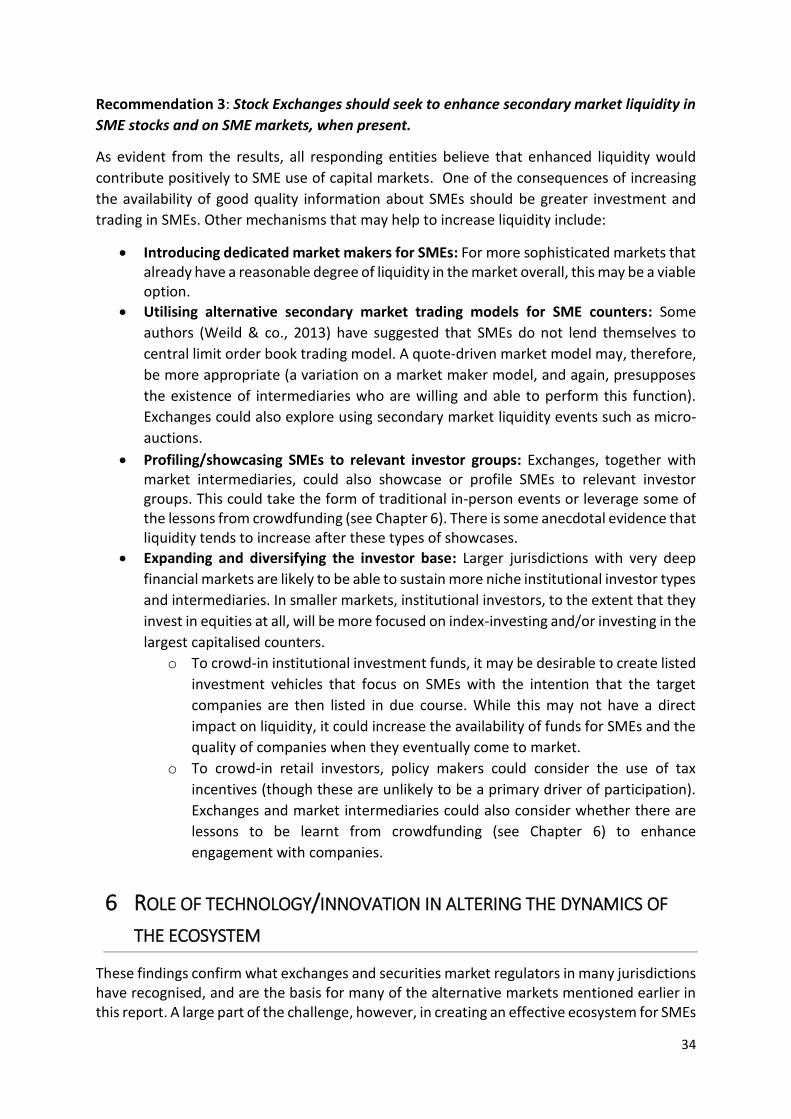
34
Recommendation 3: Stock Exchanges should seek to enhance secondary market liquidity in
SME stocks and on SME markets, when present.
As evident from the results, all responding entities believe that enhanced liquidity would
contribute positively to SME use of capital markets. One of the consequences of increasing
the availability of good quality information about SMEs should be greater investment and
trading in SMEs. Other mechanisms that may help to increase liquidity include:
Introducing dedicated market makers for SMEs: For more sophisticated markets that already have a reasonable degree of liquidity in the market overall, this may be a viable option.
Utilising alternative secondary market trading models for SME counters: Some
authors (Weild & co., 2013) have suggested that SMEs do not lend themselves to
central limit order book trading model. A quote-driven market model may, therefore,
be more appropriate (a variation on a market maker model, and again, presupposes
the existence of intermediaries who are willing and able to perform this function).
Exchanges could also explore using secondary market liquidity events such as micro-
auctions.
Profiling/showcasing SMEs to relevant investor groups: Exchanges, together with market intermediaries, could also showcase or profile SMEs to relevant investor groups. This could take the form of traditional in-person events or leverage some of the lessons from crowdfunding (see Chapter 6). There is some anecdotal evidence that liquidity tends to increase after these types of showcases.
Expanding and diversifying the investor base: Larger jurisdictions with very deep
financial markets are likely to be able to sustain more niche institutional investor types
and intermediaries. In smaller markets, institutional investors, to the extent that they
invest in equities at all, will be more focused on index-investing and/or investing in the
largest capitalised counters.
o To crowd-in institutional investment funds, it may be desirable to create listed
investment vehicles that focus on SMEs with the intention that the target
companies are then listed in due course. While this may not have a direct
impact on liquidity, it could increase the availability of funds for SMEs and the
quality of companies when they eventually come to market.
o To crowd-in retail investors, policy makers could consider the use of tax
incentives (though these are unlikely to be a primary driver of participation).
Exchanges and market intermediaries could also consider whether there are
lessons to be learnt from crowdfunding (see Chapter 6) to enhance
engagement with companies.
6 ROLE OF TECHNOLOGY/INNOVATION IN ALTERING THE DYNAMICS OF
THE ECOSYSTEM
These findings confirm what exchanges and securities market regulators in many jurisdictions have recognised, and are the basis for many of the alternative markets mentioned earlier in this report. A large part of the challenge, however, in creating an effective ecosystem for SMEs
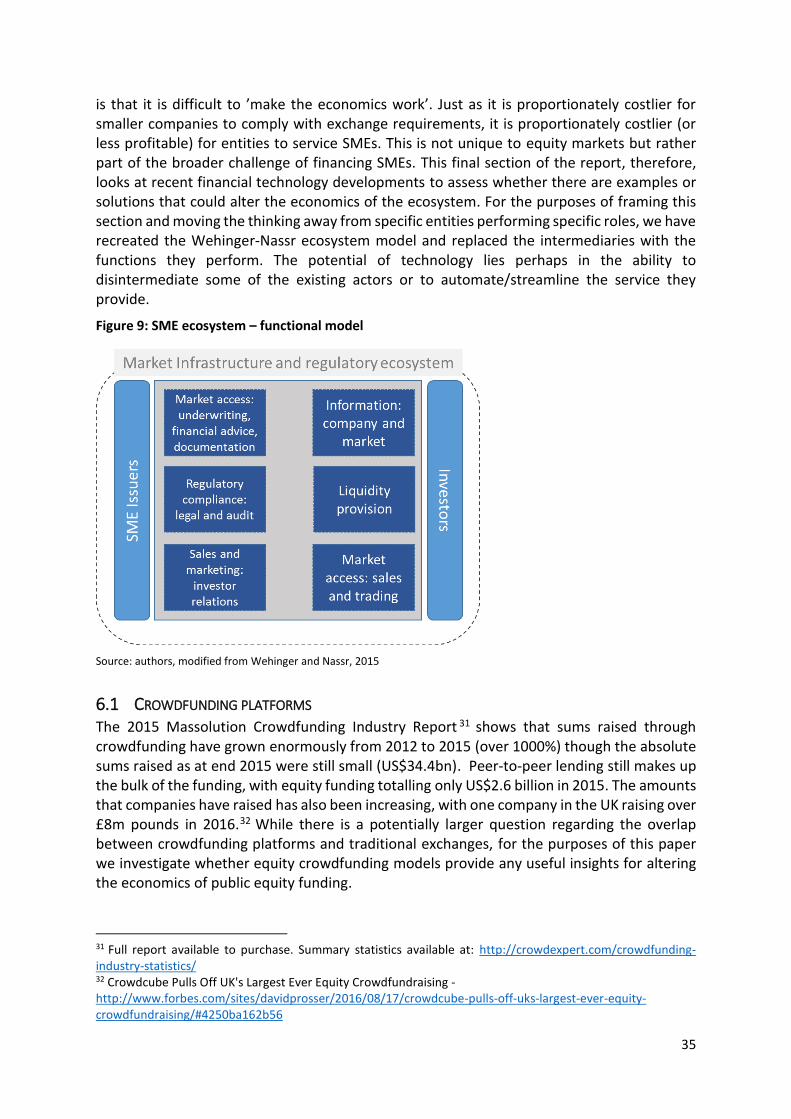
35
is that it is difficult to ’make the economics work’. Just as it is proportionately costlier for smaller companies to comply with exchange requirements, it is proportionately costlier (or less profitable) for entities to service SMEs. This is not unique to equity markets but rather part of the broader challenge of financing SMEs. This final section of the report, therefore, looks at recent financial technology developments to assess whether there are examples or solutions that could alter the economics of the ecosystem. For the purposes of framing this section and moving the thinking away from specific entities performing specific roles, we have recreated the Wehinger-Nassr ecosystem model and replaced the intermediaries with the functions they perform. The potential of technology lies perhaps in the ability to disintermediate some of the existing actors or to automate/streamline the service they provide.
Figure 9: SME ecosystem – functional model
Source: authors, modified from Wehinger and Nassr, 2015
6.1 CROWDFUNDING PLATFORMS The 2015 Massolution Crowdfunding Industry Report 31 shows that sums raised through crowdfunding have grown enormously from 2012 to 2015 (over 1000%) though the absolute sums raised as at end 2015 were still small (US$34.4bn). Peer-to-peer lending still makes up the bulk of the funding, with equity funding totalling only US$2.6 billion in 2015. The amounts that companies have raised has also been increasing, with one company in the UK raising over £8m pounds in 2016.32 While there is a potentially larger question regarding the overlap between crowdfunding platforms and traditional exchanges, for the purposes of this paper we investigate whether equity crowdfunding models provide any useful insights for altering the economics of public equity funding.
31 Full report available to purchase. Summary statistics available at: http://crowdexpert.com/crowdfunding-industry-statistics/ 32 Crowdcube Pulls Off UK's Largest Ever Equity Crowdfundraising - http://www.forbes.com/sites/davidprosser/2016/08/17/crowdcube-pulls-off-uks-largest-ever-equity-crowdfundraising/#4250ba162b56
36
Figure 10: Crowdfunding composition
Source: Massolution data
One of the core benefits for companies of crowdfunding platforms is that they reduce the search costs associated with finding suitable investors (or providers of capital). By aggregating large numbers of investors and consolidating the relevant information that investors require to make an investment decision, the cost to the company of finding someone prepared to give them money is reduced. This is also the economic promise underpinning traditional equity markets. Crowdfunding platforms are theoretically able to provide less expensive access to capital for several reasons:
Simplified capital raising process: The capital raising (generally) does not constitute an ‘offer to the public’ and the issuer does not therefore have to comply with the full set of disclosure requirements typically associated with a prospectus. Additionally, as the capital raising does not constitute a listing, there are no ongoing disclosure or compliance requirements, beyond company law requirements, nor are there specified governance requirements typically associated with being a public listed company.
Fewer required advisors: The platform effectively removes several actors present in public equity markets such as the advisor that assists with regulatory compliance etc. by performing some of the functions themselves, and adopting a more ‘buyer-beware’ approach. The platform provides ‘admission standards’ (usually tied simply to initial disclosure requirements such as the business plan and the financial forecasts), and user-friendly, easy-to-understand guidelines for the information that needs to be submitted. Generally, the platform does not require the company to utilise specified or authorised advisors to prepare these documents. In some models, the platform provider vets both the business and the application documents, performing the role of the sponsor or Nominated Advisor (NOMAD, in the language of the Alternative Investment Market (AIM)).
Use of technology to enhance ‘reach’ and engagement: Using technology, the platform provides a network which the company uses to reach investors ‘directly’. The platform therefore replaces the ‘bookbuilder’ in a traditional equity financing deal. Additionally, as investors of all sizes are registered with, and therefore reached
73%
8%
8%
8%
2%1%
Lending Donation Reward Equity Hybrid Royalty
37
through, the network, there are no costs associated with targeting more investors and no specific benefit in targeting larger investors. For example, in the fundraise referred to above where the company raised £8m, the average investment amount was £1,824. The platform may also provide a mechanism for companies and prospective (and current) investors to engage, both initially to sell the proposition, and deal with any investor questions on an ongoing basis. The direct nature of the engagement has the potential additional intangible benefit for the company of building a relationship with the investor that extends beyond just investment33 and may enhance the liquidity in the shares. Because of the use of technology, crowdfunding manages to generate more information than forms of early stage equity funding, and hence allows the gathering of funds at a lower cost (Agrawal et al, 2013). Moreover, equity crowdfunding is not geographically bound, and can attract investors from potentially everywhere in the world (Agrawal et al., 2013).
Application in equity markets: Many equity markets already make provision for compliance with less onerous disclosure standards and governance standards (see Box 1 above). Typically, however, this is framed with reference to the mainboard listings requirements and within the traditional ecosystem model of intermediaries that stand between the issuer and the exchange, and the exchange and the investor. Some newer exchanges have sought to address costs by removing intermediaries (or performing the intermediary function themselves e.g. Nx’change – see Box 2 below – and Scotex).34 One of the difficulties for equities exchanges and regulators, however, in simply removing intermediaries (particularly sponsors or others who assist with compliance), is that they are regarded as integral to ensuring compliance with the regulatory and supervisory framework that companies and investors associate with public listed companies. Equity crowdfunding is still too young to effectively demonstrate that self-policing by companies is sufficient to provide the requisite level of investor protection. Nonetheless, it is worth following closely.
Other opportunities reside in the network effects that technology can create. Some exchanges are exploring the possibility of partnering with crowdfunding platforms to ‘crowdsource’ retail participation into IPOs (e.g. Syndicate Room and the London Stock Exchange35). Others are introducing their own pre-IPO platforms (such as the Deutsche Borse Venture Network, see Box 3), providing a secondary market for crowdfunded shares (KRX Startup Market) or offering an aggregation platform for crowdfunding initiatives (Taipei Exchange Gofunding Zone: http://gofunding.tpex.org.tw/index.php?l=en-us&d=&t=0). At least one exchange has introduced a platform to enable investors to engage directly with the management of listed companies, and the exchange assists in ensuring that companies are responsive.36
33 Anecdotally, it would seem to be this element that led a European Commission economist to declare that when investing in listed equity, he was listing in a ’portfolio’ but when he was investing via crowdfunding, he was investing in the specific company. 34 The newly announced exchange has said, given the absence of well-established financial intermediaries in Scotland, it will assist prospective issuers in “producing the prospectus, arranging roadshows and bookbuilding etc.” Note however that Scotex is not targeting SMEs. http://scotex.uk/ 35 https://www.syndicateroom.com/in-the-news/syndicateroom-brings-crowdfunders-to-ipo-market 36 See the WFE report on SME Exchanges for more information about the Chinext offering
38
Box 2: Nx’change: https://www.nxchange.com/
Description of offering: Nx’change is both a regulated market and a regulated investment adviser under MiFID, licensed by the Dutch Financial Market Authority. It describes itself as a “decentralised” exchange “using the power of the Internet, social networks and ongoing technological developments… to decentralise the means of investment…to make a strong contribution to the way companies raise capital.”
Target audience: There is no minimum issue amount though given the costs associated with listing, issuers are given a guidance of €1 million; private companies wishing to create a secondary market in their shares, cooperatives with limited ownership, retail investors.
Investment size: No minimum investment size.
Value proposition:
Lower cost of capital for companies due to fewer intermediaries;
Opportunity for companies to engage directly with investors and vice versa;
Use of crowdsourced research and analysis to ensure coverage of the company;
24/7 trading and real-time settlement.
Facts and figures:
One listed company as at November 2016 (depository receipts).
.
Box 3: Deutsche Borse Venture Network: http://www.venture-network.com/dbvn-en/
Description of offering: Multi-faceted, pre-IPO finance platform targeting investors and ‘high-growth’ companies. Minimum entry criteria with tiered access to additional services.
Target audience: Institutional investors, family offices and HNWIs; high-growth companies.
Investment size: Between €5-15 million
Value proposition:
Investment matching of participating companies and investors;
Offers executive training to participating companies;
Uses standardised templates;
Companies that meet additional criteria can access the technology platform for interaction with investors.
Facts and figures: As at June 2016:
80 growth companies and 157 international investors part of the network;
US$733 million raised.
6.2 DATA-ANALYTICS AND AUTOMATION The advent of enhanced data processing capability associated with sophisticated data analytics provides several opportunities to alter the economics for SMEs and equity markets, both by automating currently manual processes (thereby enabling greater economies of
39
scale), and by potentially changing certain processes and models entirely. We look at two examples, in research and analysis, and in regulatory compliance, below:
Research and analysis: A firm’s ability to provide research coverage of listed companies is constrained by the number of research analysts that it employs, and the relative costs and benefits of covering one firm vs another. The result is smaller firms tend to receive much less coverage than larger firms (and - some argue - this situation has worsened, and is likely to deteriorate further, given changes to market structure 37 and regulatory changes e.g. unbundling of fees). Assuming, however, that company information is available electronically and analysis is automated, then the generation of additional research becomes incremental (a function of processing power) rather than linear. While much attention has been given to so-called robo-advisers (which tend to focus on portfolio construction) the team has discovered at least one firm that utilises data analytics tools to produce fundamental equity research (see Box 4).
Box 4: CapitalCube: http://www.analytixinsight.com/?page_id=2700
Description of offering: Wholly-owned subsidiary of ’big data’ analytics firm, AnalytixInsight. Purports to provide (amongst other offerings) company analysis on over 45,000 global equities. While it is not an SME-focused offering, given its extensive coverage, many smaller companies are included.38
Target audience: Investors (retail and institutional), information providers, finance portals and media.
Business model:
By using algorithms (instead of human researchers/analysts) to analyse published company financial information, it reduces the unit cost of generating company analysis and research reports.
Provides free access to certain limited information;
Offers tiered, subscription-based pricing depending on the extent of services utilised.
Other: The company recently announced a deal with the Tel-Aviv stock exchange39 whereby the exchange makes its financial ratio information available via its website. The company also has a partnership with the London Stock Exchange (the research is apparently embedded in the exchange’s ProQuote offering).
Regulatory compliance: data analytics capability and automation also provide opportunities for assessing regulatory compliance. Data analytics tools are already used in trading markets for surveillance purposes (e.g. to assess irregular trading patterns) and there are many
37 Weild, D., Kim, E, and Newport, L (2013), ;Making Stock Markets Work to Support Economic Growth: Implications for Governments, Regulators, Stock Exchanges, Corporate Issuers and their Investors;, OECD Corporate Governance Working Papers, No. 10, OECD Publishing, Paris. url: http://dx.doi.org/10.1787/5k43m4p6ccs3-en 38 While the CapitalCube coverage purports to be comprehensive, we have feedback that it is not in fact comprehensive for all markets and that e.g. in South Africa it covers only the largest 100 companies listed on the exchange. 39 See the TASE website for an example of the output: http://www.tase.co.il/Eng/General/Company/Pages/companyCapitalCubeData.aspx?companyID=001457&shareID=01115997&subDataType=1
40
automation tools (such as accounting packages) that reduce the manual burden of preparing information in compliance with listings requirements. Exchanges or relevant intermediaries can also use data analytics tools to assess the extent to which regulatory documents comply with the relevant requirements. Automating this process of regulatory assessment reduces the costs associated with providing this service.
Perhaps the greater opportunity, however, is in using ‘big data’ to come up with new regulatory models (if one thinks of regulatory models as mechanisms for allowing assessments of risk). Some of the innovation in this space has come from non-traditional finance providers such as cell-phone companies (e.g. M-Shwari40) and online retailers (e.g. Alibaba)41 who utilise data generated from mobile money transactions and online purchases to assess credit-worthiness. This not only changes the economics of lending decisions (making small-amount lending more economically viable) but also alters the basis on which lending decisions are taken, potentially expanding the list of those who can access debt finance. There should be similar opportunities in the equity realm.
6.3 DISTRIBUTED LEDGER TECHNOLOGY No discussion of financial technology would be complete without a reference to blockchain or distributed ledger technology. Capital market actors appear to be focusing on the potential efficiency gains of blockchain for securities issuance, clearing and settlement, and corporate actions as well as potential deployment for crowdfunding solutions.42 To the extent that there are market-wide deployments that serve to reduce the costs associated with these activities, all market-users (including SMEs) should benefit. The KRX Startup Market referred to in Chapter 6.1 uses blockchain technology to “provide document and authentication services” while Scotex (also referred to above) has stated that as it will use distributed ledger technology to remove the costs associated with post-trade clearing and settlement. Finally, Funderbeam, a crowdfunding platform uses blockchain technology to provide a primary and secondary market for crowdfunded investments.43
Distributed ledger technologies also have broader financial inclusion potential (e.g. through reducing the costs associated with meeting know-your-client and anti-money-laundering provisions) and reducing the information gap (e.g. through more effective retention and availability of company information). This could serve to enhance financing of SMEs more broadly.
7 CONCLUSION
This research aims to contribute to exchange and policy-maker understanding of what can be
done to enhance SME access to equity market financing within the more traditional, existing
exchange framework and within the context of an evolving financing landscape. We believe
the research conclusions and resultant recommendations are globally relevant and applicable
40 http://cbagroup.com/m-shwari/ 41 http://qz.com/436889/alibabas-customers-can-now-get-a-loan-based-on-their-online-shopping-history/ 42 See the WFE IOSCO AMCC DLT report on this topic: http://www.world-exchanges.org/home/index.php/files/18/StudiesReports/349/WFEIOSCO0AMCCDLTreport.pdf 43 http://nordic.businessinsider.com/funderbeam-uses-blockchain-technology-to-operate-a-stock-exchange-for-startups--so-you-can-invest-and-trade-in-growth-companies-and-cash-out-whenever-you-want-2016-12/
http://www.world-exchanges.org/home/index.php/files/18/StudiesReports/349/WFEIOSCO0AMCCDLTreport.pdf

41
across jurisdictions. The WFE will seek to collect more responses to the survey over time,
thereby enhancing the breadth and scope of the possible analysis and associated
recommendations. The WFE will also conduct research into other aspects of SME use of
capital markets to build out the knowledge base in this area.
We are confident the issue of SME financing (and SME development) will remain a priority for
exchanges, policy-makers and others for years to come. While public capital markets as we
understand them today are unlikely to be suitable for all SMEs, we expect to see exchanges
focus increasingly on supporting the SME ecosystem more broadly, thereby promoting overall
growth and diversity of the economy.
42
References
Agrawal, A., Catalini, C. & Goldfarb, A., 2013. ‘Some Simple Economics of Crowdfunding’, NBER Chapters, in: Innovation Policy and the Economy, Volume 14, pages 63-97 National Bureau of Economic Research, Inc.
Amihud, Y., Mendelson, H. and Pedersen, L.H. Liquidity and Asset Prices, Foundations and Trends in Finance Vol. 1, No 4 (2005) 269–364.
Baldock, R. & Mason, C., 2015. ‘Establishing a new UK finance escalator for innovative SMEs: the roles of the Enterprise Capital Funds and Angel Co-Investment Fund’, Venture Capital, Taylor & Francis Journals, vol. 17(1-2), pages 59-86, April.
Beck, T. & Demirgüç-Kunt, A. & Maksimovic, V., 2008. ‘Financing patterns around the world: Are small firms different?’, Journal of Financial Economics, Elsevier, vol. 89(3), pages 467-487, September.
Berger, A. N. & Udell, F. G., 1998. ‘The economics of small business finance: The roles of private equity and debt markets in the financial growth cycle’, Journal of Banking & Finance, Elsevier, vol. 22(6-8), pages 613-673, August.
Bock, C. & Schmidt, M., 2015. ‘Should I stay, or should I go? – How fund dynamics influence venture capital exit decisions’, Review of Financial Economics, Elsevier, vol. 27(C), pages 68-82.
Carbó-Valverde, S. & Rodríguez-Fernández, F. & Udell, G. F., 2009. ‘Bank Market Power and SME Financing Constraints’, Review of Finance, European Finance Association, vol. 13(2), pages 309-340.
Casey, E. & O'Toole, C. M., 2014. ‘Bank lending constraints, trade credit and alternative financing during the financial crisis: Evidence from European SMEs’, Journal of Corporate Finance, Elsevier, vol. 27(C), pages 173-193.
Chordia, T. & Sarkar, A. & Subrahmanyam, A., 2005. "The joint dynamics of liquidity, returns, and volatility across small and large firms’, Staff Reports 207, Federal Reserve Bank of New York.
Currie, D. & Newitt, J., 2014. ‘Capital markets for growing companies. A review of the European listings regime’, TheCityUK Report.
Degryse, H. & Goeij, P. & Kappert, P., 2012. ‘The impact of firm and industry characteristics on small firms’ capital structure’, Small Business Economics, Springer, vol. 38(4), pages 431-447, May.
Ellul, A. & Pagano, M., 2006. ‘IPO Underpricing and After-Market Liquidity’, Review of Financial Studies, Society for Financial Studies, vol. 19(2), pages 381-421.
European Bank of Reconstruction and Development, 2016. ‘Why small business matter’, url: http://www.ebrd.com/what-we-do/sectors-and-topics/why-small-businesses-matter.html
European Commission, 2015, url: http://ec.europa.eu/DocsRoom/documents/16341/attachments/2/translations/en/renditions/native
European Commission, 2015. ‘Action Plan on Building a Capital Markets Union’, url:
http://ec.europa.eu/finance/capital-markets-union/docs/building-cmu-action-plan_en.pdf
43
International Chamber of Commerce, 2016. ‘TradeMatters’ url:
http://tradematters.iccwbo.org/smes-small-business.html
International Finance Corporation, 2014. ‘Micro, Small and Medium Enterprise Country Indicators’, url: http://www.ifc.org/wps/wcm/connect/Industry_EXT_Content/IFC_External_Corporate_Site/Industries/Financial+Markets/msme+finance/sme+banking/msme-countryindicators
Gonzales, E. & Hommes, M. & Mirmulstein, M. L., 2014. ‘MSME Country Indicators 2014:
Towards a Better Understanding of Micro, Small, and Medium Enterprises’, International
Finance Corporation, World Bank
IOSCO (The Growth and Emerging Markets Committee), 2015. ‘SME Financing Through Capital Markets’, url: https://www.iosco.org/library/pubdocs/pdf/IOSCOPD493.pdf
Jõeveer, K., 2013. ‘What do we know about the capital structure of small firms?’, Small Business Economics, Springer, vol. 41(2), pages 479-501, August.
Massolution, 2015. ‘Crowdfunding Industry Report’, technical report.
Mason, C. (2011). ‘Trends in IPO Listings by SMEs in the EU. Discussion Paper.’ City of London.
Moritz, A. & Block, J. & Heinz, A., 2016. ‘Financing patterns of European SMEs: an empirical taxonomy’. Venture Capital, Taylor & Francis Journals, vol. 18 (2), pages 115-148, January.
Nassr, I. K. & Wehinger, G.2015. ‘Opportunities and limitations of public equity markets for SMEs’, OECD Journal: Financial Market Trends, OECD Publishing, vol. 2015(1), pages 49-84.
OECD, 2015. ‘Opportunities and constraints of market based financing for SMEs’, OECD report to G20 Finance Ministers and Central Bank Governors
OECD, 2016. ‘Financing SMEs and Entrepreneurs 2016: An OECD Scorecard’, OECD Publishing, Paris. url: http://dx.doi.org/10.1787/fin_sme_ent-2016-en, page. 27.
Pagano, M. & Panetta, F. & Zingales, L., 1998. ‘Why Do Companies Go Public? An Empirical Analysis’, Journal of Finance, American Finance Association, vol. 53(1), pages 27-64, 02.
Posser, D., 2016. ‘Crowdcube Pulls Off UK's Largest Ever Equity Crowdfundraising’, Forbes, August 17th 2016.
Stiglitz, J. E. & Weiss, A., 1981. ‘Credit Rationing in Markets with Imperfect Information,’ American Economic Review, American Economic Association, vol. 71(3), pages 393-410, June.
Syndicateroom, 2016. ‘SyndicateRoom brings crowdfunders to IPO market’, url: https://www.syndicateroom.com/in-the-news/syndicateroom-brings-crowdfunders-to-ipo-market
TMX, 2016. `Advancing innovation roundtable takes shape’, url: https://www.tmx.com/newsroom/press-releases?id=496
US Small Business Administration, 2016. url: https://www.sba.gov/managing-business/running-business/energy-efficiency/sustainable-business-practices/small-business-trends
Weild, D. & Kim, E. & Newport, L., 2013. ‘Making Stock Markets Work to Support Economic Growth: Implications for Governments, Regulators, Stock Exchanges, Corporate Issuers and their Investors’, OECD Corporate Governance Working Papers 10, OECD Publishing.

44
WFE and IOSCO, 2016. ‘Financial Market Infrastructures and Distributed Ledger Technology’. url: http://www.world-exchanges.org/home/index.php/files/18/StudiesReports/349/WFEIOSCO0AMCCDLTreport.pdf
WFE, 2016. ‘Report on SME Exchanges’. url: http://www.world-exchanges.org/home/index.php/files/18/Studies-Reports/310/WFEReportonSMEExchanges.pdf
Wuyts, G. 2007. ‘Stock Market Liquidity. Determinants and Implications’, Review of Business and Economic Literature, KU Leuven, Faculty of Economics and Business, vol. 0(2), pages 279-316.
http://www.world-exchanges.org/home/index.php/files/18/StudiesReports/349/WFEIOSCO0AMCCDLTreport.pdf

45
8 APPENDIX 1: MEMBERS OF THE ADVISORY GROUP
The WFE would like to thank the members of the Advisory Group for their time and input.
While the WFE team relied heavily on their knowledge and guidance, the final report should
not be construed as representing the views of their specific organisations.
Name of individual Association Country
Luke Ombara Capital Markets Authority Kenya
Etienne Cunin Jennifer D’Hoir
Autorité des Marchés Financiers France
Alvaro Meléndez Martínez Jose Loyola Trujillo
Comisión Nacional Bancaria y de Valores Mexico
Wainwright Iton Patrick Watson Chemika Ellis
Trinidad and Tobago Securities and Exchange Commission
Trinidad and Tobago
Cuthbert Chanetsa Elmarie Hamman
Financial Services Board South Africa
Nick Thadaney TMX Group Canada
Robin Jezek Euronext Europe
Anton Govor Maria Kharlashkina
Moscow Exchange Russia
Intan Ruhanida Ramli Surina Jaafar
Bursa Malaysia Malaysia
9 APPENDIX 2: INDIVIDUALS INTERVIEWED FOR THE REPORT AND
TECHNICAL INPUT PROVIDERS
Interviewees
Name of individual Association Country
Trevor Chandler Independent consultant, Association of Savings and Investment, South Africa (ASISA)
South Africa
Patrick Birley CEO, ICAP Securities and Derivatives Exchange United Kingdom
Colin Mason University of Glasgow United Kingdom
Marian Gaylard Questco Corporate Advisory South Africa
Delphine Currie Joseph Newitt
King & Wood Mallesons United Kingdom
David Weild IV Weild & Co United States
John McCoach Formerly of TMX Group Canada
Goban Arasu Formerly of Bursa Malaysia Malaysia
Technical input provider – survey design
Vilma Agalioti-Sgompou
Data Manager, Centre for Longitudinal Studies, Institute of Education, University College of London
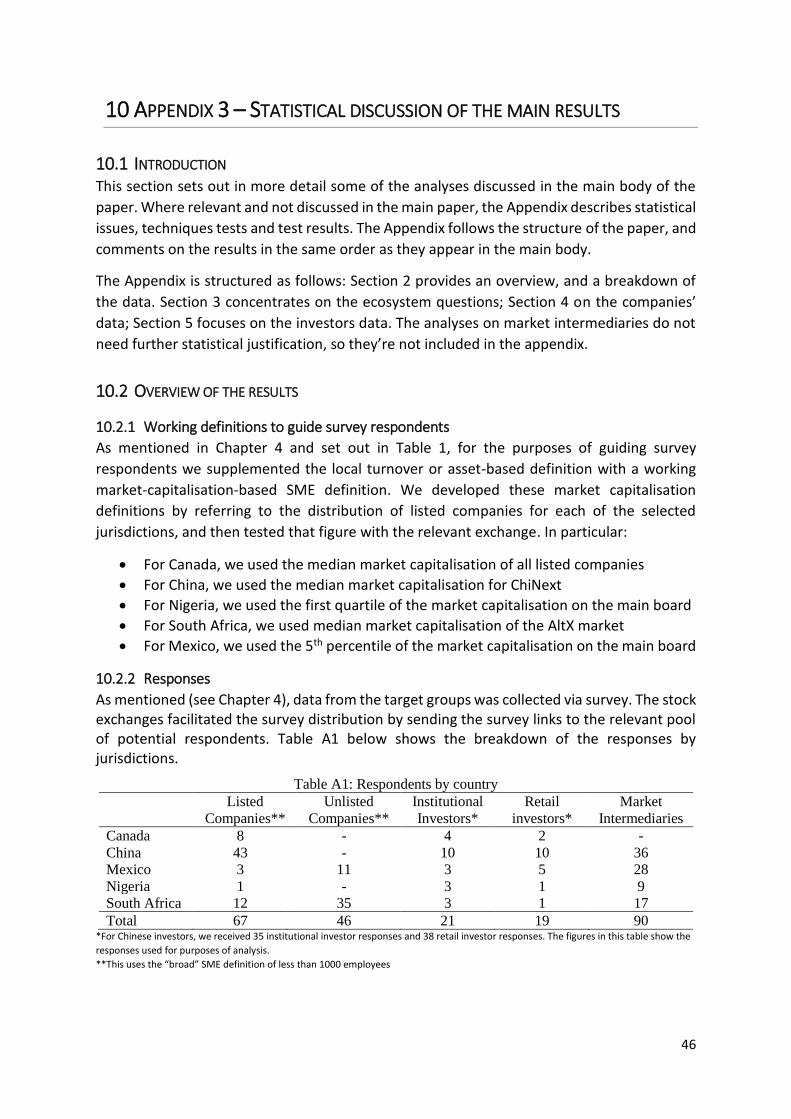
46
10 APPENDIX 3 – STATISTICAL DISCUSSION OF THE MAIN RESULTS
10.1 INTRODUCTION This section sets out in more detail some of the analyses discussed in the main body of the
paper. Where relevant and not discussed in the main paper, the Appendix describes statistical
issues, techniques tests and test results. The Appendix follows the structure of the paper, and
comments on the results in the same order as they appear in the main body.
The Appendix is structured as follows: Section 2 provides an overview, and a breakdown of
the data. Section 3 concentrates on the ecosystem questions; Section 4 on the companies’
data; Section 5 focuses on the investors data. The analyses on market intermediaries do not
need further statistical justification, so they’re not included in the appendix.
10.2 OVERVIEW OF THE RESULTS
10.2.1 Working definitions to guide survey respondents
As mentioned in Chapter 4 and set out in Table 1, for the purposes of guiding survey
respondents we supplemented the local turnover or asset-based definition with a working
market-capitalisation-based SME definition. We developed these market capitalisation
definitions by referring to the distribution of listed companies for each of the selected
jurisdictions, and then tested that figure with the relevant exchange. In particular:
For Canada, we used the median market capitalisation of all listed companies
For China, we used the median market capitalisation for ChiNext
For Nigeria, we used the first quartile of the market capitalisation on the main board
For South Africa, we used median market capitalisation of the AltX market
For Mexico, we used the 5th percentile of the market capitalisation on the main board
10.2.2 Responses
As mentioned (see Chapter 4), data from the target groups was collected via survey. The stock exchanges facilitated the survey distribution by sending the survey links to the relevant pool of potential respondents. Table A1 below shows the breakdown of the responses by jurisdictions.
Table A1: Respondents by country
Listed
Companies**
Unlisted
Companies**
Institutional
Investors*
Retail
investors*
Market
Intermediaries
Canada 8 - 4 2 -
China 43 - 10 10 36
Mexico 3 11 3 5 28
Nigeria 1 - 3 1 9
South Africa 12 35 3 1 17
Total 67 46 21 19 90 *For Chinese investors, we received 35 institutional investor responses and 38 retail investor responses. The figures in this table show the
responses used for purposes of analysis.
**This uses the “broad” SME definition of less than 1000 employees

47
As we can see, the responses varied across jurisdictions, and the proportions in the sample
do not necessarily reflect the proportions present in the target populations. We tackled this
problem in several ways, set out in more detail below.
10.2.3 Listed companies – statistical issues
Although our sample size looks small, our reference population is small as well, and amounts
to almost 2000 units. Our ‘< 1000 employees’ sample is roughly 3.5% of the population of
listed SMEs in the jurisdictions, and we are confident that the sample size does not represent
a large problem in terms of representativeness.
However, at a cluster level, some jurisdictions are under-represented, while others are over-
represented. Canada, for example, has the lion’s share of the population, but the sample of
Canadian companies is the second smallest among those collected. Chinese companies, on
the other hand, are over-represented. To perform our analyses, we constructed sampling
weights, in the form of:
(5)
𝑁𝑗
∑ 𝑁𝑗
𝑛𝑗
∑ 𝑛𝑗
Where j are the clusters, Nj are the population sizes for each cluster, and nj are the sample
sizes for each cluster. The sampling weights are displayed in table A2 below:
Table A2: Sampling weights
Country Weight
Employees <500
Weight
Employees <1,000
Canada 3.42 6.37
China 0.30 0.20
Mexico 0.67 0.83
Nigeria 0.99 1.84
South Africa 0.16 0.25
All analyses on listed companies displayed either in the main paper or in this Appendix
implement the sample weights.
10.2.4 Comparison between listed and unlisted companies: statistical issues
As we mentioned in the main body of the report, the sample of companies is a stratified
clustered sample, where the clusters are identified by the countries, whilst two strata are
identified by being listed or unlisted. Lack of information on the population of unlisted
companies does not allow us to construct proper sampling weights.
To limit this problem in the multivariate regressions below, we control for country fixed
effects, and cluster the standard errors by sector. When not possible, we cluster the standard
errors by country.

48
10.2.5 Investors data: Statistical issues
Unfortunately, we are not in possess of population values for the investor universe.
Consequently, we cannot construct sampling weights for the investors’ analyses.
As Chinese observations represent the lion’s share of our responses in this category, we
construct our sample by keeping all non-Chinese observations, using 10 randomly selected
Chinese institutional investors and 10 randomly selected Chinese retail brokers. We end up
with a sample of 40 observations overall, from which we draw the conclusions below,
mentioning where statistical tests might not have enough power.
10.3 ECOSYSTEM QUESTIONS This section provides more detail on the cross-category comparisons on the ecosystem
questions. Data are unweighted as we believe that we obtained a satisfactory balance across
jurisdictions.44
To check whether the assessment of the ecosystem levers differs across categories, we ran
ANOVA analyses by means of OLS regressions. The model is the following:
(1) 𝐸[𝐸𝑐𝑜𝑠𝑦𝑠𝑡𝑒𝑚𝑖𝑘|𝑋] = 𝛼𝑖0 + ∑ 𝛼𝑖𝑗𝐶𝑎𝑡𝑒𝑔𝑜𝑟𝑦𝑗𝑘
4
𝑗=1
Where i identifies the ecosystem variable, j identifies the category and k identifies the
observation. α0 is the coefficient of our reference category, institutional investors. In the
table, F-tests give information about the presence of relevant differences across categories
overall, whilst the t-tests describe whether the single categories statistically differ from the
baseline one. Table A3 contains the ANOVA results. These are the same results displayed in
Table 2 in the main body, but with more statistical detail. We note that, given the nature of
the dependent variable (discrete ordinal variable), other techniques might be more suitable
than ANOVA (Fisher exact statistic, ordered logistic regression), but we believe that ANOVA
models are the most powerful in terms of presentation of the results.45
We expand on the main results as follows:
“A well-established regulatory and supervisory framework for the SME exchange”: t-tests show that
market intermediaries, retail investors and listed companies consider this lever statistically more
important than institutional investors.
“A mechanism supporting SMEs to prepare disclosure documents”: in the main text we comment on
how the different categories do not statistically differ in their assessment of this lever. The F test result
supports this statement (p-value of the F-test: 0.73).
“A mechanism enhancing liquidity of SME stocks (e.g., a market-maker requirement): in the main
text we note that unlisted companies consider this lever to be significantly less important than
institutional investors. This statement is supported by the corresponding t-test.
44 Chinese data include only 10 randomly selected companies for each category. See 11.2.5. 45 Ordered logistic regressions provide overall comparable results.

49
“Research and analysis on SME capital markets activity”: in the main text we comment on how
unlisted companies consider this lever significantly less important than institutional investors. This
statement is supported by the corresponding t-test.
“Tax incentives for investors in the main text we comment on how the different categories do not
statistically differ in their assessment of this lever. The F-tests result supports this statement (p-value
of the F-test: 0.18).
“Tax incentives for issuers”: in the main text we comment on how listed companies consider this lever
significantly more important than institutional investors. This statement is supported by the
corresponding t-test.
“Simplified disclosure requirements”: in the main text we note that listed and unlisted companies
consider this lever significantly more important than institutional investors. This statement is
supported by the corresponding t-tests.

50
Table A3: Regression analyses. Dependent variables: ecosystem questions.
(1) (2) (3) (4) (5) (6) (7)
A well-
established
regulatory and
supervisory
framework for
the SME
exchange
A mechanism
supporting
SMEs to
prepare
disclosure
documents
Financial
education for
SMEs
Financial
education for
investors
Simplified
listing
procedures
A mechanism
enhancing
liquidity of
SME stocks
(e.g., a market-
maker
requirement,
Research and
analysis on
SME capital
markets activity
Retail Investor 0.37500* -0.20066 -0.04276 0.20139 0.12500 -0.03472 -0.22917
(1.655) (-0.843) (-0.198) (0.761) (0.518) (-0.154) (-1.003)
Listed Company 0.29231* -0.15547 -0.02834 0.32735 0.12308 -0.20684 -0.28974
(1.664) (-0.850) (-0.171) (1.597) (0.663) (-1.185) (-1.635)
Unlisted Company 0.02439 0.00513 -0.44673** 0.07182 0.56098*** -0.44173** -0.55691***
(0.131) (0.026) (-2.527) (0.330) (2.840) (-2.384) (-2.961)
Market Intermediary 0.46988*** -0.07039 0.03932 0.34070* 0.21687 -0.00535 -0.31124*
(2.740) (-0.394) (0.243) (1.702) (1.198) (-0.031) (-1.799)
Baseline: Instit.
Investor
3.00000*** 3.26316*** 3.10526*** 2.61111*** 3.00000*** 3.22222*** 3.16667***
(19.296) (20.270) (21.253) (14.392) (18.371) (20.857) (20.196)
Observations 223 224 224 223 224 223 223
F 4.14144 0.52034 4.32219 1.49218 3.17225 3.52069 2.45293 The variables are the responses to the question: “Please indicate how critical you think the following are for creating a successful listings environment for SMEs (one in which companies are encouraged to list and raise capital).” All respondents were asked to rate the relevance of the levers on a scale from 1 to 4, where 1 is “Not at all relevant”, 2 is “Somewhat relevant”, 3 is “Relevant” and 4 is “Very relevant”. t statistics in parentheses. * p < 0.1, ** p < 0.05, *** p < 0.01

51
Table A3 (continued): Regression analyses. Dependent variables: ecosystem questions.
(8) (9) (10) (11) (12) (13) (14) (15)
Tax incentives
for investors
Tax incentives
for issuers
Raising funds
speedily for
SMEs
Quality,
affordable
advisory
services
Low cost of
listing &
maintenance for
SMEs
Simplified
disclosure
requirements
More retail
investors
More
institutional
investors
Retail Investor 0.04861 0.28618 0.44079** -0.09028 0.36111 0.31944 0.38816 0.10417
(0.194) (1.255) (2.003) (-0.374) (1.427) (1.226) (1.342) (0.430)
Listed Company 0.15726 0.48907*** 0.48502*** 0.25299 0.31111 0.58291*** -0.05992 0.10513
(0.809) (2.791) (2.867) (1.350) (1.586) (2.886) (-0.270) (0.560)
Unlisted Company 0.03794 0.27856 0.41335** 0.39295** 0.35501* 0.83469*** 0.16560 -0.15041
(0.184) (1.494) (2.296) (1.976) (1.705) (3.893) (0.700) (-0.754)
Market Intermediary -0.14190 0.29296* 0.52061*** 0.14993 0.24364 0.27577 -0.05010 0.25100
(-0.748) (1.714) (3.156) (0.820) (1.272) (1.399) (-0.231) (1.369)
Institutional Investor 2.88889*** 2.52632*** 2.68421*** 2.77778*** 2.88889*** 2.55556*** 2.73684*** 2.83333***
(16.799) (16.388) (18.040) (16.755) (16.639) (14.299) (13.996) (17.041)
Observations 223 224 224 223 223 223 224 223
F 1.58412 2.18815 2.60221 2.01124 0.87888 5.93624 1.33073 2.33217 The variables are the responses to the question: “Please indicate how critical you think the following are for creating a successful listings environment for SMEs (one in which companies are encouraged to list and raise capital).” All respondents were asked to rate the relevance of the levers on a scale from 1 to 4, where 1 is “Not at all relevant”, 2 is “Somewhat relevant”, 3 is “Relevant” and 4 is “Very relevant”. t statistics in parentheses. * p < 0.1, ** p < 0.05, *** p < 0

52
10.4 COMPANIES DATA
10.4.1 Descriptive statistics
Table A4 provides an overview description of the surveyed companies.
Table A4: Descriptive statistics
Less than 1,000
employees
Less than 500
employees
Less than 250
employees
Mean Mean Mean
Turnover, USD 48,705,548 31,308,080 25,222,375
Turnover, PPP 32,041,247 23,925,851 22,181,045
Number of employees 330.62 159.69 105.40
Years from establishment 18.69 19.03 19.28
From Canada 0.08 0.11 0.14
From China 0.37 0.19 0.05
From Mexico 0.12 0.11 0.10
From Nigeria 0.01 0.01 0.02
From South Africa 0.42 0.57 0.70
Listed company 0.59 0.46 0.36
Observations 113 80 63
As expected, Figure A1 below shows a positive relationship between turnover and number of
employees, and a positive relationship between size (as defined as a combination of turnover
and number of employees) and the fact of being listed.
Figure A1: Relation between Turnover in USD dollars, number of employees and being listed
Nu
mb
er o
f Em
plo
yee
s
Turnover
Company size Companies with less than 1000 employees
Unlisted Companies Listed Companies Trendline
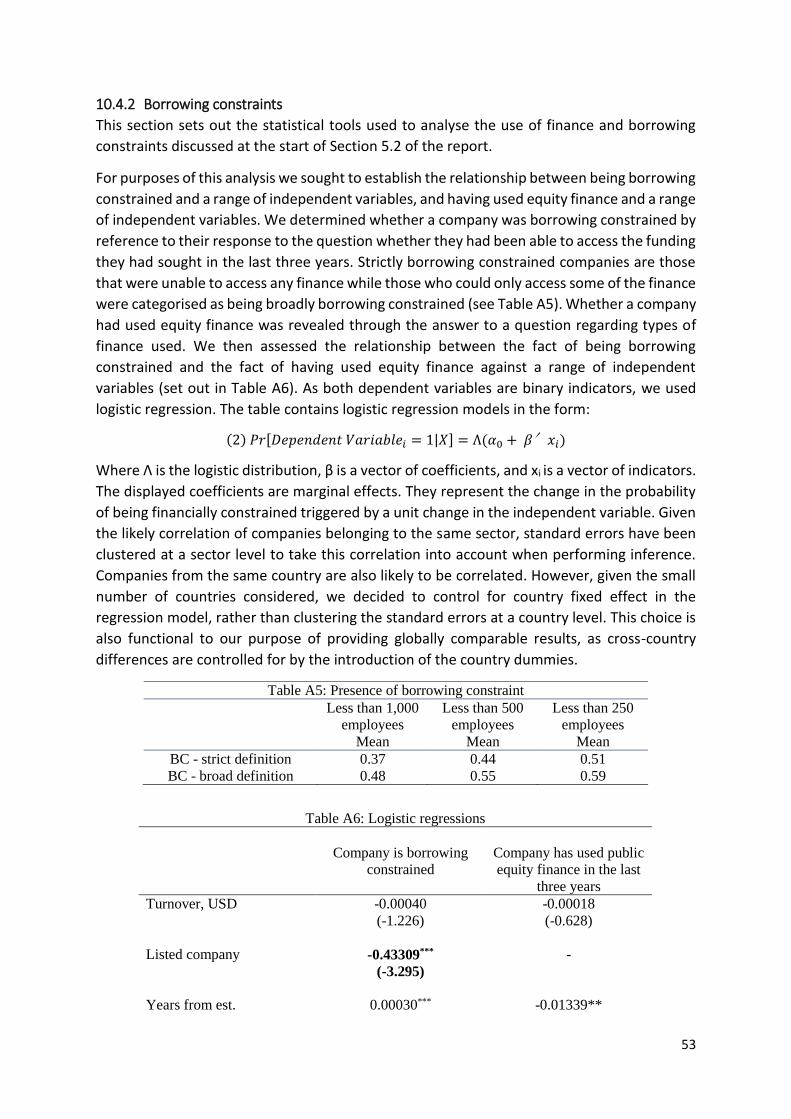
53
10.4.2 Borrowing constraints
This section sets out the statistical tools used to analyse the use of finance and borrowing
constraints discussed at the start of Section 5.2 of the report.
For purposes of this analysis we sought to establish the relationship between being borrowing
constrained and a range of independent variables, and having used equity finance and a range
of independent variables. We determined whether a company was borrowing constrained by
reference to their response to the question whether they had been able to access the funding
they had sought in the last three years. Strictly borrowing constrained companies are those
that were unable to access any finance while those who could only access some of the finance
were categorised as being broadly borrowing constrained (see Table A5). Whether a company
had used equity finance was revealed through the answer to a question regarding types of
finance used. We then assessed the relationship between the fact of being borrowing
constrained and the fact of having used equity finance against a range of independent
variables (set out in Table A6). As both dependent variables are binary indicators, we used
logistic regression. The table contains logistic regression models in the form:
(2) 𝑃𝑟[𝐷𝑒𝑝𝑒𝑛𝑑𝑒𝑛𝑡 𝑉𝑎𝑟𝑖𝑎𝑏𝑙𝑒𝑖 = 1|𝑋] = Λ(𝛼0 + 𝛽′𝑥𝑖)
Where Λ is the logistic distribution, β is a vector of coefficients, and xi is a vector of indicators.
The displayed coefficients are marginal effects. They represent the change in the probability
of being financially constrained triggered by a unit change in the independent variable. Given
the likely correlation of companies belonging to the same sector, standard errors have been
clustered at a sector level to take this correlation into account when performing inference.
Companies from the same country are also likely to be correlated. However, given the small
number of countries considered, we decided to control for country fixed effect in the
regression model, rather than clustering the standard errors at a country level. This choice is
also functional to our purpose of providing globally comparable results, as cross-country
differences are controlled for by the introduction of the country dummies.
Table A5: Presence of borrowing constraint
Less than 1,000
employees
Less than 500
employees
Less than 250
employees
Mean Mean Mean
BC - strict definition 0.37 0.44 0.51
BC - broad definition 0.48 0.55 0.59
Table A6: Logistic regressions
Company is borrowing
constrained
Company has used public
equity finance in the last
three years
Turnover, USD -0.00040 -0.00018
(-1.226) (-0.628)
Listed company -0.43309*** -
(-3.295)
Years from est. 0.00030*** -0.01339**
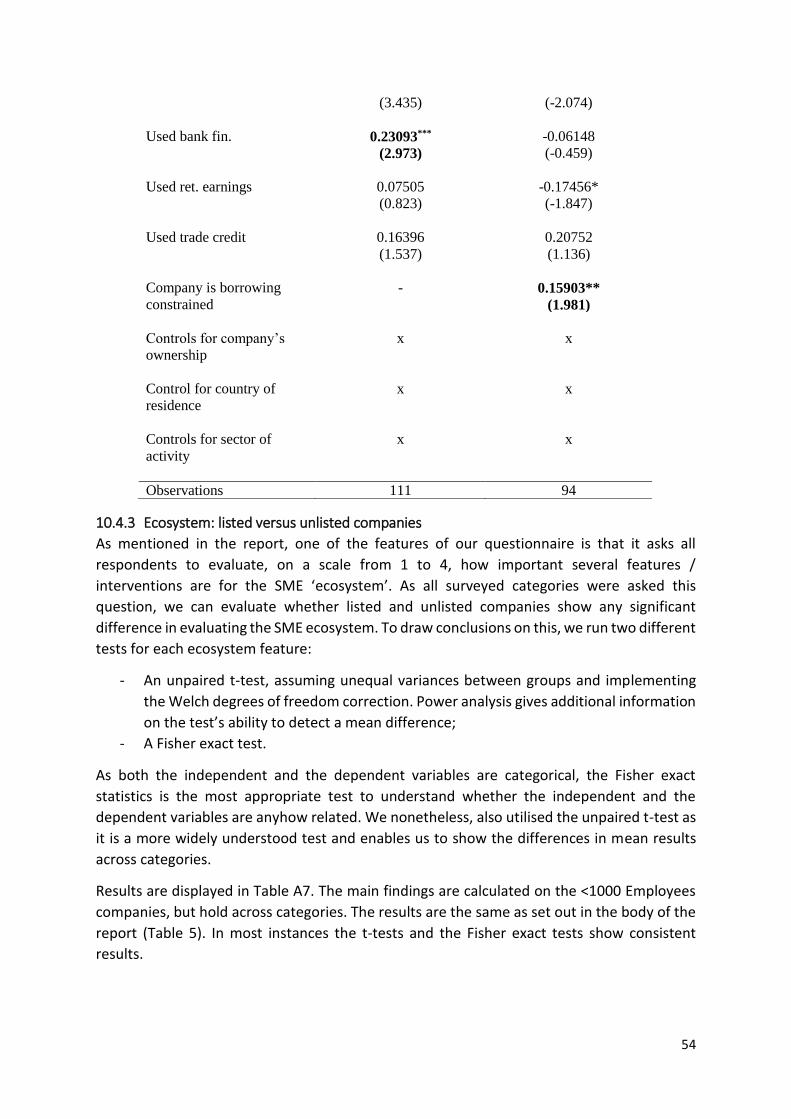
54
10.4.3 Ecosystem: listed versus unlisted companies
As mentioned in the report, one of the features of our questionnaire is that it asks all
respondents to evaluate, on a scale from 1 to 4, how important several features /
interventions are for the SME ‘ecosystem’. As all surveyed categories were asked this
question, we can evaluate whether listed and unlisted companies show any significant
difference in evaluating the SME ecosystem. To draw conclusions on this, we run two different
tests for each ecosystem feature:
- An unpaired t-test, assuming unequal variances between groups and implementing
the Welch degrees of freedom correction. Power analysis gives additional information
on the test’s ability to detect a mean difference;
- A Fisher exact test.
As both the independent and the dependent variables are categorical, the Fisher exact
statistics is the most appropriate test to understand whether the independent and the
dependent variables are anyhow related. We nonetheless, also utilised the unpaired t-test as
it is a more widely understood test and enables us to show the differences in mean results
across categories.
Results are displayed in Table A7. The main findings are calculated on the <1000 Employees
companies, but hold across categories. The results are the same as set out in the body of the
report (Table 5). In most instances the t-tests and the Fisher exact tests show consistent
results.
(3.435) (-2.074)
Used bank fin. 0.23093*** -0.06148
(2.973) (-0.459)
Used ret. earnings 0.07505 -0.17456*
(0.823) (-1.847)
Used trade credit 0.16396 0.20752
(1.537) (1.136)
Company is borrowing
constrained
- 0.15903**
(1.981)
Controls for company’s
ownership
x x
Control for country of
residence
x x
Controls for sector of
activity
x x
Observations 111 94

55
Table A7: Ecosystem questions – comparison between listed and unlisted companies (Employees <1,000)
Mean - Unlisted Mean – Listed t-test p-value Fisher (p-value)
Regulatory and
supervisory
framework
3.02 3.29 -2.10 0.03 0.06
Support to prepare
disclosure
3.26 3.10 1.17 0.24 0.14
Financial education
for SMEs
2.65 3.07 -3.50 0.00 0.00
Financial education
for investors
2.68 2.93 -1.71 0.09 0.00
Simplified listing
procedures
3.56 3.12 3.26 0.00 0.00
Mechanism to
enhance liquidity
2.78 3.01 -1.77 0.08 0.04
Research on SMEs 2.60 2.77 -0.74 0.46 0.00
Tax incent. for inv. 2.92 3.00 -0.50 0.61 0.12
Tax incent. for
issuers
2.80 3.01 -1.64 0.10 0.25
Raising funds
speedily
3.09 3.03 0.45 0.64 0.00
Quality, affordable
advisory services
3.17 3.10 0.42 0.67 0.00
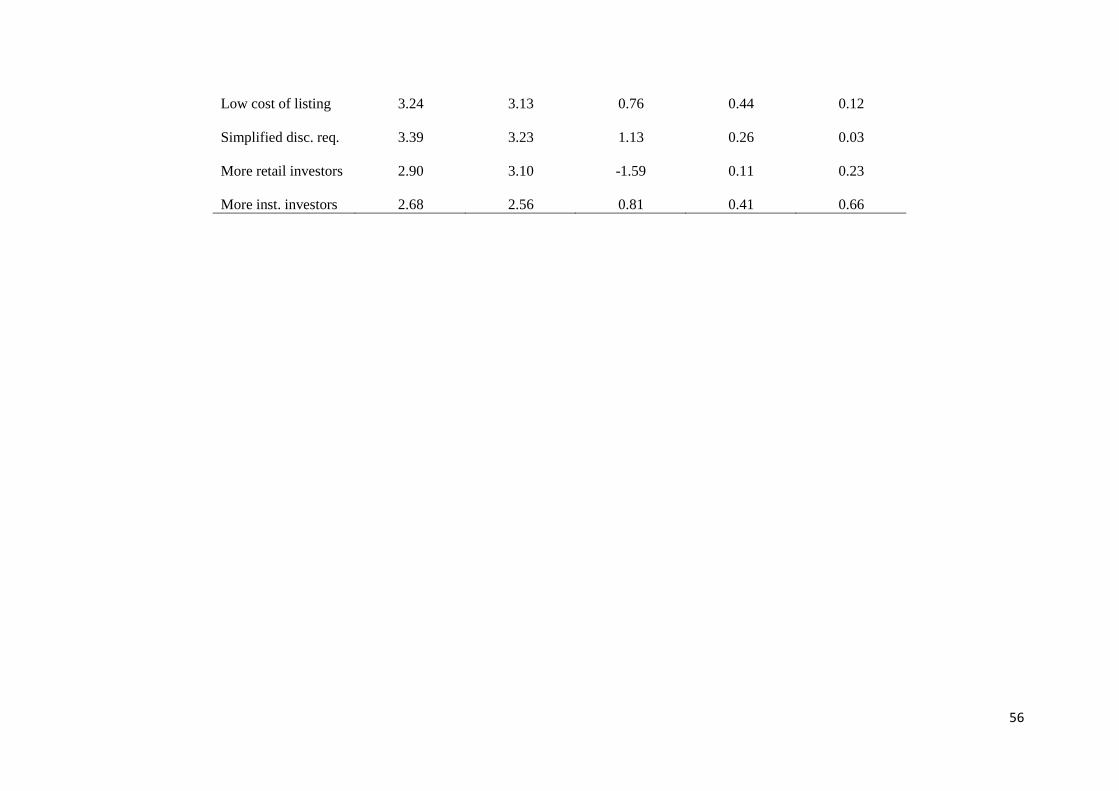
56
Low cost of listing
3.24 3.13 0.76 0.44 0.12
Simplified disc. req. 3.39 3.23 1.13 0.26 0.03
More retail investors 2.90 3.10 -1.59 0.11 0.23
More inst. investors 2.68 2.56 0.81 0.41 0.66
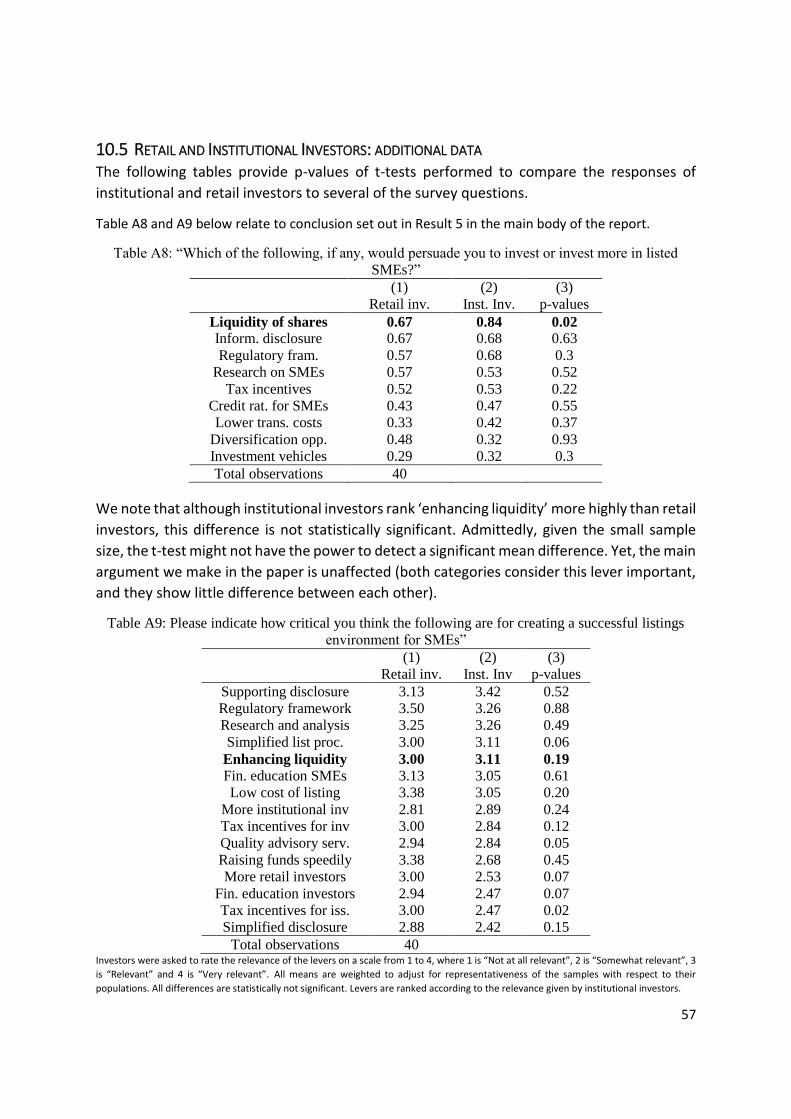
57
10.5 RETAIL AND INSTITUTIONAL INVESTORS: ADDITIONAL DATA The following tables provide p-values of t-tests performed to compare the responses of
institutional and retail investors to several of the survey questions.
Table A8 and A9 below relate to conclusion set out in Result 5 in the main body of the report.
Table A8: “Which of the following, if any, would persuade you to invest or invest more in listed
SMEs?”
(1) (2) (3)
Retail inv. Inst. Inv. p-values
Liquidity of shares 0.67 0.84 0.02
Inform. disclosure 0.67 0.68 0.63
Regulatory fram. 0.57 0.68 0.3
Research on SMEs 0.57 0.53 0.52
Tax incentives 0.52 0.53 0.22
Credit rat. for SMEs 0.43 0.47 0.55
Lower trans. costs 0.33 0.42 0.37
Diversification opp. 0.48 0.32 0.93
Investment vehicles 0.29 0.32 0.3
Total observations 40
We note that although institutional investors rank ‘enhancing liquidity’ more highly than retail
investors, this difference is not statistically significant. Admittedly, given the small sample
size, the t-test might not have the power to detect a significant mean difference. Yet, the main
argument we make in the paper is unaffected (both categories consider this lever important,
and they show little difference between each other).
Table A9: Please indicate how critical you think the following are for creating a successful listings
environment for SMEs”
(1)
Retail inv.
(2)
Inst. Inv
(3)
p-values
Supporting disclosure 3.13 3.42 0.52
Regulatory framework 3.50 3.26 0.88
Research and analysis 3.25 3.26 0.49
Simplified list proc. 3.00 3.11 0.06
Enhancing liquidity 3.00 3.11 0.19
Fin. education SMEs 3.13 3.05 0.61
Low cost of listing 3.38 3.05 0.20
More institutional inv 2.81 2.89 0.24
Tax incentives for inv 3.00 2.84 0.12
Quality advisory serv. 2.94 2.84 0.05
Raising funds speedily 3.38 2.68 0.45
More retail investors 3.00 2.53 0.07
Fin. education investors 2.94 2.47 0.07
Tax incentives for iss. 3.00 2.47 0.02
Simplified disclosure 2.88 2.42 0.15
Total observations 40 Investors were asked to rate the relevance of the levers on a scale from 1 to 4, where 1 is “Not at all relevant”, 2 is “Somewhat relevant”, 3
is “Relevant” and 4 is “Very relevant”. All means are weighted to adjust for representativeness of the samples with respect to their
populations. All differences are statistically not significant. Levers are ranked according to the relevance given by institutional investors.

58
The result in bold in Table A10 below supports the discussion under Result 6, where we note that both
retail and institutional investors regard information disclosure requirements as important to increase
their confidence in SMEs. Admittedly, given the small sample size, the t-test might not have the power
to detect a significant mean difference. Yet, the main argument we make in the paper is unaffected
(both categories consider this characteristic important, and they show little difference between each
other).
Table A10: “Please rate how much each of the following factors affect your confidence in SMEs”
(1) (2) (3)
Retail inv. Inst. Inv. p-value
Corp. gov. req. 3.60 3.53 0.72
Inform. discl. req. 3.33 3.67 0.15
Suitability of directors 3.27 3.73 0.04
Rules on party trans. 2.93 3.53 0.03
Provisions on dilution 2.80 3.33 0.03
Sharehold. rights prot. 2.93 3.67 0.02
Age or dev. of SME 3.20 3.33 0.65
Revenue growth 3.80 3.27 0.01
Total observations 30 All answers are rated in a scale from 1 to 4, where 1 is “Not relevant at all”, 2 is “Of little relevance”, 3 is “relevant” and 4 is “Very relevant”.
11 APPENDIX 4 – SURVEY COVER LETTER
Dear Respondent,
Thank you for participating in this research. It should not take more than 10 minutes to complete this
questionnaire.
Please make sure that you read all questions carefully and that your answers are accurate. Your
information will be used for research purposes only and will not be directly attributable in any
documents produced using the survey results. Your answers will also be shared with the exchange,
but you have the option to make your responses anonymous if you wish to.
This survey is about Small and Medium Enterprises (SMEs) and their use of capital markets.
For the purposes of this research, SMEs are defined as:
- for listed companies: companies with a market capitalization lower than [DEFINITION] or
turnover/revenue less than [DEFINITION]
- for unlisted companies: companies with turnover/revenue lower than [DEFINITION]
If you have any questions or concerns, please contact us (contacts at the bottom of the page).
Thank you for your participation
[CONTACT DETAILS]