
SMCN-2004-069 Final report - ACIARaciar.gov.au/files/node/11874/SMCN-2004-069 Final report.pdf ·...
99
Final report project Minimising agricultural pollution to enhance water quality in Laguna de Bay (Philippines) and Mt Lofty Ranges (Australia) project number SMCN/2004/069 date published March 2010 prepared by Danielle Oliver, Researcher, CSIRO Land and Water Rai Kookana, Principal Research Scientist, CSIRO Land and Water co-authors/ contributors/ collaborators Dr Rex Cruz, Director Institute of Renewable Resources, UPLB Dr Pearl Sanchez, UPLB Dr Lily Varca, UPLB Ms Cristy Bajet, UPLB Mr Emil Hernandez, LLDA Dr Jim Cox, SARDI Mr Jose K. Carino III, LLDA approved by Dr Gamini Keerthisinghe final report number FR2010-04 ISBN 978 1 921615 79 5 published by ACIAR GPO Box 1571 Canberra ACT 2601 Australia
Transcript of SMCN-2004-069 Final report - ACIARaciar.gov.au/files/node/11874/SMCN-2004-069 Final report.pdf ·...

Final report project Minimising agricultural pollution to
enhance water quality in Laguna de Bay (Philippines) and Mt Lofty Ranges (Australia)
project number SMCN/2004/069
date published March 2010
prepared by Danielle Oliver, Researcher, CSIRO Land and Water
Rai Kookana, Principal Research Scientist, CSIRO Land and Water
co-authors/ contributors/ collaborators
Dr Rex Cruz, Director Institute of Renewable Resources, UPLB
Dr Pearl Sanchez, UPLB
Dr Lily Varca, UPLB
Ms Cristy Bajet, UPLB
Mr Emil Hernandez, LLDA
Dr Jim Cox, SARDI
Mr Jose K. Carino III, LLDA
approved by Dr Gamini Keerthisinghe
final report number FR2010-04
ISBN 978 1 921615 79 5
published by ACIAR GPO Box 1571 Canberra ACT 2601 Australia

This publication was published by ACIAR ABN 34 864 955 427. Care was taken to ensure the accuracy of the information contained in this publication. However ACIAR cannot accept responsibility for the accuracy or completeness of the information or opinions contained in the publication. You should make your own enquiries before making decisions concerning your interests.
© Commonwealth of Australia 2010 - This work was copyright. Apart from any use as permitted under the Copyright Act 1968, no part may be reproduced by any process without prior written permission from the Commonwealth. Requests and inquiries concerning reproduction and rights should be addressed to the Commonwealth Copyright Administration, Attorney-General’s Department, Robert Garran Offices, National Circuit, Barton ACT 2600 or posted at http://www.ag.gov.au/cca.

Final report: Minimising agricultural pollution to enhance water quality in Laguna de Bay (Philippines) and Mt Lofty Ranges (Australia)
Page iii
Contents
1 Acknowledgments ..................................................................................... 5
2 Executive summary ................................................................................... 6
3 Background ................................................................................................ 8
4 Objectives ................................................................................................ 11
5 Methodology ............................................................................................ 12 5.1 Philippines Component .................................................................................................... 12
5.2 Australian Component ..................................................................................................... 18
6 Achievements against activities and outputs/milestones .................. 23
7 Key results and discussion .................................................................... 28 7.1 Philippines ....................................................................................................................... 28
7.2 Australia .......................................................................................................................... 57
8 Impacts ..................................................................................................... 65 8.1 Scientific impacts – now and in 5 years ........................................................................... 65
8.2 Capacity impacts – now and in 5 years ............................................................................ 66
8.3 Community impacts – now and in 5 years ....................................................................... 67
8.4 Communication and dissemination activities ................................................................... 69
9 Conclusions and recommendations ..................................................... 71 9.1 Conclusions ..................................................................................................................... 71
9.2 Recommendations ........................................................................................................... 72
10 References ............................................................................................... 74 10.1 References cited in report ................................................................................................ 74
10.2 List of publications produced by project ........................................................................... 74
11 Appendixes .............................................................................................. 76 11.1 Appendix 1: Initial Survey of Site Identification for Location of the Auto-samplers in
the Philippines. ................................................................................................................ 76
11.2 Appendix 2: Results of Pesticide Impact Rating Index (PIRI) assessment of chemicals used by growers at 3 monitoring sites in Mt. Lofty Ranges, Australia. ............................. 84
11.3 Appendix 3: Details of analytical methodology for analyses of total suspended sediment (TSS), nutrients and pesticides. ....................................................................... 88
11.4 Appendix 4: Example of the Chemical Reference Charts developed for the Mt. Lofty Ranges, South Australia. ................................................................................................. 91
11.5 Appendix 5: Pesticide usage in Lucban and Pagsanjan regions in the Philippines. ......... 94

Final report: Minimising agricultural pollution to enhance water quality in Laguna de Bay (Philippines) and Mt Lofty Ranges (Australia)
Page iv

Final report: Minimising agricultural pollution to enhance water quality in Laguna de Bay (Philippines) and Mt Lofty Ranges (Australia)
Page 5
1 Acknowledgments The ACIAR team gratefully acknowledges the volunteers in the Philippines who contributed to the project objectives. These volunteers include the teachers and students at schools involved with the collection of rainfall data, the members of the River Council who collected the water samples on a daily basis from the automatic samplers and the residents who allowed the auto-samplers to be located on their properties.
Thanks to Prof. Eduardo Paningbatan, UPLB, for his contribution as the initial project leader of this ACIAR project.
Thanks also to Dr Sammy Contreras and his team from Bureau of Soil and Water Management who assisted with the installation of the auto-samplers and the water level loggers in the Philippines. The authors also wish to acknowledge the enormous contribution made by other ACIAR team members: Mr Nigel Fleming, South Australian Research and Development Institute; Mr Larry Fabro, Ms Evangeline Pascual, and Mr Michael Pillas, UPLB; Mr Hernan Castillo, Ms Eli Veluz, Mr Neil Varcas, Mr Roman Corpuz, Mr Ronie Samiano, Ms Haidee Piniero, and Ms Amisol Bagonghasa, LLDA
Ms Susan Cuddy, CSIRO, is also gratefully acknowledged for her contribution to training courses and the initial establishment of the project. The project was also fortunate that Ms Anne Henderson, CSIRO, was able to train a Filipino team member in the use of SedNet - a sediment transport model; and Dr Anu Kumar, CSIRO, who provided training and guidance in ecotoxicological tests.
The Australian ACIAR team wish to thank Mr Nick Noske, Mr Stephen Cowper and Mr Anthony Plummer for allowing their farms to be used in this study. The following CSIRO staff are also acknowledged for their untiring contribution to the project: Mrs Jenny Anderson, Mr Lester Smith and Mrs Tasha Waller.
We are thankful to John Crawford Fund and especially to Dr Albert Rovira and Dr John Radcliffe to provide partial funding support to run two training workshops in the Philippines to enhance capability of the wide range of interested parties (resource managers, local government units, engineers, students, teachers and non-government organisations). Dr Radcliffe also facilitated a workshop at the beginning stages of this project with stakeholders in Mt Lofty Ranges and made a valuable contribution.
Contributions by Dr John Hutson of Flinders University to the final project workshop in Manila and his guidance and thoughts for future project activities in the Philippines are gratefully acknoweledged.
Final report: Minimising agricultural pollution to enhance water quality in Laguna de Bay (Philippines) and Mt Lofty Ranges (Australia)
Page 6
2 Executive summary Laguna de Bay (Philippines) is the second largest freshwater lake in South East Asia and contributes about 13% of national GDP (www.llda.gov.ph). Generally the lake water quality is Class C (good for fisheries and aquaculture) but water is being extracted from the Lake to augment water supply for southern Manila. Of the three bays of the lake, the eastern bay is the cleanest, but its water quality has been impacted by the drainage water predominantly from agricultural sources in the Pagsanjan-Lumban sub-catchment.
Given the prominence of agriculture (52% of all land uses) in the Pagsanjan River sub-catchment the project focussed on identifying and quantifying the major sources of sediments and pollutants from farming areas to the lake. The complementary project in Australia focussed on similar problem in the Mt Lofty Ranges in South Australia- the main catchment for Adelaide's drinking water supply. In both cases better understanding of water quality and identification of sources of pollution in streams was needed.
Study sites in both countries represented different land uses as potential pollution sources of sediments, nutrients and pesticides. In the Philippines the dominant land uses (sites) in the study area were coconut with inter-cropping (Cavinti) rice (Pagsanjan), vegetables (Lucban) and piggeries (Majayjay). In Australia, the target land uses were apples, cherries and viticulture. Sites in both countries were instrumented with auto-samplers, flow meters and data loggers to estimate pollutant loads. Concentrations of pollutants were measured by standard techniques. Modelling and monitoring approaches were employed. Key achievements are described below. Local community was involved in the project in both countries.
Sediments: Sediment transport modelling with SedNet predicted about 230 kt/yr sediment load was exported to the lake with the majority coming from the Balanac River sub-catchment, suggesting that this area be targeted for mitigation. The model predicted that a 20% conversion of plantation to forest uniformly across the catchment would decrease the total sediment supply by 7% but if the conversion to forest targeted steeply sloping areas then the decrease in sediment supply increased to 20%.
Nutrients: The maximum and annual mean concentrations (mg/L) of total suspended solids (TSS), total nitrogen (TKN) and total phosphorus (TP) from different land uses in decreasing order were : Piggeries > Rice > Vegetables > Coconut. The mean values for TKN and TP at the monitoring sites exceeded the critical level for algal bloom development (0.5 and 0.03 mg/L, respectively) and the criterion set by Filipino authorities for Class C waters for Laguna de Bay (1.10 and 0.01 mg/L, respectively).
In Australia TN concentrations exceeded Australian environmental guideline values on numerous occasions at the apples sites and in 100% of samples in the cherries site.
Pesticides: Of the 5 pesticides monitored (based on local surveys) only malathion was detected at the vegetables site and profenofos at the rice site. At times, the concentration of malathion in the river exceeded the Australian and the US environmental trigger values. The maximum detected concentrations of profenofos were close to the LC50 values derived for shrimp.
In Australia numerous pesticides were detected in surface water but two in particular, fenarimol and chlorpyrifos, were detected either for extended periods of time or at levels exceeding Australian drinking water guidelines.
Capacity Building: The project was highly successful in capacity building of the teams from Laguna Lake Development Authority, University of the Philippines (Los Banos) and Southern Luzon University. In addition to extension of tools and techniques to the Philippines, two scientists received training in Australia. Schools were involved in rainfall measurements and were provided resource books for use by students - this initiative was well received by students and teachers and proved mutually beneficial.
Final report: Minimising agricultural pollution to enhance water quality in Laguna de Bay (Philippines) and Mt Lofty Ranges (Australia)
Page 7
Future actions required: This project has provided quantitative data to highlight the need to develop alternative strategies for dealing with piggery waste at Majayjay. This is the first study providing valuable data to LLDA to predict the lake water quality with greater confidence.
Direct discharge of piggery waste to river must stop and a feasibility assessment of diversion and treatment strategies need to be investigated. On farm management and other pollution mitigation strategies must be developed in both countries. The project has developed local capabilities and has identified several future research and developmental opportunities for agricultural sustainability and environment.
Data from this study about mode of off-site transport will also be instrumental in guiding mitigation strategies to be implemented. This study will provide valuable data for Australian agencies (e.g. SA Water or SA EPA) to align the pesticides monitored with those being used in the field, and regulatory agencies (APVMA) to change regulations about frequency of applications of chemicals within a season.

Final report: Minimising agricultural pollution to enhance water quality in Laguna de Bay (Philippines) and Mt Lofty Ranges (Australia)
Page 8
3 Background Philippines Laguna de Bay is the second largest freshwater lake in SE Asia and consists of three bays (Fig. 1). The eastern bay was the cleanest of the three bays and the main source of pollution is drainage water from predominantly agricultural sources in the Pagsanjan-Lumban sub-catchment. The discharge from the Pagsanjan River into the eastern bay accounts for approximately 35% of the lakes total fresh water inflow. The eastern bay supports major aquaculture industry and has also been seen as a future source of drinking water for Manila. Water will be extracted from the eastern bay to augment water supply for customers south of Metro Manila starting at 100 ML/day in 2010 and increasing to 300 ML/day in 2014. The quality of water in the eastern bay however has been deteriorating over time due to the diffuse source pollution from agricultural activities in the sub-catchments and was evident by the increasing progression of the Pagsanjan-Lumban delta into the Lake (Fig. 2). Sediment has been the main pollutant of concern and was found to be responsible for turbidity that directly affects primary productivity, photosynthesis and fish production (Tamayo et al 2002). Sediment inputs to the lake from all sources was estimated to be 7.7 million tonnes a year and was reducing the depth of the lake (current average depth was 2 m) by an average of 2.5 to 4 cm a year, and storage volume by 3.3 million cubic metres a year.
Agriculture was considered to be a significant contributor to suspended sediment load to Laguna de Bay. Soil erosion loss rates for the Pagsanjan catchment were estimated by The University of the Philippines Los Baños (UPLB) to be in the order of 20mm/ha/yr in the 1980s and 40 mm/ha/yr in the late 1990s. Given the prominence of agriculture (52% of all land uses) in the Pagsanjan River sub-catchment, efforts to reduce off-site migration of soil from farming areas will dramatically improve lake water quality, particularly in the eastern bay. It has been projected that without intervention, the Lumban delta will eventually link with the Jala Jala Peninsula on the opposite lake side and cut off the upper eastern bay from the larger water body.
These diffuse pollutants (sediment, nutrients and pesticides) need to be addressed but there was currently little information to quantify actual losses from the main land uses in the sub-catchment. Laguna Lake Development Authority (LLDA) highlighted an urgent need to understand the pollution sources and have quantitative data from the agricultural Pagsanjan-Lumban sub-catchment in order to predict the lake water quality with greater confidence. Such data were lacking prior to the start of this project and gross assumptions were being made.
The project was undertaken collaboratively by CSIRO, the LLDA (uniquely mandated to improve water quality and catchment management across the provincial and local government agencies represented in the catchment) and the University of the Philippines, Los Baños (UPLB). The specific objectives of the project were to develop a comprehensive biophysical and hydrological characterisation of the Pagsanjan-Lumban sub-catchment of Laguna de Bay, and to identify and quantify the sources of pollutants (sediments, nutrients and pesticides) from the main agricultural activities and their potential impact on the health of Laguna de Bay in the Philippines.
The project was expected to lead to benefits arising from reduced turbidity and reduced inputs of nutrients and pesticides in the eastern bay of the lake. This includes protection of fishery habitats, reduced need for sediment dredging from water storages for power generation, and protection of water quality so that it can be maintained at a standard suitable for potable water supplies to metropolitan Manila in the future. In the Philippines, the LLDA will be the primary first user of the project’s results, which will feed into their community development and implementation activities. LLDA will be responsible for the communication and dissemination of project outcomes and for the promotion and adoption

Final report: Minimising agricultural pollution to enhance water quality in Laguna de Bay (Philippines) and Mt Lofty Ranges (Australia)
Page 9
of beneficial land management interventions within the Pagsanjan-Lumban sub-catchment. Transfer of results to other agricultural sub-catchments of the lake were planned to occur through the operations of the established and adequately resourced Federation of River Basin Councils. The outputs of this project were expected to provide
guidance in the improvement of management of watersheds outside of the Laguna de Bay area. Figure 1. Map of Laguna de Bay showing three bays and study area.
Figure 2. Pagsanjan-Lumban delta that extends into Laguna de Bay.
Australia In South Australia the Mt. Lofty Ranges watershed is a major source of drinking water for the city of Adelaide. Local runoff from the catchments can contribute up to 60% of Adelaide’s drinking water supply (SA EPA, 2000) but this varies with annual rainfall. The Cock Creek and Charleston sub-catchments occupy approximately 2840 and 5151 ha, respectively, in the Mt. Lofty Ranges. The major land uses in the Cock Creek sub-catchment are broad scale grazing (39%), pomefruit (25%) and native vegetation (15%).
Western Bay•Heavily polluted•Urban impact•End of pipe
solutions•Aquaculture•Brackish
Eastern Bay•Mainly Agril.•Less polluted•Diffuse source
pollution•Less tractable•Future drinking
water source
Study area: Pagsanjan-Lumban sub-catchment 35% of lakes freshwater flow
Lumban delta may join Jala-jala peninsula in future
Final report: Minimising agricultural pollution to enhance water quality in Laguna de Bay (Philippines) and Mt Lofty Ranges (Australia)
Page 10
The major land uses in the Charleston sub-catchment are broad scale grazing (59%), intensive grazing (19%) and vines (7%) (SA EPA).
Off-site transport of contaminants in the form of nutrients, sediment and pesticides from agricultural practices was of concern to landholders, regulatory agencies and the general public. The presence of contaminants in waterways can cause eutrophication, which may increase the cost of water treatment for a potable water source, and ecotoxicological effects on aquatic organisms.
The main objective of this study was to quantify the loads of sediment, nutrients and pesticides transported off-site from three main land uses in the Mt. Lofty Ranges, namely apple, cherries and grape production, and to ascertain the form in which these contaminants move i.e. attached to colloidal material or in a soluble phase. This project also aimed to determine whether there were any relationships between occurrence of rainfall events and transport and inter-relationships between contaminant transport.
In Australia, the agencies that manage Adelaide’s water supply (SA Water) and monitor the environmental health of rivers and creeks in the Mt. Lofty Ranges (SA Environmental Protection Authority) together with industry groups, especially Apple and Pear Growers Association and Forestry SA, were identified as the primary beneficiaries of the project outcomes. The knowledge generated from this project will enable water supply and regulatory agencies to modify their monitoring programmes to focus on the main contaminants of concern and focus on the main sources to minimise off-site transport. It will help the industry groups to apply better on-farm management practices to minimise off-site migration of nutrients, pesticides and sediments and help secure and comply with Environmental Management Systems (EMS) accreditation.
Final report: Minimising agricultural pollution to enhance water quality in Laguna de Bay (Philippines) and Mt Lofty Ranges (Australia)
Page 11
4 Objectives The specific objectives of the project are:
1. To develop a comprehensive biophysical and hydrological characterization of the selected agricultural watershed (Pagsanjan-Lumban) Laguna de Bay. In the Mt. Lofty Ranges such information already exists.
Activities:
• Engagement of relevant agencies and other stakeholders (LLDA, LGUs, River Councils etc.).
• Data gathering on biophysical attributes from various sources in GIS framework. It was understood that there may be sufficient information on the biophysical attributes of the Pagsanjan–Lumban sub watershed.
• Water balance and erosion modelling and GIS Mapping. Mapping was undertaken at the sub watershed scale with supplementary maps developed at the LGU scale and provided to local managers as the base for on-ground planning and intervention works;
• Training in the use of GIS and modelling.
Output:
• A consolidated report and GIS maps detailing bio-physical and hydrological data and information including water balance, soil type, land use, fertilizer use, pesticides use and erosion potential on the Pagsanjan-Lumban sub watershed of the Laguna de Bay.
2. To identify and quantify the sources of sediments, nutrients and pesticides from agricultural activities in the Pagsanjan-Lumban Watershed and assess their potential impacts on the water quality of the Eastern Bay of Laguna de Bay in the Philippines.
Activities:
• Identifying the potential sites of pollution sources
• Quantifying the pollution load (chemical and hydrological measurements and monitoring)
• Assessing the en route attenuation from agricultural sources and delivery of pollution and ecotoxicological impact to selected water bodies.
• Assessing the impact of water quality improvement on the fish productivity through laboratory ecotoxicological studies.
• Communication meetings for effective engagement of stakeholders and two-way flow of information.

Final report: Minimising agricultural pollution to enhance water quality in Laguna de Bay (Philippines) and Mt Lofty Ranges (Australia)
Page 12
5 Methodology
5.1 Philippines Component
Site selection, instrumentation of sites and water analyses Initially a survey was done by Dr Sammy Contreras, Bureau of Soil Water Management, to identify possible locations in the Pagsanjan-Lumban catchment for installing auto-samplers (Appendix 1). Auto-samplers and the water level loggers were installed at four sites within the Pagsanjan-Lumban catchment (Fig. 3) at locations chosen to represent the major land uses in the sub-catchment, namely production of rice (Pagsanjan) (Figs. 4-7), vegetables (Lucban) (Figs. 8 and 9) and coconut (Cavinti) (Figs.10-13) and piggeries (Majayjay) (Figs. 14-17). The auto-samplers were established to collect water on a time-weighted basis at each site to obtain a representative sample from the river throughout the day.
Volunteers from River Councils throughout the sub-catchment were engaged to assist with the daily collection of water samples which were stored in refrigerators that were specifically purchased for the project. Despite various problems with the initial establishment of the equipment daily samples were collected from Lucban from late May 2007, from Pagsanjan from mid January 2008, from Cavinti from August 2007 and from Majayjay from early June 2008. Sampling ceased at all sites in August 2009 except for Majayjay which ceased in November 2008.
At all sites (except Majayjay) approximately 250 mL of water was collected every 6 hours during the day and after the initial analysis of daily samples (approximately the first 2 weeks of sampling) the 7 daily samples are composited to provide one sample for the week. The daily samples are stored at 4 degrees C until they are composited and transported to the laboratory for analysis. The water samples collected during the week were transported to the laboratory for analysis for total suspended sediment (TSS), nutrients (total N and P) and selected pesticides.
The Odyssey water level loggers were installed to determine flow volumes and this data was used to determine loads of the contaminants being transported from the instrumented areas within the catchment.
Nutrient and pesticide analyses were conducted on unfiltered samples (representing the total concentration) and on a filtered (<0.45 µm) sample (representing the fraction in the soluble phase). The fraction of contaminant associated with the colloidal phase (>0.45 µm) was then calculated by difference.
The results of the analyses are planned to be presented in the special edition of the journal, Agricultural Water Management.

Final report: Minimising agricultural pollution to enhance water quality in Laguna de Bay (Philippines) and Mt Lofty Ranges (Australia)
Page 13
Figure 3. Location of auto-samplers and schools where rainfall gauges were installed in the Pagsanjan-Lumban catchment in the Philippines.
Figures 4 and 5. The equipment was located on the Salasad River that receives drainage water from rice production, which was the main landuse around Pagsanjan.

Final report: Minimising agricultural pollution to enhance water quality in Laguna de Bay (Philippines) and Mt Lofty Ranges (Australia)
Page 14
Figures 6 and 7. The equipment at Pagsanjan was located on private property and maintained by the owner of the house adjacent the river. A farmer spraying chemicals on rice field.
Figures 8 and 9. Installation of the stilling wells for the Odyssey water level loggers and the logger within the well at Lucban.

Final report: Minimising agricultural pollution to enhance water quality in Laguna de Bay (Philippines) and Mt Lofty Ranges (Australia)
Page 15
Figures 10 and 11. Equipment was initially installed near the Brangay Tibatib Overflow Bridge at Cavinti just beyond the green sign in the right-hand photo.
Figures 12 and 13. Autosampler and waterlogger on the Bongbongan River at Caviniti.
Due to problems with “ponding” of the water under low flow conditions an alternative site for the water level logger was found downstream. At the downstream site there was a natural V-notch weir that can be used for determining the flow rating curve.

Final report: Minimising agricultural pollution to enhance water quality in Laguna de Bay (Philippines) and Mt Lofty Ranges (Australia)
Page 16
Figures 14 and 15. The predominant industry in Majayjay was piggeries and the waste from the piggeries was washed straight out into drainage channels that run along the back of each piggery. This waste finally drains into Balanac River.
Figure 16. Location of autosampler and waterlogger at Majayjay. Effluent waste was sampled on a daily basis.
Figure 17. View from the bridge looking directly down into stream of effluent draining into the Balanac River. At the base of the bridge was a culvert that would allow easier determination of a flow rating curve for the site.

Final report: Minimising agricultural pollution to enhance water quality in Laguna de Bay (Philippines) and Mt Lofty Ranges (Australia)
Page 17
Installation of rain gauges During the launch of the project in September 2006 several options were identified to overcome the paucity of data that was needed for the models currently used in the Philippines. A scoping document outlining how volunteers could help accumulate data, primarily TSS, rainfall and water depth measurements, for the project was produced.
It was decided that the paucity of rainfall data for the catchment could be overcome by engaging schools within the watershed in the collection of rainfall data. In early March 2007 rain gauges were installed in the nine (9) identified schools and on March 9 2007 two high school students and one teacher from each of the schools were trained in using the rainfall gauge to measure rainfall. The rainfall data were collected by Roman Corpuz, LLDA, who visited each school monthly. However, considering the distance of the schools from the LLDA Office the students were asked to send through the daily rainfall data by text messaging. The distribution of the rainfall gauges through the catchment was shown in Fig. 3.
To supplement the collection of rainfall data by the students a booklet was developed outlining how the rainfall data could be incorporated into the curriculum. Included in the booklet were mathematical concepts and scientific experiments about the water cycle, catchment processes etc. This booklet was distributed to the schools involved with the rainfall data collection and can be accessed at http://www.llda.gov.ph/aciar.htm.
Collation of biophysical information about the catchment and GIS mapping During the establishment of the project proposal it was identified that information about biophysical data for the catchment was segregated and held by a range of different organisations. This data was compiled in a booklet produced by Mr Michael Pillas and Dr Rex Cruz, UPLB, and knowledge gaps have been identified during this process. GIS maps were also included in this compilation. This booklet and the GIS maps may also be accessed from the LLDA website, http://www.llda.gov.ph/aciar.htm.
Ecotoxicological testing A range of pesticides have been assessed across a range of concentrations for the ecotoxicological impact on organisms that are representative of different trophic levels in the food chain. These tests have included the following:
a. Duckweed (Lemna sp)
lambda cyhalothrin, deltamethrin, cypermethrin, malathion, profenofos, chlorpyrifos, oxadiazon, propanil + butachlor, cyhalofop butyl + chlorimuron, butachlor, 2,4-D
Duckweed was one of the standard biological test method for measuring the inhibition of growth of freshwater macrophyte. Duckweed was also an indicator for the trophic level, therefore an important parameter for the quality of the water in which it grows.
b. Shrimp (Macrobrachuim lar)
lambda cyhalothrin, deltamethrin, cypermethrin, chlorpyrifos, profenofos, butachlor, carbaryl, malathion
Shrimps are commonly used as representatives of macro invertebrate organisms for assessment of ecotoxicological effects of pesticides.
c. Tilapia fingerlings
lambda cyhalothrin, deltamethrin, cypermethrin, triazophos, metamidophos, profenofos, propanil

Final report: Minimising agricultural pollution to enhance water quality in Laguna de Bay (Philippines) and Mt Lofty Ranges (Australia)
Page 18
d. Tilapia early life stages (hatching to 7d old)
lambda cyhalothrin, deltamethrin, cypermethrin, butachlor, 2,4-D, profenofos, chlorpyrifos
The data generated from these tests was used to produce LC50 values for the various pesticides and test organisms assessed and this data was compared with the field concentrations detected during the sampling. This data will also be presented in a special edition of the journal, Agriculture Water Management.
Sediment transport modelling Mr Emiterio Hernandez came to Australia from March 16 to April 3, 2009 and worked with Ms Anne Henderson, CSIRO Land and Water, Townsville. During his visit he was trained in using the sediment transport model developed at CSIRO, SedNet, and was able to run the model for the Lucban sub-catchment. He also attempted to use it for modelling nutrient transport but several problems were encountered so this aspect was not as successful.
The results from this modelling were then compared with the field collected data for validation. The results from this assessment are presented in the special edition of the journal, Agricultural Water Management.
Water balance modelling. Water balance modelling was done using the Brook model. The Sacramento water balance model was a component of SedNet which was used for the sediment modelling so results from this model was compared with those from the Brook model and then validated with field collected water volume data for the smaller Lucban sub-catchment within the Pagsanjan-Lumban catchment. The results from this assessment are presented in the special edition of the journal, Agricultural Water Management.
5.2 Australian Component
Site selection, instrumentation of sites and water analyses. The Mt. Lofty Ranges watershed (Fig. 18) was a major source of drinking water for the city of Adelaide. Local runoff from the catchments can contribute up to 60% of Adelaide’s drinking water supply (SA EPA, 2000) but this varies with annual rainfall. The Cock Creek and Charleston sub-catchments occupy approximately 2840 and 5151 ha, respectively, in the Mt. Lofty Ranges, east of Adelaide.
The major land uses in the Cock Creek sub-catchment are broad scale grazing (39%), pomefruit (25%) and native vegetation (15%). The major land uses in the Charleston sub-catchment are broad scale grazing (59%), intensive grazing (19%) and vines (7%) (SA EPA).
Three sites (two in Cock Creek catchment and one in the Charleston catchment) were instrumented with auto-samplers and water level loggers. These sites were selected because they represented three major land uses in the Mt. Lofty Ranges, namely apples, cherries and grapes, and the area from which water was draining contained only that land use and native vegetation. This enabled a more accurate assessment of pesticide and nutrient contamination from that specific land use without the data being confounded by other contaminant sources. At the Charleston site auto-samplers were placed before and after a dam located at the base of the main stream draining the site. This was done

Final report: Minimising agricultural pollution to enhance water quality in Laguna de Bay (Philippines) and Mt Lofty Ranges (Australia)
Page 19
because the dam contained reeds, thus allowing an initial assessment of the effectiveness of this system to attenuate contaminants.
All sites were instrumented with a flow meter which controlled flow-weighted sample collection via an auto-sampler. Telemetry was fitted to all sites to allow remote download, adjustment and re-setting of flow measurement equipment and monitoring of site status. This also allowed timely and efficient collection of water samples. All sites had solar panels and batteries allowing the sampler to operate independently of 240 volt power. Unless otherwise specified, each site was equipped with an ISCO model 4230 bubble flow meter, ISCO model 3700 auto-sampler, 80 watt solar panels and 4 x 65 Ah deep cycle batteries (Fig. 19). All sites were also equipped with an Odyssey logging capacitance probe as a backup system to measure water flow.
The three field sites that were instrumented were:
1. Cherries (Cock Creek catchment): An 8 ha catchment with broad scale grazing (41%), stone fruit (34%) and native vegetation (25%). Water flow was measured over a rectangular weir (Fig. 20) with end constrictions at this site.
2. Apples (Cock Creek catchment): A 64 ha catchment with pomefruit (54%), exotic vegetation (14%) and native vegetation (13%). Flow was measured through an existing 600mm diameter culvert by a Starflow model 6265C Doppler flow meter with combined depth and velocity sensor.
3. Grapes (Charleston catchment): A 155 ha catchment with vines (27%), broad scale grazing (39%) and intensive grazing (32%). There were two measurement points at this site - one above and one below a large dam which contained a reed bed. The upper site (Grapes 1) measured flow over a rectangular weir with end constrictions (Fig. 21). The lower site (Grapes 2) measures flow over a concrete spillway, using the existing structure as the flow control.
Determination of pesticides to be monitored Prior to commencing the sampling the three growers involved with the study were interviewed about pesticide usage on their farms. The pesticide data and environmental information (such as rainfall, irrigation volumes, slope etc.) about each separate site were utilised in the predictive risk assessment tool, Pesticide Impact Rating Index (PIRI), to determine the likelihood of the pesticides used in the three land uses being transported off-site. This data was also used for determining which pesticides would be analysed in the study. For an explanation of PIRI refer to www.csiro.au/piri. The results from the PIRI risk assessment of the chemicals used in 2005/06 are given in Appendix 2.
The pesticides that were assessed by PIRI to pose a Medium or greater risk for transport to surface or ground water or to have a significant toxicological effect on four organisms that are representative of specific levels in the food chain are given in Appendix 2. A selection of pesticides (including some ranked by PIRI to pose a Medium or greater risk of off-site transport) were monitored in surface water samples from the three sites in 2007-2009.

Final report: Minimising agricultural pollution to enhance water quality in Laguna de Bay (Philippines) and Mt Lofty Ranges (Australia)
Page 20
Figure 18. Mt. Lofty Ranges watershed. (from ‘Mt. Lofty Ranges Watershed’ SA EPA).
Figure 19A. Flow meter (on wall), ISCO autosampler and battery supply which were established at every monitoring site; and
Figure 19B. Collection bottles in the autosampler.
A B

Final report: Minimising agricultural pollution to enhance water quality in Laguna de Bay (Philippines) and Mt Lofty Ranges (Australia)
Page 21
Figure 20. The stilling well for the flow meter bubble line and the rectangular weir at the cherries site.
Figure 21. The Odyssey logging capacitance probe (housed within the galvanized pipe) that was a backup for measuring water flow at each site and the rectangular weir with end constrictions.
Analytical Methodology and Calculation of Loads Details of analytical methodology for analyses of pesticides, nutrients and sediment are given in Appendix 3.
Runoff volumes were calculated from water velocity and depth measured using the Doppler flow meter, and cross-sectional area of the open-channel weir (installed at the end of the tail drain) in which the meter was installed.
Amounts (mg) of nutrients, sediment and pesticide leaving each site for the designated time intervals were determined by multiplying concentrations (mg/L) by the total volume (L) of water leaving the site during that time interval. The total volume of runoff water leaving the field over a designated time increment was determined by calculating the area under the hydrograph.
Assessment of chemical use by growers and Chemical Reference Charts A total of 21 growers were interviewed covering four main land uses in the Mt. Lofty Ranges, namely the production of apples, cherries, grapes and pears. A separate assessment of the relative risk of off-site transport of pesticides was made for each individual grower using the tool, Pesticide Impact Rating index (PIRI), and a booklet outlining the findings produced and supplied to each grower.
From the general site and chemical usage information, gathered from the broad cross-section of growers interviewed, scenarios were developed that were representative of the conditions in the Mt. Lofty Ranges and these were run through PIRI. From the results obtained from these scenarios information sheets, called “Chemical Reference Charts”, were produced and distributed to all growers involved in the survey for feedback. Once the format was finalised the “Chemical Reference Charts” will be distributed to growers and other interested stakeholders in the region. These sheets will allow growers to compare the relative risk of off-site transport to surface water of different chemicals in a range of environments that are representative of those in the Mt. Lofty Ranges. An example of the Chart is given below and in Appendix 4.

Final report: Minimising agricultural pollution to enhance water quality in Laguna de Bay (Philippines) and Mt Lofty Ranges (Australia)
Page 22
APPLES (INSECTICIDES) GUIDE FOR PIRI RISK ASSESSMENT OF TRANSPORT OF PESTICIDES TO SURFACE WATER
PESTICIDES Active Rate Frequency SITE SCENARIO ingredient applied of
A B C D E F G H I J K L Active ingredient g/kg L or kg/ha applications Abamectin 18 0.71 1 Azinphos methyl 200 4 2 Carbaryl 500 3 2 Chlorfenapyr 360 0.9 1 Chlorpyrifos 500 1.3 4 Chlorpyrifos 250 2 2 Dimethoate 400 0.375 1 Endosulfan 350 3.42 1 Fenbutatin oxide 550 0.75 2 Fenoxycarb 250 0.8 2 Fenoxycarb 250 0.8 6 Indoxacarb 300 0.75 1 Maldison 1000 1.1 1 Parathion methyl 500 2 1 Pirimicarb 500 1.2 1 Propargite 320 2 2 Propargite 320 6 2 Tau-fluvalinate 250 0.6 2 Thiacloprid 480 0.25 1 This is a guide only and growers should seek additional assistance if further clarification is required. The relative risk will vary as your site and spray conditions change Risk of chemical moving off site to surface water: KEY Copyright and Disclaimer: © 2008 CSIRO To the extent permitted by law, all rights are reserved and no part of this publication covered by copyright may be reproduced or copied in any form or by any means except with the written permission of CSIRO. To the extent permitted by law, CSIRO (including its employees and consultants) excludes all liability to any person for any consequences, including but not limited to all losses, damages, costs, expenses and any other compensation, arising directly or indirectly from using this publication (in part or in whole) and any information or material contained in it.
Low risk Medium risk High risk

Final report: Minimising agricultural pollution to enhance water quality in Laguna de Bay (Philippines) and Mt Lofty Ranges (Australia)
Page 23
6 Achievements against activities and outputs/milestones
Objective 1: To characterize the biophysical and hydrological features of the Pagsanjan-Lumban sub-watershed
no. Activity outputs/ milestones
completion date
comments
1.1 Obtain active engagement of relevant agencies and other stakeholders (LLDA, LGUs, River Councils etc)
Framework for collaboration embodied in an MOA/MOU between LLDA, LGUs and RCs
Launch 11 Sept 2006 Training of UPLB and LLDA staff in auto-sampler and Odyssey loggers March 2007 Training of LGU and RC staff in water collection April 2007
This was extremely successful as indicated by the level of involvement we have with volunteers collecting water samples from the auto-samplers and the involvement of 9 schools in the collection of daily rainfall data.
1.2 Gathering of existing secondary data, ground truthing and mapping of biophysical attributes from various sources in GIS framework
Watershed profile; database and thematic maps in GIS framework
Oct 2009 A compilation of the biopysical attributes of the Pagsanjan-Lumban catchment was contained in a booklet that will also be loaded onto the LLDA website, http://www.llda.gov.ph/aciar.htm
1.3 Water balance and erosion modelling and GIS Mapping
Operational model; Output of the model for various scenarios for use by LLDA, LGUs and RCs
Sediment modelling 16/3 - 3/4 2009 Water balance modelling Nov 2009
Mr Emiterio Hernandez came to Australia from March 16 to April 3, 2009 and worked with Ms Anne Henderson, CSIRO Land and Water, Townsville. During his visit he was trained in using the sediment transport model developed at CSIRO, SedNet, and was able to run the model for the Lucban sub-catchment. A comparison has been made between the Brook and Sacramento (utilised within SedNet) models and validated with the field data from the Lucban sub-catchment.
1.4 Training in the use of GIS and simulation models.
LGUs and RCs to understand and use GIS and the model outputs.
This output was changed and a training course was run in the Philippines in late June/early July 2008 and the general concepts and uses of GIS were covered during this course.
PC = partner country, A = Australia
24
24
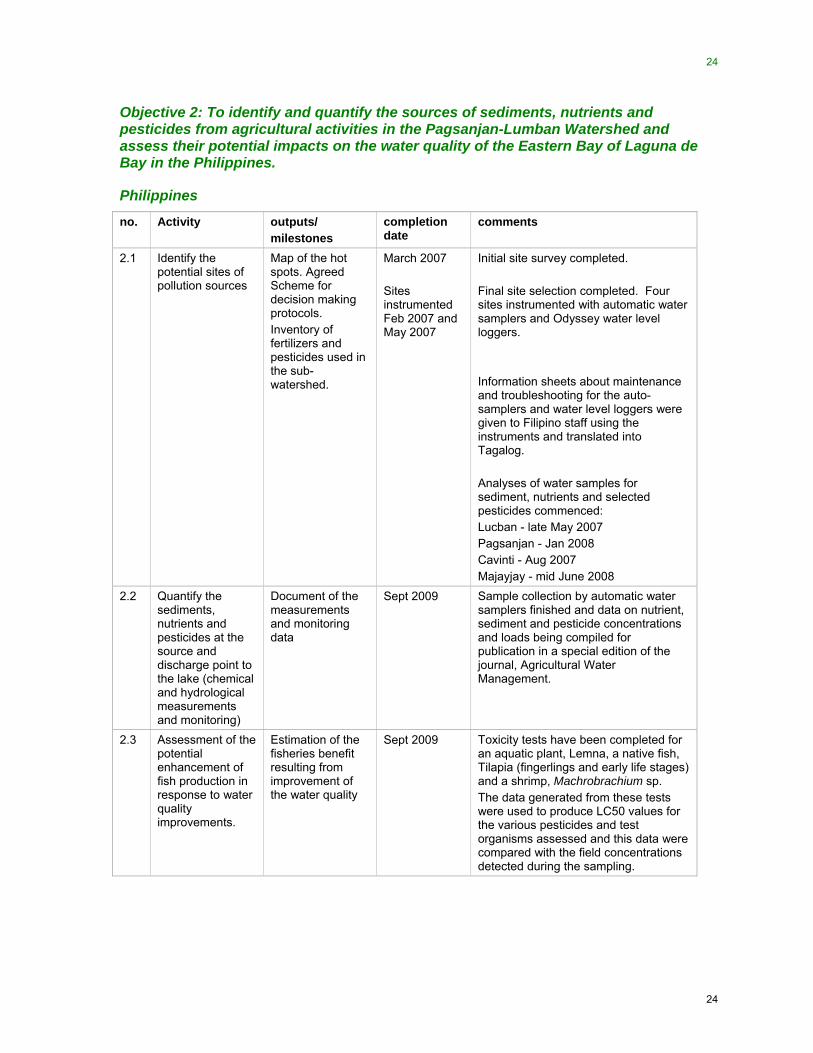
Objective 2: To identify and quantify the sources of sediments, nutrients and pesticides from agricultural activities in the Pagsanjan-Lumban Watershed and assess their potential impacts on the water quality of the Eastern Bay of Laguna de Bay in the Philippines.
Philippines
no. Activity outputs/ milestones
completion date
comments
2.1 Identify the potential sites of pollution sources
Map of the hot spots. Agreed Scheme for decision making protocols. Inventory of fertilizers and pesticides used in the sub-watershed.
March 2007 Sites instrumented Feb 2007 and May 2007
Initial site survey completed. Final site selection completed. Four sites instrumented with automatic water samplers and Odyssey water level loggers. Information sheets about maintenance and troubleshooting for the auto-samplers and water level loggers were given to Filipino staff using the instruments and translated into Tagalog. Analyses of water samples for sediment, nutrients and selected pesticides commenced: Lucban - late May 2007 Pagsanjan - Jan 2008 Cavinti - Aug 2007 Majayjay - mid June 2008
2.2 Quantify the sediments, nutrients and pesticides at the source and discharge point to the lake (chemical and hydrological measurements and monitoring)
Document of the measurements and monitoring data
Sept 2009 Sample collection by automatic water samplers finished and data on nutrient, sediment and pesticide concentrations and loads being compiled for publication in a special edition of the journal, Agricultural Water Management.
2.3 Assessment of the potential enhancement of fish production in response to water quality improvements.
Estimation of the fisheries benefit resulting from improvement of the water quality
Sept 2009 Toxicity tests have been completed for an aquatic plant, Lemna, a native fish, Tilapia (fingerlings and early life stages) and a shrimp, Machrobrachium sp. The data generated from these tests were used to produce LC50 values for the various pesticides and test organisms assessed and this data were compared with the field concentrations detected during the sampling.

25
25
2.4 Integration and Communication of project findings and recommendations
Learning Forum/ Public Disclosure Program
Launch was completed Sept 11 2006. Stakeholders have been trained in water collection and collection of rainfall data (March 2007). Jan 3 2008 2009 Brochures about the project Conference presentations
The workshop and first public meeting was combined. This was attended by the stakeholders who participated in the launch, students from schools involved with rainfall monitoring, and other stakeholders. An article was published in the Laguna Monitor, which is an annual LLDA publication. Environmental Management Workshop for Pagsanjan-Lumban catchment was held at Southern Luzon State University (one of the instrumented sites). This activity was attended by the representative of the Laguna Provincial Environment and Natural Resources Office; Mayors, Municipal Planning and Development Coordinators (MPDCs), Municipal Agriculture Officers (MAOs) and/or Municipal Environment and Natural Resources Officers (MENROs), Sanitation Engineers, Presidents of Association of Barangay Captains of the Municipalities of Majayjay, Magdalena, Luisiana, Cavinti, Pagsanjan, Kalayaan and Lumban in Laguna Province and Lucban, Quezon; as well as the President and other officers of the Pagsanjan-Lumban River Basin Management and Development Foundation, Inc. (PLRBMDFI). Two brochures were written: Monitoring off-site transport of nutrients, sediment and pesticides from cherries, apples and grapes in Mt. Lofty Ranges. http://www.clw.csiro.au/publications/projects/ Minimising agricultural pollution to enhance water quality in Laguna de Bay (Philippines) and the Mt. Lofty Ranges (Australia) http://www.clw.csiro.au/publications/projects/ Bajet, C.M. 2008. Ecotoxicological impact of agricultural contaminants on selected aquatic organisms. Oral paper presented at the 39th Anniversary and Scientific Conference of the Pest Management Council of the Philippines, May 6-9, 2008, Asturias Hotel, Puerto Princesa City Philippines. Cruz, R.V.O. 2009. Minimizing agricultural pollution to enhance water quality in the Laguna de Bay Basin. Oral paper presented at Conference of Environmental Practioners in the Laguna de Bay region "Sustaining Initiatives to Conserve and Protect Laguna de Bay" 7-9 October 2009, Splash Oasis Resort Hotel Los Banos, Laguna Philippines.

26
26
Objective 2: To identify and quantify the sources of sediments, nutrients and pesticides from horticultural activities and assess their potential impacts on the water quality of the in a Lenswood Creek subcatchment in the Mt. Lofty Ranges of South Australia.
Australia
no. activity outputs/ milestones
completion date
comments
2.1 Obtain active engagement of relevant agencies and other stakeholders (Apple & Pear Growers, SA Water, SA EPA-Watershed Protection Office etc)
A collective considered status of the diffuse pollution issues in the selected sub-catchment
A steering committee was established to oversee the project and consisted of representatives of SA EPA, SA Water, Primary Industries SA and Apple & Pear Growers Association and team members.
2.2 Gathering of pesticide use and biophysical data for identification of representative scenarios and modelling
Databases relevant to horticultural industry located in the Lenswood Creek sub-catchment
Mid 2007 Mid 2007
Pesticide use data were gathered through surveys of 21 growers covering four main land uses in the Mt. Lofty Ranges (apples, cherries, grapes and pears). Compilation of data completed in 2007. Modelling scenarios were identified for different land uses covering the wide variety of soil, landscape and environmental conditions associated with the above land uses.
2.3 Quantify the sediments, nutrients and pesticides at the source and discharge point to the Lenswood Creek (chemical and hydrological measurements and monitoring)
Document of the measurements and monitoring data
Late 2006 - Nov 2009
Water samples were analysed for sediment, nutrients and selected pesticides for three years. The results from these findings will be published in a special edition of the journal, Agricultural Water Management.
2.4 Risk Assessment modelling for environmental management
Easy to use “Ready-Reckoners” for growers
2008 Chemical Reference Charts completed in 2008 (Appendix 4) and copies sent to SA Water Corporation and SA EPA.

27
27
2.5 Integration and Communication of project findings and recommendations
Stakeholders workshop Regular update to project steering committee
2009
Results from the first year’s water analyses were presented to the Steering Committee on Aug 17 2007 and to staff from interested SA government agencies and growers on Nov 8 2007. Stakeholder meetings were held regularly to update the committee on the progress of the project. The findings of pesticide transport were also presented at 13th ASE Conference on Toxicants in a Changing Environment in Adelaide, Australia 20-23 September 2009.

28
28
7 Key results and discussion
7.1 Philippines (This was a summary of the data. Results of the studies will be published in a special edition of Agricultural Water Management)
7.1.1 Suspended sediments and nutrient analyses (Dr Pearl Sanchez, Dr Rex Cruz, Mr Hernan Castillo, Prof. Eduardo Paningbatan)
Total Suspended Sediments (TSS). Cavinti, representing coconut plantation, had the lowest mean concentration of TSS throughout the monitoring period followed by Lucban (vegetables), Pagsanjan (rice) and Majayjay (piggeries) (Table 1). Predominant land use upstream of the sampling sites tended to influence TSS concentration. Land under rice (Pagsanjan) contributed more suspended sediments which ranged from 81 to 2396 mg/L as compared to land under coconut in Cavinti (6 to 544 mg/L) and under vegetables in Lucban (13 to 312 mg/L). Very high TSS concentrations were recorded in Majayjay because of the piggery effluents that drain straight into the Initian Creek where the auto-sampler was located.
The Philippines Department of Environment and Natural Resources Administrative Order (DAO) 34 allows no more than 30 mg/L increase for TSS for Class C waters, which are suitable for fishery, recreation and industrial use.
Table 1. Maximum, minimum and mean concentrations of TSS (mg/L) from the 4 sampling sites over the monitoring period (2007-2009). 2007 (July - Dec) 2008 (Jan - Dec) 2009 (Jan - May)
min max mean min max mean min max mean
Cavinti (coconut) 6 111 43 11 544 84 11 187 85
Lucban (vegetables)
13 312 76 14 288 89 18 237 53
Majayjay (piggeries)
- - - 169 3656 1376 12 7728 2518
Pagsanjan (rice) - - - 81 2936 404 198 554 372
Laguna de Bay has been classified as Class C water and TSS limit is 30 mg/L.
Total Kjeldahl Nitrogen (TKN). The same trend as seen with TSS was observed for the mean concentration of TKN. Water samples collected from Cavinti had the lowest mean TKN (0.54 mg/L) followed by Lucban

29
29
(0.81 mg/L), Pagsanjan (1.48 mg/L) and Majayjay (61.38 mg/L) (Table 2). These values exceed the critical level of 0.50 mg/L for eutrophication (Pierzynski, et al. 2005). A mean TKN concentration of 1.10 mg/L was recorded in the eastern bay of Laguna de Bay from 1990 to 1999 (Zafaralla et al., 2005).
Aside from land use, TKN was also influenced by TSS particularly in Pagsanjan in 2008 (Fig. 22) where a positive linear relationship (r2 = 0.94) was obtained (data not shown) and in Lucban in 2007 (r2 = 0.62). At the other sites the relationship between TKN and TSS was not as obvious. Table 2. Maximum, minimum and mean concentrations of TKN (mg/L) from the 4 sampling sites over the monitoring period (2007-2009). 2007 (May-Dec) 2008 (Jan-Dec) 2009 (Jan-May)
min max mean min max mean min max mean
Cavinti (coconut) 0.08 1.30 0.54 0.01 1.50 0.58 0.14 2.43 0.62
Lucban (vegetables)
0.39 3.15 1.20 0.01 2.75 0.94 0.20 2.30 0.81
Majayjay (piggeries)
- - - 32.00 135.00 70.59 0.33 120.40 61.38
Pagsanjan (rice) - - - 0.25 9.63 1.48 0.53 5.30 1.84
Pagsanjan TSS and Total Kjeldahl N
0
2
4
6
8
10
12
15-Ja
n-08
04-F
eb-0
8
03-M
ar-08
28-A
pr-08
06-M
ay-0
8
02-Ju
n-08
09-Ju
l-08
04-A
ug-0
8
01-S
ep-0
8
06-O
ct-08
03-N
ov-0
8
Date of sampling
Tota
l Kje
ldah
l N, m
g L
-1
0
500
1000
1500
2000
2500
3000
3500
Tota
l sus
pend
ed s
olid
s, m
g L-1TKN TSS
Fig. 22. Total Kjeldahl N and total suspended sediments in Pagsanjan water samples in 2008.
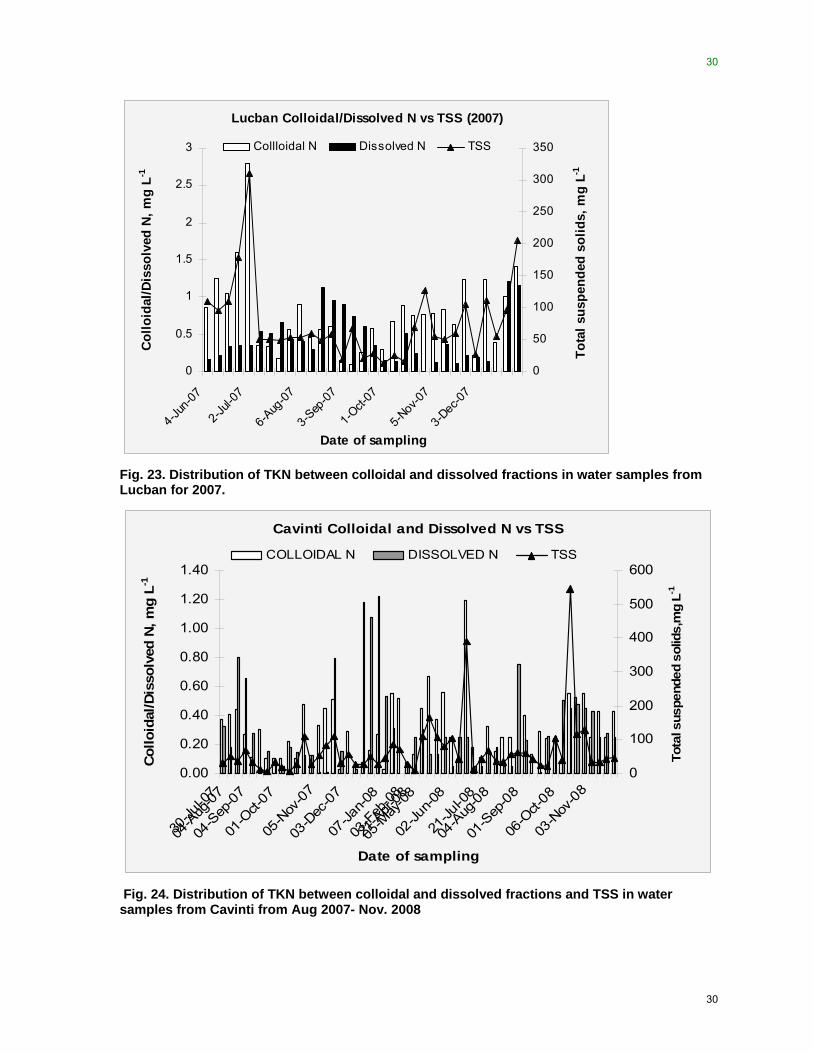
In Lucban, Pagsanjan and Majayjay TKN was generally dominated by the colloidal fraction. An example is shown in Fig. 23. On the average a 50-50% partitioning between colloidal and dissolved fractions was noted in Cavinti (Fig. 24).
30
30
Lucban Colloidal/Dissolved N vs TSS (2007)
0
0.5
1
1.5
2
2.5
3
4-Jun
-07
2-Jul-
07
6-Aug
-07
3-Sep
-07
1-Oct-
07
5-Nov
-07
3-Dec
-07
Date of sampling
Col
loid
al/D
isso
lved
N, m
g L-1
0
50
100
150
200
250
300
350
Tota
l sus
pend
ed s
olid
s, m
g L-1
Collloidal N Dissolved N TSS
Fig. 23. Distribution of TKN between colloidal and dissolved fractions in water samples from Lucban for 2007.
Cavinti Colloidal and Dissolved N vs TSS
0.00
0.20
0.40
0.60
0.80
1.00
1.20
1.40
30-Ju
l-07
04-A
ug-0
7
04-S
ep-0
7
01-O
ct-07
05-N
ov-0
7
03-D
ec-0
7
07-Ja
n-08
03-F
eb-0
8
21-A
pr-08
05-M
ay-0
8
02-Ju
n-08
21-Ju
l-08
04-A
ug-0
8
01-S
ep-0
8
06-O
ct-08
03-N
ov-0
8
Date of sampling
Col
loid
al/D
isso
lved
N, m
g L-1
0
100
200
300
400
500
600
Tota
l sus
pend
ed s
olid
s,m
g L-1
COLLOIDAL N DISSOLVED N TSS
Fig. 24. Distribution of TKN between colloidal and dissolved fractions and TSS in water samples from Cavinti from Aug 2007- Nov. 2008

31
31
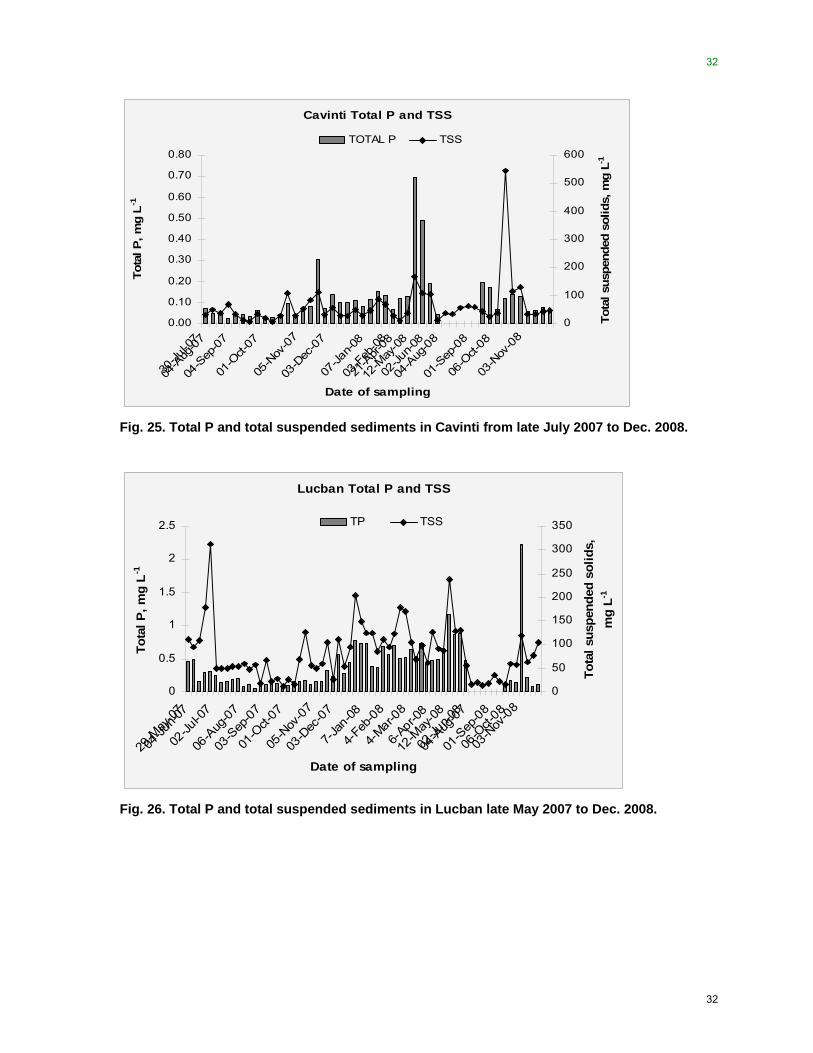
Total Phosphorus (TP). Mean total P concentration was lowest in Cavinti (0.074 mg/L) followed by Lucban (0.132 mg/L), Pagsanjan (0.287 mg/L) and Majayjay (27.56 mg/L) (Table 3). These values are way above the critical level of 0.02 to 0.1 mg/L for algal bloom development (Pierzynski et al., 2005). A stricter criterion of 0.01 mg/L is set by the Department of Environment and Natural Resources for Class C waters like Laguna de Bay. Assessment of water quality in the eastern bay of the Lake from 1990 to 1999 gave a mean TP concentration of 0.23 mg/L (Zafaralla et al. 2005).
Examples of the relationships between TP and TSS are shown for Cavinti and Lucban (Figs. 25 and 26). In Lucban, Cavinti and Pagsanjan TP was predominantly transported off-site in the colloidal fraction (Figs. 27 and 28) while in Majayjay dissolved P was the predominant fraction. Table 3. Maximum, minimum and mean concentrations of total phosphorus (mg/L) from the 4 sampling sites over the monitoring period (2007-2009). 2007 (May-Dec) 2008 (Jan-Dec) 2009 (Jan-May)
min max mean min max mean min max mean
Cavinti (coconut) 0.026 0.306 0.074 0.003 0.693 0.122 0.003 0.440 0.131
Lucban (vegetables)
0.05 0.78 0.23 0.003 2.236 0.462 0.003 0.349 0.132
Majayjay (piggeries)
- - - 0.51 132.57 27.56 0.183 53.95 15.99
Pagsanjan (rice) - - - 0.003 2.432 0.699 0.020 0.696 0.287
At Majayjay water samples only collected June-Nov in 2008.
Laguna de Bay has been classified as Class C water and TP limit is 0.01 mg/L.
32
32
Cavinti Total P and TSS
0.00
0.10
0.20
0.30
0.40
0.50
0.60
0.70
0.80
30-Ju
l-07
04-A
ug-0
7
04-S
ep-0
7
01-O
ct-07
05-N
ov-0
7
03-D
ec-0
7
07-Ja
n-08
03-F
eb-0
8
21-A
pr-08
12-M
ay-0
8
02-Ju
n-08
04-A
ug-0
8
01-S
ep-0
8
06-O
ct-08
03-N
ov-0
8
Date of sampling
Tota
l P, m
g L-1
0
100
200
300
400
500
600
Tota
l sus
pend
ed s
olid
s, m
g L-1
TOTAL P TSS
Fig. 25. Total P and total suspended sediments in Cavinti from late July 2007 to Dec. 2008.
Lucban Total P and TSS
0
0.5
1
1.5
2
2.5
29-M
ay-0
7
04-Ju
n-07
02-Ju
l-07
06-A
ug-0
7
03-S
ep-0
7
01-O
ct-07
05-N
ov-0
7
03-D
ec-0
7
7-Ja
n-08
4-Feb
-08
4-Mar-0
8
6-Apr-0
8
12-M
ay-0
8
02-Ju
n-08
04-A
ug-0
7
01-S
ep-0
8
06-O
ct-08
03-N
ov-0
8
Date of sampling
Tota
l P, m
g L-1
0
50
100
150
200
250
300
350
Tota
l sus
pend
ed s
olid
s,
mg
L-1
TP TSS
Fig. 26. Total P and total suspended sediments in Lucban late May 2007 to Dec. 2008.

33
33
Cavinti Colloidal and Dissolved P vs TSS
0.00
0.10
0.20
0.30
0.40
0.50
0.60
0.70
30-Ju
l-07
04-A
ug-07
04-S
ep-07
01-O
ct-07
05-N
ov-07
03-D
ec-07
07-Ja
n-08
03-Feb
-08
21-A
pr-08
12-M
ay-08
02-Ju
n-08
04-A
ug-08
01-S
ep-08
06-O
ct-08
03-N
ov-08
Date of sampling
Collo
idal
/Dis
solv
ed P
, mg
L-1
0
100
200
300
400
500
600
Tota
l sus
pend
ed s
olid
s, m
g L-1
COLLOIDAL P DISSOLVED P TSS
Fig. 27. Distribution of TP between colloidal and dissolved fractions and TSS
in water samples from Cavinti from late July 2007 to Dec. 2008.
Lucban Colloidal/Dissolved P vs TSS (2008)
0.0
0.2
0.4
0.6
0.8
1.0
1.2
1.4
7-Ja
n-08
4-Fe
b-08
4-Mar-
08
6-Ap
r-08
12-M
ay-0
8
02-Ju
n-08
04-A
ug-07
01-S
ep-08
06-O
ct-08
03-N
ov-08
Date of sampling
Collo
idal
/Dis
solv
ed P
, mg
L-1
0
50
100
150
200
250
Tota
l sus
pend
ed s
olid
s,m
g L-1
Colloidal P Dissolved P TSS
Fig. 28. Distribution of TP between colloidal and dissolved fractions and TSS
in water samples from Lucban for 2008.
Total Organic Carbon (TOC) Total organic carbon (TOC) measurements were made on subset of water samples from mid March to late October 2008. The TOC concentration was lowest in Cavinti (8.11 mg/L),

34
34
followed by Lucban (8.25 mg/L), Pagsanjan (15.95 mg/L) and Majayjay (38.77 mg/L). Colloidal organic C represents the dominant fraction of TOC in all the sites.
Weekly concentrations of TOC were also positively correlated with mean TSS. Regression analysis between TOC and TSS showed positive linear relationships for Cavinti (r2=0.67), for Lucban (r2=0.71) (Fig. 29), for Majayjay (r2=0.81), and for Pagsanjan (r2=0.93) (Fig.30)
Lucban Total Organic C and TSS
0
2
4
6
8
10
12
14
16
18
20
21-A
pr-08
05-M
ay-08
02-Jun
-08
07-Jul-08
04-A
ug-07
01-S
ep-08
Date of sampling
Tota
l org
anic
C, m
g L
-1
0
50
100
150
200
250
300
350
Tota
l sus
pend
ed s
olid
s, m
g L-1
TOC TSS
Fig. 29. Total organic C and total suspended sediment concentrations in Lucban water samples from mid April to mid Oct. 2008.
Pagsanjan Total Organic C and TSS
0.0
10.0
20.0
30.0
40.0
50.0
60.0
24-M
ar-08
06-M
ay-0
8
02-Ju
n-08
09-Ju
l-08
04-A
ug-0
8
02-S
ep-0
8
06-O
ct-08
Date of sampling
Tota
l org
anic
C, m
g L
-1
0
500
1000
1500
2000
2500
3000
3500
Tota
l sus
pend
ed s
olid
s, m
g L-1
Total Organic C TSS
Fig. 30. Total organic C and total suspended sediment concentrations in Pagsanjan water samples from mid March to mid Oct. 2008.
Sediment and Nutrient Loads in Lucban In Lucban, sediment load ranged from 4.8 t/wk (230 tons/y) in 24 Sept '07 to 119.9 t/wk (5755.2 tons/y) in 25 Jun '07. From August '07 to Dec '07, high rainfall generally resulted in lower sediment loads (Fig. 31).

35
35
Lucban Total Weekly Sediment Load and Total Weekly Rainfall
0.0
20.0
40.0
60.0
80.0
100.0
120.0
140.0
4-Ju
n-07
2-Ju
l-07
6-Au
g-07
3-Se
p-07
1-Oct-
07
5-Nov
-07
3-Dec
-07
7-Ja
n-08
4-Fe
b-08
4-Mar-0
8
Date of sampling
Tota
l wee
kly
sedi
men
t loa
d,
tons
0
50
100
150
200
250
300
350
400
450
Tota
l wee
kly
rain
fall,
mm
Total weekly sediment load Total weekly rainfall
Fig. 31. Total weekly sediment load transported at Lucban and total weekly rainfall.
The total N load of Lucban ranged from 156 to 1292 kg/wk or 7488 to 62016 kg/annum, respectively. The same trend as sediment load was observed and a positive correlation (r2= 0.67) between sediment load and nutrient load was obtained (data not shown). A considerable proportion of the total N load is associated with the colloidal fraction (Fig. 32).
Lucban had the lowest total P transported off-site of the 4 monitoring sites and ranged from 19 to 393 kg/wk or 888 to 18871 kg/annum, respectively. A different trend for total P load was observed with higher values apparent from Dec '07 to Mar '08. Total P load also tended to be related to rainfall particularly from mid Jul '07 to Nov '07 (r2=0.69). Most of the total P transported is also associated with the colloidal fraction (Fig. 33).

36
36
Lucban Total Weekly Colloidal/Disolved N load vs Total Weekly Rainfall
0
200
400
600
800
1000
1200
4-Ju
n-07
2-Ju
l-07
6-Au
g-07
3-Se
p-07
1-Oct-
07
5-Nov
-07
3-Dec
-07
7-Ja
n-08
4-Fe
b-08
4-Mar
-08
Date of sampling
Collo
idal
/Dis
solv
ed N
load
, Kg
0
50
100
150
200
250
300
350
400
450
Tota
l wee
kly
rain
fall,
mm
Colloidal N Dissolved N Total weekly rainfall
Fig. 32. Distribution of transported TN between colloidal and dissolved fractions
Lucban Colloidal/Dissolved P Load vs Total Weekly Rainfall
0
50
100
150
200
250
300
350
400
04-Ju
n-07
02-Ju
l-07
06-A
ug-07
03-S
ep-07
01-O
ct-07
05-N
ov-07
03-D
ec-07
7-Jan
-08
4-Feb
-08
4-Mar-0
8
Date of sampling
Col
loid
al P
load
, Kg
0
50
100
150
200
250
300
350
400
450
Tota
l wee
kly
rain
fall,
mm
Colloidal P Dissolved P Total weekly rainfall
Fig. 33. Distribution of transported TP load between colloidal and dissolved fractions

37
37
7.1.2 Survey of pesticide usage (Mr Lorenzo Fabro and Dr Lily Varca)
Lucban, Quezon Pesticide usage by farmers in Barangay Samil, Palola, Igang, Kulapi, and Tinamnan in Lucban , Quezon were gathered during the first quarter of 2007. These barangays are located upstream of the auto-sampler situated at Lucban.
The following crops are grown in these barangays:
rice, tomatoes, stringbeans, bittergourd, raddish, cabbage, coconut, chayote, celery, spinach and coriander.
Rice and coconut are also grown either as a single crop or intercropped with these vegetables. Ornamentals farm were also included in the survey. Pyrethroid- based insecticides such as lambda-cyhalothrin and cypermethrin were used by the majority of the farmers. Other insecticides used were malathion, profenofos, chlorpyrifos and carbaryl. Niclosamide and metaldehyde insecticides were used by rice farmers to control the golden apple snails. Butachlor and 2,4-D herbicides were used to control weeds and were applied once throughout the growing season. Mancozeb and copper based fungicides were used in vegetables. In ornamentals, profenofos and mancozeb were applied every two months.
Most of the farmers were following label recommendations in terms of dose and rate of application (amount of formulation per tank load or number of tablespoon of formulated product per spray load).
In rice, pesticides were applied one to three times per season. In vegetables, lambda-cyhalothrin and cypermethrin insecticides were applied five times and the other insecticides were applied two to four times throughout the cropping season. However there were three farmers who applied lambda-cyhalothrin two to four times weekly to tomatoes and snapbeans, which was equivalent to 25 spray applications in one cropping season.
Pagsanjan, Laguna Farmers from Sampaloc, Pagsanjan, Laguna provinces were interviewed for pesticide usage on irrigated mono-crop low-land rice. All farmers interviewed were using pyrethroid- based insecticides such as lambda- cyhalothrin and cypermethrin. Other insecticides used are carbofuran, endosulfan and a formulated product of BPMC and chlorpyrifos. Niclosamide was applied to control golden apple snails. Butachlor, a pre-emergent herbicide, was applied once per cropping season. Fungicides were not used by these farmers. These pesticides were used according to label recommendations and were sprayed once or twice during the entire growing season. The low usage of pesticides may be attributed to the training of the farmers in Integrated Pest Management practices.
Details from the survey of pesticide usage are given in Appendix 5.
Pesticide analyses (Dr Lily Varca, Mr Lorenzo Fabro, Mr Roman Matias and Ms Recagen Monato, UPLB)
Pesticide analyses were conducted on water samples collected at Lucban and Pagsanjan throughout the monitoring period.

38
38
Lucban
At Lucban (predominantly vegetable production site) water samples were analysed for malathion, cypermethrin, lambda-cyhalothrin and chlorpyrifos and only malathion was found at detectable concentrations. The detection limit for cypermethrin was 0.01 µg/L, for lambda-cyahlothrin was 0.002 µg/L and for chlorpyrifos was 0.04 µg/L. The total (unfiltered) malathion concentration ranged from < 0.1 to 3.5 µg/L (Fig. 35) over the period Dec. 1 2007 to Nov. 2008. Since the rice farms were closer to the sampling location than the vegetable farms it was expected that the rice production was the greater contributor of malathion to the river.
There are currently no environmental guidelines for pesticides in surface water in the Philippines. In Australia the environmental trigger values (µg/L) for malathion for protection of 99% and 95% of species are 0.002 and 0.05, respectively (PIMC/NRMMC, 2000). The USEPA water quality guideline for the protection of freshwater aquatic life for malathion was 0.1 µg/L (USEPA, 1986). This data indicates that during Jan. to mid March and June to mid Nov. 2008 the concentration of malathion in the river exceeded the Australian and the US environmental trigger values.
0.0
0.5
1.0
1.5
2.0
2.5
3.0
12/3
1/07
-1/6
1/7-
13
1/14
-20
1/21
-27
1/28
-2/3
2/4-
10
2/11
-17
2/18
-24
2/25
-3/2
3/3-
9
3/10
-16
3/17
-23
3/24
-30
4/1-
8
4/21
-27
4/28
-5/4
5/5-
11
5/12
-18
5/19
-25
5/26
-6/1
6/16
-22
7/7-
13
7/28
-8/3
9/1-
7
9/29
-10/
5
11/3
-11
SAMPLING DATE
MA
LATH
ION
(ug/
L)
0
50
100
150
200
250
300
350
TSS
(mg/
L)
UNFILTEREDFILTEREDTSS
Fig. 35 Relationship between malathion (µg/L) and total suspended sediment (mg/L) concentration in water from Lucban over the monitoring period December 1 2007 to November 11 2008.
There was no relationship between the malathion concentration in the unfiltered samples and TSS in water collected from Lucban (Fig. 36). Given the water soluble nature of malathion, it is likely that much of malathion is moving in dissolved phase.

39
39
Fig. 36. Regression between malathion and TSS from Lucban.
Pagsanjan
At Pagsanjan (rice) profenofos was detected in water samples ranging in concentration in the unfiltered samples from approximately 1 µg/L to 16 µg/L(Fig. 37) with the highest concentrations being detected from January to mid March 2008. These concentrations seem extremely high and it was thought that this may have been due to the rice fields being prepared for planting during this time or other forms of direct contamination such as washing of equipments. Also, there are usually rodent holes in rice paddies leaking water almost continuously during the spraying operation itself, leaving little opportunities for degradation losses before the pesticide is released into the stream.
Profenofos is highly toxic organophosphate compound but there was no environmental trigger value for freshwater for profenofos in the Philippines or Australia or USA. The drinking water health value in Australia for profenofos was 0.3 µg/L(NHMRC, 2004). Given that drinking water values are considerably higher than environmental guideline values, the concentrations of profenofos detected at Pagsanjan indicate that there would be a high likelihood of a detrimental effect of profenofos on aquatic organisms in the river.
Malathion and chlorpyrifos were also monitored but were not detected at Pagsanjan. There was no relationship between profenofos concentration and TSS concentration (Figs. 38 and 39).
A summary of the concentration data over the sampling period for Lucban and Pagsanjan was given in Tables 4 and 5.
Malathion vs TSS
y = 0.0017x + 0.6761R2 = 0.011
0.0
0.5
1.0
1.5
2.0
2.5
3.0
3.5
0 50 100 150 200 250
TSS (mg/L)
Mal
athi
on (u
g/L)

40
40
0
2
4
6
8
10
12
14
16
18
1/15
-20
1/22
-26,
1/2
9-2/
1
2/2-
5,12
-15
2/18
-22
2/27
-3/1
, 3/4
-7
3/10
-16,
25-
27
4/1-
4, 4
/9-1
0
4/21
-27
4/28
-5/4
5/5-
11
5/13
-18
5/19
-22,
24-
25
5/23
,26-
29
6/16
-22
7/9-
13
7/28
-8/3
9/2-
7
9/5-
10
11/4
-9
SAMPLING DATE
PRO
FEN
OFO
S (u
g/L)
-20
0
20
40
60
80
100
120
140
RA
INFA
LL (m
m)
UNFILTEREDFILTEREDRAINFALL
Fig. 37. Relationship between profenofos (µg/L) concentration and rainfall (mm) at Pagsanjan from January 15 to November 9 2008.
Fig. 38. Relationship between profenofos (µg/L) concentration and total suspended sediment (mg/L) at Pagsanjan from January 15 to November 9 2008.
02
46
810
1214
1618
1/15
-20
1/22
-26,
1/29
-2/1
2/2-
5,12
-15
2/18
-22
2/27
-3/1
,3/
4-7
3/10
-16
,25-
274/
1-4,
4/9
-10
4/21
-27
4/28
-5/4
5/5-
11
5/13
-18
5/19
-22
,24-
25
5/23
,26-
29
6/16
-22
7/9-
13
7/28
-8/3
9/2-
7
9/5-
10
11/4
-9
SAMPLING DATE
PRO
FEN
OFO
S (u
g/L)
0
500
1000
1500
2000
2500
3000
TSS
(mg/
L)
UNFILTEREDFILTEREDTSS

41
41
Fig. 39. Relationship between profenofos concentration and TSS concentration in water samples from Pagsanjan from January 15 to November 9 2008.
Table 4. Summary of malathion concentration (µg/L) measured in Lucban water samples in 2008 and 2009. Year Malathion concentration - Lucban (vegetables)
Minimum Maximum Mean
2008 0.005 3.307 0.849
2009 0.005 0.336 0.113
Table 5. Summary of profenofos concentrations (µg/L)measured in Pagsanjan water samples in 2008 and 2009. Year Profenofos concentration – Pagsanjan (rice)
Minimum Maximum Mean
2008 0.50 15.38 3.89
2009 0.50 0.50 0.50
Profenofos vs TSS
y = -2.79x + 252.34R2 = 0.014
0
3
6
9
12
15
18
0 100 200 300 400 500 600 700
TSS mg / L

42
42
7.1.3 Ecotoxicological testing
Pesticide effects on Machrobrachium sp. (shrimp) The following pesticides were assessed for their ecotoxicological effects on Machrobrachium sp. (shrimp) as measured by mortality after 96h. This is a standard test for relative toxicity of pesticides and the data is commonly used for a range of purposes e.g. risk assessment.
deltamethrin, cypermethrin, lambda cyhalothrin (pyrethroids), malathion, profenofos, chlorpyrifos(organophosphates), butachlor (chloroacetanilide herbicide), carbaryl (carbamates)
An example of the results obtained is shown for profenfos in Fig. 40 and malathion in Fig. 41. The pesticides tested affected shrimp growth in the following decreasing order:
lambda cyhalothrin> deltamethrin> cypermethrin> chlorpyrifos> profenofos> butachlor> carbaryl> malathion.
Fig. 40. Shrimp mortality to different concentrations of profenofos after 96h (ppb=µg/L).

43
43
Fig. 41 Shrimp mortality to different concentrations of malathion after 96h. (ppb = µg/L)
From this data LC50 values (lethal concentration at which 50% of the population is killed) were determined after 24h and 48h (Table 6)
Table 6. LC50 values (µg/L) for different pesticides and Machrobrachium sp. (shrimp) after 24h and 48h. Pesticide LC50 (24h) LC50 (48h)
lambda cyhalothrin
0.012* 0.005*
deltamethrin 0.26* 0.05*
cypermethrin 1.09 1.19
chlorpyrifos 1.71* 0.54*
profenofos 17.67 10.12
butachlor 22.39 8.18
carbaryl 47.98* 27.94*
malathion 1484.02 850.60
2,4 D >100 >100
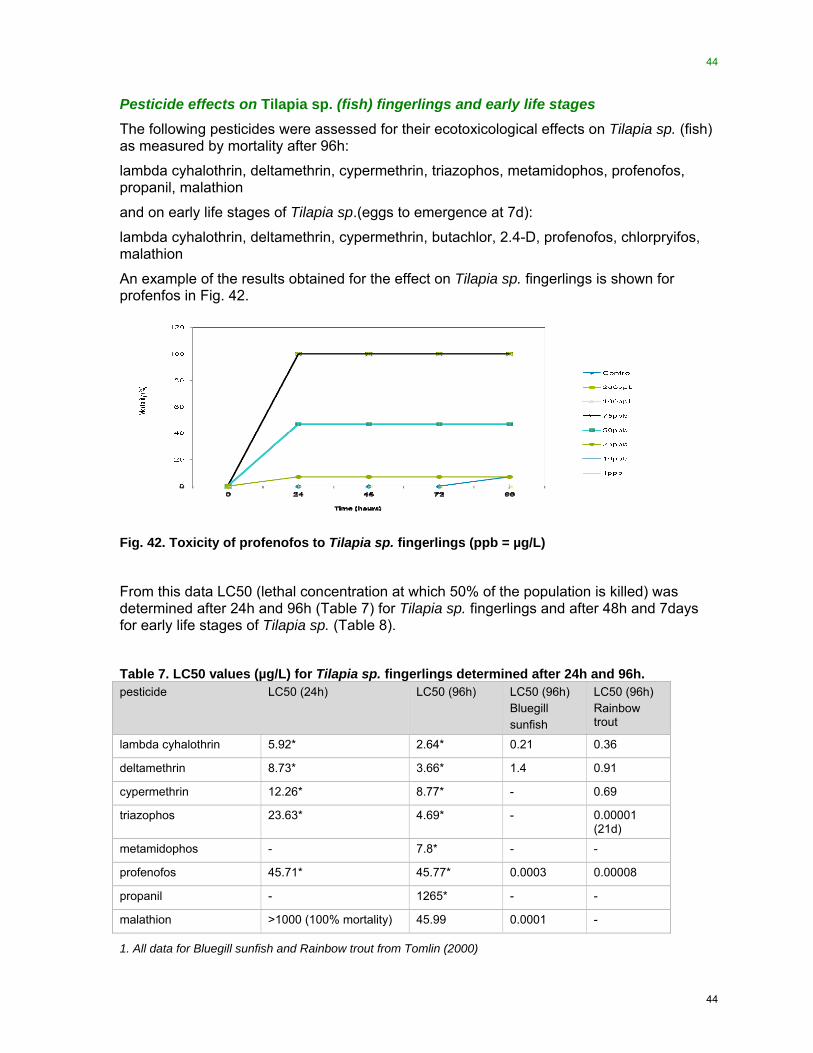
44
44
Pesticide effects on Tilapia sp. (fish) fingerlings and early life stages The following pesticides were assessed for their ecotoxicological effects on Tilapia sp. (fish) as measured by mortality after 96h:
lambda cyhalothrin, deltamethrin, cypermethrin, triazophos, metamidophos, profenofos, propanil, malathion
and on early life stages of Tilapia sp.(eggs to emergence at 7d):
lambda cyhalothrin, deltamethrin, cypermethrin, butachlor, 2.4-D, profenofos, chlorpryifos, malathion
An example of the results obtained for the effect on Tilapia sp. fingerlings is shown for profenfos in Fig. 42.
Fig. 42. Toxicity of profenofos to Tilapia sp. fingerlings (ppb = µg/L)
From this data LC50 (lethal concentration at which 50% of the population is killed) was determined after 24h and 96h (Table 7) for Tilapia sp. fingerlings and after 48h and 7days for early life stages of Tilapia sp. (Table 8).
Table 7. LC50 values (µg/L) for Tilapia sp. fingerlings determined after 24h and 96h. pesticide LC50 (24h) LC50 (96h) LC50 (96h)
Bluegill sunfish
LC50 (96h) Rainbow trout
lambda cyhalothrin 5.92* 2.64* 0.21 0.36
deltamethrin 8.73* 3.66* 1.4 0.91
cypermethrin 12.26* 8.77* - 0.69
triazophos 23.63* 4.69* - 0.00001 (21d)
metamidophos - 7.8* - -
profenofos 45.71* 45.77* 0.0003 0.00008
propanil - 1265* - -
malathion >1000 (100% mortality) 45.99 0.0001 -
1. All data for Bluegill sunfish and Rainbow trout from Tomlin (2000)

45
45
Table 8. LC50 values (µg/L) for early life stages of Tilapia sp. determined after 48h and 7d.
pesticide LC50 48h LC50 7 days
cypermethrin 18 -
lambda cyhalothrin
107 9.11*
deltamethrin 184 17.16*
butachlor 2230 1170*
2,4 D 9490 2580*
profenofos >1500 4332*
chlorpyrifos >1500 4.78*
malathion >100 >100
The pesticides affected Tilapia sp. fingerling survival in the following decreasing order:
lambda cyhalothrin >deltamethrin >cypermethrin >triazophos >metamidophos >profenofos >propanil >malathion
and affected survival of early life stages of Tilapia sp. after 7 days exposure in the following decreasing order:
cypermethrin >butachlor> 2,4-D> profenofos> chlorpyrifos> lambda cyhalothrin > deltamethrin
Pesticide Effects on Lemna Growth The following pesticides were assessed for their effects on Lemna growth as measured by frond production after 7 days:
deltamethrin, cypermethrin, lambda cyhalothrin, malathion, oxadiazon, propanil+butachlor, cyhalofop butyl + penoxulam,metsulfuron methyl + chlorimuron methyl, 2,4 D, profenofos, chlorpyrifos, butachlor
An example of the results obtained is shown for profenfos in Fig. 43.
The EC50, EC20 and EC10 values (effective concentration to affect 50%, 20% and 10% of the population, respectively) of the pesticides tested were calculated based on frond number 7 days after exposure. The insecticides tested affected Lemna frond development after 7 days in the following decreasing order:
deltamethrin>cypermethrin>lambda cyhalothrin >malathion>profenofos>chlorpyrifos (Table 9).
By comparison, the herbicides affected Lemna frond development after 7 days in the following decreasing order:
propanil>oxadiazon> propanil+butachlor>cyhalofop butyl +penoxulam> butachlor> 2,4D>metsulfuron methyl + chlorimuron methyl> MCPA (Table 9)
The effect of profenofos on Chlorella algae (responsible for the primary productivity of the Lake) growth was also measured at a concentration range from 0.01 to 50 mg/L. Results indicate an inhibition up to 2 days with concentrations >5 mg/L but with no effect on growth from 4 days onwards, suggesting a recovery from the initial impact of the pesticide.

46
46
Fig. 43 Effect of different concentrations of profenofos on frond production by duckweed, Lemna sp.
Table 9 EC50 values (mg/L) for duckweed, Lemna sp. Pesticide EC50
deltamethrin 3.26
cypermethrin 4.21
lambda cyhalothrin 5.23
malathion 13.85
profenofos 17.47
chlorpyrifos 21.25*
diuron 0.23*
propanil ~1.00
oxadiazon 1.48
propanil + butachlor 1.56
cyhalofop butyl + penoxulam 2.49
butachlor 5.74*
2,4 D 10.82
metsulfuron + chlorimuron 66.77
MCPA 82.41
Effects of field collected water and sediments on selected aquatic organisms Shrimp (October and December 2008, 3 tests) and Tilapia fingerlings (Feb 2008, 2 tests) had very low survival in field collected water from Majayjay. However, survival increased

47
47
with water quality improvements from dilution up to 75%. Lemna growth was significantly higher with 50% dilution for 3 out of the 13 tests done in 2008-2009. The number of Lemna fronds after 7 days in field collected water from all sites in March 2009 was lowest in Majayjay but increased more than threefold in downstream Balanac. Likewise snails were exposed to Majayjay sediments collected in June 2009 and there was only 45% survival compared to 90-100% other sites.
A comparison was then made with the measured environmental concentrations found in this study with the ecotoxicological impact values (EC50 or LC50 values) derived from the laboratory testing (Table 10). Malathion was not considered to have any ecotoxicological effect at the concentrations detected in the river in this study based on the test organisms assessed. By contrast, the maximum concentrations for profenofos, cypermethrin and lambda cyhalothin detected in the monitoring program are at levels close to the LC50 values derived for shrimp (Table 10). Given that the laboratory test was a 24 hour assessment and that the water samples analysed in this study were composite samples representative of the whole week, and hence the concentrations measured were an average of concentrations during the whole week, it is likely that the concentrations of pesticides exceeded the maximum concentration measured. So any macro invertebrate organisms in the Pagsanjan area that are being exposed to concentrations of these pesticides may be adversly affected. Based on a simple risk assessment procedure by dividing predicted or measured environmental concentration over LC50 values, a value > 1 would be classified as unacceptable risk. Risk classification is moderate to high for profenofos, cypermethrin and lambda cyhalothrin to shrimp based on concentrations detected from current and previous monitoring activities.

48
48
Table 10 Ecotoxicological impact values (EC50 or LC50 values) (µg/L) for the test organisms assessed in the laboratory experiments for four pesticides detected in the rivers in this or earlier studies (i.e. malathion, profenofos, cypermenthrin and lambda cyhalothrin)
Malathion (µg/L) Profenofos (µg/L) Cypermethrin (µg/L)
Lambda cyhalothrin (µg/L)
Duckweed (7d EC50)
13,850 17,470 4210 5230
Shrimps(24h LC50) 1484 17.67 1.09 0.012
Tilapia fingerlings LC50 96h
100% mortality at > 1000 (24-96 h)
45.71 (96h LC50) 75 (100% mortality 24h)
8.77 2.64
Tilapia ELS abnormalities at 1500 (7d)
4330 (7d LC50) <15 no effect 9110
*Solubility in water 145 mg/L 20 mg/L 4 5
Maximum concentration measured in field (µg/L)
3.31 (Lucban 2008)
15.38 (Pagsanjan 2008)
1.02 (Calauan 2002)
0.036 (Lumban 2003)
Average concentration measured in field (µg/L)
0.85 3.89 -- -
Data for cypermethrin and lambda cyhalothrin were obtained from analyses of grab samples taken in a previous ACIAR project.
7.1.4 Sediment transport modelling (Mr Emiterio C. Hernandez, LLDA)
The modelling of sediment transport was done using a GIS-based water quality modelling software package originally developed by CSIRO Land and Water. This model estimates river sediment loads by accounting for the main sources and stores of sediment. It uses a simple annual mean conceptualisation of transport and deposition processes in streams. Spatial patterns of sediment sources, stream loads, and areas of deposition within the system can be produced and the contribution from each watershed to the river mouth can be traced back through the system. A user's guide for SedNet outlines more details (Wilkinson et al., 2004) and the application of SedNet to a sub-catchment was given in Kinsey-Henderson et al. (2003).
The contributions of different forms of erosion in the SedNet model for one river link are conceputalised in Fig. 44.

49
49
Fig. 44. Contributions of different forms of erosion in the SedNet model for one river link.
The model also determines a hill slope erosion grid for the catchments based on the Revised Universal Soil Loss Equation where:
Soil Loss (tons/ha/yr) = R * K * L * S * C * P
R was the rainfall erosivity,
K was the soil erodibility factor,
L and S are the hillslope length and slope factors, respectively,
C represents crop cover factor.
The landuse practice factor, P was not used.
The average sediment erosion in the catchment was determined by the model to be about 68.5 tons/ha per year, with high erosion values visible in steep slopes.
The land use grids for the catchment was based on vegetation cover classified from SPOT5 imagery taken in 2003 and the land use cover was used to assign a C factor, which was an assigned value for soil loss that was relative to soil loss from a freshly tilled or bare soil which has a C factor of 1. The estimated C factors used in the model for different land uses are given in Table 11. Table 11. Estimated C factors used in SedNet for the land use covers in the Pagsanjan-Lumban catchment ID Percent of
catchment area Description C factor Remarks
1 55.44 Plantation 0.1 Coconut with tree, annual crops for intercrops
2 2.90 Marshy/ water bodies
0.5 River wash
3 29.04 Grassland/ bushland
0.3 Moderately grazed and occasionally burned
4 8.86 Arable 0.4 Representative of annual cash crops
5 1.5 Built-up 0.2 Built-up rural areas with home gardens
6 2.27 Forest 0.003 Second growth forest with good undergrowth

50
50
The total sediment supply from the Pagsanjan River basin was predicted to be about 231,000 tons/yr or an average of about 8.30 tons/ha per year and shown diagrammatically in Fig. 45. The main source of sediment supply was predicted to be from hill slope erosion which accounted for 85% of the total sediment supply. Bank erosion and gully erosion were predicted to contribute only 14% and 1% respectively, of the sediment delivered to the streams.
Of the 231.2 kt/yr sediment load exported to the lake, almost 70% was predicted to come from the sub-catchment draining into the Balanac River, which covers 62% of the total area modelled. Bombongan River sub-catchment was predicted to contribute about 23% (53.6 kt/yr) and the remaining 7% was predicted to come from the sediment loads coming from the sub-catchments downstream of these two river systems (Table 12).
The modelling suggests that the sub-catchment of Balanac River should be given priority to reduce the sediment loads from Pagsanjan.
Fig. 45. Total sediment supply from the Pagsanjan-Lumban catchment as predicted by the SedNet model.

51
51
Table 12. Estimated sediment supply consisting of deposition and export from different sub-catchments within the Pagsanjan-Lumban catchment as determined by the SedNet model. Pagsanjan
Outlet Balanac River Bombongan
River Lucban Site Cavinti Site
Area (square km)
277.8 172.6 75.4 36.0 25.9
Total sediment supply (kt/y)
231.2 161.2 53.6 27.9 17.8
Total Deposition (kt/y)
3.8 2.2 0.8 0 0.2
Total export (kt/y)
227.4 159.1 52.8 27.9 17.6
Mean annual flow ML/y
628,247 400,242 174,440 89,518 61,585
Suspended sediment yield (T/y)
209,865 146,622 48,096 27,828 16,921
Average concentration (mg/L)
334 366 276 311 275
A comparison of the predicted average concentration of TSS (mg/L) predicted by SedNet was shown in Fig. 46 with the average (+ standard deviation) concentrations of sediment concentrations measured in the study at Cavinti from July to November 2008, at Lucban from June 2007 to November 2008 and at the Pagsanjan outlet which was long term data from LLDA from January 1997 to July 2008.
Fig. 46. Concentration of TSS (mg/L) predicted by SedNet and the average (+ standard deviation) concentrations of sediment concentrations measured in the study at Cavinti from July to November 2008, at Lucban from June 2007 to November 2008 and at the Pagsanjan outlet which was long term data from LLDA from January 1997 to July 2008.
275.0311.0
334.0
68.683.5
15.4
0.0
100.0
200.0
300.0
400.0
500.0
600.0
Cavinti Lucban Pagsanjan Outlet
TSS
(mg/
L)
SedNet Result Mean
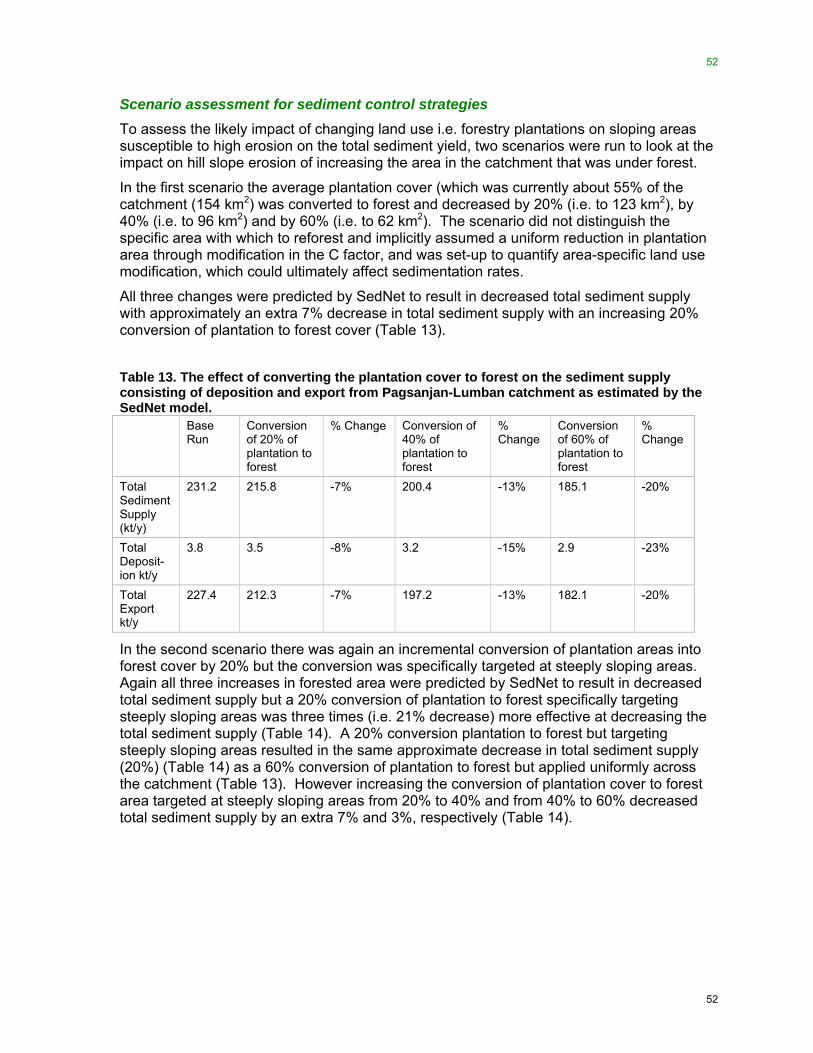
52
52
Scenario assessment for sediment control strategies To assess the likely impact of changing land use i.e. forestry plantations on sloping areas susceptible to high erosion on the total sediment yield, two scenarios were run to look at the impact on hill slope erosion of increasing the area in the catchment that was under forest.
In the first scenario the average plantation cover (which was currently about 55% of the catchment (154 km2) was converted to forest and decreased by 20% (i.e. to 123 km2), by 40% (i.e. to 96 km2) and by 60% (i.e. to 62 km2). The scenario did not distinguish the specific area with which to reforest and implicitly assumed a uniform reduction in plantation area through modification in the C factor, and was set-up to quantify area-specific land use modification, which could ultimately affect sedimentation rates.
All three changes were predicted by SedNet to result in decreased total sediment supply with approximately an extra 7% decrease in total sediment supply with an increasing 20% conversion of plantation to forest cover (Table 13).
Table 13. The effect of converting the plantation cover to forest on the sediment supply consisting of deposition and export from Pagsanjan-Lumban catchment as estimated by the SedNet model. Base
Run Conversion of 20% of plantation to forest
% Change Conversion of 40% of plantation to forest
% Change
Conversion of 60% of plantation to forest
% Change
Total Sediment Supply (kt/y)
231.2 215.8 -7% 200.4 -13% 185.1 -20%
Total Deposit-ion kt/y
3.8 3.5 -8% 3.2 -15% 2.9 -23%
Total Export kt/y
227.4 212.3 -7% 197.2 -13% 182.1 -20%
In the second scenario there was again an incremental conversion of plantation areas into forest cover by 20% but the conversion was specifically targeted at steeply sloping areas. Again all three increases in forested area were predicted by SedNet to result in decreased total sediment supply but a 20% conversion of plantation to forest specifically targeting steeply sloping areas was three times (i.e. 21% decrease) more effective at decreasing the total sediment supply (Table 14). A 20% conversion plantation to forest but targeting steeply sloping areas resulted in the same approximate decrease in total sediment supply (20%) (Table 14) as a 60% conversion of plantation to forest but applied uniformly across the catchment (Table 13). However increasing the conversion of plantation cover to forest area targeted at steeply sloping areas from 20% to 40% and from 40% to 60% decreased total sediment supply by an extra 7% and 3%, respectively (Table 14).

53
53
Table 14. The effect of converting the plantation cover to forest on the sediment supply consisting of deposition and export from Pagsanjan-Lumban catchment as estimated by the SedNet model. In this scenario the conversion specifically targeted steeply sloping areas. Base
Run Conversion of 20% of plantation to forest
% Change Conversion of 40% of plantation to forest
% Change
Conversion of 60% of plantation to forest
% Change
Total Sediment Supply (kt/y)
231.2 183.2 -21% 167.5 -28% 160.1 -31%
Total Deposit-ion kt/y
3.8 2.9 -23% 2.6 -31% 2.5 -35%
Total Export kt/y
227.4 180.3 -21% 164.9 -27% 157.6 -31%
Although SedNet was a useful tool for investigating the effects of various changes in land use in the catchment on sediment transport the estimate of sediment load was probably a bit low. Sediment loads during typhoon events could be significant and presently this data was completely lacking. Also the SedNet model requires much more input information than was currently available for the study area and all the scenarios are sensitive to the choice of C factor (represents soil loss) and estimates had to be made that do not necessarily reflect the complexities of land use sufficiently.
The model output should be treated with caution under the present conditions of relatively poor information but as more information becomes available, repeated simulations may produce better sediment estimates.
The SedNet work presented here represents an important incremental step towards better knowledge and documentation of the sedimentation processes of the area.
7.1.5 Water balance modelling Tthe streamflows in 3 major sub-watersheds in the Pagsanjan-Lumban watershed were estimated using the BROOK Hydrologic Model (Federer and Lash, 1978) which is briefly described below. The BROOK Model was used in consideration of the satisfactory performance of the model in estimating streamflows in some watersheds in the Philippines (Daño, 1994 and Combalicer et al., In press).
The BROOK 5 Hydrologic Model is a lumped parameter model that uses physically - based equations for predicting hydrologic processes. At each time step, mass conservation is accounted for by:
dS = (I-O) dt (1)
where s represents the storages, I the inputs, O the outputs and t the time step. The storages, inputs and outputs are in mm. The model calculates for the various processes and storages using the equations below.
The potential evapotranspiration is calculated by an equation described by Hamon (1963) as:
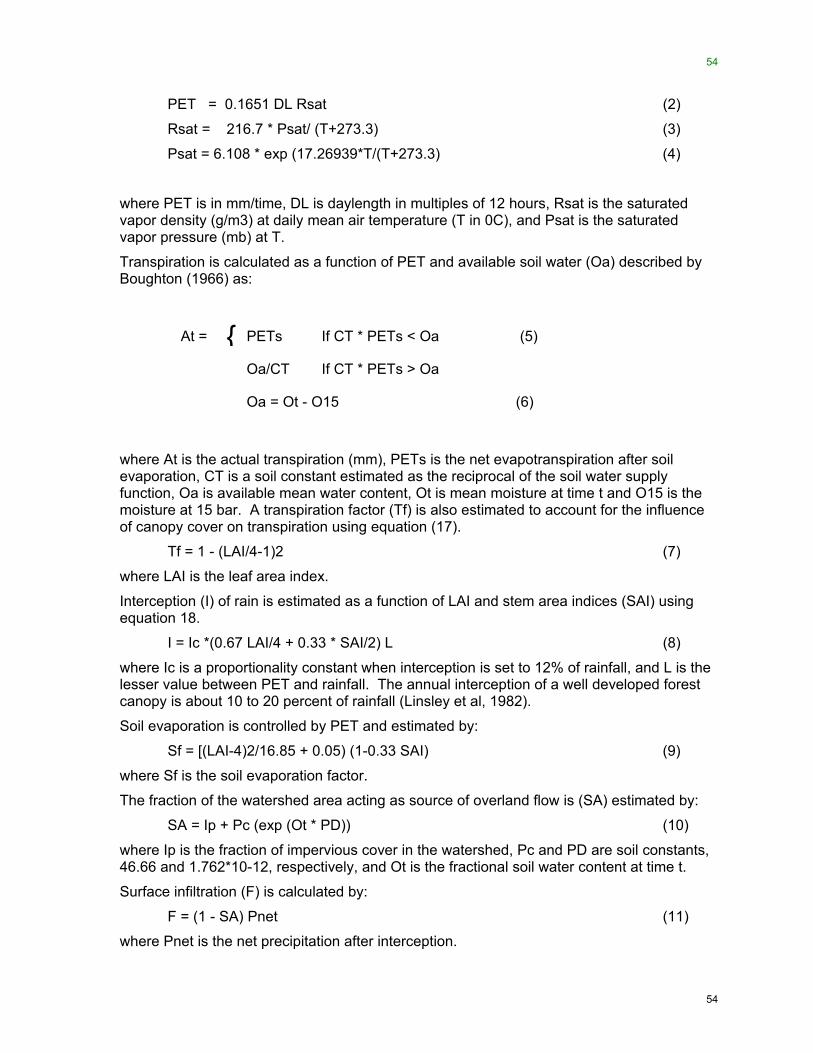
54
54
PET = 0.1651 DL Rsat (2)
Rsat = 216.7 * Psat/ (T+273.3) (3)
Psat = 6.108 * exp (17.26939*T/(T+273.3) (4)
where PET is in mm/time, DL is daylength in multiples of 12 hours, Rsat is the saturated vapor density (g/m3) at daily mean air temperature (T in 0C), and Psat is the saturated vapor pressure (mb) at T.
Transpiration is calculated as a function of PET and available soil water (Oa) described by Boughton (1966) as:
At = PETs If CT * PETs < Oa (5)
Oa/CT If CT * PETs > Oa
Oa = Ot - O15 (6)
where At is the actual transpiration (mm), PETs is the net evapotranspiration after soil evaporation, CT is a soil constant estimated as the reciprocal of the soil water supply function, Oa is available mean water content, Ot is mean moisture at time t and O15 is the moisture at 15 bar. A transpiration factor (Tf) is also estimated to account for the influence of canopy cover on transpiration using equation (17).
Tf = 1 - (LAI/4-1)2 (7)
where LAI is the leaf area index.
Interception (I) of rain is estimated as a function of LAI and stem area indices (SAI) using equation 18.
I = Ic *(0.67 LAI/4 + 0.33 * SAI/2) L (8)
where Ic is a proportionality constant when interception is set to 12% of rainfall, and L is the lesser value between PET and rainfall. The annual interception of a well developed forest canopy is about 10 to 20 percent of rainfall (Linsley et al, 1982).
Soil evaporation is controlled by PET and estimated by:
Sf = [(LAI-4)2/16.85 + 0.05) (1-0.33 SAI) (9)
where Sf is the soil evaporation factor.
The fraction of the watershed area acting as source of overland flow is (SA) estimated by:
SA = Ip + Pc (exp (Ot * PD)) (10)
where Ip is the fraction of impervious cover in the watershed, Pc and PD are soil constants, 46.66 and 1.762*10-12, respectively, and Ot is the fractional soil water content at time t.
Surface infiltration (F) is calculated by:
F = (1 - SA) Pnet (11)
where Pnet is the net precipitation after interception.
{
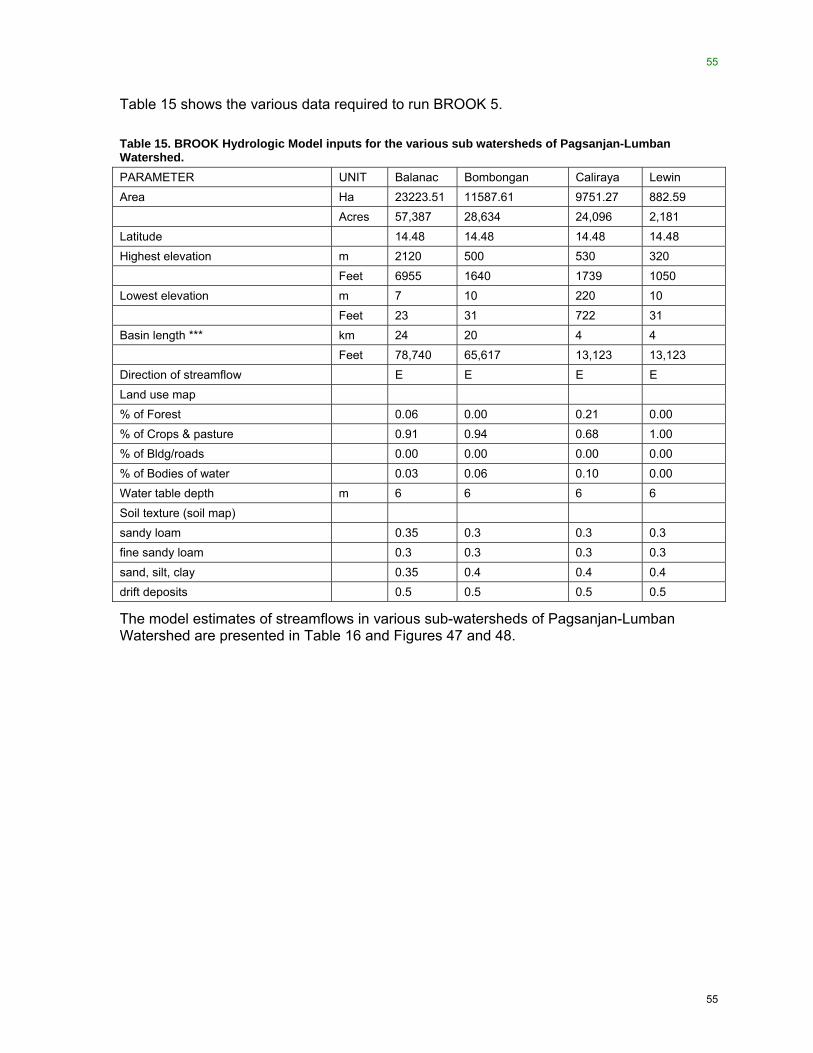
55
55
Table 15 shows the various data required to run BROOK 5. Table 15. BROOK Hydrologic Model inputs for the various sub watersheds of Pagsanjan-Lumban Watershed. PARAMETER UNIT Balanac Bombongan Caliraya Lewin Area Ha 23223.51 11587.61 9751.27 882.59 Acres 57,387 28,634 24,096 2,181 Latitude 14.48 14.48 14.48 14.48 Highest elevation m 2120 500 530 320 Feet 6955 1640 1739 1050 Lowest elevation m 7 10 220 10 Feet 23 31 722 31 Basin length *** km 24 20 4 4 Feet 78,740 65,617 13,123 13,123 Direction of streamflow E E E E Land use map % of Forest 0.06 0.00 0.21 0.00 % of Crops & pasture 0.91 0.94 0.68 1.00 % of Bldg/roads 0.00 0.00 0.00 0.00 % of Bodies of water 0.03 0.06 0.10 0.00 Water table depth m 6 6 6 6 Soil texture (soil map) sandy loam 0.35 0.3 0.3 0.3 fine sandy loam 0.3 0.3 0.3 0.3 sand, silt, clay 0.35 0.4 0.4 0.4 drift deposits 0.5 0.5 0.5 0.5
The model estimates of streamflows in various sub-watersheds of Pagsanjan-Lumban Watershed are presented in Table 16 and Figures 47 and 48.

56
56
Table 16. BROOK model estimates of streamflows in Pagsanjan-Lumban Sub-Watersheds.
Month Balanac Subwatershed Bombongan Subwatershed Caliraya Subwatershed
mm MCM m3/s mm MCM m3/s mm MCM m3/s JUN 334.7 90.8 35.0 87.9 23.8 9.2 83.5 22.6 8.7
JUL 272.8 74.0 28.5 100.3 27.2 10.5 90.0 24.4 9.4
AUG 546.8 148.3 57.2 232.3 63.0 24.3 208.3 56.5 21.8
SEP 501.9 136.1 52.5 218.6 59.3 22.9 216.2 58.6 22.6
OCT 666.2 180.7 69.7 372.6 101.1 39.0 359.2 97.4 37.6 NOV 768.5 208.5 80.4 575.3 156.1 60.2 570.6 154.8 59.7 DEC 743.2 201.6 77.8 476.5 129.3 49.9 469.1 127.2 49.1 JAN 507.1 137.5 53.1 176.0 47.7 18.4 182.2 49.4 19.1 FEB 324.8 88.1 34.0 148.2 40.2 15.5 143.7 39.0 15.0 MAR 335.1 90.9 35.1 104.7 28.4 11.0 101.0 27.4 10.6 APR 289.6 78.6 30.3 67.6 18.3 7.1 66.5 18.0 7.0 MAY 312.1 84.7 32.7 66.6 18.1 7.0 66.8 18.1 7.0 Average 466.9 126.6 48.9 218.9 59.4 22.9 213.1 57.8 22.3
Fig. 47. Streamflow estimates for sub-watersheds of Pagsanjan-Lumban Watershed using BROOK Model.

57
57
Fig. 48. Monthly streamflow estimates for sub-watersheds of Pagsanjan-Lumban Watershed using BROOK Model.
Based on the results above, the streamflow in Balanac sub-watershed is largest among the 3 sub-watersheds that is largely due to the greater rainfall data (from SLSU station) that was used for Balanac watershed.
7.2 Australia
7.2.1 Suspended sediments and nutrient analyses (Dr. Jim Cox and Mr Nigel Fleming)
Flow volumes The highest flow as percent of rainfall at all 3 sites occurred in 2008 (Table 17) and of all three sites the highest flow in each year (as a percent of rainfall) was from the cherries site. However, the most persistent flow of surface water was measured at the apples site and it is from this site that the most samples were collected.

58
58
Table 17. Total annual flow volumes (kL) leaving the monitoring sites Apples Cherries Grapes 1 Grapes 2 Year Flow (kL) %
annual rain
Flow (kL) % annual rain
Flow (kL) % annual rain
Flow (kL) % annual rain
2006* 98,972.4 24 4,339.1 8 - - - - 2007 61,385.2 13 15,897.8 25 15,762.2 2 7,352.8 1 2008 114,441.5 26 21,849.5 38 9,703.9 2 26,788.9 4
* Instrumentation installed in July; no flow at Grapes site until 2007.
Grapes 1 = auto-sampler above the dam and Grapes 2 = auto-sampler at dam outlet.
Total Suspended Sediment (TSS) The highest TSS concentrations measured were 7,162 mg/L at the commencement of flow in 2008 (when groundcover would have been very sparse) at the apples site, 369 mg/L in 2007 at the cherries site and 1489 mg/L in 2007 at the upper grapes site. However, the average total suspended sediment (TSS) concentration was highest at the upper grapes site in 2007 (152 mg/L) and 2008 (164 mg/L) (Table 18). The average TSS concentration in 2007 in drainage water leaving the dam at the grapes site (lower grapes site) was considerably lower than what entered the dam, indicating that the dam located between the two auto-samplers was effectively decreasing the sediment load transported off-site. Generally the TSS concentrations at the start of the season (approximately April-May) were highest when groundcover was sparse. There was a clear positive relationship between flow and TSS. As flow commences and peaks, TSS concentrations increase and peak in unison. Once flow declines TSS concentrations rapidly decline and remain low.
Table 18 . Maximum, minimum and mean concentrations of total suspended sediments (TSS) (mg/L) from the 4 sampling sites over the monitoring period (2006-2008). 2006 (Jul-Dec) 2007 (Jan-Dec) 2008 (Jan-Dec)
min max mean min max mean min max mean
Apples bdl* 77.5 3.65 bdl 1127 34.87 152.54 7162.5 68.97
Cherries bdl 3.0 1.46 bdl 369.4 17.03 bdl 87.07 6.21
Grapes 1 - - - 17.3 1489 152.23 31.06 421.82 164.25
Grapes 2 - - - 11.4 76.2 37.23 10.24 54.81 40.5
* below detection limit of 0.1 mg/L

59
59
Total Nitrogen (TN) The maximum concentration of TN was 37 mg/L (2008) at the apples site, 85 mg/L (2007) at the cherries site and 22 mg/L (2007) at the upper grapes site (Table 19). The trigger value for TN in fresh water for protecting 95% of species is 1.0 mg/L (PIMC/NRMMC, 2000) and this was exceeded in 16%, 28% and 69% of samples analysed in 2006, 2007 and 2008, respectively at the apples site. At the cherries and upper grapes site the trigger value for TN in fresh water was exceeded in 100% of samples analysed.
Total nitrogen (TN) behaved similarly to TSS (and not TP) at the start of the flow event i.e. TN increases as flow increases. However, unlike TSS the concentrations can remain high when flow declines.
Table 19 . Maximum, minimum and mean concentrations of total nitrogen (TN) (mg/L) from the 4 sampling sites over the monitoring period (2006-2008). 2006 (Jul-Dec) 2007 (Jan-Dec) 2008 (Jan-Dec)
min max mean min max mean min max mean
Apples 0.39 1.8 0.73 bdl* 6.31 2.66 0.46 37.07 6.5
Cherries 1.8 20.61 6.59 1.27 84.7 5.43 7.11 47.79 15.22
Grapes 1 - - - 2.15 22.0 5.15 3.38 8.96 6.07
Grapes 2 - - - 1.6 27 2.65 3.6 8.55 5.34
* below detection limit of 0.1 mg/L
Total Phosphorus (TP) The maximum concentration of TP at the apples site was 0.50 mg/L (2008), 1.27 mg/L (2007) and 1.0 mg/L (2008) at the upper grapes site (Table 20). The trigger value for TP is 0.1 mg/L (PIMC/NRMMC, 2000) and this was exceeded in 0% (all below detection limit), 16% and 3% (the other samples were below the detection limit) of samples analysed in 2006, 2007 and 2008 respectively from the apples site. At the cherries site the trigger value for TP was exceeded in 0% (all below detection limit), 6% (all other samples below detection limit) and 8% (all other samples below detection limit) of samples analysed in 2006, 2007 and 2008 respectively. At the upper grapes site the trigger value for TP was exceeded in 97% and 0% (all samples below detection limit) of samples analysed in 2007 and 2008, respectively.
The TP concentrations can be very high at the start of a flow event early in the season but rapidly decline as flow increases. Concentrations are lowest when flow peaks and remain low as flow declines.
In general, the soluble fraction (<0.45 µm) dominated the transport process for all nutrients. However, at times colloidal P (≥0.45 µm) was greater than soluble P. An example of the form in which total P was moving off-site from the apples site is given in Fig. 49.

60
60
Table 20. Maximum, minimum and mean concentrations of total phosphorus (TP) (mg/L) from the 4 sampling sites over the monitoring period (2006-2008). 2006 (Jul-Dec) 2007 (Jan-Dec) 2008 (Jan-Dec)
min max mean min max mean min max Mean
Apples bdl* bdl bdl bdl 0.17 0.04 bdl 0.5 0.06
Cherries bdl bdl bdl bdl 1.27 0.06 bdl 0.33 0.06
Grapes 1 - - - bdl 0.44 0.29 0.25 1.0 0.54
Grapes 2 - - - bdl 0.31 0.17 bdl 0.5 0.41
* below detection limit of 0.02 mg/L
Apples Total P
0
0.02
0.04
0.06
0.08
0.1
0.12
29/07 1:15
29/07 4:41
29/07 6:16
29/07 6:59
29/07 7:24
29/07 7:47
29/07 8:13
29/07 8:39
29/07 9:08
29/07 9:39
29/07 10:15
Date and time
conc
entra
tion
mg/
L
0
20
40
60
80
100
120
140
TSS
mg/
L
Colloidal (>0.45 um)Soluble (< 0.45 um)TSS
Fig. 49 . An example of the form of phosphorus moving off-site during a runoff event in July 29 2007.

61
61
Total OC The maximum concentration of non-purgeable organic carbon (NPOC) 106.5 mg/L (2008) at the apples site, 216.8 mg/L (2007) at the cherries site and 99.3 mg/L (2007) at the upper grapes site (Table 21). Table 21 . Maximum, minimum and mean concentrations of non-purgeable organic carbon (NPOC) (mg/L) from the 4 sampling sites over the monitoring period (2006-2008). 2006 (Jul-Dec) 2007 (Jan-Dec) 2008 (Jan-Dec)
min max mean min max mean min max mean
Apples 2.57 6.84 3.54 0.21 25.45 5.15 0.35 106.47 19.0
Cherries 2.8 54.68 15.58 0.19 216.8 7.19 0.05 84.48 6.95
Grapes 1 - - - 15.96 99.3 23.51 14.12 47.42 27.27
Grapes 2 - - - 9.7 68.7 13.35 15.03 47.48 22.78
7.2.2 Pesticide analyses (Ms. Danni Oliver, Ms Jenny Anderson and Dr. Rai Kookana)
A range of pesticides were detected in surface water draining from the apples and cherries sites but very few were detected from the grapes site. This was also related to the low flow volumes and a limited number of water samples collected from the grapes site.
The mode of off-site transport of the pesticides varied between pesticides. For example fenarimol, which was detected in water draining from the apples site in 2007, 2008 and 2009, moved off-site predominantly in the soluble phase (Fig. 50).
Fig. 50. Proportion of fenarimol in the colloidal (>1.2µm) and soluble (<1.2µm) fractions in water samples collected in May 2007 from the apples site.
Fenarimol May 2007 Apples
0
0.5
1
1.5
2
2.5
3
3.5
7/0517:35
31/0510:56
31/0512:09
31/0512:39
31/0513:17
31/0513:37
31/0513:56
31/0514:44
31/0518:09
1/065:40
1/066:17
1/066:52
Date and time
conc
entra
tion
ug/L
0
20
40
60
80
100
120
140
160
180
TSS
mg/
L
colloidal (>1.2um)soluble (<1.2um)TSS

62
62
In 2007 and 2009 concentrations of fenarimol were at times above the Australian drinking water guideline (DWG) (1 ug/L) (NHMRC, 2004). There are currently no Australian environmental guidelines for fenarimol but if the DWG was being exceeded then the environmental guideline would also be exceeded.
By contrast, chlorpyrifos moved both in the colloidal (>1.2µm) and soluble (<1.2µm) fractions (Fig. 51).
Fig. 51. Proportion of chlorpyrifos in the colloidal (>1.2µm) and soluble (<1.2µm) fractions in water samples collected in May 2007 from the apples site.
Chlorpyrifos was consistently detected in water samples for extended periods of time: May-Aug 2007; June-Sept 2008; May-July 2009. The concentrations of chlorpyrifos detected at times exceeded the Australian environmental trigger value to protect 95% of species (0.01 ug/L) (PIMC/NRMMC, 2000).
Other pesticides moved off-site predominantly associated with colloids. An example of this was propiconazole (Fig 52). It was only detected 6 times in 2007 but exceeded DW guideline (0.1 µg/L) (NHMRC, 2004). There was no Australian environmental guideline value for this pesticide.
Chlorpyrifos May 2007 Apples
0
0.05
0.1
0.15
0.2
0.25
7/0517:35
31/0510:56
31/0512:09
31/0512:39
31/0513:17
31/0513:37
31/0513:56
31/0514:44
31/0518:09
1/065:40
1/066:17
1/066:52
Date and time
conc
entr
atio
n ug
/L
0
20
40
60
80
100
120
140
160
180
TSS
mg/
L
colloidal (>1.2um)soluble (<1.2um)TSS

63
63
Figure 52. Proportion of propiconazole in the total (ie unfiltered) and soluble (<1.2µm) fractions in water samples collected in April 2007 from the cherries site.
The loads detected and what the loads represent as a percentage of the applied chemical was given for the pesticides detected in surface water leaving the apples site (Table 22) and the cherries site (Table 23). Table 22. Loads of pesticides in surface water draining the apples site in 2006-2008. Year Pesticide Load (g) Amount applied in
field (g) % of pesticide applied
2006 Carbaryl 0.393 4890 0.008%
Fenarimol 0.136 316 0.04%
2007 Azinphos methyl
5.254 11944 (in 2005/06 season)
0.04%
Fenarimol 12.49 630 2.00%
Chlorpyrifos 1.236 10440 0.01%
2008 Azinphos methyl1
0.104 Not applied
Carbaryl1 1.865 6140 0.03%
Fenarimol1 3.124 1890 0.17%
Chlorpyrifos 0.208 18190 0.001%
Bupirimate 0.232 1500 0.02%
Penconazole 0.760 560 0.14%
Propiconazole 2007 Cherries site
0
0.05
0.1
0.15
0.2
0.25
28 Apr15:36
28 Apr16:12
28 Apr18:24
28 Apr19:49
28 Apr20:41
3 May21:29
Date and time
conc
ug/
LUnfiltered (colloidal+soluble)
Filtered ( <1.2 um)
DW guideline value(0.1 ug/L)

64
64
Table 23. Loads of pesticides in surface water draining the cherries site in 2007-2008. Pesticide Detected
Load (g) Amounts applied in field (g)
% of pesticide applied
2007 Procymidone 0.099 1079 (applied Nov ’05) 0.01%
Pirimicarb 0.317 2015 0.02%
Propiconazole 0.043 510 0.01%
Chlorpyrifos None detected
845 -
2008 Procymidone 0.114 Not applied -
Pirimicarb 0.130 1190 0.01%
Propiconazole Negligible amounts detected
715 -
Chlorpyrifos None detected
560 -

65
65
8 Impacts
8.1 Scientific impacts – now and in 5 years
8.1.1 Philippines As can be seen from the preceding sections that a large volume of data on sediments, nutrients and pesticides have been gathered from different land uses in the Pagsanjan-Lumban sub-catchment of the Laguna de Bay. This is the first data set of its kind in the agricultural sub-catchments of the Laguna Lake. It addresses an important data gap that was identified by LLDA, crucial for lake water quality prediction.
The nutrient and TSS data collected from this study represent a large data set obtained over an extended time period in a tropical region. The data has provided some useful insights into the mode of transport of nutrients in some agricultural sub catchments. Especially at the Lucban and Pagsanjan (Salasad Creek) sites, for which the data was most comprehensive, where a significant correlation between sediment load and nutrient load has been established. These observations provide invaluable information about the mode of transport of sediment, nitrogen and phosphorus from different land uses and loads of these contaminants arising from different land uses. While data on pesticides was considerably less, the study has highlighted that some pesticides are migrating off-site at concentrations that are ecologically relevant. The ecotoxicological studies have provided basic science data as LC50 values for a range of commonly used pesticides for a number of local species of fish, invertebrates, and base of food chain (Lemna and algae). This data would help carry out risk assessment based on locally generated data to identify which pesticides pose the greatest problem with regard to off-site transport to surface water. It is expected that the data set would prove to be an excellent resource for future workers in the study catchment as well as provide guidance on the remaining agricultural catchments supplying water to Laguna Lake.
8.1.2 Australia Similarly, the nutrient, TSS and pesticide data generated from this study has highlighted the role soil colloids play in off-site migration of nutrients and several pesticides. An important finding has been that phosphorus was being transported predominantly in a soluble phase and not attached to colloidal material, the latter being the generally accepted wisdom. Also, consistently over a period of three years a number of pesticides have been detected in the runoff water. The detection of fenarimol and chlorpyrifos in particular for extended time periods (months) has implications for recommendations about allowed number of applications of these pesticides in a season and this information will be provided to the Australian Pesticides and Veterinary Medicines Authority who review application guidelines for pesticides.
These findings have major implications for mitigation strategies that may be considered in the future. The project has already provided information about which pesticides are more likely to be transported off-site and this data has been supplied to SA Water Corporation to enable them to include those higher risk pesticides (with respect to transport to surface water) in the suite of chemicals in their routine monitoring program. The mitigation and
66
66
management strategies that growers can possibly implement in the Mt. Lofty Ranges are being discussed.
The results of this study would be published as a special issue of the Journal Agricultural Water Management, which would prove an excellent repository of data and information not only for the potential scientific applications in the agricultural catchments of Laguna de Bay or Mount Lofty ranges but also to the global scientific community working in similar situations.
8.2 Capacity impacts – now and in 5 years
8.2.1 Philippines
Knowledge and skills development This project has raised the skills and capabilities of the LLDA and UPLB staff in a number of areas but more specifically
− to operate and maintain the instrumentation (auto-samplers and water level loggers),
− to measure water flow, and to develop flow rating curves,
− to measure nutrients, suspended sediments and pesticides,
− to model sediment transport and water balance,
− to understand the impact of agricultural activities on the river water quality and the Laguna Lake,
− in linking with the stakeholders and community in the catchment.
With partial funding support from the Crawford Fund a training course on Measuring Water Quality and Quantity was organised in the Philippines from June 30 to July 4 2008. The topics covered included hydrology, environmental chemistry of contaminants and hands-on sessions using a range of tools and monitoring kits.
This activity has enhanced the level of understanding of hydrological processes, fate and behaviour of nutrients, sediment and pesticides in the environment and GIS capabilities. The academic staff from the Southern Luzon State University (SLSU) particularly benefitted by the "Training the Trainer" approach of this workshop.
In addition Dr Pearl Sanchez (UPLB) visited Australia and carried out data analysis in CSIRO laboratories. Mr Emil Hernandez (LLDA) visited CSIRO (Townsville) and received training on modelling of sediment transport through SedNet, a model developed at CSIRO. This model will be used in the future in other catchments around Lake Laguna to evaluate the effect of changes in land use activities on sediment transport.
The preparation of the data from this project for publication in a special edition of the journal, Agricultural Water Management, will develop communication and writing skills of the staff involved and further develop cross-organisational links between LLDA and UPLB since a couple of papers are jointly authored.
Equipment
The following equipment was sourced and given to the Filipino team for this project:
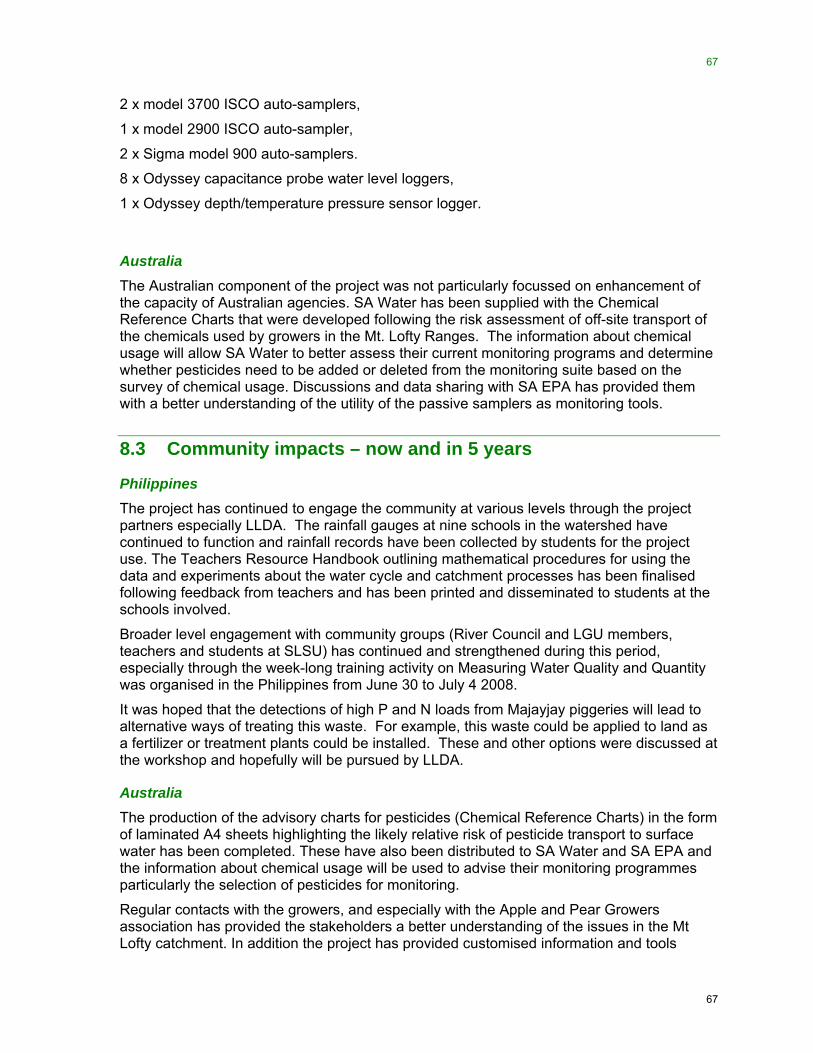
67
67
2 x model 3700 ISCO auto-samplers,
1 x model 2900 ISCO auto-sampler,
2 x Sigma model 900 auto-samplers.
8 x Odyssey capacitance probe water level loggers,
1 x Odyssey depth/temperature pressure sensor logger.
Australia The Australian component of the project was not particularly focussed on enhancement of the capacity of Australian agencies. SA Water has been supplied with the Chemical Reference Charts that were developed following the risk assessment of off-site transport of the chemicals used by growers in the Mt. Lofty Ranges. The information about chemical usage will allow SA Water to better assess their current monitoring programs and determine whether pesticides need to be added or deleted from the monitoring suite based on the survey of chemical usage. Discussions and data sharing with SA EPA has provided them with a better understanding of the utility of the passive samplers as monitoring tools.
8.3 Community impacts – now and in 5 years
Philippines The project has continued to engage the community at various levels through the project partners especially LLDA. The rainfall gauges at nine schools in the watershed have continued to function and rainfall records have been collected by students for the project use. The Teachers Resource Handbook outlining mathematical procedures for using the data and experiments about the water cycle and catchment processes has been finalised following feedback from teachers and has been printed and disseminated to students at the schools involved.
Broader level engagement with community groups (River Council and LGU members, teachers and students at SLSU) has continued and strengthened during this period, especially through the week-long training activity on Measuring Water Quality and Quantity was organised in the Philippines from June 30 to July 4 2008.
It was hoped that the detections of high P and N loads from Majayjay piggeries will lead to alternative ways of treating this waste. For example, this waste could be applied to land as a fertilizer or treatment plants could be installed. These and other options were discussed at the workshop and hopefully will be pursued by LLDA.
Australia The production of the advisory charts for pesticides (Chemical Reference Charts) in the form of laminated A4 sheets highlighting the likely relative risk of pesticide transport to surface water has been completed. These have also been distributed to SA Water and SA EPA and the information about chemical usage will be used to advise their monitoring programmes particularly the selection of pesticides for monitoring.
Regular contacts with the growers, and especially with the Apple and Pear Growers association has provided the stakeholders a better understanding of the issues in the Mt Lofty catchment. In addition the project has provided customised information and tools

68
68
(Reference Charts) to assist the growers in the Mt Lofty Ranges in making the safer choices of pesticide products.
8.3.1 Economic impacts The economic impact from the project are difficult to discern at this stage, since at this stage the project focussed on better characterisation of the issues and understanding on pollution sources, rather than finding solutions. Nevertheless the project findings would pave the way for targeted solutions. Considerable economic benefits are expected to flow at several points through improved management of sediments at sources. These include prevention of productive soil loss, improved stream performance, the improved stream water quality and ecological benefits, the sedimentations of lakes and reservoirs (e.g. used for power generation and recreation) and most importantly the lake water quality, aquaculture and water quality improvements both through reduced turbidity as well as reduction in contaminants associated with colloids.
An attempt was made to estimate the economic gain to be achieved via fish production as a result of improving water quality in the lake. It is assumed that by minimising the impact of sediments, nutrients and pesticides, fish productivity could be enhanced by xxxx % (appendix xxx). Considering the total value of aquaculture in Laguna de Bay being $xxxx , a gain in the order of xxxx dollars is estimated. This can however, only be realised when the mitigation strategies are implemented.
The project has made a significant contribution towards the sustainability of horticulture in the Mt Lofty ranges (total value multiplied by a %) and minimising the impact on water quality in the drinking water catchment. A direct estimate of improvement of water quality in dollar terms is not feasible. However, an indicative gain can be discerned from the following example from another drinking water reservoir the Mt Lofty Ranges. In 1992, SA Water used activated carbon in the treatment of potable water from the Warren Reservoir after this was contaminated with atrazine (reported to have derived from forestry areas). At an additional treatment cost of between 1 and 2 million dollars, this example is indicative of the significant costs involved in the treatment of potable water supplies contaminated by agricultural chemicals. An avoidance of similar incident due to enhanced awareness of the issues in the study area could potential resources in the same similar order.
8.3.2 Social impacts
Philippines The involvements of the broader community, especially schools and school children, in the collection of rainfall data has not only enhanced the awareness of community about the issues of water quality but has provided an opportunity for community members to make a hands-on contribution to the project. Despite the fact that the impacts are not easy to measure such involvement was known to contribute towards alleviating the community concerns about the environment and a sense of satisfaction in making a contribution to enhance environmental quality.
The development of the Teachers Resource Handbook was extremely well received and will provide a valuable teaching tool for the students and teachers in the area and will continue well beyond the project.

69
69
Australia By addressing the key areas of water quality concern the project has provided crucial assessment on the sources of the pollution in the Mt Lofty catchments. This information would provide much needed relief to some growers (e.g grapes) and will address anxiety. The growers who participated in this project (not only those who provided sites but who participated in surveys) are now using the guidance material with confidence. This is expected to have desirable positive social impact on the individual involved and the community as a whole.
8.3.3 Environmental impacts
Philippines The sediment data and modelling has highlighted the areas that make relatively higher contribution of sediment load to the river and eventually Laguna de Bay. This information guides the intervention efforts for future. Furthermore, the modelling has helped make an assessment of the likely gain by implementing some mitigation strategies on the susceptible areas.
The project has undoubtedly a positive impact on the environment and there are no adverse impacts on the environment due to the project activities. The involvement of community volunteers and the involvement of River Council and LGU staff in the collection of water samples from the auto-sampler have resulted in a greater appreciation of water quality issues in the sub-catchment. While the project has continued to raise the awareness of stakeholders about the environmental issues associated with Pagsanjan-Lumban sub-catchment, an evaluation of the measurable environmental impacts was yet to be carried out.
Australia The project findings have regularly been shared with the resource managers (SA Water) and regulators (SA EPA) together with Apple and Pear Grower Association to highlight the issue and nature and extent of environmental impact of nutrient and pesticides in the study area in the Mt. Lofty Ranges. Individual growers have been provided with the assessment of potential risks on pesticide use at their sites. Furthermore, the Chemical Reference Charts showing likely relative risk of pesticide transport to surface water would provide further positive impact on environment in due course.
8.4 Communication and dissemination activities
Philippines The following presentations have been made at conferences:
Bajet, C.M. 2008. Ecotoxicological impact of agricultural contaminants on selected aquatic organisms. Oral paper presented at the 39th Anniversary and Scientific Conference of the Pest Management Council of the Philippines, May 6-9, 2008, Asturias Hotel, Puerto Princesa City Philippines.
70
70
Cruz, R.V.O. 2009. Minimizing agricultural pollution to enhance water quality in the Laguna de Bay Basin. Oral paper presented at Conference of Environmental Practicioners in the Laguna de Bay region "Sustaining Initiatives to Conserve and Protect Laguna de Bay" 7-9 October 2009, Splash Oasis Resort Hotel Los Banos, Laguna Philippines.
The project findings have been communicated through Laguna de Bay Environment Monitor, which was an annual publication of the LLDA in partnership with the Federation of River Basin Councils in the Laguna de Bay Region, Inc. and it serves as a report of the LLDA to all its stakeholders. This publication was usually distributed during the Annual Learning Forum where all stakeholders of the Laguna de Bay were present and also made available at the LLDA website. A specific article on the project was intended for publication in the next issue of Laguna Monitor.
An article titled 'Information flows for water-wise farmers' was also written for the ACIAR Partners magazine.
http://www.aciar.gov.au/publication/PMgMar-Jun09
An environmental management workshop for Pagsanjan-Lumban catchment was held at Southern Luzon State University (one of the instrumented sites). This activity was attended by the representative of the Laguna Provincial Environment and Natural Resources Office; Mayors, Municipal Planning and Development Coordinators (MPDCs), Municipal Agriculture Officers (MAOs) and/or Municipal Environment and Natural Resources Officers (MENROs), Sanitation Engineers, Presidents of Association of Barangay Captains of the Municipalities of Majayjay, Magdalena, Luisiana, Cavinti, Pagsanjan, Kalayaan and Lumban in Laguna Province and Lucban, Quezon; as well as the President and other officers of the Pagsanjan-Lumban River Basin Management and Development Foundation, Inc. (PLRBMDFI).
http://www.llda.gov.ph/aciar_trainings_envtlmgt.htm
Australia There has been a lot of interest expressed in the “Chemical Reference Charts” that were developed for 4 main land uses in the Mt. Lofty Ranges namely, apples, pears, grapes and cherries. The horticulture industry through AusVeg has been approached about the potential development of similar reference charts in the main vegetable growing industries in Australia. The Queensland DENR has also expressed interest in these charts for use in catchments that drain into the Great Barrier Reef region.
Results from the first year’s water analyses were presented to the Steering Committee on Aug 17 2007 and to staff from interested SA government agencies (including SA Water, SA EPA, SA Department of Water, Land and Biodiversity) and growers on Nov 8 2007.
Results of pesticide transport at the three sites were presented at the following conference:
Oliver, D.P., Rai Kookana, Jim Cox, Nigel Fleming, Jenny Anderson and Lester Smith (2009) 'Mode of off-site transport of pesticides from three land uses in the Mt. Lofty Ranges, South Australia.' 13th ASE Conference on Toxicants in a Changing Environment in Adelaide, Australia 20-23 September 2009.

71
71
9 Conclusions and recommendations
9.1 Conclusions The project has been successful in producing a large volume of data on sediments, nutrients and pesticides from different land uses in the Pagsanjan-Lumban sub-catchment of the Laguna de Bay in the Philippines and the Mt Lofty Ranges in Australia. In Philippines, this is the first data set of its kind in the agricultural sub-catchments of the Laguna Lake and it addresses an important data gap that was identified by LLDA, crucial for lake water quality prediction. The key conclusions drawn from the data are as follows
9.1.1 Philippines • At the four sampling sites in the Philippines the maximum and annual average
concentrations (mg/L) of total suspended solids (TSS), total nitrogen (TKN) and total phosphorus (TP) in decreasing order were found at:
Majayjay (piggeries)>Pagsanjan (rice) > Lucban (vegetables) > Cavinti (coconut)
• The mean values for TKN and TP were above the critical level for algal bloom development (Pierzynski et al., 2005) (0.5 and 0.03 mg/L, respectively) and the criterion set by the Department of Environment and Natural Resources for Class C waters like Laguna de Bay (1.10 and 0.01 mg/L, respectively).
• Of the pesticides monitored only malathion was detected at Lucban and profenofos at Pagsanjan. At times the concentration of malathion in the river exceeded the Australian and the US environmental trigger values. The concentrations of profenofos at Pagsanjan also exceeded Australian drinking water guidelines (and hence any environmental guideline would also be exceeded).
• Ecotoxicological data (EC50 or LC50 values) on a range of pesticides were generated. (EC50 or LC50 values). The pesticides tested affected shrimp growth in the following decreasing order:
lambda cyhalothrin> deltamethrin> cypermethrin> chlorpyrifos> profenofos> butachlor> carbaryl> malathion.
• A comparison of the measured environmental concentrations found in this study with the ecotoxicological impact values (EC50 or LC50 values) found the maximum concentrations for profenofos detected in the field are at levels close to the LC50 values derived for shrimp.
• SedNet, a sediment transport model, predicted 231.2 kt/yr sediment load was exported to the lake with the majority coming from the sub-catchment draining into the Balanac River, suggesting that this area be targeted for mitigation. SedNet predicted that a 20% conversion of plantation to forest uniformly across the catchment would decrease the total sediment supply by 7% but if the conversion to forest targeted steeply sloping areas then the decrease in sediment supply increased to 20%.
This work will provide field data to justify the need to find alternative strategies for dealing with piggery waste at Majayjay and data to validate the models that currently used for predicting loads of sediment and volumes of water moving into the lake from the catchment. Future work needs to be done to investigate mitigation strategies.

72
72
9.1.2 Australia The data obtained from monitoring sites in Australia represent the upstream conditions, very close to source of contaminants and the implications for the main stream ecosystem is not clear. The following observations are based on data obtained at source.
• Nutrients were detected at concentrations exceeding current Australian freshwater trigger values. Total nitrogen concentrations exceeded the environmental trigger value for South Australian rivers (i.e. 1 mg/L) for a significant number of samples from the apples site and 100% of the samples from the cherries and grapes sites. Total phosphorus concentrations exceeded the environmental trigger value for South Australian rivers for > 15% of samples from the apples and cherries sites but >60% of samples from the grapes site.
• Phosphorus was found to move predominantly in a soluble phase, which was contrary to current accepted wisdom. Data from this study about mode of off-site transport will also be instrumental in guiding mitigation strategies to be implemented.
• This study has shown detectable levels of several pesticides in water draining various land uses. It was noted that while some pesticides move off-site predominantly in a soluble phase (e.g. the fungicide fenarimol at the apples site) others move off-site predominantly associated with colloidal material (e.g. propiconazole at the cherries site). In some cases it has been found that the pathways by which pesticides are transported off-site vary and depend on the time of sampling during a rainfall event or the time of the year (e.g. the insecticide chlorpyrifos at the apples site).
• The duration of detections of pesticides in water varied between chemicals. Some chemicals were found to be detected for only a short period of time and generally in the first runoff event of the year (e.g. carbaryl at the apples site) while other chemicals were detected in water samples for several months, which was particularly noticeable for chlorpyrifos.
• Various pesticides were detected in surface water but two in particular, fenarimol and chlorpyrifos, were detected either for extended periods of time or at levels exceeding Australian drinking water guidelines.
This study will provide valuable data for monitoring agencies (e.g. SA Water or SA EPA) to compare their monitoring data from the main streams in the catchment as well as align the pesticides monitored with those being used in the field. The regulatory agencies (APVMA) may utilise the data to change regulations about frequency of applications of chemicals within a season.
9.2 Recommendations
9.2.1 Philippines The effluent draining from the piggeries at Majayjay is a major source of TSS, nitrogen and phosphorus pollution and alternative methods of disposing of this waste need to be found. There have been some suggestions that this waste could be used as a fertiliser but the practicalities and economics of this need to be established.

73
73
Alternative pesticides to malathion and profenofos should be investigated given that the concentrations in the river systems exceeded environmental guidelines from overseas and exceeded the LC50 value derived for shrimp.
The feasibility of reforestation of plantation areas, particularly on steeply sloped areas, needs to be investigated since the modelling indicates that this strategy could significantly decrease sediment load in the catchment.
The paucity of continuous rainfall data is a major limitation for any modelling work in the area so the establishment and maintenance of weather stations should be encouraged.
The monitoring of the water quality in the Pagsanjan-Lumban catchment should continue to supplement and confirm the findings in this project. The areas identified in this project as "hot spots" should be the focus of future research and developmental efforts. The effort should be directed upstream of the monitoring points in Lucban (vegetables) and Pagsanjan (Rice) to better understand the extent of pollution arising from on-farm activities and a link with management practices be developed.
A study should be carried out to establish the en-route attenuation of sediments, nutrients and pesticides from source to the mouth of the Pagsanjan river.
Similar studies should be initiated in other catchments of Laguna de Bay
9.2.2 Australia SA Water or SA EPA should compare their monitoring data from this project with the data from the main streams in the catchment to fully assess the implications of the findings.
This information about the mode of off-site transport from these sites will assist in the development of mitigation strategies to improve water quality. Further work now needs to be done to develop strategies for minimizing off-site transport of both colloidal-bound and soluble contaminants and evaluating their efficacy.
Where practicable, an alternative chemical to chlorpyrifos should be found, or at least the number of applications within a season should be decreased, given its high toxicity and the long period over which it was detected in surface water from the apples site.
Where practicable, an alternative chemical to fenarimol should be found, given the frequency that detections exceeded drinking water guidelines.
Growers in the Mt Lofty Ranges should be further supported in their efforts to implement Environmental Management Systems by adopting tools such as the Reference Charts produced in this and a closely related project.

74
74
10 References
10.1 References cited in report Dano, A. M. (1994). Effects of Land Use Change on Soil Characteristics and Hydrology of Experimental Watershed in Angat, Bulacan. Unpublished Ph D Dissertation, Graduate School, University of the Philippines Los Baños, College, Laguna.
Federer, C. A. and D. Lash (1978). BROOK: A hydrologic simulation model for eastern forest. Water Resources Research Center, University of New Hampshire.
Kinsey-Henderson A., Prosser I., Post D., (2003), “SubNet – Predicting Sources of Sediment at Sub-catchment Scale Using SedNet”. In: Proceedings of the MODSIM Conference, Townsville, QLD, Australia 2003, 590-595.
National Health and Medical Research Council (NHMRC) (2004) Australian Drinking Water Guidelines Chapter 10 (accessed Nov 2009)
http://www.nhmrc.gov.au/publications/synopses/eh19syn.htm#sec
Pierzynski GM, Thomas Sims J, Vance GF (2005) Soils and Environmental Quality. 3rd edition. CRC Press Boca Raton Fl USA.
Primary Industries Ministerial Council (PIMC) Natural Resource Management Ministerial Council (NRMMC) (2000) Australian and New Zealand Guidelines for Fresh and Marine Water Quality.
http://www.mincos.gov.au/publications/australian_and_new_zealand_guidelines_for_fresh_and_marine_water_quality (accessed Nov 2009)
USEPA (1986) Quality criteria for water.
http://www.epa.gov/waterscience/criteria/library/goldbook.pdf (accessed Nov 2009)
Wilkinson S., Henderson A., Chen Y., Sherman B., (2004). “SedNet user guide”. Client Report, CSIRO Land and Water; Canberra.
10.2 List of publications produced by project
General Workbook to be used in conjunction with the collection of rainfall data.
http://www.llda.gov.ph/aciar.htm.
Brochure about the Mt. Lofty work:
Monitoring off-site transport of nutrients, sediment and pesticides from cherries, apples and grapes in Mt. Lofty Ranges.
http://www.clw.csiro.au/publications/projects/
Brochure about the Philippines work:

75
75
Minimising agricultural pollution to enhance water quality in Laguna de Bay (Philippines) and the Mt. Lofty Ranges (Australia)
http://www.clw.csiro.au/publications/projects/
Conference Presentations Bajet, C.M. 2008. Ecotoxicological impact of agricultural contaminants on selected aquatic organisms. Oral paper presented at the 39th Anniversary and Scientific Conference of the Pest Management Council of the Philippines, May 6-9, 2008, Asturias Hotel, Puerto Princesa City Philippines.
Cruz, R.V.O. 2009. Minimizing agricultural pollution to enhance water quality in the Laguna de Bay Basin. Oral paper presented at Conference of Environmental Practioners in the Laguna de Bay region "Sustaining Initiatives to Conserve and Protect Laguna de Bay" 7-9 October 2009, Splash Oasis Resort Hotel Los Banos, Laguna Philippines.
Oliver, D.P., Rai Kookana, Jim Cox, Nigel Fleming, Jenny Anderson and Lester Smith (2009) 'Mode of off-site transport of pesticides from three land uses in the Mt. Lofty Ranges, South Australia.' 13th ASE Conference on Toxicants in a Changing Environment in Adelaide, Australia 20-23 September 2009.
Sanchez, P., Castillo, H., Cruz, R.V., Kookana, R. and Oliver, D. (2010). Nutrient transport from various agricultural sources in the Pagsanjan-Lumban watershed in Laguna de Bay, Philippines. 19th World Congress of Soil Science: Soil Solutions for a Changing World, 1-6 August 2010 Brisbane, Australia.
Manuscripts Agricultural Water Management has agreed to the publication of a special edition of the journal with manuscripts from the ACIAR project. The planned manuscripts are:
1. Introduction about site selection and biophysical properties of Pagsanjan-Lumban catchment.
2. Water balance modelling, comparison of Brook and Sacramento models and validation with field data.
3. Modelling sediment transport using SedNet in Lucban sub-catchment.
4. Nutrient transport in the Pagsanjan-Lumban catchment.
5. Mode of off-site transport of nutrients in the Pagsanjan-Lumban catchment.
6. Survey of pesticide usage in the main land uses in the Pagsanjan-Lumban catchment.
7. Pesticide transport in the Pagsanjan-Lumban catchment.
8. Ecotoxicological results from Lemna tests
9. Summary of ecotoxicological results
10. Nutrient transport in Mt. Lofty Ranges
11. Mode of off-site transport of nutrients in Mt. Lofty Ranges.
12. Pesticide transport in Mt. Lofty Ranges.
13. Mode of off-site transport of pesticides in Mt. Lofty Ranges.
14. Summary/conclusion paper.
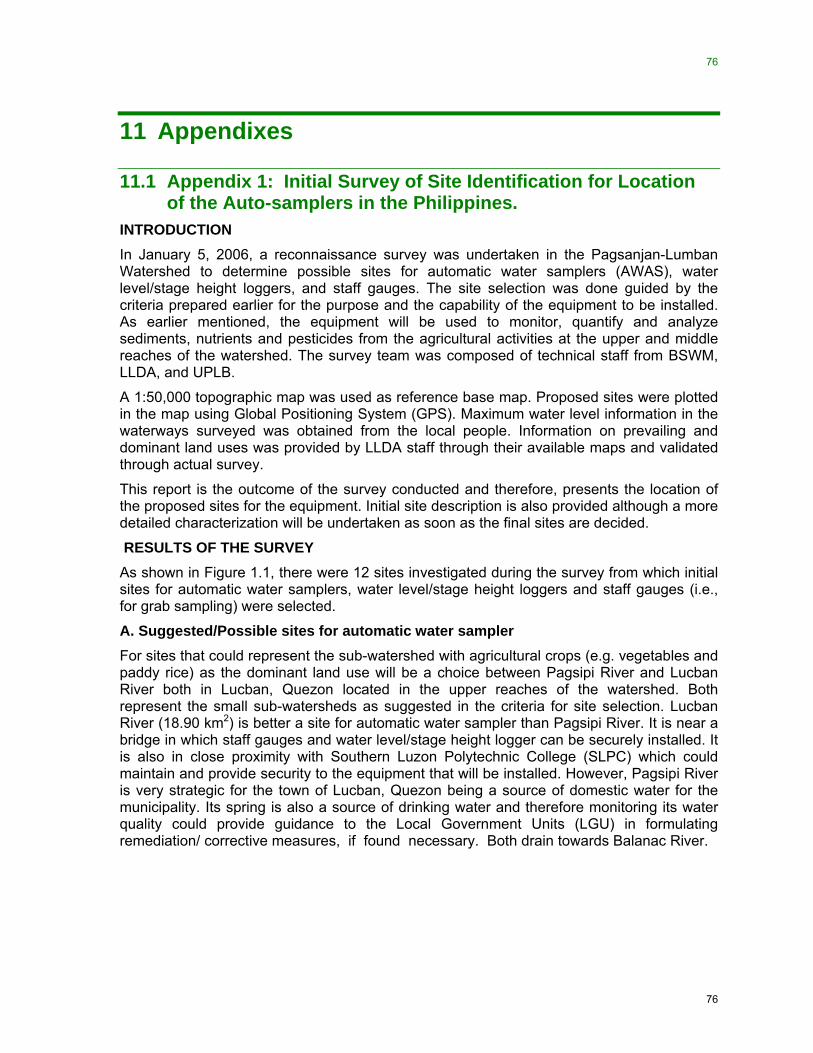
76
76
11 Appendixes
11.1 Appendix 1: Initial Survey of Site Identification for Location of the Auto-samplers in the Philippines.
INTRODUCTION In January 5, 2006, a reconnaissance survey was undertaken in the Pagsanjan-Lumban Watershed to determine possible sites for automatic water samplers (AWAS), water level/stage height loggers, and staff gauges. The site selection was done guided by the criteria prepared earlier for the purpose and the capability of the equipment to be installed. As earlier mentioned, the equipment will be used to monitor, quantify and analyze sediments, nutrients and pesticides from the agricultural activities at the upper and middle reaches of the watershed. The survey team was composed of technical staff from BSWM, LLDA, and UPLB.
A 1:50,000 topographic map was used as reference base map. Proposed sites were plotted in the map using Global Positioning System (GPS). Maximum water level information in the waterways surveyed was obtained from the local people. Information on prevailing and dominant land uses was provided by LLDA staff through their available maps and validated through actual survey.
This report is the outcome of the survey conducted and therefore, presents the location of the proposed sites for the equipment. Initial site description is also provided although a more detailed characterization will be undertaken as soon as the final sites are decided.
RESULTS OF THE SURVEY As shown in Figure 1.1, there were 12 sites investigated during the survey from which initial sites for automatic water samplers, water level/stage height loggers and staff gauges (i.e., for grab sampling) were selected.
A. Suggested/Possible sites for automatic water sampler For sites that could represent the sub-watershed with agricultural crops (e.g. vegetables and paddy rice) as the dominant land use will be a choice between Pagsipi River and Lucban River both in Lucban, Quezon located in the upper reaches of the watershed. Both represent the small sub-watersheds as suggested in the criteria for site selection. Lucban River (18.90 km2) is better a site for automatic water sampler than Pagsipi River. It is near a bridge in which staff gauges and water level/stage height logger can be securely installed. It is also in close proximity with Southern Luzon Polytechnic College (SLPC) which could maintain and provide security to the equipment that will be installed. However, Pagsipi River is very strategic for the town of Lucban, Quezon being a source of domestic water for the municipality. Its spring is also a source of drinking water and therefore monitoring its water quality could provide guidance to the Local Government Units (LGU) in formulating remediation/ corrective measures, if found necessary. Both drain towards Balanac River.

77
77
Figure 1.1 Location map of proposed sited for automatic samplers and staff gauges (Source: Google Earth Satellite Images)
For site that could represent a small sub-watershed with other land uses (e.g., coconut areas), a potential site in Cavinti Bridge, Cavinti, Laguna is proposed. As shown in Figure 1, it is located on the eastern side of the Pagsanjan-Lumban Watershed and drains towards Bongbongan River.
The Balanac Irrigation System (BRIS) diversion dam located mid-stream of the watershed is being proposed as another site for automatic water sampler. It will represent water quality from agricultural areas in combination with other land-uses (e.g. built-up areas, coconut area, and forest area). The operation, upkeep and security of the equipment can be entrusted to the Irrigators Association in coordination with the National Irrigation Administration (NIA). It will represent the medium to large watershed having a drainage area of 122.80 km2. The site is also strategic because water from Balanac River is diverted to about 4,000 ha service area that also ultimately drains towards Laguna Lake.
Another site being eyed for another automatic water sampler is Salasad Creek at the downstream portion of the watershed. A portion of the service area of BRIS drains toward this creek which ultimately ends up to Laguna Lake. Although a small sub-watershed with an
Initian Creek

78
78
area about 6.40 km2, it will facilitate the evaluation of the contribution of the irrigated Riceland to the agricultural pollution of the Laguna Lake. However, the site is exposed to the busy vehicular traffic common in the area and possible human interventions, being located in a road going to Manila. It is also vulnerable to flooding during rainy season. Perhaps, this will be a good location for stage height measurement and grab water sampling.
B. Suggested/Possible Sites for Staff Gauges In the selection of possible locations for the installation of staff gauges, the main considerations are the convenience of getting readings and grab water samples because these will be done by community volunteers. As much as possible, bridges were selected as possible sites for the staff gauges which could be fastened or anchored in the piers of bridges. The following sites were then proposed:
1. Lumban River located downstream near the confluence of Balanac and Bonbongan Rivers. It represents the large main watershed with an area of about 298.60 km2;
2. Balanac River at Pagsanjan Bridge to represent the medium watershed (170.50 km2) and with more agricultural activities upstream;
3. Bongbongan River at a hanging bridge in Pagsanjan to represent the medium watershed (116.20 km2) with more coconut areas and secondary growth forests on its watershed;
4. River under Arco Bridge in Lucban, Quezon representing small to medium watersheds (26.40 km2) with agricultural activities and built up areas as contributing land uses. The waterway is a tributary of Balanac River.
5. Salasad Creek located in Pagsanjan, Laguna, considering that the site may not be a good location for automatic water sampler as previously discussed.
Table 1.1 presents the description of all sites investigated from which the selection of the possible locations for the equipment was based.

Final report: Minimising agricultural pollution to enhance water quality in Laguna de Bay (Philippines) and Mt Lofty Ranges (Australia)
Page 79
Table 1.1 Proposed Sites for Automatic Water Sampler and Staff Gauges Pagsanjan-Lumban Sub-watershed
No Location Description Proposal/ Recommendation 1
N 14º 17’ 31” E 121º 27’ 36” Lumban Bridge Lumban, Laguna
River is about 60-70 meters wide. Watershed area is 298.6 sq.km. Near the confluence of Balanac and Bonbongan Rivers Located downstream of Pagsanjan-Lumban Watershed
Proposed for stage height measurement and grab water sampling Need to coordinate with DPWH for historical stream flow data and existence of staff gauge Volunteer observer can be worked out with the LGU
2
N 14º 16’ 23” E 121º 27’ 14” Pagsanjan Bridge Balanac River Pangsanjan, Laguna
Pagsanjan bridge is about 50-60 meters. Watershed area is 170.5 sq.km. Located downstream of Balanac River near the convergence point of Balanac and Bonbongan Rivers
Proposed for stage height measurement and grab water sampling; Need to coordinate with DPWH for historical stream flow data and existence of staff gauge Volunteer observer can be arranged with the LGU

ANNUAL REPORT 2006 PROJECT No. LWR1/2004/069
80
3
N 14º 16’ 11” E 121º 27’ 32” Hanging bridge Pagsanjan, Laguna
River is about 70 meters wide. Watershed area is 116.2 sq.km. Located downstream of Bonbongan River near the convergence point of Balanac and Bonbongan Rivers Near the Brgy. (small village) hall and office.
Proposed for stage height measurement and grab water sampling; Volunteer observer can be arranged with the Brgy. Council Need to undertake longitudinal profiling and cross-sectional survey for rating curve development
4
N 14º 15’ 59” E 121º 26’ 28” Salasad Creek Pagsanjan, Laguna
River is about 7 meters wide. Watershed area is 6.4 sq.km. One of the drainage channels of Balanac Irrigation System (BRIS) Located within the road going to Manila; busy to vehicular traffic and expose to human interventions Susceptible to flooding during rainy season.
Proposed for automatic water sampler as it captures drainage water from BRIS service area Need to develop rating curve for the water level logger or staff gauge; Security and upkeep automatic water sampler may pose a problem due to its location Just in case, it is also being proposed for stage height measurement.
5
N 14º 14’ 49” E 121º 30’ 10” Cavinti Bridge, Cavinti, Laguna
Maximum flood is about 4.0 meters deep from river bed; River is about 15 meters wide. Dominant land use of the watershed is coconut; Watershed area is 18.2 sq.km; A tributary of Bonbongan River
Proposed for automatic water sampler to represent the watershed with coconut as the dominant land use; Upkeep and security of the equipment can be arranged with the Barangay (local village) Council and LGU. Need to develop rating curve for discharge measurement.
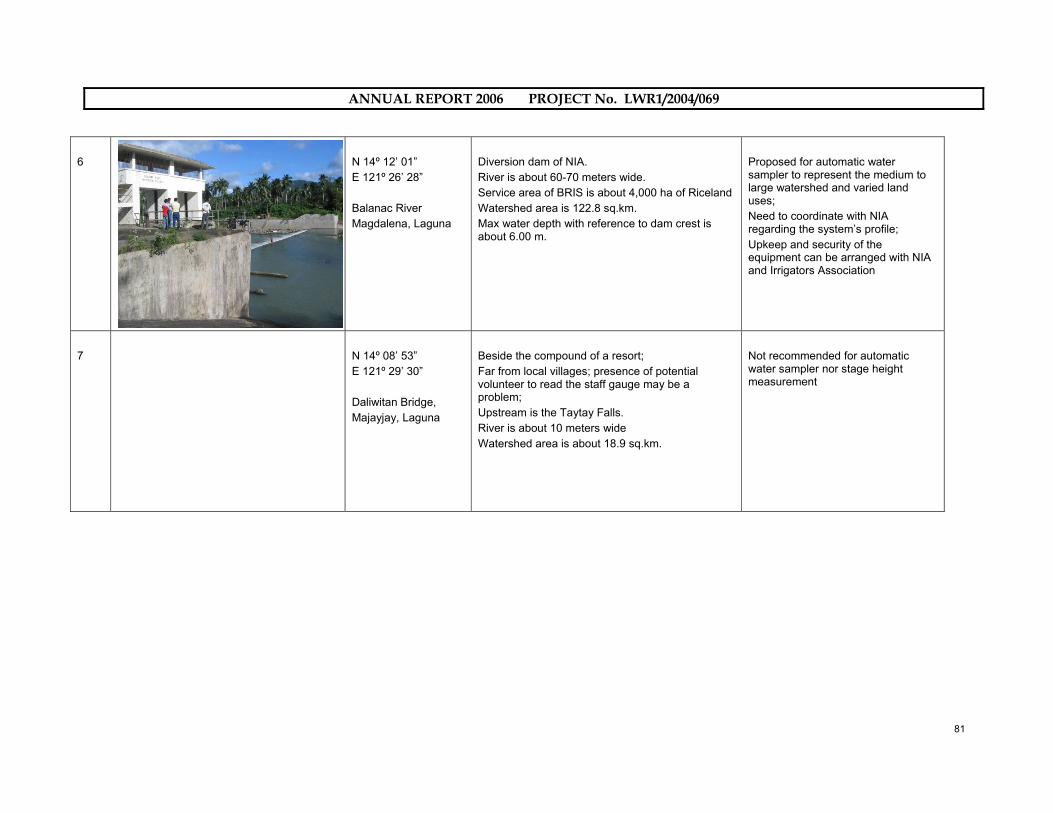
ANNUAL REPORT 2006 PROJECT No. LWR1/2004/069
81
6
N 14º 12’ 01” E 121º 26’ 28” Balanac River Magdalena, Laguna
Diversion dam of NIA. River is about 60-70 meters wide. Service area of BRIS is about 4,000 ha of Riceland Watershed area is 122.8 sq.km. Max water depth with reference to dam crest is about 6.00 m.
Proposed for automatic water sampler to represent the medium to large watershed and varied land uses; Need to coordinate with NIA regarding the system’s profile; Upkeep and security of the equipment can be arranged with NIA and Irrigators Association
7
N 14º 08’ 53” E 121º 29’ 30” Daliwitan Bridge, Majayjay, Laguna
Beside the compound of a resort; Far from local villages; presence of potential volunteer to read the staff gauge may be a problem; Upstream is the Taytay Falls. River is about 10 meters wide Watershed area is about 18.9 sq.km.
Not recommended for automatic water sampler nor stage height measurement

ANNUAL REPORT 2006 PROJECT No. LWR1/2004/069
82
8
N 14º 08’ 44” E 121º 28’ 26” Majayjay Bridge Majayjay, Laguna
Located in deep waterway; a bit difficult to get readings from the staff gauge; Located within the town proper; Watershed area is about 2.2 sq.km.
Not recommended for automatic water sampler nor stage height measurement
9
N 14º 08’ 42” E 121º 28’ 23” Initian creek Poblacion, Majayjay, Laguna
Located within the town proper; Main recipient of wastewater from piggery; Watershed area is about 0.2 sq.km.
Proposed site for grab water sampling; Need to determine the time when wastewater discharge is at its peak;
10
N 14º 07’ 23” E 121º 33’ 31” Arco Bridge Lucban, Quezon Upstream of Balanac River
Beside the DPWH Eng’g District Office. River is about 20 meters wide. Dominant land use is agricultural. Upstream of the bridge is a diversion dam. Watershed area is 26.4 sq.km. Located at the outskirt of the town of Lucban, Quezon.
Proposed site for stage height measurement, through the bridge pier or through the existing diversion dam Possible grab water sampling site to represent water quality as affected by agricultural areas (i.e., vegetables and Riceland), coconut areas, and built-up areas.

ANNUAL REPORT 2006 PROJECT No. LWR1/2004/069
83
11
N 14º 06’ 39” E 121º 33’ 45” Ilog Bridge, Lucban River, Lucban, Quezon
The bridge is beside the campus of Southern Luzon Polytechnic College (SLPC). Dominant land use is agricultural. Sampling site is beside the fence of High School Department of SLPC. River is about 15 meters wide. Watershed area is 16.7 sq.km. Water level depth is about 2-3 m.
Proposed site for automatic water sampler to represent agricultural annual crops as the dominant land use; Upkeep and security of the equipment can be taken care by SLPC; The site can be a good field laboratory for SLPC students;
12 N 14º 06’ 45” E 121º 32’ 59” Pagsipi River Lucban, Quezon
Located upstream of the town proper and near an existing diversion dam being used for domestic water supply Dominant land use is agricultural. River is about 7 meters wide. Upstream is the reservoir of Lucban potable water supply system. Watershed area is 2.2 sq.km. Water level depth 1.5-2 m.
Also being proposed as potential site for automatic water sampler due to the importance of the water source to domestic water supply; Upkeep and security of the equipment can be entrusted to the Barangay Council members.

ANNUAL REPORT 2006 PROJECT No. LWR1/2004/069
84
11.2 Appendix 2: Results of Pesticide Impact Rating Index (PIRI) assessment of chemicals used by growers at 3 monitoring sites in Mt. Lofty Ranges, Australia.
Three growers were interviewed about chemical usage in three main land uses in the Mt. Lofty Ranges, namely apples, grapes and cherry production. Environmental information for each site was collected and was presented in Tables 2.1 and 2.2. An initial assessment was made assuming all chemicals were applied to 100% of the area farmed. This represented a worst-case scenario. For those chemicals that were identified as posing a Medium or greater risk of off-site transport to either surface or ground water, another assessment was made but the area sprayed was decreased to be more representative of actual grower’s practices. The results of the PIRI assessment are summarised in Tables 2.3, 2.4 and 2.5. Table 2.1. Rainfall and temperature data used for the three land uses assessed. Land use Time period of interest Total average
annual rainfall (mm)
Average minimum temperature (0C)
Average maximum temperature (0C)
Grapes August – April 618.7 10.3 20.2 Cherries September – May 585.4 10.6 20.5 Apples September-March 396.9 10.8 21.5
For all land uses, namely apples, cherries and grapes, the initial assessment considered the “worst-case” scenario of all chemicals being applied to 100% of the area.
Those chemicals that were assessed to pose a Medium or greater risk in the five categories assessed, namely surface water mobility, ground water mobility, Rainbow trout toxicity, Daphnia toxicity, algal toxicity and rat toxicity, are listed in Table 2.3.

ANNUAL REPORT 2006 PROJECT No. LWR1/2004/069
85
Table 2.2. Input data used for PIRI assessment for each land use Input Parameter Grapes Cherries Apples Soil Silty loam Sandy clay loam Clay loam Toxicity target Rainbow trout, Daphnia,
Algae, Rat Rainbow trout, Daphnia, Algae, Rat
Rainbow trout, Daphnia, Algae, Rat
Ground covered? Yes yes Yes Soil moisture Wet wet wet Period of interest August to April September to May September to March Organic matter (%) 1.92 2.5 2 Depth to water table (m)
25 45 40
Width of water body (m)
40 75 1.2
Distance from edge of crop to water body (m)
15 75 30
Slope (degrees) 5 5, 25 15, 30 Width of buffer zone (m)
15 75 30
Annual soil loss (tonnes/ha)
0.5 0.5 0.5
Total Rainfall (mm) 618.7 (556.8)1 585.4 396.9 Total irrigation for period (mm)
688 515
2020, 1000
Recharge rate (mm)2 70 60 40 Av. Min. temp for period (0C)
10.3 10.6 10.8
Av. Max. temp. for period (0C)
20.2 20.5 21.5
1 Rainfall for Charleston adjusted to be 10% less than Lenswood Research Centre when PIRI assessment run 2nd time
2 Based on 10% of rainfall recharging; irrigation very efficient and negligible irrigation recharges (Glen Walker CSIRO, pers. comm.)
Table 2.3. Chemicals rated with Medium or greater risk in the five categories assessed. The results below are based on chemicals being applied to 100% of the area. Land use
Surface water mobility
Ground Water mobility
Toxicity to Rainbow trout
Toxicity to Daphnia Toxicity to algae Toxicity to rat
Grapes Carbendazim(F) Pyrimethanil(F)
-- Carbendazim(F) Chlorpyrifos (I)
Carbendazim(F) Chlorpyrifos (I) Diquat (H)
Diquat (H) Paraquat (H) Pyrimethanil(F)
--
Cherries -- -- Captan (F) Chlorothalonil (F)
Chlorothalonil(F) Pirimicarb (I)
Chlorothalonil((F) --
Apples Carbaryl (I) Ethephon (G)
-- Azinphos methyl (I) Carbaryl (I) Chlorpyrifos (I)
Azinphos methyl (I) Carbaryl (I) Chlorpyrifos (I) Diquat (H) Iprodione (F)
Paraquat (H) --
(F) = fungicide, (I) =insecticide, (H) =herbicide, (G) =growth regulator

ANNUAL REPORT 2006 PROJECT No. LWR1/2004/069
86
The assessment was repeated but the area sprayed was decreased to represent the actual areas sprayed in the 2005/2006. Table 2.4 lists those chemicals that were still identified to pose a Medium or greater mobility or toxicity risk after decreasing the area sprayed.
Table 2.4. Re-assessment of those chemicals identified in the first assessment as posing a Medium or greater risk but using the actual areas (%) sprayed in 2005/2006. Land use Surface
water mobility
Ground Water mobility
Toxicity to Rainbow trout
Toxicity to Daphnia
Toxicity to algae
Toxicity to rat
Grapes -- -- -- Carbendazim(F) Chlorpyrifos (I) Diquat (H)
-- --
Cherries -- -- Chlorothalonil (F)
Pirimicarb (I) -- --
Apples Ethephon (G)
-- Azinphos methyl (I) Chlorpyrifos (I)
Azinphos methyl (I) Carbaryl (I) Chlorpyrifos (I) Diquat (H)
-- --
(F) = fungicide, (I) =insecticide, (H) =herbicide
Generally, using the actual areas sprayed decreased the number of chemicals in all three land uses that were rated as posing a Medium or greater toxicity risk. However, this was not the case with chemicals identified as toxic to Daphnia and Rainbow trout and this most likely reflects the lower LC50 values for these chemicals for the two organisms. The lower the LC50 value of a chemical than the more toxic it was to the specified organism and less of it was required to kill the organism.
Generally there were a greater number of chemicals of concern in apple production than in the other two industries. This may reflect the greater number of insecticides used in apples compared with the other two industries and the high toxicity of these organisms to Daphnia and Rainbow trout. Also there were a larger number of sprays of fungicides and herbicides in the apples than in the cherries or grapes. For example, glyphosate was sprayed 8 times in the apples compared with once in the cherries and twice in the grapes. However, these sprays were not over the whole area every application time and most likely reflect that the apples are grown over a larger and more dispersed area than the cherries and grapes assessed in this survey.
While most parameters used in the PIRI assessment were comparable for all 3 land uses some were quite different. The soil texture for the 3 land uses were all forms of a loam. The slope was steeper in apples (15 and 30 degrees) compared with grapes (5 degrees), the number of applications was greater in apples (7) compared with grapes (2), and the irrigation applied was greater in apples (2020 mm) compared with grapes (688 mm). The width of the nearest water body was considerably less in apples (1.2m) compared with grapes (40m) and the cherries (75m) and the distance from the edge of crop to water and width of buffer strip decreased in the order, cherries (75m), apples (30m), grapes (15m). The total irrigation in the apples was 3-4 times greater in the apple scenarios compared with the other two land uses. The main chemicals of concern in the three land uses are given in Table 2.5.

ANNUAL REPORT 2006 PROJECT No. LWR1/2004/069
87
Table 2.5. Main chemicals of concern in the three land uses, apples, cherries and grapes. Chemical Land use Chlorpyrifos Grapes, apples Diquat Grapes, apples Ethephon Apples Carbaryl Apples Azinphos methyl Apples Chlorothalonil Cherries Pirimicarb Cherries Carbendazim Grapes

ANNUAL REPORT 2006 PROJECT No. LWR1/2004/069
88
11.3 Appendix 3: Details of analytical methodology for analyses of total suspended sediment (TSS), nutrients and pesticides.
11.3.1 Pesticide analyses
Sample preparation in laboratory The 2L sample from each sampling time was combined and mixed before an aliquot (200-400 ml) was accurately measured. This unfiltered sample was loaded onto the solid phase extraction (SPE) cartridges that extracted pesticides from the water as the water percolated through the cartridge (Fig 3.1). After all the water had percolated through the SPE cartridge the last of the water was drawn from the SPE under vacuum. Then two washes of solvent (2.5mL) were added to the SPE to elute the pesticide from the SPE. The solvent was collected in a graduated glass tube. For chlorpyrifos analyses the solvent used for SPE elution was dichloromethane (DCM). For the compounds being studied in water from the apples site the solvent used for SPE elution was acetonitrile and for the compounds being studied in water from the cherries and grapes site the solvent was acetone. These solvents were selected after testing for recovery of the compounds from water that had been spiked with the samples.
Fig. 3.1. Reservoirs connected to SPE cartridges on vacuum manifold.
The eluent in the graduated glass tube (5.0 mL) was then blown down under a gentle stream of nitrogen to just under 1.0mL for all analyses, except chlorpyrifos, and made up to exactly 1.0mL. The DCM extracts were blown down to just under 0.5 mL, made up accurately to 0.5 mL with DCM and then made up to 2.0 mL with hexane to give a final

ANNUAL REPORT 2006 PROJECT No. LWR1/2004/069
89
matrix of 25:75 (v/v) DCM: hexane. All samples were then analysed for the chemicals of interest.
When a positive result was obtained for an unfiltered water sample, the sample was filtered through a Whatman glass fibre filter paper (1.2 µm mesh) (Fig. 3.2) and the filtered sample was also extracted as described previously for the various compounds. This allowed the determination of what fraction of the pesticide was in the solution phase (<1.2 µm) and what fraction was attached to colloidal material (>1.2 µm).
Fig. 3.2. Filtering the water sample through glass fibre filter paper to remove colloidal material.
High performance liquid chromatography (HPLC) (Compounds in water from apples site)
Analysis of compounds used in the apple orchard were determined using an Agilent 1100 HPLC equipped with a quaternary pump, a programmable, variable wavelength diode array detector, and an auto-sampler with an electric sample valve. The operating conditions were: Apollo C18 column (250 mm x 4.6 mm ID, 5μm particle size); isocratic mobile phase 75:25 (v/v) acetonitrile:water; flow rate 1 mL/min; an injection volume of 20 μL; and a UV-Vis detector set at a wavelength of 220 nm. The retention times were 4.10 min for carbaryl, 5.0 min for azinphos methyl, 5.55 min for fenarimol and 6.17 min for iprodione. Detection limits were determined as three times the background noise and were 0.2 μg/L for carbaryl, 0.08 μg/L for azinphos methyl and fenarimol and 0.16 μg/L for iprodione.
Gas Chromatography-Mass Spectrometry (GC-MS) (Chlorpyrifos and other compounds in water from grapes and cherries sites)
The concentrations of chlorpyrifos and other compounds being analysed in water from the grapes and cherries sites were determined using an Agilent GC-MS with a 30m DB-5MS column (0.25 mm ID and 0.25µm film thickness) (J&W Scientific, Folson CA). Operating
ANNUAL REPORT 2006 PROJECT No. LWR1/2004/069
90
conditions for the GC were: injection port temperature 2300oC; injection volume of 2μl; the initial column temperature was 750oC which was held for 3 min, then ramped to 1800oC at a rate of 250 oC per min, and then ramped to 2600 oC at a rate of 50 oC per min. The compounds were identified using a mass spectrometer (MS) operating in selected ion monitoring (SIM) mode with an EM voltage of 1729.4V. Detection limits were determined as three times the background noise.
11.3.2 Nutrients and TSS analyses
Determination of TSS Samples were also collected at each time for measuring total suspended sediment (APHA/AWWA/WEF 1992a).
Nutrient analyses Water samples were analysed as unfiltered (total) and filtered (“soluble”) after passing through Gelman Supor Acrodisk (0.45 μm) filters.
Total N and C were determined on the filtered (<0.45 µm; termed “soluble” in the text) and unfiltered (total sample composed of “particulate” (>0.45 µm) + “soluble” (<0.45 µm fraction)) samples using the Skalar Formacs High Temperature TOC/TN Analyser. Total P was measured using inductively coupled plasma-optical emission spectroscopy (ICP). Ammonium (NH4) nitrogen was measured using ISO Method 11732 (ISO 1997), which involves mixing the water sample with a continuous flow of an EDTA/sodium hydroxide solution. The NH4 produced was determined colorimetrically. Nitrate (NO3-) nitrogen was measured using Method 4500-NO3-F (APHA/AWWA/WEF 1992b), which involves the reduction of NO3- to nitrite (NO2-) ion using cadmium. The NO2- produced was then measured colorimetrically.
ANNUAL REPORT 2006 PROJECT No. LWR1/2004/069
91
11.4 Appendix 4: Example of the Chemical Reference Charts developed for the Mt. Lofty Ranges, South Australia.
Chemical Reference Charts were developed for apple, cherry, pear and grape production in the Mt. Lofty Ranges. Several general environmental scenarios that covered a range of site conditions in the Mt. Lofty Ranges, and a range of application rates and frequencies of applications were considered in the development of the charts. The site conditions and chemicals used were obtained by interviewing numerous growers in the Mt. Lofty Ranges and accessing their detailed spray diaries. The generalised conditions and chemical rates were then run through the pesticide risk assessment tool PIRI (Pesticide Impact Rating Index) to determine the relative risk of off-site transport of the chemicals considered.
The Chart was used by the grower selecting the site conditions that most closely represent his situation. Each site scenario was designated a letter (page 1, Fig. 4.1). The user then turns the sheet over and for each chemical active ingredient, rate and frequency of application locate the site scenario (e.g. ‘C’) and from the colour identify the relative risk of that chemical under the specified site conditions moving off-site (page 2, Fig. 4.2).
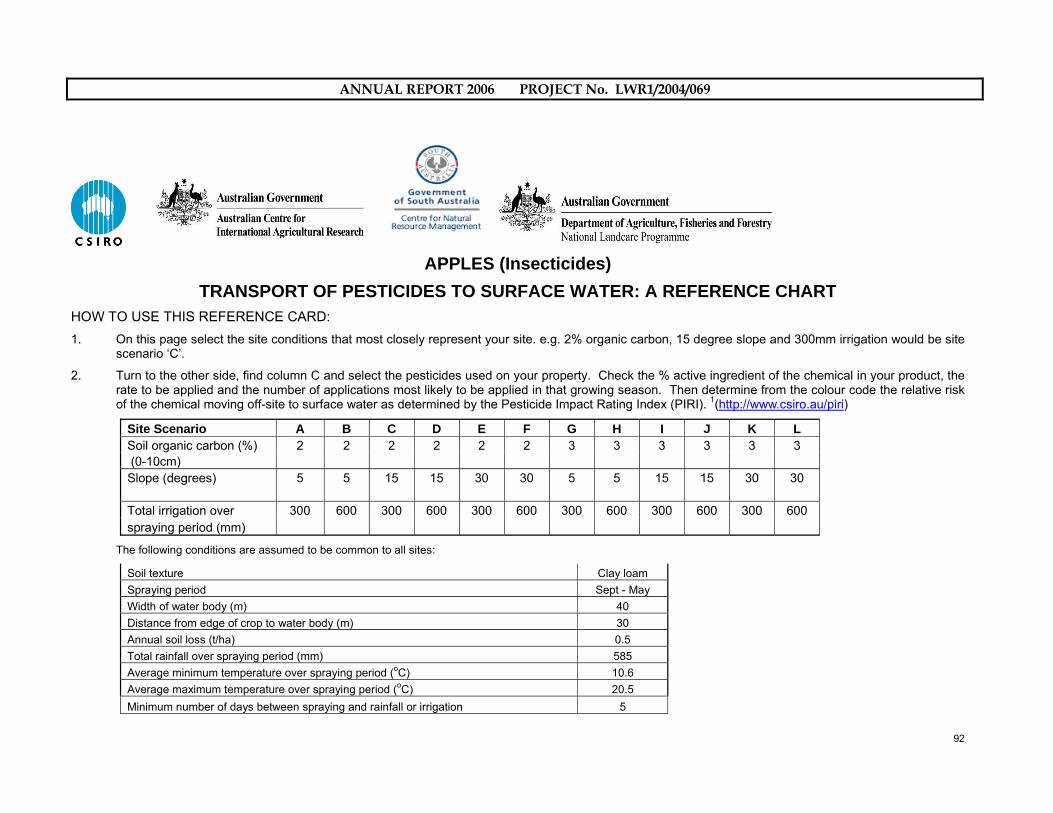
ANNUAL REPORT 2006 PROJECT No. LWR1/2004/069
92
APPLES (Insecticides)
TRANSPORT OF PESTICIDES TO SURFACE WATER: A REFERENCE CHART HOW TO USE THIS REFERENCE CARD: 1. On this page select the site conditions that most closely represent your site. e.g. 2% organic carbon, 15 degree slope and 300mm irrigation would be site
scenario ‘C’. 2. Turn to the other side, find column C and select the pesticides used on your property. Check the % active ingredient of the chemical in your product, the
rate to be applied and the number of applications most likely to be applied in that growing season. Then determine from the colour code the relative risk of the chemical moving off-site to surface water as determined by the Pesticide Impact Rating Index (PIRI). 1(http://www.csiro.au/piri)
Site Scenario A B C D E F G H I J K L Soil organic carbon (%) 2 2 2 2 2 2 3 3 3 3 3 3 (0-10cm) Slope (degrees) 5 5 15 15 30 30 5 5 15 15 30 30 Total irrigation over 300 600 300 600 300 600 300 600 300 600 300 600 spraying period (mm)
The following conditions are assumed to be common to all sites:
Soil texture Clay loam Spraying period Sept - May Width of water body (m) 40 Distance from edge of crop to water body (m) 30 Annual soil loss (t/ha) 0.5 Total rainfall over spraying period (mm) 585 Average minimum temperature over spraying period (oC) 10.6 Average maximum temperature over spraying period (oC) 20.5 Minimum number of days between spraying and rainfall or irrigation 5

ANNUAL REPORT 2006 PROJECT No. LWR1/2004/069
93
APPLES (Insecticides) GUIDE FOR PIRI RISK ASSESSMENT OF TRANSPORT OF PESTICIDES TO SURFACE WATER
PESTICIDES Active Rate Frequency SITE SCENARIO ingredient applied of
A B C D E F G H I J K L Active ingredient g/kg L or kg/ha applications Abamectin 18 0.71 1 Azinphos methyl 200 4 2 Carbaryl 500 3 2 Chlorfenapyr 360 0.9 1 Chlorpyrifos 500 1.3 4 Chlorpyrifos 250 2 2 Dimethoate 400 0.375 1 Endosulfan 350 3.42 1 Fenbutatin oxide 550 0.75 2 Fenoxycarb 250 0.8 2 Fenoxycarb 250 0.8 6 Indoxacarb 300 0.75 1 Maldison 1000 1.1 1 Parathion methyl 500 2 1 Pirimicarb 500 1.2 1 Propargite 320 2 2 Propargite 320 6 2 Tau-fluvalinate 250 0.6 2 Thiacloprid 480 0.25 1
This is a guide only and growers should seek additional assistance if further clarification is required.
The relative risk will vary as your site and spray conditions change
Risk of chemical moving off site to surface water:
KEY
Copyright and Disclaimer: © 2008 CSIRO To the extent permitted by law, all rights are reserved and no part of this publication covered by copyright may be reproduced or copied in any form or by any means except with the written permission of CSIRO. To the extent permitted by law, CSIRO (including its employees and consultants) excludes all liability to any person for any consequences, including but not limited to all losses, damages, costs, expenses and any other compensation, arising directly or indirectly from using this publication (in part or in whole) and any information or material contained in it.
Low risk Medium risk High risk

ANNUAL REPORT 2006 PROJECT No. LWR1/2004/069
94
11.5 Appendix 5: Pesticide usage in Lucban and Pagsanjan regions in the Philippines. Table 5.1 Results from pesticide survey of 11 growers in Samil in the Lucban region, Quezon.
Location Crop Size of
Farm
(Hectare)
Terrain Distance
water source to
farm
Season of
Planting
Months of Planting
Pesticide Used (Active Ingredient)
Fre- quency
Number of spray
loading
Application rate
(g a.i./ha)
Samil Rice 0.5 Terrace Irrigation Dry December metaldehyde
Zn phosphide
3 3 90
800
Samil Rice 0.5 Terrace Irrigation Wet, Dry December Lambda chyhalothrin
Niclosamide
2
2
5 TL/ application
250
250
Samil Rice 0.8 Terrace Irrigation Dry November L-cyhalothrin
metaldehyde
4 TL 250
60
Samil Rice 1.5 Terrace Irrigation Dry December L-cyhalothrin 2 4 TL/ application
250
Samil Rice 1 Terrace Irrigation Dry November L-cyhalothrin 2 250
Samil Rice, Eggplant
0.5 Terrace Irrigation River, very near
Dry November
November
L-cyhalothrin
(diazinon & cypermethrin)
1 3 TL 250
225
Samil Rice 1 Terrace Irrigation Dry December L-cyhalothrin
metaldehyde
4 TL
250
60
Samil Rice 1 Terrace Irrigation Dry December metaldehyde 1 30
Samil Rice 1.5 Terrace Irrigation Dry December L-cyhalothrin
2,4-D
1 4 TL
250
800
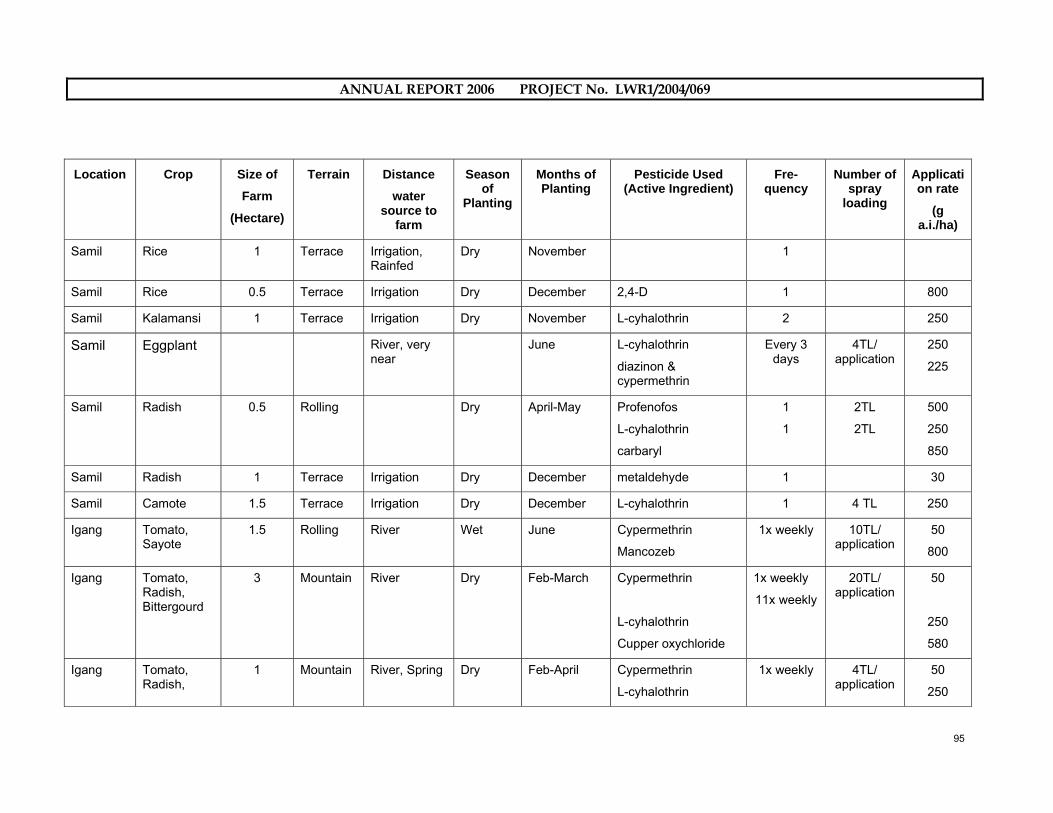
ANNUAL REPORT 2006 PROJECT No. LWR1/2004/069
95
Location Crop Size of
Farm
(Hectare)
Terrain Distance
water source to
farm
Season of
Planting
Months of Planting
Pesticide Used (Active Ingredient)
Fre- quency
Number of spray
loading
Application rate
(g a.i./ha)
Samil Rice 1 Terrace Irrigation, Rainfed
Dry November 1
Samil Rice 0.5 Terrace Irrigation Dry December 2,4-D 1 800
Samil Kalamansi 1 Terrace Irrigation Dry November L-cyhalothrin 2 250
Samil Eggplant River, very near
June L-cyhalothrin
diazinon & cypermethrin
Every 3 days
4TL/ application
250
225
Samil Radish 0.5 Rolling Dry April-May Profenofos
L-cyhalothrin
carbaryl
1
1
2TL
2TL
500
250
850
Samil Radish 1 Terrace Irrigation Dry December metaldehyde 1 30
Samil Camote 1.5 Terrace Irrigation Dry December L-cyhalothrin 1 4 TL 250
Igang Tomato, Sayote
1.5 Rolling River Wet June Cypermethrin
Mancozeb
1x weekly 10TL/ application
50
800
Igang Tomato, Radish, Bittergourd
3 Mountain River Dry Feb-March Cypermethrin
L-cyhalothrin
Cupper oxychloride
1x weekly
11x weekly
20TL/ application
50
250
580
Igang Tomato, Radish,
1 Mountain River, Spring Dry Feb-April Cypermethrin
L-cyhalothrin
1x weekly 4TL/ application
50
250

ANNUAL REPORT 2006 PROJECT No. LWR1/2004/069
96
Location Crop Size of
Farm
(Hectare)
Terrain Distance
water source to
farm
Season of
Planting
Months of Planting
Pesticide Used (Active Ingredient)
Fre- quency
Number of spray
loading
Application rate
(g a.i./ha)
Camote
Ayuti
Beans, Tomato, Chinese pechay
0.4
Rolling
Spring
Wet
November
L-cyhalothrin
4x weekly
4TL/ application
250
Kulapi Spinach, coriander, bittergourd, pechay
1 Terrace Irrigation Dry February Profenophos
L-cyhalothrin
1x weekly 4TL/ application
500
250
Malupic Chinese pechay
0.5 Plain Irrigation Dry March-November
Cypermethrin Monitoring 2TL/ application
30
Tinamnan Rice, Bittergourd
2.5 Plain Irrigation Dry March-November
BPMC + Chlorpyrifos 3x weekly 2TL/ application
315
Tinamnan Bittergourd, celery
0.25 Plain River Dry March BPMC + chlorpyrifos
Carbaryl
3x weekly
3x weekly
3TL/ application
3TL/ application
315
850
Palolan Beans 1 Profenophos 4x weekly 10TL/ application
500
Samil Tomatoes, Bittergourd
1 Terrace Irrigation Dry January-March
Malathion
L-cyhalothrin
1x weekly
1x weekly
7TL/ application
“
“
570
250

ANNUAL REPORT 2006 PROJECT No. LWR1/2004/069
97
Location Crop Size of
Farm
(Hectare)
Terrain Distance
water source to
farm
Season of
Planting
Months of Planting
Pesticide Used (Active Ingredient)
Fre- quency
Number of spray
loading
Application rate
(g a.i./ha)
Methomyl
Mancozeb
“ 400
800
Samil Tomato 1 Terrace Irrigation Dry December L-cyhalothrin
Profenophos
Cypermethrin
2x weekly 10TL/ application
250
500
50
Palola Stringbeans, Beans, Sayote
1 Rolling Collected rain water
Wet September L-cyhalothrin
Cypermethrin
1x weekly 2TL/ application
250
50
Palola Radish, sweet poatoes, Sayote
1 Terrace Rain, River Dry January- February
Cypermethrin 8TL/ application
50
Palola Chinese cabbage
0.16 Plain Spring Dry February Cypermethrin
BPMC+Chlorpyrifos
Cupric hydroxide
2x
2x
3TL/ application
10 TL/ application
50
315
538
Palola Ornamentals 2.5 Rolling River Profenophos
Mancozeb
Every 2 mos
12-15 TL/ application
500

ANNUAL REPORT 2006 PROJECT No. LWR1/2004/069
98
Table 5.2 Results from pesticide survey of 9 growers in Pagsanjan region.
Grower Crop Size of Farm
Terrain Distance from water
source (m)
Season of
Planting
Months of Planting
Pesticide Used Rate of Application (g a.i./ha)
Frequency of
Application
Number of Spray Loading
Source of Water
1 Mango 500 trees?
Plain Lambda cyhalothrin
cypermethrin
250
50
2
20 L/tree
2 Rice 2 Plain 50 Dry Dec-Jan L-cyhalothrin
Cypermethrin
Pretilachlor
Niclosamide
250
50
250
1 20TL River
3 Rice 2 Plain Dry Dec-Jan L-cyhalothrin
Cypermethrin
Niclosamide
butachlor
250
50
250
600
1 20TL River
4 Rice 2 Plain 50 Dry Dec-Jan L-cyhalothrin
Cypermethrin
Niclosamide
Pretilachlor
250
50
250
1 20TL River
5 Rice 2 Plain 100 Dry Dec-Jan L-cyhalothrin
Cypermethrin
Pretilachlor
Niclosamide
250
50
250
1 16-20TL River
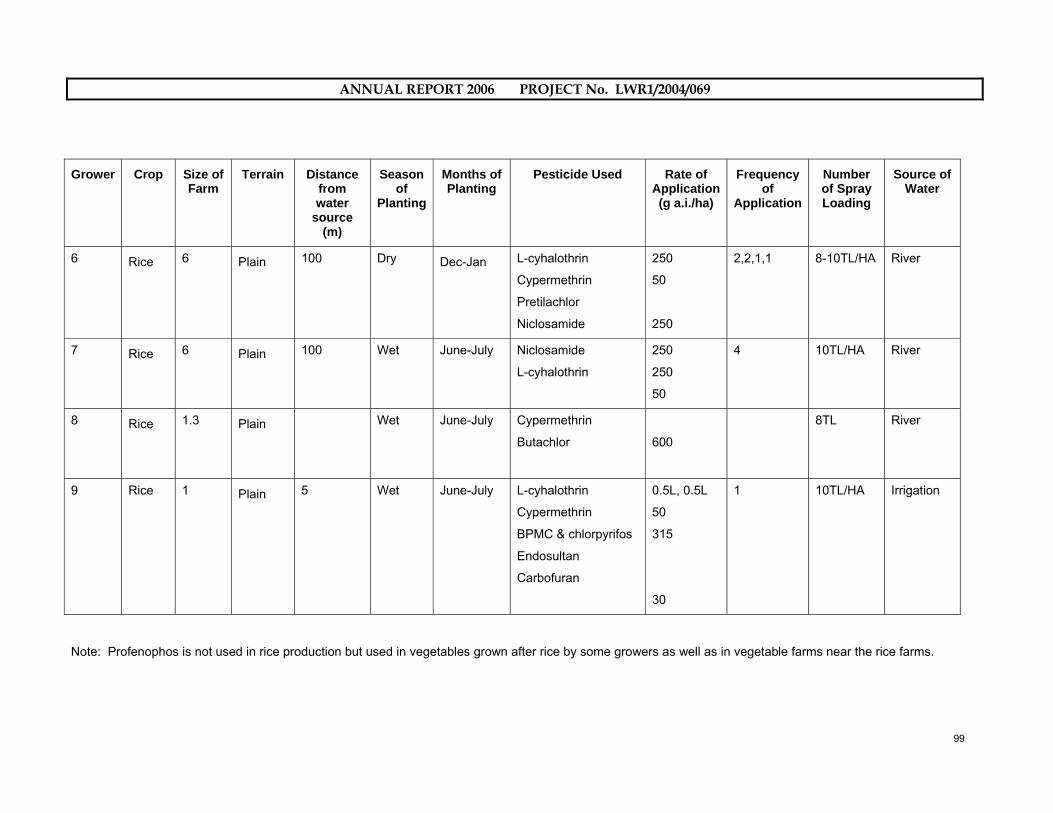
ANNUAL REPORT 2006 PROJECT No. LWR1/2004/069
99
Grower Crop Size of Farm
Terrain Distance from water
source (m)
Season of
Planting
Months of Planting
Pesticide Used Rate of Application (g a.i./ha)
Frequency of
Application
Number of Spray Loading
Source of Water
6 Rice 6 Plain 100 Dry Dec-Jan L-cyhalothrin
Cypermethrin
Pretilachlor
Niclosamide
250
50
250
2,2,1,1 8-10TL/HA River
7 Rice 6 Plain 100 Wet June-July Niclosamide
L-cyhalothrin
250
250
50
4 10TL/HA River
8 Rice 1.3 Plain Wet June-July Cypermethrin
Butachlor
600
8TL River
9 Rice 1 Plain 5 Wet June-July L-cyhalothrin
Cypermethrin
BPMC & chlorpyrifos
Endosultan
Carbofuran
0.5L, 0.5L
50
315
30
1 10TL/HA Irrigation
Note: Profenophos is not used in rice production but used in vegetables grown after rice by some growers as well as in vegetable farms near the rice farms.