SmartREIT 2016 Q3 - MD&A
47
MANAGEMENT’S DISCUSSION AND ANALYSIS FOR THE THREE AND NINE MONTHS ENDED SEPTEMBER 30, 2016 SMART Q3
Transcript of SmartREIT 2016 Q3 - MD&A

MANAGEMENT’S DISCUSSION AND ANALYSIS
FOR THE THREE AND NINE MONTHS ENDED
SEPTEMBER 30, 2016
SMARTQ3

1 CEO’s Message
3 Management’s Discussion and Analysis
4 Business Overview and Strategic Direction
5 Financial and Operational Highlights for the Three Months Ended September 30, 2016
8 Results of Operations
12 Other Measures of Performance
18 Leasing Activities and Lease Expiries
20 Mortgages, Loans and Notes Receivable and Interest Income
21 Interest Expense
22 General and Administrative Expense
22 Developments and Earnouts Completed on Existing Properties
23 Maintenance of Productive Capacity
24 Investment Properties
27 Properties Under Development
30 Investment in Associates
31 Related Party
33 Capital Resources and Liquidity
34 Debt
36 Financial Covenants
37 Unitholders’ Equity
39 Quarterly Information
39 Income Taxes and SIFT Compliance
40 Disclosure Controls and Procedures and Internal Controls Over
Financial Reporting – National Instrument 52-109 Compliance
40 Critical Accounting Estimates
40 Future Changes in Accounting Policies
41 Risks and Uncertainties
43 Subsequent Events
43 Outlook
Table of Contents

The third quarter of 2016 has continued the positive momentum that has been building throughout the year as we build
a pipeline of new initiatives at a number of our urban and retail sites.
For our financial results, these reflect Funds From Operations (“FFO”) per unit of 54¢, the same as for 2015. For Adjusted
Funds From Operations (“AFFO”), our results show 51¢ per unit, a 1.9% decline over 2015. These results reflect a good core
operating performance, modestly offset by continued investment in the operating costs of our development platform which
is fundamental to our long term success and lower recovery of operating costs due to slightly higher vacancies.
For the third year in a row, we increased our distributions to $1.70 per unit effective the October distribution and we continue
to expect further modest increases in the future.
Occupancy for the quarter including committed leases is up to 98.5%, reflecting a vigorous leasing effort, despite continued
challenging market conditions. Year-to-date, we have completed or are close to completing approximately 1.45 million square
feet of 2016 renewals (81%) at an increased rental rate of 2.7% or 4.0% excluding anchors, which again reflects the ongoing
very competitive rental market.
For our largest development opportunity, the Vaughan Metropolitan Centre, we are seeing very positive activity on a number of
fronts. We are continuing discussions on our first residential development on the site. The new development calls for in excess
of 500,000 square feet of gross buildable area in two proposed towers. At the second quarter, we announced the second
official mixed-use office tower with PwC as the lead tenant. Planning and design for this development continue to move
forward and it is expected that construction will start early in 2017.
Leasing in the KPMG tower, which formerly opened for business on October 3rd, continues to progress very well and currently
we only have approximately one floor unspoken for in the main tower, based on leasing discussions and known commitments,
with a range of commercial and professional services businesses committing to the space during the third quarter. We fully
expect to lease up the balance of the available space in the coming months.
Overall the returns we will achieve for the KPMG tower are coming in ahead
of our expectations.
Our attention has now turned to the various elements of the road infrastructure
necessary to open up the site as well as the initial planning for the next phase
of the project which is likely to be a significant mixed-use complex fronting onto
Highway 7 including two further office towers, additional residential space and retail.
CEO’S MESSAGE
SMART REAL ESTATE INVESTMENT TRUST | THIRD QUARTER REPORT 2016 1

Sincerely,
Huw Thomas
Chief Executive Officer
SmartREIT
Sales performance at the Toronto and Montreal Premium Outlets continues to be very strong, with sales performance in
Toronto up over 20% and Montreal up 10% during September. Work has started on the expansion of the Toronto site with
approximately 140,000 square feet of new retail space planned to open in the fall of 2018. The initial phase is the construction
of a new parking deck and work on this is moving forward, with the expected completion planned for mid-to-late 2017, and the
new shopping area will commence construction as soon as the new parking facility is finished. Overall, tenant and customer
satisfaction continues to be very high. We are also continuing to explore two additional outlet locations to add to our portfolio.
Elsewhere, multiple different projects are underway to look at opportunities in residential (condominium, rental, and townhome
formats), office, seniors housing, and storage. Each of these initiatives is usually with a joint venture partner who will combine
their specific sector skills with SmartREIT’s development team to maximize the value for each project.
In the capital markets, we refinanced two tranches of unsecured debt in the quarter, which both extended term and lowered
our overall interest rate as part of our on-going balance sheet management. At Q3, our overall leverage ratio was 44.8% and
our average interest rate had declined to 3.81%, both reflecting the quality of our balance sheet. Liquidity is very strong and
surplus cash on hand at the end of the quarter was used to finance a new Walmart anchored shopping centre that we have
acquired in Montreal at the end of October.
As we look forward, I continue to be grateful to our Associates for their hard work and continued commitment to our values,
our operating and financial partners for the continued support and our Board of Trustees for their leadership and guidance.
And finally, thank you to all of our loyal tenants and customers for your business and our Unitholders for trusting us with your
precious investment funds.
2 SMART REAL ESTATE INVESTMENT TRUST | THIRD QUARTER REPORT 2016

MANAGEMENT'S DISCUSSION AND ANALYSIS
SMART REAL ESTATE INVESTMENT TRUST | THIRD QUARTER REPORT 2016 3
MANAGEMENT'S DISCUSSION AND ANALYSIS
FOR THE THREE AND NINE MONTHS ENDED SEPTEMBER 30, 2016
About this Management's Discussion and AnalysisThis Management's Discussion and Analysis ("MD&A") sets out Smart Real Estate Investment Trust's ("SmartREIT" or the "Trust")
strategies and provides an analysis of the financial performance and financial condition for the three and nine months ended
September 30, 2016, the risks facing the business and management's outlook.
This MD&A should be read in conjunction with the Trust's audited consolidated financial statements for the years ended December 31,
2015 and 2014, and the unaudited interim condensed consolidated financial statements for the three and nine months ended
September 30, 2016 and the notes contained therein. Such consolidated financial statements have been prepared in accordance with
International Financial Reporting Standards ("IFRS") applicable to the preparation of condensed consolidated financial statements
and International Accounting Standard ("IAS") 34, "Interim Financial Reporting", as issued by the International Accounting Standards
Board ("IASB"). The Canadian dollar is the functional and reporting currency for purposes of preparing the unaudited interim condensed
consolidated financial statements.
This MD&A is dated November 2, 2016, which is the date of the press release announcing the Trust's results for the three and nine
months ended September 30, 2016. Disclosure contained in this MD&A is current to that date, unless otherwise noted.
Presentation of Non-GAAP MeasuresReaders are cautioned that certain terms used in this MD&A such as Funds From Operations ("FFO"), Adjusted Funds From Operations
("AFFO"), Net Operating Income ("NOI"), "Interest Coverage", "Aggregate Assets", "Gross Book Value", "Debt to Service", Adjusted
Earnings Before Interest, Taxes, Depreciation and Amortization ("Adjusted EBITDA"), "Secured Indebtedness", "Payout Ratio", and
any related per Variable Voting Unit of the Trust (a "Unit") amounts used by management to measure, compare and explain the
operating results and financial performance of the Trust do not have any standardized meaning prescribed under IFRS and, therefore,
should not be construed as alternatives to net income or cash flow from operating activities calculated in accordance with IFRS. These
terms are defined in this MD&A and reconciled to the closest IFRS measure in the unaudited interim condensed consolidated financial
statements of the Trust for the three and nine months ended September 30, 2016. Such terms do not have a standardized meaning
prescribed by IFRS and may not be comparable to similarly titled measures presented by other publicly traded entities. See "Other
Measures of Performance", "Net Operating Income", "Debt" and "Financial Covenants".
Earnings before interest expense, income taxes, depreciation expense and amortization expense ("EBITDA") is a non-IFRS measure
that can be used to help determine the Trust's ability to service its debt, finance capital expenditures and provide for distributions to
its unitholders ("Unitholders"). EBITDA is reconciled with net income, which is the closest IFRS measure (see "Financial Covenants").
Adjusted EBITDA, as defined by the Trust, is a non-IFRS measure that comprises net earnings less income taxes, interest expense,
amortization expense and depreciation expense, as well as gains and losses on disposal of investment properties and the fair value
changes associated with investment properties and financial instruments, and also excludes non-recurring one-time adjustments. It is
a metric that can be used to help determine the Trust's ability to service its debt, finance capital expenditures and provide for distributions
to its Unitholders. Additionally, Adjusted EBITDA removes the non-cash impact of the fair value changes and gains and losses on
investment property dispositions. Adjusted EBITDA is reconciled with net income, which is the closest IFRS measure (see "Capital
Resources and Liquidity").
The ratio of Total Debt to Adjusted EBITDA is included and calculated each period to provide information on the level of the Trust's
debt versus the Trust's ability to service that debt. Adjusted EBITDA is used as part of this calculation because the fair value changes
and gains and losses on investment property dispositions do not have an impact on cash flow, which is a critical part of this measure.
See "Financial Covenants" for details.
Forward-Looking StatementsCertain statements in this MD&A are "forward-looking statements" that reflect management's expectations regarding the Trust's future
growth, results of operations, performance and business prospects and opportunities as outlined under the headings "Business Overview
and Strategic Direction" and "Outlook". More specifically, certain statements contained in this MD&A, including statements related
to the Trust's maintenance of productive capacity, estimated future development plans and costs, view of term mortgage renewals
including rates and upfinancing amounts, timing of future payments of obligations, intentions to secure additional financing and
potential financing sources, and vacancy and leasing assumptions, and statements that contain words such as "could", "should", "can",
"anticipate", "expect", "believe", "will", "may" and similar expressions and statements relating to matters that are not historical facts,
constitute "forward-looking statements." These forward-looking statements are presented for the purpose of assisting Unitholders and

MANAGEMENT'S DISCUSSION AND ANALYSIS
4 SMART REAL ESTATE INVESTMENT TRUST | THIRD QUARTER REPORT 2016
financial analysts in understanding the Trust's operating environment, and may not be appropriate for other purposes. Such forward-
looking statements reflect management's current beliefs and are based on information currently available to management.
However, such forward-looking statements involve significant risks and uncertainties, including those discussed under the heading
"Risks and Uncertainties" and elsewhere in this MD&A. A number of factors could cause actual results to differ materially from the
results discussed in the forward-looking statements. Although the forward-looking statements contained in this MD&A are based on
what management believes to be reasonable assumptions, including those discussed under the heading "Outlook" and elsewhere in
this MD&A, the Trust cannot assure investors that actual results will be consistent with these forward-looking statements. The forward-
looking statements contained herein are expressly qualified in their entirety by this cautionary statement. These forward-looking
statements are made as at the date of this MD&A and the Trust assumes no obligation to update or revise them to reflect new events
or circumstances unless otherwise required by applicable securities legislation.
All amounts in the MD&A are expressed in thousands of Canadian dollars, except where otherwise stated. Per Unit amounts are
expressed on a diluted basis, except where otherwise stated.
Additional information relating to the Trust, including the Trust's Annual Information Form for the year ended December 31, 2015
can be found at www.sedar.com.
Business Overview and Strategic Direction
The Trust is an unincorporated open-ended mutual fund trust governed by the laws of the Province of Alberta. The Units of the
Trust are listed and publicly traded on the Toronto Stock Exchange ("TSX") under the symbol "SRU.UN."
The Trust's vision is to create exceptional places to shop and work. The Trust's purpose is to develop, lease, construct, own and manage
shopping centres that provide retailers with a platform to reach their customers through convenient locations, intelligent designs, and
a desirable tenant mix, and more recently to provide high quality office space for tenants to locate effective workspaces. The Trust is
currently working on opportunities to provide residential (in various forms), seniors housing, and self-storage facilities at certain of
its shopping centre properties across Canada.
The Trust's shopping centres focus on value oriented retailers and include the strongest national and regional names as well as strong
neighbourhood merchants. It is expected that Walmart will continue to be the dominant anchor tenant in the portfolio and that its
presence will continue to attract other retailers and consumers.
As at September 30, 2016, the Trust owned 142 shopping centres with total gross leasable area of 31.5 million square feet, one office
building and eight development properties, located in communities across Canada. Generally, the Trust's centres are conveniently
located close to major highways, which, along with the anchor stores, provide significant draws to the Trust's portfolio, attracting both
value-oriented retailers and consumers. The Trust, through a subsidiary limited partnership, acquired the right from Penguin to use
the "SmartCentres" brand, which represents a family and value-oriented shopping experience. In addition, the Trust acquired the
"Smart Urban" brand, which the Trust expects may be used to describe mixed-use developments in urban settings, which will likely
include a mix of retail, office and residential space.
Two current examples of the Trust's evolution into mixed-use development are: the Vaughan Metropolitan Centre ("VMC") in Vaughan,
Ontario, and the Toronto StudioCentre ("StudioCentre") in Toronto, Ontario. The VMC is one of the largest urban mixed-use
development sites proposed in Canada. The Trust owns a 50% interest in 53 acres through a joint venture with Penguin and plans to
develop an expected total of approximately 8.0 million to 10.0 million square feet of commercial, residential and retail real estate at
VMC. Phase 1 of the development at VMC includes a 360,000 square foot office complex with KPMG as lead tenant, with possession
taken by KPMG in March 2016. The site will also contain the terminus of the Spadina-York University subway extension, which is
expected to open in late 2017. The StudioCentre site has become a mainstay of the Canadian movie production industry, housing
multiple facilities for all elements of film and television production. The Trust has recently received approval from Toronto City Council
to upgrade and redevelop the 19-acre site to include 1.2 million square feet of mixed-use space, including office, retail and potentially
a hotel to service the arts, film and media community. The Trust expects that the existing 230,000 square feet of former industrial
buildings will continue to benefit from a thriving movie production industry in Canada.
On August 2, 2016, the Trust announced the commencement of the second phase of office development at VMC. The next phase
of development is expected to be completed in 2019 and will feature a new 220,000 square foot Class A facility, which the Trust
anticipates will be home to lead occupants, PwC, YMCA, and a new library and community uses for the City of Vaughan.

MANAGEMENT'S DISCUSSION AND ANALYSIS
SMART REAL ESTATE INVESTMENT TRUST | THIRD QUARTER REPORT 2016 5
AcquisitionsSubject to the availability of acquisition opportunities, the Trust intends to grow distributions, in part through the accretive acquisition
of properties. The current environment for acquisitions is very competitive with limited supply of quality properties coming to the
market. The Trust explores acquisition opportunities as they arise but will pursue only acquisitions that management believes are
accretive relative to its long-term cost of capital.
Developments, Earnouts and Mezzanine FinancingDevelopments, Earnouts and Mezzanine Financing continue to be a significant component of the Trust's strategic plan. "Developments"
represent the gross leasable area that the Trust plans to develop for its own account, which includes the VMC. The gross leasable area
to be developed and leased to third parties, which favour Penguin (controlled by Mitchell Goldhar, a Trustee and significant Unitholder
of the Trust) is defined as "Earnouts". "Mezzanine Financing" purchase options are exercisable once a shopping centre is substantially
complete and allow the Trust as a lender to acquire 50% of the completed shopping centre at agreed-upon formulas.
As at September 30, 2016, the Trust's potential gross leasable area subject to Developments, Earnouts and Mezzanine Financing is
summarized as follows:
(in thousands of square feet) September 30, 2016
Developments 3,715
Premium Outlets 130
VMC 235
Planned internal development 4,080
Planned third party development subject to Earnouts 638
Future estimated development area 4,718
Lands under Mezzanine Financing 709
Potential gross leasable area 5,427
Pursuant to the transaction - which involved the acquisition of both a very significant portfolio of real estate and the Penguin platform
(see MD&A for the year ended December 31, 2015 for details) - that occurred on May 28, 2015 (the "Transaction"), all leasing and
development work on behalf of Penguin and other vendors is now managed by and will be completed by, the Trust under contract
with those parties. Earnouts occur where the vendors retain responsibility for certain developments on behalf of the Trust for additional
proceeds calculated based on a predetermined, or formula-based, capitalization rate, net of land and development costs incurred by
the Trust. Pursuant to the Transaction, the Trust is now responsible for managing the completion of Earnouts and Developments and
charges fees to the vendors for such management.
Professional ManagementThrough professional management of the portfolio, the Trust intends to ensure its properties portray an image that will continue to
attract consumers as well as provide preferred locations for its tenants. Well-managed properties enhance the shopping experience and
ensure customers continue to visit the centres. Professional management of the portfolio has contributed to a continuing high occupancy
level of 98.3% in the quarter (from 98.2% in the second quarter) based on leased and occupied space. Including the executed deals
which will take occupancy after the quarter, this metric increases to 98.5% (from 98.3% in the second quarter).
Financial and Operational Highlights for the Three Months Ended September 30, 2016
The Trust continued its growth through Developments and Earnouts in 2016. During the quarter, the Trust also focused on managing
the operation and development of existing properties and raising the capital required for future growth of the business.
Highlights for the quarter include the following:
• The Trust improved its occupancy to 98.3% in the quarter (from 98.2% in the second quarter) based on leased and
occupied space. Including the executed deals that will take occupancy after the quarter, this metric increases to 98.5%
(from 98.3% in the second quarter)
• Developments and Earnouts of 54,845 square feet of leasable area for $17.9 million were completed, providing an
unleveraged yield of 6.7%
• An investment property in Lethbridge, Alberta, was acquired totalling 53,392 square feet of leasable area for a total
purchase price of $15.3 million, for which the Trust assumed an existing mortgage totalling $9.2 million with a term of
3.9 years and an interest rate of 2.73%
• $100.0 million of 2.987% Series O senior unsecured debentures and $250.0 million of 3.444% Series P senior unsecured
debentures were issued for combined net proceeds including issuance costs totalling $347.4 million

MANAGEMENT'S DISCUSSION AND ANALYSIS
6 SMART REAL ESTATE INVESTMENT TRUST | THIRD QUARTER REPORT 2016
• $100.0 million aggregate principal amount of 5.00% Series F senior unsecured debentures and $90.0 million aggregate
principal amount of 4.70% Series G senior unsecured debentures were redeemed
Subsequent to Quarter End:
• KPMG opened for business on October 3, 2016 at the new Vaughan Metropolitan Centre and new leasing at the centre
is very positive, with effective rents and timing ahead of expectations
• On October 25, 2016, the Trust completed the acquisition of a mixed-use retail-office centre in Pointe-Claire, Quebec,
from a third party, totalling approximately 382,000 square feet of leasable area. The total purchase price of this acquisition
was $62.0 million, which was be funded by existing cash and the assumption of an existing mortgage totalling $34.5
million with an interest rate of 2.87% that matures in 2017
• On October 28, 2016, the Trust entered into an agreement to extend a loan receivable in the amount of $40.3 million
issued to OneREIT for a period of one year that was due to mature on October 30, 2016 with an interest rate of 6.75%,
resulting in a revised maturity date of October 30, 2017 with substantially the same terms except for a one-time prepayment
option of $10.0 million that was exercised by OneREIT on October 31, 2016
Selected Consolidated Information:The operational and financial consolidated information shown in the tables below includes the Trust's share of investment in associates,
which is disclosed in Note 6 of the unaudited interim condensed consolidated financial statements.
(in thousands of dollars, except per Unit and other non-financial data) September 30, 2016 December 31, 2015 September 30, 2015
Operational information
Number of retail and other properties 142 139 138
Number of properties under development 8 11 11
Number of office buildings 1 — —
Total number of properties owned 151 150 149
Gross leasable area (in thousands of sq. ft.) 31,452 31,055 30,761
Future estimated development area (in thousands of sq. ft.) 4,718 5,037 4,852
Lands under Mezzanine Financing (in thousands of sq. ft.) 709 700 781
Occupancy 98.3% 98.7% 98.7%
Average lease term to maturity 6.8 years 6.9 years 7.1 years
Net rental rate (per occupied sq. ft.) $15.26 $15.16 $15.09
Net rental rate excluding anchors (per occupied sq. ft.) (1) $21.89 $21.87 $21.69
Financial information
Investment properties (2) 8,267,367 8,168,551 8,105,859
Total assets 8,647,605 8,505,003 8,530,967
Total unencumbered assets 2,635,200 2,453,000 2,518,800
Debt (2) 3,896,201 3,823,229 3,878,404
Debt to gross book value (3) 52.1% 52.2% 52.8%
Debt to aggregate assets 44.8% 44.7% 45.3%
Interest coverage (4) 3.0X 3.0X 3.1X
Debt to Adjusted EBITDA (5) 8.4X 8.4X 8.4X
Equity (book value) 4,563,448 4,482,571 4,440,215
MANAGEMENT'S DISCUSSION AND ANALYSIS
SMART REAL ESTATE INVESTMENT TRUST | THIRD QUARTER REPORT 2016 7
Three Months EndedSeptember 30, 2016
Three Months EndedSeptember 30, 2015
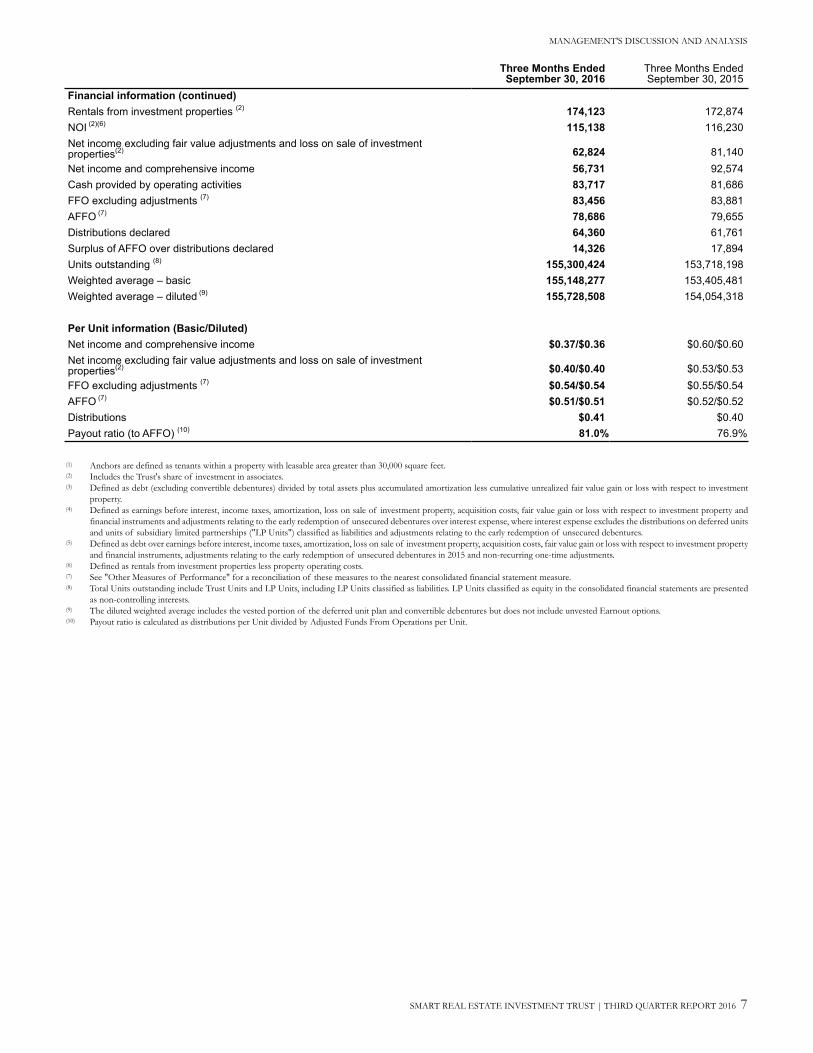
Financial information (continued)
Rentals from investment properties (2) 174,123 172,874
NOI (2)(6) 115,138 116,230
Net income excluding fair value adjustments and loss on sale of investment properties(2) 62,824 81,140
Net income and comprehensive income 56,731 92,574
Cash provided by operating activities 83,717 81,686
FFO excluding adjustments (7) 83,456 83,881
AFFO (7) 78,686 79,655
Distributions declared 64,360 61,761
Surplus of AFFO over distributions declared 14,326 17,894
Units outstanding (8) 155,300,424 153,718,198
Weighted average – basic 155,148,277 153,405,481
Weighted average – diluted (9) 155,728,508 154,054,318
Per Unit information (Basic/Diluted)
Net income and comprehensive income $0.37/$0.36 $0.60/$0.60
Net income excluding fair value adjustments and loss on sale of investment properties(2) $0.40/$0.40 $0.53/$0.53
FFO excluding adjustments (7) $0.54/$0.54 $0.55/$0.54
AFFO (7) $0.51/$0.51 $0.52/$0.52
Distributions $0.41 $0.40
Payout ratio (to AFFO) (10) 81.0% 76.9%
(1) Anchors are defined as tenants within a property with leasable area greater than 30,000 square feet. (2) Includes the Trust's share of investment in associates. (3) Defined as debt (excluding convertible debentures) divided by total assets plus accumulated amortization less cumulative unrealized fair value gain or loss with respect to investment
property.(4) Defined as earnings before interest, income taxes, amortization, loss on sale of investment property, acquisition costs, fair value gain or loss with respect to investment property and
financial instruments and adjustments relating to the early redemption of unsecured debentures over interest expense, where interest expense excludes the distributions on deferred units
and units of subsidiary limited partnerships ("LP Units") classified as liabilities and adjustments relating to the early redemption of unsecured debentures. (5) Defined as debt over earnings before interest, income taxes, amortization, loss on sale of investment property, acquisition costs, fair value gain or loss with respect to investment property
and financial instruments, adjustments relating to the early redemption of unsecured debentures in 2015 and non-recurring one-time adjustments. (6) Defined as rentals from investment properties less property operating costs. (7) See "Other Measures of Performance" for a reconciliation of these measures to the nearest consolidated financial statement measure.(8) Total Units outstanding include Trust Units and LP Units, including LP Units classified as liabilities. LP Units classified as equity in the consolidated financial statements are presented
as non-controlling interests. (9) The diluted weighted average includes the vested portion of the deferred unit plan and convertible debentures but does not include unvested Earnout options.(10) Payout ratio is calculated as distributions per Unit divided by Adjusted Funds From Operations per Unit.

MANAGEMENT'S DISCUSSION AND ANALYSIS
8 SMART REAL ESTATE INVESTMENT TRUST | THIRD QUARTER REPORT 2016
Results of Operations
Quarterly Comparison to Prior Year
(in thousands of dollars)Three Months EndedSeptember 30, 2016
Three Months EndedSeptember 30, 2015
Net base rent 116,535 116,290
Property operating cost recoveries 54,085 54,018
Miscellaneous revenue 3,503 2,566
Rentals from investment properties(1) 174,123 172,874
Service and other revenues 2,315 3,318
Other expenses (2,315) (3,288)
Recoverable costs (56,420) (54,071)
Property management fees and costs (1,510) (1,914)
Non-recoverable costs (1,055) (689)
Total property specific costs (1) (58,985) (56,644)
NOI 115,138 116,230
NOI as a percentage of base rent 98.8% 99.9%
NOI as a percentage of rentals from investment properties 66.1% 67.2%
Recovery ratio 95.9% 99.9%
(1) Includes the Trust's share of rentals from investment in associates of $0.4 million (three months ended September 30, 2015 – $0.4 million) and property specific costs from investment
in associates of $0.2 million (three months ended September 30, 2015 – $0.2 million), for a net increase to NOI of $0.2 million for the three months ended September 30, 2016 (three
months ended September 30, 2015 – $0.2 million).
Rentals from investment properties for the three months ended September 30, 2016, totalled $174.1 million, a $1.2 million or 0.7%
increase over the same period last year. Net base rent increased by $0.2 million or 0.2%, due to rent increases from new and renewing
tenants, partially offset by higher vacancies, and income from acquisitions that closed during 2015 and 2016, as well as Earnouts and
completed Developments that occurred during 2015 and 2016. Property operating cost recoveries increased by $0.1 million or 0.1%
due to the related increases in recoverable costs with the growth in the portfolio.
The Trust recovered 95.9% of total recoverable expenses during the three months ended September 30, 2016, compared to 99.9% in
the same quarter last year. Non-recovery of most of the remaining costs resulted from higher vacancies, fixed recovery rates for some
tenants, restrictions contained in certain anchor tenant leases, unfavourable property operating cost recovery adjustments made in 2016
for prior years of $0.3 million and favourable realty tax adjustments made in 2015 for prior years of $0.6 million.
In comparison to the same quarter in 2015, NOI decreased by $1.1 million or 0.9% in 2016, primarily as a result of the increase in
recoverable costs, net of recoveries, of $2.3 million attributable to additional shortfall and prior year adjustments as discussed above,
partially offset by the increase in miscellaneous revenue mainly due to the increase in settlement proceeds and short term rental revenue
of $0.9 million.
Year-to-Date Comparison to Prior Year
Nine Months Ended Nine Months Ended
(in thousands of dollars) September 30, 2016 September 30, 2015
Net base rent 349,610 323,145
Property operating cost recoveries 171,332 159,889
Miscellaneous revenue(1) 20,106 9,204
Rentals from investment properties(2) 541,048 492,238
Service and other revenues 7,692 5,209
Other expenses (7,692) (5,170)
Recoverable costs (177,384) (161,863)
Property management fees and costs (4,527) (4,118)
Non-recoverable costs (2,842) (2,429)
Total property specific costs (2) (184,753) (168,371)
NOI(1) 356,295 323,867
NOI as a percentage of base rent(1) 101.9% 100.2%
NOI as a percentage of rentals from investment properties(1) 65.9% 65.8%
Recovery ratio 96.6% 98.8%
(1) Includes $9.7 million settlement proceeds associated with the Target lease terminations net of other amounts recorded during the nine months ended September 30, 2016 (nine months
ended September 30, 2015 – $nil).

MANAGEMENT'S DISCUSSION AND ANALYSIS
SMART REAL ESTATE INVESTMENT TRUST | THIRD QUARTER REPORT 2016 9
(2) Includes the Trust's share of rentals from investment in associates of $1.2 million (nine months ended September 30, 2015 - $1.3 million) and property specific costs from investment
in associates of $0.5 million (nine months ended September 30, 2015 - $0.5 million), for a net increase to NOI of $0.7 million for the nine months ended September 30, 2016 (September 30,
2015 - $0.8 million).
Rentals from investment properties for the nine months ended September 30, 2016, totalled $541.0 million, a $48.8 million or 9.9%
increase over the nine months ended September 30, 2015. Net base rent increased by $26.5 million or 8.2%, primarily due to rent
increases from new and renewing tenants, partially offset by higher vacancies, and income from acquisitions that closed during 2015
and 2016, as well as Earnouts and completed Developments that occurred during 2015 and 2016. Property operating cost recoveries
increased by $11.4 million or 7.1% due to the related increases in recoverable costs with the growth of the Trust's portfolio. In addition,
the increase to miscellaneous revenue for the nine months ended September 30, 2016 was primarily due to $9.7 million settlement
proceeds associated with the Target lease terminations net of other amounts.
The Trust recovered 96.6% of total recoverable expenses during the nine months ended September 30, 2016, compared to 98.8% in
the same period last year. Non-recovery of most of the remaining costs resulted from higher vacancies, fixed recovery rates for some
tenants, restrictions contained in certain anchor tenant leases, unfavourable property operating cost recovery adjustments made in 2016
for prior years of $0.6 million and favourable realty tax adjustments made in 2015 for prior years of $1.3 million.
In comparison to the same period in 2015, NOI increased by $32.4 million or 10.0% in 2016, primarily as a result of: a) the growth of
the Trust's portfolio mainly due to the Transaction that closed on May 28, 2015, resulting in an increase to NOI of $24.6 million and
b) the increase to miscellaneous revenue, which was primarily due to $9.7 million settlement proceeds associated with the Target lease
terminations net of other amounts.
The Trust's portfolio is located across Canada with properties in each of the provinces. 75.1% of the gross revenue of the portfolio
is located in Ontario and Quebec, primarily in the Greater Toronto and Montreal areas.

MANAGEMENT'S DISCUSSION AND ANALYSIS
10 SMART REAL ESTATE INVESTMENT TRUST | THIRD QUARTER REPORT 2016
Top 10 Tenants
The 10 largest tenants (by rental revenue) account for 49.2% of portfolio revenue as follows:
# TenantNumber of
StoresRental Revenue (1)
($ millions)
Percentage ofTotal Rental
RevenueArea
(sq. ft.)
Percentage ofTotal Gross
Leasable Area
1 Walmart (2) 94 187.8 26.6% 13,312,041 42.3%
2 Canadian Tire, Mark's and FGL Sports 66 30.9 4.4% 1,203,388 3.8%
3 Winners, HomeSense and Marshalls 48 28.0 4.0% 1,237,483 3.9%
4 Sobeys 17 17.2 2.4% 735,485 2.3%
5 Reitmans 106 17.1 2.4% 568,342 1.8%
6 Loblaws, Shoppers Drug Mart 19 16.4 2.3% 710,484 2.3%
7 Rona 7 14.1 2.0% 734,668 2.3%
8 Best Buy 23 13.9 2.0% 524,027 1.7%
9 Michaels 24 11.2 1.6% 459,589 1.5%
10 Dollarama 44 10.7 1.5% 413,654 1.3%
448 347.3 49.2% 19,899,161 63.2%
(1) Annualized as at September 30, 2016.(2) The Trust has a total of 94 Walmarts under lease, of which 89 are Supercentres. The Trust has 14 shopping centres with Walmart as shadow anchors, of which 13 are Supercentres.

MANAGEMENT'S DISCUSSION AND ANALYSIS
SMART REAL ESTATE INVESTMENT TRUST | THIRD QUARTER REPORT 2016 11
Net Operating Income (NOI)NOI from continuing operations is defined as rentals from investment properties less property operating costs net of service and other
revenues. Disclosing the NOI contribution from each of same properties, acquisitions, dispositions, Earnouts and Development
activities highlights the impact each component has on aggregate NOI. Straight-lining of rent and other adjustments have been excluded
from NOI attributed to same properties, acquisitions, dispositions, Earnouts and Development activities in the table below to highlight
the impact of growth in occupancy, rent uplift and productivity.
Quarterly Comparison to Prior Year
(in thousands of dollars)Three Months EndedSeptember 30, 2016
Three Months EndedSeptember 30, 2015
Same properties 110,576 111,952
Acquisitions 902 1,026
Earnouts and Developments 3,687 3,446
NOI before adjustments 115,165 116,424
Amortization of tenant incentives (1,652) (1,390)
Lease termination and other adjustments 1,530 805
Straight-lining of rents 264 304
Royalties (169) (157)
Other revenue — 244
NOI 115,138 116,230
"Same properties" in the table above refer to those income properties that were owned by the Trust on July 1, 2015 and throughout
2015 to September 30, 2016. The same properties' NOI for the three months ended September 30, 2016 decreased by 1.2% or $1.4
million over the same quarter last year primarily due to an increase in recovery shortfalls of $1.5 million attributed to prior year realty
tax adjustments and higher costs associated with vacancies.
In addition, NOI before adjustments decreased by 1.1% or $1.3 million during the three months ended September 30, 2016 over the
same quarter last year. The decrease in NOI before adjustments was primarily due to the decrease in same properties' NOI of $1.4
million, partially offset by a net increase in Earnouts and Developments completed during the period of $0.1 million.
Year-to-Date Comparison to Prior Year
Nine Months Ended Nine Months Ended
(in thousands of dollars) September 30, 2016 September 30, 2015
Same properties 293,135 291,927
Acquisitions 44,070 21,126
Earnouts and Developments 9,335 7,264
NOI before adjustments 346,540 320,317
Amortization of tenant incentives (4,472) (4,065)
Lease termination and other adjustments(1) 14,005 5,173
Straight-lining of rents 709 1,596
Royalties (487) (391)
Other revenue — 1,237
NOI 356,295 323,867
(1) Includes $9.7 million settlement proceeds associated with the Target lease terminations net of other amounts recorded during the nine months ended September 30, 2016 (nine months
ended September 30, 2015 – $nil).
"Same properties" in the table above refer to those income properties that were owned by the Trust on January 1, 2015, and throughout
2015 to September 30, 2016. The same properties' NOI for the nine months ended September 30, 2016 increased by 0.4% or $1.2
million over the same period last year primarily due to an increase in net lease-up of vacant space, rent increases in renewing tenants
and step-ups in existing leases of $1.7 million, a decrease in other non-recoverable costs of $1.4 million and an increase in miscellaneous
revenue of $0.5 million mainly attributable to percentage rent increases at the Toronto Premium Outlets, partially offset by an increase
in recovery shortfalls of $2.5 million attributable to prior year realty tax adjustments and higher vacancies.
In addition, NOI before adjustments increased by 8.2% or $26.2 million during the nine months ended September 30, 2016 from
$320.3 million during the nine months ended September 30, 2015. The increase was primarily due to same properties' NOI growth of
$1.2 million, acquisitions of $22.9 million and Earnouts and Developments completed during the year of $2.1 million. In addition,
lease terminations and other adjustments for the nine months ended September 30, 2016, increased by $8.8 million to $14.0 million
compared to the same period in 2015, primarily due to $9.7 million settlement proceeds associated with the Target lease terminations
net of other amounts.

MANAGEMENT'S DISCUSSION AND ANALYSIS
12 SMART REAL ESTATE INVESTMENT TRUST | THIRD QUARTER REPORT 2016
Run-rate NOI
Management's estimate of the annual property run-rate NOI (excluding the impact of straight-line rent and other adjustments) at
September 30, 2016 is $464.4 million. Assuming a 1.0% same property NOI growth over 2016 (remainder of year) and 2017, FFO is
forecasted to increase by $0.007 (annualized $0.030) and $0.030 per Unit, respectively.
Other Measures of Performance
The following are measures sometimes used by Canadian real estate investment trusts ("REITs") as indicators of financial performance.
Management uses these measures to analyze operating performance. Because one of the factors that may be considered relevant by
prospective investors is the cash distributed by the Trust relative to the price of the Units, management believes these measures are a
useful supplemental measure that may assist prospective investors in assessing an investment in Units. The Trust analyzes its cash
distributions against these measures to assess the stability of the monthly cash distributions to Unitholders. Because these measures
are not standardized as prescribed by IFRS, they may not be comparable to similar measures presented by other trusts. These measures
are not intended to represent operating profits for the period; nor should they be viewed as an alternative to net income, cash flow
from operating activities or other measures of financial performance calculated in accordance with IFRS. The calculations are derived
from the unaudited interim condensed consolidated financial statements for the quarter ended September 30, 2016, unless otherwise
stated, do not include any assumptions, do not include any forward-looking information and are consistent with prior reporting periods.
Funds From Operations (FFO)While FFO does not have a standardized meaning prescribed by IFRS, it is a non-IFRS financial measure of operating performance
widely used by the real estate industry. The Real Property Association of Canada ("REALpac") recommends that FFO be determined
by reconciling from net income.
For the three months ended September 30, 2016, FFO excluding adjustments decreased by $0.4 million or 0.5% to $83.5 million and
remained the same on a per Unit basis ($0.54) compared to the same quarter of 2015. The decrease in FFO excluding adjustments of
$0.4 million was primarily due to a decrease in NOI of $1.1 million, an increase in general and administrative expense of $0.5 million,
partially offset by an increase in salaries and related costs attributed to leasing - which are added back to FFO - in the amount of $0.9
million and an increase in interest income of $0.1 million.
For the nine months ended September 30, 2016, FFO excluding adjustments increased by $30.9 million or 13.5% to $260.1 million
and by 5.6% to $1.67 on a per Unit basis compared to the same period of 2015. The increase in FFO excluding adjustments of $30.9
million was primarily due to an increase in NOI of $32.4 million, an increase in salaries and related costs attributed to leasing - which
are added back to FFO - in the amount of $2.8 million, partially offset by an increase in general and administrative expense of $5.6
million.
Adjusted Funds From Operations (AFFO)Since FFO does not consider capital transactions, AFFO is presented herein as an alternative measure of determining available cash
flow. AFFO is not defined by IFRS.
For the three months ended September 30, 2016, AFFO decreased by $1.0 million or 1.2% to $78.7 million and by 1.9% to $0.51 on
a per Unit basis compared to the same quarter of 2015. The decrease in AFFO of $1.0 million was primarily due to the decreases
described in FFO above for the three months ended September 30, 2016, further decreased by adjusted salaries and related costs
attributed to leasing of $0.6 million.
For the nine months ended September 30, 2016, AFFO increased by $29.6 million or 13.7% to $245.7 million and by 6.1% to $1.58
on a per Unit basis compared to the same period of 2015. The increase in AFFO of $29.6 million was primarily due to the increases
described in FFO above for the nine months ended September 30, 2016, further offset by adjusted salaries and related costs attributed
to leasing of $2.0 million.

MANAGEMENT'S DISCUSSION AND ANALYSIS
SMART REAL ESTATE INVESTMENT TRUST | THIRD QUARTER REPORT 2016 13
Reconciliations of FFO and AFFOThe analysis below illustrates a reconciliation of the Trust's net income to FFO and AFFO for the three months ended September 30,
2016 and September 30, 2015:
(in thousands of dollars, except per Unit amounts)Three Months EndedSeptember 30, 2016
Three Months EndedSeptember 30, 2015
Increase/(Decrease)
Net income and comprehensive income 56,731 92,574 (35,843)
Add (deduct):
Change in fair value of investment properties 9,524 (7,484) 17,008
Change in fair value of financial instruments (3,728) (1,922) (1,806)
Amortization of intangible assets 333 — 333
Amortization of tenant improvement allowance 1,652 1,390 262
Distributions on LP Units and vested deferred units recorded asinterest expense 479 526 (47)
Salaries and related costs attributed to leasing activities(1) 1,154 283 871
Adjustments relating to investment in associates:
Indirect interest with respect to the development portion(2) 555 541 14
Change in fair value of investment properties 425 (2,027) 2,452
Change in fair value on interest rate swap agreements (126) — (126)
FFO 66,999 83,881 (16,882)
Yield maintenance on redemption of unsecured debentures and related write-off of unamortized financing costs(3) 16,457 — 16,457
FFO excluding adjustments 83,456 83,881 (425)
Add (deduct):
Straight-lining of rents (264) (305) 41
Adjusted salaries and related costs attributed to leasing (630) — (630)
Sustaining capital expenditures (1,962) (2,871) 909
Sustaining leasing costs (1,914) (1,050) (864)
AFFO 78,686 79,655 (969)
Per Unit – basic/diluted(4):
FFO $0.43/$0.43 $0.55/$0.54 $-0.12/$-0.11
FFO excluding adjustments $0.54/$0.54 $0.55/$0.54 $-0.01/$0.00
AFFO $0.51/$0.51 $0.52/$0.52 $-0.01/$-0.01
Payout ratio:
FFO 96.1% 74.1% 22.0%
FFO excluding adjustments 76.5% 74.1% 2.4%
AFFO 81.0% 76.9% 4.1%
(1) Internal expenses for leasing, primarily salaries, of $1.2 million were incurred in the three months ended September 30, 2016 (three months ended September 30, 2015 – $0.3 million)
and were eligible to be added back to FFO based on the revision to the definition of FFO, in the REALpac white paper published in April 2014 that provided for an adjustment to
incremental leasing expenses for the cost of salaried staff. This adjustment to FFO made results more comparable between real estate entities that expensed their internal leasing
departments and those that capitalized external leasing expenses. (2) Indirect interest is not capitalized to properties under development of investment in associates under IFRS but is a permitted adjustment under REALpac's definition of FFO. The
amount is based on the total cost incurred with respect to the development portion of investment in associates multiplied by the Trust's weighted average cost of debt.(3) The three months ended September 30, 2016 include $15.1 million of yield maintenance costs on redemption of unsecured debentures and $1.3 million of accelerated amortization of
deferred financing costs (three months ended September 30, 2015 – $nil).(4) Diluted FFO and AFFO are adjusted for the dilutive effect of vested deferred units and convertible debentures, which are not dilutive for net income purposes. To calculate diluted FFO
and FFO excluding adjustments for the three months ended September 30, 2016, convertible debenture interest of $nil and accretion expense of $nil are added back to net income and
580,231 Units are added back to the weighted average Units outstanding (three months ended September 30, 2015 – convertible debenture interest of $nil and accretion expense of $nil,
and 648,837 Units, respectively). To calculate diluted AFFO for the three months ended September 30, 2016, convertible debenture interest of $nil is added back to net income and
580,231 Units are added back to the weighted average Units outstanding (three months ended September 30, 2015 – $nil and 648,837 Units, respectively).

MANAGEMENT'S DISCUSSION AND ANALYSIS
14 SMART REAL ESTATE INVESTMENT TRUST | THIRD QUARTER REPORT 2016
The analysis below illustrates a reconciliation of the Trust's net income to FFO and AFFO for the nine months ended September 30,
2016 and September 30, 2015:
(in thousands of dollars, except per Unit amounts)Nine Months EndedSeptember 30, 2016
Nine Months EndedSeptember 30, 2015
Increase/(Decrease)
Net income and comprehensive income(1) 232,246 227,812 4,434
Add (deduct):
Change in fair value of investment properties (631) (16,764) 16,133
Change in fair value of financial instruments 6,218 (157) 6,375
Loss on sale of investment properties 126 34 92
Amortization of intangible assets 998 — 998
Amortization of tenant improvement allowance 4,472 4,065 407
Distributions on LP Units and vested deferred units recorded asinterest expense 1,486 1,319 167
Salaries and related costs attributed to leasing activities(2) 3,553 583 2,970
Adjustments relating to investment in associates:
Indirect interest with respect to the development portion(3) 1,640 1,645 (5)
Change in fair value of investment properties (6,699) (2,004) (4,695)
Change in fair value on interest rate swap agreements 192 — 192
Acquisition costs(4) — 1,018 (1,018)
FFO(1) 243,601 217,551 26,050
Yield maintenance on redemption of unsecured debentures and related write-off of unamortized financing costs(5) 16,457 11,023 5,434
Write-off of unamortized financing costs on redemption of convertibledebentures — 588 (588)
FFO excluding adjustments(1) 260,058 229,162 30,896
Add (deduct):
Accretion on convertible debentures — 354 (354)
Straight-lining of rents (709) (1,596) 887
Adjusted salaries and related costs attributed to leasing (2,011) — (2,011)
Sustaining capital expenditures (5,886) (8,613) 2,727
Sustaining leasing costs (5,742) (3,150) (2,592)
AFFO(1) 245,710 216,157 29,553
Per Unit – basic/diluted(1)(6):
FFO $1.57/$1.57 $1.51/$1.50 $0.06/$0.07
FFO excluding adjustments $1.68/$1.67 $1.59/$1.58 $0.09/$0.09
AFFO $1.59/$1.58 $1.50/$1.49 $0.09/$0.09
Payout ratio(1):
FFO 78.9% 80.1% -1.2%
FFO excluding adjustments 74.1% 76.0% -1.9%
AFFO 78.4% 80.6% -2.2%
(1) Includes $9.7 million settlement proceeds associated with the Target lease terminations net of other amounts recorded during the nine months ended September 30, 2016 (nine months
ended September 30, 2015 – $nil). For the nine months ended September 30, 2016, the net settlement proceeds had an impact on both FFO per Unit and AFFO per Unit by $0.06
(nine months ended September 30, 2015 – $nil).(2) Internal expenses for leasing, primarily salaries, of $3.6 million were incurred in the nine months ended September 30, 2016 and were eligible to be added back to FFO based on the
revision to the definition of FFO, in the REALpac white paper published in April 2014 that provided for an adjustment to incremental leasing expenses for the cost of salaried staff.
This adjustment to FFO made results more comparable between real estate entities that expensed their internal leasing departments and those that capitalized external leasing expenses. (3) Indirect interest is not capitalized to properties under development of investment in associates under IFRS but is a permitted adjustment under REALpac's definition of FFO. The
amount is based on the total cost incurred with respect to the development portion of investment in associates multiplied by the Trust's weighted average cost of debt.(4) Acquisition costs relate to the costs associated with the acquisition of the Penguin platform and brand acquisition.(5) The nine months ended September 30, 2016 include $15.1 million of yield maintenance costs on redemption of unsecured debentures and $1.3 million of accelerated amortization of
deferred financing costs (nine months ended September 30, 2015 – $10.8 million of yield maintenance costs and $0.2 million of accelerated amortization of deferred financing costs).(6) Diluted FFO and AFFO are adjusted for the dilutive effect of vested deferred units and convertible debentures, which are not dilutive for net income purposes. To calculate diluted FFO
and FFO excluding adjustments for the nine months ended September 30, 2016, convertible debenture interest of $nil and accretion expense of $nil are added back to net income and
615,103 Units are added back to the weighted average Units outstanding (nine months ended September 30, 2015 – convertible debenture interest of $1.6 million and accretion expense
of $0.4 million and 2,065,608 Units, respectively). To calculate diluted AFFO for the nine months ended September 30, 2016, convertible debenture interest of $nil is added back to net
income and 615,103 Units are added back to the weighted average Units outstanding (nine months ended September 30, 2015 – $1.6 million and 2,065,608 Units, respectively).

MANAGEMENT'S DISCUSSION AND ANALYSIS
SMART REAL ESTATE INVESTMENT TRUST | THIRD QUARTER REPORT 2016 15
The analysis below shows a reconciliation from cash provided by operating facilities to FFO (excluding adjustments) and AFFO for
the three months ended September 30, 2016 and September 30, 2015:
Three Months Ended Three Months Ended
September 30, 2016 September 30, 2015
(in thousands of dollars, except per Unit amounts) FFO AFFO FFO AFFO
Cash provided by operating activities 83,717 83,717 81,686 81,686
Earnings from associates, net of distributions (86) (86) 2,267 2,267
Amortization of equipment (172) (172) (180) (180)
Amortization of acquisition date fair value adjustments on assumed debt 868 868 973 973
Amortization of deferred financing costs (1,716) (1,716) (797) (797)
Capital lease obligation interest (124) (124) (124) (124)
Straight-line rent adjustments 264 — 304 —
Deferred unit compensation expense, net of redemptions 897 897 (169) (169)
Long Term Incentive Plan expense (657) (657) (1,199) (1,199)
Expenditures on direct leasing costs 2,414 2,414 112 112
Expenditures on tenant incentives of properties under development 462 462 344 344
Changes in other non-cash operating items (5,738) (5,738) 1,867 1,867
Adjustments relating to investment in associates:
Indirect interest with respect to the development portion 555 555 541 541
Change in fair value of investment properties 425 425 (2,027) (2,027)
Change in fair value on interest rate swap agreements (126) (126) — —
Salaries and related costs attributed to leasing activities 1,154 1,154 283 283
Yield maintenance on redemption of unsecured debentures and relatedwrite-off of unamortized financing costs 1,319 1,319 — —
Adjusted salaries and related costs attributed to leasing — (630) — (1)
Sustaining capital expenditures — (1,962) — (2,871)
Sustaining leasing costs — (1,914) — (1,050)
83,456 78,686 83,881 79,655
Per Unit - basic/diluted excluding adjustments $0.54/$0.54 $0.51/$0.51 $0.55/$0.54 $0.52/$0.52
Payout ratio 76.5% 81.0% 74.1% 76.9%

MANAGEMENT'S DISCUSSION AND ANALYSIS
16 SMART REAL ESTATE INVESTMENT TRUST | THIRD QUARTER REPORT 2016
The analysis below shows a reconciliation from cash provided by operating facilities to FFO (excluding adjustments) and AFFO for
the nine months ended September 30, 2016 and September 30, 2015:
Nine Months Ended Nine Months Ended
September 30, 2016 September 30, 2015
(in thousands of dollars, except per Unit amounts) FFO(1) AFFO(1) FFO AFFO
Cash provided by operating activities 206,665 206,665 185,051 185,051
Earnings from associates, net of distributions 7,022 7,022 2,425 2,425
Amortization of equipment (508) (508) (403) (403)
Amortization of acquisition date fair value adjustments on assumed debt 2,701 2,701 1,880 1,880
Accretion on convertible debentures — — (354) —
Amortization of deferred financing costs (3,252) (3,252) (3,544) (3,544)
Capital lease obligation interest (379) (379) (326) (326)
Straight-line rent adjustments 709 — 1,596 —
Deferred unit compensation expense, net of redemptions 3,985 3,985 4,177 4,177
Long Term Incentive Plan expense (1,612) (1,612) (1,860) (1,860)
Payment of vested Long Term Incentive Plan performance units 574 574 — —
Expenditures on direct leasing costs 4,615 4,615 3,703 3,703
Expenditures on tenant incentives of properties under development 779 779 3,373 3,373
Changes in other non-cash operating items 38,754 38,754 31,401 31,401
Adjustments relating to investment in associates:
Indirect interest with respect to the development portion 1,640 1,640 1,645 1,645
Change in fair value of investment properties (6,699) (6,699) (2,004) (2,004)
Change in fair value on interest rate swap agreements 192 192 — —
Salaries and related costs attributed to leasing activities 3,553 3,553 583 583
Yield maintenance on redemption of unsecured debentures and relatedwrite-off of unamortized financing costs 1,319 1,319 213 213
Write-off of unamortized financing costs on redemption of convertibledebentures — — 588 588
Acquisition costs — — 1,018 1,018
Adjusted salaries and related costs attributed to leasing — (2,011) — —
Sustaining capital expenditures — (5,886) — (8,613)
Sustaining leasing costs — (5,742) — (3,150)
260,058 245,710 229,162 216,157
Per Unit - basic/diluted excluding adjustments $1.68/$1.67 $1.59/$1.58 $1.59/$1.58 $1.50/$1.49
Payout ratio 74.1% 78.4% 76.0% 80.6%
(1) Includes $9.7 million settlement proceeds associated with the Target lease terminations net of other amounts recorded during the nine months ended September 30, 2016 (nine months
ended September 30, 2015 – $nil). For the nine months ended September 30, 2016, the net settlement proceeds had an impact on both FFO per Unit and AFFO per Unit by $0.06 (nine
months ended September 30, 2015 – $nil).
MANAGEMENT'S DISCUSSION AND ANALYSIS
SMART REAL ESTATE INVESTMENT TRUST | THIRD QUARTER REPORT 2016 17
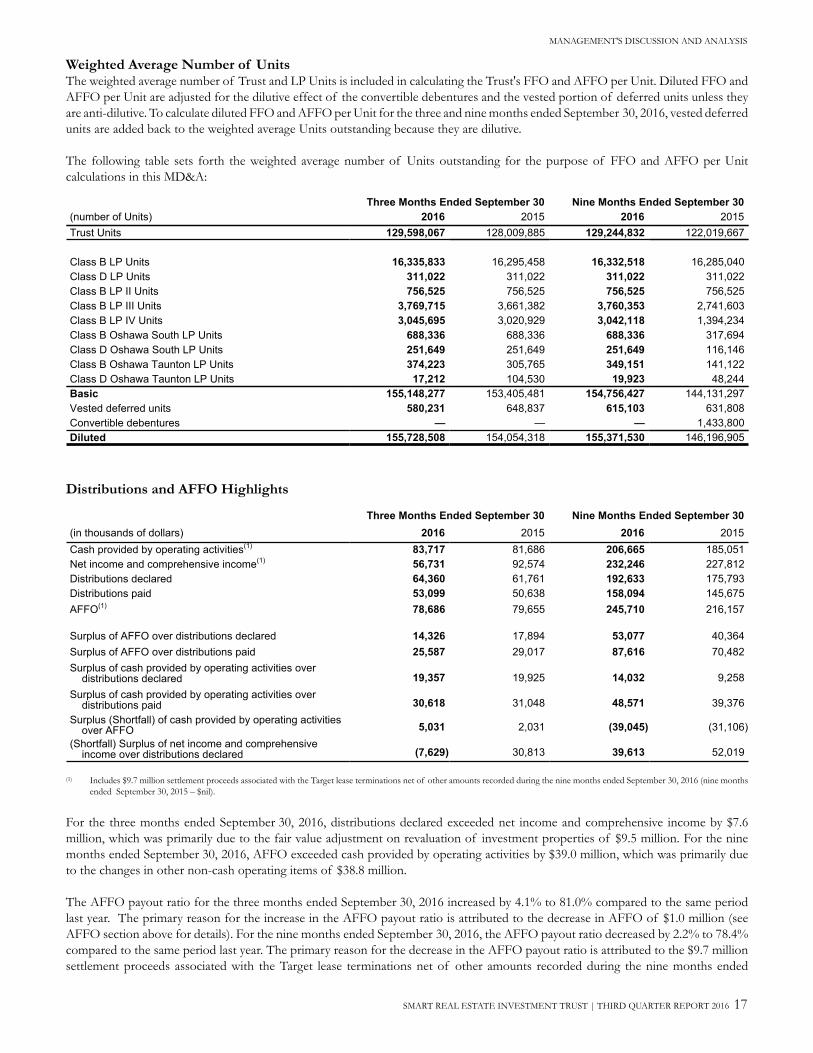
Weighted Average Number of UnitsThe weighted average number of Trust and LP Units is included in calculating the Trust's FFO and AFFO per Unit. Diluted FFO and
AFFO per Unit are adjusted for the dilutive effect of the convertible debentures and the vested portion of deferred units unless they
are anti-dilutive. To calculate diluted FFO and AFFO per Unit for the three and nine months ended September 30, 2016, vested deferred
units are added back to the weighted average Units outstanding because they are dilutive.
The following table sets forth the weighted average number of Units outstanding for the purpose of FFO and AFFO per Unit
calculations in this MD&A:
Three Months Ended September 30 Nine Months Ended September 30
(number of Units) 2016 2015 2016 2015
Trust Units 129,598,067 128,009,885 129,244,832 122,019,667
Class B LP Units 16,335,833 16,295,458 16,332,518 16,285,040
Class D LP Units 311,022 311,022 311,022 311,022
Class B LP II Units 756,525 756,525 756,525 756,525
Class B LP III Units 3,769,715 3,661,382 3,760,353 2,741,603
Class B LP IV Units 3,045,695 3,020,929 3,042,118 1,394,234
Class B Oshawa South LP Units 688,336 688,336 688,336 317,694
Class D Oshawa South LP Units 251,649 251,649 251,649 116,146
Class B Oshawa Taunton LP Units 374,223 305,765 349,151 141,122
Class D Oshawa Taunton LP Units 17,212 104,530 19,923 48,244
Basic 155,148,277 153,405,481 154,756,427 144,131,297
Vested deferred units 580,231 648,837 615,103 631,808
Convertible debentures — — — 1,433,800
Diluted 155,728,508 154,054,318 155,371,530 146,196,905
Distributions and AFFO Highlights
Three Months Ended September 30 Nine Months Ended September 30
(in thousands of dollars) 2016 2015 2016 2015
Cash provided by operating activities(1) 83,717 81,686 206,665 185,051
Net income and comprehensive income(1) 56,731 92,574 232,246 227,812
Distributions declared 64,360 61,761 192,633 175,793
Distributions paid 53,099 50,638 158,094 145,675
AFFO(1) 78,686 79,655 245,710 216,157
Surplus of AFFO over distributions declared 14,326 17,894 53,077 40,364
Surplus of AFFO over distributions paid 25,587 29,017 87,616 70,482
Surplus of cash provided by operating activities overdistributions declared 19,357 19,925 14,032 9,258
Surplus of cash provided by operating activities overdistributions paid 30,618 31,048 48,571 39,376
Surplus (Shortfall) of cash provided by operating activitiesover AFFO 5,031 2,031 (39,045) (31,106)
(Shortfall) Surplus of net income and comprehensiveincome over distributions declared (7,629) 30,813 39,613 52,019
(1) Includes $9.7 million settlement proceeds associated with the Target lease terminations net of other amounts recorded during the nine months ended September 30, 2016 (nine months
ended September 30, 2015 – $nil).
For the three months ended September 30, 2016, distributions declared exceeded net income and comprehensive income by $7.6
million, which was primarily due to the fair value adjustment on revaluation of investment properties of $9.5 million. For the nine
months ended September 30, 2016, AFFO exceeded cash provided by operating activities by $39.0 million, which was primarily due
to the changes in other non-cash operating items of $38.8 million.
The AFFO payout ratio for the three months ended September 30, 2016 increased by 4.1% to 81.0% compared to the same period
last year. The primary reason for the increase in the AFFO payout ratio is attributed to the decrease in AFFO of $1.0 million (see
AFFO section above for details). For the nine months ended September 30, 2016, the AFFO payout ratio decreased by 2.2% to 78.4%
compared to the same period last year. The primary reason for the decrease in the AFFO payout ratio is attributed to the $9.7 million
settlement proceeds associated with the Target lease terminations net of other amounts recorded during the nine months ended

MANAGEMENT'S DISCUSSION AND ANALYSIS
18 SMART REAL ESTATE INVESTMENT TRUST | THIRD QUARTER REPORT 2016
September 30, 2016, which resulted in a decrease in the AFFO payout ratio from 82.0% to 78.4% for the nine months ended
September 30, 2016.
Management determines the Trust's Unit cash distribution rate by, among other considerations, its assessment of cash flow as determined
using certain non-IFRS measures. As such, management feels the cash distributions are not an economic return of capital, but a
distribution of sustainable cash flow from operations. Management targets a payout ratio of approximately 77% to 82% of AFFO,
which allows for any unforeseen expenditures for the maintenance of productive capacity. Based on current facts and assumptions,
management does not anticipate cash distributions will be reduced or suspended in the foreseeable future.
In any given period, the distributions declared may differ from cash provided by operating activities, primarily due to seasonal fluctuations
in non-cash operating items (amounts receivable, prepaid expenses, deposits, accounts payable and accrued liabilities). These seasonal
or short-term fluctuations are funded, if necessary, by the revolving operating facility. In addition, the distributions declared include a
component funded by the Trust's distribution reinvestment plan. Management anticipates that distributions declared will, in the
foreseeable future, continue to vary from net income because net income includes fair value adjustments to investment properties, fair
value changes in financial instruments, and other adjustments and also because distributions are determined based on non-IFRS cash
flow measures, which include consideration of the maintenance of productive capacity. Management will continue to assess the
sustainability of cash and non-cash distributions in each financial reporting period.
Leasing Activities and Lease Expiries
Leasing ActivitiesFor the quarter ended September 30, 2016, the Trust achieved an occupancy level of 98.3% (June 30, 2016 – 98.2%). Including committed
leases, the occupancy level for the quarter ended September 30, 2016 was 98.5%. The Trust was able to achieve this high occupancy
level due to the quality and strength of a portfolio that has over 100 Walmart-anchored, or shadow-anchored locations. At September 30,
2016, approximately 92,000 square feet of space has been leased or is in the final stages of being leased for occupancy of vacant space
in the remainder of 2016 and in 2017.
Since Q3 2015, the Trust's quarterly occupancy level is summarized as follows:
Q3 Q2 Q1 Q4 Q3
2016 2016 2016 2015 2015
98.3% 98.2% 98.5% 98.7% 98.7%
2016 Lease ExpiriesAt September 30, 2016, the Trust completed or was near completion on lease renewals totalling 1,453,539 square feet of space,
representing a retention rate of approximately 81.0% of 2016 lease expiries. The average rental rate for completed transactions was
$18.13 per square foot, which represents an increase over previous in-place rents of 2.7%. Excluding anchor tenants, the average rental
rate per square foot increased by 4.0%.
September 30, 2016 June 30, 2016
Square feet renewed or near completion 1,453,539 1,400,204
Average net rent per square foot $18.13 $17.04
Increase in average net rent per square foot $0.48 $0.41
Percentage increase in average net rent per square foot 2.7% 3.5%
Percentage increase in average net rent per square foot excluding anchor tenants 4.0% 5.1%

MANAGEMENT'S DISCUSSION AND ANALYSIS
SMART REAL ESTATE INVESTMENT TRUST | THIRD QUARTER REPORT 2016 19
Lease expiries for the total portfolio are as follows:
Area AreaAnnualized Base Rent
Average Base Rent psf (1)
Year of Expiry (sq. ft.) (%) ($000s) ($)
Month-to-month and holdovers 267,070 0.8% 5,141 19.25
2016 (remainder of year) 187,704 0.6% 3,436 18.30
2017 1,761,175 5.6% 33,130 18.81
2018 2,390,750 7.6% 50,501 21.12
2019 3,094,529 9.8% 47,567 15.37
2020 3,193,548 10.2% 48,276 15.12
2021 3,348,584 10.6% 47,202 14.10
Beyond 16,688,118 53.1% 236,854 14.19
Vacant 520,519 1.7% — —
Total 31,451,997 100.0% 472,107 15.26
(1) The total average base rent per square foot excludes vacant space of 520,519 square feet.
Lease expiries for the portfolio, excluding anchor tenants(1), are as follows:
Area AreaAnnualized Base Rent
Average Base Rent psf (2)
Year of Expiry (sq. ft.) (%) ($000s) ($)
Month-to-month and holdovers 175,732 0.6% 3,668 20.87
2016 (remainder of year) 187,704 0.6% 3,436 18.30
2017 1,302,022 4.1% 27,053 20.78
2018 1,889,690 6.0% 42,902 22.70
2019 1,643,935 5.2% 36,187 22.01
2020 1,484,837 4.7% 32,183 21.67
2021 1,265,856 4.0% 26,848 21.21
Beyond 4,336,853 13.8% 96,732 22.30
Vacant 485,036 1.5% — —
Total 12,771,665 40.5% 269,009 21.89
(1) An anchor tenant is defined as any tenant with leasable area greater than 30,000 square feet.(2) The total average base rent per square foot excludes vacant space of 485,036 square feet.

MANAGEMENT'S DISCUSSION AND ANALYSIS
20 SMART REAL ESTATE INVESTMENT TRUST | THIRD QUARTER REPORT 2016
Mortgages, Loans and Notes Receivable and Interest Income
(in thousands of dollars) September 30, 2016 December 31, 2015
Mortgages, loans and notes receivable
Mortgages receivable (Mezzanine Financing) 123,032 127,333
Loans receivable 60,930 61,600
Notes receivable 2,979 2,928
186,941 191,861
Three Months Ended September 30 Nine Months Ended September 30
(in thousands of dollars) 2016 2015 2016 2015
Interest income
Mortgage and loan interest 2,783 2,718 8,354 8,310
Note receivable interest 67 67 199 197
Bank interest 127 91 238 640
2,977 2,876 8,791 9,147
Mortgages Receivable (Mezzanine Financing)In addition to direct property acquisitions, the Trust provides Mezzanine Financing to developers on terms that include an option to
acquire an interest in the mortgaged property on substantial completion. As at September 30, 2016, the Trust had total commitments
of $268.8 million to fund mortgages receivable under this program. Five mortgages have an option entitling the Trust to acquire a 50%
interest in the property on substantial completion at an agreed-upon formula. The properties under the Mezzanine Financing have 0.7
million potential square feet available (discussed in "Potential Future Pipeline").
The details of the mortgages receivable are set out in the following table:
(in thousands of dollars)
AmountOutstanding
($)Committed
($)
AmountGuaranteedby Penguin
($) Maturity DateInterest
RateOption
(%)
Potential Area Upon Exercising Purchase Option
(sq. ft.)(6)Project
Pitt Meadows, BC 24,951 60,119 24,951 December 2017 6.93% 50% 225,303
Salmon Arm, BC (1)(2) 16,187 23,264 16,187 October 2017 4.30% — —
Aurora (South), ON 14,635 34,807 14,635 June 2020 6.75% 50% 96,518
Caledon (Mayfield), ON 8,480 10,372 8,480 December 2016 7.00% 50% —
Innisfil, ON (1)(3) 18,675 27,077 9,495 December 2020 2.89% — —
Mirabel (Shopping Centre), QC (4) — 18,262 — December 2022 7.50% — —
Mirabel (Option Lands), QC (5) — 5,721 — December 2022 7.50% — —
Toronto (StudioCentre), ON (1) 24,481 36,102 13,981 December 2017 6.87% 50% 236,270
Vaughan (7 & 427), ON 15,623 53,124 15,623 December 2020 6.75% 50% 151,015
123,032 268,848 103,352 5.92% 709,106
(1) The Trust owns a 50% interest in this property, with the other 50% interest owned by Penguin. The loan is secured against Penguin's interest in the property. (2) Monthly variable rate based on a fixed rate of 6.35% on loans outstanding up to $7.2 million and banker's acceptance rate plus 1.75% on any additional loans above $7.2 million. (3) The Trust owns a 50% interest in this property, with the other 50% interest owned by Penguin. The monthly variable rate is based on the banker's acceptance rate plus 2.00%. The interest
rate on this mortgage will reset in 2018 to the four-year Government of Canada bond rate plus 4.0%, subject to a lower limit of 6.75% and an upper limit of 7.75%. (4) The Trust owns a 33.3% interest in this property. The loan is secured against a 33.3% interest owned by Penguin, as well as a guarantee by Penguin. (5) The Trust owns a 25% interest in this property. The loan is secured against a 25% interest owned by Penguin, as well as a guarantee by Penguin. (6) The potential area upon exercising purchase option represents management's expectation as at September 30, 2016.
As at September 30, 2016, mortgages totalling $123.0 million had been advanced to Penguin at a weighted average interest rate of
5.92% per annum. During the nine months ended September 30, 2016, including monthly interest accruals, $5.7 million was advanced
and $10.0 million was repaid. The mortgages are interest only up to a predetermined maximum with rates ranging from a variable rate
based on the banker's acceptance rate plus 1.75% to 2.00% to a fixed rate of 6.75% to 7.50%. The mortgages mature on various dates
between 2016 and 2022 with options to extend under certain conditions. The mortgage security includes a first or second charge on
properties, assignments of rents and leases and general security agreements.
In addition, $103.4 million of the outstanding balance is guaranteed by Penguin (as illustrated in the table above). The loans are subject
to individual loan guarantee agreements that provide additional guarantees for all interest and principal advanced on amounts as of
September 30, 2016 for all nine loans. The guarantees decrease upon achievement of certain specified value-enhancing events.

MANAGEMENT'S DISCUSSION AND ANALYSIS
SMART REAL ESTATE INVESTMENT TRUST | THIRD QUARTER REPORT 2016 21
Assuming that developments are completed as anticipated, and assuming that borrowers repay their mortgages in accordance with the
terms of the agreements governing such mortgages, expected repayments of the outstanding balances would be as follows:
(in thousands of dollars)Mortgages
(#)
PrincipalRepayments
($)
2016 1 8,480
2017 3 65,619
2020 3 48,933
7 123,032
Loans Receivable
Issued to Maturity Date Interest Rate September 30, 2016 December 31, 2015
OneREIT(1) October 2016 6.75% 40,314 40,314
Unrelated party(2) September 2018 4.50% 11,500 11,500
Penguin(3) November 2020 Variable 9,116 9,786
60,930 61,600
(1) This loan is secured by a subordinate charge on seven properties.(2) This loan is secured by either a first or second charge on properties, assignments of rents and leases, and general security agreements.(3) This loan was provided pursuant to a development management agreement with Penguin with a total loan facility of $20,000. Repayment of the pro-rata share of the outstanding loan
amount is due upon the completion of each Earnout event. The loan bears interest at 10 basis points plus the lower of: i) the Canadian prime rate plus 45 basis points, or ii) the Canadian
Dealer Offered Rate plus 145 basis points.
Notes ReceivableNotes receivable of $3.0 million (December 31, 2015 – $2.9 million) have been granted to Penguin. These secured demand notes bear
interest at 9.00% per annum. During the nine months ended September 30, 2016, $0.05 million was advanced (nine months ended
September 30, 2015 – $nil).
Interest Expense
Interest expense incurred during the quarter ended September 30, 2016 totalled $49.1 million. Excluding distributions classified as
liabilities, interest expense increased by $16.9 million for the quarter ended September 30, 2016 compared to the same period in 2015,
which was primarily due to a $15.1 million increase in yield maintenance on redemption of unsecured debentures. For the nine months
ended September 30, 2016, excluding distributions classified as liabilities, interest expense increased by $4.7 million compared to the
same period in 2015, which was primarily due to a $4.3 million increase in yield maintenance on redemption of unsecured debentures.
Three Months Ended September 30 Nine Months Ended September 30
(in thousands of dollars) 2016 2015 2016 2015
Interest at stated rates 37,789 37,911 113,148 109,009
Yield maintenance on redemption of unsecured debentures 15,138 — 15,138 10,810
Amortization of acquisition date fair value adjustments (868) (973) (2,701) (1,880)
Accretion of convertible debentures — — — 354
Amortization of deferred financing costs 1,716 798 3,252 3,544
53,775 37,736 128,837 121,837
Less: Interest capitalized to properties under development (5,167) (6,045) (15,419) (13,166)
Interest expense excluding distributions classified as liabilities 48,608 31,691 113,418 108,671
Distributions on vested deferred units and Class D Units, classified as liabilities 479 526 1,486 1,319
Total interest expense 49,087 32,217 114,904 109,990
Weighted average interest rate (inclusive of acquisition date fairvalue adjustment) 3.94% 4.17% 3.95% 4.21%
MANAGEMENT'S DISCUSSION AND ANALYSIS
22 SMART REAL ESTATE INVESTMENT TRUST | THIRD QUARTER REPORT 2016
General and Administrative Expense
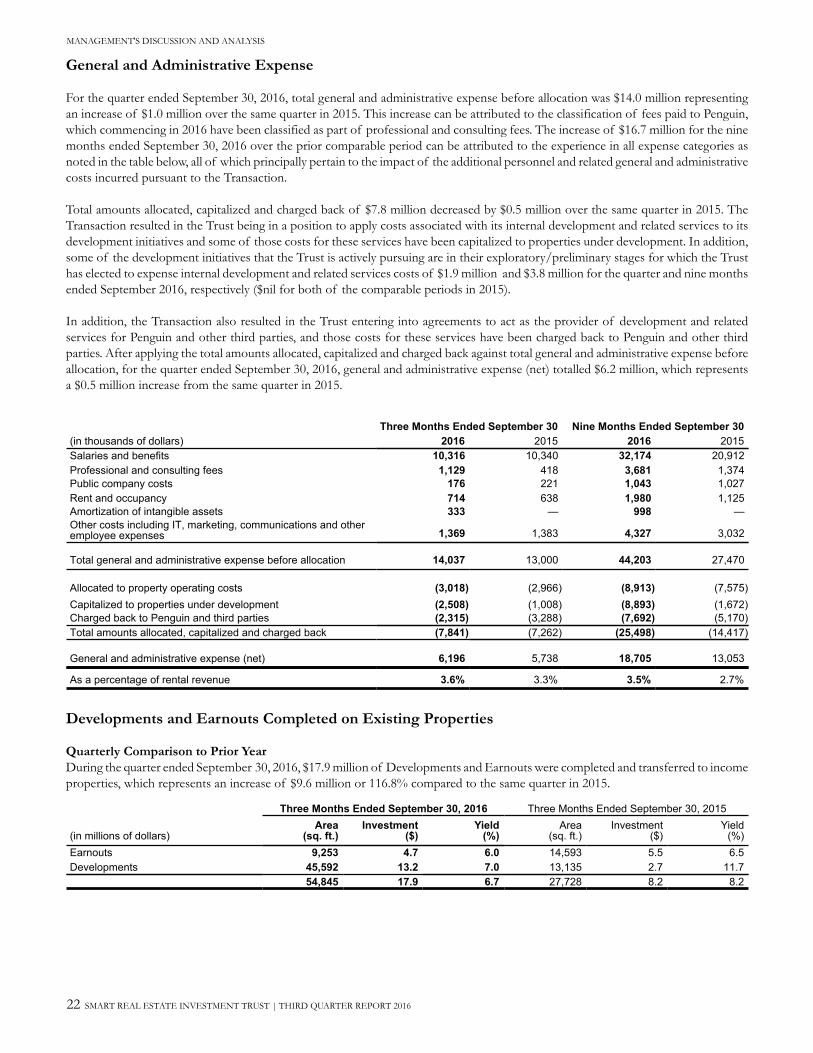
For the quarter ended September 30, 2016, total general and administrative expense before allocation was $14.0 million representing
an increase of $1.0 million over the same quarter in 2015. This increase can be attributed to the classification of fees paid to Penguin,
which commencing in 2016 have been classified as part of professional and consulting fees. The increase of $16.7 million for the nine
months ended September 30, 2016 over the prior comparable period can be attributed to the experience in all expense categories as
noted in the table below, all of which principally pertain to the impact of the additional personnel and related general and administrative
costs incurred pursuant to the Transaction.
Total amounts allocated, capitalized and charged back of $7.8 million decreased by $0.5 million over the same quarter in 2015. The
Transaction resulted in the Trust being in a position to apply costs associated with its internal development and related services to its
development initiatives and some of those costs for these services have been capitalized to properties under development. In addition,
some of the development initiatives that the Trust is actively pursuing are in their exploratory/preliminary stages for which the Trust
has elected to expense internal development and related services costs of $1.9 million and $3.8 million for the quarter and nine months
ended September 2016, respectively ($nil for both of the comparable periods in 2015).
In addition, the Transaction also resulted in the Trust entering into agreements to act as the provider of development and related
services for Penguin and other third parties, and those costs for these services have been charged back to Penguin and other third
parties. After applying the total amounts allocated, capitalized and charged back against total general and administrative expense before
allocation, for the quarter ended September 30, 2016, general and administrative expense (net) totalled $6.2 million, which represents
a $0.5 million increase from the same quarter in 2015.
Three Months Ended September 30 Nine Months Ended September 30
(in thousands of dollars) 2016 2015 2016 2015
Salaries and benefits 10,316 10,340 32,174 20,912
Professional and consulting fees 1,129 418 3,681 1,374
Public company costs 176 221 1,043 1,027
Rent and occupancy 714 638 1,980 1,125
Amortization of intangible assets 333 — 998 —
Other costs including IT, marketing, communications and otheremployee expenses 1,369 1,383 4,327 3,032
Total general and administrative expense before allocation 14,037 13,000 44,203 27,470
Allocated to property operating costs (3,018) (2,966) (8,913) (7,575)
Capitalized to properties under development (2,508) (1,008) (8,893) (1,672)
Charged back to Penguin and third parties (2,315) (3,288) (7,692) (5,170)
Total amounts allocated, capitalized and charged back (7,841) (7,262) (25,498) (14,417)
General and administrative expense (net) 6,196 5,738 18,705 13,053
As a percentage of rental revenue 3.6% 3.3% 3.5% 2.7%
Developments and Earnouts Completed on Existing Properties
Quarterly Comparison to Prior Year
During the quarter ended September 30, 2016, $17.9 million of Developments and Earnouts were completed and transferred to income
properties, which represents an increase of $9.6 million or 116.8% compared to the same quarter in 2015.
Three Months Ended September 30, 2016 Three Months Ended September 30, 2015
(in millions of dollars)Area
(sq. ft.)Investment
($)Yield
(%)Area
(sq. ft.)Investment
($)Yield
(%)
Earnouts 9,253 4.7 6.0 14,593 5.5 6.5
Developments 45,592 13.2 7.0 13,135 2.7 11.7
54,845 17.9 6.7 27,728 8.2 8.2

MANAGEMENT'S DISCUSSION AND ANALYSIS
SMART REAL ESTATE INVESTMENT TRUST | THIRD QUARTER REPORT 2016 23
Year-to-Date Comparison to Prior Year
During the nine months ended September 30, 2016, $111.1 million of Developments and Earnouts were completed and transferred
to income properties, which represents an increase of $68.6 million or 161.6% compared to the same period in 2015.
Nine Months Ended September 30, 2016 Nine Months Ended September 30, 2015
(in millions of dollars)Area
(sq. ft.)Investment
($)Yield
(%)Area
(sq. ft.)Investment
($)Yield
(%)
Earnouts 49,820 19.1 6.5 37,523 12.8 6.7
Developments 345,471 92.0 6.0 127,849 29.7 6.7
395,291 111.1 6.1 165,372 42.5 6.7
Maintenance of Productive Capacity
The main focus in a discussion of capital expenditures is to differentiate between those costs incurred to achieve the Trust's longer
term goals to produce increased cash flows and Unit distributions, and those costs incurred to maintain the quality of the Trust's
existing cash flows.
Acquisitions of investment properties and the development of new and existing investment properties (Developments and Earnouts)
are the two main areas of capital expenditures that are associated with increasing the productive capacity of the Trust. In addition,
there are capital expenditures incurred on existing investment properties to maintain the productive capacity of the Trust ("sustaining
capital expenditures").
Sustaining capital expenditures and leasing costs are funded from operating cash flow and, as such, normalized sustaining capital
expenditures and leasing costs are deducted from AFFO in order to estimate a sustainable amount of cash that can be distributed to
Unitholders. Sustaining capital expenditures are those of a capital nature that are not considered to add to productive capacity and are
not recoverable from tenants. These costs are incurred at irregular amounts over time. Leasing costs, which include tenant incentives
and leasing commissions, vary with the timing of renewals, vacancies, tenant mix and the health of the retail market. Leasing costs are
generally lower for renewals of existing tenants compared to new leases. Leasing costs also include internal expenses for leasing activities,
primarily salaries, which are eligible to be added back to FFO based on the revision to the definition of FFO in the REALpac white
paper published in April 2014. The sustaining capital expenditures and leasing costs are based on historical spend levels, as well as
anticipated spend levels over the next few years.
The following is a discussion and analysis of capital expenditures of a maintenance nature (sustaining capital expenditures and leasing
costs). Acquisitions and developments are discussed elsewhere in the MD&A.
The Trust uses normalized sustaining capital expenditures and leasing costs to calculate AFFO on a quarterly basis and actual sustaining
capital expenditures and leasing costs to calculate AFFO on an annual basis. Given that a significant proportion of the Trust's portfolio
is relatively new, management does not believe that sustaining capital expenditures will have an impact on the Trust's ability to pay
distributions at its current level.
Normalized sustaining capital expenditures totalling $2.0 million and leasing costs of $1.9 million were included in the calculations of
AFFO during the three months ended September 30, 2016. For the nine months ended September 30, 2016, normalized sustaining
capital expenditures totalling $5.9 million and leasing costs of $5.7 million were included in the calculations of AFFO. For the three
months ended September 30, 2016, total sustaining leasing costs and capital expenditures decreased by $0.05 million or 1.1% compared
to the same period last year. For the nine months ended September 30, 2016, total sustaining leasing costs and capital expenditures
decreased by $0.1 million or 1.1% compared to the same period last year.
(in thousands of dollars, except per Unit amounts)Three Months Ended September 30 Nine Months Ended September 30
2016 2015 2016 2015
Sustaining leasing commissions and salaries 509 303 1,527 909
Sustaining tenant incentives 1,405 747 4,215 2,241
Total sustaining leasing costs 1,914 1,050 5,742 3,150
Sustaining capital expenditures 1,962 2,871 5,886 8,613
Total sustaining leasing costs and capital expenditures 3,876 3,921 11,628 11,763
Per Unit – diluted 0.025 0.025 0.075 0.080

MANAGEMENT'S DISCUSSION AND ANALYSIS
24 SMART REAL ESTATE INVESTMENT TRUST | THIRD QUARTER REPORT 2016
Investment Properties
The portfolio consists of 31.5 million square feet of built gross leasable area and 4.7 million square feet of future potential gross
leasable area in 151 properties and the option to acquire a 50.0% interest (0.7 million square feet) in five investment properties on their
completion pursuant to the terms of Mezzanine Financing. The portfolio is located across Canada, with assets in each of the 10
provinces. The Trust targets major urban centres and shopping centres that are dominant in their trade area. By selecting well-located
centres, the Trust attracts quality tenants at market rental rates.
As at September 30, 2016, the fair value of investment properties, including the Trust's share of investment properties in associates,
totalled $8,267.4 million, compared to $8,238.6 million at June 30, 2016, a net increase of $28.7 million. The increase is mainly due to
net additions to investment properties of $38.7 million. The fair value of the investment properties is dependent on future cash flows
over the holding period and capitalization rates applicable to those assets.
The following table summarizes the changes in values of investment properties:
Three Months Ended September 30, 2016 Nine Months Ended September 30, 2016
(in thousands of dollars)Income
Properties
PropertiesUnder
Development
Total Investment Properties
IncomeProperties
PropertiesUnder
Development
TotalInvestment Properties
Total investment properties
Balance – beginning of period 7,588,011 480,294 8,068,305 7,471,963 544,284 8,016,247
Acquisition, and related adjustments, ofinvestment properties 15,320 — 15,320 12,660 — 12,660
Transfer from properties under developmentto income properties 14,073 (14,073) — 104,765 (104,765) —
Earnout Fees on properties subject todevelopment management agreements 2,751 — 2,751 11,446 — 11,446
Additions to investment properties 2,778 14,364 17,142 6,057 51,115 57,172
Transfer from income properties toproperties under development — — — (8,500) 8,500 —
Dispositions — — — — (4,162) (4,162)
Net additions 34,922 291 35,213 126,428 (49,312) 77,116
Fair value adjustment on revaluation ofinvestment properties 870 (10,394) (9,524) 25,412 (24,781) 631
Balance – end of period 7,623,803 470,191 8,093,994 7,623,803 470,191 8,093,994
Total investment properties classified asinvestment in associates
Balance – beginning of period 21,600 148,731 170,331 21,600 130,704 152,304
Additions — 3,467 3,467 — 14,370 14,370
Fair value adjustment on revaluation ofinvestment properties — (425) (425) — 6,699 6,699
Balance – end of period 21,600 151,773 173,373 21,600 151,773 173,373
Total balance (including investment properties classified as investment in associates) – end of period 7,645,403 621,964 8,267,367 7,645,403 621,964 8,267,367
For the nine months ended September 30, 2016, the fair value adjustment for income properties includes a decrease of approximately
$36.0 million related to prior periods, which was the result of corrections to the fair value assessments.

MANAGEMENT'S DISCUSSION AND ANALYSIS
SMART REAL ESTATE INVESTMENT TRUST | THIRD QUARTER REPORT 2016 25
Valuation MethodologyFrom October 1, 2013 to September 30, 2016, the Trust has had approximately 82% (by value) or 69% (by number of properties) of
its operating portfolio appraised externally by independent national real estate appraisal firms with representation and expertise across
Canada.
The determination of which properties are externally appraised and which are internally appraised by management is based on a
combination of factors, including property size, property type, tenant mix, strength and type of retail node, age of property and location.
The Trust, on an annual basis, has had external appraisals performed on 15–20% of the portfolio that commenced in the first quarter
of 2014, rotating properties to ensure that at least 50% (by value) of the portfolio is valued externally over a three-year period.
The remaining portfolio is valued internally by management utilizing a valuation methodology that is consistent with the external
appraisals. Management performed these valuations by updating cash flow information reflecting current leases, renewal terms and
market rents and applying updated capitalization rates determined in part, through consultation with the external appraisers and available
market data. The fair value of properties under development reflects the impact of development agreements (see Note 4(b) in the
unaudited interim condensed consolidated financial statements for the period ended September 30, 2016 for further discussion).
Fair values were primarily determined through the income approach. For each property, the appraisers conducted and placed reliance
upon: (a) a direct capitalization method, which is the appraiser's estimate of the relationship between value and stabilized income, and
(b) a discounted cash flow method, which is the appraiser's estimate of the present value of future cash flows over a specified horizon,
including the potential proceeds from a deemed disposition.
For the quarter ended September 30, 2016, investment properties (including properties under development) with a total carrying value
of $1,918.7 million (June 30, 2016 – $1,904.6 million) were valued externally with updated capitalization rates and occupancy, and
investment properties with a total carrying value of $6,348.4 million (June 30, 2016 – $6,333.6 million) were valued internally by the
Trust. Based on these valuations, the aggregate weighted average stabilized capitalization rate on the Trust's portfolio as at September 30,
2016 was 5.89%, which remained unchanged compared to the quarter ended June 30, 2016.

MANAGEMENT'S DISCUSSION AND ANALYSIS
26 SMART REAL ESTATE INVESTMENT TRUST | THIRD QUARTER REPORT 2016
Acquisitions of Investment PropertiesAcquisitions during the nine months ended September 30, 2016
Property Property Type Acquisition Date
AcquiredLeasable area
(sq. ft.)
AcquisitionCost
($millions)
OwnershipInterest
Acquired
Lethbridge, AB Shopping centre August 16, 2016 53,392 15.3 100%
Acquisitions during the nine months ended September 30, 2015
Property Property Type Acquisition Date
Acquired Leasable area
(sq. ft.)
AcquisitionCost
($millions)
OwnershipInterest
Acquired
Barrie, ON Shopping centre February 11, 2015 104,909 25.3 100%
Alliston, ON Shopping centre May 28, 2015 170,770 42.8 100%
Aurora (North), ON(1) Shopping centre May 28, 2015 248,958 76.2 50%
Bracebridge, ON Shopping centre May 28, 2015 139,244 33.9 100%
Bradford, ON Shopping centre May 28, 2015 239,274 68.4 100%
Blainville, QC Shopping centre May 28, 2015 166,154 48.9 100%
Brampton, ON Shopping centre May 28, 2015 174,665 54.3 100%
Brampton (Bramport), ON Shopping centre May 28, 2015 37,857 10.7 100%
Cornwall, ON Shopping centre May 28, 2015 163,726 43.1 100%
Laval, QC Shopping centre May 28, 2015 159,779 59.1 100%
Markham (Boxgrove), ON Shopping centre May 28, 2015 69,008 20.0 40%
Mascouche, QC Shopping centre May 28, 2015 51,228 31.8 100%
Mississauga (Go Lands), ON(1) Shopping centre May 28, 2015 56,499 20.9 50%
Montreal (Premium Outlets), QC(2)Premium Outletsshopping centre May 28, 2015 57,459 59.5 25%
Oakville (Leasehold), ON Shopping centre May 28, 2015 442,391 117.3 100%
Oshawa (North II), ON Shopping centre May 28, 2015 149,622 49.6 100%
Oshawa (South), ON(1) Shopping centre May 28, 2015 268,347 65.7 50%
Port Elgin, ON Shopping centre May 28, 2015 115,524 22.3 100%
Stoney Creek, ON Shopping centre May 28, 2015 247,399 85.9 100%
Sylvan Lake, AB Shopping centre May 28, 2015 125,081 32.0 100%
Vaudreuil, QC Shopping centre May 28, 2015 15,249 10.0 100%
Vaughan, ON Shopping centre May 28, 2015 156,538 100.8 100%
Waterloo, ON Shopping centre May 28, 2015 181,607 62.8 100%
Maple Ridge, BC Shopping centre July 30, 2015 227,000 59.3 100%
Orleans, ON(3) Development land September 25, 2015 — 8.8 60%
Total 3,768,288 1,209.4
(1) Prior to this acquisition, the Trust had a 50% interest and as such the property was recorded as a co-ownership interest. On May 28, 2015, the Trust acquired the other 50% interest in
the property effectively giving the Trust a 100% interest. (2) Prior to this acquisition, the Trust had a 25% interest in this property. On May 28, 2015, the Trust acquired an additional 25% in this property effectively giving the Trust a 50%
interest.(3) As part of the Transaction on May 28, 2015, this acquisition reflects the purchase of 132,154 square feet of developable area.

MANAGEMENT'S DISCUSSION AND ANALYSIS
SMART REAL ESTATE INVESTMENT TRUST | THIRD QUARTER REPORT 2016 27
Properties Under Development
At September 30, 2016, the fair value of properties under development totalled $622.0 million compared to $629.0 million at June 30,
2016. The net decrease of $7.1 million is primarily due to Developments and Earnouts transferred to income properties totalling $14.1
million, a fair value loss of $11.0 million (including the Trust's share of investment in associates of $0.4 million), partially offset by
additional development costs of $17.8 million.
Properties under development as at September 30, 2016 and June 30, 2016 comprise the following:
(in thousands of dollars) September 30, 2016 June 30, 2016
Earnouts subject to option agreements (1) 76,265 82,640
Developments 393,926 397,654
Investment in associates 151,773 148,731
621,964 629,025
(1) Earnout development costs during the development period are paid by the Trust and funded through interest-bearing secured debt provided by the vendors to the Trust. On completion
of the development and the commencement of lease payments by a tenant, the Earnouts will be acquired from the vendors based on predetermined or formula capitalization rates
ranging from 5.71% to 8.23%, net of land and development costs incurred. Penguin has contractual options to acquire Trust and LP Units on completion of Earnout Developments as
shown in Note 12(b) of the unaudited interim condensed consolidated financial statements for the period ended September 30, 2016.
Potential Future PipelineTotal future Earnouts, Developments and options under Mezzanine Financing could increase the existing Trust portfolio by an additional
5.4 million square feet. With respect to the future pipeline, commitments have been negotiated on 115,000 square feet.
In addition to these initiatives, the Trust is currently assessing additional future potential intensification opportunities that may exist
in its portfolio:
• Pending finalization of the development plan with the City of Vaughan, the Trust expects that VMC will over time have the
potential to add an additional 3.9 million to 4.8 million square feet of office, retail and residential space (representing the
Trust's 50% share).
• The Trust is in discussions with various parties to jointly develop its existing portfolio with residential retirement and storage
uses where such uses makes sense in optimizing each centre within its local community.
• The Trust has identified in excess of 0.3 million square feet of retail space that may be located on its existing sites and is
obtaining relevant permission to execute the same.

MANAGEMENT'S DISCUSSION AND ANALYSIS
28 SMART REAL ESTATE INVESTMENT TRUST | THIRD QUARTER REPORT 2016

MANAGEMENT'S DISCUSSION AND ANALYSIS
SMART REAL ESTATE INVESTMENT TRUST | THIRD QUARTER REPORT 2016 29
(in thousands of square feet) Committed Years 0–3 Beyond Year 3 Total (1)
Earnouts 22 184 432 638
Developments 25 849 2,841 3,715
Premium Outlets — 80 50 130
VMC (Phase 1) 68 99 68 235
115 1,212 3,391 4,718
Mezzanine Financing — — 709 709
115 1,212 4,100 5,427
(1) The timing of development is based on management's best estimates and can be adjusted based on business conditions.
During the quarter ended September 30, 2016, the future properties under development pipeline decreased by 25,000 square feet to a
total of 4,718,000 square feet. The change is summarized as follows:
(in thousands of square feet) Total Area
Future properties under development pipeline – June 30, 2016 4,743
Add:
Net adjustment to project densities 30
Less:
Completion of Earnouts and Developments during the period (55)
Net adjustment (25)
Future properties under development pipeline – September 30, 2016 4,718
Committed PipelineThe following table summarizes the committed investment by the Trust in properties under development as at September 30, 2016:
(in millions of dollars) Total Cost Incurred Future Development Costs
Earnouts 10 2 8
Developments 9 3 6
19 5 14
VMC (Phase 1) 36 24 12
55 29 26
The completion of these committed Earnouts and Developments as currently scheduled is expected to have an average estimated yield
of 6.7% in 2016 and 7.0% in 2017, which, based on the committed lease arrangements with respect to such Earnouts and Developments,
should increase the FFO per Unit by $0.002 in 2016 (remainder of year) and an additional $0.001 in 2017 assuming annualized rents
and a 55% debt to equity ratio.
Uncommitted PipelineThe following table summarizes the estimated future investment by the Trust in properties under development; it is expected the future
development costs will be spent over the next three years and beyond:
(in millions of dollars) Years 0–3 Beyond Year 3
Total Cost Incurred(1)
FutureDevelopment
Costs
Earnouts 61 128 189 7 182
Developments 243 955 1,198 452 746
Premium Outlets 55 24 79 5 74
359 1,107 1,466 464 1,002
VMC (Phase 1) 56 77 133 59 74
415 1,184 1,599 523 1,076
(1) Properties under development as recorded on the consolidated balance sheet totalled $622.0 million (including investment in associates of $151.8 million) which primarily consists of
costs of $523.0 million in the uncommitted pipeline, costs of $29.0 million in the committed pipeline and costs of $69.2 million of future development land in VMC plus $0.6 million
of non-cash development costs relating to future land development and cumulative fair value loss on revaluation of properties under development.
Approximately 12.0% of the properties under development, representing 0.6 million square feet and a gross investment of $199.0
million, are lands that are under contract by vendors to develop and lease to third parties for additional proceeds when developed. In
certain events, the developer may sell the portion of undeveloped land to accommodate the construction plan that provides the best
use of the property. It is management's intention to finance the costs of construction through interim financing or operating facilities
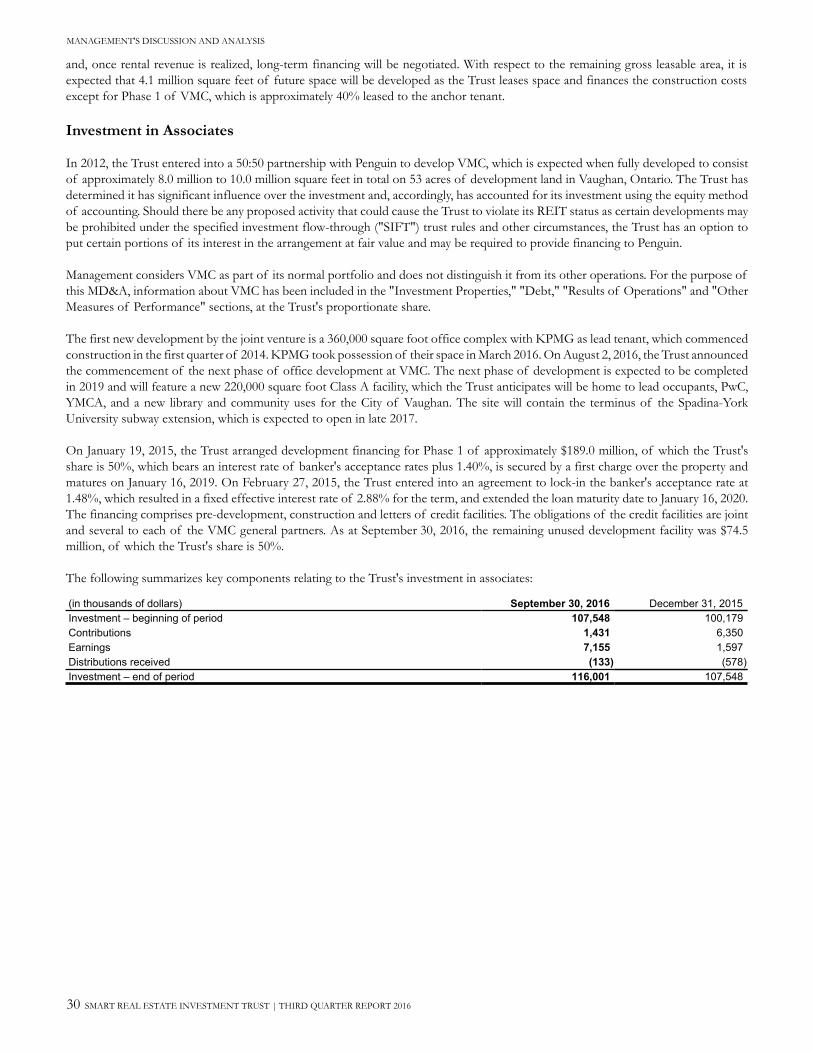
MANAGEMENT'S DISCUSSION AND ANALYSIS
30 SMART REAL ESTATE INVESTMENT TRUST | THIRD QUARTER REPORT 2016
and, once rental revenue is realized, long-term financing will be negotiated. With respect to the remaining gross leasable area, it is
expected that 4.1 million square feet of future space will be developed as the Trust leases space and finances the construction costs
except for Phase 1 of VMC, which is approximately 40% leased to the anchor tenant.
Investment in Associates
In 2012, the Trust entered into a 50:50 partnership with Penguin to develop VMC, which is expected when fully developed to consist
of approximately 8.0 million to 10.0 million square feet in total on 53 acres of development land in Vaughan, Ontario. The Trust has
determined it has significant influence over the investment and, accordingly, has accounted for its investment using the equity method
of accounting. Should there be any proposed activity that could cause the Trust to violate its REIT status as certain developments may
be prohibited under the specified investment flow-through ("SIFT") trust rules and other circumstances, the Trust has an option to
put certain portions of its interest in the arrangement at fair value and may be required to provide financing to Penguin.
Management considers VMC as part of its normal portfolio and does not distinguish it from its other operations. For the purpose of
this MD&A, information about VMC has been included in the "Investment Properties," "Debt," "Results of Operations" and "Other
Measures of Performance" sections, at the Trust's proportionate share.
The first new development by the joint venture is a 360,000 square foot office complex with KPMG as lead tenant, which commenced
construction in the first quarter of 2014. KPMG took possession of their space in March 2016. On August 2, 2016, the Trust announced
the commencement of the next phase of office development at VMC. The next phase of development is expected to be completed
in 2019 and will feature a new 220,000 square foot Class A facility, which the Trust anticipates will be home to lead occupants, PwC,
YMCA, and a new library and community uses for the City of Vaughan. The site will contain the terminus of the Spadina-York
University subway extension, which is expected to open in late 2017.
On January 19, 2015, the Trust arranged development financing for Phase 1 of approximately $189.0 million, of which the Trust's
share is 50%, which bears an interest rate of banker's acceptance rates plus 1.40%, is secured by a first charge over the property and
matures on January 16, 2019. On February 27, 2015, the Trust entered into an agreement to lock-in the banker's acceptance rate at
1.48%, which resulted in a fixed effective interest rate of 2.88% for the term, and extended the loan maturity date to January 16, 2020.
The financing comprises pre-development, construction and letters of credit facilities. The obligations of the credit facilities are joint
and several to each of the VMC general partners. As at September 30, 2016, the remaining unused development facility was $74.5
million, of which the Trust's share is 50%.
The following summarizes key components relating to the Trust's investment in associates:
(in thousands of dollars) September 30, 2016 December 31, 2015
Investment – beginning of period 107,548 100,179
Contributions 1,431 6,350
Earnings 7,155 1,597
Distributions received (133) (578)
Investment – end of period 116,001 107,548

MANAGEMENT'S DISCUSSION AND ANALYSIS
SMART REAL ESTATE INVESTMENT TRUST | THIRD QUARTER REPORT 2016 31
Related Party
Pursuant to the Trust's declaration of Trust ("Declaration of Trust"), Penguin is entitled to have a minimum of 25.0% of the votes
eligible to be cast at any meeting of Unitholders (the "Voting Top-Up Right"). As part of the Transaction, the Voting Top-Up Right
was extended by an additional five years to July 1, 2020. Pursuant to the Voting Top-Up Right, the Trust will issue additional special
voting Units of the Trust ("Special Voting Units") to Penguin to increase its voting rights to 25.0% in advance of a meeting of
Unitholders. The total number of Special Voting Units is adjusted for each meeting of the Unitholders based on changes in Penguin's
ownership interest. As a result, in connection with the recently held annual general meeting of Unitholders that took place on June 10,
2016, the Trust issued an additional 896,010 Special Voting Units to bring Penguin's total to 5,181,409 Special Voting Units. These
Special Voting Units are not entitled to any interest or share in the distributions or net assets of the Trust; nor are they convertible into
any securities of the Trust. There is no value assigned to the Special Voting Units. The Voting Top-Up Right is more particularly
described in the Trust’s Annual Information Form for the year ended December 31, 2015, which is filed on SEDAR. As at September 30,
2016, Penguin owned 22.4% of the aggregate issued and outstanding Trust Units in addition to the Special Voting Units noted above.
The 22.4% ownership would increase to 26.7% if Penguin exercised all remaining options to purchase Units pursuant to existing
development and exchange agreements. In addition, the Trust has entered into property management, leasing, development and
exchange, and co-ownership agreements with Penguin. Pursuant to its rights under the Declaration of Trust, at September 30, 2016,
Penguin has appointed two Trustees out of seven.
The Trust has entered into contracts and other arrangements with Penguin on a cost-sharing basis for administrative services and on
market terms for leasing and development services and premises rent. The Trust earns interest on funds advanced and opportunity
fees related to prepaid land held for development at rates negotiated at the time the Trust acquires retail centres from Penguin.
In connection with the Transaction, previous contracts and other arrangements with Penguin were replaced by the following as of May
28, 2015:
1) The Development and Services Agreement, under which the Trust and certain subsidiary limited partnerships of the Trust
have agreed to provide to Penguin the following services for a five-year term with automatic five-year renewal periods thereafter:
a. Construction management services and leasing services are provided, at the discretion of Penguin, with respect to
certain of Penguin's properties under development for a market-based fee based on construction costs incurred.
Fees for leasing services, requested at the discretion of Penguin, are based on various rates that approximate market
rates, depending on the term and nature of the lease. In addition, management fees are provided for a market-based
fee based on rental revenue.
b. Transition services relate to activities necessary to become familiar with Penguin projects and establishing processes
and systems to accommodate the needs of Penguin.
c. Support services are provided for a fee based on an allocation of the relevant costs of the support services incurred
by the Trust. Such relevant costs include: office administration, human resources, information technology, insurance,
legal and marketing.
2) The Services Agreement under which Mitchell Goldhar, owner of Penguin, has agreed to provide to the Trust certain advisory,
consulting and strategic services, including but not limited to strategies dealing with development, municipal approvals,
acquisitions, dispositions and construction costs, as well as strategies for marketing new projects and leasing opportunities.
The fees associated with this agreement are approximately $0.9 million per quarter for a five-year term (these charges are
included in the following table as "Master planning services").
3) The Trust has an agreement to rent its office premises from Penguin for a term ending in May 2025.

MANAGEMENT'S DISCUSSION AND ANALYSIS
32 SMART REAL ESTATE INVESTMENT TRUST | THIRD QUARTER REPORT 2016
The following amounts are included in the Trust's unaudited interim condensed consolidated financial statements for the periods ended
September 30:
Three Months Ended September 30 Nine Months Ended September 30
(in thousands of dollars) 2016 2015 2016 2015
Related party transactions with Penguin
Revenues:
Transition services fee revenue(1) 1,000 971 3,000 1,333
Management fee revenue pursuant to the Development and Services Agreement(1) 659 785 2,792 1,394
Management fee revenue pursuant to the Management Agreement — 609 — 932
Support services(1) 241 230 543 296
Interest income from mortgages and loans receivable 2,042 2,076 6,125 6,381
Head lease rents and operating cost recoveries included in rentals from income properties 690 1,010 2,062 1,422
Expenses:
Master planning services(1):
Included in general and administrative expense 218 219 656 298
Capitalized to properties under and held fordevelopment 657 656 1,969 894
Development fees and costs (capitalized to investment properties) — 612 21 3,065
Interest expense (capitalized to properties under development) 4 — 14 11
Opportunity fees capitalized to properties under development 587 554 1,723 1,621
Rent and operating costs (included in general and administrative expense and property operating costs) 556 536 1,665 1,023
Legal and other administrative services (included in general and administrative expense and property operating costs) 16 45 106 1,092
Marketing cost sharing (included in property operating costs) 75 99 227 352
Other related party transactions
Legal fees paid to a legal firm in which a partner is a Trustee (included in general and administrative expense and property operating costs) — — 421 —
(1) These amounts were recorded in connection with the Transaction that closed on May 28, 2015.
The following is a summary of other related party balances:
September 30, 2016 December 31, 2015
Related party balances with Penguin
Receivables:
Amounts receivable, prepaid expenses and deposits 6,393 3,899
Payables and other accruals:
Accrued liabilities 2,766 1,538
Future land development obligation 25,261 17,051
Secured debt 3,464 5,175
Other related party balances
Opportunity fees receivable (capitalized to properties under development) — 185
The financial implications of related party agreements are disclosed in the notes to the unaudited interim condensed consolidated
financial statements for the period ended September 30, 2016.

MANAGEMENT'S DISCUSSION AND ANALYSIS
SMART REAL ESTATE INVESTMENT TRUST | THIRD QUARTER REPORT 2016 33
Capital Resources and Liquidity
As at September 30, 2016 and June 30, 2016, the Trust had the following capital resources available:
(in thousands of dollars) September 30, 2016 June 30, 2016
Cash and cash equivalents 48,002 12,856
Unused operating facilities 333,548 268,599
381,550 281,455
On the assumption that occupancy levels remain strong and that the Trust will be able to obtain financing on reasonable terms, the
Trust anticipates meeting all current and future obligations. Management expects to finance future acquisitions, including committed
Earnouts, Developments, Mezzanine Financing commitments and maturing debt from: (i) existing cash balances; (ii) a mix of mortgage
debt secured by investment properties, operating facilities, issuance of equity, and convertible and unsecured debentures; (iii) repayments
of mortgages receivable; and (iv) the sale of non-core assets. Cash flow generated from operating activities is the source of liquidity
to pay Unit distributions, sustaining capital expenditures and leasing costs.
As at September 30, 2016, the Trust increased its capital resources by $100.1 million compared to June 30, 2016. The net increase of
$100.1 million is primarily due to the proceeds from issuance of unsecured debentures net of issuance costs of $347.4 million and the
repayments of mortgages and loans receivable of $11.2 million, partially offset by the repayment of unsecured debentures including
yield maintenance on redemption of $205.1 million and the net repayments on the Trust's revolving operating facility of $65.0 million.
The Trust manages its cash flow from operating activities by maintaining a target debt level. The debt to gross book value, as defined
in the Declaration of Trust, as at September 30, 2016, is 52.1%, excluding convertible debentures. Including the Trust's capital resources
as at September 30, 2016, the Trust could invest an additional $944.0 million in new investments and remain at the midpoint of the
Trust's target debt to gross book value range of 55% to 60% (excluding convertible debentures).
Future obligations, excluding the development pipeline, total $3,998.2 million, as identified in the following table. Other than contractual
maturity dates, the timing of payment of these obligations is management's best estimate based on assumptions with respect to the
timing of leasing, construction completion, occupancy and Earnout dates at September 30, 2016.
As at September 30, 2016, the timing of the Trust's future obligations is as follows:
(in thousands of dollars) Total
2016(remainder
of year) 2017 2018 2019 2020 Thereafter
Secured debt 2,538,264 32,275 368,981 392,803 396,379 177,243 1,170,583
Unsecured debentures 1,310,000 — 150,000 — — 150,000 1,010,000
Mortgage receivable advances (1) 145,816 32,313 24,181 7,467 7,969 8,506 65,380
Development obligations 4,092 4,092 — — — — —
3,998,172 68,680 543,162 400,270 404,348 335,749 2,245,963
(1) Mortgages receivable of $123.0 million at September 30, 2016, and further forecasted commitments of $145.8 million, mature over a period extending to 2022 if the Trust does not
exercise its option to acquire the investment properties. Refer to the "Mortgages, Loans and Notes Receivable and Interest Income" section for timing of principal repayments.
It is management's intention to either repay or refinance $13.2 million of maturing secured debt in 2016 (remainder of year). Potential
upfinancing on maturing debt using a 65% loan to value and a 6.25% capitalization rate amounts to $32.9 million in 2016 and $102.6
million in 2017. In addition, the Trust has an unencumbered asset pool with an approximate fair value totalling $2,635.2 million, which
can generate gross financing proceeds on income properties of approximately $1,712.9 million using a 65% loan to value. The secured
debt, revolving operating facility, unsecured debentures, mortgage receivable advances and development obligations will be funded by
additional term mortgages, net proceeds on the sale of non-core assets, existing cash or operating lines, the issuance of convertible
and unsecured debentures, and equity Units, if necessary.
The Trust's potential development pipeline of $1,654.0 million consists of $199.0 million in Earnouts and $1,455.0 million in
Developments. Costs totalling $552.0 million have been incurred to date with a further $1,102.0 million still to be funded. The future
funding includes $190.0 million for Earnouts that will be paid once a lease has been executed and construction of the space commenced.
The remaining $912.0 million of development will proceed once the Trust has an executed lease and financing in place. Management
expects this pipeline to be developed over the next three to five years.

MANAGEMENT'S DISCUSSION AND ANALYSIS
34 SMART REAL ESTATE INVESTMENT TRUST | THIRD QUARTER REPORT 2016
The following table represents a reconciliation of net income and comprehensive income to Adjusted EBITDA:
12 Months Ended
September 30, 2016
Net income and comprehensive income (including the Trust's share of investment in associates) 323,923
Add (deduct) the following items:
Interest expense, net 132,954
Yield maintenance on redemption of unsecured debentures and related write-off of unamortized financing costs 16,458
Amortization of equipment 2,459
Amortization of tenant incentives 5,698
Fair value adjustments (15,974)
Loss on sale of investment properties 107
Target settlement proceeds net of other amounts (9,651)
Adjusted salaries and related costs attributed to development 3,880
Adjusted EBITDA 459,854
Debt
As at September 30, 2016, indebtedness was $3,896.2 million compared to $3,842.3 million as at June 30, 2016, as follows:
(in thousands of dollars) September 30, 2016 June 30, 2016 December 31, 2015
Secured debt 2,539,163 2,586,958 2,637,579
Unsecured debentures 1,302,126 1,143,776 1,142,945
Revolving operating facility — 65,000 10,000
Total before investment in associates 3,841,289 3,795,734 3,790,524
Share of debt classified as investment in associates 54,912 46,544 32,705
3,896,201 3,842,278 3,823,229
Secured Debt Secured debt consists of term mortgages, development loans, and conduit and other non-conduit loans. As at September 30, 2016,
secured debt was $2,539.2 million, compared to $2,587.0 million as at June 30, 2016.
(in thousands of dollars)Three Months EndedSeptember 30, 2016
Three Months EndedJune 30, 2016
Nine Months EndedSeptember 30, 2016
Balance – beginning of period 2,586,958 2,633,128 2,637,579
Borrowings 1,213 1,147 34,460
Loans assumed 9,209 — 9,209
Scheduled amortization (18,928) (18,974) (56,598)
Repayments (38,616) (27,582) (83,529)
Amortization of acquisition date fair value adjustments, net ofadditions (868) (899) (2,678)
Financing costs incurred relating to term mortgages, net ofamortization 195 138 720
Balance – end of period 2,539,163 2,586,958 2,539,163
Secured debt bears interest at a weighted average contractual interest rate of 3.81% (June 30, 2016 – 3.86%) and matures on various
dates from 2016 to 2031. Including acquisition date fair value adjustments, the effective weighted average interest rate on secured debt
is 3.80% (June 30, 2016 – 3.85%). The weighted average years to maturity, including the timing for payments of principal amortization
and debt maturing, is 5.0 years (June 30, 2016 – 5.1 years).
During the three months ended September 30, 2016, the Trust assumed secured debt in connection with an acquisition in the quarter
totalling $9.2 million, with a term of 3.9 years and an interest rate of 2.73%. Also during the quarter, the Trust repaid secured debt of
$35.8 million with a weighted average interest rate of 5.89%.
The Trust continues to have access to secured debt due to its strong tenant base and high occupancy levels at mortgage loan levels
ranging from 60% to 70% of loan to value. Secured debt maturities remain low for the next several years. If maturing mortgages in
2016 and 2017 were refinanced at a 10-year rate of 2.95%, annualized FFO would increase by $0.004 per Unit for 2016 (remainder of
year) and by $0.013 per Unit for 2017.
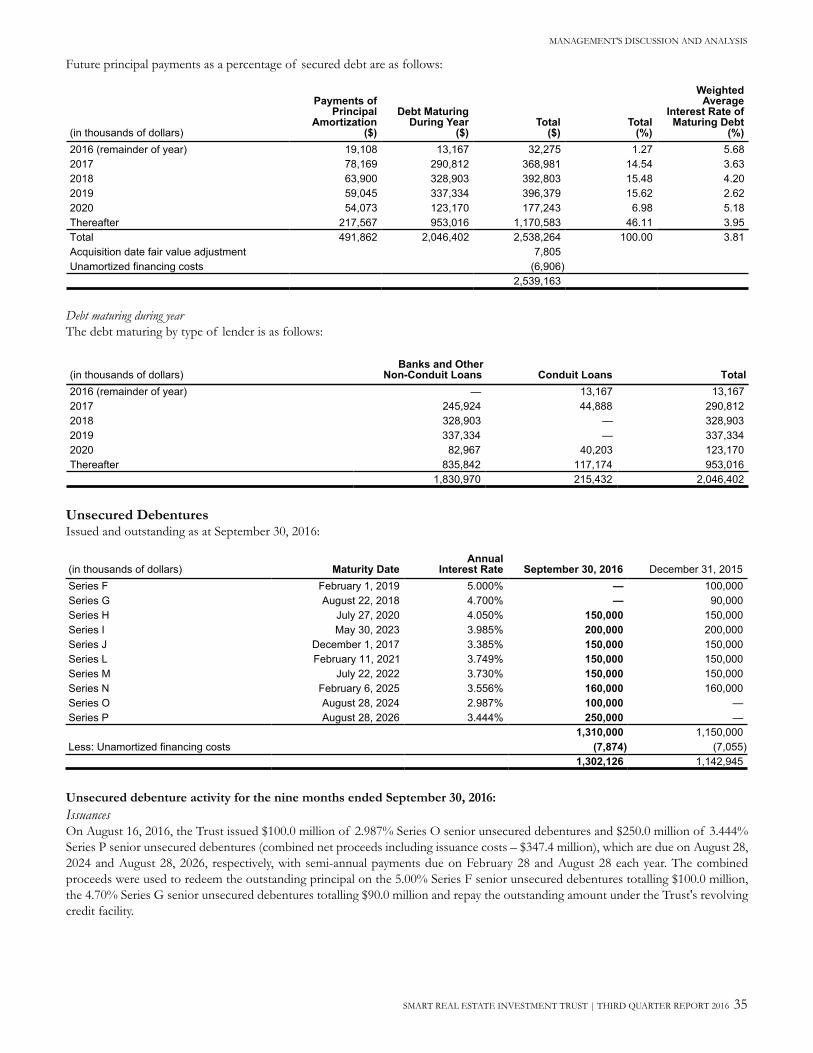
MANAGEMENT'S DISCUSSION AND ANALYSIS
SMART REAL ESTATE INVESTMENT TRUST | THIRD QUARTER REPORT 2016 35
Future principal payments as a percentage of secured debt are as follows:
(in thousands of dollars)
Payments ofPrincipal
Amortization($)
Debt Maturing During Year
($)Total
($)Total
(%)
Weighted Average
Interest Rate of Maturing Debt
(%)
2016 (remainder of year) 19,108 13,167 32,275 1.27 5.68
2017 78,169 290,812 368,981 14.54 3.63
2018 63,900 328,903 392,803 15.48 4.20
2019 59,045 337,334 396,379 15.62 2.62
2020 54,073 123,170 177,243 6.98 5.18
Thereafter 217,567 953,016 1,170,583 46.11 3.95
Total 491,862 2,046,402 2,538,264 100.00 3.81
Acquisition date fair value adjustment 7,805
Unamortized financing costs (6,906)
2,539,163
Debt maturing during year
The debt maturing by type of lender is as follows:
Banks and OtherNon-Conduit Loans Conduit Loans Total(in thousands of dollars)
2016 (remainder of year) — 13,167 13,167
2017 245,924 44,888 290,812
2018 328,903 — 328,903
2019 337,334 — 337,334
2020 82,967 40,203 123,170
Thereafter 835,842 117,174 953,016
1,830,970 215,432 2,046,402
Unsecured DebenturesIssued and outstanding as at September 30, 2016:
(in thousands of dollars) Maturity DateAnnual
Interest Rate September 30, 2016 December 31, 2015
Series F February 1, 2019 5.000% — 100,000
Series G August 22, 2018 4.700% — 90,000
Series H July 27, 2020 4.050% 150,000 150,000
Series I May 30, 2023 3.985% 200,000 200,000
Series J December 1, 2017 3.385% 150,000 150,000
Series L February 11, 2021 3.749% 150,000 150,000
Series M July 22, 2022 3.730% 150,000 150,000
Series N February 6, 2025 3.556% 160,000 160,000
Series O August 28, 2024 2.987% 100,000 —
Series P August 28, 2026 3.444% 250,000 —
1,310,000 1,150,000
Less: Unamortized financing costs (7,874) (7,055)
1,302,126 1,142,945
Unsecured debenture activity for the nine months ended September 30, 2016:
IssuancesOn August 16, 2016, the Trust issued $100.0 million of 2.987% Series O senior unsecured debentures and $250.0 million of 3.444%
Series P senior unsecured debentures (combined net proceeds including issuance costs – $347.4 million), which are due on August 28,
2024 and August 28, 2026, respectively, with semi-annual payments due on February 28 and August 28 each year. The combined
proceeds were used to redeem the outstanding principal on the 5.00% Series F senior unsecured debentures totalling $100.0 million,
the 4.70% Series G senior unsecured debentures totalling $90.0 million and repay the outstanding amount under the Trust's revolving
credit facility.

MANAGEMENT'S DISCUSSION AND ANALYSIS
36 SMART REAL ESTATE INVESTMENT TRUST | THIRD QUARTER REPORT 2016
RedemptionsOn September 14, 2016, the Trust redeemed $100.0 million aggregate principal amount of 5.00% Series F senior unsecured debentures
and $90.0 million aggregate principal amount of 4.70% Series G senior unsecured debentures. In addition to paying accrued interest
of $0.9 million, the Trust paid a yield maintenance fee of $15.1 million in connection with the redemptions and wrote off unamortized
financing costs of $1.3 million.
Unsecured debenture activity for the nine months ended September 30, 2015:
IssuancesOn February 6, 2015, the Trust issued $160.0 million (net proceeds including issuance costs – $158.8 million) of 3.556% Series N
senior unsecured debentures due on February 6, 2025, with semi-annual payments due on February 6 and August 6 each year. The
proceeds were used to redeem the outstanding principal on the 5.37% Series B senior unsecured debentures totalling $150.0 million.
RedemptionsOn March 9, 2015, the Trust redeemed $150.0 million aggregate principal amount of 5.37% Series B senior unsecured debentures. In
addition to paying accrued interest of $3.3 million, the Trust paid a yield maintenance fee of $10.8 million in connection with the
redemption of the 5.37% Series B senior unsecured debentures and wrote off unamortized financing costs of $0.2 million.
Dominion Bond Rating Services provides credit ratings of debt securities for commercial issuers that indicate the risk associated with
a borrower's capabilities to fulfill its obligations. An investment grade rating must exceed "BB," with the highest rating being "AAA."
The Trust's debentures are rated "BBB" with a stable trend as at September 30, 2016.
Operating FacilityAs at September 30, 2016, the Trust had $nil (December 31, 2015 – $10.0 million) outstanding on its operating facility of $350.0 million
(December 31, 2015 – $350.0 million). The operating facility bears interest at a variable interest rate based on bank prime rate plus
0.45% or banker's acceptance rates plus 1.45%, and expires on September 30, 2017. The operating facility includes an accordion feature
of $150.0 million whereby the Trust can increase its facility amount with the lenders to sustain future operations as required.
(in thousands of dollars) September 30, 2016 December 31, 2015
Revolving operating facility 350,000 350,000
Lines of credit – outstanding — (10,000)
Letters of credit – outstanding (16,452) (16,222)
Remaining unused operating facility 333,548 323,778
Financial Covenants
The unsecured operating facility as well as unsecured debentures contain numerous terms and covenants that limit the discretion of
management with respect to certain business matters. These covenants could in certain circumstances place restrictions on, among
other things, the ability of the Trust to create liens or other encumbrances, to pay distributions on its Units or make certain other
payments, investments, loans and guarantees and to sell or otherwise dispose of assets and merge or consolidate with another entity.
In addition, the operating facility and unsecured debentures contain a number of financial covenants that require the Trust to meet
certain financial ratios and financial condition tests. A failure to comply with the financial covenants in the operating facility and
unsecured debentures could result in a default, which, if not cured or waived, could result in a reduction or termination of distributions
by the Trust and permit acceleration of the relevant indebtedness.
As stipulated by the Declaration of Trust, the Trust monitors its capital structure based on the following ratios: interest coverage ratio,
debt to gross book value, debt to aggregate assets, and debt to Adjusted EBITDA. These ratios are used by the Trust to manage an
acceptable level of leverage and are not considered measures in accordance with IFRS; nor is there an equivalent IFRS measure. Those
ratios are as follows:
September 30, 2016 June 30, 2016 December 31, 2015
Interest coverage ratio 3.0X 3.0X 3.0X
Debt to aggregate assets 44.8% 44.3% 44.7%
Debt to gross book value (excluding convertible debentures) 52.1% 51.7% 52.2%
Debt to gross book value (including convertible debentures) 52.1% 51.7% 52.2%
Debt to Adjusted EBITDA 8.4X 8.4X 8.4X

MANAGEMENT'S DISCUSSION AND ANALYSIS
SMART REAL ESTATE INVESTMENT TRUST | THIRD QUARTER REPORT 2016 37
The following are the significant financial covenants that the Trust is required by its operating line lenders to maintain: debt to aggregate
assets of not more than 65%, secured debt to aggregate assets of not more than 40%, Adjusted EBITDA to debt service (fixed charge
coverage ratio) of not less than 1.5, unencumbered investment properties value to consolidated unsecured debt of not less than 1.4
and Unitholders' equity of not less than $2.0 billion.
Those ratios are as follows:
Ratio Threshold September 30, 2016 June 30, 2016 December 31, 2015
Debt to aggregate assets 65% 44.8% 44.3% 44.7%
Secured debt to aggregate assets 40% 29.8% 31.1% 31.2%
Fixed charge coverage ratio 1.5X 2.0X 2.0X 2.0X
Unencumbered assets to unsecured debt 1.4X 2.0X 2.1X 2.1X
Unitholders' equity (in thousands) $2,000,000 $4,563,448 $4,557,987 $4,482,571
The Trust's indentures require its unsecured debentures to maintain debt to gross book value excluding and including convertible
debentures not more than 60% and 65%, respectively, interest coverage ratio not less than 1.65 and Unitholders' equity not less than
$500.0 million.
Those ratios are as follows:
Threshold September 30, 2016 June 30, 2016 December 31, 2015
Debt to gross book value (excluding convertible debentures) 60% 52.1% 51.7% 52.2%
Debt to gross book value (including convertible debentures) 65% 52.1% 51.7% 52.2%
Interest coverage ratio 1.65X 3.0X 3.0X 3.0X
Unitholders' equity (in thousands) $500,000 $4,563,448 $4,557,987 $4,482,571
For the quarter ended September 30, 2016, the Trust was in compliance with all externally imposed financial covenants.
Unitholders' Equity
The Unitholders' Equity of the Trust is calculated based on the equity attributable to the holders of Trust Units and LP Units that are
exchangeable into Trust Units on a one-for-one basis. These LP Units consist of Class B Units of the Trust's subsidiary limited
partnerships. Certain of the Trust's subsidiary limited partnerships also have Class D Units that are exchangeable on a one-for-one
basis for Units, but such Class D Units are accounted for as a liability.
The following is a summary of the number of Units outstanding for the periods ended September 30, 2016 and December 31, 2015:
Type Class and Series September 30, 2016 December 31, 2015
Trust Units N/A 129,767,000 128,673,857
Smart Limited Partnership Class B Series 1 14,741,660 14,719,803
Smart Limited Partnership Class B Series 2 873,741 873,741
Smart Limited Partnership Class B Series 3 720,432 720,432
Smart Limited Partnership II Class B 756,525 756,525
Smart Limited Partnership III Class B Series 4 647,934 644,755
Smart Limited Partnership III Class B Series 5 559,396 559,396
Smart Limited Partnership III Class B Series 6 429,769 421,795
Smart Limited Partnership III Class B Series 7 434,598 427,357
Smart Limited Partnership III Class B Series 8 1,698,018 1,698,018
Smart Limited Partnership IV Class B Series 1 3,046,121 3,035,756
Smart Oshawa South Limited Partnership Class B Series 1 688,336 688,336
Smart Oshawa Taunton Limited Partnership Class B Series 1 374,223 305,765
Total Units classified as equity 154,737,753 153,525,536
Smart Limited Partnership Class D Series 1 311,022 311,022
Smart Oshawa South Limited Partnership Class D Series 1 251,649 251,649
Smart Oshawa Taunton Limited Partnership Class D Series 1 — —
Total Units classified as liabilities 562,671 562,671
Total Units 155,300,424 154,088,207

MANAGEMENT'S DISCUSSION AND ANALYSIS
38 SMART REAL ESTATE INVESTMENT TRUST | THIRD QUARTER REPORT 2016
The following is a summary of the activities having an impact on Unitholders' equity for the three and nine months ended
September 30, 2016 and the year ended December 31, 2015:
Three Months Ended Nine Months Ended Year Ended
(in thousands of dollars) September 30, 2016 September 30, 2016 December 31, 2015
Unitholders' equity – beginning of the period 4,557,987 4,482,571 3,906,424
Issuance of Trust Units, net of issuance cost 12,962 36,781 268,062
Issuance of LP Units classified as equity 55 3,873 169,092
Conversion of 5.75% convertible debentures — — 57,827
Net income for the period 56,731 232,246 319,489
Contributions by other non-controlling interest — 51 —
Distributions to other non-controlling interest (166) (166) (281)
Distributions for the period (64,121) (191,908) (238,042)
Unitholders' equity – end of the period 4,563,448 4,563,448 4,482,571
In the consolidated financial statements, LP Units classified as equity are presented separately from Trust Units as non-controlling
interests. However, because management views the LP Units (including those classified as a liability) as economically equivalent to the
Trust Units, they have been combined for the purpose of this MD&A.
As at September 30, 2016, equity totalled $4,563.4 million (June 30, 2016 – $4,558.0 million). Trust and LP Unit equity totalled $3,264.2
million, and Trust Units and LP Units outstanding (see table above) totalled 154,737,753 Units, which does not include 562,671 of
Class D Series 1 LP Units, Class D Series 1 Oshawa South LP Units and Class D Series 1 Oshawa Taunton LP Units totalling $19.9
million classified as a liability in the unaudited interim condensed consolidated financial statements.
During the quarter ended September 30, 2016, the Trust issued $13.0 million in Units as follows:
TrustUnits
LPUnits
Total Units
Three Months EndedSeptember 30, 2016
(in thousands of dollars except for Unit amounts) (#) (#) (#) ($)
Options exercised — 1,452 1,452 55
Distribution reinvestment plan (DRIP) 307,525 — 307,525 11,377
Units exchanged (1) 41,670 — 41,670 1,585
Total change in Unit equity 349,195 1,452 350,647 13,017
(2) 41,670 Class D Oshawa Taunton LP Units (classified as a liability – see Note 12) amounting to $1,585 were exchanged for 41,670 Trust Units.
During the three months ended September 30, 2016, distributions declared by the Trust totalled $64.4 million (of which $0.2 million
is treated as interest expense) (September 30, 2015 – $61.8 million, of which $0.3 million is treated as interest expense) or $0.4125 per
Unit (September 30, 2015 – $0.400 per Unit). For the three months ended September 30, 2016, the Trust paid $53.0 million in cash
and the balance of $11.4 million by issuing 307,525 Trust Units under the distribution reinvestment plan (September 30, 2015 – $50.7
million and the balance of $11.1 million represented by 374,141 Trust Units, respectively).
Distributions to Unitholders for the three and nine months ended September 30, 2016 compared to September 30, 2015 were as
follows:
Three Months Ended September 30 Nine Months Ended September 30
(in thousands of dollars) 2016 2015 2016 2015
Distributions to Unitholders 64,360 61,761 192,633 175,793
Distributions reinvested through DRIP (11,377) (11,058) (34,537) (27,799)
Net cash outflow from distributions to Unitholders 52,983 50,703 158,096 147,994
DRIP as a percentage of distributions to Unitholders 17.7% 17.9% 17.9% 15.8%

MANAGEMENT'S DISCUSSION AND ANALYSIS
SMART REAL ESTATE INVESTMENT TRUST | THIRD QUARTER REPORT 2016 39
Quarterly Information
(in thousands of dollars, except percentage, Unit and per Unit amounts)
Q3 Q2(6) Q1 Q4 Q3 Q2 Q1 Q4
2016 2016 2016 2015 2015 2015 2015 2014
Rental from investment properties (1) 174,123 187,297 179,629 178,085 172,874 160,663 158,701 154,142
NOI (1) 115,138 126,811 114,347 114,117 116,230 105,922 101,715 97,830
Net income and comprehensive income 56,731 76,646 98,869 91,677 92,574 79,991 55,247 61,178
FFO 66,999 93,666 82,937 80,423 83,881 73,539 60,085 64,442
Per Unit
Basic $0.43 $0.61 $0.54 $0.52 $0.55 $0.52 $0.44 $0.47
Diluted (2) $0.43 $0.60 $0.54 $0.52 $0.54 $0.51 $0.44 $0.47
FFO excluding adjustments (3) 83,456 93,666 82,937 80,423 83,881 74,127 71,107 65,789
Per Unit
Basic $0.54 $0.61 $0.54 $0.52 $0.55 $0.52 $0.52 $0.48
Diluted (2) $0.54 $0.60 $0.54 $0.52 $0.54 $0.52 $0.52 $0.48
AFFO (4) 78,686 88,935 78,090 76,750 79,655 69,830 66,625 63,474
Per Unit
Basic $0.51 $0.57 $0.51 $0.50 $0.52 $0.49 $0.49 $0.47
Diluted (2) $0.51 $0.57 $0.50 $0.50 $0.52 $0.49 $0.48 $0.46
Payout ratio (to AFFO) 81.0% 72.5% 81.0% 82.6% 76.9% 82.1% 82.6% 86.6%
Cash provided by operating activities 83,717 66,629 56,319 111,197 81,686 53,881 49,484 88,764
Distributions declared 64,360 64,237 64,037 63,854 61,761 59,124 54,908 54,732
Units outstanding (5) 155,300,424 154,991,447 154,608,575 154,088,207 153,718,198 153,209,776 136,739,722 136,315,194
Weighted average Units outstanding
Basic 155,148,277 154,807,223 154,309,475 153,905,303 153,405,481 142,266,459 136,536,536 135,363,993
Diluted (2) 155,728,508 155,427,741 154,954,420 154,531,704 154,054,318 144,987,357 139,387,830 138,338,422
Total assets 8,647,605 8,611,463 8,562,488 8,505,003 8,530,967 8,409,460 7,197,619 7,107,403
Total unencumbered assets 2,635,200 2,522,100 2,463,000 2,453,000 2,518,800 2,460,800 2,419,200 2,443,100
Total debt (1) 3,896,201 3,842,278 3,838,553 3,823,229 3,878,404 3,793,412 3,072,520 3,003,121
Occupancy rate 98.3% 98.2% 98.5% 98.7% 98.7% 98.6% 98.6% 99.0%
(1) Includes the Trust's share of earnings from investment in associates.(2) Diluted AFFO and FFO are adjusted for the dilutive effect of the convertible debentures, vested Earnout options and vested portion of deferred units, unless they are anti-dilutive.(3) September 30, 2016 excludes the yield maintenance on redemption of unsecured debentures and related write-off of unamortized financing costs ($16.5 million). June 30, 2015 excludes
write-off of unamortized financing costs on redemption of convertible debentures ($0.6 million). March 31, 2015 excludes the yield maintenance on redemption of unsecured debentures
and related write-off of unamortized financing costs ($11.0 million). December 31, 2014 excludes the adjustment for CFO transition costs ($0.9 million). June 30, 2014 excludes yield
maintenance fee paid and write-off of unamortized transaction costs upon redemption of senior unsecured debentures ($4.3 million). March 31, 2014 excludes the yield maintenance
fee paid and write-off of unamortized transaction costs upon redemption of senior unsecured debentures ($9.5 million).(4) A normalized level of sustaining capital expenditures and leasing costs is used in the first three quarters of each fiscal year, adjusted to actual in the fourth quarter. (5) Total units outstanding include Trust Units and LP Units, including Class D Units classified as financial liabilities. (6) Includes $9.7 million settlement proceeds associated with the Target lease terminations net of other amounts recorded during the three months ended June 30, 2016. For the three months
ended June 30, 2016, the net settlement proceeds had an impact on both FFO per Unit and AFFO per Unit by $0.06.
Income Taxes and SIFT Compliance
The Trust is taxed as a mutual fund trust for Canadian income tax purposes. In accordance with the Declaration of Trust, distributions
to Unitholders are declared at the discretion of the Trustees. The Trust endeavours to declare distributions in each taxation year in
such an amount as is necessary to ensure the Trust will not be subject to taxes on its net income and net capital gains under Part I of
the Income Tax Act (Canada) (the "Tax Act").
Pursuant to the amendments to the Tax Act, the taxation regime applicable to SIFTs and investors in SIFTs has been altered. If the
Trust were to become subject to these new rules (the "SIFT Rules"), it generally would be taxed in a manner similar to corporations
on income from business carried on in Canada by the Trust and on income (other than taxable dividends) or capital gains from non-
portfolio properties (as defined in the Tax Act) at a combined federal and provincial tax rate similar to that of a corporation. In general,
distributions paid as returns of capital will not be subject to this tax. The SIFT Rules apply commencing in the 2011 taxation year. The
SIFT Rules are not applicable to a real estate investment trust that meets certain specified criteria relating to the nature of its revenue
and investments (the "REIT Exemption").
The Trust qualifies for the REIT Exemption under the SIFT rules as at September 30, 2016.

MANAGEMENT'S DISCUSSION AND ANALYSIS
40 SMART REAL ESTATE INVESTMENT TRUST | THIRD QUARTER REPORT 2016
Disclosure Controls and Procedures and Internal Controls Over Financial Reporting – National
Instrument 52-109 Compliance
Disclosure Controls and Procedures (DCP)The Trust's Chief Executive Officer (CEO) and Chief Financial Officer (CFO) have designed or caused to be designed, under their
direct supervision, the Trust's DCP (as defined in National Instrument 52-109 – Certification of Disclosure in Issuers' Annual and
Interim Filings ("NI 52-109"), adopted by the Canadian Securities Administrators) to provide reasonable assurance that: (i) material
information relating to the Trust, including its consolidated subsidiaries, is made known to them by others within those entities,
particularly during the period in which the interim filings are being prepared; and (ii) material information required to be disclosed in
the annual filings is recorded, processed, summarized and reported on a timely basis. The Trust continues to evaluate the effectiveness
of DCP, and changes are implemented to adjust to the needs of new processes and enhancement required.
Internal Control Over Financial Reporting (ICFR)The Trust's CEO and CFO have also designed, or caused to be designed under their direct supervision, the Trust's ICFR to provide
reasonable assurance regarding the reliability of financial reporting and the preparation of consolidated financial statements for external
purposes in accordance with IFRS.
Inherent LimitationsNotwithstanding the foregoing, because of its inherent limitations a control system can provide only reasonable assurance that the
objectives of the control system are met and may not prevent or detect misstatements. Management's estimates may be incorrect, or
assumptions about future events may be incorrect, resulting in varying results. In addition, management has attempted to minimize
the likelihood of fraud. However, any control system can be circumvented through collusion and illegal acts.
Critical Accounting Estimates
In preparing the Trust's unaudited interim condensed consolidated financial statements and accompanying notes, it is necessary for
management to make estimates, assumptions and judgments that affect the reported amounts of assets and liabilities, the disclosure
of contingent assets and liabilities, and the reported amounts of revenue and expenses during the period. The significant items requiring
estimates are discussed in the Trust's unaudited interim condensed consolidated financial statements for the three and nine months
ended September 30, 2016, and the notes contained therein.
Future Changes in Accounting Policies
The future accounting policy changes as proposed by the International Accounting Standards Board (IASB) are discussed in the Trust's
unaudited interim condensed consolidated financial statements for the three and nine months ended September 30, 2016, and the notes
contained therein.

MANAGEMENT'S DISCUSSION AND ANALYSIS
SMART REAL ESTATE INVESTMENT TRUST | THIRD QUARTER REPORT 2016 41
Risks and Uncertainties
In addition to the risks discussed below, further risks are discussed in the Trust's Annual Information Form for the year ended
December 31, 2015 under the heading "Risk Factors."
Real Property Ownership RiskAll real property investments are subject to elements of risk. Such investments are affected by general economic conditions, local real
estate markets, supply and demand for leased premises, competition from other available premises and various other factors.
Real estate has a high fixed cost associated with ownership, and income lost due to declining rental rates or increased vacancies cannot
easily be minimized through cost reduction. Through well-located, well-designed and professionally managed properties, management
seeks to reduce this risk. Management believes prime locations will attract high-quality retailers with excellent covenants and will enable
the Trust to maintain economic rents and high occupancy. By maintaining the property at the highest standard through professional
management practices, management seeks to increase tenant loyalty.
The value of real property and any improvements thereto may also depend on the credit and financial stability of the tenants and on
the vacancy rates of the Trust's portfolio of income-producing properties. The Trust's AFFO would be adversely affected if a significant
number of tenants were to become unable to meet their obligations under their leases or if a significant amount of available space in
the properties in which the Trust has an interest were not able to be leased on economically favourable lease terms. In addition, the
AFFO of the Trust would be adversely affected by increased vacancies in the Trust's portfolio of income-producing properties. On
the expiry of any lease, there can be no assurance that the lease will be renewed or the tenant replaced. The terms of any subsequent
lease may be less favourable to the Trust than the existing lease. In the event of default by a tenant, delays or limitations in enforcing
rights as lessor may be experienced and substantial costs in protecting the Trust's investment may be incurred. Furthermore, at any
time, a tenant of any of the Trust's properties may seek the protection of bankruptcy, insolvency or similar laws that could result in
the rejection and termination of such tenant's lease and, thereby, cause a reduction in the cash flow available to the Trust. The ability
to rent unleased space in the properties in which the Trust has an interest will be affected by many factors. Costs may be incurred in
making improvements or repairs to property. The failure to rent vacant space on a timely basis or at all would likely have an adverse
effect on the Trust's financial condition.
Certain significant expenditures, including property taxes, maintenance costs, mortgage payments, insurance costs and related charges
must be made throughout the period of ownership of real property regardless of whether the property is producing any income. If
the Trust is unable to meet mortgage payments on any property, losses could be sustained as a result of the mortgagee's exercise of
its rights of foreclosure or sale.
Real property investments tend to be relatively illiquid with the degree of liquidity generally fluctuating in relation to demand for and
the perceived desirability of such investments. If the Trust were to be required to liquidate its real property investments, the proceeds
to the Trust might be significantly less than the aggregate carrying value of its properties.
The Trust will be subject to the risks associated with debt financing on its properties and it may not be able to refinance its properties
on terms that are as favourable as the terms of existing indebtedness. In order to minimize this risk, the Trust attempts to appropriately
structure the timing of the renewal of significant tenant leases on the properties in relation to the time at which mortgage indebtedness
on such properties becomes due for refinancing.
Significant deterioration of the retail shopping centre market in general or the financial health of Walmart in particular could have an
adverse effect on the Trust's business, financial condition or results of operations.
Development and Construction RiskDevelopment and construction risk arises from the possibility that developed space will not be leased or that costs of development
and construction will exceed original estimates, resulting in an uneconomic return from the leasing of such developments. The Trust
mitigates this risk by not commencing construction of any development until sufficient lease-up has occurred and by entering into
fixed price contracts for a large proportion of both development and construction costs.
Joint Venture RiskThe Trust is a co-owner in several properties including a joint venture with Penguin to develop VMC, which is classified as an investment
in associates. The Trust is subject to the risks associated with the conduct of joint ventures. Such risks include disagreements with its
partners to develop and operate the properties efficiently and the inability of the partners to meet their obligations to the joint ventures
or third parties. Any failure of the Trust or its partners to meet its obligations or any disputes with respect to strategic decision-making
or the parties’ respective rights and obligations, could have a material adverse effect on the joint ventures, which may have a material

MANAGEMENT'S DISCUSSION AND ANALYSIS
42 SMART REAL ESTATE INVESTMENT TRUST | THIRD QUARTER REPORT 2016
adverse effect on the Trust. These risks are mitigated by the Trust’s existing relationships with its partners. The VMC site could include
condominium, hotel and/or other developments, which may be prohibited activities under the SIFT Rules that could cause the Trust
to violate its REIT status. In such circumstances, the Trust has an option to put certain portions of its interest in the arrangement at
fair value to Penguin and may be required to provide financing to Penguin. The Trust will monitor the developments in VMC and take
proactive action to protect its REIT status and will exercise its put option only if necessary.
Interest and Financing RiskIn the low interest rate environment that the Canadian economy has experienced in recent years, leverage has enabled the Trust to
enhance its return to Unitholders. A reversal of this trend, however, could significantly affect the business's ability to meet its financial
obligations. In order to minimize this risk, the Trust's policy is to negotiate fixed rate secured debt with staggered maturities on the
portfolio and seek to match average lease maturity to average debt maturity. Derivative financial instruments may be utilized by the
Trust in the management of its interest rate exposure. The Trust's policy is not to utilize derivative financial instruments for trading
or speculative purposes. In addition, the Declaration of Trust restricts total indebtedness permitted on the portfolio.
Interest rate changes will also affect the Trust's development portfolio. The Trust has entered into development agreements that obligate
the Trust to acquire up to approximately 0.6 million square feet of additional income properties at a cost determined by capitalizing
the rental income at predetermined rates. Subject to the ability of the Trust to obtain financing on acceptable terms, the Trust will
finance these acquisitions by issuing additional debt and equity. Changes in interest rates will have an impact on the return from these
acquisitions should the rate exceed the capitalization rate used and could result in a purchase being non-accretive. This risk is mitigated
as management has certain rights of approval over the developments and acquisitions.
Operating facilities and secured debt exist that are priced at a risk premium over short-term rates. Changes in short-term interest rates
will have an impact on the cost of financing. In addition, there is a risk the lenders will not refinance on maturity. By restricting the
amount of variable interest rate debt and short-term debt, the Trust has minimized the impact on financial performance.
The Canadian capital markets are competitively priced. In addition, the secured debt market remains strong with lenders seeking quality
products. Due to the quality and location of the Trust's real estate, management expects to meet its financial obligations.
Credit RiskCredit risk arises from cash and cash equivalents, as well as credit exposures with respect to tenant receivables and mortgages and loans
receivable. Tenants may experience financial difficulty and become unable to fulfill their lease commitments. The Trust mitigates this
risk of credit loss by reviewing tenants' covenants, by ensuring its tenant mix is diversified and by limiting its exposure to any one
tenant, except Walmart Canada because of its creditworthiness. Further risks arise in the event that borrowers may default on the
repayment of amounts owing to the Trust. The Trust endeavours to ensure adequate security has been provided in support of mortgages
and loans receivable. The failure of the Trust's tenants or borrowers to pay the Trust amounts owing on a timely basis or at all would
have an adverse effect on the Trust's financial condition. The Trust deposits its surplus cash and cash equivalents in high-credit-quality
financial institutions only in order to minimize any credit risk associated with cash and cash equivalents.
Environmental RiskAs an owner of real property, the Trust is subject to various federal, provincial, territorial and municipal laws relating to environmental
matters. Such laws provide that the Trust could be liable for the costs of removal of certain hazardous substances and remediation of
certain hazardous locations. The failure to remove or remediate such substances or locations, if any, could adversely affect the Trust's
ability to sell such real estate or to borrow using such real estate as collateral and could potentially also result in claims against the Trust.
The Trust is not aware of any material non-compliance with environmental laws at any of its properties. The Trust is also not aware
of any pending or threatened investigations or actions by environmental regulatory authorities in connection with any of its properties
or any pending or threatened claims relating to environmental conditions at its properties. The Trust has policies and procedures to
review and monitor environmental exposure. It is the Trust's operating policy to obtain a Phase I environmental assessment on all
properties prior to acquisition. Further investigation is conducted if the Phase I assessments indicate a problem. In addition, the
standard lease requires compliance with environmental laws and regulations and restricts tenants from carrying on environmentally
hazardous activities or having environmentally hazardous substances on site. The Trust has obtained environmental insurance on certain
assets to further manage risk.
The Trust will make the necessary capital and operating expenditures to ensure compliance with environmental laws and regulations.
Although there can be no assurances, the Trust does not believe that costs relating to environmental matters will have a material adverse
effect on the Trust's business, financial condition or results of operations. However, environmental laws and regulations can change,
and the Trust may become subject to more stringent environmental laws and regulations in the future. Compliance with more stringent
environmental laws and regulations could have an adverse effect on the Trust's business, financial condition or results of operations.

MANAGEMENT'S DISCUSSION AND ANALYSIS
SMART REAL ESTATE INVESTMENT TRUST | THIRD QUARTER REPORT 2016 43
Capital RequirementsThe Trust accesses the capital markets from time to time through the issuance of debt, equity or equity related securities. If the Trust
were unable to raise additional funds or renew existing maturing debt on favourable terms, then acquisition or development activities
could be curtailed, asset sales accelerated and property specific financing, purchase and development agreements renegotiated and
monthly cash distributions reduced or suspended. However, the Trust anticipates accessing the capital markets on favourable terms
due to its high occupancy levels and low lease maturities, combined with strong national tenants in prime retail locations.
Tax Rules for Income TrustsPursuant to the SIFT Rules, a SIFT is subject to taxes with respect to certain distributions at a rate that is substantially equivalent to
the general tax rate applicable to a Canadian corporation. The SIFT Rules apply to most trusts, other than REITs that qualify for the
REIT Exemption. Accordingly, unless the REIT Exemption is applicable to the Trust, the SIFT Rules could have an impact on the
level of cash distributions that would otherwise be made by the Trust and the taxation of such distributions to Unitholders.
As at September 30, 2016, the Trust qualifies for the REIT Exemption.
Income Tax RiskAlthough the Trust believes that all expenses claimed for income tax purposes are reasonable and deductible and that the cost amounts
and capital cost allowance claims are correctly determined, there can be no assurance that the Canada Revenue Agency (CRA) will
agree or that the Tax Act or the interpretation of the Tax Act will not change. If the CRA successfully challenges the deductibility of
such expenses, the taxable income of the Trust and its Unitholders may be adversely affected. The extent to which distributions will
be tax-deferred in the future will depend in part on the extent to which entities owned by the Trust are able to deduct capital cost
allowance relating to the assets held by them.
Subsequent Events
On October 25, 2016, the Trust completed the acquisition of a mixed-use retail-office centre in Pointe-Claire, Quebec, from a third
party, totalling approximately 382,000 square feet of leasable area. The total purchase price of this acquisition was $62.0 million, which
was be funded by existing cash and the assumption of an existing mortgage totalling $34.5 million with an interest rate of 2.87% that
matures in 2017.
On October 28, 2016, the Trust entered into an agreement to extend a loan receivable in the amount of $40.3 million issued to OneREIT
for a period of one year that was due to mature on October 30, 2016 with an interest rate of 6.75%, resulting in a revised maturity
date of October 30, 2017 with substantially the same terms except for a one-time prepayment option of $10.0 million that was exercised
by OneREIT on October 31, 2016.
Outlook
“What issues keep the company’s management team awake at night?” is a question that is often asked of SmartREIT’s management.
When recently asked this question, SmartREIT’s management responded by saying that there were four primary areas of concern:
a) The slow pace of economic growth currently enveloping Canada and its corresponding adverse impact on employment growth,
consumer confidence, retail spending, and tenant sustainability and creditworthiness;
b) The challenges associated with development, including delays in tenant expansion decisions, a surplus of vacant retail inventory,
and narrowing returns on investment levels;
c) The capricious nature of the equity capital markets that are currently experiencing tremendous short term volatility resulting in
SmartREIT’s cost of capital, when pursing acquisitions, being at a competitive disadvantage to pension funds and similar custodians
of longer term capital; and,
d) The evolving needs and business platform changes to the retail landscape caused by e-commerce and m-commerce and how these
changes may affect the SmartREIT portfolio in the future.
The concerns that emanate from this question, although important, are more appropriately assessed when a further question is asked
and that is, “So what is the company’s management team doing to mitigate the risks associated with these concerns in an effort to at
least permit its Unitholders and other stakeholders to enjoy a restful slumber?” The sections below represent management’s perspective
on these four areas of concern.

MANAGEMENT'S DISCUSSION AND ANALYSIS
44 SMART REAL ESTATE INVESTMENT TRUST | THIRD QUARTER REPORT 2016
a) Limitations on Economic Growth
From an economic perspective, given the continuing challenges in both real employment and real growth levels, the federal government
and the Bank of Canada continue to reaffirm their collective belief that economic stimulus is a necessary priority. The decline in the
price of oil, which has caused a material weakening in both capital investment and oil-production in Canada’s oil-producing provinces
and has subsequently resulted in increased unemployment levels in these provinces, appears to have bottomed in February 2016, when
the price of oil hit $26 per barrel. The market has since experienced some upward momentum and stabilization in the price of oil,
reaching over $46 per barrel at the end of October 2016. The horrific forest fires that devastated the Fort McMurray area of northern
Alberta earlier in the year, have substantially curtailed Canadian oil sands' year to date production levels, which in turn continue to
impede Canadian economic growth prospects. However, some turnaround was experienced during the third quarter of 2016. Canada's
overall employment levels, however, continue to weaken, with the national unemployment level increasing to 7% at the end of September
2016. Accordingly, management anticipates these challenges with national levels of permanent, full-time employment will continue to
weaken consumer confidence levels and coincident retail spending, resulting in overall annual growth levels in Canadian retail sales
remaining sluggish at 2.1%.
This continued economic malaise has resulted in some well- known retailers, including Golf Town, Danier Leather, Aeropostale, PJ’s
Pets, Ben Moss Jewellers, and Jones New York, filing for creditor protection or in some cases shuttering their businesses. The "economic
exhaust" to landlords that is left from these challenged retailers includes: delinquent and unpaid rents, lower rents achieved on lease
renewals, condensed or smaller area requirements, and higher levels of vacant space.
In an effort to mitigate many of these challenges, SmartREIT’s core portfolio, which includes over 31 million square feet of
predominately Walmart anchored shopping centres, has been designed to withstand economically ‘troubled times’ by offering a tenant
mix principally targeted to value-conscious Canadians. This portfolio of shopping centres also offers convenient locations, low operating
costs and intelligent designs. Management believes that the presence of these factors should continue to permit SmartREIT to maintain
overall industry-leading occupancy and tenant renewal levels and in spite of market limitations, reasonable rental increases (albeit lower
than those experienced in recent years).
Notwithstanding this strong level of insulation from these challenged economic times, some SmartREIT tenants, as noted above, do
become economic casualties. In an effort to ensure that challenges associated with tenant rent collections are prudently managed,
management continues to take a conservative view of its overdue accounts receivable balances and provides allowances in anticipation
of potential future collection challenges. As at September 30, 2016, these provisions exceeded $4.7 million and management is confident,
when looking forward, that this practice, which does have a direct adverse impact on its current period financial results, will continue
to permit SmartREIT to be identified as an industry leader among its peers.
b) Challenges Associated with Development
Property development is the second area that continues to be a concern of management. One of the direct consequences of having
a large supply of vacant retail space in the marketplace is the inverse correlation this phenomenon has with the level of development
of new retail space. Target’s departure from Canada in 2015 left approximately 15 million square feet of available vacant retail space.
In addition, the vacant space left by the tenants noted above and other Canadian retailers contracting in size, has added further inventory
options for those Canadian retailers that are expanding. Accordingly, until the market has substantively absorbed these vacant areas,
new retail development in some markets will continue to be limited.
Because of the preponderance of available vacant land surrounding many of its shopping centres, management has been examining
the possibility for SmartREIT to develop, on a joint venture basis with ‘best-in-class’ partners, opportunities in the areas of retirement
homes, self-storage and various forms of residential development. Many of these development initiatives are in their infancy at either
the exploratory stage, or the preliminary discussion stage with potential partners. Management has chosen to account for many of the
costs associated with these initiatives as current period expenses and therefore the treatment of these costs has an unfavourable impact
on current period earnings. For the nine months ended September 30, 2016, SmartREIT expensed $3.9 million in additional G&A
costs for these initiatives, a conservative practice that is temporary, but will likely continue until these initiatives progress further.
One of the guiding disciplines pertaining to value creation from development that management continues to profess is the assumption
that value is created for SmartREIT’s unitholders by investing capital raised to generate future cash flow at rates of return that exceed
SmartREIT’s cost of capital. Accordingly, development initiatives which typically have long development timeframes, significant
capital outlays, sensitivity to rising interest rates, cost escalation exposure, and leasing and occupancy risk must follow this discipline
such that the invested capital provides SmartREIT’s unitholders with a return that exceeds its cost of capital. Looking forward,
management is ever mindful of this disciplined approach to development which may, from time to time, result in decisions to defer
or pass on certain development opportunities.
Growth initiatives are being further propelled by the continued unprecedented success of the first phase of the Toronto Premium
Outlets, which has resulted in the decision to embark upon a multi-phased plan to expand the centre’s parking facility and its retail
footprint over the next two years. Concurrent with this expansion initiative, SmartREIT and its partner, Simon Properties, are also
continuing to search for other Premium Outlets sites in Canada. Development and leasing initiatives at VMC continue to progress,

MANAGEMENT'S DISCUSSION AND ANALYSIS
SMART REAL ESTATE INVESTMENT TRUST | THIRD QUARTER REPORT 2016 45
with the second phase of office development at VMC being recently announced. This exciting next phase is expected to be completed
in 2019 and will feature a new 220,000 square foot Class A facility, which management anticipates will be home to lead occupants PwC,
the YMCA, and a new library and additional space for other community uses for the City of Vaughan. Also, KPMG, the lead occupant
for the first phase of VMC, has now moved in to their premises; a significant occasion for both KPMG and for SmartREIT! There
continues to be a strong level of interest by many large prospective tenants in both available space in the KPMG Tower and also for
future phases of VMC. In addition, construction of the Spadina subway line’s northern extension, which will permit direct underground
access from VMC to the on-site subway station, continues in earnest and completion is expected in late 2017. This distinguishing facet
of the project is a key differentiating characteristic to other commercial nodes that have developed in the GTA over the last 25 years
and underscores the reality of how transit hubs can spur the development of intensified communities.
SmartREIT has also commenced development planning on two other large development initiatives that are proximate to proposed
future transit hubs in Toronto. These include: a) the StudioCentre property on Eastern Avenue in Toronto which, when complete, is
expected to feature up to 1.2 million square feet of mixed use development and will be a short walk to the proposed “Downtown
Relief ” subway line in Toronto, and b) the Westside Mall property on Eglinton Avenue West in Toronto which, when complete, is
expected to feature over 2.0 million square feet of mixed use development and will accommodate the “Caledonia Station” on the
Eglinton Crosstown LRT line which is currently under construction with completion expected in 2021.
c) Turbulence in the Capital Markets
The erratic movements of the capital markets is the third issue that continues to be a concern of management. Market forces have
seen SmartREIT’s Unit price fluctuate during 2016 from a low of $29.05 per unit to a high of $38.63 per unit, representing a 33%
swing over a nine-month period. 10 year bond prices were even more volatile and have varied from a low of 0.95% to a high of 1.56%
during the same period, representing a swing of 64%. In addition, spreads for secured and unsecured 10 year debt have varied from
lows of 1.95% and 2.25% to highs of 2.15% and 2.90% respectively during the year to date. Overall rates for longer terms which had
been trending upwards prior to Britain’s Brexit vote in June 2016, have recently returned to historically low levels. These longer term
rates in Canada, which have historically moved in the same direction as U.S. bond rates, are expected to move higher after the US
election.
SmartREIT has indicated over the last several quarters, its expectation for longer-term yields to climb from their current historically
low levels. Accordingly, management continues to favour a disciplined “lock long” strategy when mortgage renewals and similar financing
opportunities arise. This refinancing strategy has now pushed SmartREIT’s overall weighted average term and interest rate to 5.0 years
and 3.81% respectively for its secured debt (September 30, 2015 - 5.6 years and 3.85%) and 6.3 years and 3.71% respectively for its
unsecured debt (September 30, 2015 - 5.25 years and 3.85%).
These market driven variations in unit price and cost of debt result in challenges with planning for developments, acquisitions, and
operations. The corresponding higher cost of capital leaves SmartREIT as well as its counterpart Canadian REITs with a competitive
disadvantage to Canadian pension funds and offshore investors when competing for property and development opportunities; because
the market to purchase existing higher quality retail properties continues to be limited, with an abundance of capital trying to be ‘put
to use’, values continue to rise. Accordingly, at least in the near term, acquisition opportunities will likely continue to be relatively
limited.
d) E-commerce and M-commerce Changes
The fourth issue that continues to concern management pertains to the continuing evolution of e-commerce and m-commerce and
their combined impact on conventional retail shopping. SmartREIT’s retail partners continue to evolve their e-commerce and m-
commerce strategies to gain further traction with their customers. The continued development of omni-channel alternatives and “click
and collect” options are having an impact on the way that Canadian retailers use their retail locations. In this regard, SmartREIT is
continuing its discussions with its retail partners to determine better spatial solutions to accommodate the industry’s ever-changing
needs, including: alternative docking, storage and delivery systems, priority parking options, and swiftness in change-in-use planning.
The Penguin Pick-Up concept (SmartREIT does not have an ownership interest in this entity) continues its ascent in Canada and
SmartREIT plans to continue to facilitate the expansion of this concept in its shopping centres over the next several years.
SmartREIT’s best-in-class income producing properties continue to offer strength, stability and security during these periods of
economic uncertainty. Its disciplined platform for innovative growth is focused on a myriad of development opportunities that presently
exist in its portfolio. Its "lock long" practice of financing mitigates much of the volatility and risk that might arise as a result of interest
rate ‘creep’. And lastly, its constant surveying of its tenants’ evolving needs in light of the e-commerce and m-commerce landscape
permit SmartREIT to be well positioned to accommodate these changing requirements. These initiatives, and those risk mitigation
practices noted above should permit SmartREIT’s Unitholders and other stakeholders sufficient ‘peace of mind’ to enjoy a restful
night’s sleep!