Smart Motorway All Lane Running - GOV.UK
57
Smart Motorway All Lane Running M25 J23-27 Monitoring Third Year Report Highways England 8 February 2018
Transcript of Smart Motorway All Lane Running - GOV.UK

Smart Motorway All Lane Running M25 J23-27 Monitoring Third Year Report Highways England
8 February 2018

SMALR Monitoring M25 J23-27 SMALR Monitoring Third Year Report
Highways England M25 J23-27 SMALR Monitoring Third Year Report | Version 2.0 | 8 February 2018 2
Notice
This document and its contents have been prepared and are intended solely for Highways England’s information and use in relation to the SMALR project.
Atkins assumes no responsibility to any other party in respect of or arising out of or in connection with this document and/or its contents.
This document has 57 pages including the cover.
Document history
Job number: Document ref: 5150343/04/06
Revision Purpose description Originated Checked Reviewed Authorised Date
Rev 1.0 Draft Issue to client. Joe Castle Andrew Truscott
Jill Hayden Jill Hayden 06/12/2017
Rev 2.0 Final Issue Joe Castle Andrew Truscott
Jill Hayden Jill Hayden 08/02/2018

SMALR Monitoring M25 J23-27 SMALR Monitoring Third Year Report
Highways England M25 J23-27 SMALR Monitoring Third Year Report | Version 2.0 | 8 February 2018 3
Table of contents
Chapter Pages
Executive summary 5
1. Introduction 7 1.1. Scope of project and purpose of this report 7 1.2. Background of the scheme 7 1.3. Evaluation timescales 8 1.4. Expected effects of SMALR 9
2. Flows 14 2.1. Introduction 14 2.2. Daily flows per link 14 2.3. Flow over each time slice per link 19 2.4. Summary 24
3. Journey times 25 3.1. Introduction 25 3.2. Average journey time 25 3.3. Speed by distance analysis 26 3.4. Journey time reliability 29 3.5. Summary 31
4. Safety 32 4.1. Introduction 32 4.2. Number and rate of collisions 32 4.3. Severity and severity index 35 4.4. Casualties, FWI and KSI rate 35 4.5. User groups 36 4.6. Red X (lane closed) analysis 36 4.7. Summary 37
5. Conclusions 38 5.1. Flow 38 5.2. Journey time 38 5.3. Safety 38
Appendices 39
Appendix A. Flows additional information 40 A.1. 24 hour average daily traffic (ADT) 40 A.2. Flows by time slice 41
Appendix B. Journey times additional information 43 B.1. Days in sample 43 B.2. Journey time 43
Appendix C. Safety 47 C.1. Injury collisions by user group 47 C.2. Contributory factors 48 C.3. Red X compliance 54

SMALR Monitoring M25 J23-27 SMALR Monitoring Third Year Report
Highways England M25 J23-27 SMALR Monitoring Third Year Report | Version 2.0 | 8 February 2018 4
Tables Table 1-1 Day type and time slice definitions 9 Table 3-1 Journey time metrics 29 Table 4-1 Number of collisions by severity and collision rates 33 Table 4-2 Number of collisions and collision rates following national trends 35 Table 4-3 Collisions by severity and severity index 35 Table 4-4 Number of casualties and FWI rate 35 Table 4-5 Total KSI and KSI rate 36 Table C-1 Summary of Red X events 54
Figures Figure 1-1 Geographical location of the M25 J23 to J27 SMALR scheme 7 Figure 1-2 M25 J23 to J27 SMALR scheme split 8 Figure 1-3 Data collection & evaluation periods 9 Figure 1-4 Snapshot of speeds by lane Before and Yr3 After 10 Figure 1-5 Flow by lane Before and Yr3 After 11 Figure 1-6 Speed flow curves Before and Yr3 After 12 Figure 1-7 Speed distribution Before and Yr 3 After 13 Figure 2-1 Average daily traffic by day type J23-J24 clockwise 15 Figure 2-2 Average daily traffic by day type J24-J25 clockwise 15 Figure 2-3 Average daily traffic by day type J25-J26 clockwise 16 Figure 2-4 Average daily traffic by day type J26-J27 clockwise 16 Figure 2-5 Average daily traffic by day type J23-J24 anticlockwise 17 Figure 2-6 Average daily traffic by day type J24-J25 anticlockwise 17 Figure 2-7 Average daily traffic by day type J25-J26 anticlockwise 18 Figure 2-8 Average daily traffic by day type J26-J27 anticlockwise 18 Figure 2-9 Average flow by time slice J23-J24 clockwise 20 Figure 2-10 Average flow by time slice J24-J25 clockwise 20 Figure 2-11 Average flow by time slice J25-J26 clockwise 21 Figure 2-12 Average flow by time slice J26-J27 clockwise 21 Figure 2-13 Average flow by time slice J23-J24 anticlockwise 22 Figure 2-14 Average flow by time slice J24-J25 anticlockwise 22 Figure 2-15 Average flow by time slice J25-J26 anticlockwise 23 Figure 2-16 Average flow by time slice J26-J27 anticlockwise 23 Figure 3-1 Clockwise journey time comparison 26 Figure 3-2 Anticlockwise journey time comparison 26 Figure 3-3 Clockwise speed over distance plots 27 Figure 3-4 Anticlockwise speed over distance plots 28 Figure 3-5 Clockwise journey time reliability 30 Figure 3-6 Anticlockwise journey time reliability 31 Figure 5-1 Example lane closure event 37

SMALR Monitoring M25 J23-27 SMALR Monitoring Third Year Report
Highways England M25 J23-27 SMALR Monitoring Third Year Report | Version 2.0 | 8 February 2018 5
Executive summary
Background
Smart motorways increase capacity to reduce congestion and improve journey time reliability while maintaining safety, by making the hard shoulder available as a traffic lane and by using variable speed limits to smooth traffic flow, supporting economic growth.
The Smart Motorway All Lane Running (SMALR) scheme, M25 J23 to J27, has previously been monitored and evaluated for Yr1 and Yr2 After period. This report details the performance after 3 years of operation and confirms that All Lane Running is performing as expected. This report completes the evaluation of the scheme in this format and further monitoring and evaluation will continue as part of Highways England’s business as usual monitoring and evaluation processes, including Road Safety Audits and Post Opening Evaluation Reports
The safety data confirms that the concept has met its safety objective of maintaining the very high standards of safety compared to the situation before All Lane Running was introduced.
Atkins was commissioned to perform a wide-ranging, comprehensive evaluation of the third year of operation in order to:
• review the safety performance during the initial period of operation;
• monitor and understand the change in safety risk to road users and to road workers;
• quantify and provide evidence of the benefits of the concept; and
• provide evidence to help improve the concept of operation and the design requirements.
This report presents the results following a third year of after evaluation from May 2016 to April 2017. It is split into sections to cover each of the objectives of SMALR assessed in this report:
• flows;
• journey times; and
• safety.
Overview of Year 3 Results
Expanding evidence base to provide confirmation of performance
SMALR objectives

SMALR Monitoring M25 J23-27 SMALR Monitoring Third Year Report
Highways England M25 J23-27 SMALR Monitoring Third Year Report | Version 2.0 | 8 February 2018 6
Flows
The SMALR section has experienced traffic growth of 16% between the Before and Yr3 After periods, which is far higher than regional motorway growth of 7% over the same period. The largest growth from the Before period has been at weekends, up to 23%, while other days have seen increases between 6% and 19%. This growth may be due to suppressed demand taking advantage of the increased capacity and better journey time reliability of the scheme.
Journey Times
Overall clockwise journey times are effectively unchanged since the Before period in Yr3 After. In the anticlockwise direction journey times have improved by 15 seconds (1.4%).
Journey time reliability clockwise remains similar between the Before and Yr3 After periods. However, there are some delayed journeys in weekday PM peaks. Anticlockwise there is a good improvement on the Monday to Thursday AM peak, while times of day remain similar to before the scheme.
These results show that increases in capacity have been achieved, moving more goods, people and services, while maintaining journey times at pre-scheme levels and slightly improving reliability.
Safety
Against a background of increasing flows, the scheme has met its safety objective1:
• no increase in number or rate of fatal and weighed injury (FWI) casualties;
• based on the data in the analysis, no user group has been adversely affected.
There has been no change in collision rate after taking account the national background trend of improvement.
Severity index, FWI and KSI rates have improved, although these changes are not directly attributable to the scheme.
Monitoring of Red X compliance revealed that across all events analysed, an average of 94% of vehicles complied with Red X signals in the Yr3 After period.
1 Defined as required by Smart Motorways Interim Advice Note 161, http://www.standardsforhighways.co.uk/ha/standards/ians/pdfs/IAN161_15.pdf
Red X compliance is 94%
Journey time reliability has improved slightly
Anticlockwise journey times are improved
Flow has increased by 16%, significantly above national trends
Clockwise journey times are unchanged
The scheme has achieved its safety objective

SMALR Monitoring M25 J23-27 SMALR Monitoring Third Year Report
Highways England M25 J23-27 SMALR Monitoring Third Year Report | Version 2.0 | 8 February 2018 7
1. Introduction
1.1. Scope of project and purpose of this report Having completed the monitoring and evaluation of the second year of operation, Highways England commissioned this project to monitor and evaluate the impact following a third year’s operation of this SMALR scheme, M25 Junction 23 to Junction 27. The evidence base is being continually expanded, providing ongoing confidence in the ALR concept. It is crucial that the performance of the scheme is accurately assessed for a third year of operation in order to:
• review the safety performance during the initial period of operation;
• continue to monitor and understand the change in risk to road users and to road workers;
• quantify and provide evidence of the benefits of the concept; and
• provide evidence to help improve the concept of operation and the design requirements.
With a third year of data available it is possible to conclude whether the collision rate metric has changed with a level of statistical significance that demonstrates it is the result of SMALR. If the change is not statistically significant it can be concluded that the SMALR objective of maintaining a high level of safety has been achieved.
As part of the previous SMALR Monitoring project, an evaluation methodology was designed. The analysis for the Before period, Yr1, Yr2 and Yr3 After follow this methodology to ensure that all results are comparable.
The report is split into sections to cover each of the objectives of SMALR: flows, journey times and safety.
1.2. Background of the scheme
1.2.1. Location This scheme, M25 J23 to J27, is part of the key strategic orbital route around London which forms the hub of the English motorway network; it is also a commuter route for local traffic. It lies within the counties of Hertfordshire, Essex and the Greater London Authority and is located in the northern segment of the M25. J23 is the intersection with the A1(M) and J27 the intersection with the M11.
Figure 1-1 Geographical location of the M25 J23 to J27 SMALR scheme
The SMALR scheme encompasses two tunnels, Holmesdale located between J25 and J26 and Bell Common between J26 and J27.
14
31
30
29
28
2726252423
2221a
20
19
18
17
16
15
21
A1(M)
M1
M11
M40
M4
M25
SM-ALR

SMALR Monitoring M25 J23-27 SMALR Monitoring Third Year Report
Highways England M25 J23-27 SMALR Monitoring Third Year Report | Version 2.0 | 8 February 2018 8
The majority of the M25 is Smart Motorway with hard shoulders which, together with the SMALR scheme, form an overall long term strategy to manage the existing motorway network more effectively.
1.2.2. The SMALR scheme SMALR is a controlled four lane carriageway with no hard shoulder. This is supported by technology in the form of Motorway Incident Detection and Automatic Signalling (MIDAS) traffic detection and traffic control. The signs and signals can be controlled by operators and by automatic algorithms for Congestion Management (CM) and Queue Protection (QP). Emergency Areas (EAs) are available for emergencies.
This scheme was opened in two stages, J23 to J25 opening in May 2014 and J25 to J27 opening in November 2014, see Figure 1-2.
Figure 1-2 M25 J23 to J27 SMALR scheme split
1.3. Evaluation timescales This report presents the results of evaluation and monitoring following three years’ operation of the scheme from May 2014 to April 2017. For clarity and efficiency, the evaluation periods will be referred to as follows throughout this report:
• Before - Baseline;
• Yr1 After - First year after opening;
• Yr2 After - Second year after opening;
• Yr3 After – Third year after opening; and
• After - Entire after period.
The evaluation makes comparisons between the Before and After periods, while operational monitoring has taken place for Red X compliance analysis during the After periods only.
Figure 1-3 shows the evaluation periods used for the Before and After periods. This scheme was opened in two stages, J23 to J25 opening in May 2014 and J25 to J27 opening in November 2014. Consequently, the After period for Yr1 is based on the data for J23 to J25 only until November 2014.
The flow and journey time evaluations compare the Before with Yr2 and Yr3 After; the last 6 months of Yr1 After are not comparable due to the different duration so are not included in this evaluation. The results for Before vs Yr1 and Yr2 can be found in the respective reports.
For the analysis of flows and journey times it is useful to consider the results separately for different day types and time slices. This is because the traffic conditions are different and therefore so are the impacts. Table 1-1 shows the time slices and day types used for the flow and journey time analysis, in accordance with the Monitoring Design Report.

SMALR Monitoring M25 J23-27 SMALR Monitoring Third Year Report
Highways England M25 J23-27 SMALR Monitoring Third Year Report | Version 2.0 | 8 February 2018 9
Figure 1-3 Data collection & evaluation periods
Table 1-1 Day type and time slice definitions
Day type AM peak Inter-peak PM peak
Monday – Thursday 05:30 – 10:30 10:30 – 15:00 15:00 – 20:00
Friday 05:00 – 09:00 09:00 – 13:00 13:00 – 20:00
Saturday - Sunday 08:00 – 20:00
1.4. Expected effects of SMALR The SMALR concept involves increasing the number of running lanes from three to four by re-allocating the space previously used by the hard shoulder. In addition, other infrastructure is provided to deliver a controlled environment to manage the risks associated with converting the hard shoulder to a traffic lane.
The effect of an increase in capacity is that periods of congestion are expected to be less frequent, shorter and less intense leading to reductions in journey time and better journey time reliability. The road effectively becomes more resilient to regular and incident related congestion.
In addition, safety benefits could be realised because traffic speeds become more consistent and the speed differential between lanes reduces. The number of non-emergency hard shoulder stops should also be reduced.
These effects can be seen by looking at traffic performance on a daily basis. The following subsections show speed by lane, flow by lane, speed distribution and speed flow curves for typical days in the Before and Yr3 after periods. The plots show a snapshot of just one location and one day, to demonstrate the impacts.
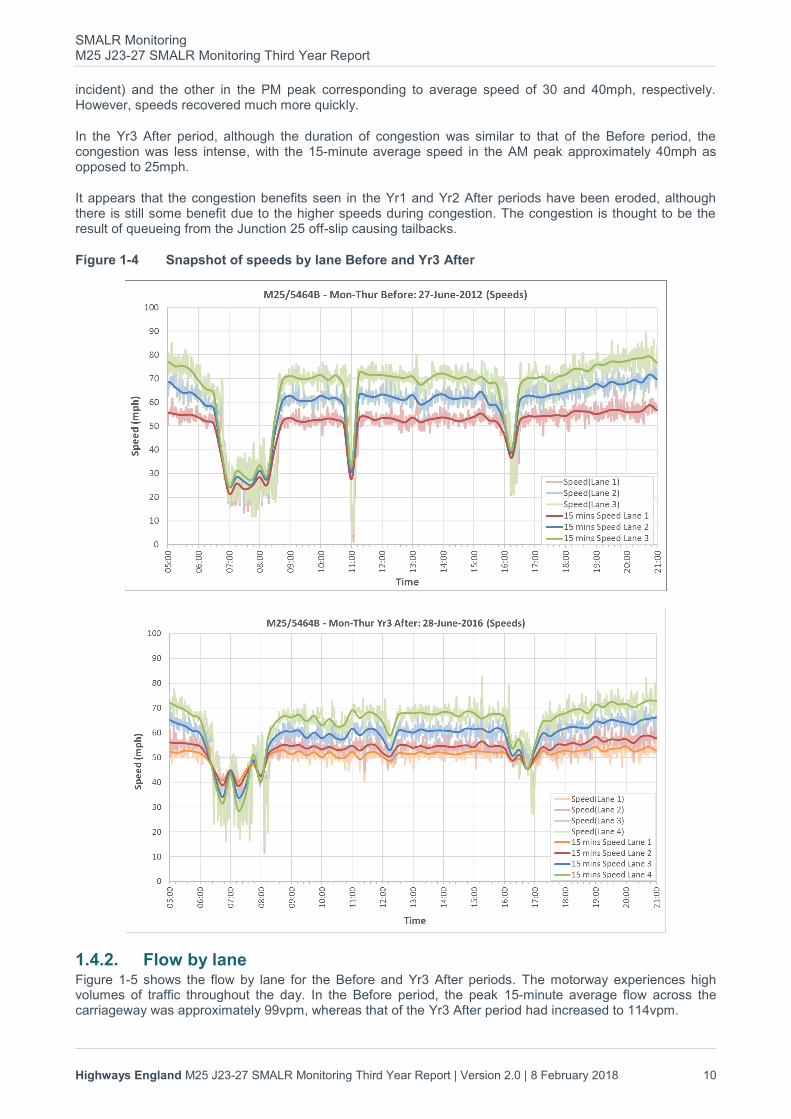
1.4.1. Speed by lane Figure 1-4 shows a snapshot of data from Before and Yr3 After collected during the evaluation process. The 15-minute average speed for each lane is also plotted on the same chart to emphasise the daily trend.
Before the scheme, congestion was present in the morning peak where there was a drop in speeds at 06:30. The average speed in each lane fell to about 25mph which is representative of stop-and-go traffic. This lasted over an hour before recovering to free flow speeds. The speed differential was about 10mph between lanes. Two more breakdowns occur throughout the day, one during the inter-peak (likely to be caused by an
SMALR Monitoring M25 J23-27 SMALR Monitoring Third Year Report
Highways England M25 J23-27 SMALR Monitoring Third Year Report | Version 2.0 | 8 February 2018 10
incident) and the other in the PM peak corresponding to average speed of 30 and 40mph, respectively. However, speeds recovered much more quickly.
In the Yr3 After period, although the duration of congestion was similar to that of the Before period, the congestion was less intense, with the 15-minute average speed in the AM peak approximately 40mph as opposed to 25mph.
It appears that the congestion benefits seen in the Yr1 and Yr2 After periods have been eroded, although there is still some benefit due to the higher speeds during congestion. The congestion is thought to be the result of queueing from the Junction 25 off-slip causing tailbacks.
Figure 1-4 Snapshot of speeds by lane Before and Yr3 After
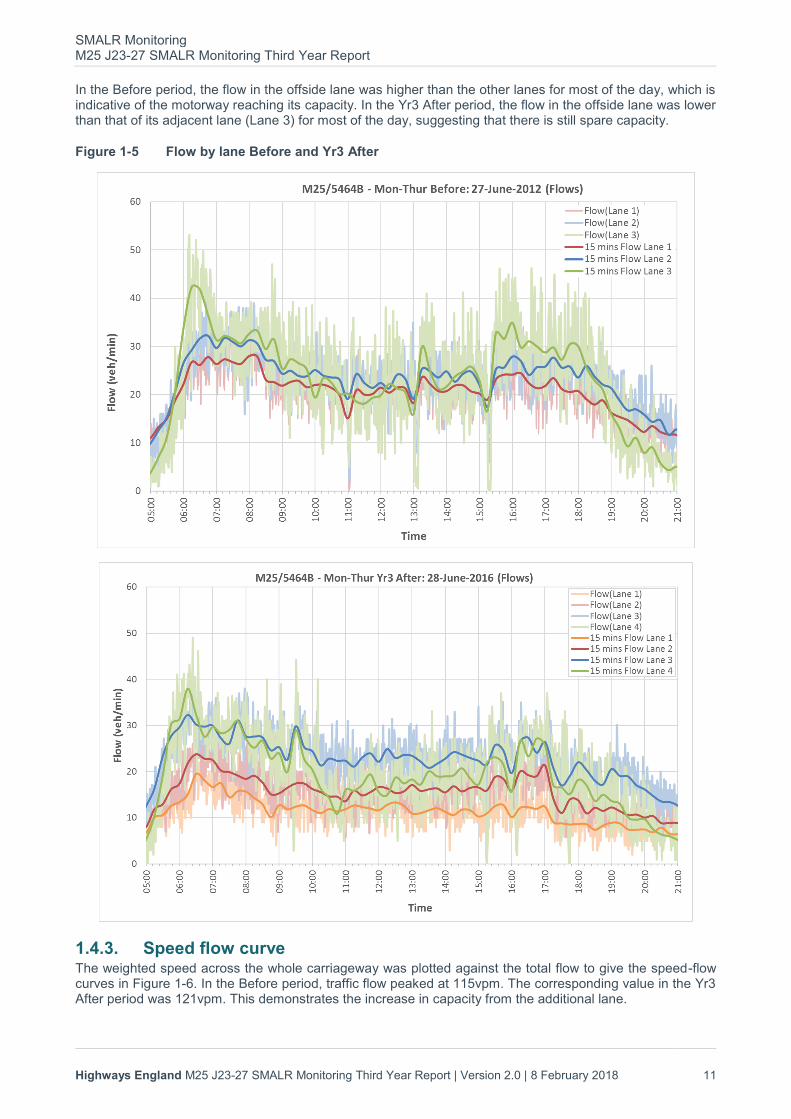
1.4.2. Flow by lane Figure 1-5 shows the flow by lane for the Before and Yr3 After periods. The motorway experiences high volumes of traffic throughout the day. In the Before period, the peak 15-minute average flow across the carriageway was approximately 99vpm, whereas that of the Yr3 After period had increased to 114vpm.
SMALR Monitoring M25 J23-27 SMALR Monitoring Third Year Report
Highways England M25 J23-27 SMALR Monitoring Third Year Report | Version 2.0 | 8 February 2018 11
In the Before period, the flow in the offside lane was higher than the other lanes for most of the day, which is indicative of the motorway reaching its capacity. In the Yr3 After period, the flow in the offside lane was lower than that of its adjacent lane (Lane 3) for most of the day, suggesting that there is still spare capacity.
Figure 1-5 Flow by lane Before and Yr3 After
1.4.3. Speed flow curve The weighted speed across the whole carriageway was plotted against the total flow to give the speed-flow curves in Figure 1-6. In the Before period, traffic flow peaked at 115vpm. The corresponding value in the Yr3 After period was 121vpm. This demonstrates the increase in capacity from the additional lane.

SMALR Monitoring M25 J23-27 SMALR Monitoring Third Year Report
Highways England M25 J23-27 SMALR Monitoring Third Year Report | Version 2.0 | 8 February 2018 12
Figure 1-6 Speed flow curves Before and Yr3 After
In the Before period, the congestion caused flow breakdown, reducing the speeds and the flows to 10mph and 54vpm. This demonstrates the significant capacity drop caused by severe congestion. In the Yr3 After period, despite the congestion duration being similar, it was less intense with the lowest speeds and flows in the region of 25mph and 71vpm.
1.4.4. Speed distribution Figure 1-7 shows the approximate proportions2 of vehicles travelling at speeds in different 10mph ‘bands’, over a 24 hour period in the Before and Yr3 After. The key points of interest are:
When comparing the Yr3 After period against the Before period, the proportion of vehicles travelling at 41-60mph has increased by approximately 20 percentage points, whereas the proportion of vehicles travelling at 21-40mph and 61-80mph has decreased by approximately 7 and 12 percentage points, respectively. This shift in speeds can be explained by the higher speeds observed during congestion in the AM peak. The reduction in the highest speeds is likely to be the result of drivers’ perception of speed enforcement.
2 TCD data has been used providing the average speed minutely per lane.

SMALR Monitoring M25 J23-27 SMALR Monitoring Third Year Report
Highways England M25 J23-27 SMALR Monitoring Third Year Report | Version 2.0 | 8 February 2018 13
Figure 1-7 Speed distribution Before and Yr 3 After

SMALR Monitoring M25 J23-27 SMALR Monitoring Third Year Report
Highways England M25 J23-27 SMALR Monitoring Third Year Report | Version 2.0 | 8 February 2018 14
2. Flows
2.1. Introduction This section presents the results of the Yr3 After traffic flow analysis for the full length of the scheme. Results are compared with the Before and Yr2 data where possible (see Section 2.1.1). The traffic data has been taken from Highways England’s MIDAS database.
2.1.1. Data availability and quality Highways England and their suppliers are investigating a known issue with the quality of flow data from radar detectors and work has been underway to improve it. This has allowed the full length of the scheme to be assessed for the first time in this report. The radar data is now sufficiently good that, with some outliers removed, the remaining radars are considered sufficiently representative of traffic conditions in Yr3 to be reported here.
In Yr1, the radar data issues meant that only J23 to J25 could be reported. The Yr1 After report covered only six months following the opening of J25 – J27; these results are not comparable with the 12 month sample so have not been included in this report.
In Yr2, flows from an extra link (J25 to J26) were presented using a bespoke methodology which compared data from all detector sites against publicly available Manual Classified Counts (MCCs) to determine which sites were considered to be more reliable. However, now that the data for this link has improved in Yr3, we have identified that the flows recorded using this methodology in Yr 2 were too high. We have therefore reanalysed Yr2 flows using the information available to us now.
2.2. Daily flows per link The average daily traffic for the Before and After periods is compared in Figure 2-1 to Figure 2-8, with the 24 hour Average Daily Traffic (ADT) flows between each junction plotted for the different day types. The percentage change form Before is shown above the Yr3 After bar in each case. The corresponding values are shown in Appendix A.1 with changes shown in bold text.
Flows have increased year on year across the After period for all day types and all time slices. In the clockwise direction compared to Before, Mon-Thu Yr3 flows have increased as follows:
• J23 to J24: 11%
• J24 to J25: 10%
• J25 to J26: 13%
• J26 to J27: 17%
Friday flows have also increased, but very slightly less, ranging from 9% to 15%. Weekends have seen the greatest increases between 21% and 25%. The ADTs reflect the overall growth in traffic, with increases ranging from 13% to 18%.
In the anticlockwise direction compared to Before, Mon-Thu Yr3 flows have increased as follows:
• J23 to J24: 13%
• J24 to J25: 13%
• J25 to J26: 17%
• J26 to J27: 15%
Friday flows have again increased slightly less, ranging between 12% and 14%. Weekends have seen the greatest increases between 21% and 24%. The ADTs reflect the overall growth in traffic, with increases ranging from 16% to 17%.
This is the first year in which the impact on J26 to J27 has been reported; clockwise flows appear to have increased slightly more on this link than others, whereas anti-clockwise are similar to other links.

SMALR Monitoring M25 J23-27 SMALR Monitoring Third Year Report
Highways England M25 J23-27 SMALR Monitoring Third Year Report | Version 2.0 | 8 February 2018 15
Figure 2-1 Average daily traffic by day type J23-J24 clockwise
Figure 2-2 Average daily traffic by day type J24-J25 clockwise

SMALR Monitoring M25 J23-27 SMALR Monitoring Third Year Report
Highways England M25 J23-27 SMALR Monitoring Third Year Report | Version 2.0 | 8 February 2018 16
Figure 2-3 Average daily traffic by day type J25-J26 clockwise
Figure 2-4 Average daily traffic by day type J26-J27 clockwise

SMALR Monitoring M25 J23-27 SMALR Monitoring Third Year Report
Highways England M25 J23-27 SMALR Monitoring Third Year Report | Version 2.0 | 8 February 2018 17
Figure 2-5 Average daily traffic by day type J23-J24 anticlockwise
Figure 2-6 Average daily traffic by day type J24-J25 anticlockwise

SMALR Monitoring M25 J23-27 SMALR Monitoring Third Year Report
Highways England M25 J23-27 SMALR Monitoring Third Year Report | Version 2.0 | 8 February 2018 18
Figure 2-7 Average daily traffic by day type J25-J26 anticlockwise
Figure 2-8 Average daily traffic by day type J26-J27 anticlockwise

SMALR Monitoring M25 J23-27 SMALR Monitoring Third Year Report
Highways England M25 J23-27 SMALR Monitoring Third Year Report | Version 2.0 | 8 February 2018 19
The overall AADT over the 12 months of Before and Yr3 After traffic data has increased by between 13% (J24-2J25 clockwise) and 18% (J26-J27 clockwise), with all the other sections/directions experiencing an increase in traffic flow of between 15% and 17%.
South East regional motorway traffic increased between 2013 and 2016 by around 7%3. The growth along the scheme is far above that observed in the regional trends. Although the increase in traffic flows on the M25, facilitated by the scheme, will in itself contribute to the regional traffic trends, this is still a useful point to note when looking at link by link flow increases.
2.3. Flow over each time slice per link Figure 2-9 to Figure 2-16 compare the average Before, Yr2 After and Yr3 After flows by time slice for each link. The percentage change is shown above the Yr3 After bar in each case. The corresponding values are shown in Appendix A.2, with changes shown in bold text.
Clockwise, there are flow increases in each year, on all links in all time slices. Flows are highest in the PM peaks and these have seen the highest weekday growth between J25 and J27. Growth has been more evenly spread across the periods between J23 and J25. The smallest increase is during the Mon-Thu AM Peak between J24 and J25 at 6%. The Fri AM peak and Inter-peak increases for this link are also smaller than other links with increases of 8% and 7%, respectively. In general, the largest increases in traffic flow can be seen between J26 and J27. The largest increase can be seen on the weekends, ranging from 19 to 23%.
Anticlockwise, there are flow increases in each year, in all time slices, on all links apart from J24 to J25. This link has seen slight reductions since Yr2 although still higher than in the Before. For Mon-Thu, the AM peaks generally have the highest flows in this direction and have seen the largest increases. On Fridays, the highest flows are in the PM peaks but the largest increases occur in the AM peaks. The largest increases are on weekends where they range from 21% to 23%.
3 https://www.gov.uk/government/collections/road-traffic-statistics

SMALR Monitoring M25 J23-27 SMALR Monitoring Third Year Report
Highways England M25 J23-27 SMALR Monitoring Third Year Report | Version 2.0 | 8 February 2018 20
Figure 2-9 Average flow by time slice J23-J24 clockwise
Figure 2-10 Average flow by time slice J24-J25 clockwise

SMALR Monitoring M25 J23-27 SMALR Monitoring Third Year Report
Highways England M25 J23-27 SMALR Monitoring Third Year Report | Version 2.0 | 8 February 2018 21
Figure 2-11 Average flow by time slice J25-J26 clockwise
Figure 2-12 Average flow by time slice J26-J27 clockwise

SMALR Monitoring M25 J23-27 SMALR Monitoring Third Year Report
Highways England M25 J23-27 SMALR Monitoring Third Year Report | Version 2.0 | 8 February 2018 22
Figure 2-13 Average flow by time slice J23-J24 anticlockwise
Figure 2-14 Average flow by time slice J24-J25 anticlockwise

SMALR Monitoring M25 J23-27 SMALR Monitoring Third Year Report
Highways England M25 J23-27 SMALR Monitoring Third Year Report | Version 2.0 | 8 February 2018 23
Figure 2-15 Average flow by time slice J25-J26 anticlockwise
Figure 2-16 Average flow by time slice J26-J27 anticlockwise

SMALR Monitoring M25 J23-27 SMALR Monitoring Third Year Report
Highways England M25 J23-27 SMALR Monitoring Third Year Report | Version 2.0 | 8 February 2018 24
2.4. Summary The SMALR section has experienced traffic growth of 16% between the Before and Yr3 After periods, which
is far higher than regional motorway growth over the same period. The largest growth has been at
weekends, up to 23%, while other days have seen increases between 6% and 19%.

SMALR Monitoring M25 J23-27 SMALR Monitoring Third Year Report
Highways England M25 J23-27 SMALR Monitoring Third Year Report | Version 2.0 | 8 February 2018 25
3. Journey times
3.1. Introduction This section outlines the changes in journey times and reliability on the M25 J23-27 SMALR between the Before and Yr3 After periods.
The data used was supplied by TomTom who provide anonymised data of journeys through the scheme during the Before and After periods. The journey time data is at a very spatially disaggregate level, allowing speed analysis to be undertaken at regular intervals along the scheme.
Before interrogating the TomTom database, a review of severe incidents and road works was undertaken to identify any days that should be removed from the analysis because they would not represent normal operating conditions. No such days were identified in the samples therefore all days within the year are included in the dataset.
The journey time results presented in this section form the latest conclusions on journey time performance for the scheme following three years of operation.
3.2. Average journey time The analysis of average journey times from junction to junction demonstrates the change in journey times at link level. The headline results are summarised in Figure 3-1 for clockwise and Figure 3-2 for anticlockwise with more detail provided in Appendix B.
Clockwise, between the Before and Yr3 After periods, there has been effectively no change on average, across all day types and time slices from the average Before journey time of 15 minutes 47 seconds (an increase of 0.4%, i.e. 3 seconds). However there is some variation between time slices. The most congested periods were the Mon-Thu PM peaks and they have experienced worsened journey times of 7%. Other periods have seen improvements of up to 2%.
On individual links, the scheme has provided a slight journey time benefit between J23-24 and J25 to J26 with an overall improvement in average journey time of 13 seconds across all day types and time slices. The J24-25and J26-27 links have seen average journey time increases of 15 seconds and 1 second respectively. It appears that the J24-25 link has caused most of the additional delay in the After period. The roundabout at J25 has been identified as a possible cause and is currently being upgraded with new traffic signals equipment which could reduce the congestion in this area in the future.
Anticlockwise, between the Before and Yr3 After periods, there has been an average percentage improvement of 1.4% (i.e. 15 seconds) across all day types and time slices from the average Before journey time of 16 minutes 37 seconds. The Mon-Thu AM peak period experiences the worst congestion; there has been a 6% journey time improvement, equating to 1 minute 16 second improvement. However, there has been a 2% increase in the Mon-Thu inter-peak.
On individual links, there has been a very slight increase overall on the J24 to J23 link which can be attributed to weekday AM peaks. Slight journey time benefits in the order of a few seconds on average are still being seen on all other links compared to Before.
In summary, average journey times are effectively unchanged in the clockwise direction and 15 seconds shorter in the anticlockwise.

SMALR Monitoring M25 J23-27 SMALR Monitoring Third Year Report
Highways England M25 J23-27 SMALR Monitoring Third Year Report | Version 2.0 | 8 February 2018 26
Figure 3-1 Clockwise journey time comparison
Figure 3-2 Anticlockwise journey time comparison
3.3. Speed by distance analysis To understand how the journey times accrue, analysis of average speed along the scheme has been carried out. Figure 3-3 and Figure 3-4 show the average speed every 100m along the scheme by time slice4. Junction numbers are shown so it can be seen where performance improvements have been made and whether they relate to on or off slip locations. When the After line is above the Before line, benefits are being accrued.
4 In mph; speed in kph by distance plots are contained in Appendix B.2.2.

SMALR Monitoring M25 J23-27 SMALR Monitoring Third Year Report
Highways England M25 J23-27 SMALR Monitoring Third Year Report | Version 2.0 | 8 February 2018 27
Figure 3-3 Clockwise speed over distance plots M
ond
ay –
Th
urs
day
AM
IP
PM
Friday
AM
IP
PM
Satu
rday &
Su
nday
Day

SMALR Monitoring M25 J23-27 SMALR Monitoring Third Year Report
Highways England M25 J23-27 SMALR Monitoring Third Year Report | Version 2.0 | 8 February 2018 28
Figure 3-4 Anticlockwise speed over distance plots M
ond
ay –
Th
urs
day
AM
IP
PM
Friday
AM
IP
PM
Satu
rday &
Su
nday
Day

SMALR Monitoring M25 J23-27 SMALR Monitoring Third Year Report
Highways England M25 J23-27 SMALR Monitoring Third Year Report | Version 2.0 | 8 February 2018 29
The key findings clockwise are:
• Average speeds are consistently higher through J23 in Yr3 After – accruing benefits. In all other links, speeds are lower or similar; and
• The largest difference in average speeds can be seen during the weekday PM peaks in the vicinity of J25, where the Yr3 After average speed is consistently lower (around 50mph or less) than in the Before period. This is in accordance with the journey time findings.
The key findings anticlockwise are:
• In the After period, average speeds are improved, both higher and more consistent through J25 during the weekday AM peaks; and
• Elsewhere the speeds in Yr3 After are generally lower than or similar to the Before.
3.4. Journey time reliability Reliability of journey times is a critical measure of a road’s utility and function for road users. Percentile data has been used to understand the distribution of journey times through the scheme. Four metrics have been used, as shown in Table 3-1.
Table 3-1 Journey time metrics
Metric Description
5th percentile One in 20 vehicles are completing the journey faster than this, so it is a good measure of the best time achievable.
25th percentile One in four vehicles are completing the journey faster than this and it is known as the lower quartile. The further this value is from the 5th percentile the more variability there is in the fastest journeys. It is an indicator that delays are experienced by a high proportion of all users.
75th percentile Three quarters of vehicles complete the journey faster than this and it is a good measure of general variability from day to day of journey times.
95th percentile 95% of vehicles complete the journey faster than this, the remaining journeys are likely to be affected by incidents or heavy congestion. The further the 95th percentile journey time is from the 75th percentile the more heavily congested a journey is. This is an indication of incident related variability.
These four metrics are shown below in Figure 3-5 and Figure 3-6 as ‘box and whisker’ diagrams for each time slice, Before and Yr3 After. The box contains the 25th to 75th percentile range and the whiskers show the 5th and 95th percentile values. The 75th percentile and 95th percentile journey times are annotated on the plots.

SMALR Monitoring M25 J23-27 SMALR Monitoring Third Year Report
Highways England M25 J23-27 SMALR Monitoring Third Year Report | Version 2.0 | 8 February 2018 30
Figure 3-5 Clockwise journey time reliability
Clockwise, the most unreliable journey times, Before and Yr3 After, are during the weekday PM peaks. Although the 95th percentile values of the weekday PM peaks worsened, the variability in journey time experienced by the majority of road users during these periods has improved (i.e. a reduced difference between the 25th and 75th percentile, the interquartile range). So journeys in the PM peaks are longer but more reliable; possibly due to the action of the variable mandatory speed limits.
Apart from Friday AM peak where reliability was unchanged, in all other weekday periods, the interquartile range has decreased very slightly, in the range of seven to 34 seconds.
Anticlockwise, the most unreliable journey time, Before and Yr1 After, is in the Monday-Thursday AM peak. This has experienced improvements in both the 95th percentile and the 75th percentile as well as the interquartile range. This shows better journey time reliability with the all lane running scheme.
In other (previously uncongested) periods, the interquartile range is similar between the Before, Yr1 After and Yr2 After periods, showing no change in day-to-day reliability.

SMALR Monitoring M25 J23-27 SMALR Monitoring Third Year Report
Highways England M25 J23-27 SMALR Monitoring Third Year Report | Version 2.0 | 8 February 2018 31
Figure 3-6 Anticlockwise journey time reliability
3.5. Summary Overall clockwise journey times are effectively unchanged since the Before period (increase of 3 seconds, 0.4%) in Yr3 After compared to Before. In the anticlockwise direction journey times have improved by 15 seconds (1.4%).
Journey time reliability clockwise remains similar between the Before and Yr3 After periods. However, there are some delayed journeys in weekday PM peaks. Anticlockwise there is a good improvement on the Monday to Thursday AM peak, while times of day remain similar to before the scheme.
These results show that increases in capacity have been achieved, moving more goods, people and services, while maintaining journey times at pre-scheme levels and slightly improving reliability.

SMALR Monitoring M25 J23-27 SMALR Monitoring Third Year Report
Highways England M25 J23-27 SMALR Monitoring Third Year Report | Version 2.0 | 8 February 2018 32
4. Safety
4.1. Introduction This section compares the Before and After safety performance of the M25 J23 to J27 SMALR scheme. STATS19 data has been used to identify the number and rate of personal injury collisions and it should be noted that the After period is three years for J23 to J25 and 30 months for J25 to J27. The minimum desirable sample period for collision analysis is three years, due to the fact that motorways are the safest roads with relatively few collisions occurring compared to the total vehicle mileage travelled.
STATS19 collates all injury collision data in a consistent manner each year and is a generally reliable source for numbers of injury collisions. Damage-only collisions are not recorded in STATS19 so it is not a record of all collisions. Recording collision details relies on police input at the collision scene, therefore there is some scope for inconsistencies when the information is recorded.
Further analysis includes the user groups involved based on the STATS19 data and the compliance with Red X lane closure signals.
Note that the methodology for flow calculations between J25 and J27 for the Yr2 After period has been updated due to better information becoming available during the Yr3 After flow analysis. This means the rates calculated for Yr2 After differ slightly from previous reports issued; the impact is a 0.5% reduction in total vehicle kilometres travelled.
4.1.1. Changes in STATS19 reporting of collisions The recent release of 2016 STATS19 data by DfT5 has highlighted that there has been a national trend of increasing Killed and Seriously Injured (KSI) incidents across all the roads in England, including the strategic road network, which is counter to the historic trend of increasing safety. This increase affects 3 lane motorways with continuous hard shoulders as well as smart motorways, including all lane running.
A contributing factor for this increase is the change in the way incidents are automatically classified using the CRASH database. CRASH has been implemented during the After period of our evaluation. Since this change, it has become noticeable that there are subtle differences in the way the data is recorded that have made comparisons between the two datasets more challenging. Previously Police forces would have determined if somebody’s injuries were slight / serious / fatal. The exact injury is now recorded by Police but categorised by the CRASH system. This has resulted in reported increases in the severity of collisions, known as ‘the CRASH effect’.
The CRASH effect, the increase in the proportion of non-fatal casualties recorded as serious, occurs due to the CRASH system deciding severity based on injury instead of the Officer in Charge (OIC) deciding severity. There are rules within the system that auto-fill some of the data, such as severity, based on other inputs. The recorded severity appears to have worsened in some cases as a result. This means the two data sets cannot be compared like-for-like, so it is likely that the severity improvements reported in this chapter would have been greater under the previous recording system.
4.2. Number and rate of collisions Table 4-1 shows the number of collisions during the Before and After periods, and the rate of collisions. Numbers of collisions cannot be directly compared due to the staged opening in Yr1 After but it can be seen that the annual numbers for other years are relatively similar; with the higher After flow this has resulted in a reduction in collision rate. To fully understand the results we also need to take into account the background trend in collisions, see Section 4.2.1.
5 https://www.gov.uk/government/uploads/system/uploads/attachment_data/file/648081/rrcgb2016-01.pdf

SMALR Monitoring M25 J23-27 SMALR Monitoring Third Year Report
Highways England M25 J23-27 SMALR Monitoring Third Year Report | Version 2.0 | 8 February 2018 33
Table 4-1 Number of collisions by severity and collision rates
Period Fatal Serious Fatal & serious
Slight Total
Before
Year 1 1 11 12 85 97
Year 2 2 11 13 88 101
Year 3 1 5 6 87 93
Total 4 27 31 260 291
Collision rate (collisions per hmvm) (22.6 hmvm) 0.177 1.194 1.371 11.500 12.871
Collision rate (collisions per mvkm) (3,641 mvkm) 0.001 0.007 0.009 0.071 0.080
After*
Year 1 2 3 5 55 60
Year 2 1 9 10 93 103
Year 3 0 11 11 81 92
Total 3 23 26 229 255
Collision rate (collisions per hmvm) (22.7 hmvm) 0.132 1.013 1.145 10.089 11.234
Collision rate (collisions per mvkm) (3,653 mvkm) 0.001 0.006 0.007 0.063 0.070
*Due to staged opening this is based on 36 months of data for J23 to J25 and 30 months of data for J25 to J27. Total values cannot be compared between Before and After periods, but rates can be compared.
The four fatal collisions in the Before period include:
• A car transporter losing control for unknown reasons and striking street lighting;
• A motorcyclist weaving through traffic and colliding with a vehicle;
• A vehicle drifting across lanes and losing control; and
• A suspected suicide where a pedestrian ran out into the carriageway.
There were three fatal collisions in the After period, as follows:
• A stowaway incident where a pedestrian climbed out from underneath a vehicle and was run over;
• A suspected suicide attempt where a car pulled out from the nearside verge (actually a very short length of hard shoulder) into the path of an HGV in lane 1 causing the HGV to swerve and collide with another HGV causing a crossover and ultimately the fatality of an HGV occupant on the opposite carriageway; and
• A slow moving / stationary vehicle in lane 1 was struck by another vehicle.
There were a total of 23 serious collisions in the After period (description not available for one of those), as follows:
• Seven nose to tail collisions: - A bus or coach braked and was hit from behind by an HGV; - An HGV collided with a van in front for unknown reasons; - Two cars were braking and the second vehicle was hit from behind by a third car which pushed the
second vehicle into the first vehicle; and - A car was hit from behind by an HGV which pushed it into a car in front. The front vehicle lost control,
striking the central reserve barrier and rebounded across the carriageway into the nearside barrier and off the motorway. A toddler in the middle vehicle was being carried on the lap of a pregnant passenger and suffered serious injuries;
- Three vehicles queueing on a slip road when a fourth vehicle collided with the back of the queue pushing the vehicles into one another;
- A car slowed down in traffic and was hit by the car following; - A car hit the car in front;
• Five collisions associated with lane changing and/or failing to look: - An HGV moved from lane 1 into lane 2, colliding with a van in lane 2; - A car moved from lane 3 into lane 2, colliding with a car in lane 2. The first car left the scene; and

SMALR Monitoring M25 J23-27 SMALR Monitoring Third Year Report
Highways England M25 J23-27 SMALR Monitoring Third Year Report | Version 2.0 | 8 February 2018 34
- A car moved from lane 1 of the slip road for the M11 Northbound into lane 2 for the M11 Southbound. A motorbike already in lane 2 could not stop and hit the rear of the car, unseating the rider;
- A car travelling at excessive speed attempted to undertake a vehicle which was changing lanes to the left. The car changing lanes was struck, overturning and hitting a third car;
- A goods vehicle was travelling in lane 1 and a car in lane 2, as the goods vehicle moved into lane 2 hit the car making it to spin into the central reservation, bounce off and spin back across the carriageway coming to rest sideways across lane 1 and the verge.
• Seven single vehicle collisions: - A driver who had fallen asleep woke as their car was about to collide with an HGV, panicked and lost
control, striking the nearside and then offside tunnel walls; - A vehicle left the motorway to the offside for unknown reasons, struck the central reserve barrier and
caught fire; - A vehicle left the motorway to the nearside, struck the tunnel wall and came to rest in the hard
shoulder; - An HGV lost control and turned onto its side.; - A car driver felt pain in the left shoulder veered to the offside colliding with central barrier and
overturned - A car was travelling in torrential rain, the driver lost control due to the excessive water and struck the
nearside and offside barriers; - A car took the exit at J27 towards M11, the car then swerved back onto the M25 across the
chevroned area, at that point it suffered a front-off-side tyre blow out which caused the vehicle to cross all lanes and hit the concrete central barrier coming to a stop in lane 4.
• One other collision where a car entered a slip road which was closed for recovery work and collided with a road worker. The car failed to stop at the scene.
• Due to driver’s fatigue, a car travelling in lane 4 veered right into the concrete crash barrier and then left into lane 3 colliding with another car. The other car then swerved across into lane 4 also colliding with the concrete crash barrier.
• Due to driver’s suspected bleed on the brain a car stopped in lane 3 of the 4, another car was presented with the stationery vehicle in lane 3 during rush hour traffic and could not avoid a collision.
It can be seen that these serious collisions could have occurred on any stretch of motorway so are not attributable to ALR.
The relevant stakeholder Transport for London was not able to provide contributory factor data and accident descriptions for 13 of the 92 collisions in Yr3, one of these was of serious severity. Contributory factors by severity for the collisions are shown in Appendix C.2.
4.2.1. Background trend in collisions There is a trend over time leading to a reduction in the number of personal injury collisions against a trend of increasing traffic volumes. The reasons for the reduction are wide ranging and include improved safety measures in vehicles and on the road. This trend needs to be accounted for when comparing the Before and After periods.
The best way to take into account the national trend is to assume that, if the scheme had not been built, the number of collisions on the roads in the study area would have dropped at the same rate as they did nationally during the same time period. This provides what is known as a counterfactual ‘without scheme’ scenario and can be compared on a like-for-like basis with the observed After data which is the ‘with scheme’ scenario6. The difference between the numbers of collisions in these two scenarios can then be attributed to the scheme rather than the wider national trends.
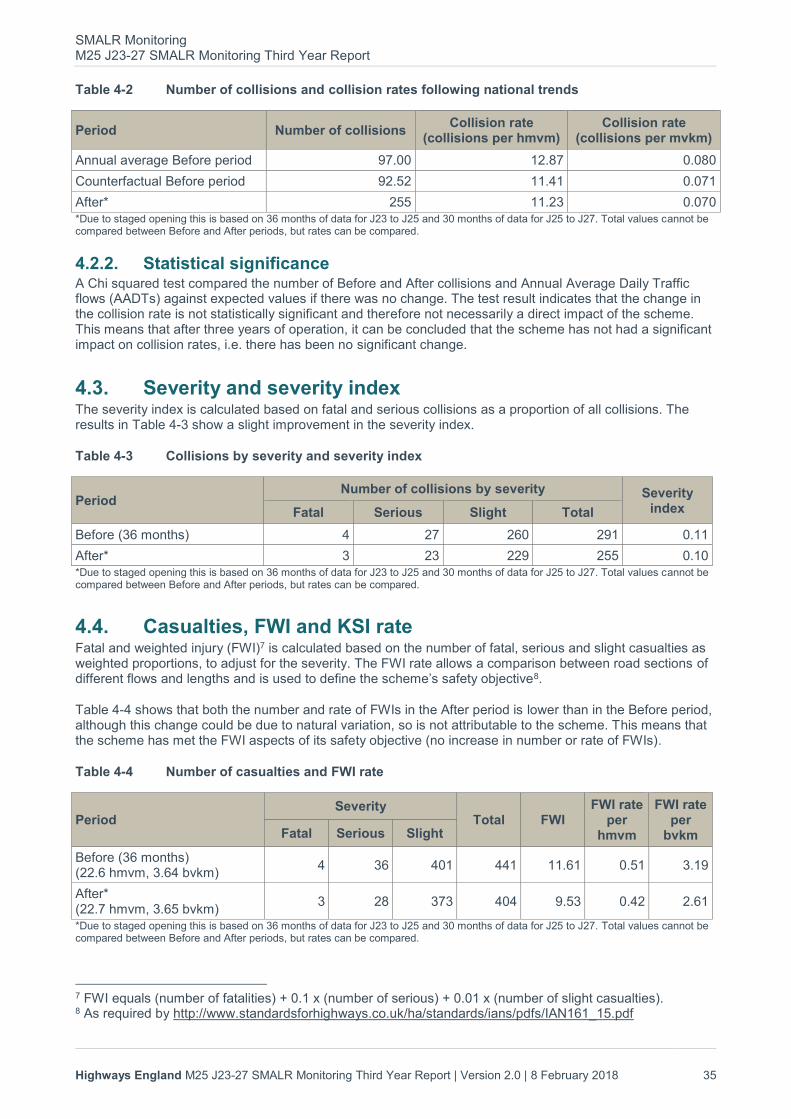
Table 4-2 shows that there has been a small decrease in the collision rate over and above the background reduction in collisions (compared to the 13% absolute reduction in Table 4-1).
6 The counterfactual factor is calculated using the national collision data for motorway class roads in the middle year of the After period (2015) and for the middle year in the Before period (2011). The calculated factor between these years is 0.95 for the number of collisions and 0.89 for the collision rate.
SMALR Monitoring M25 J23-27 SMALR Monitoring Third Year Report
Highways England M25 J23-27 SMALR Monitoring Third Year Report | Version 2.0 | 8 February 2018 35
Table 4-2 Number of collisions and collision rates following national trends
Period Number of collisions Collision rate
(collisions per hmvm) Collision rate
(collisions per mvkm)
Annual average Before period 97.00 12.87 0.080
Counterfactual Before period 92.52 11.41 0.071
After* 255 11.23 0.070
*Due to staged opening this is based on 36 months of data for J23 to J25 and 30 months of data for J25 to J27. Total values cannot be compared between Before and After periods, but rates can be compared.
4.2.2. Statistical significance A Chi squared test compared the number of Before and After collisions and Annual Average Daily Traffic flows (AADTs) against expected values if there was no change. The test result indicates that the change in the collision rate is not statistically significant and therefore not necessarily a direct impact of the scheme. This means that after three years of operation, it can be concluded that the scheme has not had a significant impact on collision rates, i.e. there has been no significant change.
4.3. Severity and severity index The severity index is calculated based on fatal and serious collisions as a proportion of all collisions. The results in Table 4-3 show a slight improvement in the severity index.
Table 4-3 Collisions by severity and severity index
Period Number of collisions by severity Severity
index Fatal Serious Slight Total
Before (36 months) 4 27 260 291 0.11
After* 3 23 229 255 0.10
*Due to staged opening this is based on 36 months of data for J23 to J25 and 30 months of data for J25 to J27. Total values cannot be compared between Before and After periods, but rates can be compared.
4.4. Casualties, FWI and KSI rate Fatal and weighted injury (FWI)7 is calculated based on the number of fatal, serious and slight casualties as weighted proportions, to adjust for the severity. The FWI rate allows a comparison between road sections of different flows and lengths and is used to define the scheme’s safety objective8.
Table 4-4 shows that both the number and rate of FWIs in the After period is lower than in the Before period, although this change could be due to natural variation, so is not attributable to the scheme. This means that the scheme has met the FWI aspects of its safety objective (no increase in number or rate of FWIs).
Table 4-4 Number of casualties and FWI rate
Period Severity
Total FWI FWI rate
per hmvm
FWI rate per
bvkm Fatal Serious Slight
Before (36 months) (22.6 hmvm, 3.64 bvkm)
4 36 401 441 11.61 0.51 3.19
After* (22.7 hmvm, 3.65 bvkm)
3 28 373 404 9.53 0.42 2.61
*Due to staged opening this is based on 36 months of data for J23 to J25 and 30 months of data for J25 to J27. Total values cannot be compared between Before and After periods, but rates can be compared.
7 FWI equals (number of fatalities) + 0.1 x (number of serious) + 0.01 x (number of slight casualties). 8 As required by http://www.standardsforhighways.co.uk/ha/standards/ians/pdfs/IAN161_15.pdf

SMALR Monitoring M25 J23-27 SMALR Monitoring Third Year Report
Highways England M25 J23-27 SMALR Monitoring Third Year Report | Version 2.0 | 8 February 2018 36
There has been a reduction in the KSI rate, shown in Table 4-5, which is due to the lower number of fatalities and serious casualties in the After period. The improvement could be a result of natural variation, so is not directly attributable to the scheme.
Table 4-5 Total KSI and KSI rate
Period Total KSI KSI rate per hmvm KSI rate per bvkm
Before (36 months) (22.6 hmvm, 3.64 bvkm)
40 1.77 10.99
After* (22.7 hmvm, 3.65 bvkm)
31 1.37 8.49
*Due to staged opening this is based on 36 months of data for J23 to J25 and 30 months of data for J25 to J27. Total values cannot be compared between Before and After periods, but rates can be compared.
4.5. User groups The number of casualties from different user groups are shown in Appendix C.2. The sample sizes of casualties are too small to draw any conclusions in the changes between periods for each user group. Based on the data in the analysis, no user group has been adversely affected by the scheme, which meets this aspect of the safety objective. The two pedestrian casualties in the Before period are suspected suicides (one fatal, one serious). There were also two pedestrian casualties in the After period, including a stowaway incident resulting in a fatality and a serious collision involving a vehicle colliding with a pedestrian trying to stop traffic on a slip road.
4.6. Red X (lane closed) analysis An analysis of Red X compliance was undertaken using HALOGEN data for Sign and Signal settings and MIDAS TCD files for minutely flows per lane. The two data sets were combined to identify lane closures and flows along the lane during the restriction. An example of a Red X event is presented in Figure 4-1.
A total of 119 lane closures have been assessed in the Yr3 After period and the results are summarised in Appendix 0. The per-lane minutely flow is provided to give an indication of how busy the motorway was; a flow of 30 vehicles per minute per lane is a high flow (one vehicle every 2 seconds).
Non-compliance in this sample ranges from 1 to 15 vehicles per minute, 0% to 20% of total flow; across all Red X events analysed the minutely average flow of non-compliant vehicles was 4 per minute. Compliance with Red X as a percentage of total flow was 94%, which appears to show a slight worsening, from the 96% in the Yr2 After period, but still a slight improvement from the 93% in the Yr1 After period.
The percentage non-compliance was compared to the incident duration and traffic flow; no correlation was found with either. This suggests that the subset of drivers who choose not to comply with Red Xs do so regardless of how busy the motorway is or how long the incident duration is.

SMALR Monitoring M25 J23-27 SMALR Monitoring Third Year Report
Highways England M25 J23-27 SMALR Monitoring Third Year Report | Version 2.0 | 8 February 2018 37
Figure 4-1 Example lane closure event
Key:
4.7. Summary Against a background of increasing flows, the scheme has met its safety objective:
• no increase in number or rate of FWIs;
• based on the data in the analysis, no user group has been adversely affected.
There has been no change in collision rate after taking account the national background trend of improvement.
Severity index, FWI and KSI rates have improved, although these changes are not directly attributable to the scheme, as they could have occurred as a result of natural variation.
Monitoring of Red X compliance revealed that across all events analysed, an average of 94% of vehicles complied with Red Xs in the Yr3 After period.

SMALR Monitoring M25 J23-27 SMALR Monitoring Third Year Report
Highways England M25 J23-27 SMALR Monitoring Third Year Report | Version 2.0 | 8 February 2018 38
5. Conclusions
5.1. Flow The SMALR section has experienced traffic growth of 16% between the Before and Yr3 After periods, which is far higher than regional motorway growth over the same period. The largest growth has been at weekends, up to 23%, while other days have seen increases between 6% and 19%.
5.2. Journey time Overall clockwise journey times are effectively unchanged since the Before period (increase of 3 seconds, 0.4%) in Yr3 After compared to Before. In the anticlockwise direction journey times have improved by 15 seconds (1.4%).
Journey time reliability clockwise remains similar between the Before and Yr3 After periods. However, there are some delayed journeys in weekday PM peaks. Anticlockwise there is a good improvement on the Monday to Thursday AM peak, while times of day remain similar to before the scheme.
These results show that increases in capacity have been achieved, moving more goods, people and services, while maintaining journey times at pre-scheme levels and slightly improving reliability.
5.3. Safety Against a background of increasing flows, the scheme has met its safety objective9:
• no increase in number or rate of FWIs;
• based on the data in the analysis, no user group has been adversely affected.
There has been no change in collision rate after taking account the national background trend of improvement.
Severity index, FWI and KSI rates have improved, although these changes are not directly attributable to the scheme, as they could have occurred as a result of natural variation.
Monitoring of Red X compliance revealed that across all events analysed, an average of 94% of vehicles complied with Red Xs in the Yr3 After period.
9 As required by http://www.standardsforhighways.co.uk/ha/standards/ians/pdfs/IAN161_15.pdf

Appendices
SMALR Monitoring M25 J23-27 SMALR Monitoring Third Year Report
Highways England M25 J23-27 SMALR Monitoring Third Year Report | Version 2.0 | 8 February 2018 40
Appendix A. Flows additional information
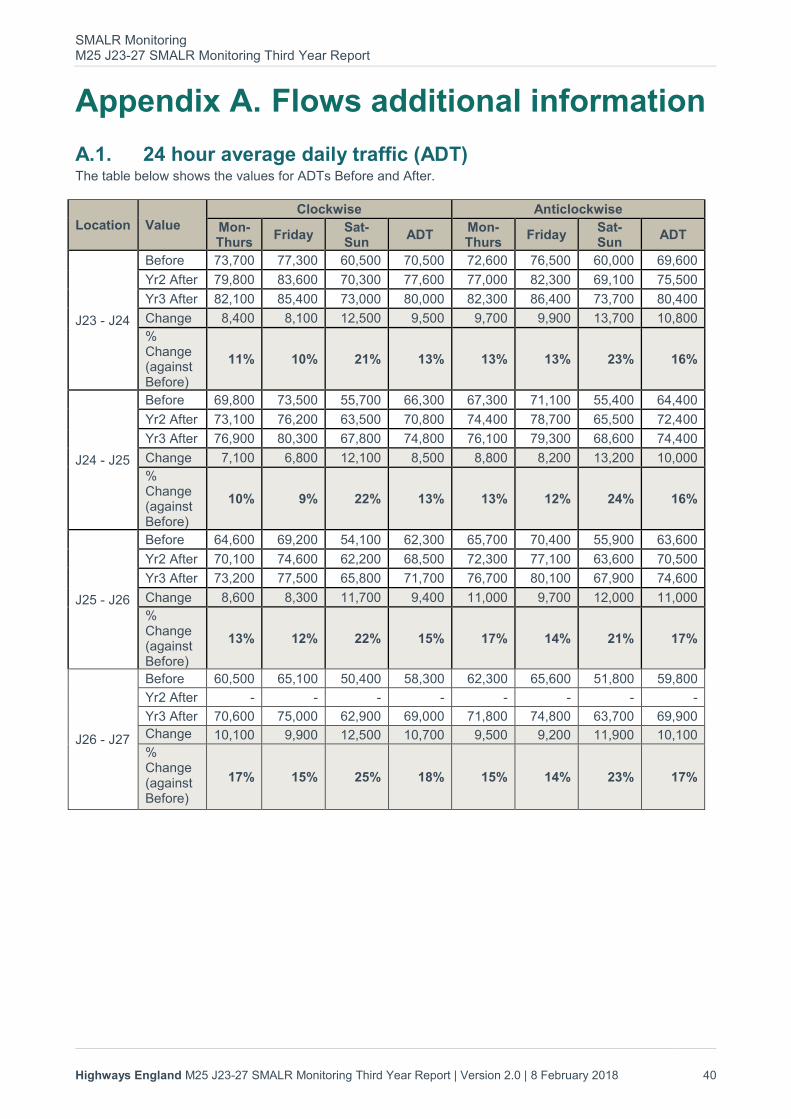
A.1. 24 hour average daily traffic (ADT) The table below shows the values for ADTs Before and After.
Location Value
Clockwise Anticlockwise
Mon-Thurs
Friday Sat-Sun
ADT Mon-Thurs
Friday Sat-Sun
ADT
J23 - J24
Before 73,700 77,300 60,500 70,500 72,600 76,500 60,000 69,600
Yr2 After 79,800 83,600 70,300 77,600 77,000 82,300 69,100 75,500
Yr3 After 82,100 85,400 73,000 80,000 82,300 86,400 73,700 80,400
Change 8,400 8,100 12,500 9,500 9,700 9,900 13,700 10,800
% Change (against Before)
11% 10% 21% 13% 13% 13% 23% 16%
J24 - J25
Before 69,800 73,500 55,700 66,300 67,300 71,100 55,400 64,400
Yr2 After 73,100 76,200 63,500 70,800 74,400 78,700 65,500 72,400
Yr3 After 76,900 80,300 67,800 74,800 76,100 79,300 68,600 74,400
Change 7,100 6,800 12,100 8,500 8,800 8,200 13,200 10,000
% Change (against Before)
10% 9% 22% 13% 13% 12% 24% 16%
J25 - J26
Before 64,600 69,200 54,100 62,300 65,700 70,400 55,900 63,600
Yr2 After 70,100 74,600 62,200 68,500 72,300 77,100 63,600 70,500
Yr3 After 73,200 77,500 65,800 71,700 76,700 80,100 67,900 74,600
Change 8,600 8,300 11,700 9,400 11,000 9,700 12,000 11,000
% Change (against Before)
13% 12% 22% 15% 17% 14% 21% 17%
J26 - J27
Before 60,500 65,100 50,400 58,300 62,300 65,600 51,800 59,800
Yr2 After - - - - - - - -
Yr3 After 70,600 75,000 62,900 69,000 71,800 74,800 63,700 69,900
Change 10,100 9,900 12,500 10,700 9,500 9,200 11,900 10,100
% Change (against Before)
17% 15% 25% 18% 15% 14% 23% 17%

SMALR Monitoring M25 J23-27 SMALR Monitoring Third Year Report
Highways England M25 J23-27 SMALR Monitoring Third Year Report | Version 2.0 | 8 February 2018 41
A.2. Flows by time slice The table below shows the flows for each time slice in the clockwise direction.
Clockwise flows by time slice
Location Value
Mon-Thurs Friday Saturday-Sunday AM
Peak Inter-peak
PM Peak
AM Peak
Inter-peak
PM Peak
J23 - J24
Before 20,700 18,700 24,200 14,100 16,400 34,700 46,000
Yr2 After 21,700 20,000 26,100 15,500 17,400 36,900 53,000
Yr3 After 22,400 20,900 26,400 15,500 17,800 37,600 54,800
Change 1,700 2,200 2,200 1,400 1,400 2,900 8,800
% Change 8% 12% 9% 10% 9% 8% 19%
J24 - J25
Before 19,000 17,700 23,300 13,000 15,500 33,500 42,000
Yr2 After 19,300 18,400 24,000 13,700 15,600 33,700 47,500
Yr3 After 20,200 19,600 25,200 14,000 16,600 36,000 50,600
Change 1,200 1,900 1,900 1,000 1,100 2,500 8,600
% Change 6% 11% 8% 8% 7% 7% 20%
J25 - J26
Before 17,200 16,500 21,900 11,800 14,600 32,000 41,200
Yr2 After 17,800 17,600 23,900 12,800 14,700 34,200 46,800
Yr3 After 18,700 18,800 24,700 13,000 15,900 35,700 49,400
Change 1,500 2,300 2,800 1,200 1,300 3,700 8,200
% Change 9% 14% 13% 10% 9% 12% 20%
J26 - J27
Before 16,100 15,400 20,400 11,100 13,800 30,100 38,400
Yr2 After - - - - - - -
Yr3 After 18,100 18,100 23,600 12,600 15,500 34,300 47,100
Change 2,000 2,700 3,200 1,500 1,700 4,200 8,700
% Change 12% 18% 16% 14% 12% 14% 23%
The table below shows the flows for each time slice in the anticlockwise direction.
Anticlockwise flows by time slice
Location Value
Mon-Thurs Friday Saturday-Sunday AM
Peak Inter-peak
PM Peak
AM Peak
Inter-peak
PM Peak
J23 - J24
Before 23,200 18,400 21,300 16,100 18,200 31,900 45,700
Yr2 After 24,000 19,500 22,300 17,900 19,400 33,300 52,400
Yr3 After 25,700 21,300 23,100 18,700 20,700 34,200 55,200
Change 2,500 2,900 1,800 2,600 2,500 2,300 9,500
% Change 11% 16% 8% 16% 14% 7% 21%
J24 - J25
Before 21,800 17,000 19,300 15,700 17,000 29,100 41,900
Yr2 After 24,600 18,900 20,300 18,400 18,900 30,500 49,500
Yr3 After 25,100 19,400 20,500 18,200 19,000 30,700 51,300
Change 3,300 2,400 1,200 2,500 2,000 1,600 9,400
% Change 15% 14% 6% 16% 12% 5% 22%

SMALR Monitoring M25 J23-27 SMALR Monitoring Third Year Report
Highways England M25 J23-27 SMALR Monitoring Third Year Report | Version 2.0 | 8 February 2018 42
J25 - J26
Before 21,400 16,200 19,000 15,400 16,400 29,000 42,300
Yr2 After 24,100 17,800 20,500 17,800 17,900 31,000 48,300
Yr3 After 25,300 19,000 21,400 18,200 18,600 32,100 51,100
Change 3,900 2,800 2,400 2,800 2,200 3,100 8,800
% Change 18% 17% 13% 18% 13% 11% 21%
J26 - J27
Before 20,300 15,400 18,000 14,400 15,200 27,200 39,300
Yr2 After - - - - - - -
Yr3 After 23,600 17,600 20,000 17,100 17,400 29,900 47,900
Change 3,300 2,200 2,000 2,700 2,200 2,700 8,600
% Change 16% 14% 11% 19% 14% 10% 22%

SMALR Monitoring M25 J23-27 SMALR Monitoring Third Year Report
Highways England M25 J23-27 SMALR Monitoring Third Year Report | Version 2.0 | 8 February 2018 43
Appendix B. Journey times additional information
B.1. Days in sample The table below shows the date ranges and number of days used in the data set for the analysis:
Period Clockwise Anticlockwise
Before
From 1 Feb 12 1 Feb 12
To 31 Jan 13 31 Jan 13
Days removed 0 0
Days in sample 365 365
Yr2 After
From 1 May 15 1 May 15
To 30 Apr 16 30 Apr 16
Days removed 0 0
Days in sample 365 365
Yr3 After
From 1 May 16 1 May 16
To 30 Apr 17 30 Apr 17
Days removed 0 0
Days in sample 365 365
B.2. Journey time
B.2.1. Average journey time The tables below show the results.
Clockwise Journey Time Comparison
Section Distance (miles)
M-T AM M-T IP M-T PM F AM F IP F PM SS
Period average
% change
Before
J23 to J24 2.5 00:02:37 00:02:27 00:03:15 00:02:31 00:02:24 00:03:27 00:02:22
J24 to J25 5.6 00:05:19 00:05:14 00:05:44 00:05:18 00:05:10 00:05:59 00:04:59
J25 to J26 3.6 00:03:28 00:03:29 00:03:47 00:03:29 00:03:30 00:04:01 00:03:20
J26 to J27 4.3 00:04:03 00:04:06 00:04:11 00:04:07 00:04:08 00:04:13 00:03:52
Total 16.0 00:15:26 00:15:17 00:16:57 00:15:24 00:15:13 00:17:40 00:14:32
Yr2 After
J23 to J24 2.5 00:02:30 00:02:29 00:02:58 00:02:26 00:02:24 00:03:09 00:02:20 -4%
J24 to J25 5.6 00:05:28 00:05:28 00:06:48 00:05:20 00:05:17 00:06:59 00:05:06 7%
J25 to J26 3.6 00:03:30 00:03:33 00:03:56 00:03:29 00:03:30 00:03:58 00:03:21 1%
J26 to J27 4.3 00:04:06 00:04:13 00:04:32 00:04:09 00:04:08 00:04:31 00:03:53 3%
Total 16.0 00:15:33 00:15:42 00:18:14 00:15:24 00:15:19 00:18:36 00:14:40 3%
Yr3 After
J23 to J24 2.5 00:02:26 00:02:27 00:03:04 00:02:23 00:02:21 00:03:02 00:02:18 -5%
J24 to J25 5.6 00:05:13 00:05:22 00:06:45 00:05:13 00:05:11 00:06:37 00:05:02 4%
J25 to J26 3.6 00:03:24 00:03:30 00:03:51 00:03:24 00:03:26 00:03:44 00:03:19 -2%
J26 to J27 4.3 00:04:00 00:04:05 00:04:27 00:04:02 00:03:59 00:04:24 00:03:51 1%
Total 16.0 00:15:03 00:15:24 00:18:07 00:15:03 00:14:58 00:17:47 00:14:29 0%
% Change -2% 1% 7% -2% -2% 1% 0% -2%

SMALR Monitoring M25 J23-27 SMALR Monitoring Third Year Report
Highways England M25 J23-27 SMALR Monitoring Third Year Report | Version 2.0 | 8 February 2018 44
Anticlockwise journey time comparison
Section Distance (miles)
M-T AM M-T IP M-T PM F AM F IP F PM SS Period
average % change
Before
J27 to J26 4.3 00:05:37 00:04:03 00:04:09 00:04:21 00:04:12 00:04:06 00:03:54
J26 to J25 3.6 00:05:13 00:03:27 00:03:30 00:03:52 00:03:49 00:03:32 00:03:23
J25 to J24 5.6 00:06:47 00:05:25 00:05:39 00:06:07 00:05:47 00:05:40 00:05:20
J24 to J23 2.5 00:02:48 00:02:31 00:02:37 00:02:42 00:02:38 00:02:36 00:02:28
Total 16.1 00:20:25 00:15:27 00:15:55 00:17:02 00:16:27 00:15:55 00:15:05
Yr2 After
J27 to J26 4.3 00:05:00 00:04:15 00:04:10 00:04:21 00:04:15 00:04:09 00:03:56 -1%
J26 to J25 3.6 00:04:45 00:03:40 00:03:39 00:03:49 00:03:45 00:03:43 00:03:22 0%
J25 to J24 5.6 00:06:24 00:05:39 00:05:40 00:05:53 00:05:36 00:05:40 00:05:18 -1%
J24 to J23 2.5 00:03:14 00:02:30 00:02:32 00:02:55 00:02:34 00:02:35 00:02:21 2%
Total 16.1 00:19:24 00:16:06 00:16:00 00:16:58 00:16:11 00:16:08 00:14:57 -0.5%
Yr3 After
J27 to J26 4.3 00:04:53 00:04:08 00:04:09 00:04:23 00:04:16 00:04:03 00:03:54 -2%
J26 to J25 3.6 00:04:29 00:03:33 00:03:34 00:04:04 00:03:45 00:03:35 00:03:20 -2%
J25 to J24 5.6 00:06:27 00:05:33 00:05:34 00:05:47 00:05:41 00:05:37 00:05:16 -2%
J24 to J23 2.5 00:03:20 00:02:30 00:02:32 00:02:52 00:02:32 00:02:29 00:02:18 1%
Total 16.1 00:19:09 00:15:44 00:15:50 00:17:06 00:16:15 00:15:45 00:14:48 -1%
% Change -6% 2% -1% 0% -1% -1% -2% -6%

SMALR Monitoring M25 J23-27 SMALR Monitoring Third Year Report
Highways England M25 J23-27 SMALR Monitoring Third Year Report | Version 2.0 | 8 February 2018 45
B.2.2. Speed (kph) over distance
Clockwise speed (kph) over distance plot
Clockwise speed vs distance profiles
Mond
ay –
Th
urs
day
AM
IP
PM
Friday
AM
IP
PM
Satu
rday &
Su
nday
Day

SMALR Monitoring M25 J23-27 SMALR Monitoring Third Year Report
Highways England M25 J23-27 SMALR Monitoring Third Year Report | Version 2.0 | 8 February 2018 46
Anticlockwise speed (kph) over distance plot
Anticlockwise speed vs distance profiles
Mond
ay –
Th
urs
day
AM
IP
PM
Friday
AM
IP
PM
Satu
rday &
Su
nday
Day

SMALR Monitoring M25 J23-27 SMALR Monitoring Third Year Report
Highways England M25 J23-27 SMALR Monitoring Third Year Report | Version 2.0 | 8 February 2018 47
Appendix C. Safety
C.1. Injury collisions by user group
User Group
Before (36 months data)
After (36 months data)
Number % of total casualties (441)
Number % of total casualties (404)
Pedestrians 2 0.5% 2 0.5%
Motorcyclists 16 3.6% 3 0.7%
Car occupants 363 82.3% 323 80.0%
Taxi / Private hire vehicles occupants 5 1.1% 7 1.7%
Van occupants 29 6.6% 21 5.2%
HGV occupants 25 5.7% 22 5.4%
Public service vehicles 0 0.0% 0 0.0%
Road worker - On road resources (ORR) 0 0.0% 0 0.0%
Road worker - Maintenance workers 0 0.0% 0 0.0%
Emergency services 0 0.0% 0 0.0%
Private recovery organisations 0 0.0% 0 0.0%
Minibus (8-16 passenger seats) 0 0.0% 1 0.2%
Bus or Coach (17 or more passenger seats) 0 0.0% 5 1.2%
Other (type of vehicle not specified in STATS19 data) 1 0.2% 0 0.0%
Disabled drivers or passengers 4 0.9% 5 1.2%
Not classified 0 0.0% 20 5.0%

SMALR Monitoring M25 J23-27 SMALR Monitoring Third Year Report
Highways England M25 J23-27 SMALR Monitoring Third Year Report | Version 2.0 | 8 February 2018 48
C.2. Contributory factors
Contributory factors by severity before period
Code Contributory factor group Fatal Serious Slight Total
101-109 Road environment contributed 0 2 21 23
201-206 Vehicle defects 2 3 6 11
301-310 Injudicious action 0 7 123 130
401-410 Driver/rider error 8 41 374 423
501-510 Impairment or distraction 0 7 37 44
601-607 Behaviour or inexperience 1 5 67 73
701-710 Vision affected 0 3 35 38
801-810 Pedestrian involved 2 0 1 3
901-999 Special codes 0 1 8 9
Total 13 69 672 754
Rank
1 to 10
11 to 15
Code Contributory factors Fatal Serious Slight Total Rank
Road environment contributed 0 2 21 23
101 Poor or defective road surface 0 0 0 0
102 Deposit on road (e.g. oil, mud, chippings) 0 0 1 1 34
103 Slippery road (due to weather) 0 2 15 17 11
104 Inadequate or masked signs or road markings 0 0 0 0
105 Defective traffic signals 0 0 0 0
106 Traffic calming (e.g. speed cushions, road humps, chicanes)
0 0 0 0
107 Temporary road layout (e.g. contraflow) 0 0 0 0
108 Road layout (e.g. bend, hill, narrow carriageway) 0 0 3 3 24
109 Animal or object in carriageway 0 0 2 2 28
Vehicle defects 2 3 6 11
201 Tyres illegal, defective or under-inflated 0 1 2 3 24
202 Defective lights or indicators 0 0 0 0

SMALR Monitoring M25 J23-27 SMALR Monitoring Third Year Report
Highways England M25 J23-27 SMALR Monitoring Third Year Report | Version 2.0 | 8 February 2018 49
203 Defective brakes 1 0 1 2 28
204 Defective steering or suspension 1 0 1 2 28
205 Defective or missing mirrors 0 0 0 0
206 Overloaded or poorly loaded vehicle or trailer 0 2 2 4 21
Injudicious action 0 7 123 130
301 Disobeyed automatic traffic signal 0 0 0 0
302 Disobeyed 'Give Way' or 'Stop' sign or markings 0 0 0 0
303 Disobeyed double white lines 0 0 0 0
304 Disobeyed pedestrian crossing facility 0 0 0 0
305 Illegal turn or direction of travel 0 0 1 1 34
306 Exceeding speed limit 0 0 6 6 16
307 Travelling too fast for conditions 0 5 44 49 7
308 Following too close 0 2 72 74 3
309 Vehicle travelling along pavement 0 0 0 0
310 Cyclist entering road from pavement 0 0 0 0
Driver/rider error 8 41 374 423
401 Junction overshoot 0 1 0 1 34
402 Junction restart (moving off at junction) 0 0 2 2 28
403 Poor turn or manoeuvre 2 4 37 43 8
404 Failed to signal or misleading signal 0 0 4 4 21
405 Failed to look properly 2 11 128 141 1
406 Failed to judge other person's path or speed 1 5 79 85 2
407 Passing too close to cyclist, horse rider or pedestrian
0 0 1 1 34
408 Sudden braking 1 5 57 63 4
409 Swerved 0 4 24 28 9
410 Loss of control 2 11 42 55 5
Impairment or distraction 0 7 37 44
501 Impaired by alcohol 0 3 10 13 12
502 Impaired by drugs (illicit or medicinal) 0 0 0 0
503 Fatigue 0 3 9 12 13
504 Uncorrected, defective eye sight 0 0 0 0
505 Illness or disability, mental or physical 0 0 4 4 21
506 Not displaying lights at night or in poor visibility 0 0 0 0
507 Cyclist wearing dark clothing at night 0 0 0 0
508 Driver using mobile phone 0 0 0 0
509 Distraction in vehicle 0 1 9 10 14
510 Distraction outside vehicle 0 0 5 5 20
Behaviour or inexperience 1 5 67 73
601 Aggressive driving 0 0 6 6 16
602 Careless, reckless or in a hurry 1 4 48 53 6
603 Nervous, uncertain or panic 0 0 3 3 24
604 Driving too slow for conditions or slow vehicle (e.g. tractor)
0 1 0 1 34
605 Learner or inexperienced driver / rider 0 0 7 7 15
606 Inexperience of driving to the left 0 0 3 3 24
607 Unfamiliar with model of the vehicle 0 0 0 0
Vision affected 0 3 35 38
701 Stationary or parked vehicle(s) 0 0 0 0
702 Vegetation 0 0 0 0
703 Road layout (e.g. bend, winding road, hill crest) 0 0 0 0
704 Buildings, road signs, street furniture 0 0 0 0
705 Dazzling headlights 0 0 1 1 34
SMALR Monitoring M25 J23-27 SMALR Monitoring Third Year Report
Highways England M25 J23-27 SMALR Monitoring Third Year Report | Version 2.0 | 8 February 2018 50
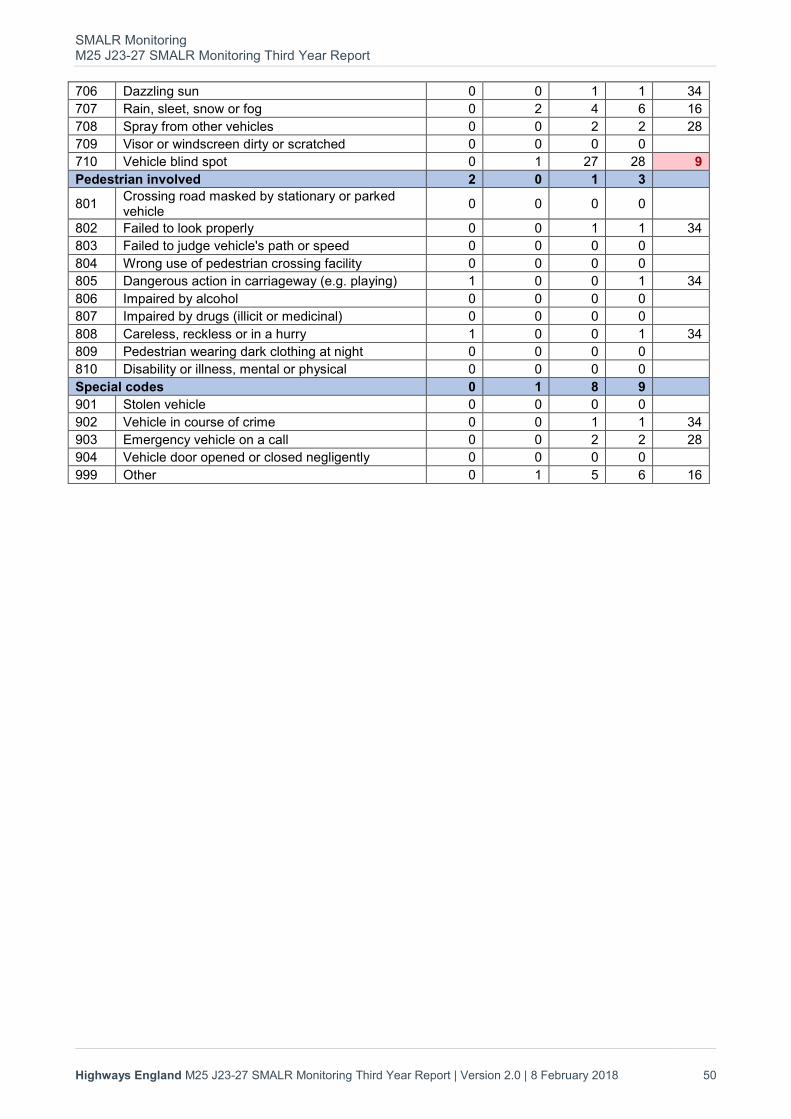
706 Dazzling sun 0 0 1 1 34
707 Rain, sleet, snow or fog 0 2 4 6 16
708 Spray from other vehicles 0 0 2 2 28
709 Visor or windscreen dirty or scratched 0 0 0 0
710 Vehicle blind spot 0 1 27 28 9
Pedestrian involved 2 0 1 3
801 Crossing road masked by stationary or parked vehicle
0 0 0 0
802 Failed to look properly 0 0 1 1 34
803 Failed to judge vehicle's path or speed 0 0 0 0
804 Wrong use of pedestrian crossing facility 0 0 0 0
805 Dangerous action in carriageway (e.g. playing) 1 0 0 1 34
806 Impaired by alcohol 0 0 0 0
807 Impaired by drugs (illicit or medicinal) 0 0 0 0
808 Careless, reckless or in a hurry 1 0 0 1 34
809 Pedestrian wearing dark clothing at night 0 0 0 0
810 Disability or illness, mental or physical 0 0 0 0
Special codes 0 1 8 9
901 Stolen vehicle 0 0 0 0
902 Vehicle in course of crime 0 0 1 1 34
903 Emergency vehicle on a call 0 0 2 2 28
904 Vehicle door opened or closed negligently 0 0 0 0
999 Other 0 1 5 6 16

SMALR Monitoring M25 J23-27 SMALR Monitoring Third Year Report
Highways England M25 J23-27 SMALR Monitoring Third Year Report | Version 2.0 | 8 February 2018 51
Contributory factors by severity after period
Code Contributory factor group Fatal Serious Slight Total
101-109 Road environment contributed 0 2 25 27
201-206 Vehicle defects 0 2 7 9
301-310 Injudicious action 0 4 56 60
401-410 Driver/rider error 2 18 292 312
501-510 Impairment or distraction 0 7 31 38
601-607 Behaviour or inexperience 1 6 73 80
701-710 Vision affected 0 3 29 32
801-810 Pedestrian involved 2 0 0 2
901-999 Special codes 0 0 11 11
Total 5 42 524 571

SMALR Monitoring M25 J23-27 SMALR Monitoring Third Year Report
Highways England M25 J23-27 SMALR Monitoring Third Year Report | Version 2.0 | 8 February 2018 52
Rank
1 to 10
11 to 15
Code Contributory factors Fatal Serious Slight Total Rank
Road environment contributed 0 2 25 27
101 Poor or defective road surface 0 0 1 1 29
102 Deposit on road (e.g. oil, mud, chippings) 0 0 2 2 26
103 Slippery road (due to weather) 0 2 17 19 9
104 Inadequate or masked signs or road markings 0 0 0 0
105 Defective traffic signals 0 0 1 1 29
106 Traffic calming (e.g. speed cushions, road humps, chicanes)
0 0 0 0
107 Temporary road layout (e.g. contraflow) 0 0 0 0
108 Road layout (e.g. bend, hill, narrow carriageway) 0 0 3 3 22
109 Animal or object in carriageway 0 0 1 1 29
Vehicle defects 0 2 7 9
201 Tyres illegal, defective or under-inflated 0 1 2 3 22
202 Defective lights or indicators 0 0 0 0
203 Defective brakes 0 0 1 1 29
204 Defective steering or suspension 0 1 3 4 20
205 Defective or missing mirrors 0 0 0 0
206 Overloaded or poorly loaded vehicle or trailer 0 0 1 1 29
Injudicious action 0 4 56 60
301 Disobeyed automatic traffic signal 0 0 0 0
302 Disobeyed 'Give Way' or 'Stop' sign or markings 0 0 0 0
303 Disobeyed double white lines 0 0 0 0
304 Disobeyed pedestrian crossing facility 0 0 0 0
305 Illegal turn or direction of travel 0 0 0 0
306 Exceeding speed limit 0 1 6 7 16
307 Travelling too fast for conditions 0 0 13 13 11
308 Following too close 0 3 37 40 4
309 Vehicle travelling along pavement 0 0 0 0
310 Cyclist entering road from pavement 0 0 0 0
Driver/rider error 2 18 292 312
401 Junction overshoot 0 1 0 1 29
402 Junction restart (moving off at junction) 0 0 0 0
403 Poor turn or manoeuvre 0 2 32 34 6
404 Failed to signal or misleading signal 0 0 3 3 22
405 Failed to look properly 1 9 98 108 1
406 Failed to judge other person's path or speed 1 3 73 77 2
407 Passing too close to cyclist, horse rider or pedestrian
0 0 0 0
408 Sudden braking 0 2 31 33 7
409 Swerved 0 0 19 19 9
410 Loss of control 0 1 36 37 5
Impairment or distraction 0 7 31 38
501 Impaired by alcohol 0 1 5 6 18
502 Impaired by drugs (illicit or medicinal) 0 0 0 0
503 Fatigue 0 2 5 7 16
504 Uncorrected, defective eye sight 0 0 0 0

SMALR Monitoring M25 J23-27 SMALR Monitoring Third Year Report
Highways England M25 J23-27 SMALR Monitoring Third Year Report | Version 2.0 | 8 February 2018 53
505 Illness or disability, mental or physical 0 3 9 12 12
506 Not displaying lights at night or in poor visibility 0 0 0 0
507 Cyclist wearing dark clothing at night 0 0 0 0
508 Driver using mobile phone 0 0 1 1 29
509 Distraction in vehicle 0 1 8 9 14
510 Distraction outside vehicle 0 0 3 3 22
Behaviour or inexperience 1 6 73 80
601 Aggressive driving 0 2 6 8 15
602 Careless, reckless or in a hurry 1 4 56 61 3
603 Nervous, uncertain or panic 0 0 4 4 20
604 Driving too slow for conditions or slow vehicle (e.g. tractor)
0 0 1 1 29
605 Learner or inexperienced driver / rider 0 0 5 5 19
606 Inexperience of driving to the left 0 0 0 0
607 Unfamiliar with model of the vehicle 0 0 1 1 29
Vision affected 0 3 29 32
701 Stationary or parked vehicle(s) 0 0 0 0
702 Vegetation 0 0 0 0
703 Road layout (e.g. bend, winding road, hill crest) 0 0 1 1 29
704 Buildings, road signs, street furniture 0 0 0 0
705 Dazzling headlights 0 0 0 0
706 Dazzling sun 0 0 1 1 29
707 Rain, sleet, snow or fog 0 1 1 2 26
708 Spray from other vehicles 0 0 2 2 26
709 Visor or windscreen dirty or scratched 0 0 0 0
710 Vehicle blind spot 0 2 24 26 8
Pedestrian involved 2 0 0 2
801 Crossing road masked by stationary or parked vehicle
0 0 0 0
802 Failed to look properly 0 0 0 0
803 Failed to judge vehicle's path or speed 0 0 0 0
804 Wrong use of pedestrian crossing facility 0 0 0 0
805 Dangerous action in carriageway (e.g. playing) 1 0 0 1 29
806 Impaired by alcohol 0 0 0 0
807 Impaired by drugs (illicit or medicinal) 0 0 0 0
808 Careless, reckless or in a hurry 1 0 0 1 29
809 Pedestrian wearing dark clothing at night 0 0 0 0
810 Disability or illness, mental or physical 0 0 0 0
Special codes 0 0 11 11
901 Stolen vehicle 0 0 0 0
902 Vehicle in course of crime 0 0 0 0
903 Emergency vehicle on a call 0 0 1 1 29
904 Vehicle door opened or closed negligently 0 0 0 0
999 Other 0 0 10 10 13

SMALR Monitoring M25 J23-27 SMALR Monitoring Third Year Report
Highways England M25 J23-27 SMALR Monitoring Third Year Report | Version 2.0 | 8 February 2018 54
C.3. Red X compliance Table C-1 Summary of Red X events
Duration (mins) Total number of non-compliant vehicles
Per-lane average minutely flow during lane closure
Average minutely flow of non-compliant vehicles
Percentage non-compliance
8 8 7 1 3%
27 310 16 11 17%
11 1 6 0 0%
16 161 19 10 14%
5 5 8 1 3%
96 10 14 10 18%
19 83 11 4 10%
86 14 18 14 19%
9 10 3 1 9%
25 2 2 0 1%
18 56 18 3 4%
15 22 16 1 2%
17 186 23 11 12%
15 15 16 1 2%
15 27 18 2 2%
5 3 10 1 2%
22 328 24 15 16%
5 4 15 1 1%
4 2 14 1 1%
20 7 7 0 1%
22 45 20 2 3%
8 0 8 0 0%
4 1 8 0 1%
31 9 17 0 0%
21 63 23 3 3%
3 6 4 2 12%
23 12 7 1 2%
16 7 19 0 1%
18 9 2 0 6%
1 1 14 1 1%
13 3 2 0 3%
10 6 15 1 1%
3 1 16 0 0%
23 19 7 1 3%
28 63 14 2 4%
11 20 12 2 4%
2 3 18 1 2%
14 63 15 4 7%

SMALR Monitoring M25 J23-27 SMALR Monitoring Third Year Report
Highways England M25 J23-27 SMALR Monitoring Third Year Report | Version 2.0 | 8 February 2018 55
Duration (mins) Total number of non-compliant vehicles
Per-lane average minutely flow during lane closure
Average minutely flow of non-compliant vehicles
Percentage non-compliance
31 2 9 0 0%
9 67 22 7 9%
11 18 12 2 3%
18 168 20 9 12%
11 40 16 4 6%
15 92 20 6 8%
15 6 14 0 1%
8 29 18 4 5%
1 13 22 12 14%
86 304 13 4 7%
11 46 21 4 5%
8 1 18 0 0%
6 11 9 2 5%
25 182 18 7 10%
9 3 8 0 1%
2 9 17 5 7%
17 200 24 12 12%
24 21 12 1 2%
108 657 13 6 11%
18 0 18 0 0%
3 4 21 1 1%
17 4 10 0 1%
14 2 11 0 0%
22 92 16 4 6%
17 45 13 3 5%
7 10 17 1 2%
8 23 22 3 3%
20 83 18 4 6%
22 1 13 0 0%
3 2 9 1 2%
31 187 17 6 9%
15 78 11 5 12%
10 60 17 6 9%
80 392 16 5 8%
25 86 7 3 12%
17 136 21 8 10%
19 141 13 7 14%
32 60 16 2 3%
2 5 12 2 5%
41 86 18 2 3%
16 48 13 3 6%

SMALR Monitoring M25 J23-27 SMALR Monitoring Third Year Report
Highways England M25 J23-27 SMALR Monitoring Third Year Report | Version 2.0 | 8 February 2018 56
Duration (mins) Total number of non-compliant vehicles
Per-lane average minutely flow during lane closure
Average minutely flow of non-compliant vehicles
Percentage non-compliance
13 45 19 3 5%
6 39 21 6 8%
4 9 11 2 5%
18 7 2 0 5%
42 66 17 2 2%
16 44 8 3 9%
3 28 20 9 12%
79 43 7 1 2%
2 14 14 7 13%
12 40 13 3 6%
14 38 14 3 5%
26 31 3 1 9%
2 6 12 3 7%
90 211 20 2 3%
16 72 19 4 6%
3 39 19 13 17%
52 110 17 2 3%
21 80 17 4 6%
12 176 18 15 20%
89 863 17 10 14%
19 79 15 4 7%
28 74 10 3 7%
10 8 8 1 2%
8 55 19 7 9%
5 23 17 5 7%
24 11 3 0 4%
77 274 15 4 6%
11 37 12 3 7%
6 2 1 0 7%
4 0 3 0 0%
18 82 16 5 7%
4 9 20 2 3%
24 119 16 5 8%
13 46 19 4 5%
11 23 16 2 3%
27 25 2 1 11%
3 9 21 3 4%
6 11 20 2 2%
5 34 18 7 9%
25 52 10 2 5%
Average: 20 Average: 67 Average: 14 Average: 4 Average: 6%