
Smart Meters as Part of a Sensor Network for Monitoring ...
6
Smart Meters as Part of a Sensor Network for Monitoring the Low Voltage Grid Alessio Dedé, Davide Della Giustina A2A Reti Elettriche SpA Via Lamarmora 230, 25124 Brescia, Italy Tel.: (+39) 030 3555301 [email protected] Stefano Rinaldi, Paolo Ferrari, Alessandra Flammini, Angelo Vezzoli Department of Information Engineering University of Brescia, Via Branze 38, 25123 Brescia, Italy. Tel: (+39) 030 3715445, Fax: (+39) 030 380014 [email protected] Abstract—Traditional low voltage grids are equipped with meters for the accounting of the energy consumed by customers. Recently, the use of electronic meters offers the possibility of the remote reading. This paper deals with smart sensing: a second- generation Smart Meters replacing traditional metering device, and the first generation of electronic meters, in order to extract a richer and near real-time information. This information in then transferred on a fast communication network where is needed. In other words, the Smart Meters deployed over the distribution grid create a Sensor Network used for grid control and management. The intelligent unit employed in the proposed system is able to communicate using standard metering protocols like DLMS/COSEM, allowing high-level integration with systems that use this information for both billing and customer relationship management – as is today with Automatic Meter Management systems – and for the technical management of the LV power infrastructure like Distribution Management Systems. The paper presents a pilot installation in a real grid of the smart sensor network composed about 50 new-generation Smart Meters using fast – broad-band – communication. The network of Smart Meters has been used to monitor, during a measurement campaign of two months, the Power Quality of a part of the distribution grid. During the campaign, the grid voltage is below the 5 % of the nominal value only for the 3 % of the time, despite the large presence of distributed renewable resources. Keywords—Smart Meter; Sensor Network; DLMS/COSEM; Distributed Measurement System; Distribution Grid Monitoring; Distributed Energy Resources; Broadband Power Line communication I. INTRODUCTION Traditionally, distribution automation systems is mainly focused on high voltage (HV) and medium voltage (MV) level; a wide range of sensors and sensor networks has been investigated in this field [1][3]. On the other hand, low voltage (LV) grid and secondary substations have very low level of automation intelligence, with few traditional sensors installed and, even less, sensors networks deployed. However, the LV electrical network is actually getting more and more importance because of the recent developments involving the power distribution. Among the most important development should be mentioned: the progressive diffusion of photovoltaic and other power generation systems, such as combined heat and power or micro wind turbines; the continuous increment of electrical/hybrid cars that requires recharge; and demand/response schemas for improving the power delivery [2]. Because of that, a clear trend involves more intelligence and automation at secondary substation level [4]. In some specific cases, the deployment of sensors is also extended to load management in local micro-grid [5] and electric vehicle [6]. As an example, consider that LV lines today are often equipped with LV breakers including a magneto-thermic protection to avoid the propagation of fault current to the MV/LV transformer. This system cannot be remotely operate, meaning that a field crew has to be dispatched in field every time there is maintenance on the LV line. In future, the trend will be to install more and more controllable breakers. Such example also hold for electric measurement devices. Driven by the concerns raised by distributed generation, some Distribution System Operators (DSOs) have already started the deployment of monitoring system to highlight Power Quality (PQ) issues for instance inverse power flow, voltage variations, and phase unbalances [7]. However, the main effort done in the last years in most of European countries was on the installation sole electronic meters. The Automatic Metering system, if already present today, have been usually conceived for billing and customers relation purpose [8][9] and not to perform distributed measurements analysis, technical management, or diagnosis of the LV grid [10]. The second generation of smart meters is characterized by the use of standard protocols like the DLMS/COSEM [11][12]. In addition, they include smart sensors, and provide near real-time measures (few minutes timescale). The progressive introduction of these smart meters opens the possibility to use the meters data not only for billing and customer relationship management, but also for the technical management of the LV distribution grid, e.g. for expanding the LV grid diagnosability and controllability [13]. For these reasons, the rest of the work will be focused on the creation of a smart sensor network aimed to achieve distribute sensing inside the metering system. After a brief overview of the technologies involved in a distributed monitoring system, the typical architecture of the today’s Automatic Meter Infrastructure (AMI) systems and its future evolution are described together with the structure of a typical SM with smart This research activity has been partially funded by the Italian Ministry for Education, University and Research (MIUR) under Smart cities and communities grant no. SCN00416 (“Brescia Smart Living - BSL”). 978-1-4799-6117-7/15/$31.00 ©2015 IEEE This full text paper was peer-reviewed at the direction of IEEE Instrumentation and Measurement Society prior to the acceptance and publication. Downloaded from http://iranpaper.ir http://translate68.ir
Transcript of Smart Meters as Part of a Sensor Network for Monitoring ...

Smart Meters as Part of a Sensor Network for Monitoring the Low Voltage Grid
Alessio Dedé, Davide Della Giustina A2A Reti Elettriche SpA
Via Lamarmora 230, 25124 Brescia, Italy Tel.: (+39) 030 3555301
Stefano Rinaldi, Paolo Ferrari, Alessandra Flammini, Angelo Vezzoli Department of Information Engineering
University of Brescia, Via Branze 38, 25123 Brescia, Italy. Tel: (+39) 030 3715445, Fax: (+39) 030 380014
Abstract—Traditional low voltage grids are equipped with meters for the accounting of the energy consumed by customers. Recently, the use of electronic meters offers the possibility of the remote reading. This paper deals with smart sensing: a second-generation Smart Meters replacing traditional metering device, and the first generation of electronic meters, in order to extract a richer and near real-time information. This information in then transferred on a fast communication network where is needed. In other words, the Smart Meters deployed over the distribution grid create a Sensor Network used for grid control and management. The intelligent unit employed in the proposed system is able to communicate using standard metering protocols like DLMS/COSEM, allowing high-level integration with systems that use this information for both billing and customer relationship management – as is today with Automatic Meter Management systems – and for the technical management of the LV power infrastructure like Distribution Management Systems. The paper presents a pilot installation in a real grid of the smart sensor network composed about 50 new-generation Smart Meters using fast – broad-band – communication. The network of Smart Meters has been used to monitor, during a measurement campaign of two months, the Power Quality of a part of the distribution grid. During the campaign, the grid voltage is below the 5 % of the nominal value only for the 3 % of the time, despite the large presence of distributed renewable resources.
Keywords—Smart Meter; Sensor Network; DLMS/COSEM; Distributed Measurement System; Distribution Grid Monitoring; Distributed Energy Resources; Broadband Power Line communication
I. INTRODUCTION
Traditionally, distribution automation systems is mainly focused on high voltage (HV) and medium voltage (MV) level; a wide range of sensors and sensor networks has been investigated in this field [1][3]. On the other hand, low voltage (LV) grid and secondary substations have very low level of automation intelligence, with few traditional sensors installed and, even less, sensors networks deployed. However, the LV electrical network is actually getting more and more importance because of the recent developments involving the power distribution. Among the most important development should be mentioned: the progressive diffusion of photovoltaic and other
power generation systems, such as combined heat and power or micro wind turbines; the continuous increment of electrical/hybrid cars that requires recharge; and demand/response schemas for improving the power delivery [2]. Because of that, a clear trend involves more intelligence and automation at secondary substation level [4]. In some specific cases, the deployment of sensors is also extended to load management in local micro-grid [5] and electric vehicle [6].
As an example, consider that LV lines today are often equipped with LV breakers including a magneto-thermic protection to avoid the propagation of fault current to the MV/LV transformer. This system cannot be remotely operate, meaning that a field crew has to be dispatched in field every time there is maintenance on the LV line. In future, the trend will be to install more and more controllable breakers. Such example also hold for electric measurement devices. Driven by the concerns raised by distributed generation, some Distribution System Operators (DSOs) have already started the deployment of monitoring system to highlight Power Quality (PQ) issues for instance inverse power flow, voltage variations, and phase unbalances [7].
However, the main effort done in the last years in most of European countries was on the installation sole electronic meters. The Automatic Metering system, if already present today, have been usually conceived for billing and customers relation purpose [8][9] and not to perform distributed measurements analysis, technical management, or diagnosis of the LV grid [10]. The second generation of smart meters is characterized by the use of standard protocols like the DLMS/COSEM [11][12]. In addition, they include smart sensors, and provide near real-time measures (few minutes timescale). The progressive introduction of these smart meters opens the possibility to use the meters data not only for billing and customer relationship management, but also for the technical management of the LV distribution grid, e.g. for expanding the LV grid diagnosability and controllability [13].
For these reasons, the rest of the work will be focused on the creation of a smart sensor network aimed to achieve distribute sensing inside the metering system. After a brief overview of the technologies involved in a distributed monitoring system, the typical architecture of the today’s Automatic Meter Infrastructure (AMI) systems and its future evolution are described together with the structure of a typical SM with smart
This research activity has been partially funded by the Italian Ministry forEducation, University and Research (MIUR) under Smart cities and communities grant no. SCN00416 (“Brescia Smart Living - BSL”).
978-1-4799-6117-7/15/$31.00 ©2015 IEEE
This full text paper was peer-reviewed at the direction of IEEE Instrumentation and Measurement Society prior to the acceptance and publication.
Downloaded from http://iranpaper.irhttp://translate68.ir
sensing. Then the description of a real application in a medium-size city located in the North of Italy is presented. Last, the measuring results over a long time are reported and discussed.
II. SMART METERS: STATE OF THE ART
The status of the SMs deployment is somehow heterogeneous in Europe [14][15] and in the rest of the world [16][17]. For example, in Finland government gave regulation that at least 80% of all customers had to be equipped with remote readable energy meters (capable of hourly consumption measurements) by the end of 2013. In Italy [18], electronic meters installation started in 2003 and became mandatory in 2006 – according to the resolution 292/06 of the Italian Authority for the Electrical Energy Gas and Water (AEEGSI) – even if they are still used mainly for fiscal and customers relation purposes, for example:
Activation/deactivation of contracts;
Contractual power variations in the power purchase agreement;
Power curtailment in case of nonpayment;
Meter monitoring to avoid/discover eventual sabotages (anti-tamper).
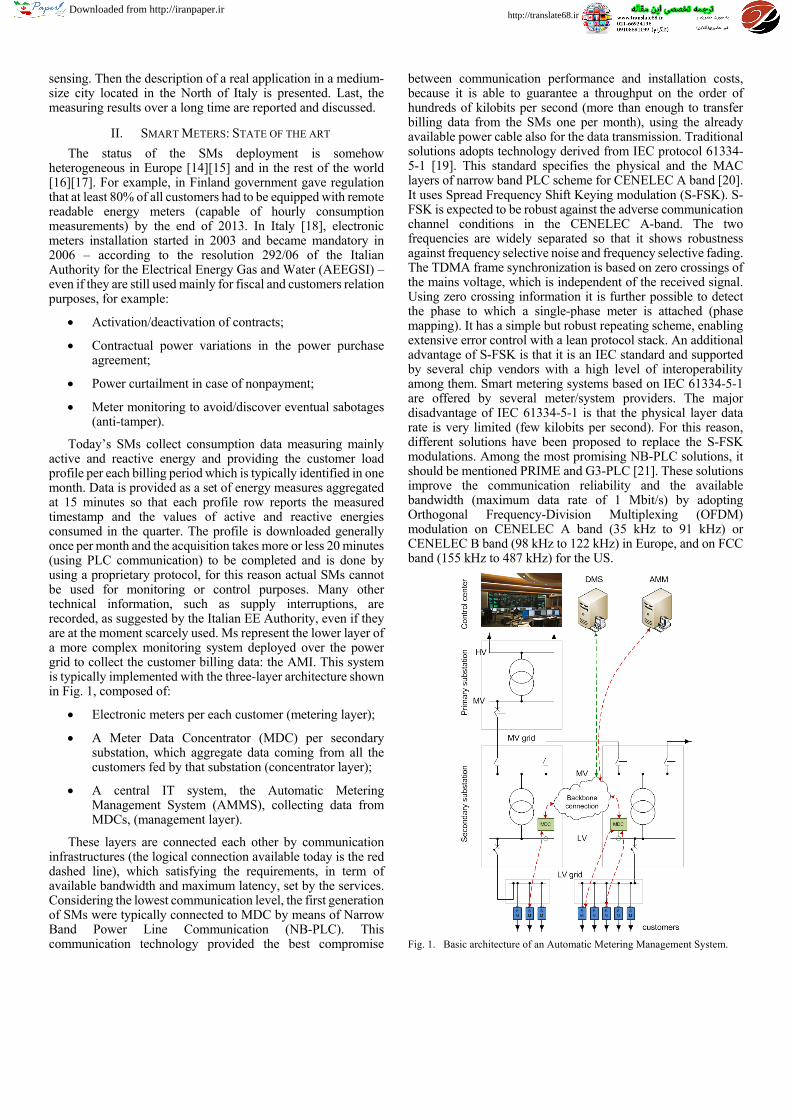
Today’s SMs collect consumption data measuring mainly active and reactive energy and providing the customer load profile per each billing period which is typically identified in one month. Data is provided as a set of energy measures aggregated at 15 minutes so that each profile row reports the measured timestamp and the values of active and reactive energies consumed in the quarter. The profile is downloaded generally once per month and the acquisition takes more or less 20 minutes (using PLC communication) to be completed and is done by using a proprietary protocol, for this reason actual SMs cannot be used for monitoring or control purposes. Many other technical information, such as supply interruptions, are recorded, as suggested by the Italian EE Authority, even if they are at the moment scarcely used. Ms represent the lower layer of a more complex monitoring system deployed over the power grid to collect the customer billing data: the AMI. This system is typically implemented with the three-layer architecture shown in Fig. 1, composed of:
Electronic meters per each customer (metering layer);
A Meter Data Concentrator (MDC) per secondary substation, which aggregate data coming from all the customers fed by that substation (concentrator layer);
A central IT system, the Automatic Metering Management System (AMMS), collecting data from MDCs, (management layer).
These layers are connected each other by communication infrastructures (the logical connection available today is the red dashed line), which satisfying the requirements, in term of available bandwidth and maximum latency, set by the services. Considering the lowest communication level, the first generation of SMs were typically connected to MDC by means of Narrow Band Power Line Communication (NB-PLC). This communication technology provided the best compromise
between communication performance and installation costs, because it is able to guarantee a throughput on the order of hundreds of kilobits per second (more than enough to transfer billing data from the SMs one per month), using the already available power cable also for the data transmission. Traditional solutions adopts technology derived from IEC protocol 61334-5-1 [19]. This standard specifies the physical and the MAC layers of narrow band PLC scheme for CENELEC A band [20]. It uses Spread Frequency Shift Keying modulation (S-FSK). S-FSK is expected to be robust against the adverse communication channel conditions in the CENELEC A-band. The two frequencies are widely separated so that it shows robustness against frequency selective noise and frequency selective fading. The TDMA frame synchronization is based on zero crossings of the mains voltage, which is independent of the received signal. Using zero crossing information it is further possible to detect the phase to which a single-phase meter is attached (phase mapping). It has a simple but robust repeating scheme, enabling extensive error control with a lean protocol stack. An additional advantage of S-FSK is that it is an IEC standard and supported by several chip vendors with a high level of interoperability among them. Smart metering systems based on IEC 61334-5-1 are offered by several meter/system providers. The major disadvantage of IEC 61334-5-1 is that the physical layer data rate is very limited (few kilobits per second). For this reason, different solutions have been proposed to replace the S-FSK modulations. Among the most promising NB-PLC solutions, it should be mentioned PRIME and G3-PLC [21]. These solutions improve the communication reliability and the available bandwidth (maximum data rate of 1 Mbit/s) by adopting Orthogonal Frequency-Division Multiplexing (OFDM) modulation on CENELEC A band (35 kHz to 91 kHz) or CENELEC B band (98 kHz to 122 kHz) in Europe, and on FCC band (155 kHz to 487 kHz) for the US.
Fig. 1. Basic architecture of an Automatic Metering Management System.
Downloaded from http://iranpaper.irhttp://translate68.ir

III. SMART METERS OF THE NEXT GENERATION
A. Architecture and features
The architecture of an electronic SM is similar to the architecture of an electronic data acquisition system: sensors, the sensor conditioning stage, the data acquisition block (ADC), an elaboration block (Elab) and a communication stage (Comm). The simplified block diagram of a single phase SM is shown in Fig. 2.
The sensors stage is composed of voltage and current sensors, which are directly connected to the LV grid. In LV application, resistive voltage divider sensors are used to acquire the voltage from the grid. Resistive voltage divider sensors use a voltage divider to scale down the voltage of the grid so that it can be acquired by the ADC block of the SM. These sensors offer the best comprise between the cost and measurement performance (good accuracy and linearity). Considering the current sensors, several solutions are available in literature [22]. Resistive shunts are the cheapest, and the most commonly used solution for residential and LV applications. Shunt sensors use a low-value resistor to produce a low-voltage drop that can be used to estimate the current. Current Transformers (CTs) represent an alternative to shunt-based sensors in applications requiring higher accuracy, higher current ranges and isolation. The CT sensors produce a reduced current accurately proportional to the current in the conductor by means of a magnet coupling. An additional solution could be the use of Rogowski coil-based sensor. A Rogowski coil consists of a coil of wire wrapped around the conductor carrying the current. The Rogowski coil sensors are more expensive compared to CTs, but their fast response times, highly linear outputs over large current ranges, electrical isolation, and immunity to electromagnetic interference make them an ideal solution for applications with strict measurement requirements. Traditionally, the elaboration block uses the data provided by current and voltage sensors to estimate the customer power consumption, and then, considering the time of use, the customer billing. It is rather simple to make available additional measurements that can be useful for the grid management, since the elaboration is performed by means of a microprocessor. For this reason, the SMs of the next generation can provide, in addition to billing information, also information about: i) active and reactive power consumption, ii) power factor, iii) RMS voltage and current, iv) line frequency and total harmonic distortion, v) number and the description of voltage dips and short interruptions.
Fig. 2. Simplified architecture of single phase SM of the next generation and list of additional measurements available for the management of the distribution grid.
B. Smart Meter Communication
Traditionally, the SMs have not demanding communication requirements since they were designed mainly for billing and customer relationship management (red dashed logic communication in Fig. 1). These requirements can be easily satisfied using PLC communication, like IEC 61334-5-1 [19], offering a limited bandwidth (approximately few kilobit per second). This is no longer valid if the SM should be able to transfer near real-time measurements that are used for grid monitoring and management. In addition, these meters work mainly through a non-standard application protocol. This means that smart meter data can be merged with data from other monitoring system of the distribution utility only in the control center, after they were acquired, transfer to and stored in the AMM. On the contrary, in a sensor network approach, the data provided by the SM should be directly available for the DMS, which supervises the distribution grid (dashed green line in Fig. 1).
The transfer of additional information requires a communication infrastructure able to provide a proper throughput and a limited latency, and an advanced protocol to structure the data and transfer the information efficiently. In the literature, several protocols have been proposed for an efficient communication of SMs, like DLMS/COSEM and IEC 61850 [23]. Nevertheless, the most promising standard is nowadays DLMS/COSEM, which has been already used by different suppliers.
COmpanion Specification for Energy Metering (COSEM) [11] is a specific object-oriented model for the Electronic Energy (EE) meters communication interfaces, providing a complete view of their available functionalities directly through the interfaces.
Device Language Message Specification (DLMS) [12] defines an application layer that does not depend on the lower layer. It has been developed with the aim to provide an interoperable environment in which to exchange metering data/information.
DLMS/COSEM is a standard that uses COSEM to define the EE meters interfaces and DLMS for the data exchange between different devices. More specifically:
The interface model provides only a functional description via building block, without describing the specific aspects of its implementation;
The communication protocol defines the data access and transport.
The DLMS/COSEM standard is divided in three blocks:
Modeling of both the device interfaces and the rules for the data identification;
Messaging: mapping of the interface model on the messages;
Transporting: message transport through the communication layer.
The DLMS/COSEM standard defines a client-server communication scheme: the MDC periodically polls the SM for
Downloaded from http://iranpaper.irhttp://translate68.ir

data acquisition. This communication scheme has severe scalability issue in a system which should be able to provide information for monitoring and control of the distribution grid. For this reason, recently DLMS/COSEM has introduced the event notification and Push mechanisms, which can be used to send notification of events to the MDC of to trigger the transmission of messages without the direct request of the MDC. This approach is similar to the Report service defined by the IEC 61850 [23]. Nevertheless, at the moment few meters on the market supports these modes of operation because of their recent introduction in the standard.
These advanced application layer protocols require a communication infrastructure able to transfer the amount of data. For this reason, more complex communication protocols, such as PRIME and G3-PLC [21], were introduced to boost the deployment of SM. For example, PRIME has been tested in many European countries (Spain, France and Switzerland) and is already used in Spain on the IBERDROLA Network. PRIME main features consist in the use of an OFDM modulation with 97 subcarriers in the 42-89 kHz band range, allowing it to reach a hypothetical performance of 128 kbit/s. Moreover, the OFDM modulation provides a high spectral efficiency and increases immunity of the system to noise. PRIME networks are composed by one base node and many remote nodes. Each remote node can act as a repeater for the traffic send/received to/from other remote nodes. Even in the case of mesh networks, each node can dynamically determinate its best route with the support of the base node. PRIME MAC level supports both contention-free (i.e. the TDM) and contention-based access policies like Carrier Sense Multiple Access with Collision Avoidance (CSMA/CA). Compared to contention-free protocols like TDM, which is collision free, the CSMA is much simpler because it does not require low-level synchronization mechanism between devices.
IV. THE EXPERIMENTAL TEST BED
The area selected for the test is the LV network connected to a MV/LV substation located in the city of Brescia (North of Italy). This area has been selected because of the high photovoltaic (PV) penetration, which is about 40 % of the peak demand. This grid is composed of eight LV feeders, five of them has been partially equipped with the sensor network made of SMs. The topology of the grid is depicted in Fig. 3. Three types of installations can be found:
Passive customers (15) with no generation which have been equipped with a SM to monitor the power flow between the grid and the load;
Active customers (21) with a PV plant which have been equipped with a SM to monitor the power flow between the grid and the load;
Active customers (7) with a PV plant, which have been equipped with two SMs. The first one (red) to monitor the power flow between the grid and the load and the second one (green) to monitor the PV production.
LV backbones are three-phase, while the connection to the residential customers is single-phase.
As a whole, the system has 48 SMs. The installed SMs are the EBM-M65BD E-METER by Indra Sistemas, S.A.. Each SM
has an Ethernet port and is connected to a LV Broandband Power Line (BPL) modem (API-2000-GW by Ormazabal Current), operating in the 2-32 MHz band. Data are collected in the MV/LV substation where the master node of the LV-BPL network is installed. A repeater is present in any street cabinet to boost the signal strength.
The Smart Meter installed in the experimental test bed are fully compliant with accuracy Class B for Active power (as defined in EN 50470-3:2006 [24]) and Class 2 for Reactive power (as defined in IEC 62053-23 [25]). In Table I and in Table II are respectively shown the accuracy classes for active and reactive power.
TABLE I. THE ACCURACY CLASSES FOR ACTIVE POWER (SINGLE-PHASE METERS AND POLYPHASE METERS WITH BALANCED LOAD) DEFINED BY EN
50470-3:2006 [24].
TABLE II. THE ACCURACY CLASSES FOR REACTIVE POWER(SINGLE-PHASE METERS AND POLYPHASE METERS WITH BALANCED LOAD) DEFINED BY IEC
62053-23 [25].
SMs used in the experimental test-bed are based on the DLMS/COSEM as application protocol. The client installed in the MDC retrieves the following measures:
Real-time RMS values: phase voltage (V), current (I), active power (P), reactive power (Q), power factor (PF). The data are estimated over an observation window of 200 ms and collected with a frequency of 1 minute;
Energies profiles: imported/exported active energies (P±) and imported/exported reactive energies (Q±) calculated in a 5-minute window. Data are collected with a frequency of 5 minutes
Every time the MDC connects to the meter asking for a measure, it sets the time reference of the reading by using the standard OBIS code and set function. The main limit of this approach is that the timestamp resolution of a DLMS data is 1 s [26]. Depending on the application that make use of the reading, the limited timestamp resolution could be one of the main source of uncertainties for the real time values provided by the SM. This could be solved if SMs would extend the timestamp data representation defined by DLMS/COSEM and could use a protocol specifically designed for time synchronization, for instance Network Time Protocol (NTP) or Precision Time Protocol (PTP), which can be adopted in Smart Grid network, as demonstrated in [27][28].
Class Accuracy
0.05*Iref<I<0.1*Iref Accuracy
0.1*Iref <I<Imax
A ±2.5% ±2.0% B ±1.5% ±1.0% C ±1.0% ±0.5%
Class Sin φ Accuracy
0.05*Iref<I<0.1*Iref Accuracy
0.1*Iref<I<Imax
2 1.0 ±2.5% ±2% 0.5 ±2.5% ±2%
3 1.0 ±4.0% ±3% 0.5 ±4 ±3
Downloaded from http://iranpaper.irhttp://translate68.ir

Fig. 3. Scheme of the test bed. Six LV feeders fed by an MV/LV substation were partially equipped with a new SM to monitor in real time the power exchange between the customer and the grid and the power produced by PV panels, where present.
V. EXPERIMENTAL RESULTS
The sensor network has been running for about 2 months, acquiring both real time data and energies values. In particular, the deployed smart meter network is able to measure, in real-time, the energy produced or consumed by each customer. This information, in conjunction with the PV production prediction, is crucial for the DSO to estimate the state of the LV grid, and therefore, to actively manage LV grid. As an example, Fig. 4 compares active powers from two nodes of the network, highlighted in Fig. 3 as Customer A and Customer B, fed by two different feeders. Each sub-picture reports the power used by the customer (magenta dashed line) the power injected in the grid (black dot-dashed line) and the power produced by the local PV panel (blue solid line). As clearly shown in the figure, during the morning and in the afternoon, both the customers inject power (black line) in the LV grid. In the case of a deep PV penetration, the energy may flows from the customers toward the secondary substation, creating instability to the distribution grid.
Table III reports statistics (mean, standard deviation, min, max and jitter, defined as the maximum voltage variation during the observation) about the voltage monitored in six feeders, grouped per phase. The nominal phase-to-ground voltage is 230 V. As can be seen, even if the voltage is always within the range mandates by the European norm EN 50160 (± 10 %) [29], in some cases is closer to the lower boundary during the acquisition period.
Fig. 4. Active powers from two nodes of the network: power used by the customer (magenta dashed line) the power injected in the grid (black dot-dashed line) and the power produced by the local PV panel (blue solid line). Customer A (a) and customer B (b).
TABLE III. MINIMUM, MAXIMUM, MEAN VALUES, JITTER AND STANDARD DEVIATION OF THE VOLTAGE MEASURED IN THE TEST AREA, GROUPED PER
FEEDER AND PER PHASE.
Feeder Phase Mean(V) Std(V) Min (V) Max (V) Jitter (V) FD01 3 228.14 3.91 208 240 34FD02 1 229.06 3.94 209 241 32FD02 3 228.28 3.62 211 240 29FD02 2 231.22 3.60 218 246 28FD07 2 230.55 3.22 215 242 27FD03 2 230.60 3.23 216 242 26FD08 2 230.96 3.10 217 243 26FD03 3 229.74 3.16 217 242 25FD08 1 230.93 3.16 216 241 25FD01 2 230.65 3.29 218 242 24FD07 3 230.81 3.06 218 241 23FD03 1 231.59 3.18 218 241 23FD07 1 230.51 3.26 218 240 22FD08 3 230.50 2.94 218 240 22FD06 2 230.77 2.43 222 240 18FD06 3 230.71 2.49 222 239 17FD06 1 230.99 2.54 223 240 17
Table IV reports further details, extracted by the data provided by the SMs network, about the percentage of measures below the 5 % (halfway from the lower limit of -10 % defined by the EN 50160). The voltage is below the 5 % only the 3 % of the time, as clearly shown in Table IV. This provides an indication that the very low value shown in Table III was not so common.
0
0.5
1
1.5
2
2.5
3
3.5
4
00:0
001
:00
02:0
003
:00
04:0
005
:00
06:0
007
:00
08:0
009
:00
10:0
011
:00
12:0
013
:00
14:0
015
:00
16:0
017
:00
18:0
019
:00
20:0
021
:00
22:0
023
:00
Act
ive P
ower
(kW
)
Time (hour)
Customer B
0.0
0.5
1.0
1.5
2.0
2.5
3.0
3.5
4.0
Act
ive
Pow
er (k
W)
Customer A
Load Power Injection Power PV Production Power
(b)
(a)
Downloaded from http://iranpaper.irhttp://translate68.ir

TABLE IV. PERCENTAGE OF MEASURES BELOW THE 5 % OF THE NOMINAL VALUE.
Customer Phase Measure < 5 % (#) Measures (#) Ratio (%)FD02.CU03 1 300 11892 2,52 FD01.CU07 3 155 14814 1,05 FD02.CU06 3 94 14796 0,64 FD07.CU32 2 25 14758 0,17 FD07.CU46 2 21 14821 0,14 FD08.CU22 1 16 14847 0,11 FD02.CU33 1 15 14807 0,10
VI. CONCLUSION
The increasing penetration of small distributed energy resources, like residential photovoltaic panels, in combination with an expected increase of electric vehicles and relative charging stations is causing severe management issues to the distribution grid. Traditionally, the MV/LV substations are not equipped with dedicated instruments that can support the management and the monitoring of the MV and LV grid. The deployment of dedicated instruments in connection point of the distribution grid is not feasible both for technical as well cost reasons. In the paper, the possibility to use the network of SMs as a sensors network for the grid monitoring has been explored and validated through a dedicated experimental set-up. In fact, SMs of the next generation, compared to devices already installed in some countries provide several parameters, like active and reactive power, line frequency, voltage dips and total harmonic distortion, which can be used by DSO to monitor the status of the network. A network composed of 48 SMs has been deployed over the LV grid of A2A in the city of Brescia, Italy. Each SM is connected to the MDC by means of a performing broadband power line communication network. The results of the monitoring, performed over 2 months, highlight the potential capabilities of a large scale monitoring system based on the use of a network of second generation SMs. Using the SM network has been verified that the voltage is below the 5 % of the nominal value only the 3 % of the time in section of the distribution grid under analysis, despite the large presence of distributed energy resources. In addition, the SMs network identifies inversion of the energy flow in part of the distribution grid due to an excess of PV energy production compared to customers consumption.
REFERENCES [1] J. Magalhaes Alves, et al. "Smart Grids: Asset management in primary
distribution substations, with smart sensor networks", in Proc. of IEEE CIRED 2013, pp.1-4, 10-13 June 213.
[2] G. Accetta, D. Della Giustina, G. D’Antona, R. Faranda and S. Zanini "SmartDomoGrid: Reference Architecture and Use Case Analyses for a Grid-Customer Interaction", in Proc. 2013 IEEE ISGT-Europe, Copenhagen, Danmark, Oct. 6 – 9, 2013.
[3] R. Moghe, A.R. Iyer, F.C. Lambert, D.M. Divan "A Low-Cost Wireless Voltage Sensor for Monitoring MV/HV Utility Assets", IEEE Transactions on Smart Grid, vol.5, no.4, pp.2002-2009, July 2014.
[4] D. Della Giustina, P. Ferrari, A. Flammini, S. Rinaldi, E. Sisinni, "Automation of Distribution Grids With IEC 61850: A First Approach Using Broadband Power Line Communication", IEEE Trans. Instrumentation and Measurement, Sept., 2013, Vol. 62, N. 9, pp. 2372-2383.
[5] P. Diefenderfer, P.M. Jansson, "Power sensor applications in a load management network for a residential microgrid", in Proc. of 2014 IEEE SAS, pp.136,140, 18-20 Feb. 2014.
[6] S. Shahid, K.R. Narumanchi, D. Gurkan, "Plug-in electric vehicle battery sensor interface in Smart Grid network for electricity billing", in Proc. of 2012 IEEE SAS, pp.1,4, 7-9 Feb. 2012.
[7] M. Pikkarainen, A. Lof, Lu Shengye, T. Poho, S. Repo, D. Della Giustina "Power quality monitoring use case in real low voltage network", in Proc. of ISGT EUROPE 2013, pp.1,5, 6-9 Oct. 2013.
[8] J. Vasconcelos, “Survey of Regulatory and technological Development Concerning Smart Metering in the European Union Electricity Market”, Policy Papers, RSCAS 2008/01.
[9] A. B. Haney, T. Jamasb and M. Pollitt, “Smart Metering and Electricity Demand: Technology, Economics and International Experience”, EPRG Working Paper; Cambridge Working Paper in Economics, Feb. 2009.
[10] S. Repo, D. Della Giustina, G. Ravera, L. Cremaschini, S. Zanini, J.M. Selga, P. Jarventausta "Use case analysis of real-time low voltage network management", in Proc. of ISGT Europe, pp.1,8, 5-7 Dec. 2011.
[11] “Electricity metering data exchange - The DLMS/COSEM suite - Part 6-2: COSEM interface classes”, IEC 62056-6-2 ed1.0, IEC, 2013.
[12] “Electricity metering data exchange - The DLMS/COSEM suite - Part 5-3: DLMS/COSEM application layer”, IEC 62056-5-3 ed1.0, IEC, 2013.
[13] P.A Pegoraro, T. Junjie, L. Junqi, F. Ponci, A. Monti, C. Muscas, "PMU and smart metering deployment for state estimation in active distribution grids", in Proc. of ENERGYCON 2012, pp.873,878, 9-12 Sept. 2012.
[14] A. Marcoci, et al. "The Meter-ON project: How to support the deployment of advanced metering infrastructures in Europe?", in Proc. of CIRED 2013 pp.1,4, 10-13 June 213.
[15] Yi Ding, P. Nyeng, et al., "Ecogrid EU - a large scale smart grids demonstration of real time market-based integration of numerous small DER and DR", in Proc. of IEEE ISGT Europe, pp.1,7, 14-17 Oct. 2012.
[16] M. Milam, G. Kumar Venayagamoorthy, "Smart meter deployment: US initiatives", in Proc. of IEEE ISGT 2014, pp.1,5, 19-22 Feb. 2014.
[17] M.F Khan, et al., "Roadmap for smart metering deployment for Indian smart grid", in Proc. of IEEE PES GMCE, pp.1,5, 27-31 July 2014.
[18] V. Strugar, et al. "South East Europe style smart metering: The cost effective solution for an ageing network", in Proc. of CIRED 2013, pp.1,4, 10-13 June 213.
[19] “Distribution automation using distribution line carrier systems - Part 5-1: Lower layer profiles - The spread frequency shift keying (S-FSK) profile”, IEC 61334-5-1 ed2.0, IEC, 2001.
[20] “Signalling on low-voltage electrical installations in the frequency range 3 kHz to 148,5 kHz. General requirements, frequency bands and electromagnetic disturbances”, EN 50065-1:2011, 2011.
[21] M. Hoch, "Comparison of PLC G3 and PRIME", in Proc. of IEEE ISPLC, pp.165,169, 3-6 April 2011.
[22] J. Fraden, “Handbook of Modern Sensors: Physics, Designs, and Applications”, Springer, Sept. 2010.
[23] S. Feuerhahn, M. Zillgith, C. Wittwer, C. Wietfeld "Comparison of the communication protocols DLMS/COSEM, SML and IEC 61850 for smart metering applications", in Proc. of IEEE SmartGridComm 2011, pp.410,415, 17-20 Oct. 2011.
[24] “Electricity metering equipment (a.c.) -- Part 3: Particular requirements - Static meters for active energy (class indexes A, B and C)”, EN 50470-3:2006, CENELEC, 2006.
[25] “Electricity metering equipment (a.c.) –Particular requirements – Part 23: Static meters for reactive energy”, IEC 62053-23, IEC, 2003.
[26] A. Flammini, S. Rinaldi, A. Vezzoli, "The sense of time in Open Metering System", in Proc. of 2011 IEEE SMFG, Italy, Nov. 14-16, 2011, pp. 22-27.
[27] D. Della Giustina, P. Ferrari, A. Flammini, S. Rinaldi, "Synchronization requirements of a Power Quality measurement system for the distribution grid", in Proc. of 2014 IEEE I2MTC, Uruguay, May 12-15, 2014, pp. 245-250.
[28] D. Della Giustina, P. Ferrari, A. Flammini, S. Rinaldi, "Experimental characterization of time synchronization over a heterogeneous network for Smart Grids", in Proc. of 2013 IEEE AMPS, Germany, Sept. 25-27, 2013, pp. 132-137.
[29] “Voltage characteristics of electricity supplied by public electricity networks”, EN 50160:2010, CENELEC, 2010.
Downloaded from http://iranpaper.irhttp://translate68.ir