
SMART Growth Evaluation Report
79
SMART Growth Evaluation Report Lisa Tylke, Evaluator Rob Paral, Associate May 2010
Transcript of SMART Growth Evaluation Report

SMART Growth Evaluation Report
Lisa Tylke, Evaluator Rob Paral, Associate
May 2010

SMART Growth Participating Grantees 2006-2009
African American Arts Alliance of Chicago
Albany Park Theater Project
American Theater Company
Anchor Graphics
Barrel of Monkeys
Changing Worlds
Chicago Chamber Musicians
Chicago Dramatists
Chicago Human Rhythm Project
Chicago Jazz Ensemble
Chicago Jazz Orchestra
Chicago Public Art Group
Congo Square Theatre
Emerald City Theatre Company
House Theatre
Hypocrites Theatre
Independent Feature Project
Intuit: The Center for Intuitive and Outsider Art
Jazz Institute of Chicago
Joel Hall Dancers and Center
Jump Rhythm Jazz Project
Lifeline Theatre
Links Hall
Luna Negra Dance Theater
Muntu Dance Theatre
Natya Dance Theatre
Neighborhood Writing Alliance
Neo-Futurists
Next Theatre
Puerto Rican Arts Alliance
Remy Bumppo Theatre Company
Rush Hour Concerts at St. James Cathedral
Shanti Foundation for Peace
ShawChicago Theatre Company
Silk Road Theatre Project
South Chicago Art Center
Teatro Vista
TimeLine Theatre Company
TUTA: The Utopian Theatre Asylum
Young Chicago Authors

SMART Growth Evaluation Report
Table of Contents
Executive Summary
SMART Growth/Evaluation Process Overview ........................................................................... 1
Summary Findings ....................................................................................................................... 2
Summary Recommendations ...................................................................................................... 5
Summary of Progress toward Common Outcomes and Measures ............................................. 8
Evaluation Report
Background ................................................................................................................................ 12
Evaluation Overview.................................................................................................................. 13
SMART Growth Program History ............................................................................................... 13
Qualitative Analysis ................................................................................................................... 15
Grantee Progress Toward SMART Growth Common Outcomes and Measures....................... 26
Findings ..................................................................................................................................... 35
Recommendations .................................................................................................................... 39
Appendices
I SMART Growth Grantee Survey Instrument ........................................................................ 42
II Grantee List........................................................................................................................... 60
III Interview List ........................................................................................................................ 61
IV SMART Growth Common Outcomes and Measures ............................................................ 62
V SMART Growth Evaluation Comprehensive Results ............................................................ 64
VI Recommended Data Collection Guide ................................................................................. 75

1
Executive Summary
SMART Growth Overview
In 2005, the Chicago Community Trust (Trust) launched the SMART Growth program for arts and culture, marking a new approach to funding very small and small arts and culture organizations in Chicago. SMART Growth was developed as a capacity-building program founded on the smARTscope® philosophy developed by the Arts & Business Council of Chicago (A&BC). SmARTscope defines six developmental phases (from budding organization to major institution) charting seven distinct management areas including: Concept Development and Planning, Staffing and Structure, Board Governance, Income Generation, Financial Management, Facilities and Audience Development and Marketing. Its fundamental premise is that balanced growth across all seven management areas is essential in order to ensure stability and resilience while progressing from Phase 1 through subsequent phases. The goal of SMART Growth was to guide 40 participating arts and culture organizations toward balanced growth that ensured their sustainability and resilience in the face of economic shifts and organizational transitions. The methodology coupled small general operating grants of $10,000 to $40,000 annually and an initial organizational assessment (smARTscope) that identified areas of strength and provided recommended strategies to address the lagging areas. FY2009 was the final year of this three-year demonstration model. Evaluation Process Overview
The purpose of this evaluation has been to assist the Trust in determining the value of the SMART Growth methodology and three-year program cycle to the participating grantee organizations. The evaluation process focused on identifying the strengths and weaknesses of the program, the degree to which the program’s approach was embraced and executed by the grantees, the program’s impact as perceived and measured by the individual SMART Growth grantees, whether or not the actual data related to relevant factors supports the impact as perceived by the grantees, and the program’s potential areas for improvement in the event of future deployment by the Trust. The evaluation process included information gathering via a range of methodologies including document review (original smARTscope assessment reports and all SMART Growth grant documents and financial reports), an electronic survey of all grantees (98% response rate) (Appendices I and II), analysis of the Trust’s SMART Growth data tables, and historic SMART Growth program documentation. To provide further qualitative data a series of one-on-one interviews was conducted with a subset of grant recipients and all programmatic staff members (Appendix III). The following narrative briefly summarizes the findings of the research and offers recommendations for the Trust to consider in any re-deployment of the program in the future.

2
Summary Findings
I. The SMART Growth program had a positive impact on the majority of groups involved.
Two thirds of the SMART Growth grantees reported that the experience changed their understanding of how to manage an arts organization. Eighty-eight percent (88%) reported that the SMART Growth experience made them more sustainable and resilient and 86% said they would continue to use the model going forward.
Grantee quotes:
- The SMART Growth process absolutely helped us to think more strategically about our priority areas. SMART Growth helped us to develop those tools by breaking down our problem areas and developing a step by step plan in addressing them.
- I think it gave us time to plan and to have room to make mistakes.
II. The SMART Growth program works well for a diversity of groups.
The SMART Growth program has a strong potential to work well for any small arts organization, regardless of artistic genre, age, ethnic affiliation, or budget size (< $1 million). In a cross comparison of common indicators no particular type of organization thrived or failed on average. SMART Growth’s nine “top achievers” (organizations who achieved 75% or more of their measures all three years) represented a diversity of organizational profiles. Top achievers represented 23% of the grantee cohort and ranged in age (9 to 27 years), budget size ($80,000 to $850,000), board size (5 to 22 members), staff size (1 to 7) and in their earned/contributed revenue ratios (0/100 to 96/4).
Organizations that were less successful at achieving their outcomes/measures (achieving 25% or less of their measures all three years) represented 10% of the grantee cohort. They too represented a range of profiles, age (8-21 years), budget size ($20,000 to $420,000), board size (9 to 15 members), staff size (0 to 2.5) and earned/contributed revenue (0/100 to 50/50).
III. SMART Growth had a positive impact on organizational sustainability as demonstrated by cohort growth across six management areas. Moderate to significant progress was made by the grantee cohort toward achievement of the SMART Growth Common Outcomes and Measures in six out of the seven management areas.
Ninety-two percent (92%) of the grantees thought SMART Growth would continue to affect their organizations in the future.

3
Grantee quotes:
- This [sustainability] is one of the most critical impact areas for us. It [SMART Growth] enabled us to build foundational elements, as well as develop a succession plan, strengthen our board and fundraising capacity and refocus our efforts around board development and growth.
IV. SMART Growth had its most significant impact on the area of Board Governance. The quantitative data as well as the qualitative information gathered shows a significantly positive impact on the development of board governance among grantees.
- All indicators (other than the number of total board members) within the Board Governance Common Outcomes and Measures demonstrated the strongest trends in growth (between 93% and 250% growth) among the grantee cohort when compared to the other management areas.
- The majority of groups (86%) stated that the SMART Growth experience was helpful to their board, citing their board’s involvement in SMART Growth sponsored governance outcomes, improved focus and strategic thinking among members of their boards, better quality of board engagement/practice, greater organizational awareness and unity of vision.
- Eighty-eight percent (88%) of grantees elected to work on Board Governance during the grant cycle. One third of the grantees had this area prescribed by the smARTscope assessment as lagging.
Grantee quote:
- Our board is now a major force in the organization. In a totally good way.
V. The SMART Growth logic model methodology was utilized as a tool to improve management. The majority of SMART Growth grantees utilized the smARTscope assessment as a springboard for their initial proposals and over the course of the program adopted a more customized approach to selecting outcomes and measures in subsequent proposals.
- The majority (89%) of grantees were able to find ways to track progress easily, citing that the process itself had taught them to set quantifiable measures, and in some cases, to create new internal systems.
- Ninety-one percent (91%) of grantees reported that the SMART Growth experience helped them learn to identify meaningful outcomes and measures for their organizations.
- Seventy-seven percent (77%) of grantees reported that the SMART Growth process changed their understanding of the ways to manage an arts organization.

4
- The majority (88%) of grantees stated that the experience was helpful to their staff, citing the program’s annual goal-setting and tracking framework, the professional development support and program-inspired unity of vision among board and staff as helpful.
- All but one of the grantees (97%) reported that the SMART Growth experience helped them think more strategically about the seven management areas.
Grantee quotes:
- The focus on capacity building and the program’s openness to allowing groups to create their own goals based upon their own needs was valuable...
- Initial proposal was staff developed. By the end of process, proposals reflected board input. Grant proposals prepared this year for new capacity building grant opportunities were a total collaboration between staff and board leadership.
- Each year the reporting and renewals showed us where we were lacking and also those we had made some huge strides. Nothing was what one would call easy, but we definitely could compare the proposals and the reports and see that we were making improvements. So the experience was heartening.

5
Summary Recommendations The following recommendations are presented for the Trust to consider as it looks to the future and potential re-deployment of the SMART Growth program.
I. Maintain the program’s strong and unique elements, including:
Multi-year, general operating support The SMART Growth program’s premise of providing general operating support is valuable because it provides financial flexibility to its grantees allowing them to determine what is of greatest need in any given year. The three-year renewable commitment also allows sufficient time for learning and growth.
Initial organizational assessment Taking part in an initial organizational assessment set the SMART Growth program experience apart from other funding programs. It set the tone for thoughtful engagement and was highly valued by the grantees, providing them with an important starting-point characterized by greater organizational awareness, focus, Board engagement, and planning structure.
Logic model methodology The SMART Growth program’s logic model methodology introduced a valuable management tool to the grantees, guiding them through the process of identifying meaningful outcomes, setting tangible measures and more thoughtfully engaging in evaluation.
Promotion of professional development to support change The SMART Growth program’s philosophy of promoting proactive accessing of professional development opportunities aligned with an organization’s stated outcomes and measures is critical because it establishes a practice of institutional learning. The program’s encouragement paid off as the overall trend in accessing professional development resources increased significantly among the cohort (from 32% to 80%) over the three years.
II. Encourage sustained board engagement throughout the process
Board commitment and engagement in the SMART Growth methodology is an essential component of success. Groups that did well all spoke of their board’s involvement as key to their success. To help grantees sustain board engagement throughout the process the Trust may want to develop a component of the reporting and re-application process that requires applicants to secure a renewed commitment from their Board to stay engaged in the methodology and process. To further support this essential element, the Trust may also want to provide groups with a management tool that suggests ways to keep the board involved and engaged in the process.

6
III. Provide discretionary consulting support and/or peer learning opportunities for arts organizations that seek it.
Most groups reported receiving sufficient support from Trust staff throughout the process. However, on deeper review of open-ended questions and follow-up interviews a recommendation is emerging for the Trust to consider -- any future deployment of the program should offer discretionary support services to SMART Growth grantees.
Access to optional coaching support via an outside consultant contracted by the Trust for groups who self-select and/or seem to be struggling could assist groups trying to make the most of the experience. It could also provide a means for facilitating struggling groups through a difficult situation or transition without putting undue burden on Trust program staff or the grantee/grantor relationship.
Cross-organizational peer learning opportunities, discussion circles on topics related to the most commonly selected management areas, and/or a SMART Growth cohort online discussion board might help to establish ongoing peer learning and exchange among the cohort with benefits beyond the three-year grant cycle. The key to providing such added-value programs is to clearly articulate their discretionary standing, and structure them to be delivered by persons outside of the Trust’s program staff to protect the grantor/grantee relationship.
IV. Maintain the eligibility criterion requiring grantees maintain a minimum of one paid staff
person and ensure that this requirement is in place throughout the process.
The review of documents and qualitative data indicated that the SMART Growth methodology was less effective among groups with extremely limited staffing (less than one full-time staff member.) The SMART Growth program requires from its grantees a commitment to thoughtful planning, basic tracking and purposeful evaluation. Without a consistent management “engine” to see the process through it is easy for this commitment to slip. It is advised that the Trust maintain its eligibility requirement regarding staffing but recognize that extra care and support may be required in monitoring those grantees who meet only the minimal requirement. The Trust may want to consider requiring them to participate in added-value consulting assistance to maintain focus and commitment over the three-year cycle.
V. Strive to maintain consistency within the grantee/grantor relationship
Because SMART Growth is unique in that it provides support for groups to do very intentional work and requires them to go through a thoughtful process of planning, tracking and accountability, striving to maintain a consistent relationship between program officer and grantee throughout the grant cycle could improve the outcomes and experiences for groups striving to get the most out of the experience.

7
VI. Flexible grant amounts may provide better incentives to achieve
Predictability of support was highly valued by the grantees. However, the ability to increase support to those groups demonstrating higher achievement or decrease support to those demonstrating lack of achievement could underscore the importance of thoughtful planning, reflection and accountability among grantees, particularly as the process unfolds beyond the initial energy and experience of the start-up assessment and grant award. Keeping a base-level funding commitment to those groups who continue to participate in good faith is recommended as it is an important factor underlying the strength of the program’s capacity-building focus. However, providing program staff with the flexibility to recommend increases or decreases in support based on merit or underachievement could keep groups striving and participating more actively in Years 2 and 3.
VII. A smaller grantee cohort may be advised
If the intention in a future deployment of the SMART Growth program is to provide grantees with increased Trust staff support and attention, then a reduction in the number of grantees taken into the program should be a consideration.

8
Summary of Grantee Progress toward SMART Growth
Common Outcomes and Measures
Analysis of how well the SMART Growth program achieved its goals and had its intended impact was based on the level of growth evident collectively among the 40 grantees in meeting the program’s “Common Outcomes and Measures” (Attachment IV). Created at the beginning of the program, the Common Outcomes and Measures were to serve as a guide to understanding and/or verifying the impact of SMART Growth on developing the seven management areas of its 40 grantees. Six out of the seven management areas saw moderate to significant progress made toward achievement of the stated SMART Growth Common Outcomes and Measures. 1
The following charts summarize data collected from the survey and grantee reports. The information demonstrates SMART Growth effectiveness at helping the grantees achieve desired outcomes.
What the Data Shows
The SMART Growth methodology encouraged more groups to engage in planning (both strategic and business).
1 Because the cohort was diverse with regard to facility access, usage and maintenance, the Common Outcomes
and Measures selected for Facilities were less valid as indicators of common progress. Therefore this evaluation report is not attempting to analyze this information with regard to grantee cohort progress.

9
What the Data Shows
The SMART Growth experience encouraged more groups to develop organizational charts and position descriptions; establish annual performance goals and evaluation practices for their paid staff members. In particular, the growth in accessing professional development among staff shows significant shifts in practice.
What the Data Shows
Board Governance showed the strongest growth among all of the measured indicators. Although the number of total board members increased only slightly (6%), the SMART Growth experience encouraged significantly more groups to develop formal board member job descriptions and board orientation manuals and encouraged more groups to develop an annual fundraising goal.

10
What the Data Shows
There was an increase in both earned and contributed revenue between years 2006 and 2008. In comparison though, 2009 showed a decrease among the cohort, which may have been influenced by an economic downturn which began in the fall of 2008. However, the number of individual donors reported by the cohort grew significantly (70%) over the three-year cycle.
* Comparative years 2006 to 2008

11
What the Data Shows
There was modest growth among groups reporting having an annual operating budget approved by the board and more significant growth with regard to the development of basic financial controls and accounting procedures over the three-year cycle.
What the Data Shows
The SMART Growth experience encouraged significantly more groups to develop an annual marketing plan and more groups to annually assess and analyze their audience demographics.

12
Evaluation Report
Background
In 2005, the Chicago Community Trust (Trust) launched the SMART Growth program for arts and culture, marking a new approach to funding very small (budgets < $250,000) and small (budgets between $250,000-$1m) arts and culture organizations in Chicago. SMART Growth was developed as a capacity-building program founded on the smARTscope® philosophy developed by the Arts & Business Council of Chicago (A&BC). The smARTscope Philosophy The smARTscope philosophy defines six developmental phases (from budding organization to major institution) charting seven distinct management areas (Concept Development and Planning, Staffing and Structure, Board Governance, Income Generation, Financial Management, Facilities and Audience Development and Marketing) to help arts boards and staff think more strategically about organizational development. Its fundamental premise is that balanced growth across all seven management areas is essential in order to progress from Phase 1 through subsequent phases. The SMART Growth Philosophy The goal of Smart Growth was to guide 40 participating arts and culture organizations toward balanced growth that ensured their sustainability and resilience in the face of economic shifts and organizational transitions; to help them find stability within one phase of development while establishing planning practices that would enable them to grow to the next level. The SMART Growth methodology was designed to help small and very small arts organizations (budgets under $550,000) strengthen their infrastructures so that they can focus on developing and sharing their artistic resources and talent. Rather than compel organizations to become larger in their quest for sustainability, SMART Growth encouraged organizations to make more effective use of their resources by reallocating them away from management areas that were ahead of the developmental curve toward lagging areas, thus helping the organization find stability from which to grow more thoughtfully and strategically. The SMART Growth cohort was diverse in several aspects. The range of artistic discipline included 38% theatre, 19% dance, 15% arts education, 13% music, 10% visual and media arts, and 5% literacy/art center. Budget sizes among the cohort ranged between $70,000 to $850,000 and less than 25% of the groups were minority-led. The methodology coupled small general operating grants of $10,000 to $40,000 annually with an initial assessment (smARTscope) that identified specific management areas that were ahead of the developmental curve and those that were lagging, along with recommended outcomes and measures to address the lagging areas. FY2009 was the final year of this three-year demonstration model.

13
Evaluation Overview The following report describes the outcomes and recommendations from the external evaluation of the SMART Growth program conducted by the Arts & Business Council of Chicago. The evaluation was both process-focused and, to the extent possible, outcomes-based, using tools and methods for both qualitative information gathering and quantitative data collection and analysis. The process evaluation aspects of the project focused on how SMART Growth was implemented and how it operated from both a foundation staff perspective and grantee perspective. It looked into whether the program provided the services as intended, while focusing specifically on whether the process was an effective means of achieving the desired outcomes for the program. The outcome evaluation aspects investigated whether or not the SMART Growth program achieved its goals and had its intended impact. Evaluation Methodology The evaluation process included information gathering via a range of methodologies including document review (40 original smARTscope assessment reports and SMART Growth grant documents and financial reports), an electronic survey of all grantees (Appendices I and II), analysis of the Trust’s SMART Growth data tables, and historic SMART Growth program documentation. To provide further qualitative data a series of one-on-one interviews was conducted with staff and a subset of grant recipients (Appendix III) and all programmatic staff members. Response to the electronic survey and interviews was extremely high, with 39 out of the 40 organizations responding (98%); all programmatic staff and five of the six selected organizations took part in requested interviews.
SMART Growth Program History In order to broaden the opportunity for more types of arts and cultural organizations to receive funding from the Trust, Arts and Culture staff in 2005 recommended establishing new priorities based on the needs identified in research and categorized by budget size. One key priority was the focus on “organizational development for the arts” which ultimately took the form of the SMART Growth program which was the first time that the Trust created a grant making focus area aimed specifically to serve “small” and “very small” arts organizations. SMART Growth was a thoughtfully-designed process to implement a theory of change. It assumed that the resources of organizations with operating budgets less than $1 million were limited and must be strategically allocated toward lagging management areas in order to maintain organizational stability and avert crises. The goal of the SMART Growth project was for each organization to substantially achieve the outcomes recommended in their smARTscope assessment report over a period of three years,

14
unless there were adequate justifications for shifting priorities through the course of the proposal process, thereby identifying and achieving appropriately revised outcomes. The SMART Growth methodology strived to train the organizations’ leaders in the basics of the logic model, reviewing and revising outcomes annually and setting measures by which progress could be monitored. If the SMART Growth philosophy was valid, this prescribed method would enable each organization to create an individualized and appropriate set of outcomes that were SMART (strategic, measurable, actionable, realistic, and timed) to guide their use of their resources (supplemented by a Trust grant). The common Year 3 outcome would be a cohort of arts organizations that are more stable and resilient and less prone to crisis management. The SMART Growth program was a competitive selection process by which 40 organizations were selected from a pool of 154 Letters of Inquiry. Prior to receiving the first general operating support grant, each grantee’s Board and senior staff completed the Arts and Business Council’s smARTscope assessment to identify management areas that were ahead of the curve, those that were on track for its specific phase of development, and those that were lagging. The smARTscope assessment process included an online survey asking board and senior staff members to report on their perceptions of the organization’s capabilities and practices within the seven management areas. A 95% participation rate for each organization was required for participation in the program. The survey data provided a framework for analysis by an A&BC consultant regarding the organization’s developmental strengths and weaknesses. A “Cohesion Meeting” followed with the consultant and principal board and staff member representatives. This meeting provided the consultant with deeper insights into the data findings because the discussion probed those areas of the survey data which had a wide discrepancy among staff and board member perceptions. Following the Cohesion Meeting and final analysis of the data, the consultant presented the smARTscope report to the full board and management team of the organization to ensure organizational awareness and learning. The smARTscope report identified outcomes and measures in each management area and was designed to provide the framework for each organization’s first SMART Growth application.
Each yearly proposal to the Trust specified the outcomes that would be addressed during the grant year and set measures by which progress would be monitored. Grants ranged in size from $10,000 to $40,000 and were renewable for three years.

15
Qualitative Analysis
The following narrative describes the summarized outcomes from the evaluation’s qualitative information gathering focusing on how SMART Growth was implemented and how it operated from both a foundation staff perspective and grantee perspective. The evaluation examined whether SMART Growth provided the services as intended and whether the process was an effective means of achieving the desired outcomes for the program.
I. The Proposal Process
a. Did the initial proposals fully reflect the smARTscope report?
The perception among the majority of grantees (95%) was that their initial proposals closely aligned with their smARTscope assessment reports; i.e. they focused on the identified lagging management areas and were reflective of the recommended outcomes and measures included in the report.
However, the quantitative data indicates that only 29% of Year 1 applications fully reflected the specific recommendations of the smARTscope assessments. According to the comparative review of smARTscope assessment reports and the initial proposals, the majority of grantees utilized the smARTscope assessment as a “guide” or starting point for planning and did not strictly adhere to the smARTscope philosophy of focusing exclusively on lagging management areas nor did they exclusively adopt the assessment’s recommended outcomes and/or measures.
The hard data shows the following and provides further insight into the depth to which the groups utilized the report: The majority of groups (58%) submitted applications that partially reflected the
recommendations found within the smARTscope assessments.

16
10% (4 groups) chose entirely independent outcomes/measures from their smARTscope assessments.
Overall, the percentage of groups using the smARTscope assessment “fully” was greatest in year 1 (just under one third) then declined annually. A document comparison of proposals to the original smARTscope assessment in Years 2 and 3 show an evolution of outcomes and measures among the majority of groups. This supports the idea that groups utilized the smARTscope assessment as a springboard for their initial proposal and then began to follow their own institutional instincts in developing outcomes and measures for Years 2 and 3.
Why then did the grantees believe their initial proposal so closely reflected their smARTscope assessment report? Their further written responses provide insight into how they viewed the assessment report as a planning tool rather than a strict outline. When asked to explain why they believed their applications reflected their assessment reports, their common responses included the clarity the report offered in identifying lagging areas for work; the heightened awareness it provided of already existing issues and the assessment’s assistance in prioritizing these needs. Focus on Lagging Areas
This trend of using the smARTscope assessment as a guide rather than a directive was also evident with regard to the grantees’ choice in selected “lagging” management areas – the majority choosing to focus on both lagging and non-lagging management areas in any given year. Only 18% of applications focused exclusively on the recommended lagging management areas, while only one grantee (2%) chose not to focus on any of their lagging management areas.
Board Governance emerged as an area of intense focus among the cohort during the grant cycle; even among those organizations where it was not considered to be a lagging management area. Data shows that although the smARTscope assessment reports identified Board Governance as a lagging management area for only one third of the grantees, 88% chose to focus on it at least once over the three year cycle. Annually Board Governance was selected by over 50% of the grantees (58% in Year 1; 63% in Year 2 and 52% in Year 3) making it an area of popular choice among the cohort for improvement and focus.
b. Did the grantees need more guidance in preparing the initial proposals and did Trust staff adequately explain the purpose and process?
Trust Staff Perspective Compared to other grant making focus areas, the SMART Growth program required more upfront education and staff guidance during the initial proposal development. There was a significant amount of pre-proposal work offered by Trust staff prior to application as well as an orientation session for grantees describing the application process and its use of the logic model methodology. The Trust invited grantees to an application learning session

17
which assisted the organizations in complying with the new process and in developing (for the most part) well-presented, thoughtful and focused proposals. The staff reported that although some groups needed more assistance during the proposal development phase than normal, they thought this was to be expected and was well worth the upfront time. In addition, the staff stated that the experience of going through the smARTscope assessment helped groups identify specific needs and stay focused on those needs within their initial proposals.
Grantee Perspective The majority of the grantees (83%) reported that they received enough assistance from Trust staff and the smARTscope consultants. However, a few groups (17%) thought they would receive some form of individualized follow-through with the smARTscope consultant who had developed their assessment report and recommendations, under the auspices of the Arts & Business Council. Although a minority, this response may suggest revisiting the “coaching” aspects of the program in the future and how this may increase the effectiveness of the program among a segment of the participating groups.
When asked to describe their experience in developing the original and subsequent proposals, the majority of grantees found something useful in the process while only 12% described it as difficult or confusing. Twenty-four percent (24%) described the process as straightforward; these were also the groups who mentioned having a strategic plan or regular planning process in place prior to starting SMART Growth. Thirty-three percent (33%) found the process to be an important tool for planning, tracking, and staying focused; while 27% thought the process was a valuable way to engage the board in planning and goal setting.

18
II. Grant Making Scope
a. Was it helpful to give grants for general operation rather than more specific capacity-building efforts and was the three-year time frame appropriate?
The vast majority of the grantees (97%) responded that general operating support as opposed to more specifically focused capacity-building support was valuable. Reasons cited included its flexibility, the need to pay for staff to support capacity building and the lack of general operating support from other funders.
The three-year timeframe was also endorsed by 80% of the groups surveyed citing that it allowed enough time for growth. Those that did not agree suggested a longer timeframe would better support their ability to grow and ultimately “replace” the SMART Growth support through other revenue sources.
The multi-year commitment was also supported whole-heartedly by all grantees, citing their increased ability to plan and implement confidently; the financial security it offered; and staff stability it supported. In addition groups cited the importance of the multi-year commitment in leveraging other funding sources and its assistance in transitioning to other sources of funding/revenue.
b. How were grant funds actually used?
Because the SMART Growth grants were classified as general operating support, this was a difficult question to measure. However, what we can say is that the grant funds supported the pursuit of the stated outcomes 89% of the time over the three-year timeframe and across the 40 organizations. Groups who did not use the funds for their stated outcomes cited leadership transition and unforeseen opportunities and/or challenges which precluded movement forward on the stated outcomes and measures.

19
III. Monitoring/Data Collection
a. Should there have been more structured data collection during the grant term?
Because SMART Growth was by nature a demonstration model, the staff did not have the benefit of hindsight to know which data was most useful to collect. Looking ahead to a redeployment of the program, data collection for the purposes of program evaluation should focus specifically on the measures identified within the SMART Growth logic model (Appendix IV). This data could be collected from grantees throughout the cycle at appropriate intervals i.e., via a beginning and exit survey and within the application, interim and final reports. A follow-up survey to gather qualitative information might still be desired but would not be burdened by the need to collect historic data from the grantees. In addition, an annual assessment by program staff of each grantee’s “achievement ratio” with regard to their identified measures would be a valuable indicator of the program’s overall success at engendering stronger management practices through the use of the logic model methodology. (Appendix VI) . Other data indicators collected this past cycle such as the grantee’s pursuit of other funding opportunities and their participation in professional development opportunities were less useful in the evaluation process; however, they may have other intrinsic values for the staff and therefore should be considered for collection in the future.
b. Did the grantees utilize the outcomes and measures as a means of tracking their own progress?
The majority (89%) of grantees were able to find ways to track progress easily, citing that the process itself had taught them to set quantifiable measures, and in some cases, to create new internal systems. Those that did not feel they sufficiently were able to track progress (11%) cited insufficient staffing and other resource related issues.
Ninety-one percent (91%) said their experience with SMART Growth helped them learn how to identify meaningful outcomes and measures. Grantees cited that the experience taught them to be more specific by setting tangible outcomes and measures and being more thoughtful in setting goals. A minority (9%) disagreed, responding that the process produced artificial outcomes and measures or they themselves had failed to fully integrate the practice.

20
Tracking Data With regard to the question “Did your experience with SMART Growth help you learn how to track income, attendance and other key data?”, there appears to be some questionnaire error in that we suspect many of the grantees interpreted this question more narrowly than intended, relating it to data collection rather than the more analytical practice of tracking. Therefore we found a split (43% to 47%) in the overall opinion of the cohort with regard to how the program may have enhanced their learning. When asked in a two-part question if they found the program experience helpful and would continue to track key data and use it to assess their organization, 43% gave a qualified “no”, noting that they were already tracking data (i.e., collecting data) prior to SMART Growth and did not credit SMART Growth for improved tracking/data collection.
Grantee quotes:
- We were already quite adept at tracking income, attendance, etc.
- We were already tracking all of those things. Furthermore, there was never any training mechanism that would have taught me those skills--either I had/have them or I didn't/don't. I don't know how I would have learned them from the program. We set goals and tracked progress toward them the same way at the end of three years as we had at the beginning.

21
- We are collecting key data and will continue to do so, but it wasn't entirely a result of the Smart Growth program.
Forty-seven percent (47%), however, answered yes to this question and saw the experience as a learning opportunity and a reason to invest more in data collection.
Grantee quotes:
- Absolutely. It was extremely helpful to learn effective ways in which to track income, expenses out, and profit in. Although there were ways in the past to track such data, the resources and structure provided by SMART growth were most effective for the organization.
- Yes. The first thing that we did was implement a new database, so we're finally starting to see two and three years’ worth of comparative data. This is allowing us to make better decisions about our future.
- Being able to plan based on results achieved or not in the previous years is crucial. That way we know where best to devote our resources. We don't have to keep doing the same things over and over without having a clue as to which ones contributed to the success or failure of our efforts.
In summary, the vast majority of the cohort (91%) reported learning from the SMART Growth process how to more effectively set outcomes and measures while slightly less than half of the cohort (47%) reported also improving their data collection skills and practices.
Following the Methodology There was a wide variety of responses to the question of the extent to which organizations followed the SMART Growth method of planning through a logic model. Those that strongly agreed with the statement (46%) cited board interest in the methodology and expected improvements to their financial and overall planning processes. Thirty-four percent agreed somewhat with the statement, noting that they used the method for certain management areas but not all; they also were employing other/new methodologies and/or the methodology worked better with either staff or board but not both. The smallest percentile (11%) did not agree with the statement at all. Eighty-six percent (86%) of the grantees stated that they would continue to use the SMART Growth model in future years.

22
IV. Impact on the Grantees
a. Did the grantees feel that the SMART Growth program experience increased their knowledge of management methods?
All but one of the grantees (97%) reported that the SMART Growth experience helped them think more strategically about the seven management areas. When asked to expand on this, groups referenced a greater shared awareness among their board and staff regarding the organization’s position and needs, as well as greater focus and the feeling that they had a “road map” or guide to follow from one year to the next. These grantee responses support the finding that enhanced Board engagement can be considered a key result of the SMART Growth methodology and process.
Grantee quotes
1. SMART Growth helped the organization be more focused and targeted in the management areas that needed attention and, as a result, became a significant part of quarterly reviews and annual board retreats.
2. It did teach us to think more strategically. It was good to have targets to hit; even if we were not always successful in hitting the mark.
3. It was the best template we had in place that kept the organization focused on its needs to conduct board development and fundraising goals.
Impact on Staff The majority (88%) of grantees stated that the experience was helpful to their staff, citing the program’s annual goal-setting and tracking framework, the professional development support and program-inspired unity of vision among board and staff as helpful. Those that did not find it helpful (11%) cited their organization’s lack of sufficient staffing, staff turnover or lack of staff effort as reasons.

23
Management Proficiency Seventy-seven percent (77%) of grantees reported that the SMART Growth process changed their understanding of the ways to manage an arts organization. There was a wide variety of response which corresponds to the wide range of organizational needs identified within the smARTscope assessment and grantee proposals.
The following quotes provide insights into the range of responses:
Grantee quotes
- It helped staff to think about programming and marketing strategies, and to evaluate these strategies.
- It was the beginning of re-thinking and training our basically untrained staff and board. It gave us an opportunity to set goals, even if we did not succeed in managing them every well.
- It gave us clear management areas that both the board and staff used to plan each year.
- It was the first time I had an understanding of an organization's life cycle and key operational areas.
- While it may not have "changed our understanding," it certainly had a positive impact on our overall management, from board engagement to staff structure.
- Yes, it forced issues to the surface that were difficult to discuss, but easy to ignore. It made us look at problem areas, and gave us specific, strategic models to address them.
- It furthered our already held belief that good art will not necessarily make us a good arts organization.
b. Did the grantees feel that the SMART Growth experience made them more sustainable and resilient?
Eighty-eight percent (88%) reported that the SMART Growth experience made them more sustainable and resilient. When asked to expand on this statement, 34% cited the methodology itself as the reason they responded this way. Other reasons included board growth and stronger board engagement (20%), and specific improvements to audience development and marketing and fundraising infrastructures (11% each). Three of the

24
grantees (9%) believed that they had not reached a sufficient level of sustainability to replace the SMART Growth funding going forward.
Examples given by grantees regarding SMART Growth funded projects that enhanced their sustainability touched on a wide variety of management initiatives including marketing initiatives, staff expansion, fundraising, fiscal management, enhanced governance practices and leadership succession planning. In addition grantees reported considering the SMART Growth grant size and multi-year structure as well as their ability to use it to leverage other funding as sustainability enhancing attributes of the program.
c. Did the grantees feel that their boards became more active as a result of their organization’s participation in the SMART Growth program?
The majority of groups (86%) stated that the SMART Growth experience was helpful to their board, citing their board’s involvement in SMART Growth sponsored governance outcomes, improved focus and strategic thinking among members of their boards, better quality of board engagement/practice, greater organizational awareness and unity of vision. Those that did not find the program to be helpful to their boards (14%) cited board turnover and non-involvement as the primary reasons.
When asked to describe the impact SMART Growth had on their board of directors, a small minority of groups stated that the program had little or no impact on their board. In comparison, 88% described the following developments: a more motivated and engaged board (35%), improved governance structures and practices (32%); board growth and transition (24%); greater organizational awareness and a better understanding of the board’s role within the organization (21%) and strengthened board fundraising practices (21%).
Grantee quotes:
- Unequivocally yes! The SMART Growth process has helped the board to focus on those areas of non-profit management vital to the organization.

25
- The goals became a priority of the board and the organization and refocused the work around tangible measurable outcomes. It helped us prioritize things that were on the radar screen, but always seemed to get less attention.
- The process served as an educational experience for board members who participated in the initial survey; and although some of those members were transitioning off of the board at that time, the work accomplished through assessment and through annual evaluation, and outcome/ measurement review, helped the evolving board to review recent history and to target discussions and planning according to identified need.
- Most importantly, it provided an impetus for the board to do the organizing/systematizing work. Knowing that certain tasks were a requirement of our funding gave the board the motivation to take on complex projects.
Sustainable Impact Ninety-two percent (92%) of the grantees thought SMART Growth would continue to affect their organizations in the future, 53% citing the methodology itself as providing an ongoing context for planning and assessment while 24% discussed the SMART Growth funded management initiatives as having the most lasting impact on their organizations. In comparison, only 8% were unclear as to how they would continue to feel its impact.

26
Grantee Progress toward SMART Growth Common Outcomes and Measures
Analysis of how well the SMART Growth program achieved its goals and had its intended impact was based on the level of growth evident collectively among the 40 grantees in meeting the program’s “Common Outcomes and Measures” (Attachment IV). Created at the beginning of the program, the Common Outcomes and Measures were to serve as a guide to understanding and/or verifying the impact of SMART Growth on developing the seven management areas of its 40 grantees. The Common Outcomes and Measures were based on benchmarks identified within the Arts & Business Council’s smARTscope assessment tool as descriptors for Phases 3 and 4 (the Phases most representative of a healthy arts organization within the budget and developmental ranges represented by the SMART Growth cohort – small and very small arts organizations).
Progress Summary Six out of the seven management areas saw moderate to significant progress made toward achievement of the stated SMART Growth Common Outcomes and Measures.
[Note: The Facilities management area did not show any significant movement forward as a cohort. Because the cohort was diverse with regard to facility access, usage and maintenance, the Common Outcomes and Measures selected for Facilities were less valid as indicators of common progress. Therefore this evaluation report is not attempting to analyze this information with regard to grantee cohort progress. In future deployment of SMART Growth the Trust should consider withdrawing the Facilities management area of its smARTscope assessment matrix as it appears to be a difficult area to measure and assess among the cohort targeted for support through SMART Growth, i.e. small and very small arts organizations.]
SMART Growth had its most significant impact on the area of Board Governance. This area above all others was cited most often within the survey by the grantees as a new area of infrastructure growth. The quantitative data as well as the qualitative information gathered shows a significantly positive impact on the development of board governance practices among the grantee cohort.
Data Findings The following charts summarize data collected from the survey and grantee reports. The information demonstrates SMART Growth effectiveness at helping the grantees achieve desired outcomes.

27
I. Concept Development and Planning
What the Data Shows
The SMART Growth methodology encouraged more groups to conduct planning (both strategic and business). This indicates positive movement toward the stated SMART Growth Common Outcomes for Concept Development and Planning – succession for the Artistic Director has been discussed by the Board and a strategic plan exists for two-to-three years.
Common Measure:
One half of the grantees agreed strongly or completely with the statement that they had a strategic plan in place that was approved and monitored annually by the board in 2009, compared to only one-third in 2006.
Common Measure:
One-third of grantees agreed strongly or completely in 2009 that they had a board approved business plan, compared to just one-fifth in 2006.

28
II. Staffing and Structure
What the Data Shows
The SMART Growth experience encouraged more groups to develop organizational charts and position descriptions; establish annual performance goals and evaluation practices for their paid staff members; and take part in professional development opportunities. In particular, the growth in accessing professional development among staff shows significant shifts in practice. Combined, these common measures indicate positive movement toward the stated SMART Growth Common Outcomes for Staffing and Structure – a staffing structure and performance management system for paid staff exist.
Common Measure:
Eighty percent (80%) of grantees agreed strongly or completely with the statement that they had an up-to-date organizational chart and position description for paid staff in 2009, compared to 50% in 2006.
Common Measure:
Fifty-five (55%) of the grantees agreed strongly or completely with the statement that annual performance goals for paid staff existed and were evaluated annually in 2009, compared to only 28% in 2006.

29
Common Measure:
Eighty percent (80%) of grantees agreed strongly or completely with the statement that management staff pursued professional development opportunities in 2009, compared to only 32% in 2006.

30
III. Board Governance
What the Data Shows
Board Governance showed the strongest growth among all of the measured indicators. Although the number of total board members increased only slightly (6%) over the three-year cycle, formal governance practices grew among the cohort. The SMART Growth experience encouraged significantly more groups to develop formal board member job descriptions and board orientation manuals. The SMART Growth experience also encouraged more groups to develop an annual fundraising goal that was approved by the board and that included board member contributions. These measures indicate positive movement toward the stated SMART Growth Common Outcomes for Board Governance – board governance capacity is strengthened.
Common Measure:
There was a 6% increase in the total number of board members reported at the end of the grant cycle.
Common Measure:
There was a very strong shift toward agreement with the statement that their organization had formal board member job descriptions and an orientation manual; 63% agree strongly or completely in 2009, compared to only 18% in 2006.

31
Common Measure:
Eighty-seven (87%) of grantees agreed strongly or completely with the statement that they had an annual board fundraising goal in 2009, compared to 45% in 2006.

32
IV. Income Generation
What the Data Shows
Although many variables influence revenue growth from year to year -- including programming choices and opportunities, donor priorities and the economic environment -- it may be assumed that the SMART Growth experience assisted groups to increase their earned and contributed revenue between years 2006 and 2008. In comparison though, all common income measures for 2009 show a decrease among the cohort, which may have been influenced by an economic downturn which began in the fall of 2008. In particular, earned revenue appears to have been impacted most severely (40% decrease). However, the number of individual donors reported by the cohort grew significantly (70%) over the three-year cycle which bodes well for contributed revenue sustainability as individual donors are considered to be an organization’s most loyal donors. These measures indicate positive movement toward the stated SMART Growth Common Outcomes for Income Generation – earned revenue dollars increase, contributed income increases and the individual donor base increases.
Common Measure:
Between 2006 and 2008, average earned income and contributed income increased significantly (60% earned, 42% contributed). In 2009, the average earned and contributed revenue dollars decreased. Earned income fell more sharply (by 40%) than contributed income (7%).
Common Measure:
The number of individual donors grew by 70% between 2006 and 2009.

33
V. Financial Management
What the Data Shows
Most groups (75%) reported having an annual operating budget approved by the board at the beginning of the SMART Growth program. However, the SMART Growth experience did encourage the majority of those groups who did not have this in 2006 to develop it by 2009 (only 2 of the 38 respondents disagreed with this statement still in 2009. More significant growth can be seen with regard to the development of basic financial controls and accounting procedures over the three-year cycle. These measures indicate movement forward toward the stated SMART Growth Common Outcomes for Financial Management – financial management capacity increases.
Common Measure:
Ninety-two (92%) agree strongly or completely with the statement that they had an annual operating budget which was approved by the board in 2009, compared to 75% in 2006.
Common Measure:
One grantee disagreed with the statement that they have basic financial controls and accounting procedures in 2009, compared to 34% in 2006.

34
VI. Audience Development and Marketing
What the Data Shows
The SMART Growth experience encouraged significantly more groups to develop an annual marketing plan and more groups to annually assess and analyze their audience demographics. These measures indicate positive movement toward the stated SMART Growth Common Outcomes for Audience Development and Marketing –audience development is prioritized through the implementation of a marketing plan, the current core audience demographic data is measured and analyze, and audiences increase2
Common Measure:
A clear majority (72%) of the groups agree strongly or completely with the statement that they had a marketing plan in 2009, compared to only 19% in 2006.
Common Measure:
Just over half (53%) of the grantees strongly or completely agree with the statement that they annually assess and analyze audience demographic data in 2009, compared to only 13% in 2006.
2 Note: The evaluation process did not include a data collection measurement for audience growth. This indicator was not documented at the beginning of the grant cycle and, therefore, we did not believe that the cohort could reliably provide data from 2006.

35
Findings
I. The SMART Growth program had a positive impact on the majority of groups involved.
Two thirds of the SMART Growth grantees stated that the experience changed their understanding of how to manage an arts organization; 86% said they would continue to use the model going forward. Throughout the survey, the vast majority of grantees had positive things to say about the SMART Growth methodology and grant experience. Most notably, they remarked on how it helped their boards develop organizational awareness, how it encouraged planning; and how they found it to be a valuable tool for engaging their boards more effectively. In addition, moderate to significant progress was made by the cohort toward meeting the SMART Growth Common Outcomes and Measures in six out of the seven management areas.
Grantee quotes:
- The SMART Growth process absolutely helped us to think more strategically about our priority areas. We were clear on what aspects of our company needed work we just did not have the tools to address them. SMART Growth helped us to develop those tools by breaking down our problem areas and developing a step by step plan in addressing them.
- It pushed us further in really articulating and quantifying areas which needed attention in our organization. Overall, the process just forced us to be more precise and detailed with our goal setting.
- I think it gave us time to plan and to have room to make mistakes.
II. The SMART Growth program works well for a diversity of groups.
The SMART Growth program has a strong potential to work well for any small arts organization, regardless of artistic genre, age, ethnic affiliation, or budget size (< $1 million). In a cross comparison of common indicators no particular type of organization thrived or failed on average. SMART Growth’s nine “top achievers” (organizations who achieved 75% or more of their measures all three years) represented a diversity of organizational profiles. Top achievers represented 23% of the grantee cohort and ranged in age (9 to 27 years), budget size ($80,000 to $850,000), board size (5 to 22 members), staff size (1 to 7) and in their earned/contributed revenue ratios (0/100 to 96/4).
Organizations that were less successful at achieving their outcomes/measures (achieving 25% or less of their measures all three years) represented 10% of the grantee cohort. They too represented a range of profiles, age (8-21 years), budget size ($20,000 to $420,000), board size (9 to 15 members), staff size (.5 to 2.5) and earned/contributed revenue (0/100 to 50/50).

36
III. SMART Growth had a positive impact on organizational sustainability as demonstrated by cohort growth across six management areas.
Moderate to significant progress was made by the grantee cohort toward achievement of the SMART Growth Common Outcomes and Measures in six out of the seven management areas. Only Facilities management did not see any significant movement forward as a group.
Eighty-eight percent (88%) of grantees reported that the SMART Growth experience made them more sustainable and resilient. When asked to expand on this statement, 34% cited the methodology itself as the reason they responded this way. Other reasons included board growth and stronger board engagement (20%); and specific improvements to audience development and marketing and fundraising infrastructures (11% each).
Grantee quotes:
- The SMART Growth program enabled the organization to develop a road map to follow. This has put everyone on the same page and has allowed consistency in how the organization approaches all of its functions.
- This [sustainability] is one of the most critical impact areas for us. It [SMART Growth] enabled us to build foundational elements, as well as develop a succession plan, strengthen our board and fundraising capacity and refocus our efforts around board development and growth.
- It helped us solve issues that were keeping us from moving towards sustainability. It helped us look at the policies and practices especially of our board and administrative team and to shape them over the years into specific, clear procedures.
- I think urging us to be more organized and goal driven helped.
- To a large extent, all of the systems that we refined or implemented have made the organization run more efficiently.
The question of sustainability, however, among the smallest of the groups was more difficult to gauge. Although some very small organizations were among the top achievers, when asked about long-term sustainability, this group of grantees discussed their concerns regarding their ability to replace the Trust funding after only three years. It may be unrealistic to assume that this size organization will develop enough capacity in three years to replace the SMART Growth level of funding. Therefore, these groups will most likely see a decline in capacity in the year following the conclusion of the project.
Grantee quotes:
- At this juncture, I'm not sure that we are sustainable.
- SMART Growth was hugely influential on our organization's growth in the last three years -- a time period in which our budget, audience, staff and programming have

37
increase dramatically. The huge question we face now is how to replace the SMART Growth funding.
- For organizations without established board/staff cultures, three years would be a minimum amount of time needed to establish a new and stable culture. Given the economic upheaval of the last 18 months, a lot of the work that was done has been undone. In a more positive economic environment, the gains that were made might have been more easily sustained.
IV. The Board Governance management area grew most significantly among the cohort.
SMART Growth had its most significant impact on Board Governance. This management area above all others was cited most often by the grantees as a new area of infrastructure growth. It was also selected most often as an area of focus. Board engagement and good governance practices are common challenges among small and very small arts organizations and, indeed, the smARTscope assessments confirm this. Board Governance was identified as one of the top three lagging management areas among the grantee cohort. A sampling of the quantitative and qualitative data supporting the conclusion that SMART Growth had a significantly positive impact on board governance includes:
- Eighty-six percent (86%) of groups surveyed replied yes to the question of whether the SMART Growth experience was helpful to their boards, describing the following developments: a more motivated and engaged board, improved governance structures and practices, board growth and transition, greater organizational awareness, a better understanding of the board’s role within the organization and strengthened board fundraising practices.
- Board Governance emerged as an area of intense focus among the cohort during the grant cycle, even among those organizations where it was not considered to be a lagging management area. Eight-eight percent (88%) of grantees elected to work on Board Governance during the grant cycle while just one third of the grantees had this area prescribed by the smARTscope assessment as lagging.
- All indicators (other than the number of total board members) within the Board Governance Common Outcomes and Measures demonstrated the strongest trends in growth (between 93% and 250% growth) among the grantee cohort when compared to the other management areas.
- In follow-up interviews, when asked who benefited most within the organization from the SMART Growth experience, 80% stated that their boards had, citing improved board governance practices, clarity of focus and a better understanding among board members of their role within the organization.
Grantee quotes:
- SMART Growth greatly expanded our vision of the role, commitment and involvement of the board in the overall management of the organization.

38
- [SMART Growth] provided a framework for the board to think about their role and responsibilities. They became more involved.
- Our board is now a major force in the organization, in a totally good way.
- The board is now more committed to and involved in the fundraising activities and audience development activities of the organization.
V. The SMART Growth methodology was utilized as a tool to improve management.
The vast majority of grantees (91%) reported that the SMART Growth experience taught them how to more effectively set outcomes and identify measures. The majority of SMART Growth grantees utilized the smARTscope assessment as a springboard for their initial proposals and over the course of the program adopted a more customized approach to selecting outcomes and measures in subsequent proposals.
The percentage of groups using it “fully” was greatest in Year 1 (one third), then declined annually with the majority of groups following their own instincts in developing customized outcomes and measures (i.e., using smARTscope as a guide and/or starting point but not strictly adhering to its recommended outcomes/measures). This was also true with regard to their choice in selected “lagging” management areas, the majority choosing to focus on a combination of lagging and non-lagging management areas in any given year.
Ninety-five percent (95%) of grantees stated that the SMART Growth experience helped them think more strategically about the seven management areas. When asked to expand on this, groups referenced a greater shared awareness among their board and staff regarding the organization’s position and needs, as well as greater focus and the feeling that they had a “road map” or guide to follow from one year to the next.
Grantee quotes:
- It served to bring to the front the importance of the management within the organization…By doing so it helped to move us beyond the founder’s influence and support the transition of leadership at the management and board level.
- The focus on capacity building and the program’s openness to allowing groups to create their own goals based upon their own needs was valuable…,
- This process provided an opportunity to engage the entire Board in assessing the challenges that had to be faced. In addition, Board members made stronger commitments to the organization.
- The process began with the initial assessment but grew to cover additional areas over the years as staff and needs changed.

39
Recommendations
The following recommendations are presented for the Trust to consider as it looks to the future and the potential re-deployment of the SMART Growth program.
I. Maintain the program’s strong and unique elements, including:
Multi-year, general operating support The program’s premise of providing general operating support (as opposed to more specifically focused capacity-building support) is valuable because it provides financial flexibility to its grantees allowing them to determine what is of greatest need in any given year. The three-year renewable commitment also allows sufficient time for learning and growth.
Initial organizational assessment Taking part in an initial organizational assessment set the SMART Growth program experience apart from other funding programs. It set the tone for thoughtful engagement and was highly valued by the grantees, providing them with an important starting-point characterized by greater organizational awareness, focus, Board engagement, and planning structure.
Logic model methodology The SMART Growth program’s logic model methodology introduced a valuable management tool to the grantees, guiding them through the process of identifying meaningful outcomes, setting tangible measures and more thoughtfully engaging in evaluation.
Promotion of professional development to support change The SMART Growth program’s philosophy of promoting proactive accessing of professional development opportunities aligned with an organization’s stated outcomes and measures is critical because it establishes a practice of institutional learning. The program’s encouragement paid off as the overall trend in accessing professional development resources increased significantly among the cohort (from 32% to 80%) over the three years.
II. Encourage sustained board engagement throughout the process
Board commitment and engagement in the SMART Growth methodology is an essential component of success. Groups that did well all spoke of their board’s involvement as key to their success. To help grantees sustain board engagement throughout the process the Trust may want to develop a component of the reporting and re-application process that requires applicants to secure a renewed commitment from their Board to stay engaged in the methodology and process. To further support this essential element, the Trust may also want to provide groups with a management tool that suggests ways to keep the board involved and engaged in the process.

40
III. Provide discretionary/optional consulting support and/or peer learning opportunities
Most groups reported receiving sufficient support from Trust staff throughout the process. However, on deeper review of open-ended questions and follow-up interviews a recommendation is emerging for the Trust to consider -- any future deployment of the program should offer discretionary support services to SMART Growth grantees.
Access to optional coaching support via an outside consultant contracted by the Trust for groups who self-select and/or seem to be struggling could assist groups trying to make the most of the experience. It could also provide a means for facilitating struggling groups through a difficult situation or transition without putting undue burden on Trust program staff or the grantee/grantor relationship.
Cross-organizational peer learning opportunities could also provide an additional level of support, learning and ultimately sustainability if offered in a discretionary manner. Quarterly or bi-annual discussion circles on topics related to the most commonly selected management areas, facilitated by an outside consultant, might have benefits beyond each organization’s individual needs by establishing ongoing peer learning and exchange among the cohort -- including relationships that could continue beyond the three-year cycle and without the Trust’s facilitation. Another avenue might include a SMART Growth cohort online discussion board. The key to providing such added-value programs is to clearly articulate their discretionary standing, and structure them to be delivered by persons outside of the Trust’s program staff to protect the grantor/grantee relationship.
IV. Maintain the eligibility criterion requiring grantees maintain a minimum of one paid staff person and ensure that this requirement is in place throughout the process.
The review of documents and qualitative data indicated that the SMART Growth methodology was less effective among groups with extremely limited staffing (less than one full-time staff member.) The SMART Growth program requires from its grantees a commitment to thoughtful planning, basic tracking and purposeful evaluation. Without a consistent management “engine” to see the process through it is easy for this commitment to slip. It is advised that the Trust maintain its eligibility requirement regarding staffing but also recognize that extra care and support may be required in monitoring those grantees who meet only the minimal requirement. The Trust may want to consider requiring them to participate in added-value consulting assistance to maintain focus and commitment over the three-year cycle.
V. Strive to maintain consistency within the grantee/grantor relationship
A minority of grantees mentioned the lengthy staff transition at the Trust following the launch of the program, coupled with the rotation of program staff assigned to review their proposals, as having a negative impact on their ability to build a grantee/grantor relationship with the Trust. In particular, they believed that given the program’s

41
methodology, which was new to them, the lack of a consistent relationship with a program officer was an added burden.
Because SMART Growth is unique in that it provides support for groups to do very intentional work and requires them to go through a thoughtful process of planning, tracking and accountability, striving to maintain a consistent relationship between program officer and grantee throughout the grant cycle could improve the outcomes and experiences for groups striving to get the most out of the experience.
VI. Flexible grant amounts may provide better incentives to achieve
Predictability of support was highly valued by the grantees. However, the ability to increase support to those groups demonstrating higher achievement or decrease support to those demonstrating lack of achievement could underscore the importance of thoughtful planning, reflection and accountability among grantees, particularly as the process unfolds beyond the initial energy and experience of the start-up assessment and grant award. Keeping a base-level funding commitment to those groups who continue to participate in good faith is recommended, as it is an important factor underlying the strength of the program’s capacity-building focus. Keeping a base-level funding commitment to those groups who continue to participate in good faith is recommended as it is an important factor underlying the strength of the program’s capacity-building focus. However, providing program staff with the flexibility to recommend increases or decreases in support based on merit or underachievement could keep groups striving and participating more actively in Years 2 and 3.
VII. A smaller grantee cohort may be advised
If the intention in a future deployment of the SMART Growth program is to provide grantees with increased Trust staff support and attention, then a reduction in the number of grantees taken into the program should be a consideration. Conversely, providing more hands-on support and/or added-value services could also be managed by outsourcing many of these activities, which would allow for a similar sized grantee cohort in the future.

The Arts & Business Council of Chicago is conducting, on behalf of the Chicago Community Trust, an evaluation of the Trust’s SMART Growth program. We ask that you please take some time to complete the following survey. Individual responses will be kept confidential and the combined data shared with the Trust. Your insights and opinions are both meaningful and important to the evaluation process. Collectively they will help shape the Trust’s future giving program for arts and culture in Chicago.
Please note, this survey may require an hour or more of your time. You may exit the survey at any time, return to it later and your responses will be saved. To do so you must first select "next" at the bottom of each page before selecting "exit this survey" at the top of each page.
Please submit the completed survey by Friday, November 13, 2009. Should you have any questions regarding the survey or the evaluation process please contact Lisa Tylke at (630) 942-0922 or [email protected].
Thank you,
Peter KuntzExecutive DirectorArts & Business Council of Chicago
1. Introduction
kromans
Typewritten Text
Appendix I
kromans
Typewritten Text
42

Why this Survey?The purpose of this evaluation is to assist the Chicago Community Trust in determining the value of the SMART Growth methodology and three-year grant cycle to the participating grantee organizations. As part of this evaluation we are asking you to reflect and comment on your experience with the SMART Growth program.
Is the Survey Confidential?YES, individual responses to the survey are confidential. Survey findings will be discussed in the aggregate in a final report that will not identify any individual or organization.
How Will the Survey Results Be Used?The Arts & Business Council will use these results to help - identify the strengths and weaknesses of the SMART Growth program; - understand the degree to which the SMART Growth methodology was embraced by the grantees; and - gauge the SMART Growth program’s impact as perceived and measured by the grantees.
How Can I Get More Information?More information can be obtained by contacting Lisa Tylke at [email protected], 630-942-0922.
Who Should Complete This Survey?One survey should be completed by each organization. Ideally, the person completing the survey would be the individual who has worked most closely with the SMART Growth application process over the past three years. If your organization has experienced turnover in this staffing position you may want to seek advice and comment from several individuals (board or staff) who were involved with the SMART Growth process at various times during the three-year cycle.
If you feel you are not the best person within your organization to respond to this survey, please forward this email on to whomever you feel could respond most effectively on behalf of your organization. Please note however, that your organization will only be asked for one response. Multiple responses from this particular link (listed below) will not register separately but rather over-write the previous one.
2. Survey Information
kromans
Typewritten Text
43

Please select the statement that most closely reflects the state of your organization at the time.
3. Concept Development and Planning
1. In 2006, we had a strategic plan in place that was approved and monitored annually by the board.
*
2. In 2009, we currently have a strategic plan in place and progress on the plan is being monitored.
*
3. In 2006, we had a detailed business plan to implement the artistic and programmatic elements of our strategic plan.
*
4. In 2009, we currently have a detailed business plan to implement the artistic and programmatic elements of our strategic plan.
*
Disagree
nmlkj
Agree somewhat
nmlkj
Agree strongly
nmlkj
Completely agree
nmlkj
Disagree
nmlkj
Agree somewhat
nmlkj
Agree strongly
nmlkj
Completely agree
nmlkj
Disagree
nmlkj
Agree somewhat
nmlkj
Agree strongly
nmlkj
Completely agree
nmlkj
Disagree
nmlkj
Agree somewhat
nmlkj
Agree strongly
nmlkj
Completely agree
nmlkj
kromans
Typewritten Text
44

Please select the statement that most closely reflects the state of your organization at the time.
4. Staffing & Organizational Structure
1. In 2006 we had an up-to-date organizational chart and position descriptions for all paid staff.
*
2. In 2009 we currently have an up-to-date organizational chart and position descriptions for all paid staff.
*
3. In 2006 we had annual performance goals for paid staff and the goals were evaluated annually.
*
4. In 2009 we currently have annual performance goals for paid staff and the goals are evaluated annually.
*
Disagree
nmlkj
Agree somewhat
nmlkj
Agree strongly
nmlkj
Completely agree
nmlkj
Disagree
nmlkj
Agree somewhat
nmlkj
Agree strongly
nmlkj
Completely agree
nmlkj
Disagree
nmlkj
Agree somewhat
nmlkj
Agree strongly
nmlkj
Completely agree
nmlkj
Disagree
nmlkj
Agree somewhat
nmlkj
Agree strongly
nmlkj
Completely agree
nmlkj
kromans
Typewritten Text
45

5. In 2006 management staff pursued professional development opportunities.
*
6. In 2009 management staff pursued professional development opportunities.
*
Disagree
nmlkj
Agree somewhat
nmlkj
Agree strongly
nmlkj
Completely agree
nmlkj
Disagree
nmlkj
Agree somewhat
nmlkj
Agree strongly
nmlkj
Completely agree
nmlkj
kromans
Typewritten Text
46

Please select the statement that most closely reflects the state of your organization at the time.
5. Board Governance
1. In 2006 our organization had formal board member job descriptions and a board orientation manual.
*
2. In 2009 our organization currently has formal board member job descriptions and a board orientation manual.
*
3. In 2006 our organization had an annual fundraising goal that was approved by the board and that included a minimal annual board member contribution.
*
4. In 2009 our organization currently has an annual fundraising goal that was approved by the board and that included a minimum annual board member contribution.
*
Disagree
nmlkj
Agree somewhat
nmlkj
Agree strongly
nmlkj
Completely agree
nmlkj
Disagree
nmlkj
Agree somewhat
nmlkj
Agree strongly
nmlkj
Completely agree
nmlkj
Disagree
nmlkj
Agree somewhat
nmlkj
Agree strongly
nmlkj
Completely agree
nmlkj
Disagree
nmlkj
Agree somewhat
nmlkj
Agree strongly
nmlkj
Completely agree
nmlkj
kromans
Typewritten Text
47

6. Income Generation
1. How many individual donors did your organization have in:FY2005
FY2009
kromans
Typewritten Text
48

Please select the statement that most closely reflects the state of your organization at the time.
7. Financial Management
1. In 2006 we had an annual operating budget which was approved by the board.
*
2. In 2009 we currently have an annual operating budget which has been approved by the board.
*
3. In 2006 we had basic financial controls and accounting procedures that were written down and monitored by the board.
*
4. In 2009 we currently have basic financial controls and accounting procedures that were written down and monitored by the board.
*
Disagree
nmlkj
Agree somewhat
nmlkj
Agree strongly
nmlkj
Completely agree
nmlkj
Disagree
nmlkj
Agree somewhat
nmlkj
Agree strongly
nmlkj
Completely agree
nmlkj
Disagree
nmlkj
Agree somewhat
nmlkj
Agree strongly
nmlkj
Completely agree
nmlkj
Disagree
nmlkj
Agree somewhat
nmlkj
Agree strongly
nmlkj
Completely agree
nmlkj
kromans
Typewritten Text
49

5. In 2006 we had an annual fundraising plan that was approved by the board.
*
6. In 2009 we currently have an annual fundraising plan that was approved by the board.
*
7. In 2006, monthly financial statements were prepared for and reviewed by the board.
*
8. In 2009, monthly financial statements have been prepared for and reviewed by the board.
*
Disagree
nmlkj
Agree somewhat
nmlkj
Agree strongly
nmlkj
Completely agree
nmlkj
Disagree
nmlkj
Agree somewhat
nmlkj
Agree strongly
nmlkj
Completely agree
nmlkj
Disagree
nmlkj
Agree somewhat
nmlkj
Agree strongly
nmlkj
Completely agree
nmlkj
Disagree
nmlkj
Agree somewhat
nmlkj
Agree strongly
nmlkj
Completely agree
nmlkj
kromans
Typewritten Text
50

Please select the statement that most closely reflects the state of your organization at the time.
8. Audience Development and Marketing
1. In 2006 we had a marketing plan that was updated annually.*
2. In 2009 we currently have a marketing plan that will be updated annually.
*
3. In 2006 we annually assessed and analyzed audience demographic data.*
4. In 2009 we assessed and analyzed audience demographic data.*
Disagree
nmlkj
Agree somewhat
nmlkj
Agree strongly
nmlkj
Completely agree
nmlkj
Disagree
nmlkj
Agree somewhat
nmlkj
Agree strongly
nmlkj
Completely agree
nmlkj
Disagree
nmlkj
Agree somewhat
nmlkj
Agree strongly
nmlkj
Completely agree
nmlkj
Disagree
nmlkj
Agree somewhat
nmlkj
Agree strongly
nmlkj
Completely agree
nmlkj
kromans
Typewritten Text
51

Please select the statement that most closely reflects the state of your organization at the time.
9. Facilities
1. In 2006 we had office space that was well-suited to our needs. *
2. In 2009 we have office space that is well-suited to our current needs. *
3. In 2006 we had access to space(s) that were better-suited for our rehearsal and performance needs.
*
4. In 2009 we have access to space(s) that are better-suited to our rehearsal and performance needs.
*
Disagree
nmlkj
Agree somewhat
nmlkj
Agree strongly
nmlkj
Completely agree
nmlkj
Disagree
nmlkj
Agree somewhat
nmlkj
Agree strongly
nmlkj
Completely agree
nmlkj
Disagree
nmlkj
Agree somewhat
nmlkj
Agree strongly
nmlkj
Completely agree
nmlkj
Disagree
nmlkj
Agree somewhat
nmlkj
Agree strongly
nmlkj
Completely agree
nmlkj
kromans
Typewritten Text
52

10. Process
1. Did your initial proposal closely reflect your smARTscope assessment report?
*
2. Describe your organization’s experience in developing the original and subsequent renewal SMART Growth proposals.
*
3. Was it challenging for your organization to prepare the proposal each year?
*
4. Did you receive enough assistance from The Chicago Community Trust staff and smARTscope consultants along the way?
*
Yes
nmlkj
No
nmlkj
Why or why not?
Yes
nmlkj
No
nmlkj
If so, how?
Yes
nmlkj
No
nmlkj
If not, what in your opinion was lacking?
kromans
Typewritten Text
53

5. Did your experience with SMART Growth help you think more strategically about the 7 management areas?
*
6. Was your experience with SMART Growth helpful to your board?*
7. Was your experience with SMART Growth helpful to your staff?*
8. Did your experience with SMART Growth help you learn how to identify meaningful outcomes and measures for your organization?
*
Yes
nmlkj
No
nmlkj
If so, provide some examples. If not, tell us why.
Yes
nmlkj
No
nmlkj
If so, provide some examples. If not, tell us why.
Yes
nmlkj
No
nmlkj
If so, provide some examples. If not, tell us why.
Yes
nmlkj
No
nmlkj
If so, provide some examples. If not, tell us why.
kromans
Typewritten Text
kromans
Typewritten Text
54

9. Were you able to find ways to track your progress easily?*Yes
nmlkj
No
nmlkj
Why or why not?
kromans
Typewritten Text
55

11. Grantmaking Scope
1. Was it helpful for your organization to get general operating grants from the SMART Growth program rather than grants for specific activities?
*
2. Has the three-year time frame for this project been appropriate? *
3. How would a longer or shorter time frame have affected your progress?
*
4. Why was it important or not to have the Chicago Community Trust’s commitment to three years of funding?
*
Yes
nmlkj
No
nmlkj
Why or why not?
Yes
nmlkj
No
nmlkj
kromans
Typewritten Text
56

12. Monitoring/Data Collection
1. Did your experience with SMART Growth help you learn how to track income, attendance and other key data?
*
2. Was this experience helpful and will you keep tracking key data and use it to assess your organization?
*
3. Our organization fully utilized the SMART Growth method of setting outcomes and measures annually and tracking progress throughout the year.
*
4. Are you likely to continue to use this model in future years?*
Yes
nmlkj
No
nmlkj
Disagree
gfedc
Agree somewhat
gfedc
Agree strongly
gfedc
Completely agree
gfedc
Describe to what extent your organization followed the SMART Growth method of planning and tracking.
Yes
nmlkj
No
nmlkj
kromans
Typewritten Text
57

13. Impact on the Grantee Organizations
1. Did SMART Growth change your understanding of ways to manage an arts organization?
*
2. To what extent did SMART Growth help make your organization more sustainable?
*
3. What are examples of how SMART Growth affected your sustainability?
*
4. What impact did participation in the SMART Growth program have on your board of directors? Please describe any changes.
*
5. How will SMART Growth continue to affect your organization in the future?
*
Yes
nmlkj
No
nmlkj
If so, please describe this change.
kromans
Typewritten Text
58

14. Additional Feedback
1. Please share any additional thoughts or comments.
2. All information will be kept confidential. However, to assist us in clarifying any questions regarding your survey, we ask that you please provide us with the following contact information.Name
Organization
Phone
kromans
Typewritten Text
59

60
Appendix II
SMART Growth Grantee List
African American Arts Alliance of Chicago Albany Park Theater Project American Theater Company Anchor Graphics Barrel of Monkeys Changing Worlds Chicago Chamber Musicians Chicago Dramatists Chicago Human Rhythm Project Chicago Jazz Ensemble Chicago Jazz Orchestra Chicago Public Art Group Congo Square Theatre Emerald City Theatre Company House Theatre Hypocrites Theatre Independent Feature Project Intuit: The Center for Intuitive and Outsider Art Jazz Institute of Chicago Joel Hall Dancers and Center Jump Rhythm Jazz Project Lifeline Theatre Links Hall Luna Negra Dance Theater Muntu Dance Theatre Natya Dance Theatre Neighborhood Writing Alliance Neo-Futurists Next Theatre Puerto Rican Arts Alliance Remy Bumppo Theatre Company Rush Hour Concerts at St. James Cathedral Shanti Foundation for Peace ShawChicago Theatre Company Silk Road Theatre Project South Chicago Art Center Teatro Vista…Theater with a View TimeLine Theatre Company TUTA: The Utopian Theatre Asylum Young Chicago Authors

61
Appendix III
SMART Growth Evaluation Interview List
Chicago Community Trust Program Staff:
Suzanne Connor, Senior Program Officer, Arts and Culture
Kassie Davis, former Senior Program Officer, Arts and Culture
Anita Alexander, Program Officer, Arts and Culture
Karen-Jo Mensch, Senior Administrative Assistant
Grantee Staff:
Ryan Butts, Director of Planning and Development, The House Theatre of Chicago
Heidi Thompson Saunders, former Executive Director, Barrel of Monkeys
A. Alyce Claerbaut, Executive Director, Chicago Jazz Orchestra Association
Joanna Naftali, Managing Director, Luna Negra Dance Theater
Mark Rodriguez, Executive Director, Changing Worlds

62
Appendix IV
SMART Growth Common Outcomes and Measures
Management Area Outcome Measures
Concept Development and Planning
Succession for the Artistic Director has been discussed by the Board. A strategic plan exists for 2-3 years.
A current strategic plan has been approved by the Board and progress is monitored annually by the Board.
A Board approved business plan exists for implementation of the artistic and programmatic elements of the strategic plan.
Staffing & Organizational Structure
A staffing structure and performance management system for paid staff exists
An organizational chart and position descriptions for all paid staff are up to date.
Annual performance goals for paid staff exist and are evaluated annually.
Management staff pursues professional development opportunities.
Board Governance Board governance capacity is strengthened
FY09 number of Board members vs. FY05 number of Board members.
A Board member job description and orientation manual exists.
An annual Board fundraising goal is approved including a minimum annual Board member contribution
Income Generation Earned revenue dollars increase FY09 earned revenue $ vs. FY05 earned revenue $ & % change.-
Contributed income increases FY09 contributed income $ vs. FY05 contributed income $ and % change.
The individual donor base increases Number of individual donors FY09 vs. number of individual donors FY05 and % change –
Financial Management Financial management capacity increases
An annual operating plan and corresponding budget is approved by the Board.
An annual fundraising plan is approved by the Board.
Monthly financial statements are prepared and reviewed by the Board.

63
SMART Growth Common Outcomes and Measures Continued:
Management Area Outcome Measures
Audience Development and Marketing
Audience development is prioritized through implementation of a marketing plan
A marketing plan is developed and updated annually.
The audience increases FY09 audience vs. FY05 audience & % change – audience numbers (ticket buyers) have increased
Current core audience demographic data is measured and analyzed.
Baseline measurement is established in 2006 and measured annually
Facilities Only organizations with sufficient financial and management capacity acquire their own building.
Monitor capital plans and building acquisition.

64
Appendix V
SMART Growth Evaluation Comprehensive Results
I Summary of Common Themes from Responses to Survey Qualitative Questions
Process Questions: P1 Did your initial proposal closely reflect your smARTscope assessment report? Why or why
not?
95% Yes 5% No
Common Themes (from among 27 yes responses):
26% felt the SmARTscope assessment helped them to identify lagging areas 22% felt the SmARTscope process strengthened their awareness of already existing
issues and helped them to prioritize. 19% felt the smARTscope assessment was accurate and therefore they used it as their
basis for the proposal. 15% The SmARTscope assessment provided a helpful guide to completing the
application; providing a basis for establishing goals. P2 Describe your organization’s experience in developing the original and subsequent renewal
SMART Growth proposals.
Common Themes (among 33 responses) 33% a tool for planning, tracking, staying focused 27% a valuable way to engage the board in planning, goal setting, etc. 9% thought it was a challenge to work with their board on this 24% described the process as straightforward; these were groups who also mentioned
having a strategic plan or planning process is place 15% began in a straightforward manner and then become more difficult in subsequent
years due to internal and external factors 12% stated the entire process was difficult and confusing 3% found the process to go from difficult to easier as they became aware of the process
and CCT expectations. P3 Was it challenging for your organization to prepare the proposal each year? If so, how?
Common Themes (among 34 responses)

65
56% (19) No; reasons sited for its ease centered on the initial assessment and methodology which they felt was clear and easy to maintain.
45% (15) Yes o 18% (6) sited turnover among staff and board, or lack of sufficient staffing o 9% (3) mentioned the process as too time consuming (3X) – relates I think to
the above answers o 9% (3) sited CCT- related issues (i.e., staff turnover; inconsistencies in message
and reporting forms as well as the online application process o 3% (1) found the new rubric difficult to understand o 3% (1) mentioned the lack of alignment between SMART growth priorities and
the organization’s priorities.
P4 Did you receive enough assistance from The Chicago Community Trust staff and smARTscope consultants along the way? If not, what in your opinion was lacking?
Common Themes (35 responses)
17% (6) No o 2 sited the desire for more learning opportunities sponsored by CCT o 3 (2 no/1yes) sited the lack of consulting support into years 2 and 3 as
disappointing
83% (29) Yes
P5 Did your experience with SMART Growth help you think more strategically about the 7 management areas? If so, provide some examples. If not, tell us why.
Common Themes (35 responses)
3% (1) No (did not respond why.)
97% (34) Yes o 26% (9) sited a greater shared awareness both at the board and staff levels
regarding the organization’s position and needs o 23% (8) said the process provided them with greater focus o 21% (7) described the process as providing them with a clear road map or guide
to follow from one year to the next P6 Was your experience with SMART Growth helpful to your board? If so, provide some
examples. If not, tell us why.
Common Themes (35 responses) 14% (5) no
o 6% (2) sited board turnover o 3% (1) board disbanded

66
o 3% (1) board was not involved/interested
86% (30) Yes o 23% (8) sited a direct correlation to board development initiatives underwritten
by the SMART Growth program. o 20% (7) sited improved focus and strategic thinking among board members o 17% (6) sited deeper and better quality of board engagement/practice o 9% (3) sited greater organizational awareness among board members o 6% (2) sited greater unity of vision among board members o 6% (2) sited the smARTscope assessment as being most beneficial to the board
rather than the SMART Growth grant methodology.
P7 Was your experience with SMART Growth helpful to your staff? If so, provide some examples.
If not, tell us why.
Common Themes (35 responses) 11% (4) no
o 3% (1) sited staff turnover o 3% (1) sited no staff o 3% (1) sited that they did not put the effort into having it filter down to staff
88% (31) Yes
o 49% (17) sited the framework “assessment/goal setting/tracking” as helpful o 14% (5) sited professional development/learning process o 14% (5) credited the program for engendering a better working relationship
among board and staff o 9% (3) sited the three year funding commitment o 6% (2) credited the program for engendering a unity of vision among staff and
board
P8 Did your experience with SMART Growth help you learn how to identify meaningful outcomes
and measures for your organization? If so, provide some examples. If not, tell us why.
Common Themes (35 responses) 9% (3) No
o 3% (1) felt that the process produced artificial outcomes and measure not meaningful to the organization.
o 3% (1) never integrated the practice beyond the proposal writing requirements
91% (32) Yes o 31% (11) stated that they developed their ability to identify meaningful
outcomes and measures o 31% (11) stated that it taught them to be more specific in setting more tangible
outcomes and measures

67
o 26% (9) stated that the practice had taught them to be more thoughtful in setting goals
o 9% (3) said yes but still found the process confusing P9 Were you able to find ways to track your progress easily? Why or why not?
Common Themes (35 responses) 11% (4) No
o 6% (2) sited insufficient staffing o 3% (1) sited lack of support from within the organization o 3% (1) sited lack of support from CCT
89% (31) Yes
o 37% (13) sited the practice (forced or learned) of requiring them to set quantifiable measures
o 14% (5) stated that they had taken this a step further by creating new internal systems
Grantmaking Scope Questions: G1. Was it helpful for your organization to get general operating grants from the SMART Growth
program rather than grants for specific activities? Why or why not?
Common Themes (35 responses) 3% (1) No; 6% (2) Qualified Yes
o all thought it may have forced more specific progress on outcomes/measures if it had been restricted in their use of the money
97% (34) Yes
o 46% (16) sited its flexibility o 31% (11) sited the necessity of general operating support to underwrite
administration/capacity building and staffing o 9% (3) commented on its rarity
G2&3. Has the three year time frame for this project been appropriate? How would a longer or
shorter time frame have affected your progress?
Common Themes (35 responses) 20% (7) No
o all sited the desire to have a longer timeframe; 5 years was mentioned by some to correlate with more standard strategic plans; some felt abandoned during this time of economic struggle;
80% (28) Yes
o 65% (23) sited that the timeframe allowed important time for growth

68
Note: 7 of these thought any longer would be less productive/efficient for a variety of reasons
o 29% (10) thought a longer timeframe would be better (5 or more); added to the above “no” votes that makes 17 or 49% who felt longer would be better.
Note:
o 6% (2) (one Yes; one No) mentioned the unrealistic expectation of CCT that significant growth would happen in three years and the organization could replace this support beyond the third year
G4. Why was it important or not to have the Chicago Community Trust’s commitment to three
years of funding?
Common Themes (35 responses) o 26% (9) sited the ability to plan o 14% (5) sited financial security o 14% (5) sited time for growth and implementation o 11% (4) sited staff stability o 11% (4) sited confidence building o 9% (3) sited time to transition to other sources of funding/revenue
Note:
o 9% (3) sited concern regarding the gap left in their funding Monitoring/Data Collection Questions: M1&2. Was this experience helpful and will you keep tracking key data and use it to assess your
organization?
Common Themes (35 responses) 43% (15) No (a qualified no….no to helpful; yes to tracking)
o all stated that they had been tracking certain things already and did not credit Smart growth for instituting any changes/improvements, they would continue with their ongoing level of tracking.
7% (20) Yes (not much detail given under the “yes” responses)
o 9% (3) stated they saw the benefits of tracking o 6% (2) identified themselves as groups who were already tracking before SMART
Growth but were investing more into tracking following SMART Growth o 3% (1) saw it as a learning opportunity for their board and staff
M3&4 Describe to what extent your organization followed the SMART Growth method of planning
and tracking. (a wide variety of responses; may relate to the wide range of organizational needs/level of development)

69
Common Themes (35 responses) 11% (4) Disagree
o 6% (2) not at all o 3% (1) only generally
34% (12) Agree somewhat
o 9% (3) sited using the method for certain management areas but not all o 6% (2) sited that they had introduced new methodologies o 6% (2) sited either board or staff utilizing it more effectively o 6% (2) sited staff transition
46% (16) Agree strongly
o 6% (2) sited board level interest in the methodology o 6% (2) sited the method having the greatest impact on financial planning o 6% (2) sited overall planning o 6% (2) sited the need to continue to improve tracking o 3% (1) stated they used the method widely throughout the organization o 3% (1) stated they used the method only for the SMART Growth grant
initiatives.
9% (3) Completely Agree o 3% (1) sited planning
Impact Questions: I1. Did SMART Growth change your understanding of ways to manage an arts organization? If so,
please describe this change.
Common Themes (35 responses) 23% (8) No
o 3% (1) staff turnover o 3% (1) smARTscope assessment was most helpful; not SMART Growth
methodology
77% (27) Yes ( a wide variety of responses; may relate to the wide range of organizational needs/level of development) o 17% (6) sited improved planning/looking ahead o 11% (4) awareness of how management tools can be helpful o 11% (4) increased professionalism among management practices o 9% (3) increased board engagement o 3% (1) improved evaluation o 3% (1) improved awareness about organizational development and key
organizational areas
I2. To what extent did SMART Growth help make your organization more sustainable?

70
Common Themes (35 responses) - 9% (3) felt they were no longer sustainable following the grant period
- 3% (1) felt that SMART Growth was not the reason they were more sustainable
88% (31) felt they were more sustainable. (there was a wide variety of responses;
may relate to the wide range of organizational needs/level of development) o 34% (12) sited the methodology itself o 20% (7) sited board growth and stronger board engagement o 11% (4) sited improvements in marketing o 11% (4) sited improvements in fundraising o 9% (3) sited the grant size and timeframe
I3. What are examples of how SMART Growth affected your sustainability?
Common Themes (34 responses) – wide variety of responses; “sustainability” means something different to each group and/or they were at very different places organizationally.
7% (2) restated that they were no longer sustainable following the grant cycle
24% (8) sited marketing developments 21% (7) sited the methodology 15$ (5) sited staffing/management developments 15% (5) sited leveraging other funding 12% (4) sited the size and timeframe of the grant award 12% (4) sited fundraising developments 9% (3) sited better financial management 7% (2) sited earned income development 7% (2) sited governance development 3% (1) sited leadership succession 3% (1) sited better planning
I4. What impact did participation in the SMART Growth program have on your board of directors? Please describe any changes.
Common Themes (34 responses) 6% (2) stated that the program had a minimal impact on their board 12% (4) stated that the program did not have an impact on their board at all (one
board has disbanded) 35% (12) sited a more motivated and engaged board 32% (11) sited stronger governance structures and practices 24% (8) sited board growth and transition 21% (7) sited greater organizational awareness and the board’s role within the
organization 21% (7) sited stronger board fundraising practices

71
I5. How will SMART Growth continue to affect your organization in the future?
Common Themes (34 responses) 8% (3) were unclear as to how it would continue to impact
53% (18) sited the methodology as providing on ongoing context for planning and
assessment 24% (8) sited the actual SG-sponsored initiatives developed over the three years
has continuing to impact the organization 3% (1) sited stronger board engagement
II Summary of Common Themes from Document Review Process
Did the initial proposal fully reflect the smARTscope report? If so, for how long?
Fully (100%) Partially (50-99%)
Partially (less than 50%)
0%
Y1 SmARTscope out/measures
11 29% 13 34% 9 24% 4 11%
Y 1 lagging management areas
7 18% 11 29% 12 32% 8 21%
Y2 SmARTscope out/measures
3 8% 19 50% 14 37% 4 11%
Y2 lagging management areas
6 16% 14 37% 14 37% 4 11%
Y3 SmARTscope out/measures
3 8% 11 29% 11 29% 15 39%
Y3 lagging management areas
6 16% 10 26% 13 34% 9 24%
Lagging Management Areas (times prescribed by SmARTscope Assessment:
1. Audience Development & Marketing – 23 2. Income Generation – 22 3. Board Governance – 12 4. Staffing & Structure – 10 5. Concept Development & Planning – 9 6. Financial Management – 6
Selecting SS outcomes/measures:
0% (0) focused “fully” or 100% all three years
2% (1) focused “fully” or 100% for two years in a row (2nd and 3rd yrs)
11% (4) selected to focus on lagging management areas 100% of the time (all three years)
18% (7) focused on lagging areas (100%) the first year

72
3% (1) chose not to focus on at least one lagging area all three years.
21% (8) chose not to focus on at least one lagging area in Y1; 7 chose a lagging area for Y2; 4 of those continued to select lagging area(s) in Y3.
8% (3) did not focus on a lagging area two out of the three years
11% (4) did not focus on a lagging area one out of three years How many management areas were selected to focus upon?
Over the three years; 40 groups selected 7 management areas a total of 169 times over three year grant period.
Majority (89%) focused on 3 or more areas over three years.
8% (3) selected 6 areas over 3 years
35% (14) selected 5 areas (majority)
33% (13) selected 4 areas (majority)
21% (9) selected 3 areas
3% (1) selected 2 areas (minority) Management Area breakdown:
BG – 88% (35) focused at least once….(69 times) (majority)
IG – 83% (33) focused at least once…(67 times) (majority)
ADM – 77% (31) focused at least once…(60 times)
SS – 70% (28) focused at least once…(52 times)
FM – 45% (18) focused at least once…(30 times)
CD&P – 40% (16) focused at least once during the three year cycle (24 times overall)
Facility – 20% (8) groups focused at least once (16 times) (minority choice)
Board Governance, Income Generation and Audience Development and Marketing were the most common areas for groups to focus upon of the 7 management areas. 77% or more chose these areas
Facilities was the least selected management area.
Were the funds used to support the stated goals/outcomes?
Year 1:
90% (36) used the funding for the stated outcomes (majority)
10% (4) did not use the funding for the stated outcomes Year 2:
87% (35) used the funding for the stated outcomes (majority)
13% (5) did not use the funding fot the stated outcomes Year 3:
83% (33) used the funding for the stated outcomes (majority)
17% (7) did not use the funding for the stated outcomes The majority of grantees used the funding to support the stated goals/outcomes each year (between 83% and 90%)

73
The percentage of grantees not using the funding to support stated goals/outcomes increased each year by approximately 3%.
If so, what management areas were supported?
Management Areas selected by year and how many: 318 overall selections
Concept Development and Planning
Board Governance
Financial Management
Income Generation
Audience Development & Marketing
Staffing & Structure
Facilities
Year 1
9 23 12 24 19 20 4
Year 2
7 25 10 25 23 16 7
Year 3
8 21 8 18 18 16 5
Total 24 69 30 67 60 52 16
The majority of grantees focused on Board Governance; Income Generation and Audience Development & Marketing (supporting 195 projects out of 318 overall (61%)
If not, what were the uses?
8% (3) did not use the funding for stated outcomes consistently
18% (7) did not use the funding for stated outcomes at least once over two years Of those who did not use the funds for stated outcomes, the reasons stated included:
50% (5) staff turnover/leadership transition
10% (1) unexpected opportunities
40% (4) rationale unclear from reports Did the grantees utilize the outcomes and measures as a means of tracking their own progress?
Yes No Unknown
Y1 35 87% 5 13% 0 0%
Y2 33 82% 7 18% 0 0%
Y3 33 83% 3 7% 4 10%
If not, why?
42% (5) of those not tracking were due to staff/board turnover
42% (5) unable to detect from reports
8% (1) organizational deficit took focus off stated measures
8% (1) of those not tracking were due to unexpected opportunity
How successful were they at achieving their stated outcome/measures?
Fully (100%) Partially (99-51%)
Partially (50%-1%)
0% unknown

74
Y1 3 8% 18 45% 15 38% 4 10% 0 0%
Y2 7 18% 15 38% 10 25% 8 20% 0 0%
Y3 5 13% 10 25% 14 35% 7 43% 4 10%
NOTES:
8 groups sited staff and/or board turnover as rationale for not meeting measures
8 groups sited the economic downturn as rationale for not meeting measures in Y3
12 groups showed significant progress made on unmet measures however; they did not “attain” the measure due to faulty or problematic measure; timeline too restrictive; etc.
The logic model system appears to have been less effective with groups that had limited/revolving or no staffing – overall these groups appeared less adept at tracking; evidenced more assistance from CCT staff in conforming to application/program requirement throughout the three years; and did not demonstrate institutional learning with regard to the use of a logic model system for planning and growth.

75
Appendix VI
Recommended SMART Growth Data Collection Guide
SMART Growth Logic Model of overall theory of change Outcome Measures Data Collection Method
The SMART Growth logic model methodology is utilized as a tool to improve management.
Grantee proposals identify specific outcomes and measures
Grantees achieve more than 50% of their identified measures annually
Application, interim report, final report.
SMART Growth Logic Model of Common Outcomes and Measures Management Area Outcome Measures Data Collection Method
Concept Development and Planning
Succession for the Artistic Director has been discussed by the Board. A strategic plan exists for 2-3 years.
A current strategic plan has been approved by the Board and progress is monitored annually by the Board.
A Board approved business plan exists for implementation of the artistic and programmatic elements of the strategic plan.
Grantee Beginning and Exit Survey
Staffing & Organizational Structure
A staffing structure and performance management system for paid staff exists
An organizational chart and position descriptions for all paid staff are up to date.
Annual performance goals for paid staff exist and are evaluated annually.
Management staff pursues professional development opportunities.
Grantee Beginning and Exit Survey
Board Governance Board governance capacity is strengthened
FY-end number of Board members vs. FY-previous number of Board members.
A Board member job description and orientation manual exists.
An annual Board fundraising goal is approved including a minimum annual Board member contribution
Grantee Beginning and Exit Survey
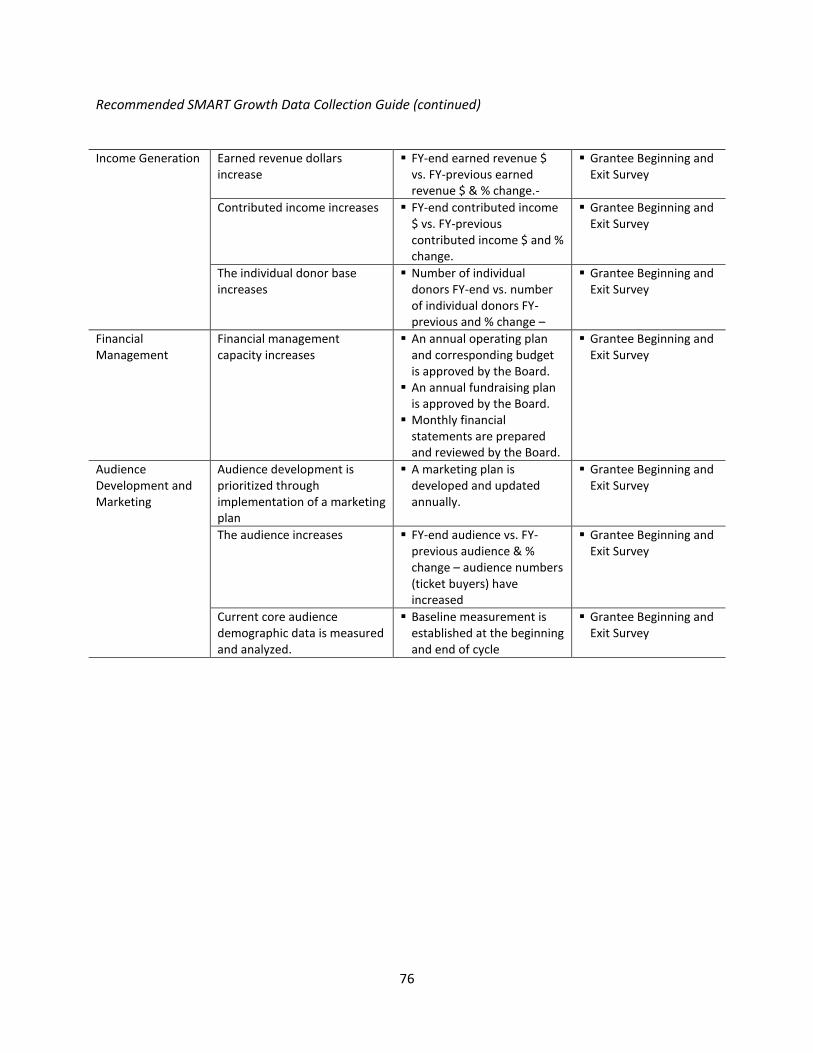
76
Recommended SMART Growth Data Collection Guide (continued) Income Generation Earned revenue dollars
increase FY-end earned revenue $
vs. FY-previous earned revenue $ & % change.-
Grantee Beginning and Exit Survey
Contributed income increases FY-end contributed income $ vs. FY-previous contributed income $ and % change.
Grantee Beginning and Exit Survey
The individual donor base increases
Number of individual donors FY-end vs. number of individual donors FY-previous and % change –
Grantee Beginning and Exit Survey
Financial Management
Financial management capacity increases
An annual operating plan and corresponding budget is approved by the Board.
An annual fundraising plan is approved by the Board.
Monthly financial statements are prepared and reviewed by the Board.
Grantee Beginning and Exit Survey
Audience Development and Marketing
Audience development is prioritized through implementation of a marketing plan
A marketing plan is developed and updated annually.
Grantee Beginning and Exit Survey
The audience increases FY-end audience vs. FY-previous audience & % change – audience numbers (ticket buyers) have increased
Grantee Beginning and Exit Survey
Current core audience demographic data is measured and analyzed.
Baseline measurement is established at the beginning and end of cycle
Grantee Beginning and Exit Survey


