SMART GRID IN THE USA - AHK USA-Chicago
20
GACC - 2011 1 April 5, 2011 Hannover, Germany Organized by the German American Chamber of Commerce of the Midwest (AHK USA – Chicago) Part of the Export Initiative for Energy Efficiency, supported by the German Federal Ministry of Economics and Technology on the basis of a decision by the German Parliament. SMART GRID IN THE USA
Transcript of SMART GRID IN THE USA - AHK USA-Chicago

GACC - 2011 1
April 5, 2011Hannover, Germany
Organized by the German American Chamber of Commerce of the Midwest (AHK USA – Chicago)
Part of the Export Initiative for Energy Efficiency, supportedby the German Federal Ministry of Economics andTechnology on the basis of a decision by the GermanParliament.
SMART GRID IN THE USA

GACC - 2011 2GACC - 2011 2GACC - 2011 2
Important OrganizationsTransmission and Distribution
InfrastructureRole of Renewable EnergyGovernment Initiatives
AGENDA

GACC - 2011 3GACC - 2011 3GACC - 2011 3
• US Department of Energy (DOE)– Office of Electricity Delivery and Energy Reliability (OE)– Office of Energy Efficiency and Renewable Energy (EERE)
• Federal Energy Regulatory Commission (FERC)• North American Electric Reliability Corporation (NERC)• Public Service Commissions (PSC) / Public Utility
Commissions (PUC)• National Institute for Standards and Technology (NIST)• American National Standards Institute (ANSI)• Electric Power Research Institute (EPRI)• National Renewable Energy Laboratory (NREL)
IMPORTANT ORGANIZATIONS

GACC - 2011 4GACC - 2011 4GACC - 2011 4
THE US ELECTRICAL GRID
Source: FERC

GACC - 2011 5GACC - 2011 5GACC - 2011 5
• 160,000 mi (257,500 km) of transmission lines between power plants (generation) and substations. Including distribution, over 300,000 mi.
THE US TRANSMISSION NETWORK
Source: http://teeic.anl.gov/er/transmission/restech/dist/index.cfm

GACC - 2011 6GACC - 2011 6GACC - 2011 6
There are 3 distinct power grids, or interconnections in North America:– Eastern
Interconnection– Western
Interconnection– ERCOT
Interconnection
THE US ELECTRICAL GRID
Source: http://www.ferc.gov/industries/electric/indus-act/reliability/blackout/ch1-3.pdf

GACC - 2011 7GACC - 2011 7GACC - 2011 7
REGIONAL RELIABILITY COUNCILS
Source: http://www.ferc.gov/industries/electric/indus-act/reliability/blackout/ch1-3.pdf

GACC - 2011 8GACC - 2011 8GACC - 2011 8
• Regional Transmission Organizations (RTO)
• Independent System Operators (ISO)
SYSTEM OPERATORS IN NORTH AMERICA
Source: http://www.ferc.gov/industries/electric/indus-act/rto.asp

GACC - 2011 9GACC - 2011 9GACC - 2011 9
DEREGULATION BY STATES
Source: http://www.quantumgas.com/list_of_energy_deregulated_states_in_united_states.html

GACC - 2011 10GACC - 2011 10GACC - 2011 10
210 investor-owned electric utilities– 38% of utility installed capacity– 42% of generation– 66% of sales– 67% of revenue in the United States– about 100 million ultimate consumers: ~ 71% of the total
2,009 publicly-owned electric utilities– 9% of generating capability– 8% of generation– 15% of retail sales– 13% of revenue.
OVER 3,273 TRADITIONAL ELECTRIC UTLITIES
Source: http://www.eia.doe.gov/cneaf/electricity/page/prim2/toc2.html

GACC - 2011 11GACC - 2011 11GACC - 2011 11
883 consumer-owned rural electric cooperatives– owned by their members (i.e., the consumers they serve)– ~4 % of generation and generating capability– ~10 % of sales and revenue
9 Federal electric utilities
~1,738 nonutility power producers(incl CHP, small renewable energy producers up to 80 MW, and independent power producers)
OVER 3,273 TRADITIONAL ELECTRIC UTLITIES, CONT’D
Source: http://www.eia.doe.gov/cneaf/electricity/page/prim2/toc2.html

GACC - 2011 12GACC - 2011 12GACC - 2011 12
• US Average retail Electricity price, 2008 9.74 USD-cents/kWh
#1 Hawaii – 29.20 cents/kWh#2 Connecticut - 17.79
#50 Wyoming - 5.67#51 West Virginia - 5.61
• Germany 2008 - 21.65 Euro cents/kWh (private households) In 2011 - 24.95
• Note: US is total retail sales, Germany is residential customers.Source: http://www.eia.gov/cneaf/electricity/st_profiles/us.html
ENERGY PRICES

GACC - 2011 13GACC - 2011 13GACC - 2011 13
RENEWABLE ENERGY IN THE USA
GACC - 2011 14GACC - 2011 14GACC - 2011 14
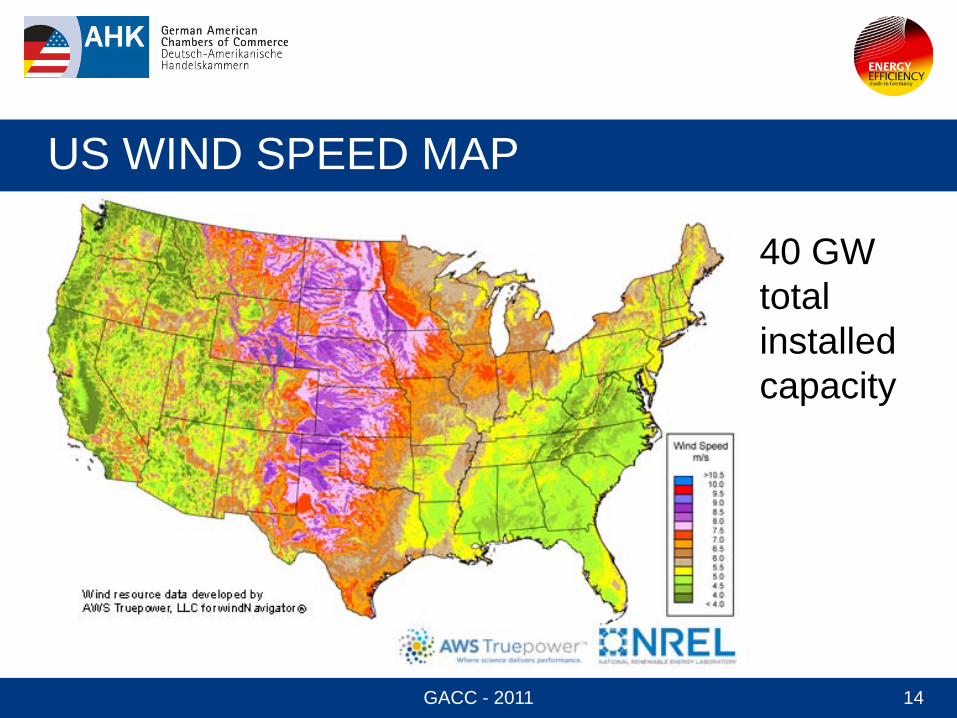
US WIND SPEED MAP
40 GW total installed capacity

GACC - 2011 15GACC - 2011 15GACC - 2011 15
THE US TRANSMISSION NETWORK
Source: http://teeic.anl.gov/er/transmission/restech/dist/index.cfm

GACC - 2011 16GACC - 2011 16GACC - 2011 16
• 10 states got 42%, or $1.9 billionCalifornia ($303.4 million)Colorado ($24.1 million)Florida ($467.2 million)Massachusetts ($28.29 million)New Jersey ($212.4 million)New York ($232.2 million)North Carolina ($403.5 million)
GOVERNMENT PROGRAMS American Recovery and Reinvestment Act (ARRA)
provided $4.5 billion
Ohio ($142.4 million)Pennsylvania ($466.3 million)Texas ($285.6 million)Source: http://www.smartplanet.com/businessblog/smart-takes/top-10-states-leading-us-smartgrid-deployment/9399/
• $1.005 billion paid out by March 25, 2011
Source: http://www.oe.energy.gov/DocumentsandMedia/11_OE_Recovery_ARRAImplementStat.pdf

GACC - 2011 17GACC - 2011 17GACC - 2011 17
Smart Grid Investment Grant Program• Up to 50% of cost for projects with immediate
commercial use
Smart Grid Demonstration Program• Up to 50% of cost for projects examining emerging
technologies
Smart Grid Workforce Training and Development • $100 million for 54 projects: to develop training
programs, and to train workforce
ARRA FUNDING AREAS
Source: http://www.smartgrid.gov/projects

GACC - 2011 18GACC - 2011 18GACC - 2011 18
• Support NREL with development and testing of the IEEE 1547 Series of Standards
• Support the Pacific Northwest National Laboratory and the GridWiseArchitecture Council to identify areas for standardization
• Support public/private partnerships such as the GridWise Alliance and the Grid Modernization Collaborative to coordinate and collaborate on smart grid development.
• Also projects such as VERDE: visualizing energy resources dynamically on earth, with Oak Ridge National Lab; IntelliGrid with EPRI, Smart Grid Interoperability Panel with NIST
DOE ACTIVITIES
Source: http://www.oe.energy.gov/smartgrid_02.htm

GACC - 2011 19GACC - 2011 19GACC - 2011 19
Architecture & Communication Standards• for interoperability, also with legacy systems
Monitoring & Load Management Technologies• including fault detection & prediction, monitoring & control of loads
for demand side management
Advanced Components & Operating Concepts• Interconnection technologies, substation and equipment
advancements, advanced system operating concepts
Modeling & Simulation• Planning and operational support for contingencies and disturbance
events
DOE FOCUS AREAS

GACC - 2011 20GACC - 2011 20GACC - 2011 20
Superconducting power cablesEnergy storageAdvanced sensors
TECHNOLOGY NEEDS