Smart Grid Advanced Metering Annual Implementation...
37
Smart Grid Advanced Metering Annual Implementation Progress Report Submitted by: Commonwealth Edison Company April 1, 2013
Transcript of Smart Grid Advanced Metering Annual Implementation...

Smart Grid Advanced Metering Annual Implementation
Progress Report
Submitted by: Commonwealth Edison Company
April 1, 2013

i
Table of Contents I. Introduction and Overview ..................................................................................................... 1
II. AMI Operational Deployment ................................................................................................ 3
A. 2012 Activities and Accomplishments ............................................................................. 3
1. Procurement .................................................................................................................. 3
2. Project Management Office .......................................................................................... 5
3. AMI Deployment .......................................................................................................... 6
4. AMI Operations ............................................................................................................ 6
5. Customer Experience .................................................................................................... 7
6. AMI Information Technology ...................................................................................... 7
7. Business Transformation .............................................................................................. 7
B. 2013 Activities and Goals ................................................................................................ 8
1. Procurement .................................................................................................................. 8
2. Project Management Office .......................................................................................... 8
3. AMI Deployment .......................................................................................................... 8
4. AMI Operations ............................................................................................................ 9
5. Customer Experience .................................................................................................... 9
6. AMI IT .......................................................................................................................... 9
7. Business Transformation ............................................................................................ 10
C. Budget Update ................................................................................................................ 10
III. Customer Applications....................................................................................................... 11
A. 2012 Activities and Accomplishments ........................................................................... 11
1. Peak Time Rebate ....................................................................................................... 11
2. Web Portal .................................................................................................................. 11
3. Technology and Customer Research .......................................................................... 12
B. 2013 Activities and Goals .............................................................................................. 12
1. Peak Time Rebate ....................................................................................................... 12
2. Web Portal .................................................................................................................. 12
3. Technology and Customer Research .......................................................................... 12
IV. Customer Outreach and Education .................................................................................... 13
A. 2012 Activities and Accomplishments ........................................................................... 13
1. Initial Customer Education and Awareness ................................................................ 13
2. Research Developed Messaging ................................................................................. 14

ii
3. Audience Segmented Customer Education and Awareness ....................................... 15
4. Financial Assistance ................................................................................................... 16
B. 2013 Activities and Goals .............................................................................................. 17
1. Initial Customer Education and Awareness ................................................................ 17
2. Research Developed Messaging ................................................................................. 17
3. Audience Segmented Customer Education and Awareness ....................................... 18
4. Financial Assistance ................................................................................................... 18
V. Metrics and Milestones ......................................................................................................... 19

1
I. INTRODUCTION AND OVERVIEW
ComEd presents this Annual Implementation Progress Report (“Report” or “AIPR”) of its Smart Grid Advanced Metering Infrastructure (“AMI”) Deployment Plan (“AMI Plan” or “Plan”) to the Illinois Commerce Commission (“Commission” or “ICC”). ComEd’s original proposed AMI Plan was filed on April 23, 2012 in ICC Docket No. 12-0298. The Commission entered an Order approving ComEd’s AMI Plan with certain modifications on June 22, 2012 in ICC Docket No. 12-0298 (“June 2012 Order”). ComEd filed a modified AMI Plan in compliance with the June 2012 Order on July 13, 2012 (“Modified AMI Plan”). On October 3, 2012, ComEd submitted a Revised AMI Plan on rehearing in ICC Docket No. 12-0298 (“Revised AMI Plan”). The Revised AMI Plan was approved by the Commission in its Order on Rehearing in ICC Docket No. 12-0298 dated December 5, 2012 (“December 2012 Order”).
This Report summarizes the activities and achievements accomplished in 2012 and the activities and goals planned for 2013 in the areas of AMI Operational Deployment, Customer Applications, Customer Outreach and Education, and Metrics and Milestones.1 There are three numerical attachments to this Report that are referenced in the Metrics and Milestones section. Additionally, there are two appendices to this Report. Appendix A addresses issues and topics beyond those specified for this Report in Section 16-108.6(e) of the Public Utilities Act (“PUA”), 220 ILCS 5/16-108.6(e), that the Commission directed ComEd to submit with this Report in its June 2012 Order, and Appendix B contains ComEd’s Analysis of Accelerated Deployment Schedules as directed by the Commission in its December 2012 Order.
Operational Deployment
In 2012, ComEd’s AMI team accomplished several project activities in the Operational Deployment area, including: (1) the evaluation and selection of key professional service providers and technology solutions; (2) the establishment of a Project Management Office (“PMO”) under the direction of the AMI Program Director, which will be responsible for providing management and oversight to the AMI Program; (3) the development of plans and strategies for the full service territory AMI deployment that will begin in 2015; (4) the implementation of high-priority system enhancements and business process redesigns that focus on the deployment and operation of additional AMI meters and the development of core business processes.
In 2013, the AMI team plans to complete a number of operational objectives, including: (1) initiate the technical architecture and Meter Data Management System (“MDMS”) replacement work; (2) ramp-up business process design work; (3) continue the planning of field deployment and cross dock operations; (4) complete the implementation of system enhancements and processes to continue the improvement of pilot system operations; and (5) continue the piloting of data analytics tools and processes to improve the effectiveness of revenue protection and the pilot system operations.
1 This Report refers to various systems, standards, groups, teams, organizations, and processes described in
more detail in the AMI Plan. While acronyms used in this Report are defined when introduced, readers can refer to the AMI Plan for more detailed information and background on such terms and acronyms.

2
Customer Applications
In 2012, the AMI team also accomplished a number of key Customer Applications activities, including: (1) the development of the Peak Time Rebate (“PTR”) program; (2) providing provisional access for all residential customers to the web portal that securely provides them with their detailed account information; and (3) the completion of research regarding technologies enabled by Smart Grid that could directly touch customers as well as the development of a partnership with Whirlpool Corporation (“Whirlpool”) in support of the proposed regional launch of Smart Appliances in ComEd’s service territory. The AMI team has a number of Customer Applications goals planned for 2013, including: (1) the development of technology research on Direct Load Control (“DLC”) devices in preparation for a 2014 DLC pilot; (2) the commencement of design work on the web portal to provide customers with increased access; and (3) the renewal of technology research and continuance of the partnership with Whirlpool.
Customer Outreach and Education
In 2012, the AMI team conducted Customer Outreach and Education programs related to AMI and its associated benefits, including: (1) the provision of general information to customers in order to educate them regarding the uses and benefits of smart meters through programs such as the Smart Youth Ambassador Program and ComEd.com; (2) the research-driven development of a staged messaging program intended to provide customers with general information and education in a timely manner; (3) the customization of education programs to fit specific customer segments as identified by demographic data; and (4) the development of financial assistance programs, also known as ComEd’s CARE programs, designed to assist low-income customers with the payment of their utility bills. The AMI team has a number of goals for 2013 related to the development of Customer Outreach and Education programs, including: (1) the continuing focus on general customer education and an effort to provide information on the use and benefits of smart meters; (2) the use of the staged messaging system to provide information to customers related to the smart grid and smart meters, CARE programs, and energy efficiency; (3) the development of staged messaging to utilize direct mail and community events; (4) the on-going customization of education programs to fit specific customer segments as identified by demographic data; and (5) the on-going development of financial assistance programs designed to assist low-income customers.
Consultation with Smart Grid Advisory Council (“SGAC”)
As required by Section 16-108.6(e) of the PUA, 220 ILCS 5/16-108.6(e), ComEd consulted with the SGAC regarding this AIPR. ComEd provided a complete draft of the AIPR to the SGAC in advance of its March 14, 2013 meeting. ComEd also made a presentation on its AIPR at that meeting, and personnel were present that were knowledgeable on each relevant subject. The SGAC offered no written or formal comments on the AIPR or Appendix B thereof, but suggested that it would provide a draft statement of advisement regarding ComEd’s analysis of a Time-Of-Use rate in Appendix A to the Report. ComEd received that statement on Friday, March 29, 2013 via email at 11:57 a.m. and it is discussed further in Appendix A.
3
AMI Plan Revisions
As a result of the meetings ComEd held with stakeholders regarding vulnerable customers as described in Appendix A to this Report, ComEd has made some minor edits to the AMI Plan regarding the definition of vulnerable customers. These edits are contained in the Updated AMI Plan that was filed with this Report.
II. AMI OPERATIONAL DEPLOYMENT
A. 2012 Activities and Accomplishments
The following section highlights the project work that was accomplished by the AMI team in 2012. This includes key activities in the areas of Procurement, the Project Management Office, AMI Deployment, AMI Operations, Customer Experience, Information Technology (“IT”) and Business Transformation (“BT”). These areas are defined in the subsections below.
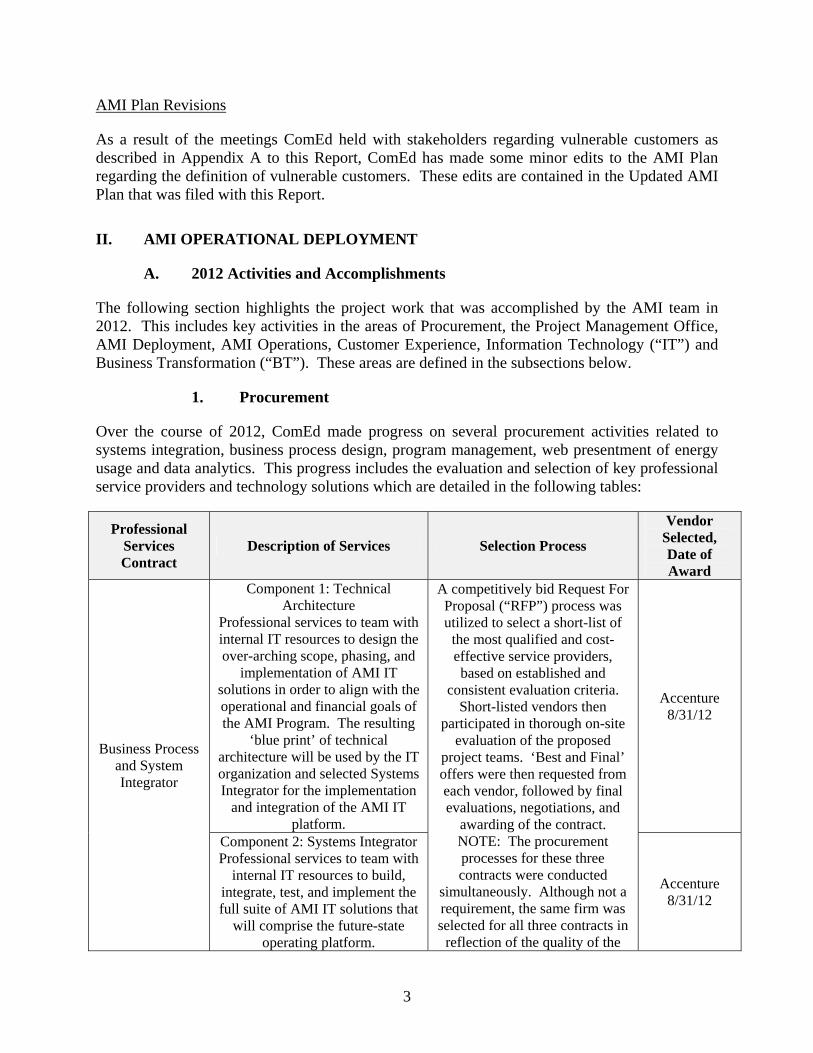
1. Procurement
Over the course of 2012, ComEd made progress on several procurement activities related to systems integration, business process design, program management, web presentment of energy usage and data analytics. This progress includes the evaluation and selection of key professional service providers and technology solutions which are detailed in the following tables:
Professional Services Contract
Description of Services Selection Process
Vendor Selected, Date of Award
Business Process and System Integrator
Component 1: Technical Architecture
Professional services to team with internal IT resources to design the over-arching scope, phasing, and
implementation of AMI IT solutions in order to align with the operational and financial goals of the AMI Program. The resulting
‘blue print’ of technical architecture will be used by the IT organization and selected Systems Integrator for the implementation
and integration of the AMI IT platform.
A competitively bid Request For Proposal (“RFP”) process was utilized to select a short-list of
the most qualified and cost-effective service providers, based on established and
consistent evaluation criteria. Short-listed vendors then
participated in thorough on-site evaluation of the proposed
project teams. ‘Best and Final’ offers were then requested from each vendor, followed by final evaluations, negotiations, and
awarding of the contract. NOTE: The procurement processes for these three contracts were conducted
simultaneously. Although not a requirement, the same firm was selected for all three contracts in
reflection of the quality of the
Accenture 8/31/12
Component 2: Systems Integrator Professional services to team with
internal IT resources to build, integrate, test, and implement the full suite of AMI IT solutions that
will comprise the future-state operating platform.
Accenture 8/31/12

4
Professional Services Contract
Description of Services Selection Process
Vendor Selected, Date of Award
Component 3: Business Process Redesign
Professional services to team with the BT team to analyze, assess,
and redesign the business processes impacted by the
deployment of AMI. The goal is to transform these business
processes to achieve financial metrics, deliver operational
efficiencies, improve the customer experience, make conditions safer for employees and customers, and fully leverage the new technology
to improve the way ComEd conducts business.
bids, familiarity with the AMI Pilot program, proposed synergy
of the three teams, and competitive pricing.
Accenture 8/31/12
Project Management Office (PMO)
Professional services to provide program management services. This includes management of
scope, schedule, budget, risks, and issues
A competitively bid RFP process was utilized to select a short-list of the most qualified and cost-
effective service providers, based on an established and
consistent evaluation criteria. Short-listed vendors then
participated in thorough on-site evaluation of the proposed
project teams. ‘Best and Final’ offers were then requested from each vendor, followed by final evaluations, negotiations, and
awarding of the contract.
West Monroe Partners, Deloitte 10/30/12
Technology Solutions
Description of Services Selection Process
Vendor Selected, Date of Award
Web Presentment Solution
An integrated web application that will provide customers with
access to energy usage information, including current and
historical usage, savings tips, neighbor comparisons, bill calculators, and other user-
friendly data. This application
A competitively bid RFP process resulted in the selection of a Web Presentment Tool after
detailed cost and scope negotiations with the vendor. Additionally, the selected tool had already proven to perform
well during the AMI Pilot.
Opower 4/30/12

5
Technology Solutions
Description of Services Selection Process
Vendor Selected, Date of Award
will provide customers with timely, detailed information they need to take ownership of their
energy usage behaviors and corresponding monthly costs.
EIMA Event Planning / Tracking
A supporting service to aid in the support of the event strategy, including the identification of
events and activities in specific communities, management of a calendar of events, creation of displays, interactive games and
engagement devices used at events, training for staff, and
providing measurable results and budget tracking.
A competitively bid process was conducted in early 2012,
resulting in the selection of an experiential event marketing vendor and the use of their
supporting tool for tracking and planning.
Ignition 3/15/12
Data Analytics Solution (Pilot)
Software and services to provide the ability to analyze meter data,
provide context to its meaning and implications, and report it
throughout the organization to improve decision making, identify
trends, and define and execute effective strategies.
A solution was chosen to operate within the AMI Pilot footprint after a thorough review of the
marketplace, including detailed research, vendor demonstrations,
and detailed cost negotiations. The solution selected also
allowed for synergy with ComEd affiliates Philadelphia Electric
Company (“PECO”) and Baltimore Gas and Electric
Company (“BG&E”), which selected the same system for
their data analytics solution. The results and value of the solution
will be evaluated prior to any larger-scale deployment and/or
spending.
Data Raker 8/15/12
2. Project Management Office
A key accomplishment during 2012 was the establishment of a Project Management Office, or PMO, under the direction of the AMI Program Director. This group is responsible for providing management and oversight of the AMI Program. This includes clear identification and management of scope, establishment and ongoing maintenance of the program schedule, and active management, reporting and analysis related to the overall budget. Additionally, the PMO is responsible for identification and mitigation of program risks and issues that occur over the course of project planning and execution.

6
Learnings from the AMI Pilot and previous project experience led to the creation of the AMI Steering Committee in 2012, consisting of cross-functional executives throughout ComEd that are impacted by the AMI deployment. This group meets regularly with the AMI PMO and project leadership to review project milestones, provide strategic guidance, and make decisions that impact the direction of the program. The AMI PMO also reports to the Energy Infrastructure Modernization Act (“EIMA”) PMO, which is the group responsible for program management across the scope of EIMA. Thus, the AMI PMO was also established as the key integration point for communication and coordination with EIMA PMO. Project updates, risks, and issues are also communicated by the AMI PMO to Executive-level committees within ComEd with overall EIMA oversight.
The PMO has contributed to the effective progress and integration of the workstreams within the AMI program. These workstreams provide regular updates and are evaluated based on their performance related to Scope, Schedule, Budget, Issues, Risks, and Resources. As of December 2012, all workstreams were deemed to be progressing as expected with all identified risks and issues being properly managed.
3. AMI Deployment
Throughout 2012, the AMI Deployment team continued to refine the plans for AMI deployment throughout ComEd’s service territory with AMI meter installations commencing in 2015. These updated plans addressed organization structure and size, field labor requirements and mix, cross dock operations, and meter installation methods and processes based on pilot learnings and best practices across the industry. A number of the significant planning refinements were: the optimal use of the handheld devices during meter installation; the method to improve both the quality and safety of the meter exchange addressing the meter installers themselves; and the customer-owned equipment.
4. AMI Operations
Throughout the year the AMI operations team, made up of business and IT personnel, gained valuable experience in the management and operation of the pilot system, and was able to improve operational performance. Business process and IT system functionality enhancements were completed, leveraging best practices and AMI Pilot lessons learned for the management, monitoring, and operation of AMI systems, such as how to optimize the performance of the field network, the work required to gain access to previously inaccessible locations, and how to more effectively utilize data analytics tools to manage operations.
Additionally, through collaboration with the IT team, enhanced reporting and monitoring capabilities were delivered resulting in more efficient trouble-shooting of network or meter performance issues, and improvements in meter read and billing rates. Lastly, IT functionality was delivered to enable the AMI Operations team to remotely re-program meters from the back office, rather than requiring a field visit. These improvements will benefit the full deployment and operation of the AMI system and will enable more effective utilization of resources.

7
5. Customer Experience
Improvement of the Customer Experience remained a focus for ComEd throughout 2012. A central point of contact for all escalated customer concerns regarding AMI was established. The design and implementation of a formal reporting process for all such concerns was also completed in order to actively and transparently manage contact with AMI customers. Additionally, roadshows and update presentations were conducted to help employees and customers understand smart meter technology, the program status, and future plans.
6. AMI Information Technology
In 2012 the AMI IT team focused on the planning, prioritizing, and implementing the high-priority system enhancements that were identified in the AMI Pilot as most critical to establishing the capability to deploy and effectively operate additional AMI meters. The AMI IT team delivered 24 business and IT requirements within four main focus areas, resulting in (1) improvement in meter deployment planning and forecasting; (2) a comprehensive redesign of the IT processes surrounding meter exchanges to avoid manual work-arounds; (3) an improved automated meter certification process; and (4) enhanced notifications and system settings for Customer Service Representatives to utilize. The team also continued to work on additional enhancements scheduled for completion in 2013, including the enablement of more complex meter exchanges, improvements to the customer rate change process, capturing GPS coordinates at multi-unit premises, and improved system reporting capabilities.
The AMI IT team also was a main participant in the competitive RFP process conducted for the System Integrator contract that was awarded in August of 2012. This participation included requirements identification for the RFP release document, evaluation of vendor responses, selection and subsequent participation in the short-list presentation process, contract negotiation, and eventual selection and contract awarding.
7. Business Transformation
Throughout 2012, the BT team focused on the core set of business processes that were identified as most critical for the commencement of meter deployment. The BT team worked with the business units to review the relevant processes using a standard utility operating model. Over 120 processes were reviewed with over 65 ComEd Subject Matter Experts. This resulted in a sub-set of process documentation and a prioritization of business processes to redesign and support deployment and enable functionality to achieve key operational and EIMA metrics. The business processes were then grouped into execution waves to be completed over the next three years.
Additionally, the BT team initiated the installation of a Business Process Repository tool for storage and maintenance of business process documentation, housed within the ComEd IT infrastructure. The work of the BT team will contribute to the ongoing effort to transform the organization through AMI technology and the supporting business processes.
The BT team was also a main participant in the competitive RFP process conducted for the Business Process Design Contract and System Integrator contracts that were awarded in August of 2012. This participation included requirements identification for the RFP release document,

8
evaluation of vendor responses, selection and subsequent participation in the short-list presentation process, contract negotiation, and eventual selection and contract awarding.
B. 2013 Activities and Goals
1. Procurement
Based on the planned deployment of meters in 2015 consistent with the Commission-approved Revised AMI Plan, no significant procurement activities are planned for 2013. However, procurement activities will potentially take place based on evolving strategy that reflects lessons learned and marketplace evolution. A company providing management consulting services will be hired to work with the AMI Deployment team to provide expertise, best practices, lessons learned, and strategic guidance to the Deployment planning process. This work includes planning for the next meter installation, design and execution of cross dock operations, and the development of a resource plan for meter installation.
Other potential areas for procurement include possible expansion of the Data Analytics tool, a Meter Events solution to validate and organize meter event data, a theft detection solution to process and organize meter data in support of reducing tampering activities, and professional services to assist in the documentation and redesign of the newly created processes used by the AMI Operations group. All of these solutions are included in the long-term vision for AMI, though the specific timing of the associated procurement remains flexible.
2. Project Management Office
The PMO will continue to operate the project team status reporting cycle, including dashboard and summary reporting. Regular communication with ComEd leadership and the broader organization will continue, utilizing the AMI Steering Committee and other EIMA governance processes, as will the PMO’s identification and mitigation of program risks and issues that occur over the course of project planning and execution. The PMO will continue to focus on the ongoing management of the projects’ scope, schedule, and budget throughout the course of the AMI deployment.
3. AMI Deployment
The focus in 2013 for the AMI Deployment team will be similar to that of 2012. This team will continue to refine the plans for full AMI deployment. A particular area of focus for the AMI deployment team will be to work with the selected meter deployment technical consultants on the labor strategy for meter installation, and to define the operating structure and key processes for the Cross Docks that will be used as the geographic hubs for full deployment. Additionally, consultants will review the deployment planning assumptions, and either validate or provide recommendations for improvement.
The AMI Deployment team will continue to provide input to the AMI IT and BT teams as subject matter experts for the business process design and IT system design and implementation work that is planned. The team will continue to leverage AMI Pilot learnings, such as the need to closely integrate the installation process with the AMI Operations team to ensure that proper hand-offs take place.

9
4. AMI Operations
The AMI operations team will maintain their focus on improving the health of the pilot system. This includes continuing to gain valuable experience and identifying and executing improvement opportunities in the monitoring of the existing Pilot footprint, and continuing the build-out and training of the team. The identification of core business process improvements and the establishment of formal documentation will also be a focus of the team as noted in the Procurement section above. Additionally, the AMI operations team will collaborate with the AMI IT and/or BT teams in the upgrade of the AMI head-end system, and the commencement of the MDMS implementation and business process re-design.
5. Customer Experience
Throughout 2013 the Customer Experience team will continue to act as the central point of contact for escalated AMI customer inquiries, and will drive the processes that actively manage related communications. Additionally, roadshows and update presentations will continue to be conducted to help employees and customers understand smart meter technology, the program status, and future plans.
6. AMI IT
The AMI IT work includes the completion of additional enhancements and improvements identified during the AMI Pilot. In the first quarter of 2013, the team plans to complete enhancements related to the enablement of more complex meter exchanges, improvements to the customer rate change process, capturing GPS coordinates at multi-unit premises, and improved system reporting capabilities.
Work on an additional set of IT enhancements will be initiated in 2013 and delivered in 2014. These enhancements are primarily tied to operational benefit realization (reduction in consumption on inactive meters, reduction in unaccounted for energy, reduction in the number of estimated bills, and reduction in bad debt) and improved functionality for the systems that support the meter deployment process. The AMI IT team will also be developing the technical architecture conceptual design for the systems platform that will support the full deployment of AMI.
A main area of focus for the team will be on the initiation of the work associated with the replacement of the MDMS. The current MDMS was sized for management of the data from AMI meters deployed during the pilot, and does not have the capacity to handle the full amount of AMI meters to be deployed. This limitation makes the implementation of a new MDMS of critical importance to the overall deployment timeline. A new MDMS must be in place and operational prior to the full ramp up of meter installation and certification. The work in 2013 associated with MDMS replacement includes gathering and refining the technical requirements, and initiating the associated implementation and system integration work. These work activities and the associated staffing levels will ramp up in the second half of 2013.
Finally, the AMI IT team will be completing an upgrade of the head-end operating system for the Silver Spring Networks AMI network. This upgrade will result in improved capabilities and functionality to support the full deployment of meters and ongoing operation of the AMI system.

10
7. Business Transformation
The BT team will grow and expand their business process design-related activities throughout 2013, along with coordinating and supporting the AMI IT work to be completed. Additionally, the team will continue with business and technical requirements gathering, and the overall prioritization and roll-out timing of business process work, which will drive the current and future state business process design work that will ramp up over the course of the year.
Their work will also include the completion and launch of the business process repository that will contain the AMI process documentation, and an assessment of ongoing technology and functionality needs, including the potential to expand the Pilot for the data analytics tool.
C. Budget Update
This section outlines the spend profile for the 10-year AMI deployment2. It compares the Capital and O&M projections noted within the Revised AMI Plan to the adjusted projections based on actual costs incurred in 2012, knowledge gained since the previous filing, and changes to some of the Capital and O&M cost components.
Capital Spend ($K)
20123 2013 2014 2015 2016 2017 2018 2019 2020 2021 TOTAL
Revised AMI Plan 1,415 8,613 44,449 163,983 178,959 163,344 136,551 102,258 81,088 64,239 944,899
Updated Budget 294 3,779 36,718 163,464 176,912 161,116 141,390 107,567 82,347 62,273 935,860
Variance 1,121 4,834 7,731 519 2,047 2,228 (4,839) (5,309) (1,259) 1,966 9,039
O&M Spend
($K) 2012
1 2013 2014 2015 2016 2017 2018 2019 2020 2021 TOTAL
Revised AMI Plan 23,259 22,785 29,828 36,122 42,712 45,084 50,527 54,935 54,436 60,246 419,934
Updated Budget 18,433 23,131 30,558 37,204 43,852 45,942 51,768 55,560 54,063 56,975 417,486
Variance 4,826 (346) (730) (1,082) (1,140) (858) (1,241) (625) 373 3,271 2,448
As noted in the tables above, the actual spend in 2012 and the total projected spend for the remaining years of the deployment period are slightly lower than what was included in the Revised AMI Plan. In addition, projected spend in certain future years is slightly higher than what was included in the Revised AMI Plan. These variances can be attributed to two factors: (1) the deferral of costs tied to the deferral of deployment, and (2) an adjustment made to the projected labor costs over the course of the deployment period.
Subsequent to preparation of the Revised AMI Plan, additional cost deferrals associated with the deferral of deployment until 2015 have been identified. These cost deferrals relate to services, equipment, materials, and tools that are not required prior to the deployment period. The resulting spend variances are timing-related and do not impact the overall projections.
2 As noted in the Revised AMI Plan, these costs exclude the sunk costs associated with the AMI Pilot, as
well as the costs associated with a Peak Time Rebate (“PTR”) program included in the PTR cost benefit analysis. 3 For the updated budgets for Capital and O&M, the 2012 values represent actual spend.

11
The reduction in spend over the 10-year deployment period is primarily attributed to an updated projection of labor costs for that time period. The number of required FTE’s did not change; rather the individual cost associated with each resource was adjusted. As ComEd continues to plan and execute the deployment, more current information will become available for budget refinement. The tables above have been updated to reflect the knowledge gained since the Revised AMI Plan was submitted, and represent a reduction in overall projected spend of less than 1%. It is reasonable to anticipate similar variances in the future, given the large and complex nature of the project.
It is important to note that while the actual spend in 2012 and the total spend over the 10-year period is less than what was previously projected, the planned 2012 scope of work was completed and there are no significant adjustments to the planned work for 2013 and beyond. The deployment will be executed as described in the Revised AMI Plan.
III. CUSTOMER APPLICATIONS
A. 2012 Activities and Accomplishments
1. Peak Time Rebate
In August 2012, pursuant to new Section 16-108.6(g) of the PUA, 220 ILCS 5/16-108.6(g), ComEd petitioned the Commission for approval of a proposed a Peak Time Rebate (“PTR”) program in ICC Docket No. 12-0484. This program was based on extensive secondary research of similar North American PTR programs, and previous ComEd customer pricing programs. Prior to August of 2012, ComEd reviewed the proposed PTR program with stakeholders and the Smart Grid Advisory Council (“SGAC”), and received feedback from those groups which ComEd incorporated into its filed PTR proposal. As will be discussed below, on February 21, 2013, the Commission entered an Interim Order approving the PTR program.
As required by the Commission’s June 2012 Order, ComEd performed a cost benefit analysis for PTR scenarios that included the use of Direct Load Control (“DLC”) devices during events that required curtailment of demand. ComEd included that study within its August 2012 filing.
In 2012, prior to the rescheduling of AMI deployment to 2015, ComEd began to perform solution analysis and requirements gathering to support a customer enrollment system that will include updates to the ComEd.com website, the automated phone system, and live agent call processes. The development of the customer enrollment system was paused upon the AMI deployment rescheduling.
2. Web Portal
In September 2012, ComEd provided all residential customers with access to the My Energy Tools web portal through their ComEd.com account via a single sign-on process. My Energy Tools is a suite of online tools that provides customers with detailed information regarding their personal energy usage. Customers can use that information to manage their home energy consumption to achieve cost savings. In addition, ComEd has enabled the Green Button feature, which allows a customer to download a report of their meter usage data based on a customer-specified time frame. This data can also be downloaded in a format that is easily uploaded to

12
third party applications. As smart meters are deployed the benefit of the web portal will grow because hourly usage data will be available through My Energy Tools.
3. Technology and Customer Research
In 2012, ComEd conducted extensive secondary research of technologies enabled by Smart Grid that could directly touch customers. ComEd organized this research into categories by technology type and subcategories by feature sets. ComEd then evaluated the customers and vendors that utilized each feature set to determine the impact. These steps were taken in an effort to establish a mechanism through which there could be continuous monitoring of the marketplace to identify technologies that are enabled by the Smart Grid as required by the AMI Plan.
ComEd utilized the research described above in the development of its partnership with Whirlpool in support of their proposed regional launch of Smart Appliances in 2013 in ComEd’s service territory. Smart Appliances include both connectivity (e.g., iPad / internet control) and energy management capabilities. Whirlpool's initial Smart Appliances are expected to incorporate ComEd’s hourly pricing data into its energy management intelligence to potentially delay or change appliance functionality during peak price periods (examples of this might include the delay of ice making for refrigerators and delayed start for clothes washers) to automate customers’ energy / money saving operations. In 2013, ComEd expects to continue to support Whirlpool in its Smart Appliance roll-out and potentially evaluate the customer use and impact of the Smart Appliance capabilities.
B. 2013 Activities and Goals
1. Peak Time Rebate
The Commission’s Interim Order dated February 21, 2013, in ICC Docket No. 12-0484 approved ComEd’s proposed PTR program with slight modifications and ordered program implementation to begin in 2015. The Commission directed ComEd to submit for approval at a later date its proposed method for the rebate calculation. Additionally, ComEd was directed to develop a pilot program related to technology to assist customers in reducing usage when requested by ComEd. ComEd will develop both the rebate calculation and the pilot throughout 2013 in order to submit both to the Commission for approval on or before February 1, 2014.
2. Web Portal
In 2013, design work will begin to fully integrate My Energy Tools beyond the current functionality. This integration will provide customers with Smart Meters the ability to view bill projections as well as to sign up for usage alerts when they are headed towards a high bill. It will also allow the inclusion of the energy management tools in ComEd’s mobile website and applications.
3. Technology and Customer Research
In 2013, ComEd will continue to review technology research on a regular basis and complete updates as the vendor landscape evolves. ComEd will also to continue to support Whirlpool in

13
its Smart Appliance roll out and potentially evaluate the customer impact of the Smart Appliance features.
IV. CUSTOMER OUTREACH AND EDUCATION
Throughout 2012, ComEd spent over $1.1 million in customer outreach and education related to AMI and its associated benefits. These communications focused on general education about AMI meters. This sets the foundation to prepare customers for eventual AMI meter deployment.
In approving ComEd’s AMI Plan, the Commission made sure that the AMI Plan included customer outreach and education goals that incorporated provisions designed to ensure that ComEd’s customers were adequately educated about the deployment of AMI meters, how to capture economic benefits associated with AMI meters, energy efficiency information and tips, low income customer assistance programs, and no-cost and low-cost ways low income customers can decrease their future electric bills. These provisions were also intended to educate customers without AMI meters on actions they can take to offset their AMI-related charges while awaiting AMI meter installation.
The following discusses activities and events that have been undertaken in order to educate ComEd customers – both those who are with and those who are without AMI meters - on actions they can take to manage their energy bills and obtain benefits. All of the outreach and educational efforts discussed in this section promote the goals of the AMI Plan and provide customers with essential information to control their energy bills and obtain the benefits available through AMI meters. In addition, these activities reflect that ComEd leverages program benefits from other areas such as CARE, energy efficiency, and grid modernization that can help customers better manage their energy usage, take actions to lower their bills, and receive needed assistance.
A. 2012 Activities and Accomplishments
1. Initial Customer Education and Awareness
During 2012, ComEd provided customers with general information to educate them regarding what smart meters are and the benefits they provide. Customers were informed about the benefits of AMI meters through a number of different mechanisms, including ComEd.com, the Smart Youth Ambassador Program, and materials at local community events such as a side-by-side display of smart meters and analog meters.
ComEd focused its education efforts on specific actions that all customers could take, both those who are with and those who are without AMI meters, in order to manage and control their energy bills. ComEd’s customer education broadly addressed energy management, including AMI meter information, as well as ComEd’s CARE programs (financial assistance programs), energy efficiency measures, and other tools available to ComEd customers to assist in their management of energy. These tools include mobile applications and texting for outage alerts and videos that instruct customers on practical cost savings tips such as turning off lights, programming their thermostat, and regularly changing air filters.
14
Moreover, ComEd sought to enhance the customer experience by providing both actionable information and easy access to information, and used the guiding principles outlined in ComEd’s Modified AMI Plan to facilitate customer engagement. For example, at local area mall events ComEd communicated smart meter value by educating customers on how to utilize My Energy Tools to access customer specific information to achieve energy and monetary savings.
ComEd also utilized municipal outreach channels to inform community leaders about the educational events and to update them on how their residents will be impacted by AMI; ComEd did so through the use of a toolkit that included a variety of materials about AMI deployment. This information was also made available electronically. Throughout the year, external affairs managers met with municipal leaders to discuss program details.
In 2012, ComEd launched a Smart Home Showcase program to select four homes to receive Whirlpool smart appliances, a solar / battery solution, a NEST learning thermostat and an in-home display. The purpose of this program is to demonstrate and increase awareness of the smart products, technologies and energy-savings that a smart grid could make widely available. The residents of the four homes selected in 2013 will share their experiences, and the impact the technologies have made on their energy use and lifestyles.
2. Research Developed Messaging
In 2012, ComEd utilized messaging to provide customers with general information and education based on qualitative and quantitative research that was conducted in 2012. This research indicated low customer awareness of smart meters as well as limited knowledge of AMI capabilities among customers who are aware of the smart meter programs. This information is reflected in Section V of this Report, Metrics and Milestones. These research findings are consistent with the typical customer journey, where most customers are designated as either “uninformed” or “aware” in the early stages of AMI deployment. Accordingly, ComEd chose to rely upon general information to educate customers and begin transitioning them from the “uninformed” designation to “aware” designation throughout 2012. In part, ComEd was able to do so through a series of local community events that provided the information in fun, engaging, and memorable environments. Additionally, ComEd communicated initial awareness-focused messages through bill inserts to residential customers and energy essentials newsletters to businesses.
Research results indicate that while customers are interested in learning more about smart meters, they only want detailed information once they are directly impacted. In the short term, customers are most interested in information related to reliability improvements and the direct effect of that work on them. As a result, ComEd began implementing a staged messaging approach so that customers received relevant information in a timely manner that could be immediately acted on and used without a smart meter. For example, basic information such as “what is a smart meter” and specific customer benefits were emphasized in bill inserts, brochures and videos. Other examples include:
Events: ComEd attended outdoor events in local communities throughout the summer and indoor events at malls during the winter holiday season. These events were promoted through customer emails, bill inserts (Energy@Home), ComEd.com, social
15
media and on-bill, envelope, and on-hold messaging. The events included mobile demonstrations of analog versus smart meters, videos about smart meters and energy efficiency tips, interactive games on iPads, and brochures. The events were staffed by trained personnel who instructed customers about energy management and energy savings opportunities. Smart Youth Ambassadors also attended the events and helped promote the ComEducation booth among event-goers, driving more traffic to the events.
Faith-Based Outreach: An energy management seminar was conducted in 2012 with participation from green teams at over a dozen congregations. The seminar focused on the benefits of AMI and was an effective way of communicating energy management information and providing materials and the opportunity to host a speaker about these topics at each congregation.
Teacher Partnerships: In 2012, ComEd developed a plan to utilize the Rockford Training Center as a field trip destination and engaged an organization to help develop, promote and coordinate the field trips. The opening of the facility was delayed until 2013 and field trips will begin in March 2013.
Online Community Forums: In 2012, ComEd attempted to use online community forums, such as mommy bloggers, to promote the interactive games which educate users on energy efficiency and AMI. No bloggers or online forums wrote about our efforts. Based on this experience, this method will not be successful until there is something directly relevant to online community forums, such as meter installation details.
In addition, in response to the Commission’s focus on providing education and outreach for low income customers and ways in which they can manage their energy usage more effectively and learn about the benefits of AMI, ComEd developed some education and outreach tactics specifically directed to low income customers. These tactics were primarily funded through the funds made available by ComEd pursuant to Section 16-108.5(b-10) of the PUA, and include the following:
Direct Mail: Several direct mail campaigns were sent to nonprofit organizations and low-income advocates in 2012 to raise awareness of ComEd’s CARE programs.
Speakers Bureau: ComEd hosted energy management workshops for CHA residents, seniors, and other groups at local community centers and other centralized meeting locations. Attendees were educated about AMI, CARE programs, energy efficiency and ComEd’s grid modernization work.
3. Audience Segmented Customer Education and Awareness
Audience segmentation is an important component of launching effective marketing efforts. In launching education and outreach efforts in 2012, ComEd customized education to focus on specific customer segments based on available demographic data.
For seniors and economically disadvantaged customers, ComEd provided specific information relating to CARE as well as energy reduction management tips appropriate for their homes and

16
communities by enhancing a variety of communication methods available for low income customers.
This information was communicated through CARE program references and updates that included outgoing collection activity, the proactive call script, the written disconnection notice, the field notification call script and the municipal notification of disconnections. ComEd also enhanced the incoming customer contact phone greeting and website. Additionally, ComEd implemented a variety of outreach efforts, such as participating in conferences, hosting senior luncheons with Meals on Wheels, distributing information about CARE to Local Administering Agencies (“LAAs”) at Low Income Home Energy Assistance Program (“LIHEAP”), and Community and Economic Development Associations (“CEDA”) agencies, and building advocacy with partners such as St. Vincent DePaul, Refugee One, local housing authorities, and other organizations. Throughout these efforts, ComEd communicated energy management tips to help customers manage and reduce their energy use.
For customers who do not have the means to receive information through electronic channels, ComEd provided information in a variety of paper methods, including bill inserts and brochures. For customers whose primary language is Spanish, ComEd made Spanish-language brochures and Spanish speakers available at events.
4. Financial Assistance
Pursuant to the June 2012 Order, the Revised AMI Plan includes directives related to providing assistance to customers through energy low-income and support programs for purposes of paying past due arrearages and avoiding disconnection. In 2012, ComEd utilized its CARE programs, which assist low-income customers, to help customers that faced financial hardships and had difficulty paying their electric utility bills. ComEd was successful in distributing $10 million that was allocated for this purpose throughout 2012. The allocation for the $10 million was as follows:
$7.118 million for Residential Special Hardship, a program designed to help eligible residential customers pay their electric bills. Customers participating in this program also received education about no-cost and low-cost ways to decrease their future electric bills.
$58,000 for Nonprofit Special Hardship, which focuses on assisting nonprofit organizations who have fallen behind on their electric bills. Organizations receiving a grant as part of this program were required to attend an educational workshop / webinar on energy management to help lower their future electric bills.
$427,000 for Chicago Housing Authority (CHA) All Clear program, a partnership between CHA and ComEd to assist CHA residents and Housing Choice Voucher (HCV) participants with their electric bills. Although this partnership has been in existence for a number of years, the 2012 program included mandatory attendance at an energy management workshop for customers with high account balances.

17
$1.460 million for the Fresh Start program, where PIPP (Percentage of Income Payment Plan) customers with PPA balances enrolled between 8/1/11 and 1/31/12 received credits equal to their PPA.
$65,000 for Educational Classes, conducted through the Chicago Urban League and LUCHA organizations for first time homebuyers, and energy management education for nonprofits developed and implemented with CNT.
594,000 for the administrative costs for CNT Energy, a division of the Center for Neighborhood Technology, and the Illinois Association of Community Action Agencies (LIHEAP) to manage customer requests for funds for the Customer Assistance Programs.
$280,000 for Outreach, Marketing and Advertising, which included energy fairs, local community events, senior outreach and partnerships with local housing authorities. Other methods of communication included radio, newspaper and billboard ads, press conferences and news releases, Facebook and Twitter, ComEd.com, brochures, fact sheets and talking points for distribution in municipalities and with legislators.
In addition, ComEd expended approximately $64,000 for CHAMP (ComEd Helps Activated / Disabled Military Personnel), a program to help military personnel experiencing hardship in paying their electric bills. Participating military personnel also received education about no-cost and low-cost ways to decrease their future electric bills. For 2012, this program was not funded from the allocated $10 million; funding with allocated money will commence in 2013. As a result, funding on identified projects actually exceeded the $10 million by a small margin.
B. 2013 Activities and Goals
1. Initial Customer Education and Awareness
In 2013, ComEd will continue to focus its education efforts on providing customers with general information regarding smart meters and the benefits they provide. These education efforts will be made through the channels discussed in Section IV.A.1 above, along with education about general energy efficiency. As a result of understanding AMI awareness and interest levels among customers, and measuring the effectiveness of 2012 communication methods, marketing for 2013 will be focused on building awareness in the following areas:
Energy management options for all customers.
Planned work on ComEd’s grid and major facilities upgrades.
Education of customers with smart meters as to the full range of energy management options available to them through the smart meters.
Education and engagement of customers about AMI and associated benefits.
2. Research Developed Messaging
In 2013, key messages that will be communicated to customers include:

18
The smart grid, how it works, and customer benefits.
The smart meter, what it is, and how it can be used.
Utilization of My Energy Tools to customers, especially those with smart meters.
Low-cost and no-cost energy efficiency tips.
CARE programs to assist customers in need with paying their electric bills.
Additionally, some changes will be made to staged messaging. Direct mail will be used in 2013 to educate customers who already have AMI meters. In addition to general marketing events, communities that already have AMI meters installed will also be targeted for event activities. These activities will remind customers that they have AMI meters, and will inform them of their energy saving benefits. The Smart Youth Ambassador Program will be expanded to 100 students through a partnership with After School Matters. Educators and students in the Teacher Partnership Program will be engaged through field trips offered at ComEd’s Rockford Training Center.
As future meter installation is ramped up, ComEd will use education and outreach efforts to ensure customers progress along the customer journey and fall within the segments entitled “informed,” “educated,” “engaged,” and “advocating.” Also, ComEd will begin to develop the specific staged messaging for future AMI deployment that provides specific information to customers 90, 60 and 30 days immediately prior to AMI meter installation for that customer.
3. Audience Segmented Customer Education and Awareness
ComEd will continue the audience segmented customer education and awareness described above in Section IV.A.3.
4. Financial Assistance
In 2013 ComEd will continue to provide financial assistance to the programs described above in Section IV.A.4. Additionally, ComEd will provide low-income and support program assistance to aid customers in paying past due arrearages, and will provide assistance to those who are unable to avoid disconnection. ComEd will accomplish this by coordinating spend and ongoing efforts with other providers of customer education and assistance, such as the Chicago Housing Authority, LAAs, and social service agencies to increase awareness of assistance programs and to explore new approaches to customer assistance program planning and design. In addition, in 2013, ComEd’s CHAMP program will be funded with allocated EIMA funds.
Additionally, ComEd will have the capability to notify the City of Chicago and other municipalities of impending disconnections on a zip code (or comparable) basis, as permitted by customer information privacy constraints. The details of the report, including its frequency, will be determined and agreed upon by ComEd and the requestor.

19
V. METRICS AND MILESTONES
The following table contains the set of tracking measures the Commission approved for inclusion in the AMI Plan, including measures that ComEd agreed to report on via collaborative sessions with external stakeholders. The purpose of the table is to provide the required information and demonstrate the progress made during the prior calendar year regarding these measures. Results will be refreshed via this Report through its annual filing over the ten-year deployment period. The June 2012 Order also directed ComEd to include in this Report a baseline for each measure. June 2012 Order at 19. ComEd proposes to use the 2012 results for each measure as the baseline. ComEd has initial Citizens Utility Board (“CUB”), Environmental Law & Policy Center (“ELPC”), and Environmental Defense Fund (“EDF”) consensus on the tracking measures to be used for year one, and will continue collaborating with these and other stakeholders to refine the measures for future years.
As also noted in Section II.A of this Report, the data in the table below indicates that the overall smart meter program is progressing as scheduled, and the plan for full deployment is being executed on-time and in-budget. None of the data points captured indicate an inability for ComEd to execute the deployment according to the approved plan. As meter deployment progresses throughout the service territory beginning in 2015, many of the measures identified will become more meaningful and indicative of quantitative progress towards completing full deployment of AMI meters.
ComEd mapped the measures below to the Revised AMI Plan to the extent possible given that all the measures in the Revised AMI Plan are not centrally located in one section. Additionally multiple measures that are tracked relating to a single issue are all identified under one number consistent with the numbering in the June 2012 Order and the Revised AMI Plan. For example there are 4 items tracked under measure number 1. For ease of identification, letters are used to differentiate these related items (e.g., 1a, 1b, 1c, and 1d are used). Further, Attachments 1-3 are specifically referenced when they can provide additional information regarding a certain measure.

20
2012 Tracking Metrics
# Issue Tracking Metric Description 2012 Annual AMI Metric Data
1a
Customers enrolled in Peak Time Rebate, Real Time Pricing, and other dynamic/time variant prices
Residential Customers Number of customers on a time‐variant or dynamic pricing tariff offered by ComEd. Expressed also as a percentage of customers in each delivery class.
The number of customers on a time-variant or dynamic pricing tariff offered by ComEd are as follows: Residential - Single: 8,473 (0.4%) Residential - Multi: 605 (0.1%) Residential - Single (Space Heat): 157 (0.5%) Residential - Multi (Space Heat): 155 (0.1%)
1b
Customers enrolled in Peak Time Rebate, Real Time Pricing, and other dynamic/time variant prices
Residential Customers Number of customers served by retail electric suppliers for which the supplier has requested monthly Electronic Data Interchange delivery of interval data. Expressed also as a percentage of customers taking supply from a retail electric supplier in each delivery class.
The number of residential customers served by retail electric suppliers for which the supplier has requested monthly Electronic Data Interchange delivery of interval data is zero (0% of customers taking supply from a retail electric supplier in each delivery class.) ComEd will work with the external stakeholders and Ameren in a workshop forum to determine how to track the number of TOU customers related to this measurement; the result will be included in the AIPR submitted in 2014.
1c
Customers enrolled in Peak Time Rebate, Real Time Pricing, and other dynamic/time variant prices
Small Commercial Customers Number of customers on a time‐variant or dynamic pricing tariff offered by ComEd. Expressed also as a percentage of customers in the delivery class.
Zero Watt-Hour customers are taking hourly service from ComEd out of 91,275 total customers in the Watt-Hour class (0% of the class.) 1,923 Small Load Delivery (0-100kW) customers are taking hourly service from ComEd out of 247,581 total customers in the Small class (0.78% of the delivery class.)
1d
Customers enrolled in Peak Time Rebate, Real Time Pricing, and other dynamic/time variant prices
Small Commercial Customers Number of customers served by retail electric suppliers for which the supplier has requested monthly Electronic Data interchange delivery of interval data. Expressed also as a percentage of customers taking supply from a retail electric supplier in the delivery class.
The number of small commercial customers served by retail electric suppliers for which the supplier has requested monthly Electronic Data interchange delivery of interval data is zero (0% of customers taking supply from a retail electric supplier in the delivery class.).

21
2012 Tracking Metrics
# Issue Tracking Metric Description 2012 Annual AMI Metric Data
2
Customer‐side‐of-the‐meter devices sending or receiving grid related signals
Number of ComEd AMI meters with consumer devices registered to operate with the Home Area Network (HAN) chip by tariffs under which customer receives delivery.
The number of ComEd AMI meters with consumer devices registered to operate with the Home Area Network (HAN) chip by tariffs under which customer receives delivery are as follows: Residential – Single: 684 Residential – Multi: 146 Residential – Single (w/Space Heat): 2 Residential – Multi (w/Space Heat): 11 TOTAL: 841 Number of customer applications/devices registered with the meter that connect to a 3rd party (e.g. CUB) is 7,357. Consumer devices registered through the Green Button Initiative is zero.
3 AMI Meter failures
Number of advanced meter malfunctions where customer electric service is disrupted. (A “malfunction” is a malfunction that causes the meter to become inoperable but does not include cases of tampering, service panel and service entry equipment, house fires, etc.) ComEd will be able to determine which of the advanced meter malfunctions were due to voltage outside design criteria, but there were none for 2012.
The number of advanced meter malfunctions where customer electric service is disrupted is zero.

22
2012 Tracking Metrics
# Issue Tracking Metric Description 2012 Annual AMI Metric Data
4 AMI Meters replaced before the end of their expected useful life
Number of ComEd advanced meters replaced annually before the end of their expected useful life, including reasons for replacement that include ComEd errors. (“Replaced” means a replacement due to a malfunction that causes the meter to become inoperable, including tampering.)
The number of ComEd advanced meters replaced annually before the end of their expected useful life, itemized by tamper versus non-tamper is as follows: 334 meters replaced before the end of their expected useful life due to tampering 164 meters replaced before the end of their expected useful life due to reasons other than tampering TOTAL: 498 meters replaced before the end of their expected useful life Note: ComEd worked with the external stakeholders, and it was determined that ComEd does not have the system capability to show detailed reason codes by type. If this is needed in the future, an IT enhancement would be required.
5 Customers with net metering
Number of customers enrolled on Net Metering tariff and net load of each customer.
Number of customers enrolled on Net Metering tariff and net load of each customer is as follows: Residential Customers (Photovoltaic Source): 40 (0.202 MW) Residential Customers (Wind Source): 2 (0.022 MW) Commercial Customers (Photovoltaic Source): 22 (0.258 MW) Commercial Customers (Wind Source): 0 (-0.009 MW) TOTAL: 64 Customers (0.473MW)
6a
Customer premises capable of receiving information from the grid
Number of installed AMI Meters as of the last day of the calendar year that communicate back to the head end system.
The number of installed AMI Meters as of the last day of the calendar year that communicate back to the head end system is 127,114.
6b
Customer premises capable of receiving information from the grid
Number of installed AMI Meters as of the last day of the calendar year that communicate back to the head end system, divided by the total number of AMI meters installed.
The number of installed AMI Meters as of the last day of the calendar year that communicate back to the head end system, divided by the total number of AMI meters installed is 99.50%

23
2012 Tracking Metrics
# Issue Tracking Metric Description 2012 Annual AMI Metric Data
6c
Customer premises capable of receiving information from the grid
Number of customers who have accessed the web‐based portal as of the last day of the calendar year as a percentage of customers with AMI Meters and as a percentage of ComEd customers in that delivery class.
Please reference Attachment 1.
6d
Customer premises capable of receiving information from the grid
Number of customers who can directly access their usage data as of the last day of the calendar year as a percentage of customers with AMI Meters and as a percentage of ComEd customers in that delivery class.
Please reference Attachment 1.
7 Peak load reductions enabled by demand response programs
Load impact in MW of peak load reduction from the summer peak due to AMI enabled, ComEd administered demand response programs such as the Peak Time Rebate program as a percentage of all demand response in ComEd’s portfolio.
The load impact in MW of peak load reduction from the summer peak due to AMI enabled, ComEd administered demand response programs such as the Peak Time Rebate program as a percentage of all demand response in ComEd’s portfolio is zero. The RRTP estimated peak load reduction is .5KW X 9,390 customers = 4,695 KW For the desired %, 4,695 KW is divided by 1,342.4 MW (the DR portfolios total peak load reduction potential): 4.695 MW / 1342.2 MW = .35%
8 Customer Complaints
Number of formal ICC complaints, informal ICC complaints, and complaints escalated to ComEd’s Customer Relations or Customer Experience departments related to AMI Meter deployment, broken down by type of complaint and resolution. AMI Meter deployment includes AMI Meter installation, functioning or accuracy of the AMI meter, and HAN device registration.
Number of formal ICC complaints, informal ICC complaints, and complaints escalated to ComEd’s Customer Relations or Customer Experience departments related to AMI Meter deployment, broken down by type of complaint and resolution. AMI Meter deployment includes AMI Meter installation, functioning or accuracy of the AMI meter, and HAN device registration. Formal ICC Complaints: 1 Smart Meter Refusal; Complaint remains in progress with resolution pending. Informal ICC Complaints: 4 Smart Meter Refusals; ComEd has completed process for customer contact and resolution for each. Complaints escalated to ComEd AMI Customer Relations or Customer Experience departments: 52 smart meter refusals; ComEd has completed process for customer contact and resolution for 51; 1 remains open with clear next steps identified for resolution.
24
2012 Tracking Metrics
# Issue Tracking Metric Description 2012 Annual AMI Metric Data
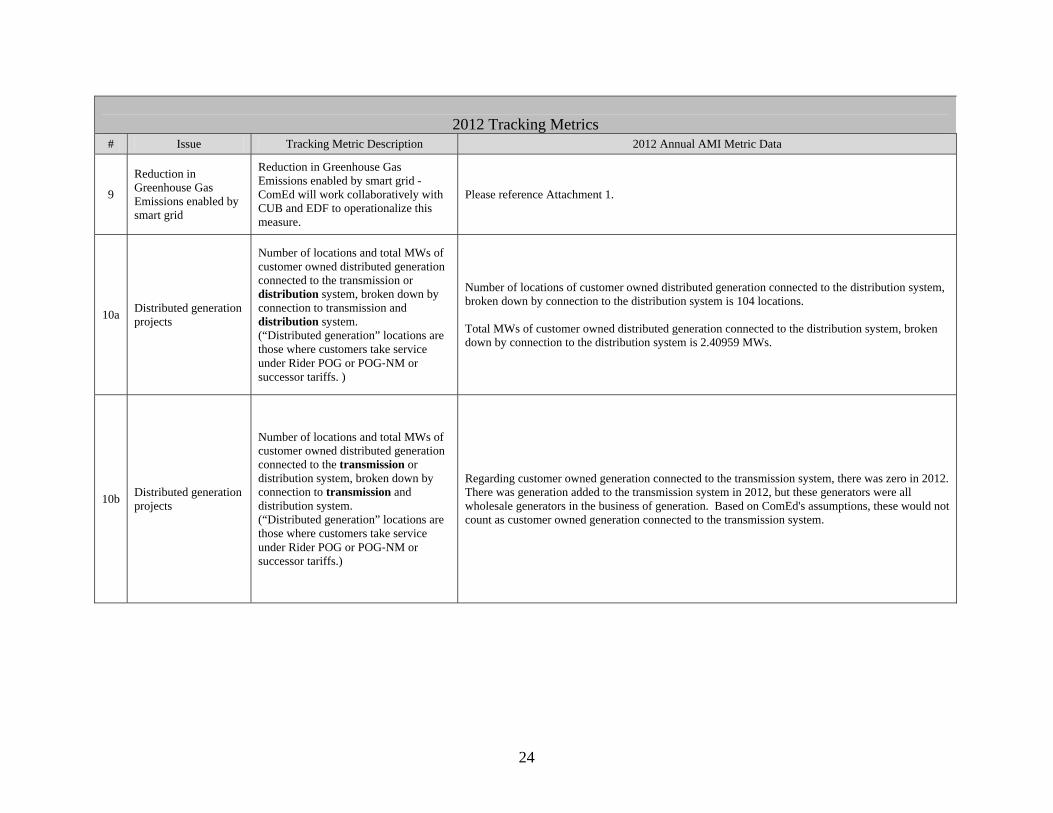
9
Reduction in Greenhouse Gas Emissions enabled by smart grid
Reduction in Greenhouse Gas Emissions enabled by smart grid - ComEd will work collaboratively with CUB and EDF to operationalize this measure.
Please reference Attachment 1.
10a Distributed generation projects
Number of locations and total MWs of customer owned distributed generation connected to the transmission or distribution system, broken down by connection to transmission and distribution system. (“Distributed generation” locations are those where customers take service under Rider POG or POG‐NM or successor tariffs. )
Number of locations of customer owned distributed generation connected to the distribution system, broken down by connection to the distribution system is 104 locations. Total MWs of customer owned distributed generation connected to the distribution system, broken down by connection to the distribution system is 2.40959 MWs.
10b Distributed generation projects
Number of locations and total MWs of customer owned distributed generation connected to the transmission or distribution system, broken down by connection to transmission and distribution system. (“Distributed generation” locations are those where customers take service under Rider POG or POG‐NM or successor tariffs.)
Regarding customer owned generation connected to the transmission system, there was zero in 2012. There was generation added to the transmission system in 2012, but these generators were all wholesale generators in the business of generation. Based on ComEd's assumptions, these would not count as customer owned generation connected to the transmission system.
25
2012 Tracking Metrics
# Issue Tracking Metric Description 2012 Annual AMI Metric Data
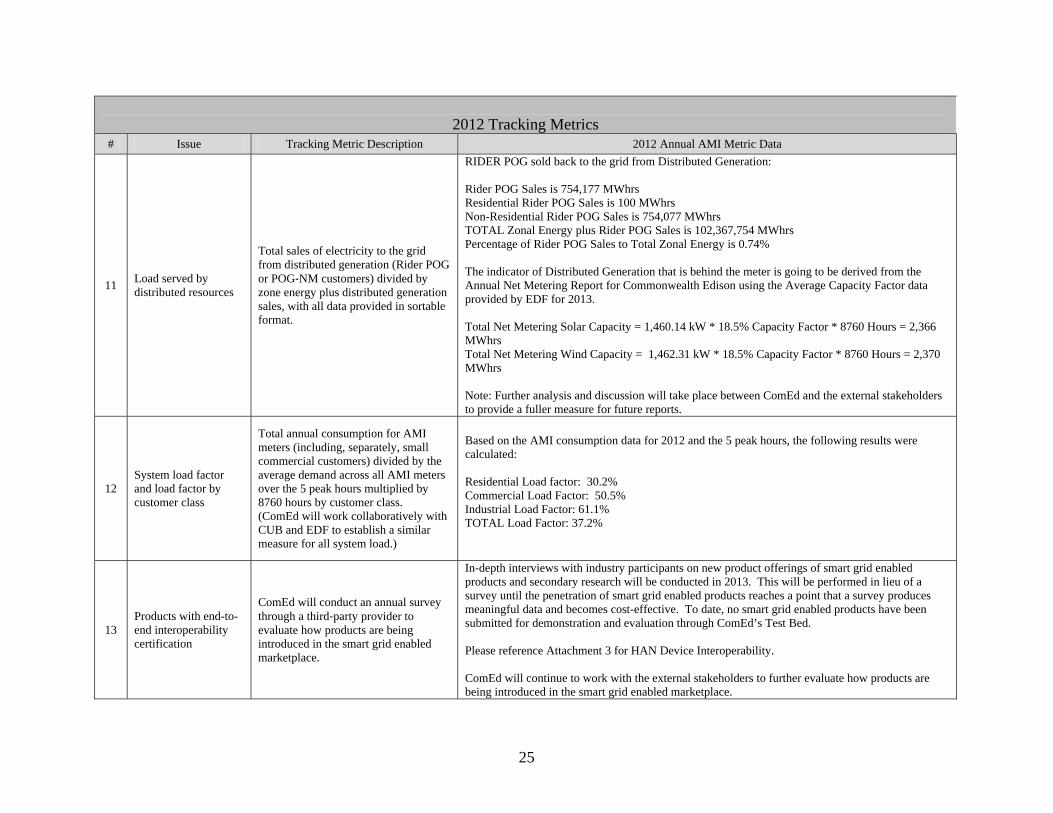
11 Load served by distributed resources
Total sales of electricity to the grid from distributed generation (Rider POG or POG‐NM customers) divided by zone energy plus distributed generation sales, with all data provided in sortable format.
RIDER POG sold back to the grid from Distributed Generation: Rider POG Sales is 754,177 MWhrs Residential Rider POG Sales is 100 MWhrs Non-Residential Rider POG Sales is 754,077 MWhrs TOTAL Zonal Energy plus Rider POG Sales is 102,367,754 MWhrs Percentage of Rider POG Sales to Total Zonal Energy is 0.74% The indicator of Distributed Generation that is behind the meter is going to be derived from the Annual Net Metering Report for Commonwealth Edison using the Average Capacity Factor data provided by EDF for 2013. Total Net Metering Solar Capacity = 1,460.14 kW * 18.5% Capacity Factor * 8760 Hours = 2,366 MWhrs Total Net Metering Wind Capacity = 1,462.31 kW * 18.5% Capacity Factor * 8760 Hours = 2,370 MWhrs Note: Further analysis and discussion will take place between ComEd and the external stakeholders to provide a fuller measure for future reports.
12 System load factor and load factor by customer class
Total annual consumption for AMI meters (including, separately, small commercial customers) divided by the average demand across all AMI meters over the 5 peak hours multiplied by 8760 hours by customer class. (ComEd will work collaboratively with CUB and EDF to establish a similar measure for all system load.)
Based on the AMI consumption data for 2012 and the 5 peak hours, the following results were calculated: Residential Load factor: 30.2% Commercial Load Factor: 50.5% Industrial Load Factor: 61.1% TOTAL Load Factor: 37.2%
13 Products with end-to-end interoperability certification
ComEd will conduct an annual survey through a third‐party provider to evaluate how products are being introduced in the smart grid enabled marketplace.
In-depth interviews with industry participants on new product offerings of smart grid enabled products and secondary research will be conducted in 2013. This will be performed in lieu of a survey until the penetration of smart grid enabled products reaches a point that a survey produces meaningful data and becomes cost-effective. To date, no smart grid enabled products have been submitted for demonstration and evaluation through ComEd’s Test Bed. Please reference Attachment 3 for HAN Device Interoperability. ComEd will continue to work with the external stakeholders to further evaluate how products are being introduced in the smart grid enabled marketplace.

26
2012 Tracking Metrics
# Issue Tracking Metric Description 2012 Annual AMI Metric Data
14
Network nodes and customer interfaces monitored in “real time”
Network nodes and customer interfaces monitored in “real time” ComEd will work collaboratively with CUB and EDF to operationalize this measure.
ComEd worked collaboratively with CUB and EDF to operationalize this measure, which yielded the following: Grid-side Network Nodes Measured as Total Number of DA Devices: 12kV DA = 2,125 and 34kV DA = 971 (DA devices) connected to the grid. Customer-side Network Nodes Measured as Total Number of Devices Registered to a Meter: 841 HAN devices for meters, though they are not actively "Monitored."
15a
Grid connected energy storage interconnected to utility facilities at the transmission or distribution system level
Number of locations and total MWs of utility owned or operated energy storage interconnected to the transmission or distribution system as measured at storage device electricity output terminals.
The number of locations and total MWs of utility owned or operated energy storage interconnected to the distribution system as measured at storage device electricity output terminals is zero. ComEd has not installed any storage on either the transmission or distribution system in 2012, nor has any energy storage been certified, tested or deployed in the ComEd test bed. The storage installed on the transmission and distribution system that is part of the PJM wholesale market is 1.5 MW at one location, and it participates directly as a supply resource as part of a wind development for 2012. Please note: concerning measuring the storage installed on the transmission or distribution system participating in PJM wholesale markets, there are limitations in obtaining the information for proprietary reasons. Storage assets directly participating in PJM markets will require interconnection agreements and ComEd will have the information to track if or when these types of supply resources enter the market. For behind-the-meter storage assets participating in the PJM through the demand response program, there is currently no requirement that PJM will share that information with ComEd. ComEd will only have knowledge of the customers that are participating in demand response, but not how customers are achieving load reductions. In terms of measuring the storage installed on the distribution system as part of the PJM wholesale market (behind-the-meter) it may not be possible unless the installation requires an interconnection agreement.
15b
Grid connected energy storage interconnected to utility facilities at the transmission or distribution system level
Number of locations and total MWs of utility owned or operated energy storage interconnected to the transmission or distribution system as measured at storage device electricity output terminals.
The number of locations and total MWs of utility owned or operated energy storage interconnected to the transmission system as measured at storage device electricity output terminals is zero. ComEd has not installed any storage on either the transmission or distribution system in 2012.

27
2012 Tracking Metrics
# Issue Tracking Metric Description 2012 Annual AMI Metric Data
15c
Grid connected energy storage interconnected to utility facilities at the transmission or distribution system level
ComEd will conduct an annual survey through a third‐party provider to estimate similar measures of non‐utility storage units.
In-depth interviews with industry participants in non-utility storage markets and secondary research will be conducted in 2013. This will be performed in lieu of a survey until the penetration of non-utility storage units reaches a size that a survey produces meaningful data and becomes cost-effective. ComEd will continue to work with the external stakeholders to further estimate similar measures of non‐utility storage units.
16a Time required to connect distributed resources to grid
ComEd’s response time to a distributed resource project application, and time from receipt of application until energy flows from project to grid (distribution.)
ComEd’s response time to a distributed resource project application can be referenced in the ICC guidelines, as follows: Title 83: Public Utilities - Chapter I: Illinois Commerce Commission - Subchapter c: Electric Utilities - Part 466 - Electric Interconnection of Distributed Generation Facilities. Please reference Attachment 1 for the time from receipt of application (using the application complete date as the start date for 2012 reporting) until energy flows from project to grid (distribution.)
16b Time required to connect distributed resources to grid
ComEd’s response time to a distributed resource project application, and time from receipt of application until energy flows from project to grid (transmission.)
This does not apply since there were zero projects to apply this measurement.
17 Voltage and VAR controls
Number and percentage of distribution lines using sensing from an AMI meter as part of ComEd’s voltage regulation scheme.
The number and percentage of distribution lines using sensing from an AMI meter as part of ComEd’s voltage regulation scheme is as follows: Feeders that use sensing from an AMI meter as part of a voltage regulation scheme is 13 out of 5456 (0.24%).

28
2012 Tracking Metrics
# Issue Tracking Metric Description 2012 Annual AMI Metric Data
18a Grid assets that are monitored, controlled, or automated
Number and percentage of ComEd substations (Distribution Center Substations (DCs), Substations (SSs) Transmission Substations (TSSs) and Transmission Distribution Centers (TDCs)) monitored or controlled via Supervisory Control and Data Acquisition (SCADA) systems.
The number and percentage of ComEd substations (Distribution Center Substations (DCs), Substations (SSs) Transmission Substations (TSSs) and Transmission Distribution Centers (TDCs)) monitored or controlled via Supervisory Control and Data Acquisition (SCADA) systems is as follows: Number on SCADA: DC: 479 TDC: 115 SS: 51 TSS: 169 Generating Stations: 16 Relay Points: 5 Percentage on SCADA: DC: 99% TDC: 100% SS: 100% TSS: 100% Generating Stations: 100% Relay Points: 100%
18b Grid assets that are monitored, controlled, or automated
Number and percentage of ComEd distribution circuits (4kV, 12kV and 34kV) equipped with automation or remote control equipment including monitor or control via Supervisory Control and Data Acquisition (SCADA) systems.
The number and percentage of ComEd distribution circuits (4kV, 12kV and 34kV) equipped with automation or remote control equipment including monitor or control via Supervisory Control and Data Acquisition (SCADA) systems is 5,168 distribution circuits (99% of total). Specifically, circuits with 12kV DA = 1,169 circuits (24% of the system circuits.)

29
2012 Tracking Metrics
# Issue Tracking Metric Description 2012 Annual AMI Metric Data
19 Customers connected per automated circuit segment
Average number of customers per automated three phase 12kV line segment. (An “automated line segment” is a segment of 12 kV three phase mainline circuit between automated devices which include circuit breakers, reclosers, automated switches, etc.; A “customer” is a ComEd account connected on the automated 12kV three phase line segment.)
The average number of customers per automated three phase 12kV line segment is 638.
20
Improvement in line loss reductions enabled by smart grid technology
Improvement in line loss reductions enabled by smart grid technology - ComEd will research the uncertainty in line loss measurement collaboratively with CUB and EDF.
ComEd will work with CUB and EDF to develop a full and practical measure of Line Loss Reductions as enabled by smart grid investments, by exploring the capability of calculating Line Loss reductions realized through items such as the following: A) More efficient equipment B) Increased use of distributed generation that is located closer to the load C) Optimized power flows D) Volt/VAR optimization E) Improved power factor The parties will hold stakeholder workshops in 2013 to identify the best approach to achieve this measure in Illinois, including strategies for better data collection.
21 Tracking Actual Costs
The actual cost of the AMI deployment costs that ComEd has incurred, including both one-time costs and on-going operating costs
The actual cost of the AMI deployment costs that ComEd has incurred, including both one-time costs and on-going operating costs is as follows: Actual Costs Incurred (000's), not including PTR: One-time CAP - $272,367 One-time O&M (if applicable) - $12,410,487 Ongoing CAP - $21,907 Ongoing O&M - $6,022,911 TOTAL- $18,727, 672

30
2012 Tracking Metrics
# Issue Tracking Metric Description 2012 Annual AMI Metric Data
22 Customer Applications
Bill impacts associated with the costs for implementation of ComEd’s AMI Plan for low, average, and higher usage level customers pursuant to approved rates and surcharges. The usage level calculations will be values for a “typical” customer at the 25th, 50th, and 75th percentile of total usage for each applicable delivery service class.
Please reference Attachment 1 for the metric data and Attachment 2 for supporting documentation.
23 Customer Applications
Number of customers that have created and viewed an account on ComEd.com – by usage levels, customer class, and low income customers. An account on ComEd.com is necessary for viewing the web portal.
Please reference Attachment 1.
24 Customer Applications
Number of customers with ComEd.com accounts that have viewed the web portal - by usage levels, customer class, and low income customers
Please reference Attachment 1.
25 Customer Applications
Change in customers’ energy consumption for customers that have viewed the web portal. ComEd will work with the web presentment vendor to define the business processes necessary to track an energy usage impact of accessing the web portal.
The My Energy Tools web portal became available to all ComEd residential customers through their ComEd.com account in September 2012. Given the short timeframe this was available to customers and the time needed to discern savings from customer billing data following their access to the web tools and subsequent actions taken to reduce their usage, there are no savings to report at this time. More robust analytics are expected as a greater number of customers begin accessing the My Energy Tools web portal and additional billing data can be utilized to measure savings in the future.
26 Customer Applications
Number of customers enrolled in the Residential Real Time Pricing (RRTP) program (ComEd’s hourly pricing program) by usage levels, customer class, and low income customers.
Please reference Attachment 1.

31
2012 Tracking Metrics
# Issue Tracking Metric Description 2012 Annual AMI Metric Data
27 Customer Applications
Number of customers enrolled in any future Time of Use (TOU) program that ComEd might offer by usage levels, customer class, and low income customers.
The number of customers enrolled in any future Time of Use (TOU) program that ComEd might offer by usage levels, customer class, and low income customers is zero.
28 Customer Applications
Number of customers enrolled in ComEd’s Peak Time Rebate (“PTR”) program by usage levels, customer class, and low income customers.
The number of customers enrolled in ComEd’s Peak Time Rebate (“PTR”) program by usage levels, customer class, and low income customers is zero.
29 Customer Applications
Number of deposits required, disconnection notices, and disconnections for nonpayment for all customers and, if applicable, by low income customers. Other “key indicia associated with credit and collection activities targeted to low income customers” may be incorporated in the project plan’s business process redesigns for future implementation.
Please reference Attachment 1.
30 Customer Applications
If further information is required to allow ComEd to track vulnerable populations and that information is not easily available (or only at significant cost) then ComEd should provide an explanation of the barriers to tracking vulnerable populations.
Please reference Section IV of Appendix A to this Report - Vulnerable Populations.
31 Customer Applications
ComEd should further identify what measures would be necessary to protect consumer privacy in tracking vulnerable populations.
Please reference Section IV of Appendix A to this Report - Vulnerable Populations.

32
2012 Tracking Metrics
# Issue Tracking Metric Description 2012 Annual AMI Metric Data
32 Customer Applications
The definition and identification of such groups should be discussed with stakeholders and Staff to develop a methodology to be included with the modified AMI Plan. To the extent that is not possible, it should be included with the first annual filing.
Please reference Section IV of Appendix A to this Report - Vulnerable Populations.
33 Customer Outreach & Education
Awareness and Education - Awareness and understanding of AMI technology and benefits (survey metric)
6,032 surveys were collected for awareness and understanding of AMI technology and benefits.
34 Customer Outreach & Education
Customer Experience and Engagement - Understanding of AMI technology (Customer Experience/Engagement Research and Customer Experience Tracking).
74 Community Events were conducted about Understanding AMI Technology.
35 Customer Outreach & Education
Community Outreach - # of community events and # of direct interactions
Community outreach included: 74 Community Events conducted and 50,871 direct interactions.
36 Customer Outreach & Education
Local Media - # of articles that appear in local media
1,125 articles appeared in local media.
37 Customer Outreach & Education
Potential missing metric: internal newsletter (# of articles in newsletter)
37 internal articles were included in the newsletter.
38 Customer Outreach & Education
Customer Experience and Engagement - Meter Installations complaints/claims (Rapid Response Situational Assessments)
57 Meter Installations complaints/claims.
39 Customer Outreach & Education
Customer Experience and Engagement - # of installation appointments (tracked by AMI Deployment team)
Zero installation appointments.
40 Customer Outreach & Education
Community Outreach - # of customer organizations contacted
1,098 organizations were contacted as part of Community Outreach.
41 Customer Outreach & Education
Community Outreach - # of customer communication methods deployed
17 communication methods employed as part of Community Outreach.
42 Customer Outreach & Education
Awareness and Education - # of advocates and ambassadors informed
70 Ambassadors were contacted and informed.
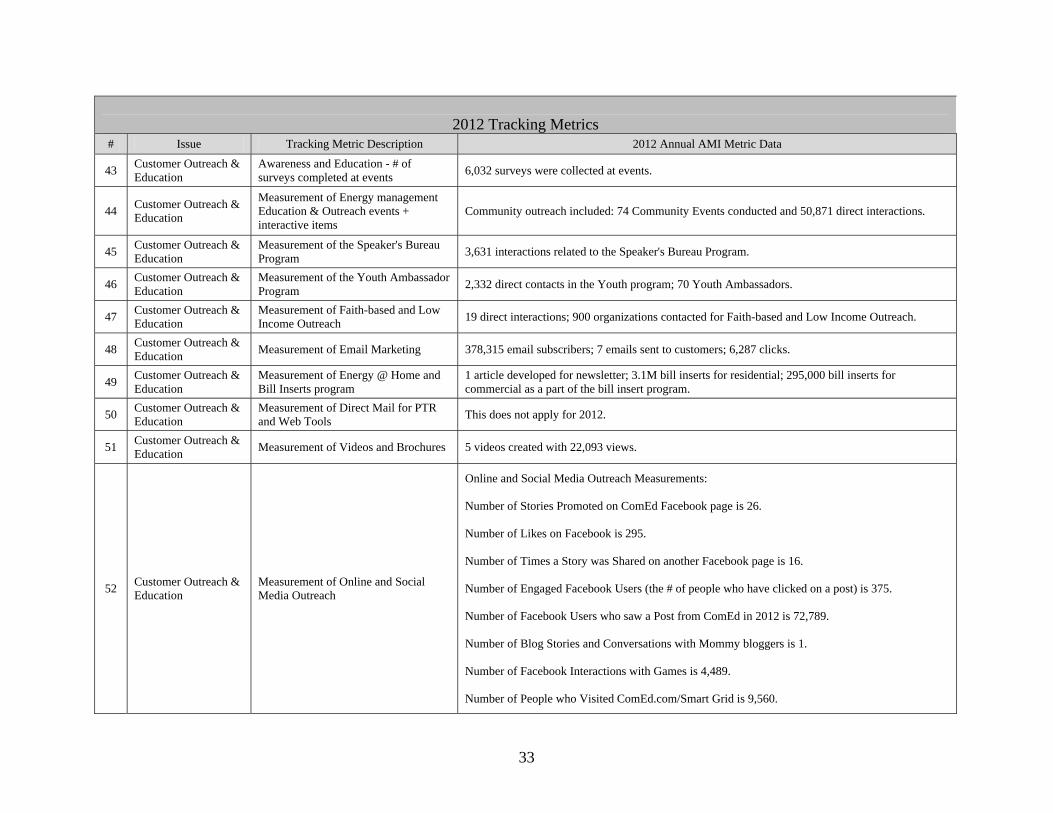
33
2012 Tracking Metrics
# Issue Tracking Metric Description 2012 Annual AMI Metric Data
43 Customer Outreach & Education
Awareness and Education - # of surveys completed at events
6,032 surveys were collected at events.
44 Customer Outreach & Education
Measurement of Energy management Education & Outreach events + interactive items
Community outreach included: 74 Community Events conducted and 50,871 direct interactions.
45 Customer Outreach & Education
Measurement of the Speaker's Bureau Program
3,631 interactions related to the Speaker's Bureau Program.
46 Customer Outreach & Education
Measurement of the Youth Ambassador Program
2,332 direct contacts in the Youth program; 70 Youth Ambassadors.
47 Customer Outreach & Education
Measurement of Faith-based and Low Income Outreach
19 direct interactions; 900 organizations contacted for Faith-based and Low Income Outreach.
48 Customer Outreach & Education
Measurement of Email Marketing 378,315 email subscribers; 7 emails sent to customers; 6,287 clicks.
49 Customer Outreach & Education
Measurement of Energy @ Home and Bill Inserts program
1 article developed for newsletter; 3.1M bill inserts for residential; 295,000 bill inserts for commercial as a part of the bill insert program.
50 Customer Outreach & Education
Measurement of Direct Mail for PTR and Web Tools
This does not apply for 2012.
51 Customer Outreach & Education
Measurement of Videos and Brochures 5 videos created with 22,093 views.
52 Customer Outreach & Education
Measurement of Online and Social Media Outreach
Online and Social Media Outreach Measurements: Number of Stories Promoted on ComEd Facebook page is 26. Number of Likes on Facebook is 295. Number of Times a Story was Shared on another Facebook page is 16. Number of Engaged Facebook Users (the # of people who have clicked on a post) is 375. Number of Facebook Users who saw a Post from ComEd in 2012 is 72,789. Number of Blog Stories and Conversations with Mommy bloggers is 1. Number of Facebook Interactions with Games is 4,489. Number of People who Visited ComEd.com/Smart Grid is 9,560.
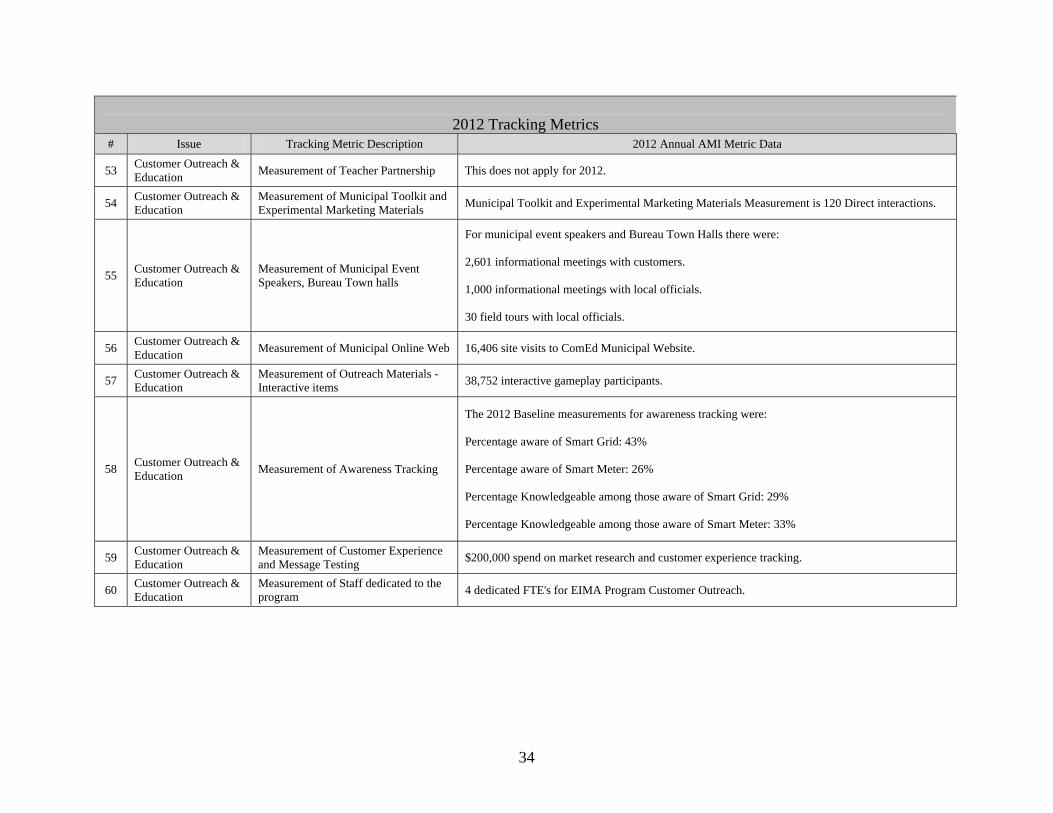
34
2012 Tracking Metrics
# Issue Tracking Metric Description 2012 Annual AMI Metric Data
53 Customer Outreach & Education
Measurement of Teacher Partnership This does not apply for 2012.
54 Customer Outreach & Education
Measurement of Municipal Toolkit and Experimental Marketing Materials
Municipal Toolkit and Experimental Marketing Materials Measurement is 120 Direct interactions.
55 Customer Outreach & Education
Measurement of Municipal Event Speakers, Bureau Town halls
For municipal event speakers and Bureau Town Halls there were: 2,601 informational meetings with customers. 1,000 informational meetings with local officials. 30 field tours with local officials.
56 Customer Outreach & Education
Measurement of Municipal Online Web 16,406 site visits to ComEd Municipal Website.
57 Customer Outreach & Education
Measurement of Outreach Materials - Interactive items
38,752 interactive gameplay participants.
58 Customer Outreach & Education
Measurement of Awareness Tracking
The 2012 Baseline measurements for awareness tracking were: Percentage aware of Smart Grid: 43% Percentage aware of Smart Meter: 26% Percentage Knowledgeable among those aware of Smart Grid: 29% Percentage Knowledgeable among those aware of Smart Meter: 33%
59 Customer Outreach & Education
Measurement of Customer Experience and Message Testing
$200,000 spend on market research and customer experience tracking.
60 Customer Outreach & Education
Measurement of Staff dedicated to the program
4 dedicated FTE's for EIMA Program Customer Outreach.


![Player Next Generation Grid Components R&D - FINAL4] ComEd... · ComEd service territory covers over 11,000 square ... Evaluate expanding existing radio and fiber ... Player_Next](https://static.fdocuments.us/doc/165x107/5b50741d7f8b9a346e8e8842/player-next-generation-grid-components-rd-final-4-comed-comed-service.jpg)