

smart grid
53
Energy / Smart Grid Energy / Smart Grid. Impact on Montgri Plain landscape Pep Salas Prat [email protected] 1 st October, 2012
-
Upload
master-paisatge -
Category
Documents
-
view
212 -
download
0
description
smart grid
Transcript of smart grid

Energy / Smart GridEnergy / Smart Grid.Impact on Montgri Plain landscape
Pep Salas Prat
1st October, 2012

2
1. ENERGY, society and science
2 C t it ti d l b l t d
3 Energy impact on Montgrí landscape
2. Current situation and global trends
3. Energy impact on Montgrí landscape
4. CO2 emissions in Montgrí Area – Baix Empordà
5. Conclusions: Smart Grids, a driver to shape the landscapelandscape

0. Presentation3
Agronomist and PhD candidate (a Agronomist and PhD candidate (a technologic and humanistic approach to smart grids)
Entrepreneur - WATTPIC (2004-2010) – photovoltaic technology- WATTPIC (2004-2010) – photovoltaic technology - ENERBYTE (2012- ) – energy efficiency &
consumer behaviour
Divulgation at www.smartgrid.cat (conferences, papers, speeches, books, …)

4
1. ENERGY, society and science
2 C t it ti d l b l t d
3 Energy impact on Montgrí landscape
2. Current situation and global trends
3. Energy impact on Montgrí landscape
4. CO2 emissions in Montgrí Area – Baix Empordà
5. Conclusions: Smart Grids, a driver to shape the landscapelandscape

1. ENERGY, society and scienceCivilization – Landscape ‐ Energy
5
Civilization Landscape ‐ Energy
The availability of “Energy” define the society The availability of Energy define the society
Each civilization has modified its landscape for aEach civilization has modified its landscape for a better access of resources and drain
B f “ il ” h i l l L 200 Before “oil era”, the impacts were local. Last 200 years, has become global.
After “oil era”, the impacts will be local again.
Which are the trade-off between landscape protection and local resources exploitation?

1. ENERGY, society and scienceBasics: Energy Laws
6
Basics: Energy Laws
1st Law, Energy Conservation: Energy can be changed from one form to another, but it cannot be neither created nor destroyed. Energy, in an isolated system remains constant over timeisolated system, remains constant over time.
2nd Law, Entropy: In all energy exchanges, if no energy enters or leaves the system, the potential energy of the state will always be less than that of the initial statethan that of the initial state.
3rd Law, Entropy production: , py pIn an isolated system, entropy production only can increase.

1. ENERGY, society and scienceBasics: Typology of systems (thermodynamically)
7
Basics: Typology of systems (thermodynamically)
Energy transfer
Mass transfer
Open Y YOpen Y Y
Close Y N
Isolated N N
A landscape is, thermodynamically, an OPEN SYSTEMA first question is then which is the scope of ourA first question is, then, which is the scope of our
“energy & landscape” analysis ? The piece of land itself, or also the surroundings?

1. ENERGY, society and scienceShould we consider Montgrí as an isolated area ?
9
Should we consider Montgrí as an isolated area …?

1. ENERGY, society and scienceor in its socieconomic and geographic context?
10
… or in its socieconomic and geographic context?

1. ENERGY, society and scienceEnergy sustainability criteria
11
Energy sustainability criteria
Concept: maximum consumption of energy is fixed by potential of “local” (and renewable) energy resources.
From the concept to the reality: (is not only technology!)
Efficiency revolution: decrease energy consumption and processes Consumer behaviour: being part of the energy chain, mobility…
Demand managing (peak savings, …). Local storage facilities.
Local energy production (renewables, CHP, …)
Matching demand curve with local energy resources & storage
Managing of energy exchanges with the surrenders (supra-network)g g gy g ( p )
This could be a good approach of Smart Grid!
This could be a good approach of Smart Grid!

1. ENERGY, society and scienceEnergy sustainability criteria – consequences on the landscape
12
Energy sustainability criteria consequences on the landscape
We have to consider:
M i it f i i ti iti (i d t
Maximum capacity of local energy resources ( production)
Maximum capacity of socioeconomic activities (industry, residential, tourism, …) in terms of energy usage per region (or other unit of land). Is it a new limit? (is it “The” limit?)
Social constraints: impact on the landscape, scope of analysis (local, regional, national wide), governance and regulation, life model
Other infrastructures and services to the area: Power distribution network, IT (fibre…), roads…
model…

1. ENERGY, society and scienceEnergy sustainability criteria – consequences in the landscape
13
Energy sustainability criteria consequences in the landscape
Scenarios (Hypothesis) 2050: Scenarios (Hypothesis) 2050:
Medium term (<40 years): oil still available, despite high costs and l b l iglobal warming
o A trade-off could be achieved. It is a question of cost and a socio-politic agreement
Long term (>40 years): oil collapse
socio politic agreement.
o Maybe we (as a whole society) cannot afford to produce less renewable than its maximum potential
This transition point is not known when it will happen (but it will).
An energy transition can not be delayed
An energy transition can not be delayed.

14
1. ENERGY, society and science
2 C t it ti d l b l t d
3 Energy impact on Montgrí landscapeCO
2. Current situation and global trends
3. Energy impact on Montgrí landscapeCO2
4. Emissions in Montgrí Area – Baix Empordà
5. Conclusions: Smart Grids, a driver to shape the landscapelandscape
2. Current situation and global trendsCentralized Vs Decentralized energy system
15
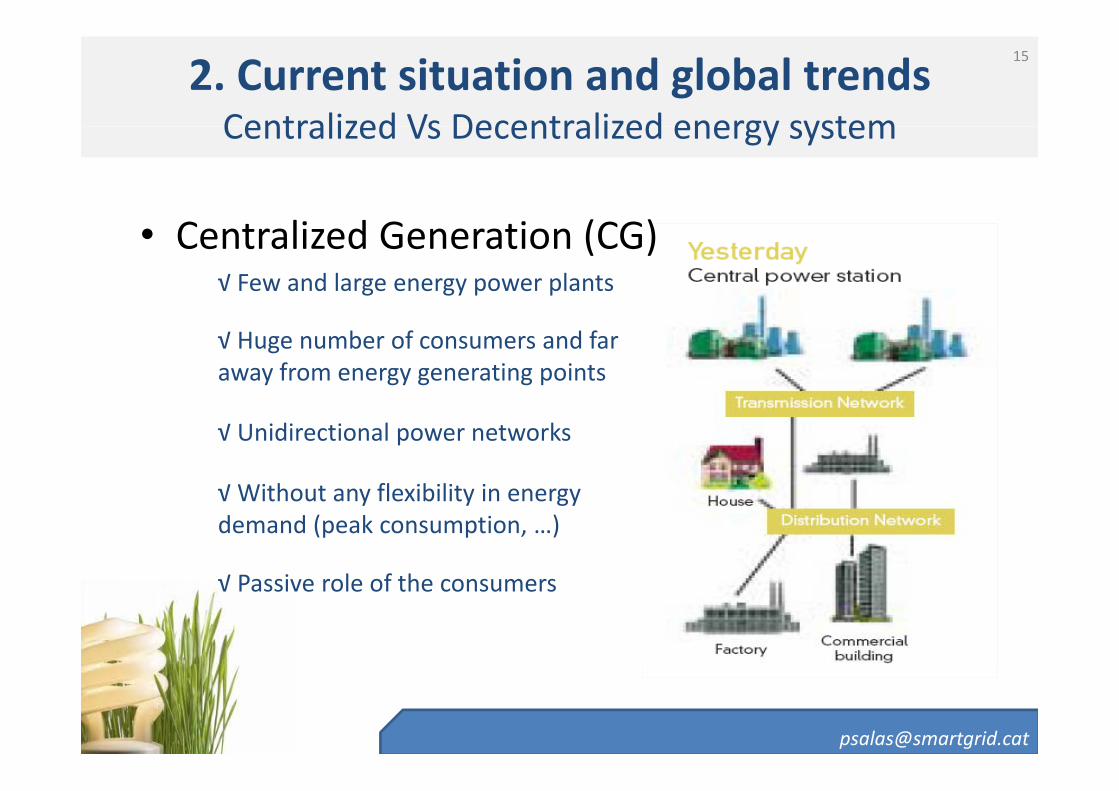
Centralized Vs Decentralized energy system
• Centralized Generation (CG)√ Few and large energy power plants
√ Huge number of consumers and far away from energy generating points
√ Unidirectional power networks
√Wi h fl ibili i√ Without any flexibility in energy demand (peak consumption, …)
√ P i l f h√ Passive role of the consumers

2. Current situation and global trendsLimitations of Centralized model according to European Commission
16
Limitations of Centralized model according to European Commission
Source: European CommissionSource: European Commission

2. Current situation and global trendsLimitations of Centralized model according to European Commission
17
• The European Internal Market: This market evolution, associated with an efficient regulatory framework, will promote economic growth and play a key role in the EU’s competitiveness strategy. Increasing competition will
Limitations of Centralized model according to European Commission
encourage efficiency and spur on technological progress and innovation. As a result, the internal market is expected to provide benefits to the European citizens such as a wider choice of services and downward pressure on electricity prices.
S it d Q lit f S l• Security and Quality of Supply: Modern society depends critically on a secure supply of energy. Countries without adequate reserves of fossil fuels are facing increasing concerns for primary energy availability. Furthermore, the ageing infrastructure of Europe's electricity transmission and distribution networks is increasingly threatening security, reliability and quality of supply.It is time to redesign electricity grids which take account of new roles and challenges Significant investment will beIt is time to redesign electricity grids which take account of new roles and challenges. Significant investment will be required to develop and renew these infrastructures: the most efficient way to achieve this is by incorporating innovative solutions, technologies and grid architectures.
• The Environment: Besides issues of primary energy supply the major disadvantage of fossil fuels is that they• The Environment: Besides issues of primary energy supply, the major disadvantage of fossil fuels is that they emit CO2, SO2, NOx and other pollutants when burnt to generate electricity. The greenhouse gases contribute to climate change, which is recognised to be one of the greatest environmental and economicchallenges facing humanity. Research is needed to help identify the most cost-effective technologies and measures
Source: European Commission
that will enable the EU to meet its targets under the Kyoto Protocol and beyond.
Source: European Commission

2. Current situation and global trendsCentralized Vs Decentralized energy system
18
• Decentralized Generation (DG)
Centralized Vs Decentralized energy system
ece t a ed Ge e at o ( G)√ Demand priority: what, how and when it happens
√ Energy production near where the consumption
√ Energy efficiency
consumption√ Priority of local resources
√ Bidirectional power networks
√ Bi D t
√ Peak savings√ Consumer engagement√ Big Data

2. Current situation and global trendsPace of Smart Grid deployment
19
Pace of Smart Grid deployment
SMARTGRID (>2018)- Power network meshed - Combination of DG and CG
- Self-healing power network- Microgrids- Demand response
N i f th- Combination of DG and CG- Electric vehicle- Automatization of power network
- New services for the consumers- consumer engagement - Smart Metering
SMART METERING (2012 - 2018) (2020 in UE)- Incident detection- Telemetry and monitoring
- Digital meters roll outD i t t - Telemetry and monitoring
TELEMETRY (today)
- Dynamic energy contracts- Signals of energy prices- Remote meter set up
( y)

2. Current situation and global trends20‐20‐20 targets
20
20‐20‐20 targets
a 20% reduction in EU greenhouse gas emissions from 1990 levels;emissions from 1990 levels;
a 20% improvement in the EU's energy a 20% improvement in the EU s energy efficiency.
raising the share of EU energy consumption produced from renewableconsumption produced from renewable resources to 20%;
Source: http://ec.europa.eu/clima/policies/package/index_en.htm (september 2012)

21
1. ENERGY, society and science
2 C t it ti d l b l t d
3 Energy impact on Montgrí landscape
2. Current situation and global trends
4. CO2 emissions in Montgrí Area – Baix Empordà
3. Energy impact on Montgrí landscape
5. Conclusions: Smart Grids, a driver to shape the landscapelandscape

3. Energy impact on Montgrí landscapeEnergy production & consumption in Catalonia (2009)
22
Energy production & consumption in Catalonia (2009)
Primary energy consumption (2009) Final energy consumption by sector (2009)
Source: ICAEN, Generalitat de Catalunya

3. Energy impact on Montgrí landscapeEnergy consumption & Production by region
23
Energy consumption & Production by region
Electric mix (2009) Electric mix (2010)
Renewable: 17,6 % (cat) 35 % (esp)Source: www.elpuntavui.cat/asco/mes/2-societat.html?start=40
Total renewable: 18,5 % (cat)
Source: ICAEN, Generalitat de Catalunya
ota e e ab e 8,5 % (cat)

3. Energy impact on Montgrí landscapeEnergy consumption & Production by region
24
Energy consumption & Production by region
Without energy d ti f ilitiproduction facilities

3. Energy impact on Montgrí landscapeEnergy consumption & Production by region
25
Energy consumption & Production by region
Production Consumption

3. Energy impact on Montgrí landscapeTransmission & Distribution Networks
26
Transmission & Distribution Networks
Without energy gytransportation network.
Poor distribution network (single circuit)

3. Energy impact on Montgrí landscapeTransmission & Distribution Networks
27
Transmission & Distribution Networks
New infrastructureNew infrastructure forecasting 2015

3. Energy impact on Montgrí landscapeLocal renewable energy available Wind
28
Local renewable energy available. Wind
spring summer

3. Energy impact on Montgrí landscapeLocal renewable energy available Wind
29
Local renewable energy available. Wind
autumn winter

3. Energy impact on Montgrí landscapeLocal renewable energy available Wind
30
Local renewable energy available. Wind
RED: Incompatible areasYELLOW: implantation sites subject to the environmental impact statementWHITE: Compatible areas
Map of wind potential based on
Map of wind potential based on environmental criteria
Catalan Goverment

3. Energy impact on Montgrí landscapeLocal renewable energy available Wind
31
Local renewable energy available. Wind
Windiest areas (such as Montgrí) are excluded!

3. Energy impact on Montgrí landscapeLocal renewable energy available Solar
32
Local renewable energy available. Solar
Type of solar projects:
Solar Farms (<3MW ≈ 15H ) i il it i th
yp p j
15Ha): similar criteria than wind farms
Distributed solar (small installations at the same point of the consumption):
MJ/
m2
point of the consumption): allowed everywhere
M

3. Energy impact on Montgrí landscapeLocal renewable energy available Solar
33
Local renewable energy available. Solar
Example of distributed photovoltaic potential in residential areas:
Single-family first home
Roof integration

3. Energy impact on Montgrí landscapeLocal renewable energy available Solar
34
Local renewable energy available. Solar
Example of distributed photovoltaic potential in residential areas (188 houses):
2 9
1
3
1210
13
14
15 224
6
511
13 5
16
17 23
2735
333036
7
17
18
19
20
21
2523
24
2831 34
3726
39
8
-
19 21 29 32 38 40 41

3. Energy impact on Montgrí landscapeLocal renewable energy available Solar
35
Local renewable energy available. Solar
Example of distributed photovoltaic potential in residential areas (188 houses):
Parametre Value
First residence homes (single‐family) 188
2 i l t 10 486 76m2 equivalent 10,486.76
PV module efficiency 15.0%
kW peak 1,573.01
kWn in average by house 8.4
PV d ti (kWh/kW ) 1 100 00PV production (kWh/kWn) 1,100.00
PV‐MWh/year 1,730.32
Production by house (PV‐kWh/year) 9,203.806
Consumption by house/year 4,979.162
PV coverage 184.8%

3. Energy impact on Montgrí landscapeLocal renewable energy available Solar
36
Local renewable energy available. Solar
Example of distributed photovoltaic potential in residential areas. Balance per month:month:
5,00004,3528
1,1769
4,5587
‐5,0000
0,0000 ‐0,0504
‐10,0000
,
‐10,3663
‐6,9434
In summer (high ti i d d
‐20,0000
‐15,0000‐13,5663
‐18,6703‐17,5085‐18,0259
‐15,9771
consumption period due to tourism) surplus PV production is maximum
‐25,0000
,‐20,5624
Gener Febrer Març Abril Maig Juny
Gener Febrer Març Abril Maig Juny
Juliol Agost Setembre Octubre Novembre Desembre

3. Energy impact on Montgrí landscapeLocal renewable energy available Solar
37
Local renewable energy available. Solar
Example of solar farm (1MW ≈ 6 Ha):
The visual impact is local because of
height of the machines (<7m)

3. Energy impact on Montgrí landscapeLocal renewable energy available Solar
38
Local renewable energy available. Solar
Example of solar farm (lower intensity land use):
It is also possible to combine the use of land with traditional activities
with traditional activities

39
1. ENERGY, society and science
2 C t it ti d l b l t d
3 Energy impact on Montgrí landscape
2. Current situation and global trends
4. CO2 emissions in Montgrí Area – Baix Empordà
3. Energy impact on Montgrí landscape
5. Conclusions: Smart Grids, a driver to shape the landscapelandscape

4. Energy impact on Montgrí landscapeCO emissions per capita (2005 revision 2011)
40
CO2 emissions per capita (2005, revision 2011)
Girona: 6,5 tnCO2 Catalunya: 8,1 tnCO2
Baix Empordà: 7,3 tnCO2
Source: Inventari de referència d’emissions (2005). CILMA, Diputació Girona, Set. 2012

4. Energy impact on Montgrí landscapeCO emissions totals (2005 revision 2011)
41
CO2 emissions totals (2005, revision 2011)
Source: Inventari de referència d’emissions (2005). CILMA, Diputació Girona, Set. 2012

4. Energy impact on Montgrí landscapeCO emissions totals (2005 revision 2011)
42
CO2 emissions totals (2005, revision 2011)
Baix Empordà Gironap
CO2 emissions per capita: 7,3 tnCO2
Total CO2 emissions : 875.743 tnCO2
Source: Inventari de referència d’emissions (2005). CILMA, Diputació Girona, Set. 2012

4. Energy impact on Montgrí landscapeCO emissions due to electricity consumption Baix Empordà
43
CO2 emissions due to electricity consumption. Baix Empordà
Source: Inventari de referència d’emissions (2005). CILMA, Diputació Girona, Set. 2012

4. Energy impact on Montgrí landscapeCO emissions due to natural gas consumption Baix Empordà
44
CO2 emissions due to natural gas consumption. Baix Empordà
Source: Inventari de referència d’emissions (2005). CILMA, Diputació Girona, Set. 2012

4. Energy impact on Montgrí landscapeCO emissions due to oil consumption Baix Empordà
45
CO2 emissions due to oil consumption. Baix Empordà
Source: Inventari de referència d’emissions (2005). CILMA, Diputació Girona, Set. 2012

4. Energy impact on Montgrí landscapeCO emissions due to GLP consumption Baix Empordà
46
CO2 emissions due to GLP consumption. Baix Empordà
Source: Inventari de referència d’emissions (2005). CILMA, Diputació Girona, Set. 2012

4. Energy impact on Montgrí landscapeCO emissions due to urban transport Baix Empordà
47
CO2 emissions due to urban transport. Baix Empordà
Source: Inventari de referència d’emissions (2005). CILMA, Diputació Girona, Set. 2012

4. Energy impact on Montgrí landscapeCO emissions due to solid urban waste management Baix Empordà
48
CO2 emissions due to solid urban waste management. Baix Empordà
Source: Inventari de referència d’emissions (2005). CILMA, Diputació Girona, Set. 2012

4. Energy impact on Montgrí landscapeCO Torroella de Montgrí ‐ Baix Empordà
49
CO2 Torroella de Montgrí ‐ Baix Empordà
CO2 emission tn per capita Total tn/year
Electricity consumption 3,1 – 6 20.000 ‐ 30.000
Natural gas 0,51‐1 0,51 ‐ 1 20.000 ‐ 40.000
Oil consumption 0 – 0,5 2.000 ‐ 3.000
GLP consumption 0 – 0,15 500 – 1.000
Urban transport 3,1 ‐ 6 20.000 – 40.000Urban transport 3,1 6 20.000 40.000
Solid urban waste 0,6 ‐ 1 10.000 – 15.000
TOTAL 7 3TOTAL 7,3

50
1. ENERGY, society and science
2 E i t M t í l d
3 CO emissions in Montgrí Area – Baix Empordà
2. Energy impact on Montgrí landscape
3. CO2 emissions in Montgrí Area – Baix Empordà
4. Current situation and global trends
5. Conclusions: Smart Grids, a driver to shape the landscape of Montgrí plainlandscape of Montgrí plain

5. Conclusions: Smart Grids, a driver to shape the landscape of Montgrí plain
Mid t i ( i ) il d 20 20 20 t t
51
Mid term scenario: (expensive) oil era and 20‐20‐20 targets
Goal ActionImpact on the landscape
1 2 3
1 E Effi i ti d i ti ( t t d ti ) L1 Energy Efficiency active and passive actions (smart meters, education, …) Low
2 Renewables Decentralized energy generation (PV integrated, micro wind) medium
3 Renewables Renewable energy generation (wind and solar farms) high medium
4 CO2 reduction Natural gas distribution network (underground pipes) medium
5 CO2 reduction Urban transport ‐ Public transport, electric vehicles Low
6 CO2 reduction Urban wastes: reuse and recicling. Local treatments Medium
7 Network interoperability bidirecicional power grids (<110kV) and new lines High

5. Conclusions: Smart Grids, a driver to shape the landscape of Montgrí plain
L t i ith t il (*)
52
Long term scenario: without‐oil era (*)
Goal ActionImpact on the landscape
1 2 3
1 Energy Efficiency redefine maximum turism capacity and other activities Low
2 Renewables maximum potential of renewable (wind on‐shore and off‐shore) Very high High
3 Consumer engagement Energy consumer fully integrated into energy value chain Low3 Consumer engagement Energy consumer fully integrated into energy value chain Low
4 Transmission grid export renewables (wind on‐shore and off‐shore) >110kV Very high
5 Network interoperability bidirecicional power grids (<110kV) and new lines High medium
6
7
(*) due to Montgrí area is one of the windiest areas in Catalonia, potentially could develop a role as a net energy producer.

Thanks for your attentionwww smartgrid catwww.smartgrid.cat
“Solar energy, when interacts with bioelements, and it is driven by a high amount of information, provides the necessary resources for the
development of life as we know it. Watching and learning from this process (Biomimetics) will allow us to optimize the electrical system”. [email protected]
![[Smart Grid Market Research] Brazil: The Smart Grid Network, Zpryme Smart Grid Insights, October 2011](https://static.fdocuments.us/doc/165x107/577d20871a28ab4e1e931ff6/smart-grid-market-research-brazil-the-smart-grid-network-zpryme-smart-grid.jpg)
![[Smart Grid Market Research] South Korea: Smart Grid Revolution, Zpryme Smart Grid Insights, July 2011](https://static.fdocuments.us/doc/165x107/5414026d8d7f727d698b47c7/smart-grid-market-research-south-korea-smart-grid-revolution-zpryme-smart-grid-insights-july-2011.jpg)


![[Smart Grid Market Research] India: Smart Grid Legacy, Zpryme Smart Grid Insights, September 2011](https://static.fdocuments.us/doc/165x107/541402518d7f7294698b47d4/smart-grid-market-research-india-smart-grid-legacy-zpryme-smart-grid-insights-september-2011.jpg)


![[Smart Grid Market Research] Smart Grid Index: November 2012 - Zpryme Smart Grid Insights](https://static.fdocuments.us/doc/165x107/541402018d7f728a698b47a5/smart-grid-market-research-smart-grid-index-november-2012-zpryme-smart-grid-insights.jpg)