Smart Cities: Improving the Roadside Environment with Distributed Sensor Systems
31
Smart Cities: Improving the Roadside Environment with Distributed Sensor Systems Christine Kendrick, City of Portland October 28, 2016 PSU Transportation Seminar
-
Upload
trec-at-psu -
Category
Education
-
view
101 -
download
0
Transcript of Smart Cities: Improving the Roadside Environment with Distributed Sensor Systems

Smart Cities: Improving the Roadside Environment with Distributed Sensor SystemsChristine Kendrick, City of PortlandOctober 28, 2016PSU Transportation Seminar

How many regulatory air quality monitoring stations are located within the City of Portland?
(a) 6
(b) 4
(c) 2
(d) 1
2

3
Near-road air quality monitoring
Oregon Department of Environmental Quality (DEQ) I-5 Near Road Monitoring Site
Photos courtesy of Gabe Javier

4
Proximity to Traffic
• Increased exposure
• Increased health risks
Karner et al.. 2010. Near-Roadway Air Quality: Synthesizing the Findings from Real-
World Data. Environmental Science & Technology 2010, 44, 5334-5344.

5
Why networks of low-cost sensors?
• Increase available data for City engineers, planners & public to:
• Improve transportation operations
• Enable assessments of public health & equity
• Evaluate transportation projects
• Advance Portland’s Climate Action Plan goals
• Create opportunities for economic development and civic engagement
Portland’s 20 Minute Neighborhoods

Motivation
• Urban roadsides under-sampled
• Need improved exposure assessment
• Understand the connection between traffic and air quality
• Consider public health in decision making
Photo from Trimet’s Pedestrian Network Activity
6

Opportunity on SE Powell Boulevard
• Sydney Coordinated Adaptive Traffic Signal System (SCATS)
• Traffic volumes
• Cycle lengths
• Green time, red time
7
Screen capture of SCATS loop detectors and phases

Roadside Air Quality Monitoring Station• Curbside Lab for Emissions and Atmospheric Research (CLEAR) Cabinet
8

Annual Aggregation
Short-Term, 15 min Aggregation
Findings
• Using traffic volumes as a proxy for exposure assessment is not a reliable method for shorter time periods
Kendrick et al.. 2015. Diurnal and seasonal variations of NO, NO2, PM2.5 mass as a function of
traffic volumes alongside an urban arterial. Atmospheric Environment, 122, 13-141. 9

10
Findings
• Demonstrated a change in traffic signal settings can be measured through roadside pollutant concentrations
• Matched sampling is a useful analysis tool for observational study with small effects & high variability

Second CLEAR Station- SE 122nd and SE Division
11

Powell-Division Living Laboratory
Portland’s US DOT Smart City Challenge Proposal:
12

13
Need for Sensor Evaluation
• Minimum detection limits vs ambient concentrations
• Interferences with temperature and relative humidity
• Cross-sensitivities with gases
• Solar panel capabilities
Pilot Evaluation • Electrochemical sensors for gases- $200-$250 per
sensor
• Co-located at DEQ monitoring station at SE Lafayette & SE 58th Ave
• DEQ measurements include: • CO• Ozone• NO, NO2• Particulate matter• Meteorology
• AirSense Pro measurements:• CO • NO2• Temp & relative humidity• PM2.5 counts
14

Percent Data Recovery over 19 Day Period• Measurement every 10 minutes
• Sensor 1= 14%
• Sensor 2= 31%
• Sensor 3= 40%
Sensor box 1 on east side of deck. AC powered
Sensor boxes 2 and 3 on west side of deck. Solar powered.
15

Sensor Temperature versus DEQ Temperature
• Biased high compared to DEQ• Most likely measuring internal box temperature and not ambient air
16
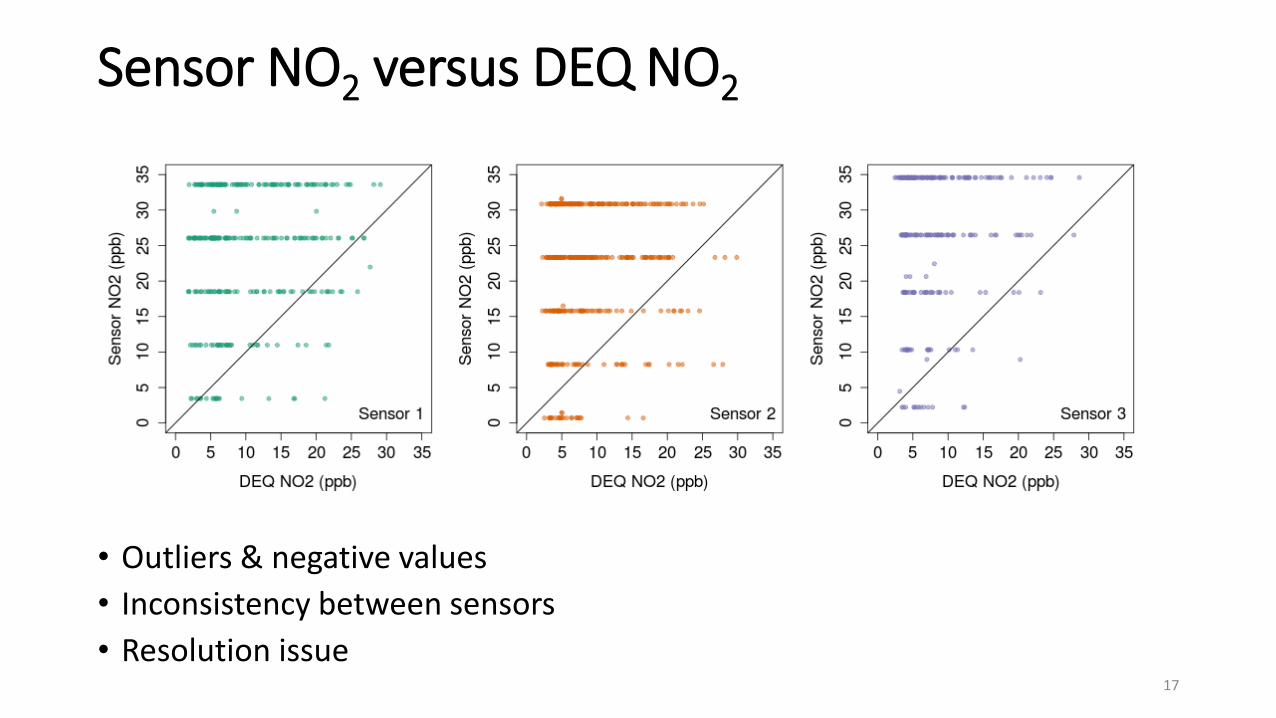
Sensor NO2 versus DEQ NO2
• Outliers & negative values
• Inconsistency between sensors
• Resolution issue17

PM2.5 versus DEQ Aerosols
• Sensors show a bi-modal distribution of PM2.5 count data
• No relationship with DEQ measurements
18

CO Pilot Results
• CO showed the most potential
• Interference issues with ozone and NOx
19

20
Pilot Findings
• Interferences with temperature and relative humidity
• Cross-sensitivities with gases
• Initial pilot results highlighted additional issues:
• Data recovery
• Electronics interferences with pollutant signals
• Sampling inlet design

NIST Replicable Smart City Technologies Cooperative Agreement Grant
Goals:
21
1. Co-located sensor evaluation deployments
2. Develop standards for sensor air quality data:
a. Data formats
b. Data quality
3. Develop specialized guidelines to enable cities to use low-cost air quality sensors

NSF Early-concept Grants for Exploratory Research- Portland State University
Goals:
1. Expand sensor deployment into neighborhoods surrounding study roadways.
2. Incorporate low, mid, and high cost sensors in testbed to create scaffolding of data quality
3. Develop agile data integration system for data management
22
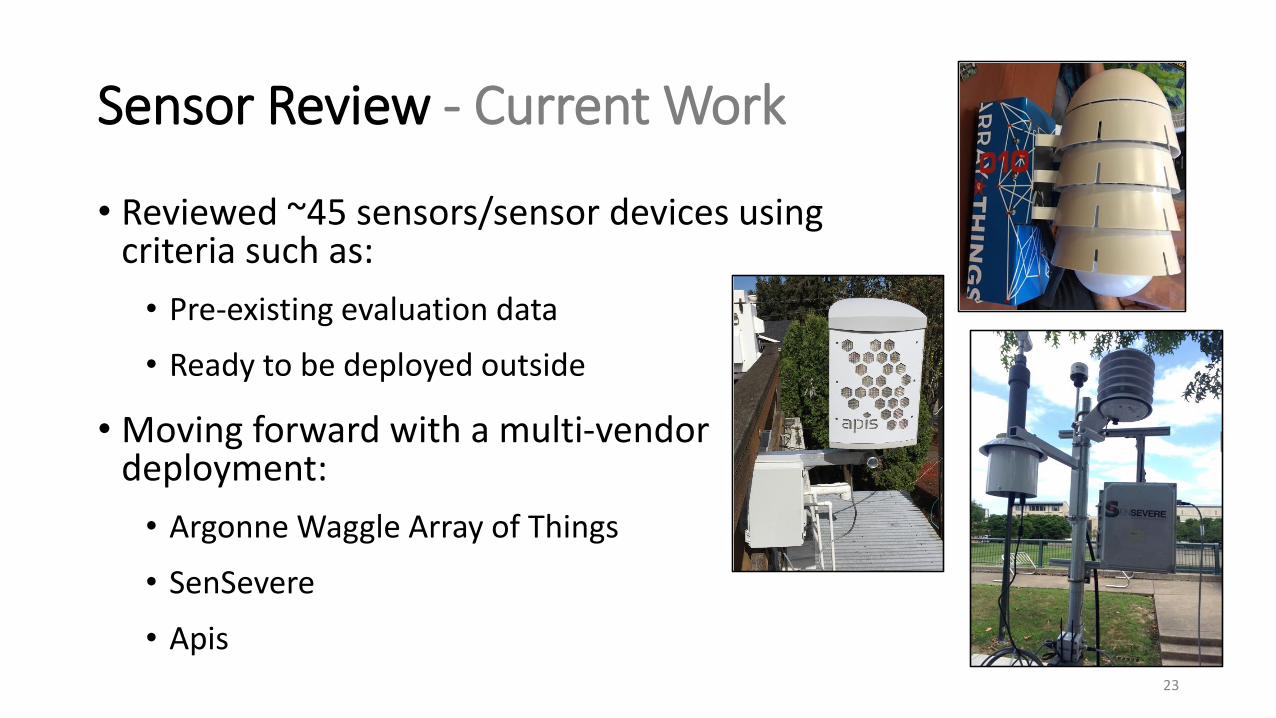
Sensor Review - Current Work
• Reviewed ~45 sensors/sensor devices using criteria such as:
• Pre-existing evaluation data
• Ready to be deployed outside
• Moving forward with a multi-vendor deployment:
• Argonne Waggle Array of Things
• SenSevere
• Apis23

Sensor Recycling - Current Work
• Working with Green Electronics Council (GEC)
• Drafting guidelines for how to improve recyclability of IoT electronics
• Minimize electronics waste
• Maximize ability to repurpose electronics
24

DEQ Co-located Deployment - Upcoming
• AC power accessible
• Compare sensors vs reference instruments
• Compare sensor vs sensor
Oregon’s Department of Environmental Quality (DEQ) urban background monitoring station
25

Roadside Co-located Deployment - Upcoming
• 4-5 month deployment
• Drift over time
• Effects of high pollution environment
• Document what type of maintenance is required
Curbside Labs for Emissions and Atmospheric Research (CLEAR) cabinets
26

Outcomes
• Drafting guidelines for cities throughout every step
• “A Framework for using low-cost sensors for urban air quality monitoring”
• Developing protocols to address data standards
• Publish papers documenting evaluation of sensor performance versus reference instruments and variability between sensors
*Evaluation studies are missing from the research literature
• Internet of Things (IoT) Pilot
27

Future Sensor Network Additions?
• Water quality sensors to an environmental data layer
• Storm water management and maintenance needs
Image from Portland’s Bureau of Environmental Services
28

Future Directions
29
• Open data
• Community engagement
• What are the impacts of short, peak exposure concentrations?
NO 134 ppb

Team
Thank you City of Portland project team members:
• Peter Koonce (Bureau of Transportation)
• Kevin Martin & Michael Armstrong (Bureau of Planning and Sustainability)
Thank you PSU team members:
• Linda George (Environmental Science and Management)
• Kristin Tufte & Dave Maier (Computer Science)
30

Funding
• EPA STAR Fellowship
• NSF GK-12 Fellowship
• NITC Dissertation Fellowship
• NIST RSCT Cooperative Agreement
31