Smallholder agriculture’s contribution to better nutrition · Smallholder agriculture’s...
114
Smallholder agriculture’s contribution to better nutrition Steve Wiggins & Sharada Keats Overseas Development Institute [email protected] 20 March 2013 Report commissioned by the Hunger Alliance
Transcript of Smallholder agriculture’s contribution to better nutrition · Smallholder agriculture’s...

Smallholder agriculture’s contribution to better nutrition
Steve Wiggins & Sharada Keats
Overseas Development Institute
20 March 2013
Report commissioned by the Hunger Alliance

Acknowledgements
We’d like to thank members of the Hunger Alliance who gave us such useful feedback on a
presentation of the main ideas in the report on 25 November 2012, and commented on an
earlier draft report. Also thanks to Helen Hynes from ODI’s Agricultural Development and
Policy team for valuable assistance.
This research was commissioned and funded by the Hunger Alliance, a joint DFID-NGO
consortium which addresses food insecurity and undernutrition and promotes predictable long
term responses to food insecurity. Members include: ActionAid, Action Against Hunger UK,
British Red Cross, CARE International UK, Christian Aid, Concern Worldwide, Oxfam, Save the
Children, Tearfund, World Vision UK; Department for International Development. HA
publications and events are not funded by and do not represent the opinion of DFID.
Overseas Development Institute
203 Blackfriars Road, London, SE1 8NJ
Tel: +44 (0)20 7922 0300
Fax: +44 (0)20 7922 0399
www.odi.org.uk
Disclaimer: The views presented in this paper
are those of the authors and do not necessarily
represent the views of ODI or organisations
that have sponsored and supported the work;
they, including any errors and omissions, are
the responsibility of the authors alone.

Smallholder agriculture’s contribution to better nutrition
i
Contents
Contents i Tables, figures & boxes ii Abbreviations iii Short summary v Summary vii
1 Introduction 1 1.1 Objectives 1 1.2 Food security and nutrition: concepts 2 1.3 Pathways from smallholder agricultural development to food security and nutrition 3 1.4 Approach taken 4 2 How can smallholder agricultural development improve food security and
nutrition? Pathways reviewed 5 2.1 Producing food: availability and its cost 5 2.2 Smallholder agricultural development and incomes 11 2.3 How much is smallholder agricultural development environmentally sustainable? 14 3 How far can smallholder agricultural development contribute to better food
security and nutrition? 17 3.1 Beyond availability and access 17 3.2 Insights from country cases 18 4 How can smallholder agricultural development have a stronger impact on
nutrition? 24 4.1 Empowering women farmers 24 4.2 Addressing the micro-nutrition challenge: home gardens 24 4.3 Complementing farming 28 5 What are political and administrative conditions for progress? 31 5.1 Policies for smallholder agricultural development 31 5.2 Leadership and political conditions 34 5.3 Delivering in the field: co-ordinating activity 38 6 Conclusions and recommendations 39
References 44
Annex A Ghana: star agricultural performance, on track to meeting MDG1 – but
disappointing progress in stunting of pre-school age children 52 Annex B Bangladesh: Good progress on undernutrition over the last 20 years but more
needed to maintain momentum 60 Annex C Tanzania: Disappointing agricultural growth and not enough focus on health or
education of girls means poor progress on child malnutrition 71 Annex D Zambia: Faltering agriculture, slow progress on fundamentals, and high inequality
means high levels of chronic child malnutrition 79 Annex E Kerala: Focus on the fundamentals of health and education means Kerala is a
leading Indian state for child nutrition 86 Annex G WHO classifications of stunting, underweight, and wasting indicators 94 Annex H Scaling Up Nutrition: the thirteen recommended direct interventions 95

Smallholder agriculture’s contribution to better nutrition
ii
Tables, figures & boxes
Tables
Table 2.1 Food production and availability, northern Zambia, mid-1980s 9
Table 2.2 Under-five nutritional status by farmer category, northern Zambia, mid 1980s 10
Table 3.1 Agricultural and economic growth, food availability and poverty 1990–2012 19
Table 3.2 Food security and nutrition 1990–2012 21
Table 3.3 Health, water, sanitation, 1990–2012 22
Table 3.4 Female empowerment, 1990–2012 23
Figures
Figure 1.1 Causes of child malnutrition 3
Figure 2.1 Food production a person, 1961/63 to 2007/09, indexed 5
Figure 2.2 Agriculture and food production, 2007/09 compared to 1961/63 5
Figure 2.3 Cereals prices on the world market, constant, since 1950 7
Figure 2.4 (a) Changes in real household incomes, high potential rural areas, 1980s to 2003/04 12
Figure 2.4 (b) Changes in real household incomes, marginal potential rural areas, 1980s to
2003/04 12
Figure 2.5 Growth multipliers for rural Africa, mid to late 1980s. Impact of extra income from
farm tradables 13
Figure 2.6 Changes in incomes, resurveyed villages, North Arcot District, Tamil Nadu, 1973/74
and 1983/84 13
Figure 3.1 Nominal rates of assistance to agriculture, case countries: early 1980s and early
2000s 20
Figure 4.1 Change in stunting prevalence among children 6–24 months: Shouhardo project area
versus nationwide rural Bangladesh 29
Figure 4.2 Reductions in stunting among 6–24 month olds. Synergies between direct nutrition
activities and other actions 30
Figure 6.1 Extra annual spending needed to end hunger by 2025, by sector and region 43
Figure A.1 Stunting and underweight in pre-school age children in Ghana, 1988-2008 52
Figure A.2 Complementary feeding of under-threes in Ghana, comparing 2003 and 2008: focus
on vitamin A and selected animal products 53
Figure A.3 Agricultural net production indices and growth rates for Ghana, 1990-2010 54
Figure A.4 Stacked supply of different foodstuffs in kilocalories per person per day in Ghana,
1990–2009 55
Figure A.5 Absolute numbers of poor in Ghana compared to population, rural and urban: 1992–
2006 56
Figure A.6 Stunting and underweight of preschoolers in Ghana in 2008 by wealth quintile 56
Figure B.1 Stunting and underweight of children under five, moderate and severe 1990-2011,
Bangladesh 60
Figure B.2 Agricultural net production indices and growth rates for Bangladesh, 1990-2010 62
Figure B.3 Stacked supply of different foodstuffs in kilocalories per person per day, 1990-2009,
Bangladesh 63
Figure B.4 Stunting and underweight rates in Bangladeshi preschoolers by wealth quintile, 2011 64
Figure B.5 Children aged 6 to 59 months in receipt of a vitamin A capsule in the last 6 months,
by characteristic 65
Figure B.6 Percent of infants fed adequately diverse diets frequently compared to stunting rates
in Bangladesh by area, wealth quintile, and mothers’ education, 2011 66
Figure C.1 Stunting and underweight of children under five in Tanzania, moderate and severe,
1992–2010 71
Figure C.2 Agricultural net production indices and growth rates for Tanzania, 1990-2010 73
Figure C.3 Stacked supply of different foodstuffs in kilocalories per person per day, 1990–2009,
Tanzania 74
Figure C.4 Poverty numbers in absolute terms, compared to urban and rural populations, Tanzania, 1992-2007 75
Figure C.5 Literacy levels of young women in Tanzania, compared to selected regions, 1991-
2011 76
Figure C.6 Fertilizer use per unit of arable and permanent cropland in case study countries 78

Smallholder agriculture’s contribution to better nutrition
iii
Figure D.1 Stunting and underweight of children under five, moderate and severe 1992–2010,
Zambia 79
Figure D.2 Agricultural net production indices and growth rates for Zambia, 1990-2010 80
Figure D.3 Stacked supply of different foodstuffs in kilocalories per person per day, 1990–2009,
Zambia 81
Figure D.4 White maize prices in Zambia, 2004-2012 82
Figure D.5 Poverty rates in absolute numbers, compared to urban and rural populations:
Zambia, 1991-2006 82
Figure E.1 Population and average annual growth rates (in boxes) of case study locations, 1990-
2012 86
Figure E.2 Stunting and underweight rates in Kerala, compared to neighbouring states and the
national average 1993-2006 87
Figure E.3 Numbers of poor in Kerala compared to population, rural and urban: 1994-2010
estimate 89
Figure E.4 Female, male, and average literacy rates in Kerala compared to India nationally,
1991-2011 90
Figure E.5 School enrolment of children in different income groups in rural Kerala, compared to
India nationally and neighbouring states, 1993-94 91
Boxes
Box A Policy frameworks for food security and nutrition 35
Abbreviations
ACF Action Contre la Faim
ADB Asian Development Bank
BCC Behaviour Change Communication
BDHS Bangladesh Demographic and Health Survey
BINP Bangladesh Integrated Nutrition Plan
CFA Comprehensive Framework for Action
CIDA Canadian International Development Agency
CIMMYT International Maize and Wheat Improvement Centre
CPI Consumer Price Index
DFID Department for International Development (UK)
DHS Demographic & Health Surveys
ENHANCE Expanding Nutrition and Health Achievements through Necessary Commodities and Education (USAID)
FAO (STAT) Food and Agriculture Organization of the United Nations (Statistical Service)
FPMU Food Planning and Monitoring Unit (Bangladesh)
GAM Global Acute Malnutrition – sum of severe acute malnutrition and moderate acute malnutrition
GDP Gross Domestic Product — the market value of all officially recognized final goods and services produced within a country in a given period of time
GHS Ghana Health Service
GIEWS Global Information and Early Warning Systems (FAO)
GPS Global Positioning System
GSP Gross State Product
GSS Ghana Statistical Service
Ha Hectares
HFP Homestead Food Production
HKI Helen Keller International
HLTF The Secretary-General's High Level Task Force on the Global Food Security

Smallholder agriculture’s contribution to better nutrition
iv
Crisis (UN)
IFA Iron and Folic Acid
IFAD International Fund for Agricultural Development
IFPRI International Food Policy Research Institute
IMF International Monetary Fund
IRDP Institute of Rural Development Planning (Tanzania)
LBW Low Birth Weight
LIC Low Income Country
LMIC Lower Middle Income Country
M Million
MCHN Mother and Child Health and Nutrition
MDG Millennium Development Goal
MICAH Micronutrient and Health programme, implemented 1996 to 2005 in Ethiopia,
Ghana, Malawi, Senegal and Tanzania by World Vision Canada
NGO Non-Governmental Organisation
NNSP National Nutrition Surveillance Project (Bangladesh)
NRA Nominal Rate of Assistance (to agriculture)
OECD Organisation for Economic Cooperation and Development
OFSP Orange-Fleshed Sweet Potato
ORS Oral Rehydration Salts
PL480 Public Law 480, also known as Food For Peace
QPM Quality Protein Maize
SHOUHARDO Nutrition programme implemented by CARE in Bangladesh, it stands for
Strengthening Household Ability to Respond to Development Opportunities. Also means ‘friendship’ or ‘amity.’
SIS Small Indigenous Species
SUN Scaling Up Nutrition – a global push for action and investment to improve maternal and child nutrition
TGR Total Goitre Rates
UN SCN United Nations Standing Committee on Nutrition
UNESCO United Nations Educational, Scientific, and Cultural Organisation
UNICEF United Nations Children’s Fund
WDI World Development Indicators (World Bank)
WFSP White-Fleshed Sweet Potato
WHO World Health Organisation (United Nations)
WIN Empowerment of Women in Irrigation and Water Resources Management for Improved Household Food Security Nutrition and Health

Smallholder agriculture’s contribution to better nutrition
v
Short summary
Food insecurity and under-nutrition remain pressing problems in the developing world. Despite
their direct contribution to food production, small-scale farmers and their households are
disproportionately vulnerable to hunger. How then can smallholder agriculture that is
sustainable contribute to improving food security and reducing under-nutrition?
Potentially, smallholder agriculture can improve food security by making food available through
production; reducing the real cost of food by increasing supply; generating incomes for
farmers and those working the land as labourers, as well as to others in the rural economy
from linkages in production and consumption that create additional activity and jobs. Other
considerations include the way that increased rural incomes are spent; impacts on women’s
incomes, status within the household, and through the demands of farm work, the ability of
mothers to allocate income to food and care of young children; the effect of farm work on
energy of field workers; and, impacts on health of field workers and those living close to
farms.
The record shows:
Worldwide, and especially in the developing world, the production of food has increased ahead of population growth for most of the last fifty years.
Much of this increase in availability has come from small-scale family farms, particularly in Asia;
Increased food production has led to falling real prices of food, especially for staples, with benefits to those vulnerable people who have to buy in most of their food;
Smallholder agricultural development usually leads to higher farm incomes, even when output prices may be pushed down by rising production,
owing to improved productivity. Increasingly, however, incomes from off the farm — in services, public employment, businesses — tend to rise more. Links from smallholder agricultural development to the rest of the rural economy, especially
when farmers spend increased incomes on locally-supplied goods and services, can be strong;
Smallholders who focus on production of crops for sale can also increase their food security and nutrition, since commercial production from smallholdings is also often associated with increased food production and higher
incomes. Under some conditions, however, nutrition may be impaired by cash crops; as, for example, when the demands of these crops mean that women working in the fields have too little time to feed and care for infants;
Given appropriate technical knowledge and skill, some of it learned from other farmers, secure tenure and the incentive of markets, smallholder agricultural
development can support food security and nutrition outcomes while being environmentally sustainable.
Smallholder agricultural development can be steered to have a greater impact on food security
and nutrition through three measures.
Empower women farmers, both to allow them more control over income and household spending — which usually leads to more being spent on the feeding and
care of young children, as well as to correct for unequal access to labour and inputs that means that women’s plots often achieve lower yields than men’s;
Promote home gardens and small-scale livestock rearing for increased diversity of production and consumption. Children’s nutrition often improves: effects that are stronger when these programmes are combined with education on diet, child care and hygiene; and,

Smallholder agriculture’s contribution to better nutrition
vi
Complement agricultural programmes with education and communication, health services, water and sanitation. Smallholder agriculture cannot achieve better nutrition alone.
Four points stand out for policy-makers:
1. Smallholder agricultural development can be an excellent way to reduce poverty and tackle hunger in low income countries. Encourage this by making sure
that rural investment climate is conducive to investment and innovation. Provide rural public goods roads and other physical infrastructure, schools, health, clean water, agricultural research and extension. Improve access to inputs, insurance and finance
for smallholders and improve their terms of engagement in such markets. Develop and promote innovations for marginal farms. Recognise and protect the rights of small farmers to their land.
2. Patterns of agricultural development need steering towards more diversified food production. Production of staples has increased more than foods with more
diverse nutrients. For every person who suffers from undernourishment in the world, more than twice as many suffer from deficiencies in minerals and vitamins. Hence promote home gardens, with small-scale livestock rearing — including fish.
Complement this up with communications for nutrition, health and child care. Monitor the adoption of emerging bio-fortified staples of maize, rice and sweet potato by
farmers.
3. Back up smallholder agricultural programmes with primary health care, clean
water and sanitation, other direct interventions for nutrition, and female empowerment. Empowered and educated mothers are time and again shown to spend incomes on their young children and to protect the nutrition and health of the
household. Correct female disadvantages in farming: through recognising and strengthening women’s rights to fields and common property resources; directing attention to women’s needs in farming and finding ways to support them; and in
general, developing innovations both on field and in domestic tasks, such as water supply and fuel collection, that save time and appropriate for women. Make sure that girls living in rural areas are schooled through until the end of secondary.
4. Greater political support for improving food security and nutrition is needed. Political support for nutrition is often lukewarm: perhaps because of ignorance of the
problems, or because the remedies can seem dauntingly difficult for problems with multiple causes. Monitor and survey more often the state of food security and nutrition, to highlight the problems and to see where and when progress is being
made. Regular national surveys of nutrition and food security should be conducted, at least once every five years, preferably every three years. Sentinel sites could be established for more frequent monitoring of food and nutrition, using text messaging
to collect information in real time. Pilot innovations, then evaluate these rigorously, compare them to counter-factuals, and publicise the results.
These policies either have low costs or are not additional to the funding what would be needed
for any serious programme of development. FAO in 2011 estimated the extra annual
spending required to eliminate hunger by 2025 as US$50.2 billion, including US$7.5
billion for food and cash-based safety nets in keeping with the twin-track approach of dealing
with long-term chronic hunger while also addressing short-term needs. Most of the extra
investment is for physical infrastructure, and mostly in Sub-Saharan Africa and South Asia.
An extra US$50 billion a year may sound a lot, but consider the figure for sub-Saharan Africa
of US$13.3 billion more. This is about US$15.50 for each of the 854M living in the region. The
costs are small compared to the numbers who will potentially benefit from better food security
and nutrition.

Smallholder agriculture’s contribution to better nutrition
vii
Summary
Objective and approach
Food insecurity and under-nutrition remain pressing problems in the developing world. Some
852M persons in the developing world, 15% of the total, were estimated to be undernourished
and so unable to meet their minimum energy requirements in 2010–12, while among children
under five years old, 29% were stunted and 18% were underweight. Micro-nutrient
deficiencies, especially of vitamin A, iodine, iron and zinc, are even more widespread, with
perhaps as many as two billion persons affected owing to insufficient vitamins and minerals in
their diet.
Despite their direct contribution to food production, small-scale farmers and their households
are disproportionately vulnerable to these forms of hunger. Hence this paper addresses the
question of how can smallholder agriculture that is sustainable contribute to improving food
security and reducing under-nutrition?
Food security, following FAO definition and concepts, is achieved when individuals have the
food they need to live their lives: it depends on sufficient, adequate food being available;
people having access to it; food being well utilised; and on reliable availability and access.
Adequate nutrition depends partly on access to food, but also on the health environment and
child care.
Smallholder agriculture can potentially affect food security and nutrition through the following
pathways:
1 Making food available through production;
2 Reducing the real cost of food by increasing the supply of food. The composition of
production also matters, since this affects the availability and prices of different foods
with their varying nutrients;
3 Generating incomes for farmers and those working the land as labourers, that allow
access to food; and through
4 Providing incomes to others in the rural economy from linkages in production and
consumption that create additional activity and jobs.
In addition, in some circumstances the following may be equally important:
1 Whether incomes from agriculture are spent on food, especially higher value foods rich in
vitamins and minerals, as well as on health, water and sanitation — all factors that may
improve the nutrition of household members and especially infants;
2 Impacts of agriculture on women’s incomes, status within the household, and through
the demands of farm work, the ability of mothers to allocate income to food and care,
especially of young children;
3 The effect of farm work on energy of field workers: hard labour may create high
demands for energy that cannot be met from limited access to food; and,
4 Impacts on health, both on field workers who may be exposed to hazards such as
accidents, crop chemicals, zoonoses and to others whose environment may be impaired
by agriculture — as, for example, when irrigation canals become habitats for disease
vectors such as mosquitoes and worms.
This paper examines the contribution of smallholder agricultural development to attaining
improved food security and nutrition, how development policy might strengthen its
contribution, what complementary actions are needed, and what the political conditions for
better policy may be.
The literature has been reviewed, including reports of agricultural programmes explicitly and
specifically designed to reduce malnutrition. Since the relations of agriculture to food security,
and nutrition especially, are diverse and only explain part of the outcomes, five countries were
selected to look in more detail at the interplay of smallholder agricultural development with

Smallholder agriculture’s contribution to better nutrition
viii
other determinants of food security and nutrition. The cases comprise two with relatively rapid
agricultural growth, Ghana and Bangladesh, two with relatively slow agricultural growth,
Tanzania and Zambia, and Kerala State, India where agriculture has also grown slowly, but
which has seen a concerted effort to improve other basic factors affecting undernutrition.
Smallholder agriculture and food security and nutrition
Food availability and cost. Worldwide, and especially in the developing world, the
production of food has increased ahead of population growth for most of the last fifty
years. Much of this increase in availability has come from small-scale family farms,
particularly in Asia.
From the early 1960s, world food production per person has increased by one third. In the
developing world, in Asia the quantity has doubled, in South America increased by more than
80%, and only for Africa has production increased more slowly than the world average —
although even in this case, production has increased slightly more than population growth.
This increased food production can lead to falling real prices of food, especially for
staples, with benefits to those vulnerable people who have to buy in most of their food. Given
the inelastic demand for staple foods, small increases in supply ahead of demand can lead to
sizeable falls in prices. Between 1960 and 2000, the prices of maize, rice and wheat in
constant terms fell by 69%, 72% and 66% respectively on world markets. Given the strong
contribution of smallholder farming to increased production, it has contributed to falling food
prices. Since the mid-2000s, prices have spiked and remain above their 2000 levels: but they
are still well below prices in 1960.
Incomes of farmers and other rural households. Smallholder agricultural development
usually leads to higher farm incomes, even when real output prices may be pushed down by
production increases, owing to improved productivity. Increasingly, however, incomes from off
the farm — in services, public employment, businesses — tend to rise more. Links from
smallholder agricultural development to the rest of the rural economy, especially when farmers
spend increased incomes on locally-supplied goods and services, can be strong — with every
extra dollar of agricultural incomes generating another 1.4 or more in the rest of the rural
economy, and thereby giving others more access to food.
Cash versus food crops. Smallholders who focus on production of crops for sale can also
increase their food security and nutrition, since commercial production from smallholdings is
also often associated with increased food production and higher incomes. Under some
conditions, however, nutrition may be impaired by such a focus on cash crops; as for example,
when the demands of these crops mean that women working in the fields have too little time
to feed and care for infants.
Environmental sustainability. With the right support, smallholder agricultural development
can support food security and nutrition outcomes while being environmentally sustainable. Two
cases, Machakos, Kenya and the central plateau of Burkina Faso, show that intensification and
agricultural development can go hand in hand with conservation of soil and water and indeed
enhancement of the environment. Appropriate technical knowledge and skill, some of it
learned from other farmers, secure tenure and the incentive of markets for surplus produce
are amongst the reasons for the conservation seen in these cases.
Smallholder agriculture’s contribution to food security and nutrition
Smallholder agriculture can clearly do much to improve people’s availability and access to
food. But how far does this lead to improved food security and nutrition? Cross-country
evidence suggests that while low incomes correlate with child stunting (low height for age, an
indicator of physical development), only about half the variation in stunting can be explained
by income differences. Much of the remainder is attributable to health conditions, water and
sanitation and levels of female empowerment.

Smallholder agriculture’s contribution to better nutrition
ix
The five country cases provide insights into the interplay of smallholder agricultural
development with other variables. Ghana and Bangladesh show what strong agricultural
growth from smallholdings, where policy has supported farming, can achieve. Poverty has
been reduced, food prices pushed down, with clear benefits to food security and nutrition. They
also show, however, what may be lacking for nutrition, especially in the case of Ghana where
progress on health, sanitation, and women’s empowerment has been limited. Increased food
production in Bangladesh, moreover, has relied too much on rice, with little commensurate
increase in complementary crops to the detriment of dietary diversity.
Tanzania and Zambia show what may happen when smallholder agricultural growth is
limited, owing at least in part to lack of policy support, and in Zambia when overall economic
growth is restricted as well. With food availability per capita just keeping up with population
growth in Tanzania, and falling behind in Zambia, while poverty remains high and falling
slowly, it is no surprise that gains to nutrition have been limited. The few gains seen look to
arise from the improving health of under-fives. In both these cases, lack of agricultural
development is compounded by failure to improve water and sanitation and to empower
women, the last an acute problem in Zambia.
Despite limited economic and agricultural growth, Kerala has high levels of food security and
low malnutrition, owing to strong public support for health, water, education, and female
empowerment for decades. On the other hand, limited agricultural growth and apparently low
food availability may explain why nutrition has not improved more in the last twenty years.
Kerala’s social progress is an object lesson to the rest of India and indeed the world.
How can smallholder agricultural development have a stronger impact on nutrition?
Recent reviews suggest three ways in which smallholder agricultural development can be
steered to have a greater impact on food security and nutrition.
Empower women farmers, both to allow them more control over income and
household spending — which usually leads to more being spent on the feeding and
care of young children, as well as to correct for unequal access to labour and inputs
that means that women’s plots often achieve lower yields than men’s, when all
other factors are held constant;
Promote home gardens and small-scale livestock rearing for increased
diversity of production and consumption. Since gardens and small-scale livestock
are often carried out by women — being close to the house can make them more
compatible with women’s time, they tend as well to , as well as to empower women
giving them more incomes and status. Evaluations in several countries show that
households that have improved home gardens have higher production of micro-
nutrient-rich foodstuffs, higher consumption of these, and increased sales in local
markets. Children’s nutrition often improves: effects that are stronger when these
programmes are combined with education on diet, child care and hygiene.
Bio-fortification of staple foods with nutrients such as Vitamin A and iron shows
promise, but so far these varieties have only been piloted and have yet to adopted
at scale. They may come to be useful complement, but for the time being home
gardens are probably a better route to more diversified diets; and
Complement agricultural programmes with education and communication,
health services, water and sanitation. Smallholder agriculture cannot achieve
food security and nutrition alone. But, combined with complementary rural services,
the outcomes are powerful. For example, Shouhardo, a programme that works on
all these areas with poor households in some of the poorest areas of Bangladesh,
has managed to bring down stunting of under-twos by 16 percentage points
between 2006 and 2010, at a time when no progress was seen nationally. It
Smallholder agriculture’s contribution to better nutrition
x
suggests that it may be easier to make progress in improving the fundamental
determinants of nutrition than some believe.
Policies for nutrition-sensitive smallholder development
Policy to encourage smallholder development, as for agriculture as a whole, has come
back into the limelight in the new century. A broad consensus exists on policies for
development of agriculture, and smallholder agriculture in particular. Governments need to do
two things above all else. One is to ensure that there is a rural investment climate that
encourages agricultural investment and innovation; the other to supply rural public goods
including physical infrastructure of roads, power lines, in some areas irrigation and drainage;
investments in education, health care, clean water and sanitation; and knowledge generation
through agricultural research, preferably that takes account of indigenous knowledge and
extension. Both conditions, and especially the second, matter especially for smallholders, since
unlike some large-scale commercial farmers who may have the means to access some of these
goods and services privately, they cannot.
While these basic conditions can do much to stimulate agricultural growth, many smallholders
face difficulties in accessing markets, and especially those for inputs, insurance, financial
services and technical assistance. Remedies for failings in rural markets are debated, however:
the answers may lie variously with institutions such as contract farming that give farmers
access to inputs on credit; or in farmer co-operation that makes it easier to negotiate credit or
inputs in bulk; or else in direct state provision to replace the market where it does not
function.
Women farmers face disadvantages, some specific to the roles assigned to their gender,
others being more intense manifestations of problems that many male smallholders face. To
correct some of the worst disadvantages, women need secure access to land, access to
markets, ways to reduce the risks faced possibly by micro-insurance, and extension that
attends to women farmers and their needs. Other public goods can complement agricultural
interventions: ensuring that girls get at least secondary education can contribute in lowering
barriers to communication, as well as raising female status. Clean water supplies can reduce
the time taken to draw household water and reduce child sickness. Health services are likely
to be of particular benefit to mothers. Shouhardo in Bangladesh shows what can be achieved
when deliberate actions are taken, through group work, to empower women.
Leadership and political conditions
Food security and nutrition need political support, preferably at high level. Presidential or
Prime Ministerial support was a feature of success in Brazil, Ethiopia and Peru. There
may be no science to firing the imagination of leaders, but there are indications of factors that
can contribute. One of these is the creation of convincing narratives that are widely shared.
Good experiences can inspire imitation, so that piloting innovative approaches to
smallholder agricultural development and nutrition can capture the imagination. Civil
society can help make results known; researchers can ensure that reviews are rigorous so that
they cannot be readily dismissed by sceptics
Pressure for governments to take food security and nutrition more seriously can come from
international efforts, witness the efforts of the Special Rapporteur on the Right to Food. More
pressure can come from civil society that can monitor progress towards better food security
and nutrition, as well as track commitment of resources to programmes — as has been seen in
India.
Holding government and leaders to account depends on having information and data. At
national level, data on food security and nutrition outcomes, preferably disaggregated by sex,
needs to be collected regularly. With advances in information technology, most notably mobile
phones, the possibility of much more agile data collection and processing arises. Text
messaging coupled with GPS, for example, might allow indicators of food security and nutrition
to be collected monthly from sentinel sites across nations and regions, with almost no delay in

Smallholder agriculture’s contribution to better nutrition
xi
feeding the results back to decision-makers and the public, the results being presented in
easily appreciated maps.
Co-ordinating field efforts
Marrying smallholder development to other efforts to improve food security and nutrition
involve co-ordinating the efforts of several agencies. Central co-ordination units at high level
may work, but not always: much depends on the political support they receive.
Complementary actions may be better arranged locally.
Funding can contribute to co-ordination, so long as public funds are disbursed from one
source, such as finance ministries. The danger here is that external funds channelled directly
to operating agencies to avoid delays can give them the liberty to ignore other agencies.
Programmes need to fit with local circumstances and capabilities: these should be overloaded
and overwhelmed by over-ambitious programmes. The art here is to simplify the vertical
structures of programmes, while allowing them to become more complex at the field level as
elements are combined to increase the coverage and attractiveness of the programme.
The MICAH programme, operating in four African countries, did this by a broad package of
interventions rather than relying on single ‘magic bullets’, but then allowed community
participation to tune the package to local needs. The technical integrity of the programme was
nevertheless ensured by technical support and regular supervision of field staff, plus
monitoring of results that allowed programmes to be adjusted when it was clear that they were
not making headway.
A balance needs to be struck between the limits of what may be possible locally, against
impatiently demanding that programmes include all proven interventions.
Conclusions and recommendations
Four points stand out from this review and form the basis of policy conclusions and
recommendations.
1. Smallholder agricultural development can be an excellent way to reduce poverty
and tackle hunger in low income countries. It can increase food production, raise rural
incomes, and push down food prices; all of which should improve the access of poor and
vulnerable people to food and thereby contribute considerably to improving their food security.
Given that many of those who are food insecure work in agriculture, then its effects can be
direct.
The implication is to continue with efforts to develop agriculture and especially that of small-
scale family farms. Some of the ways to do this are reasonably well known, hence the first two
recommendations:
R1: Countries need to ensure that the rural investment climate is conducive to
investment and innovation. This means peace and security, a reasonably stable
macro-economy without major economic distortions, and the establishment and
recognition of critical institutions, such as property rights. Those who suffer most from
investment climates that deter investment are small-scale enterprises, including
smallholdings. Large businesses may be able to protect themselves from insecurity,
macro-economic chaos and the absence of property rights: smallholders can only do so
by retreating to autarkic subsistence economy, usually of low productivity.
This may seem a tall order for low income countries that face multiple challenges; but
experience shows that the rural investment climate does not have to be ideal; only that
the worst failings are eliminated.
R2: Countries need to invest in rural public goods, including: physical
infrastructure — rural roads, electricity, perhaps irrigation and drainage where

Smallholder agriculture’s contribution to better nutrition
xii
applicable; human development — education, water and sanitation, health; and public
knowledge through agricultural research and extension. Again, these are particularly
valuable for smallholders who cannot substitute private investments for most of these
public goods.
Spending on public goods in rural areas pays off, both in returns on investment and in
reductions of the numbers of people living in poverty: as can be seen from studies of
returns to these investments in Asia when agricultural development was particularly
rapid (Fan et al. 2007).
Prime responsibility for these lies with domestic governments, but donors can help with
some of the capital costs of public investments.
After these, comes a more challenging matter where the responses to the problem are
in debate, but in any case will vary by circumstances.
R3: Improve the access to rural markets, especially for inputs, insurance and
finance, for smallholders and improve their terms of engagement in such
markets. Currently the majority of small-scale farmers in Africa engage much less with
markets than the gains to specialisation and use of external inputs would suggest. Part
of the reason for this lies in high costs of information and negotiations between
enterprises in the supply chain such as banks and small family farms. Responses will
need to be tailored to conditions, but promising ways to improve lie in institutional
innovations such as contracting and in producer organisations.
Finding effective solutions requires innovative programmes that may be too risky for
governments and donors, and hence may be better managed by NGOs, foundations and
private enterprise. More effort, however, needs to be made to learn from these
experiences, so that where effective solutions are proved, they can be replicated more
widely by public programmes.
While these policies will allow some smallholders to develop their farms, other farms
marginal either by their very small size, poor quality of soils and climate, lack of labour,
or remoteness from services and markets may need additional measures. In particular,
on the more marginal holdings farming is often part-time, one of several livelihoods
that household members pursue. Hence labour may be scarce, and working capital may
also be lacking.
R4: Develop and promote innovations for marginal farms, focusing on higher
yields for staples but using few external inputs and where possible saving labour. These
will allow these farms to achieve the self-provisioning in staples that is often a primary
objective of the farm, as well as potentially allowing some of the land to be switched to
more diverse, nutrient-rich fruit, vegetables and small-scale livestock rearing.
Responsibility for this lies with agricultural research systems, although for some
researchers taking up this challenge may require setting aside the search for optimal
yields. There is scope here for NGOs to foster exchange of experiences from local
innovations and NGO research.
Smallholders and especially the more marginalised, need assurance that their land
rights are respected both in recognition of their entitlements and to remove any
disincentive there may be to invest, innovate and conserve.
R5: Recognise and protect the rights of small farmers to their land. This may
mean some form of registration of rights, but it may mean recognising local authorities
that define land rights. Two particular issues are to ensure the recognition of women’s
rights as farmers, especially those of widows; and of safeguarding against land being
taken away in land deals without free, prior and informed consent.
Smallholder agriculture’s contribution to better nutrition
xiii
Responsibility here lies with governments, although there are roles for civil society in
making sure that laws, rules and practice are respected and in bringing abuses to
attention.
Last but not least, smallholder agriculture can be environmentally sustainable and
increasingly will have to be in a world where natural resources will be in short supply,
further ecological damage will carry too high a price for future generations and where
global warming will lead to climate change and increasingly volatile weather.
R6: Give sufficient support to make sure that smallholder agricultural
development is environmentally sustainable. This can be encouraged by
agricultural research & extension that engages with local needs, knowledge and
perceptions of the relation of farming to soil, water, and other parts of the local
ecology. When better farming practice confers external benefits, farmers should be
rewarded for this.
Given the size of this challenge this will require not only appropriate domestic policies,
but also support from international policy-making to promote global public goods — and
prevent global bads, with major roles for research both technical and social to find
responses to the challenges including those of climate change.
2. Patterns of agricultural development need steering towards more diversified
food production. Progress on food security and better nutrition has been greater on
food availability than on food access, and on access to energy-rich foods than on those
with more diverse nutrients. For every person who suffers from undernourishment in the
world, more than twice as many suffer from deficiencies in minerals and vitamins. Part of
the answer lies with more diversified food production, that may also reduce risk in
production and markets for smallholders. The problem of the focus on energy-dense
foodstuffs is likely to become ever more pressing this century, with urbanisation and
rising incomes allowing people to adopt diets high in energy, sugar and salt that have
already taken their toll in the diseases of affluence seen in most OECD countries.
Production of foodstuffs rich in micro-nutrients needs encouragement.
Agricultural policy can contribute, even if wider changes in diet will be necessary in the
medium term.
R7: Promote home gardens, with small-scale livestock rearing — including fish,
and back this up with communications for nutrition, health and child care. This
costs little, while the returns can be disproportionate. A key challenge here is ensuring
smallholders have access to good seed.
R8: Monitor progress on bio-fortification of staples, especially their adoption
by farmers. Since this technology is not yet proven at scale, this should not be seen as
the primary and still less the only way to tackle micro-nutrient deficiencies. Home
gardens, for example, can be promoted at the same time. Even if bio-fortified crops do
become taken up widely, people will want to consume foods complementary to their
staples as well.
Responsibility here lies with domestic governments, with ministries of agriculture in the
lead, but working in co-operation with those of health, community development and so
on. NGOs have a role to play in piloting and demonstrating effective models,
documenting them and bringing them to the attention of governments.
3. Back up smallholder agricultural programmes, with complementary actions in
primary health care, clean water and sanitation, other direct interventions for
nutrition, and female empowerment. Agriculture can play a key role in reducing hunger,
but it needs to be supported by actions in these other spheres. Female empowerment may be
the outstanding complement to both agriculture and actions on health, water and so on.

Smallholder agriculture’s contribution to better nutrition
xiv
Empowered and educated mothers are time and again shown to spend incomes on their young
children and to protect the nutrition and health of the household.
R9: Back up agricultural development with commensurate investments in
primary health care, clean water and sanitation, and BCC on diet, child care
and hygiene. These measures include the direct nutrition interventions recommended
in the SUN initiative, but they should not be the only ones, however valuable as they
may be. The concern that progress in shifting the deeper causes of malnutrition would
be too slow may exaggerate if the striking results of programmes such as Shouhardo in
Bangladesh are considered.
R10: Correct female disadvantages in farming: this will not only raise production
and improve the pattern of production, but also help empower rural women and
overcome longstanding unfairness. Priorities include recognising and strengthening
women’s rights to fields and common property resources; directing attention to
women’s needs in farming and finding ways to support them; and in general,
developing innovations both on field and in domestic tasks, such as water supply and
fuel collection, that save time and appropriate for women. Making sure that girls living
in rural areas are schooled through until the end of secondary will underpin these
measures.
Prime responsibility lies with national governments, where the challenge is to co-
ordinate the actions of different agencies. At central level this may consist of little more
than political leadership and budget co-ordination by finance ministries: the detailed
operational co-ordination may be simpler at district level than attempting to decide this
centrally. NGOs and donors may support these efforts by funding innovative
programmes that can show how these programmes may work in specific countries.
4. Greater political support for improving food security and nutrition is needed.
Political support to is often lukewarm: perhaps because of ignorance of the problems, or
because the remedies can seem dauntingly difficult for problems that have multiple causes.
How to generate political support may not be certain, but at least two things seem promising.
R11: Monitor and survey more often the state of food security and nutrition, to
highlight the problems and to see where and when progress is being made. At
the moment, statistics in many low income countries with high rates of food insecurity
and malnutrition are few, collected infrequently, and some, such as those for
undernourishment of individuals, are unreliable. Statistics on micro-nutrient deficiency
are particularly rare. Regular national surveys of nutrition and food security should be
conducted, at least once every five years, preferably every three years. Sentinel sites
could be established for more frequent monitoring of food and nutrition (see Barrett
2010). This could take advantage of text messaging to collect information in real time,
so that policy-makers and their advisers have information accurate to the month on the
state of food insecurity.
R12: Pilot innovative approaches, then evaluate these rigorously with counter-
factuals wherever possible, and publicise the results. Currently much is tried, but
much either passes without review or is not sufficiently well evaluated to convince
sceptical readers. Not all pilots will succeed of course, but some will: understanding in
broad terms what works can inspire action — and political will.
Civil society can play a role in generating information to draw attention to problems and
opportunities, then making sure that key messages reach leaders, opinion-makers and
the general public.
Final consideration: costs
These recommendations have not been costed item by item, partly because some are policies
that have low costs, if they have any monetary cost at all; but mainly because most of what is
recommended here is not additional spending over and above what would be needed for any
programme of development. Most of the recommendations are for adjusting the use of
Smallholder agriculture’s contribution to better nutrition
xv
resources that are already being funded, or would be funded under a serious development
effort.
That said, FAO has recently (Schmidhuber & Bruinsma, 2011) estimated the extra annual
spending required to eliminate hunger by 2025 as US$50.2 billion, including US$7.5
billion for food and cash-based safety nets1 in keeping with the twin-track approach of dealing
with long-term chronic hunger while also addressing short-term needs. Most of the extra
investment is for physical infrastructure, and mostly in Sub-Saharan Africa and South Asia.
An extra US$50 billion a year may sound a lot, but consider the figure for sub-Saharan Africa
of US$13.3 billion more. This is about US$15.50 for each of the 854M living in the region. Not
to labour the point: the costs are small compared to the numbers who will potentially benefit,
and the importance to them of food security and nutrition.
1 Without the consumption safety nets, the extra spending is equal to around US$42 billion per year (constant 2009), the figure called for in the IF campaign launched in 2013.


Smallholder agriculture’s contribution to better nutrition
1
1 Introduction
1.1 Objectives
Food insecurity and under-nutrition remain pressing problems in the developing world. Some
852M persons in the developing world, 15% of the total, were estimated to be undernourished2
in 2010–12 (FAO 2012). Amongst children under five years old, 29% are stunted3 and 18%
are underweight4 (UNICEF 2012). Micro-nutrient deficiencies are even more widespread, with
perhaps as many as two billion persons affected, most of them suffering from a lack of vitamin
A, iodine, iron or zinc (UN SCN 2004).
For two reasons, this report focuses on small-scale farms (‘smallholdings’), operated by
households, largely with their own labour. One, these farms are home to about 430M
households in the developing world,5 perhaps two billion persons in all. Two, despite
smallholders farming and producing food, their incomes are usually lower than average for
their countries, rates of poverty are above average, and many households are vulnerable to
hunger: IFPRI (2005) estimates that most persons in absolute poverty live on small farms; as
well as half the undernourished in the world, and for Africa, three-quarters of malnourished
children.
How then can smallholder agriculture contribute most to improving food security and reducing
under-nutrition? The following sets of questions are addressed:
1 What is known about the contribution of smallholder agricultural development to
attaining improved food security and nutrition? Under what conditions is sustainable
smallholder agricultural development most effective in improving food security and
nutrition?
2 How can agricultural development policy and programmes be designed, implemented and
monitored to have a stronger effect on supporting sustainable smallholder production to
achieve food security and nutrition outcomes, both directly through the nutrition of
farming households and indirectly through their contribution to the reduction of poverty
and food prices — without neglecting other objectives or raising costs disproportionately?
What specific sustainable smallholder livelihood programmes have been undertaken to
improve nutrition and dietary diversity at the household level? What implications of cost-
effectiveness can be drawn?
3 What complementary actions on the underlying determinants of nutrition — primary
health care, water and sanitation, female education — are needed to ensure that
sustainable smallholder agricultural development has a strong impact on attaining food
security and nutrition? Are there additional implications for gender equity and
governance?
4 What are the political conditions under which progress is most likely to be made? What
evidence is there of political commitment and cross- governmental approaches to
supporting environmentally sustainable smallholder livelihoods to improve and monitor
progress in food security and nutrition? Has civil society played a role in this?
2 Undernourishment implies individuals not getting enough energy in their diet sufficient to lead a healthy and active
life. 3 Defined by height for age: children who are 2 standards deviations or more below the median for their age are
considered stunted. 4 Defined by weight for age: children who are 2 standards deviations or more below the median for their age are
considered underweight. 5 Although a precise definition of a smallholding may be elusive, FAO has adopted a two hectare threshold as a broad
measure of a small farm. There are roughly 450 million farms in the world smaller than two hectares. Most of these in the developing world (Nagayets 2005).

Smallholder agriculture’s contribution to better nutrition
2
1.2 Food security and nutrition: concepts
A commonly used framework to explain the causes of food insecurity comes from FAO
(2008), building on the following definition of food security adopted by the World Food Summit
of 1996:
Food security exists when all people at all times have physical and economic access
to sufficient, safe and nutritious food to meet their dietary needs and food
preferences for an active and healthy life.
From that, it is proposed that people will only be food secure when: sufficient food is available;
people have access to it; it is well utilised; and when availability and access are reliable. Food
availability is influenced by the production of food, modified by storage, transport and trade.
Globally, there has been no shortage of food for more than half a century. Given obstacles to
transport and delays, locally there can, however, be food shortages temporarily.
Food access is related in large part to incomes including implicit income from farm
households’ own production, as well as other entitlements such as gifts, loans and transfers
from government. Sen (1981) stressed the importance of entitlements in determining who
suffers during famines, arguing that almost all famines in the twentieth century were the result
of entitlement or access failures, rather than from food being unavailable.
Reliable availability and access: not only should access to available food not vary
significantly by season and year, but also people should feel secure of access to food, they
should not fear that they will go hungry at some time or other. The unfortunate reality is that
many people living in poverty, especially those whose livelihoods depend on farming or other
activities influenced by variable weather, do face significant risks of losing access to food.
Food utilisation comprises those factors that intervene between having food and this
translating into adequate nutrition: it includes the way that food is distributed within
households, how it is prepared, care of infants and their feeding, and the health of those
eating the food. Since each of these considerations can be quite complicated, this dimension is
not always fully appreciated:
… outside the nutrition community dialogues about food security often remain
focused on household-level access to sufficient food energy... (Arimond et al.
2011)
Since these dimensions of utilisation are so important for the nutrition of young children,
UNICEF created a framework to show the causes of child malnutrition, mortality and disability,
see Figure 1.1: a frame that has been widely used and adapted in the twenty or more years
that it has been in circulation. This sees two immediate determinants of child malnutrition:
inadequate diet and disease. These in turn originate from three factors: insufficient access to
food; inadequate care; and poor water, sanitation and health services. Behind these lie the
political, economic and social reasons that govern how food and public services are produced
and provided, and how they are distributed. Nutrition is thus the outcome of multiple factors
interacting in complex systems. The key point here is that food insecurity is only one of the
factors leading to undernutrition.

Smallholder agriculture’s contribution to better nutrition
3
Figure 1.1 Causes of child malnutrition
Poor water/
sanitation and
inadequate health
services
Child malnutrition,
death and disability
Inadequate
maternal and child-
care practices
Insufficient access
to food
Quantity and quality of actual
resources - human, economic
and organizational - and the
way they are controlled
Potential resources: environment, technology, people
Figure 1: Causes of Child Malnutrition
Inadequate
dietary intakeDisease
Basic
causes at
societal
level
Outcomes
Immediate
causes
Underlying
causes at
household/
family level
Political, cultural, religious,
economic and social systems,
including women’s status, limit the
utilization of potential resources
Inadequate and/or
inappropriate
knowledge and
discriminatory
attitudes limit
household access to
actual resources
Source: The State of the World’s Children 1998
Source: The State of the World’s Children, reproduced in Pelletier 2002
1.3 Pathways from smallholder agricultural development to food security and nutrition
These frameworks help set out the expected pathways from smallholder agricultural
development to food security and nutrition,6 as follows:
1 Agriculture produces food, thereby making it available. To the extent to which food can
be produced and stored locally at moderate cost, this can reduce temporary local
shortages;
2 Increased food supplies will tend to push down the prices of food, thereby improving the
entitlement and access to food by people with limited incomes. The pattern of production
matters here, since the availability and prices of different foods with their varying
nutrients depend on what is produced. Diverse production, including fruit and vegetables
as complements to staple crops, makes a diverse diet rich in micro-nutrients more
accessible and affordable;
6 This draws partly on Gillespie et al. 2012 who set out seven ways that agriculture can affect nutrition in India.

Smallholder agriculture’s contribution to better nutrition
4
3 Agriculture provides incomes to farmers and those working the land as labourers,
incomes that may be taken directly as food produced on farm. Incomes allow access to
food in markets; and,
4 Agriculture generates links to other activities, such as those in the supply chain where
increases in farm output generate additional activity, jobs and incomes for those working
in the chains. Similarly, as farmers and labourers spend incomes earned from farming,
those providing goods and services for rural communities also see additional activity,
jobs and incomes. Hence the access to food of others outside of farming may also
increase.
In addition, in some circumstances the following may be important as well:
1 The extent to which income from agriculture is spent on food, especially higher value
foods, rich in vitamins and minerals, as well as on health, water and sanitation — all
factors that may affect nutrition of household members and especially infants. This is
related to the next pathway;
2 Impacts of agriculture on women’s incomes, status within the household, and through
the demands of farm work, the ability of mothers to allocate income to food and care,
especially of young children;
3 The effect of farm work on energy of field workers: hard labour may create high
demands for energy that cannot be met from limited access to food; and,
4 Impact on health, both on field workers who may be exposed to hazards such as
accidents, crop chemicals, zoonoses and to others whose environment may be impaired
by agriculture — as, for example, when irrigation canals become habitats for disease
vectors such as mosquitoes and worms.
While agriculture can thus affect some important determinants of food security and nutrition, it
may not often be a major influence on two of the underlying determinants of child
malnutrition: care and health.
1.4 Approach taken
To answer the questions, literature has been reviewed on the pathways outlined from
smallholder agricultural development to improved food security and nutrition. Reviews of
agricultural programmes explicitly and specifically designed to reduce malnutrition were of
particular relevance.
Since the relations of agriculture to food security, and nutrition especially, are diverse and only
explain part of the outcomes, five countries were selected to look in more detail at the
interplay of agricultural development with other determinants of food security and nutrition.
These were chosen from developing countries of special interest to DFID7, the main object
being to look at how countries with differing agricultural growth have seen changes in food and
nutrition security. The countries comprise:
Two with relatively rapid agricultural growth, Ghana and Bangladesh;
Two with relatively slow agricultural growth, Tanzania and Zambia; and
One state of India with slow agricultural growth, but which has seen a concerted
effort to improve other basic factors affecting undernutrition: Kerala.
For each of these cases, available data and statistics on agricultural growth, poverty reduction,
health, water and food and nutrition security from 1990 to the present, together with relevant
analyses and literature, were reviewed. Detail of each of the countries appear in Annexes A to
E.
7 The selected countries are also all on the list of 36 countries identified in the Lancet (Black et al. 2008) that carry 90% of the stunting burden for which financing needs related to the Scaling up Nutrition (SUN) framework were estimated by Horton et al. 2009.
Smallholder agriculture’s contribution to better nutrition
5
2 How can smallholder agricultural development improve food security and nutrition? Pathways reviewed
2.1 Producing food: availability and its cost
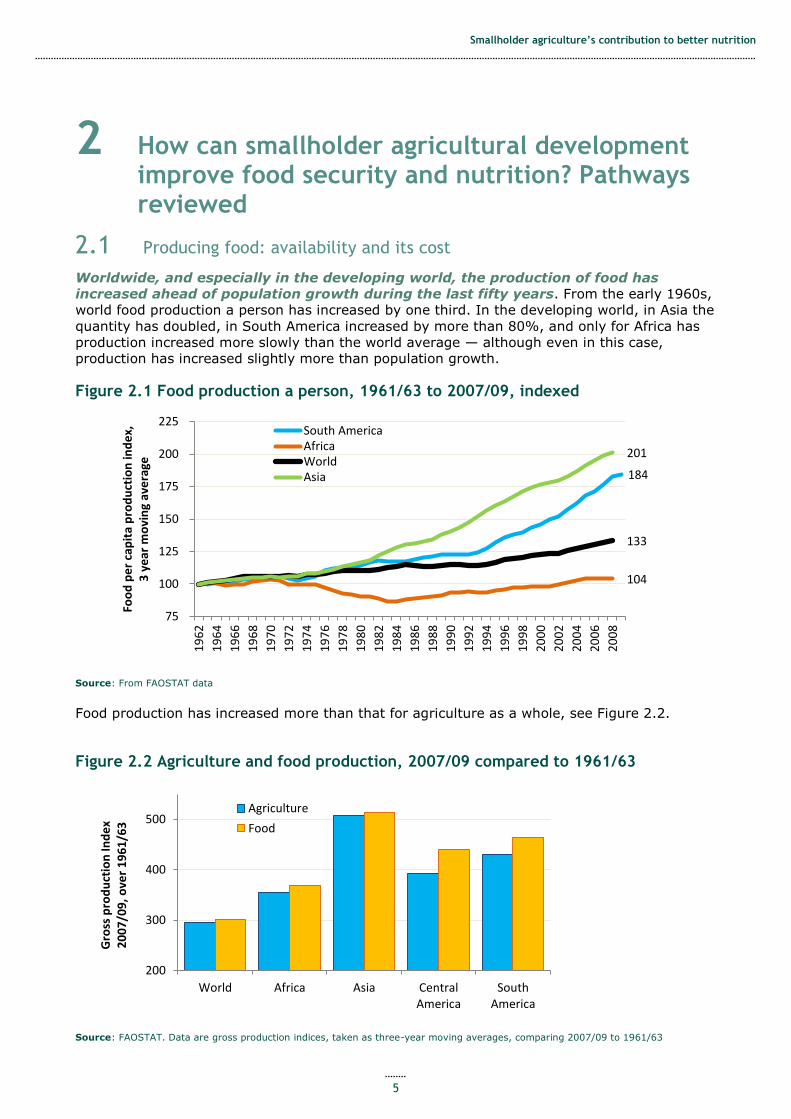
Worldwide, and especially in the developing world, the production of food has
increased ahead of population growth during the last fifty years. From the early 1960s,
world food production a person has increased by one third. In the developing world, in Asia the
quantity has doubled, in South America increased by more than 80%, and only for Africa has
production increased more slowly than the world average — although even in this case,
production has increased slightly more than population growth.
Figure 2.1 Food production a person, 1961/63 to 2007/09, indexed
Source: From FAOSTAT data
Food production has increased more than that for agriculture as a whole, see Figure 2.2.
Figure 2.2 Agriculture and food production, 2007/09 compared to 1961/63
Source: FAOSTAT. Data are gross production indices, taken as three-year moving averages, comparing 2007/09 to 1961/63
184
104
133
201
75
100
125
150
175
200
225
19
62
19
64
19
66
19
68
19
70
19
72
19
74
19
76
19
78
19
80
19
82
19
84
19
86
19
88
19
90
19
92
19
94
19
96
19
98
20
00
20
02
20
04
20
06
20
08
Foo
d p
er
cap
ita
pro
du
ctio
n in
de
x,
3 y
ear
mo
vin
g av
era
ge
South AmericaAfricaWorldAsia
200
300
400
500
World Africa Asia CentralAmerica
SouthAmerica
Gro
ss p
rod
uct
ion
Ind
ex
20
07
/09
, o
ver
19
61
/63
Agriculture
Food

Smallholder agriculture’s contribution to better nutrition
6
That there is more food available today compared to half a century ago, despite this period
having seen the world population more than double from 3.1 billion to 6.75 billion, has been
largely due to the ‘green revolution’ that began in the late 1960s across the developing
world (see Hazell 2009, Lipton & Longhurst 1989). This involved the application of higher-
yielding varieties of maize, rice and wheat, with much greater use of manufactured fertiliser
and crop protection chemicals, usually supported by irrigation.
The green revolution, however, was uneven with greater impact, being effective in areas of
irrigation, for the three main grains, and in those countries that were able to roll out the
technical improvements with extensive state support to farmers in technical assistance, input
supply, seasonal credit and guaranteed prices for additional crops offered for sale. Hence it had
its greatest impact in Asia, then Latin America, and only sporadically and weakly in Africa.
It has also entailed some environmental losses, as for example in acidification of soils from
continuous use of fertiliser, loss of diversity of crop varieties, salination of poorly-drained
irrigated land, and over-drawing of groundwater from tubewells (Hazell, 2002).
How much of this agricultural development came from small farms?
Although production data are rarely reported in the developing world by farm size, we can be
reasonably sure that smallholders have made a large contribution to the increases seen. Most
of the additional production from the green revolution, at least in Asia, came from family farms
of less than ten hectares — many considerably less. The technology based around improved
seeds was neutral to scale: applicable on very small fields. Initial adoption of the new seeds
may have been by the larger family farmers, but within a decade most smallholders in areas
suited to the new varieties had adopted (see Hazell & Ramasamy 1991 for the case of northern
Tamil Nadu).
China is perhaps the outstanding example from Asia: after land reforms and collectivisation
under Mao, almost no large private holdings were left in China by the time the reforms of 1978
re-instated small-scale family farming from previous collective production. The remarkable
acceleration in agricultural growth that took place subsequently should prove, if proof were
necessary, that small farms are no barrier to rapid agricultural growth.
Much the same can be said for agricultural development in Africa where the majority of farms
are smallholdings. Examples of successful agricultural development in Africa (see, for example,
Gabre-Madhin & Haggblade 2001, Wiggins 2000), are almost entirely accounts of increased
production from smallholdings.
For Latin America, however, the answer would be different: here much of the increase in
output have come from medium to large farms. Some therefore see that in this region, the
same results would not have been forthcoming from small family farms. The Asian experience
suggests otherwise.
Lower food prices as production of food increases
Increased food production can lead to falling real prices of food, especially for
staples. Given that the demand for staple foods is inelastic, small increases in supply ahead of
demand can lead to sizeable falls in prices.
Worldwide, between 1960 and 2000, the prices of maize, rice and wheat in constant terms fell
by 69%, 72% and 66% respectively, see Figure 2.3. Most of the increase in the volume of
cereals that made this possible came from developing countries, rather than from the OECD
countries. Since the mid-2000s, prices have spiked and remain well above their 2000 levels:
but they are still well below prices in 1960.

Smallholder agriculture’s contribution to better nutrition
7
Figure 2.3 Cereals prices on the world market, constant, since 1950
Source: From Timmer, 2008, supplemented by statistics from IMF commodity price records
At national level, the effect can be equally strong. Between 1980 and 2003, the real8
wholesale price of rice on the Dhaka market in Bangladesh fell by more than 40% (Food
Planning and Monitoring Unit data and authors’ calculation). In this period, Bangladeshi rice
production rose from around 150 kg a person a year, to more than 185 kg, owing in large part
to the use of higher-yielding varieties of rice and irrigation that allowed more frequent
cropping.
Cash versus food crops
A longstanding concern is that production by smallholders for the market, especially of non-
staples, might see farmers, especially smallholders, replace their food crops for their own
consumption with cash crops for sale and thereby reduce their food security.
An early review of this, Maxwell & Fernando (1989), reported that at national level, countries
that produce more cash crops also tend to produce more food crops as well. Does that still
apply, almost a quarter century later? If the growth of production of cereals in the developing
world is compared to the growth of other agricultural produce from 1990 to 2010, the
correlation is high: 0.95 for Africa, 0.97 for South America and 0.91 for Asia. There is little to
indicate that staple food production trades off against that of other agriculture.
What happens on individual farms is, however, perhaps more important. At farm level cash
crops could reduce household food security and nutrition in three ways:
Through reduced production of food on farm leading to lower domestic
consumption, coupled with …
… failure to spend any incomes from cash crops on food or other items that might
contribute to nutrition, such as water and health care; and,
8 Prices were deflated using the non-food Dhaka middle-income Cost of Living Index (and the national CPI after June 1998)
0
500
1,000
1,500
2,000
2,500
0
100
200
300
400
500
600
700
8001
95
0
19
52
19
54
19
56
19
58
19
60
19
62
19
64
19
66
19
68
19
70
19
72
19
74
19
76
19
78
19
80
19
82
19
84
19
86
19
88
19
90
19
92
19
94
19
96
19
98
20
00
20
02
20
04
20
06
20
08
20
10
US$
a t
on
ne
, co
nst
ant
20
07
pri
ce o
f ri
ce
US$
a t
on
ne
, co
nst
ant
20
07
pri
ce o
f w
he
at a
nd
mai
ze
Wheat
Rice [right axis]
Maize

Smallholder agriculture’s contribution to better nutrition
8
Increased demands on the labour of caregivers leading to less care of infants, in
particular too little time to prepare and serve complementary foods.
So then, how widespread and severe are these potential dangers?
Case studies suggest that smallholders, at least in the early stages of development,
tend not to specialise their production, even as they produce more for the market.
For example, Leavy (2007) for Zambia and Sharp et al. (2007) for Ethiopia report farm
households diversifying their crops and livestock for market, rather than expanding a single
enterprise. In Kenya, in areas that have grown coffee for export since the 1950s, it was still
the case in the 1980s that as little as 10–20% of the land was under coffee, the rest being
devoted to diverse food crops, despite the returns to coffee being far higher than those to
staples (Haugerud 1988). In the same country Tiffen (1992) reported the same reluctance to
depend on markets for staple foods in Machakos District in the late 1980s and early 1990s.
Two reasons explain this. One, farm households dislike the increased risk from relying
on a single crop for income. Two, they try to produce a large share of staples for home
consumption, since they do not trust local markets to have staple foods in stock at
reasonable prices. As Heltberg (2001:3) puts it for Africa, the tendency to add cash crops to
existing food production activities can be attributed to the:
‘… urge for food self-sufficiency in environments of large transaction costs and high
risks found in many sub-Saharan African countries’.
The returns to producing staples for home consumption, moreover, may be underestimated
since the value of foods consumed at home is not their value in sale, but rather their cost of
acquisition were they not produced at home. In many rural areas there is a major wedge
between these two valuations, thanks to high transport costs to markets (Low 1986).
Indeed, the relation between cash and food crops may be the reverse of that feared: growing
cash crops may boost staples production at the same time. Cash incomes can allow better
seed or fertiliser to be bought for the staple crop, or for more labour to be used in weeding and
other operations likely to raise yields. Oyugi et al. (1987) reported that farmers in South
Nyanza, Kenya growing tobacco did not cut back on food production; instead they used
earnings to invest in food crops. In Gokwe, Zimbabwe a household survey from 1996 showed
that cotton farmers had higher yields on their food plots, when controlling for the effects of
household assets, education and location (Govereh & Jayne 2003). On contract farming
schemes a common observation is that some of the fertiliser and chemicals supplied to grow
the cash crop is diverted to staples. For example, in northern Ghana part of the fertiliser
supplied by companies was switched to food crops (Dorward et al. 1998). In other cases,
fertiliser applied to an annual cash crop planted in rotation with staples may confer some
residual benefits to the staple grown the year after. This has been seen for maize and sorghum
after cotton is grown in the Sahel (Bassett 1988), as well as for rice sown on plots previously
under green beans in Madagascar (Minten et al. 2011).
The complementary relation can apply in the other direction: higher yields from fields of
staples has tended to promote cash cropping, sometimes as pre-condition for this to take
place. In Kenya, the spread of coffee and other cash crops in densely-settled central parts of
the country was boosted by the introduction of hybrid maize that made it possible to feed the
household off a smaller maize plot (Tiffen et al 1994).
Studies that allow comparison of volumes of marketed produce with volumes of staples
produced across different households, commonly report that the two correlate positively, not
negatively. For example, in Zambia in the 1980s, as farm sizes increased, so did area to food
crops and the amount of staple food retained for home consumption, see Table 2.1.

Smallholder agriculture’s contribution to better nutrition
9
Table 2.1 Food production and availability, northern Zambia, mid-1980s
Farmer Category: 'subsistent' 'emergent' 'commercial'
Average family size 6 6 6
Average number of
dependents
2 2 2
Farm area (ha.) 1.94 2.72 4.51
Farm area (ha.) devoted to
food crops
1.57 1.66 1.80
Average quantities of food retained by households
Bags of maize 4 7 11
Finger millet (kg) 13 17 18
Beans (kg) 106 279 420
Source: IRDP (Serenje, Mpika, Chinsali), reproduced in Moore & Vaughan 1987
Turning to the second issue, is additional income from agricultural sales spent on food, health,
water and sanitation that would probably improve child nutrition? Produce sold by men may
then see them spend the money on things other than the basic needs of the household, at
worst drinking and gambling away precious funds. The dangers are greatest when incomes
from sales come in large lumps, exacerbating the temptation to spend unwisely.
Although not much evidence can be found on the spending patterns of commercialised small
farmers , reports from the 1980s on the marginal spending of small farmers in Burkina Faso,
Niger, Senegal and Zambia show that more than half of additional income was likely to be
spent on food and drink. More detailed breakdowns for Burkina Faso show that most of the
food spending, and more than half of all marginal spending, was on cereals (Delgado et al.
1998). While this is reassuring, more evidence would be welcome.
Does commercial production by smallholders raise workloads to the detriment of child care?
Producing commercial crops and livestock on small farms nearly always raises the total amount
of labour used. That does not necessarily, however, mean that members of the households
work longer or harder: hired labour may take the strain, and indeed, the additional income
may encourage some households to take some of their gains in less time worked on fields or in
stables. But it can mean more effort, as one women interviewed in Machakos poignantly
reported:
'My father could sing and dance, but I have no time.' (Tiffen et al. 1994,: 175)
It is perhaps not the amount of the work that matters, but who gets additional work: if it falls
to women, then there are concerns that children may lose out.
This has been a persistent problem in northern Zambia where women are expected to take
care of children but also do much of the farming of food gardens — in the past this has been
exacerbated by the men migrating to work in the copper mines, so that many households have
been headed by females with little male labour to help. In the 1940s it was observed that
meals were infrequently prepared, to the detriment of young children who need frequent
meals. Maize commercialisation, even with oxen, in the 1970s and 1980s used more female
labour. Studies showed increased child malnourishment with commercialisation despite
households having more staples of all kinds (see Table 2.2). The most likely explanation was
lack of female labour to prepare food and especially weaning foods (Moore & Vaughan 1987).

Smallholder agriculture’s contribution to better nutrition
10
Table 2.2 Under-five nutritional status by farmer category, northern Zambia, mid 1980s
Farmer category No. of 90 kg bags of maize
sold to Provincial Marketing
Union
Proportion of farm
households with adequate
nutrition of children
Proportion of households
where children showed
mild malnutrition
‘subsistence’ 0 70 26
'emergent' 1-30 52 41
'commercial' 30 + 50 44
Source: lRDP (Serenje, Mpika, Chinsali), Reproduced in Moore & Vaughan 1987.
Note: Sample consisted of 205 households containing 166 children aged 6 to 60 months.
Gillespie & Mason (1991) report studies, mainly from the 1980s, where mothers’ work did
affect the nutrition of infants in the Philippines, Kerala, and south India; but results were
qualified by the usually positive impact of additional earnings by mothers. In some cases, it
was seasonality that mattered: for example, when demands for planting crops coincided with
higher incidence of disease to which infants were particularly vulnerable.
In a more recent and particularly detailed study from rural Nepal, Paolisso et al. (2001) report
that preschool children were less likely to get care from mothers working on cash crops when
there was only one child: but when there was more than one child, field work did not detract
from child care. Reasons for this surprising outcome included the stronger demand on mothers’
time from multiple children, plus the likelihood that mothers with several children would have
received more education and training. This study confirms that the relation between farm work
by mothers and child care is neither straightforward nor direct, and may be mediated by a
wide range of factors.
Detailed pathways aside, what have been the observed impacts of cash cropping by
smallholders on nutrition? In the late 1980s and early 1990s, the International Food Policy
Research Institute (IFPRI) carried out surveys designed to investigate the links between
commercialisation and nutrition in the Gambia, Guatemala, Kenya, the Philippines and
Rwanda. This was complemented by reviews from India, Malawi, Papua New Guinea, Sierra
Leone and Zambia. The key findings from these studies (see the synthesis by von Braun 1995)
were:
Generally smaller farms participated less in commercialisation schemes, but when
they did their degree of participation was often higher than larger farms;
In most cases, commercialisation increased staple food crop production either by
bringing in new land or by increasing yields;
Commercialisation usually meant more work in the fields with corresponding
increases in the use of hired labour. In some cases it also meant more off-farm
work as well. Much of the work on commercial enterprises was carried out by men;
Income increased in most cases for participants, whilst the demand for hired labour
often spread the benefits of increased output. Total household income increased by
less than the increase in crop income, given the importance of off-farm earnings for
most households; and,
In almost all cases higher income meant better child nutrition, although the relation
was quite weak. There was, however, little evidence, other than for Sierra Leone, of
nutrition getting worse under commercialisation.
They concluded that smallholder commercialisation does not usually impair food security
and nutrition, but that increased incomes only improve nutrition weakly. These findings were

Smallholder agriculture’s contribution to better nutrition
11
confirmed and qualified by DeWalt’s (1993) review of these and similar studies. She concluded
that:
First, the income effects of shifts to cash cropping are highly dependent on pricing
policy for cash crops. Short term gains seen in some schemes are often highly
dependent on the maintenance of high prices for commercial crops.
Second, those schemes in which subsistence production is protected or stabilized
are more likely to show positive results with an increase in income generated from
cash cropping.
Third, increased income does not translate directly into increased food consumption
at either the household or individual (child) level. Shifts in control of income from
women to men are important.
Fourth, morbidity, especially from diarrheal disease is an important predictor of
child growth. A failure to improve morbidity of children may offset gains in food
consumption and in some instances a decrease in the time women have to care for
their children as a result of commercialization has resulted in greater morbidity
among children.
Hence it is not whether farming is for subsistence or sale that matters, but rather prices for
cash crops and food, access to land, and who has control over produce and income
(DeWalt 1993).
2.2 Smallholder agricultural development and incomes
Smallholder agricultural development should raise the incomes of farmers and thereby improve
access to food. While there is much evidence from single period surveys to show that farm
incomes are greater for farmers with more agricultural production, data sets that show how
farm incomes change through time are less common. Those that do exist, however confirm the
expected relation.
For example, from the mid-1950s onwards, agricultural development was relatively rapid in
the highlands of Machakos District, Kenya as farmers first planted coffee, then later began
small-scale dairying and vegetable growing. These were accompanied, and indeed made
possible, by the intensification of food crops, such as maize using hybrids, thus sparing the
amount of land that had to be planted for home consumption — even as rapid population
growth meant the land was divided into ever smaller plots. (Tiffen et al. 1994) When
households were surveyed in the early 1990s, it was clear that agricultural development had
led to rising farm incomes a head in Machakos. Output on farms per capita, measured in maize
equivalents, had risen from 54 in 1930 to 137 in 1987.
In Ibarapa District, south-west Nigeria, between the 1960s and 1980s, production of
cassava, maize and tomatoes sold to the growing cities of the region increased. Returns to
farm work, and hence incomes, over the two decades rose by 25% (Guyer 1992).
For Bangladesh, Philippines, Tamil Nadu (India) and Thailand, household surveys in the
1980s were compared to those in the mid-2000s (Otsuka & Yamano 2008) to examine changes
in real household incomes, with comparisons possible between areas of high and marginal
potential, see Figure 2.4. It is clear that in all cases other than marginal areas of Thailand,
farm incomes had risen over the twenty or so years between surveys. Those increases were
quite modest, however, often less than a 25% increase. Overall rural household incomes
increased by more, since in all cases except high potential Tamil Nadu, non-farm incomes rose
by much more — a point that will taken up in the next paragraph.

Smallholder agriculture’s contribution to better nutrition
12
Figure 2.4 (a) Changes in real household incomes, high potential rural areas, 1980s to 2003/04
Figure 2.4 (b) Changes in real household incomes, marginal potential rural areas, 1980s to 2003/04
Source: Compiled from data in Otsuka & Yamano 2008.
Note: Incomes were measured in constant terms. More detailed breakdown of these statistics, moreover, show that income gains were
more or less equal across social groups defined by access to land: income gains were broadly shared and not concentrated amongst
any landholding class.
As important as gains to farm households, are those to others who benefit from smallholder
agricultural development. Increased farm output can create additional jobs, both on
and off farms. The most notable link is rising demand for labour on small farms as
production rises. Crops grown for sale can have high labour requirements. In
Machakos, Kenya small farms with coffee, fruit and vegetables typically hired in the equivalent
of one full-time worker for each hectare cultivated (Tiffen 1992). In the Guinea savannah of
northern Nigeria in the 1980s maize production for sale boomed, encouraged by urban demand
and the spread of improved varieties. Labour demand on fields rose, raising wages and
drawing in migrants to the zone (Goldman & Smith 1995). Some intensively grown vegetables
can generate huge demands for labour. For example, exported snow peas from (very) small
farms in Guatemala required 600 days of labour per hectare meaning that growers were hiring
in more hands to cope (von Braun et al. 1989).
Some of the stronger links arise through consumption, in jobs created when small farmers with
additional incomes spend on locally produced goods and services — including furniture,
entertainment, food and drink, and house improvements. Some estimates of multipliers in
rural Africa can be high (Delgado et al. 1995), see Figure 2.5. Most of the effect comes from
consumption rather than production. The high indices reflect the high fractions of additional
income likely to be spent locally.
-
1
2
3
4
5
6
7
8
9
10
11
Philippines Thailand Bangladesh Tamil Nadu
Total
Farm
Non-Farm
-
1
2
3
4
5
6
7
8
9
10
11
Philippines Thailand Bangladesh Tamil Nadu
Total
Farm
Non-Farm

Smallholder agriculture’s contribution to better nutrition
13
Figure 2.5 Growth multipliers for rural Africa, mid to late 1980s. Impact of extra income from farm tradables
Source: Delgado et al. 1994
Note: Different estimates relate to degree of tradability of marketed farm produce
One of the most remarkable observations of the power of these linkages comes from North
Arcot District, Tamil Nadu during the 1970s. In this case modest increases in rice
production, at around 1% a year over the decade, from irrigated fields as improved
varieties of rice were adopted, led to a doubling of real incomes and welfare of the
poorest in the surveyed villages, including landless labourers (see Figure 2.6).
Figure 2.6 Changes in incomes, resurveyed villages, North Arcot District, Tamil Nadu, 1973/74 and 1983/84
Source: from Table 3.7, Hazell & Ramasamy 1991
Increased production of rice, plus more dairy cattle, led to more demand for workers in input
supply, in processing and marketing of produce; as well as in local services and manufacturing
to meet the demand of farmers with additional incomes. Small farmers apparently withdrew
from the rural labour market as their more productive farms now absorbed household labour,
while income rises made working for low pay off the farm unattractive. The combination of
reduced supply of labour and increased demand for workers meant more paid days and
increased wages for landless labourers (Hazell & Ramasamy 1991).
0
1
2
3
4
Burkina Faso,
1984/85
Niger, 1989/90 Senegal,
Central
Groundnut
basin, 1989/91
Senegal, SE
Groundnut
basin, 1989/92
Zambia,
Plateau,
1985/86
Local National Regional
1,199
2,764
1,732
935
1,187
2,286
3,268
2,032 2,102
1,837
500
1,000
1,500
2,000
2,500
3,000
3,500
Small paddy farms Large paddy farms Non-paddy farms Landless laborers Non-agriculturalhouseholds
Ru
pp
es
pe
r h
ou
seh
old
, 1
97
3/7
4 v
alu
e
1973/74 1983/84

Smallholder agriculture’s contribution to better nutrition
14
In sum, evidence suggests that smallholder agricultural development can generate higher
incomes that should thereby improve food security through better access to food.
2.3 How much is smallholder agricultural development environmentally sustainable?
Alarming reports of agricultural development harming the environment can be found. Some of
these deal with the impacts of large-scale, capitalised farming. But equally smallholders with
little capital and employing limited external inputs can harm the environment, especially when
they lack support from research and extension. The following problems feature frequently in
these accounts, and can be seen in the country cases:
Repeated cropping of soils that lead to over-extraction of nutrients, leaching of
nutrients, and soil erosion — see, for example, Koning & Smaling 2005, Sanchez
2002. In 2006, the International Centre for Soil Fertility (Henao & Baanante 2006)
suggested that African soil nutrients were, on average, depleted five times quicker
than they were renewed. They see this as resulting from population pressure:
‘...high population density in many countries already exceeds the long-term
population carrying capacity of the land’. Concerns over soil erosion are frequent in
Tanzania and Zambia, although the degree and extent of the problem are not
precisely known;
Overgrazing of pastures;
Conversion of valued habitats, above all forest, to arable and grazing land —
resulting in loss of biodiversity [UN & ADB 2012, Rosegrant et al 2007]. In Ghana
forests declined from 7.4M ha in 1990 to 4.9M ha in 2010, being lost at a rate of
about 2% per year (FAOSTAT & WDI), while in Tanzania area under forest reduced
from 41M ha in 1990 to 34M ha in 2009, (FAOSTAT). In both cases, clearance for
fields was the main driver.
Land conversion is especially worrying since large amounts of carbon are often
released as gas, thereby contributing to global warming and climate change; and,
Drawing down of aquifers by excessive water abstraction, especially when wells are
used to pump out groundwater (UNESCO 2006). Bangladesh and Kerala have both
seen water tables falling from heavy use of tubewells for irrigation, as well as for
domestic uses in the case of Kerala.
Problems correspond in large part to population density, pressure on land and the way in
which agriculture then grows. In Africa where population density is often quite modest,
agriculture has been able to expand by clearing new fields from forests: hence the reports on
forest loss for Ghana and Tanzania. These rates may fall as population density rises and there
is less forest left to clear. Soil erosion from cropping on sloping land is reported for Tanzania
and Zambia, but precise statistics are not available — hardly surprising given the difficulty of
measuring erosion.
Other issues that apply less often with smallholders than larger farmers include:
loss of land races and farmer varieties as improved varieties displace them;
pollution from excess use of fertiliser and pesticide — a problem in both Bangladesh
and Kerala arising from highly intensive cultivation; and,
salination from irrigation without adequate drainage.
Two questions thus arise: how general is environmental degradation from smallholder farming?
And is this inevitable when smallholders expand production?
The former question provokes some controversy. Although there are some dramatic assertions
of large areas suffering land degradation, evidence for this is imperfect (see essays in Leach &

Smallholder agriculture’s contribution to better nutrition
15
Mearns 1996). It is not clear that some landscapes, seen as damaged by humans, owe their
characteristics to human processes. Ideas about ‘fragile’ semi-arid environments have been
contested by those proposing the high resilience of the ecosystems in question (Behnke et al.
1993). Indeed, there are suggestions that narratives of widespread environmental damage
represent a projection of the assumptions of outsiders on to local rural realities that lead to
exaggerations — see Hoben (1995) for a discussion of this in Ethiopia — and complete mis-
readings of local processes — see Fairhead & Leach (1996) for confusions over change in
woodlands and its causes in the savannah of Guinea.9
Resolving some of these debates is difficult, since getting more accurate and widespread
evidence is still beyond the means of current scientific monitoring.
Turning to the second question, is environmental harm the likely outcome of smallholder
agricultural development? Evidence from two parts of Africa suggest that no, it is not: indeed
it is perfectly possible to have increased output and productivity with environmental
conservation and enhancement.
Machakos, Kenya (Tiffen et al. 1994) is one of the best documented accounts. In the 1940s,
before commercial crops were planted, the district saw widespread soil erosion and
deforestation as increasing populations expanded their fields and cut fallowing times. Yet half a
century later, the introduction of coffee, dairying and green beans to upper Machakos had
justified widespread terracing, gulley stabilisation, tree planting and application of green
manures. Areas that in the 1940s were denuded with bare patches and few trees, were by the
early 1990s terraced, with green cover of the land and increased density of trees. The
explanation for this given by the authors was that once commercial crops and livestock were
taken up, it became worth the cost — often in hard labour — of conserving the land.
Some reacted to this publication by claiming that Machakos was an unusual or unique case.
Yet this is not the only account of intensification going hand-in-hand with conservation. In the
Sahel, and above all on the central plateau of Burkina Faso, the use of planting pits and stone
bunds has increased with intensification, as has planting of trees, keeping livestock and
applying their manure (Mazzucato & Niemeyer 2001, Reij & Smaling 2008).
Yet in the 1960s the central plateau of Burkina Faso was an area of average rainfall in the
range 500–700mm, poor soils, and yields of cereals — mainly millet and sorghum — of just
500 kg/ha. With such meagre resources, many of the able-bodied young men migrated to find
better work, often to Côte d'Ivoire and other countries to the south. But since then field
surveys reveal the following changes:
Soil and water have been conserved, most notably by use of stone bunds and
improved traditional planting pits (‘zai’) to retain water and topsoil;
Trees have been planted, livestock have been kept in semi-intensive systems and
the manure gathered and applied to the fields; and,
Collective institutions to manage wells, natural resources, village cereal banks, and
schools have multiplied.
An experienced observer commented:
Thirty years ago a World Bank sector report estimated that land losses in Burkina
Faso amounted to something like 2 percent of GDP per year. Today the land
supports nearly twice the population than in 1980 …
The change is visible to the naked eye: On a recent visit crops looked greener and
healthier than the visitor had ever seen them before, crop livestock integration had
happened in many parts, degraded arid lands were being recuperated via traditional
and new techniques, and a number of new crop varieties had been introduced,
9 Seeing trees concentrated around settlements, outsiders had assumed these were the remnants of extensive woodlands that had been cleared to leave the savannah grasses. Locals told researchers that no, the reason for the trees was they had been planted by villagers. Inspection of air photos from the past confirmed this: as the number of villages grew with population growth, so did the area under trees.

Smallholder agriculture’s contribution to better nutrition
16
there were more trees on the land. [Binswanger & McCalla 2008, paragraphing
added]
The results can be seen in the national statistics that shows cereals production in Burkina Faso
has grown at an annual average of 3.5% a year from the mid-1960s to the mid-2000s, well
ahead of population growth, and at a rate that matches that of Vietnam where the Asian green
revolution was particularly effective. Local results confirm this. In Bam province, for instance,
millet and sorghum yields rose from 406 and 446 kg/ha respectively in 1984/88 to 662 and
669 kg/ha in 1996/00. Water levels in wells have risen in areas that have conserved soil and
water. More greenery is evident in aerial surveys.
These examples show that smallholder agricultural development has the potential to contribute
to environmental sustainability and to preserve the local environment. Although it is difficult to
be completely sure what has made the difference in Machakos and the Mossi Plateau, at least
three elements can be seen in the accounts reported.
One, there were technical skills that locals had either developed themselves, or learned from
others. In Machakos it seems that some farmers got the inspiration for their terraces from
observing Indian farms when posted there as soldiers with the King’s African Rivals during the
Second World War.
Two, farmers in both areas believed in the security of their tenure, whether or not — mostly
not — they had a formal title to their land.
Three, conservation took place as the value of the land rose either given the value of the
commercial activities in Machakos, or in Burkina perhaps more owing to the rising value of
home produce. There is some confirmation in these accounts of the hypothesis developed by
Templeton & Scherr (1999) having examined 70 cases in hill lands: that initial intensification
may degrade land, but as population density builds up, then land becomes increasingly
valuable leading to its conservation.
The country studies also provide evidence of sustainable practice. Home gardens have long
been highly developed in Kerala, made necessary by the scarcity of land, and assisted by high
rainfall. These combine production on several levels —‘multi-storey cropping’, usually including
perennial crops along with annuals, often agroforestry crops, and in some cases aquaculture
and livestock. The gardens mimic a climax ecology, containing diverse species and varieties
and allowing the created ecology to recycle moisture and nutrients. (Jose & Shanmugaratnam
1993, Pushkaran 2001) Some gardens may be becoming more specialised, gradually
concentrated on a limited number of cash-crops with increased use of external inputs, but
others have been able to integrate commercial production with intensive management without
relying on external inputs. (Peyre et al. 2006)
On the slopes of Mount Kilimanjaro in northern Tanzania the combination of coffee
bushes, fodder grasses, bananas and field crops in very small plots produces a landscape of
diversity with considerable cover that protects against erosion. Similar to Machakos, this case
combines local skills with secure tenure, incentives to conserve — the slopes are thickly
populated, and for the furrow irrigation that is a feature of these systems, collective
organisation (Grove 1993).
In summary, then, while smallholder development can lead to environmental loss, it can just
as well lead to conservation of the land. With appropriate technical knowledge and skill,
secure tenure and incentives to conserve — above all in the value of land, then
conservation may be expected.

Smallholder agriculture’s contribution to better nutrition
17
3 How far can smallholder agricultural development contribute to better food security and nutrition?
3.1 Beyond availability and access
Food availability and access may be essential for food security and nutrition, but as the
UNICEF framework indicates, smallholder agricultural development needs to be accompanied
by other actions in the fields of care, health, water and sanitation to reduce hunger.
The importance of different underlying factors for child malnutrition was studied by Smith &
Haddad (2002). They examined the relation between income and child underweight rates from
1970 to 1995 across countries using regression. Almost 60% of reduced prevalence of
underweight infants could be attributed to rising incomes. Higher incomes, however, did not
affect nutrition directly through access to food and consumption alone. Instead incomes
affected malnutrition through interactions with increased food availability, more female
schooling, better access to safe water, and through improvements in the ratio of female to
male life expectancy (a proxy for female status) — factors that responded in part to higher
incomes, but only in part. In order of their contribution to reducing malnutrition, female
schooling was the strongest factor followed by food availability, safe water and the life
expectancy ratio.
The importance of female schooling is remarkable. Quite why this, defined as enrolment of
girls in secondary schools, should be so powerful is open to interpretation; but it very probably
indicates the value of women being empowered in their education, job opportunities and status
and how this then impacts through income and mothers’ control over income, better
information and access to health care on child nutrition.
Haddad (et al. 2003) then followed this study up with a similar one that used data from 66
countries, with 12 studied in detail, to ask whether likely rates of future incomes would by
themselves lead to reductions in malnutrition sufficient to achieve the first of the Millennium
Development Goals of halving hunger. They concluded that, yes, income growth would reduce
malnutrition …
Even with no change in community and household infrastructure, rates of
malnutrition (low weight for age) are projected to decline by an average of around
27 percent by 2015 if countries can achieve per capita income growth of 2.5
percent a year. Allowing community and household infrastructure to change over
time increases the effect of the growth to a 34 percent reduction in national
malnutrition rates. Cross-country regressions imply similar reductions. The cross-
country estimates add another dimension, showing that historical patterns of
income distribution are consistent with income growth leading to marked
improvements in nutrition.
... but in some cases not sufficiently to reach the Goal by 2015. 10
This confirms the UNICEF proposition: improved food security and nutrition requires
complements to those things that smallholder agricultural development can achieve in p
roducing more food, pushing down food prices and raising rural incomes.
10 An early draft of a 2012 review of subsequent studies on the relation of income to nutrition confirms these findings: that if anything the findings from Haddad et al. 2003 may be towards the higher end of income to nutrition effects.

Smallholder agriculture’s contribution to better nutrition
18
3.2 Insights from country cases
To explore the ways in which smallholder agricultural development may lead to better food
security and nutrition, five cases have been studied. For these, key indicators of food security
and nutrition have been compiled, together with indicators for factors influencing them:
agricultural development, economic growth, health, water and sanitation and female
empowerment, for 1990 and 2012, or the closest years to these for which there were statistics
available — see Tables 3.1 to 3.4.
Smallholder agriculture dominates farming in all these cases: for example, the fraction of
farms of two hectares or less has been reported as 96% for Bangladesh, 85% for Ghana, 82%
for India, 75% for Tanzania and 76% for Zambia (farms of less than one hectare in this case)
(Nagayets 2005, FAO country profiles at http://www.fao.org/ag/AGP/AGPC/doc/Counprof ).
Only in the case of Zambia are large-scale farms present in any significant number. Hence
most of the growth seen nationally comes from small-scale, family farms.
Agricultural growth varies across these cases, with Ghana and Bangladesh showing appreciable
increases — 58% and 43% per person rises — over the 20 years; Zambia and India’s growth
has been less, but still ahead of population; while Tanzanian agricultural output has only just
matched population growth. These are reflected in changing food availability per person:
Ghana and Bangladesh showing strong increases, to reach levels well above those needed to
provide enough energy for an active life; with less change for the other three cases.
Economic growth has raised average incomes in all cases, but with stronger growth for Ghana,
Bangladesh and Kerala than for Tanzania and Zambia. This is reflected in poverty rates that
have fallen considerably for Ghana, Bangladesh and Kerala between 1990 and 2010 — with
Kerala reporting especially low poverty rates by the end of the period. For Tanzania and
Zambia, poverty has fallen only a little and remains at very high levels.
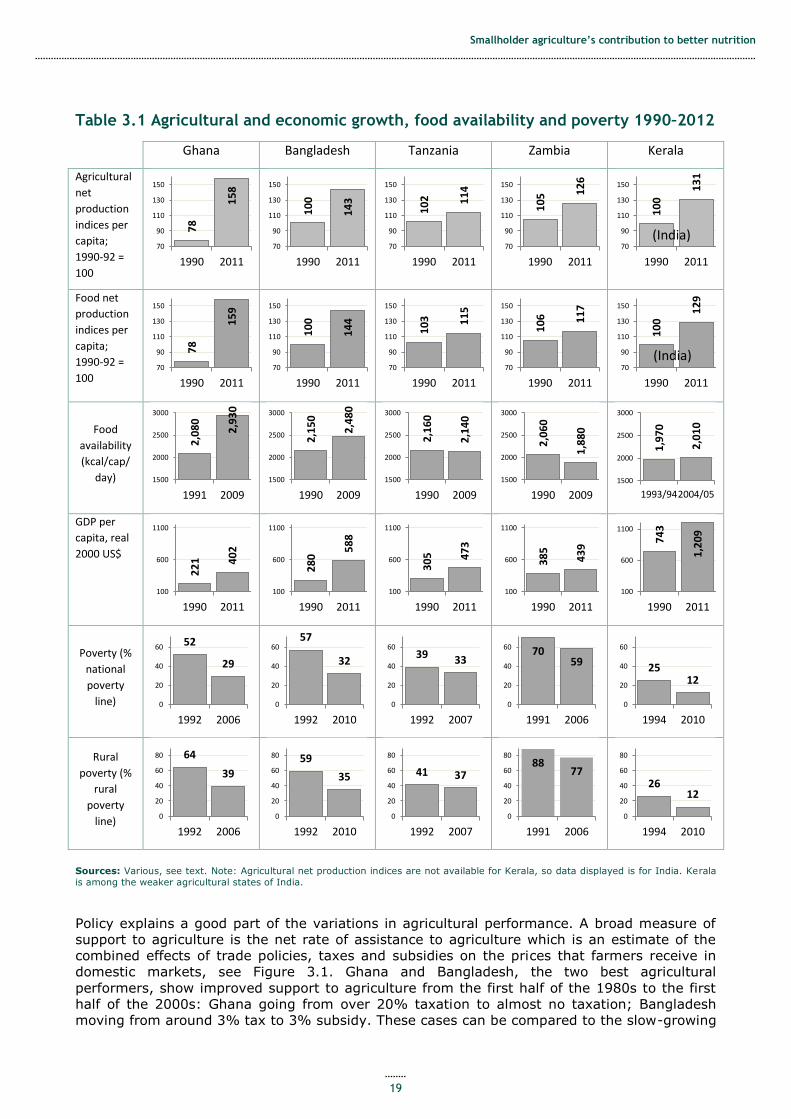
Smallholder agriculture’s contribution to better nutrition
19
Table 3.1 Agricultural and economic growth, food availability and poverty 1990–2012
Ghana Bangladesh Tanzania Zambia Kerala
Agricultural
net
production
indices per
capita;
1990-92 =
100
Food net
production
indices per
capita;
1990-92 =
100
Food
availability
(kcal/cap/
day)
GDP per
capita, real
2000 US$
Poverty (%
national
poverty
line)
Rural
poverty (%
rural
poverty
line)
Sources: Various, see text. Note: Agricultural net production indices are not available for Kerala, so data displayed is for India. Kerala
is among the weaker agricultural states of India.
Policy explains a good part of the variations in agricultural performance. A broad measure of
support to agriculture is the net rate of assistance to agriculture which is an estimate of the
combined effects of trade policies, taxes and subsidies on the prices that farmers receive in
domestic markets, see Figure 3.1. Ghana and Bangladesh, the two best agricultural
performers, show improved support to agriculture from the first half of the 1980s to the first
half of the 2000s: Ghana going from over 20% taxation to almost no taxation; Bangladesh
moving from around 3% tax to 3% subsidy. These cases can be compared to the slow-growing
78
15
8
70
90
110
130
150
1990 2011
10
0
14
3
70
90
110
130
150
1990 2011
10
2
11
4
70
90
110
130
150
1990 2011
10
5 12
6
70
90
110
130
150
1990 2011
10
0
13
1
70
90
110
130
150
1990 2011
(India)
78
15
9
70
90
110
130
150
1990 2011
10
0
14
4
70
90
110
130
150
1990 2011
10
3
11
5
70
90
110
130
150
1990 2011
10
6
11
7
70
90
110
130
150
1990 2011
10
0 1
29
70
90
110
130
150
1990 2011
(India)
2,0
80
2,9
30
1500
2000
2500
3000
1991 2009
2,1
50
2,4
80
1500
2000
2500
3000
1990 2009
2,1
60
2,1
40
1500
2000
2500
3000
1990 2009
2,0
60
1,8
80
1500
2000
2500
3000
1990 2009
1,9
70
2,0
10
1500
2000
2500
3000
1993/942004/05
22
1
40
2
100
600
1100
1990 2011
28
0 5
88
100
600
1100
1990 2011
30
5
47
3
100
600
1100
1990 2011
38
5
43
9
100
600
1100
1990 2011
74
3
1,2
09
100
600
1100
1990 2011
52
29
0
20
40
60
1992 2006
57
32
0
20
40
60
1992 2010
39 33
0
20
40
60
1992 2007
70 59
0
20
40
60
1991 2006
25 12
0
20
40
60
1994 2010
64
39
0
20
40
60
80
1992 2006
59
35
0
20
40
60
80
1992 2010
41 37
0
20
40
60
80
1992 2007
88 77
0
20
40
60
80
1991 2006
26 12
0
20
40
60
80
1994 2010

Smallholder agriculture’s contribution to better nutrition
20
agricultures of Tanzania and Zambia, where net taxation has been high. Tanzania may have
reduced its taxation of agriculture, though levels still remain high at 12%; while Zambia
actually taxed its agriculture more over the period, going from about 3% to almost 30%
taxation. India, which subsidised agriculture to the tune of about 2% in the first half of the
1980s increased this to some 16% over the first half of the 2000s.
Figure 3.1 Nominal rates of assistance to agriculture, case countries: early 1980s and early 2000s
Source: Data from Anderson & Valenzuela, 2008.
Note: The Nominal rate of assistance (NRA) to farmers is the price of their product in the domestic market (plus any direct output
subsidy) less its price at the border, expressed as a percentage of the border price (adjusting for transport costs, quality differences and so forth). Distortions in input prices and exchange rates are also captured.
How well do these changes in agricultural production, economic growth and poverty, reflecting
primary determinants of food availability and access, match the observations of changes in
food security and nutrition, see Table 3.2? The main measure used to compare food security
across counties is the FAO estimate of the percentage of the under-nourished population
unable to access enough energy for their daily needs. Since this is closely related to food
availability, it is no surprise to see that undernourishment has fallen considerably for Ghana
and Bangladesh. For Tanzania and Zambia, however, the incidence of undernourishment has
risen. Lack of agricultural growth has its costs in these cases. [For Kerala the earlier data point
is missing so change cannot be seen: estimated undernourishment is higher than in Ghana and
Bangladesh.]
These changes do not necessarily match those in child malnutrition. In all cases other than
Kerala, the fraction of under-fives underweight has fallen — most strongly in Ghana and
Bangladesh, but also in Zambia and Tanzania. In Kerala no change can be seen. When
underweight is split into its components of stunting — a measure of longer-term nutrition —
and wasting — usually a measure of short-term distress, the patterns diverge. Bangladesh and
Kerala have seen stunting fall considerably; Ghana and Tanzania have seen smaller falls; while
stunting remains unchanged for Zambia. Wasting rates have fallen most for Ghana, a little for
Bangladesh and Tanzania, no change for Zambia, and have apparently actually increased for
Kerala.
-60%
-50%
-40%
-30%
-20%
-10%
0%
10%
20%
Gh
ana
Ban
glad
esh
Zam
bia
Tan
zan
ia
Ind
ia1980-1984 2000-2004

Smallholder agriculture’s contribution to better nutrition
21
Table 3.2 Food security and nutrition 1990–2012
Ghana Bangladesh Tanzania Zambia Kerala
Under-
nourishment (%
of population)
Underweight (%
under-fives)
Stunting (%
under-fives)
Wasting (%
under-fives)
Sources: Various, see text
Changes in food availability and access explain some of the changes in nutrition, but not all. So
what can be seen of changes in indicators for other underlying determinants of nutrition?
Comparative statistics for health, water, and sanitation over the period are shown in Table 3.3.
The under-five mortality rate is taken as a proxy for the health of young children, those most
susceptible to malnutrition.
Impressive reductions in under-five mortality can be seen in all cases, with
remarkable progress being made in Bangladesh, Tanzania and Zambia. Previously
these countries had very high rates of mortality, but have more than halved these over the
two decades. For Tanzania and Zambia which show little or no improvement on food
production and poverty, improvements in the health of young children may well explain
their achievements in reduced child malnutrition. For the other two cases, sizeable
reductions have also taken place: Kerala has halved its under-five mortality, from already low
levels, while Ghana has cut child deaths by more than a third.
Access to clean water has improved for all cases other than Tanzania, with notable increases
for Ghana and Kerala. Use of improved sanitation has improved for all cases other than
Zambia, but with major differences in levels: Ghana and Tanzania still have very low scores on
this indicator.
41
>5
0
10
20
30
40
1990 2012
35
17
0
10
20
30
40
1990 2012
29
39
0
10
20
30
40
1990 2012
34
44
0
10
20
30
40
1990 2012
29
0
10
20
30
40
no data 2008
25 14
0
20
40
60
1994 2008
62
36
0
20
40
60
1990 2011
25 16
0
20
40
60
1992 2010
21 15
0
20
40
60
1992 2007
24 24
0
20
40
60
1993 2006
34 29
0
20
40
60
1994 2008
63
41
0
20
40
60
1990 2011
50 43
0
20
40
60
1992 2010
46 46
0
20
40
60
1992 2007
36 25
0
20
40
60
1993 2006
15
9
0
5
10
15
1994 2008
18 16
0
5
10
15
1990 2011
8 5
0
5
10
15
1992 2010
6 6
0
5
10
15
1992 2007
13 16
0
5
10
15
1993 2006
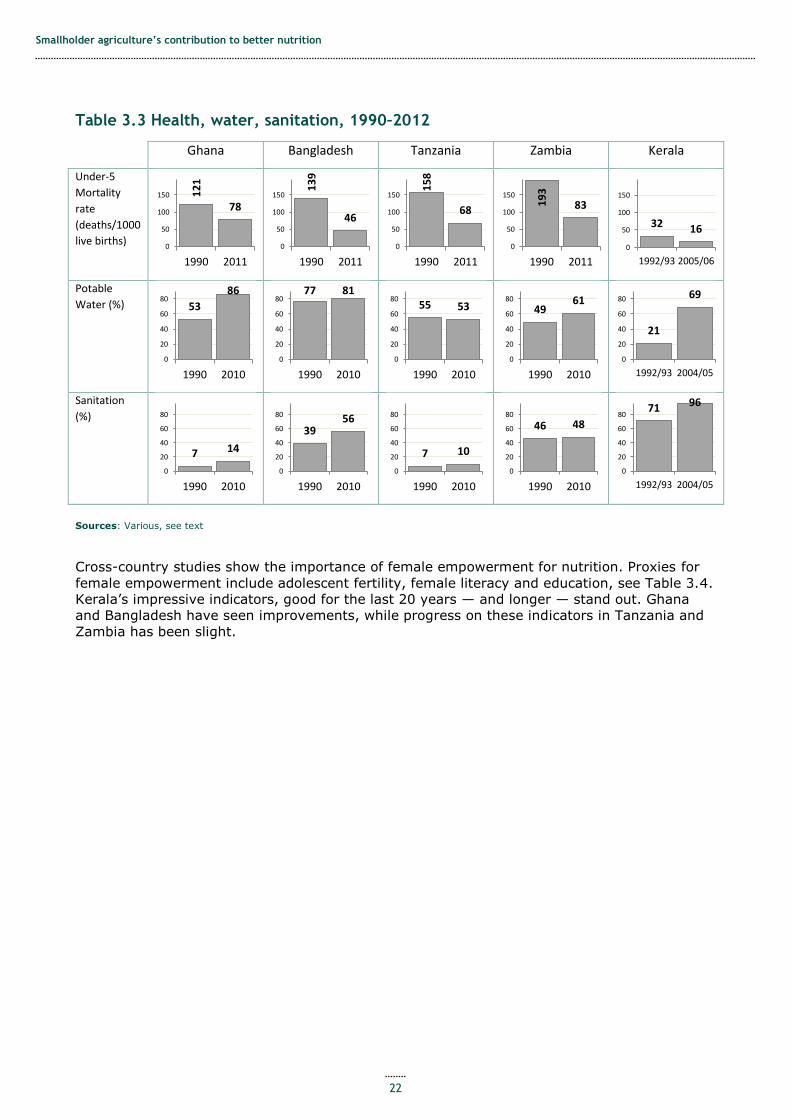
Smallholder agriculture’s contribution to better nutrition
22
Table 3.3 Health, water, sanitation, 1990–2012
Ghana Bangladesh Tanzania Zambia Kerala
Under-5
Mortality
rate
(deaths/1000
live births)
Potable
Water (%)
Sanitation
(%)
Sources: Various, see text
Cross-country studies show the importance of female empowerment for nutrition. Proxies for
female empowerment include adolescent fertility, female literacy and education, see Table 3.4.
Kerala’s impressive indicators, good for the last 20 years — and longer — stand out. Ghana
and Bangladesh have seen improvements, while progress on these indicators in Tanzania and
Zambia has been slight.
12
1
78
0
50
100
150
1990 2011
13
9
46
0
50
100
150
1990 2011
15
8
68
0
50
100
150
1990 2011
19
3
83
0
50
100
150
1990 2011
32 16
0
50
100
150
1992/93 2005/06
53
86
0
20
40
60
80
1990 2010
77 81
0
20
40
60
80
1990 2010
55 53
0
20
40
60
80
1990 2010
49 61
0
20
40
60
80
1990 2010
21
69
0
20
40
60
80
1992/93 2004/05
7 14
0
20
40
60
80
1990 2010
39 56
0
20
40
60
80
1990 2010
7 10
0
20
40
60
80
1990 2010
46 48
0
20
40
60
80
1990 2010
71 96
0
20
40
60
80
1992/93 2004/05

Smallholder agriculture’s contribution to better nutrition
23
Table 3.4 Female empowerment, 1990–2012
Ghana Bangladesh Tanzania Zambia Kerala
Adolescent
fertility rate
(births/1000
females 15
– 19)
Youth
female
literacy (%
15 – 24)
Female
completion
of primary
school*
Source: Various, see text. Note: *Except in Kerala, where comparable data is not available and the first data point refers to enrollment of all children 6 to 10 years, the second to enrolment of children 6-17 years. Data for enrollment of 5-14 year old children in
2005 show slightly higher proportion of girls than boys enrolled (UNICEF, May 2011)
While changes in food security and nutrition in these five cases cannot be fully explained by
these statistics, they yield some useful insights that can best be summarised by country.
Ghana and Bangladesh show what strong agricultural growth can achieve, in countries
dominated by smallholder farming. With good growth in the agriculture sector and such large
fractions of society engaged in smallholder agriculture, agricultural and economic growth has
reduced poverty and destitution, with clear benefits to food security and nutrition. They also
show, however, what may be lacking for nutrition, especially in the case of Ghana where
progress on health, sanitation, and women’s empowerment has been limited (Tables 3.3 and
3.4). Increased food production in Bangladesh, moreover, has relied too much on rice, to the
detriment of other crops, reducing dietary diversity.
Tanzania and Zambia show the costs of limited agricultural growth, made worse in Zambia
by limited economic growth. With food availability per capita just keeping up with population
growth in Tanzania, and falling behind in Zambia, while poverty remains high and falling
slowly, it is no surprise that gains to nutrition have been limited. The few gains seen look to
arise from the improving health of under-fives. In both these cases, lack of agricultural
development is compounded by failure to improve water and sanitation and to empower
women, the last an acute problem in Zambia.
Kerala shows what can be achieved despite limited economic and agricultural growth, when
health, water, education, and female empowerment are taken seriously — and have been for
decades. On the other hand, limited agricultural growth and apparently low food availability
may explain why nutrition has barely improved in the last couple of decades. Kerala’s social
progress is an object lesson to the rest of India and indeed the world.
90 66
0
50
100
1997 2010
13
0
73
0
50
100
1997 2010
13
3
12
9
0
50
100
1997 2010
14
3
14
2
0
50
100
1997 2010
18
0
50
100
no data 2008
65 79
0
20
40
60
80
2000 2009
38
77
0
20
40
60
80
1994 2010
78 76
0
20
40
60
80
1988 2010
66 67
0
20
40
60
80
1990 2010
90 94
0
20
40
60
80
1991 2011
58 69
0
20
40
60
80
1991 2008
71
0
20
40
60
80
no data 2009
59 87
0
20
40
60
80
1992 2009
56 52
0
20
40
60
80
1998 2008
93 90
0
20
40
60
80
2001 2006

Smallholder agriculture’s contribution to better nutrition
24
4 How can smallholder agricultural development have a stronger impact on nutrition?
Are there ways to adjust the pattern of smallholder agricultural development to maximise the
benefits for nutrition? Two recent reviews (World Bank 2007, Arimond et al. 2011) address this
question.11 Three main lessons emerge from these. One is a general point of considerable
importance for development overall, but which has a specific nutritional benefit: female
empowerment in agriculture improves child nutrition. A second concerns a specific
intervention, but one can be powerful in reducing micro-nutrient deficiency: home gardening
and small-scale livestock raising can provide micro-nutrients. The third point concerns the
wider relation of smallholder development to nutrition: that agricultural programmes should be
complemented by education and communication, health services, water and sanitation.
4.1 Empowering women farmers
Empowering women farmers can improve food security and nutrition both through increased
food production as well through better use of food and income. On the former, large disparities
often exist between men and women farmers in access to land, security of tenure, education,
credit, extension and other services. This makes it harder for women farmers to achieve the
same yields and levels of production as men can, since they cannot get the inputs or technical
knowledge needed to match their labour. A particular concern is that women often have less
control over household resources, such as labour and manure, than men do. In Burkina Faso,
for example, it was estimated that if household labour and manure were distributed across
male and female plots more equitably and efficiently, production would rise by 10–20% (Udry
et al. 1995). Overall, FAO has estimated that closing the gender gap in agriculture could
reduce the number of hungry people in the world by 12 to 17%, or by 100 to 150M people.
(FAO 2011, also summarised in Tripathi et al. 2012)
Women are more likely to use household incomes and food supplies to care for children and
feed them, ‘since they are the prime givers of care, stewards of health and preparers of food.‘
(World Bank 2007) ‘Women have consistently been shown to be more likely than men to invest
in their children’s health, nutrition, and education.’ (ibid.) This effect probably contributes to
the strong relation seen between female secondary schooling and child nutrition, as described
in Section 3.1.
Potential ways to close the gender gaps encompasses a broad range of activities from
legislation on rights, education, awareness raising including generating statistics that keep the
issues in view, ensuring respect for women’s rights to land and water, reducing the drudgery
of household maintenance such as water collection, and making sure that agricultural
development programmes reach women farmers (FAO 2011). In the next section an effective
example of directly working to raise women’s self-esteem and status will be described.
4.2 Addressing the micro-nutrition challenge: home gardens
Home gardens producing fruit, vegetables, herbs, medicinal plants and serving as a space to
rear livestock on a small scale, can address the frequent observation of micro-nutrient deficits
amongst rural populations in the developing world. Inadequate intake of Vitamin A, iron, iodine
and zinc can impair the mental and physical development of infants, as well as more widely
causing illness, disability and premature death.
11 For the rest of this section, these are the sources, unless otherwise indicated.

Smallholder agriculture’s contribution to better nutrition
25
Since home gardens are often controlled by mothers, they can increase their access to food,
and incomes from sales of surplus. Since gardens occupy small areas, households with little
land can participate.
Reviews suggest these potential benefits can be realised through programmes to encourage
development of gardens — and where they are absent, their establishment, through provision
of seeds, tools, and information and training. For example, in the late 1980s Helen Keller
International (HKI) piloted home gardens for Vitamin A in north-west Bangladesh, with a
programme of promotion, village nurseries and nutrition education. That eventually led to a
national programme in the late 1990s that engaged 0.9M households at an annual cost of just
US$8 a household. This was then replicated in Cambodia, Nepal, Philippines and adapted for
Niger. HKI later realised the importance of animals for bio-available Vitamin A, so added this
component.
Monitoring and evaluation showed that households were indeed taking up gardening:
Between 1997 and 1998, the proportion of households without a homestead garden
decreased from 25% at baseline to less than 2%. After 1 year of participation, the
proportion that practised year-round (developed) gardening increased from 3% to
33%. (Arimond et al. 2011)
Fruit and vegetable production increased, by three times the volume seen in traditional
gardens, more varieties were cultivated.
… households participating in the intervention produced a median of 135 kg of
vegetables and 24 kg of fruit in the preceding 3 months, compared with 46 kg of
vegetables and 14 kg of fruits during the same period for control households. (ibid.)
Consumption also rose, with reduced deficiency of Vitamin A for children:
… children in households with developed gardens consumed 1.6 times more
vegetables. The risk of night blindness was lower for at-risk children when their
house had a homestead garden. (ibid.)
Incomes also increased from sales, and some of this allowed them to buy in complementary
foods they did not produce:
Participating households earned, on average, the equivalent of US$8 on a
bimonthly basis selling fruits and vegetables. The main uses of this income were
food purchases and investments in seeds, seedlings, saplings, poultry, or other
income-generating activities. Nearly 10% of households saved income generated
from the garden.
Households with improved or developed homestead gardens consumed
micronutrient-rich, non-cereal foods more frequently than other households. These
foods, such as lentils and animal products, were not produced in the gardens, but
were purchased using income generated from sales of garden produce. (ibid.)
Furthermore, most (73%) of gardens were operated by women and they had control over
production and use of income from sales.
Results were also sustained:
Three years after withdrawal of programme support, formerly participating
households maintained higher production of vegetables (120 kg) and fruits (24 kg),
relative to controls. Similarly, income from gardening remained more than twice as
high in formerly participating households, compared with controls. (ibid.)
Other experiences show that home gardens can succeed. In Chipinge District, Zimbabwe,
Action Against Hunger (Action Contre la Faim, ACF) promoted low input vegetable gardens for

Smallholder agriculture’s contribution to better nutrition
26
the benefit of people living with HIV/AIDS, with 1,200 households benefiting by 2009. An
evaluation showed that beneficiaries were eating more diverse diets from participating,
although it is not known to what degree. The gardens allowed people to sell vegetables and
buy in other complementary foods. Interviewees reported that belonging to groups increased
their social contacts, esteem, made them feel empowered. In this case, however, it was not
clear that the participants were more food secure or in better state of nutrition than control
groups. (Roberfroid et al. 2011, Tonderayi 2012)
In Kita, southern Mali, ACF runs a programme that combines promotion of vegetable gardens
with education and behaviour change communication (BCC) on diet, hygiene and child care.
Although Kita lies in some of the best land in Mali, there are high rates of vulnerability, poverty
and GAM. The programme reached 1,400 households.
Participants had more production from gardens; more income; were eating a more diverse
diet; and child malnutrition had fallen in participating villages — according to a 2010
evaluation comparing the beneficiaries to others in the same communities and others living in
control villages. There were concerns, however, about the time that women have to participate
in gardening. Evaluators recommended the programme ensure that vulnerable households are
targeted and included, and that communications on hygiene and nutrition be improved and
complemented with participatory hygiene and sanitation activities. (ACF 2010, 2012)
The World Bank (2007) review also commended home gardens, concluding that these:
… carry considerable potential to effectively address micronutrient deficiencies. The
review identified a significant body of evidence documenting the success of
homestead gardens in raising production, income, household consumption, and the
intake of targeted fruit and vegetables by vulnerable population groups.
Nutrition impacts are enhanced when livestock raising, or fish culture, are included to make
animal foods more available …:
Programs and interventions involving animal source foods have even greater
potential to tackle micronutrient deficiencies, especially vitamin A, iron, and zinc
deficiencies. These micronutrients are more readily bioavailable in animal source
foods than in plant foods.
… and especially when there is communication to influence behaviour and when women are
empowered.
Several programs also showed significant impacts on dietary and biochemical
indicators of micronutrient deficiencies, and especially so when they included
components designed to change behavior through education and to empower
women.
…
Several interventions showed gains in production, income, and household food
security, and significantly greater nutrition impacts when combined with
interventions involving women’s empowerment, education, and behavior change.
(World Bank 2007)
A review of 30 agricultural programmes that recorded nutritional impact, including home
gardening, livestock, mixed garden and livestock, cash cropping, and irrigation, confirms these
findings (Berti et al. 2004). While the interventions improved food production, they did not
always improve nutrition or health. Home gardens, however, were very likely— seen in 11 out
of 13 cases — to improve nutrition. Programmes that improved nutrition were typically those
where there had been a wider range of action than agriculture alone, especially where there
was nutrition education and attention to gender.
In sum, home gardens, it seems, can diversify and improve household diets, raise income, and
empower women. But for greatest nutritional impact, complementary measures to address

Smallholder agriculture’s contribution to better nutrition
27
health, water and sanitation, female empowerment, and care practices are needed; a point to
which discussion will return in section 4.3.
Before that an alternative way to remedy micro-nutrient deficiency needs mention: bio-
fortification.
Bio-fortification: another way to remedy micro-nutrient deficits
Fortification of processed foods with additional nutrients has long been used to address
nutrition deficiencies: for example, iodine added to salt and iron to bread. Benefits can be very
high compared to the costs. A more recent development is the possibility of breeding varieties
of staples to include higher content of minerals and vitamins for people who consume them,
but who are chronically short of these micro-nutrients.
Rice with enhanced Vitamin A, ‘golden rice’, is an example. One of the most prominent, and
well advanced of these initiatives is the orange-fleshed sweet potato (OFSP), which has
been bred for its content of beta-carotene that is a pre-cursor of Vitamin A. OFSP has the
additional advantages of being easy to plant, requires little labour, tolerates drought, and can
be harvested over the season. Tubers can either be sold or consumed at home. (Arimond et al.
2011)
Mozambique has seen a pioneer action research. Implemented in drought-prone areas of
Zambezia Province, where most households produce sweet potato but where nutrition is poor
and Vitamin A intake is low, the programme promoted OFSP, complemented by BCC messages
and marketing. Around 1000 farmers, 70% of them women, in 53 groups were reached.
Villages were divided into intervention and control, then households within them were
surveyed for:
.. socio-economic and demographic characteristics of households, agricultural
production, child morbidity, adult and child anthropometry, parental nutrition
knowledge, food frequency, dietary intakes and biochemical indicators. In addition,
sweet potato plots were measured annually and market prices were monitored
monthly. (ibid.)
Children showed improved Vitamin levels:
There was a marked decrease in the prevalence of low serum retinol (an indicator
of vitamin A deficiency) among children in intervention households (60 to 38%);
prevalence remained unchanged in control communities.
Moreover, the intervention saw progress along the expected path from growing OFSP to more
Vitamin A in children:
There were large differences in production of OFSP (90% of intervention households
compared with 11% of controls) and increases in sales (30% of households
compared with 13% at baseline, among producers). Mean sweet potato plot size
increased more than tenfold in intervention households and agronomic performance
was acceptable, with yields similar to [white-fleshed sweet potato] WFSP. Both
women and men showed positive changes in nutrition knowledge, relative to
baseline and relative to controls. Intervention children were ten times more likely to
eat OFSP frequently. Vitamin A intakes among intervention children were eight
times higher than in controls; energy intakes and intakes of several other
micronutrients were also higher. Finally, by the end of the study, OFSP was the
cheapest source of vitamin A (per retinol unit) in local markets. (ibid.)
There remains the question of sustainability, both in distribution of free vines and in the
intensity of extension.

Smallholder agriculture’s contribution to better nutrition
28
The country cases include some initial experiences with bio-fortified crops. In Ghana, OFSP
has been introduced and programmes to promote the variety have started, although it is too
early to know the effects. Ghana is a target country for dissemination of HarvestPlus maize
bio-fortified with Vitamin A (Pixley & McClafferty 2006). People may be willing to pay for bio-
fortified maize in Ghana, and willing to change preferences given clear information (De Groote
et al. 2010). Potential new maize sources for high iron and zinc were identified by CIMMYT in
2005(Pixley & McClaffert, 2006) though varieties are not available yet in Ghana. High quality
protein maize is another bio-fortified variety that has been transferred to Ghana, where the
varieties are drought tolerant as well as resistant to Striga, a parasitic weed (Atser, 2010). The
combination of physical hardiness and nutritional benefits could make this attractive.
Bio-fortification is in early stages in Bangladesh. Several species appear to have potential,
including OFSP), golden rice which is currently being investigated for efficacy by HKI (HKI
2012), and high-zinc rice that may become available in Bangladesh within the next five years
(IRIN 2011).
Tanzania has also seen promotion of OFSP which has been added to breeding work. Sweet
potatoes are already part of the diet, and the orange-fleshed sweet potato has been accepted
and enjoyed, particularly by children, in trials (RAC, 2012). Quality Protein Maize (QPM) was
promoted under CIDA's QPM Development project, which ran 2003 to 2010. (CIDA, 2012).
Seed availability may limit adoption.
Zambia is also a target country for dissemination of HarvestPlus high Vitamin A maize. Recent
studies show this to be acceptable to consumers in Zambia, with potential to compete with
white maize even without nutrition campaigns — and may fetch a premium over white maize
where nutrition information is provided (Meenakshi et al., 2012).
All these experiences are recent, being trials and pilots. So far adoption has not been
widespread. It remains to be seen how acceptable these bio-fortified varieties may be and
whether they are a more effective way to improve the quality of diets, rather than through
consumption of more diverse foodstuffs. Until pilots are completed and seed of bio-fortified
varieties becomes widely available at reasonable cost, home gardens will remain the proven
response to micro-nutrient deficiency: one that can have additional benefits in female
empowerment.
4.3 Complementing farming
Reviews of home gardens and other agricultural interventions where the primary intention is to
improve nutrition commonly report that complementary activities through education and
behaviour, health services, water and sanitation are necessary to get the full benefit of
interventions. Two recent examples provide stimulating evidence of what may be achieved by
working both on smallholder farming as well as other sectors.
Shouhardo, Bangladesh: combatting malnutrition amongst very poor people
A remarkable programme in Bangladesh gives insight into the relation between smallholder
livelihoods, direct nutrition interventions and attention to the underlying determinants of
nutrition, according to a recent review (Smith et al. 2011).
Between 2006 and 201012 CARE ran the SHOUHARDO13 programme funded by US PL480 food
aid funds. This focussed attention on poor and vulnerable households who were living in four of
the most marginal areas of Bangladesh: on the seasonally-flooded Haor lands, the Charlands
(sand and silt islands) of the big rivers, and the coast — all areas highly vulnerable to river
flooding, cyclones or both. Some 400,000 households were enrolled in the programme, around
three-quarters of the communities in the target areas.
12 A second phase is now running 13 The SHOUHARDO acronym stands for ‘Strengthening Household Ability to Respond to Development Opportunities’ and also means “friendship” or “amity
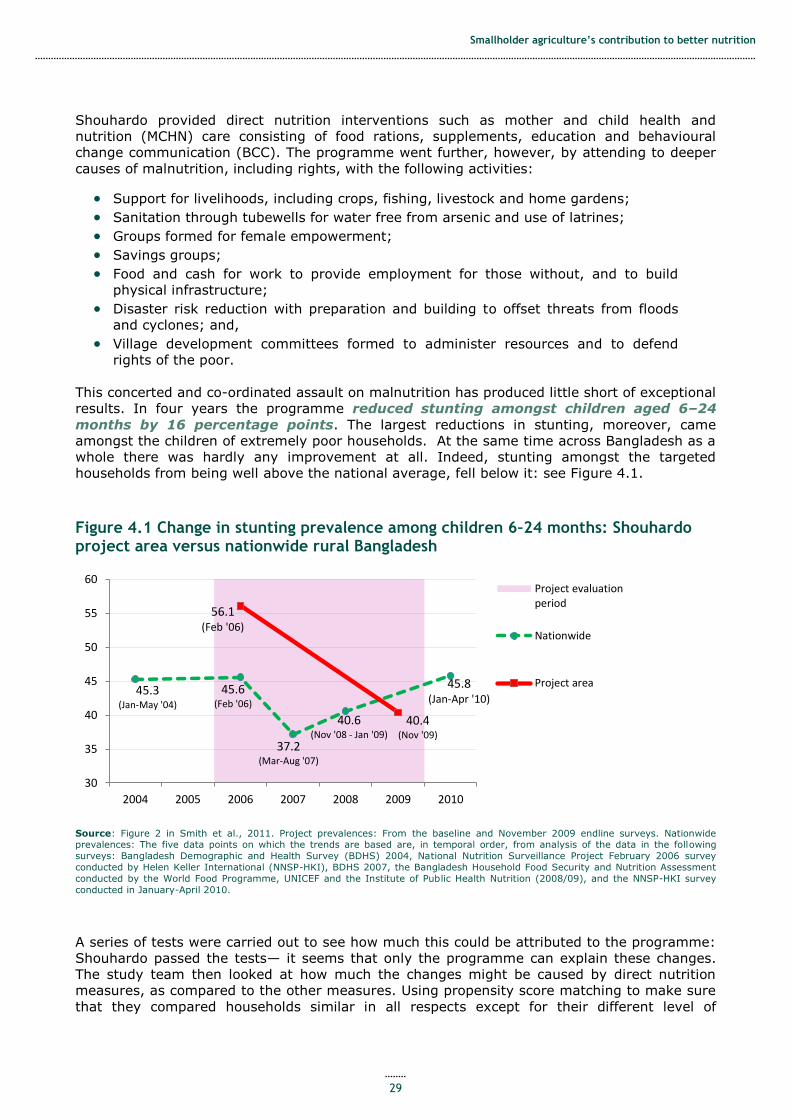
Smallholder agriculture’s contribution to better nutrition
29
Shouhardo provided direct nutrition interventions such as mother and child health and
nutrition (MCHN) care consisting of food rations, supplements, education and behavioural
change communication (BCC). The programme went further, however, by attending to deeper
causes of malnutrition, including rights, with the following activities:
Support for livelihoods, including crops, fishing, livestock and home gardens;
Sanitation through tubewells for water free from arsenic and use of latrines;
Groups formed for female empowerment;
Savings groups;
Food and cash for work to provide employment for those without, and to build
physical infrastructure;
Disaster risk reduction with preparation and building to offset threats from floods
and cyclones; and,
Village development committees formed to administer resources and to defend
rights of the poor.
This concerted and co-ordinated assault on malnutrition has produced little short of exceptional
results. In four years the programme reduced stunting amongst children aged 6–24
months by 16 percentage points. The largest reductions in stunting, moreover, came
amongst the children of extremely poor households. At the same time across Bangladesh as a
whole there was hardly any improvement at all. Indeed, stunting amongst the targeted
households from being well above the national average, fell below it: see Figure 4.1.
Figure 4.1 Change in stunting prevalence among children 6–24 months: Shouhardo project area versus nationwide rural Bangladesh
Source: Figure 2 in Smith et al., 2011. Project prevalences: From the baseline and November 2009 endline surveys. Nationwide prevalences: The five data points on which the trends are based are, in temporal order, from analysis of the data in the following
surveys: Bangladesh Demographic and Health Survey (BDHS) 2004, National Nutrition Surveillance Project February 2006 survey
conducted by Helen Keller International (NNSP-HKI), BDHS 2007, the Bangladesh Household Food Security and Nutrition Assessment
conducted by the World Food Programme, UNICEF and the Institute of Public Health Nutrition (2008/09), and the NNSP-HKI survey
conducted in January-April 2010.
A series of tests were carried out to see how much this could be attributed to the programme:
Shouhardo passed the tests— it seems that only the programme can explain these changes.
The study team then looked at how much the changes might be caused by direct nutrition
measures, as compared to the other measures. Using propensity score matching to make sure
that they compared households similar in all respects except for their different level of
45.3 (Jan-May '04)
45.6 (Feb '06)
37.2 (Mar-Aug '07)
40.6 (Nov '08 - Jan '09)
45.8 (Jan-Apr '10)
56.1 (Feb '06)
40.4 (Nov '09)
30
35
40
45
50
55
60
2004 2005 2006 2007 2008 2009 2010
Project evaluationperiod
Nationwide
Project area

Smallholder agriculture’s contribution to better nutrition
30
participation in the various interventions, they derived the following picture of the
effectiveness of the different parts of the programme (Figure 4.2).
Figure 4.2 Reductions in stunting among 6–24 month olds. Synergies between direct nutrition activities and other actions
Source: Figure 5 in Smith et al., 2011, Authors’ calculations
As can be seen, all interventions worked, with female empowerment being the strongest single
determinant — echoing the Smith & Haddad reports from cross-country regression. The
synergies, however, were most impressive. The combinations of mother and child health care
with sanitation, female empowerment, and agriculture and fisheries significantly strengthened
the effects.
Although this is only one programme, albeit one so large and affecting people so
disadvantaged that it deserves attention, the implications are potentially very important for
nutrition policy. The influential Scaling Up Nutrition (SUN) (2010) framework — see Box B in
section 5 — can be read to suggest that trying to move the fundamental factors behind
malnutrition — poverty, access to food, health and sanitation — may take so long that the
overwhelming priority should be direct interventions such as MHCN, micro-nutrient
supplementation, and therapeutic feeding. Shouhardo, in contrast, suggests that significant
progress can be made on underlying factors at the same time as direct intervention, and to
very good effect: a remarkable finding.
Micro-nutrient and health (MICAH) programme, Africa
An unusually wide-ranging evaluation has been carried out of a comprehensive
micronutrient and health (MICAH) programme funded by World Vision Canada since 1995
in five countries — Ethiopia, Ghana, Malawi, Senegal and Tanzania — to promote better
micro-nutrition and health care (Berti et al. 2010). In each country, interventions were
designed for poor rural areas —areas with worse nutritional indicators compared to data from
(DHS) national surveys carried out at that period — corresponding to their understood
problems. The programmes typically included dietary diversification through fruit and
vegetable cultivation and raising livestock on small-scale, supplementation, fortification, infant
and young child feeding practices, water and sanitation, and disease control.
-9
-8
-7
-6
-5
-4
-3
-2
-1
0
MC
HN
San
itat
ion
MC
HN
+ S
anit
atio
n
MC
HN
Fem
ale
em
po
we
rme
nt
MC
HN
+ F
em.
Emp
ow
eerm
en
t
MC
HN
Agr
i & F
ish
MC
HN
+ A
gri &
Fis
h
Pe
rce
nta
ge p
oin
ts r
ed
uce
d s
tun
tin
g

Smallholder agriculture’s contribution to better nutrition
31
Most of the programmes succeeded in reducing micro-nutrient deficiencies and their
consequences; health was improved; and, with the exception of Ethiopia, child malnutrition
was reduced. In each case, it seems that programme participants enjoyed greater
improvements than national averages suggested would have been so for those outside the
programme.
Of particular interest, in this case it seemed that the results of multiple interventions produced
larger effects than might have been expected from trials of isolated interventions. Of the
country programmes, the one where most resources were brought to bear on the problems,
Malawi, saw the largest impact. Integrating efforts across sectors — in this case food
production, care, water and sanitation, and health — paid off.
5 What are political and administrative conditions for progress?
5.1 Policies for smallholder agricultural development
Policy to encourage smallholder development, as for agriculture as a whole, has come back
into the limelight in the new century. The 1980s and 1990s saw a decline in support for
agriculture from the main donors, and from governments as well in some parts of the
developing world, most notably in Africa (Binswanger-Mkhize & McCalla 2008). Since 2000,
however, there has been a growing sense that agriculture has been unduly neglected. In part
this came from the Millennium Development Goals that set reduced poverty and hunger as the
first objectives, thereby drawing attention to the concentration of poverty in rural areas.
Frustration over slow agricultural growth in Africa led ministers of agriculture meeting in
Maputo in 1993 to pledge to increase spending on agricultural development to raise growth
rates of agriculture to 6% a year. The refocusing of attention on agriculture was further
stimulated when cereals prices spiked on world markets in 2007–08 to a degree not seen since
1973–74.
A broad consensus exists on policies for development of agriculture, and smallholder
agriculture in particular, perhaps best expressed in the World Development Report for 2008
(World Bank 2007). Governments need to do two things above all else. One is to ensure that
there is a rural investment climate that encourages agricultural investment and innovation.
These enabling conditions include peace, law and order in rural areas; macro-economic
stability in the shape of a competitive exchange rate, relatively low inflation and interest rates;
and support for key institutions such as property rights, weights and measures, contract law,
financial supervision and regulation, and business regulations that protect public interests but
do not deter investors. This is understood largely by default: when the investment climate is
grossly deficient, agricultural growth slows to a crawl — see, for example, the studies of
effective rates of protection in the 1970s that showed how damaging heavy taxation, most of it
implicit, of agriculture was in the developing world (Krueger, Schiff & Valdés 1991).
The other is to supply rural public goods: those goods that private investors will not otherwise
supply. These include physical infrastructure of roads, power lines, in some areas irrigation and
drainage; investments in education, health care, clean water and sanitation; and knowledge
generation through agricultural research, preferably that takes account of indigenous
knowledge and extension. Returns to rural public goods have often been found to be high: see
evidence for Asia in Fan et al. 2000, 2003, 2007.
Public goods matter especially for smallholders, since unlike some large-scale commercial
farmers who may have the means to access some of these goods and services privately, they
cannot. Roads that allow trucks to reach small farms without undue unit cost are particularly
important. Public agricultural research needs to focus on smallholder needs, with technical
innovations that are sparing in their use of capital, but which emphasise labour and the skilful

Smallholder agriculture’s contribution to better nutrition
32
application to local circumstances: reflecting the relative endowments of smallholders. For very
small, part-time farms there is often a call for intermediate technologies that raise yields of
food crops without heavy demands for labour or external inputs.
It is probably not necessary that public performance needs to be exemplary in either of these
tasks. China, for example, saw extraordinary growth of its agriculture from 1978 onwards,
simply because a poor rural investment climate had been reformed into being a tolerably
deficient one — it was subsequently improved with further reforms, but most of the impact
was achieved through removing the worst faults (Rodrik 2003). Ghana whose agriculture was
in dire straits in the early 1980s saw it become one of the fastest-growing in the world after
the reforms that began in 1983 (Leturque & Wiggins 2011). For a quarter century since, the
average rate of growth has been between 4% and 5% a year, well ahead of population growth.
Ghana’s reforms were far from comprehensive or perfect: but they removed the main
blockages faced by farmers, and provided some rural public goods that were not there before.
While these basic conditions can do much to stimulate agricultural growth, many smallholders
face difficulties in markets, and especially those for inputs, insurance, financial services and
technical assistance. Inability to obtain seeds, fertiliser, advice and credit on reasonable terms
explains in part why in many parts of Africa yields are so far below what fields trials suggest is
possible with technical improvements. Remedies for failings in rural markets are debated,
however: the answers may lie variously with institutions such as contract farming that give
farmers access to inputs on credit; or in farmer co-operation that makes it easier to negotiate
credit or inputs in bulk; or else in direct state provision to replace the market where it does not
function.
Tackling female disadvantage in agriculture
Women farmers face disadvantages, some specific to the roles assigned to their gender, others
being more intense manifestations of problems that many male smallholders face.
Access to land for women needs to be made secure, especially for widows who often lose
access to land when their husbands die. Making sure national laws recognise women’s rights to
land they have long cultivated is one response; but equally work at local level with traditional
authorities to raise awareness of potential injustice may be effective. The Tripathi et al (2012)
review gives an example of this work in southern Africa. It is not just rights to crop land:
women may rely as well on collective rights to grazing, firewood and water — rights that can
be vulnerable to private appropriation. Such collective rights need to form part of official
recognition and local defence.
The difficulties male smallholders face in markets are magnified for many women farmers —
owing to entrenched inequality in which women often have less education, less facility in
national languages, and less time and more difficulty in engaging with (largely male) actors
outside of the village. Hence actions to improve the functioning of rural markets are likely to
be of disproportionate benefit to women farmers. For credit, rotating savings groups may be
one way forward (Tripathi et al., 2012).
Risks in agriculture of harvest failures and deaths of livestock may be greater for women who
have fewer resources: these may deter them from innovation and investment. Micro-
insurance may be one response. Disaster resilience and risk reduction at greater scales of
village, district and province need to be gender-sensitive.
Of the public goods for rural areas, several are particularly important for women farmers.
Extension services too often do not recognise women farmers’ circumstances and often do
not have women extensionists; the technologies they seek to disseminate are rarely designed
with women in mind — above all taking into account a critical factor for women farmers: time.
Labour-saving technologies such as drip irrigation can be particularly useful for women with
irrigated gardens. Forms of communication matter as well: community radios, literacy
programmes for rural women, farmer field schools and farmer-to-farmer exchanges, mentoring

Smallholder agriculture’s contribution to better nutrition
33
support for women producers to improve organisational and technical skills, and establishing
plant clinics in local markets — may be appropriate (Tripathi et al., 2012).
Other public goods can complement agricultural interventions: ensuring that girls get at least
secondary education can contribute in lowering barriers to communication, as well as raising
female status. Clean water supplies can reduce the time taken to draw household water and
reduce child sickness. Health services are likely to be of particular benefit to mothers.
Ultimately underlying gender inequities need to be challenged:
‘Therefore, women’s economic empowerment must be accompanied by measures to
address broader gender issues including power imbalances, gender stereotypes and
discrimination against women. Among and between both men and women,
activities that promote discussion and mutual understanding of issues such as
gender roles, unequal workload, rights and responsibilities are important for raising
awareness, informing programmes and policies and ultimately addressing gender
inequality.’ (Tripathi et al., 2012)
Shouhardo in Bangladesh, see section 3.3, is an example of a nutrition programme that
included explicit and direct action on female empowerment, to good effect. Central to this was
the formation of …
‘… Empowerment, Knowledge and Transformative Action (EKATA) groups, which
established a recognised and accepted forum for women to meet and express
themselves in a public role. The groups, comprised of twenty women and ten
adolescent girls, provided a platform for empowering women and girls through
education, solidarity, group planning, and rights advocacy.
[Together with pre-school groups and parent-teacher associations that included
women …]
… the three interventions had a broad range of goals: increasing women’s decision
making power at household and community levels, reducing gender-based violence,
raising awareness of educational entitlements for women and girls, building
women’s leadership, advocacy, and literacy skills, and consciousness-building
around important social issues, including dowry, early marriage, divorce, and
violence against women. (Smith et al. 2011)
Ensuring smallholder development be environmentally sustainable
In the cases of Machakos and Burkina Faso where smallholders had conserved their land while
developing it, three factors stand out. One is that farmers had the appropriate technical
knowledge and skill, much of it the product of farmer-to-farmer learning. A second element
was that farmers were secure in their tenure of their land, albeit under longstanding collective
tenure rather than formal registration. A third factor was they had incentives to conserve: in
both cases there was little chance to raise production by expanding the area, and the fields
had to be conserved if productivity was to rise.
Not all of these factors can be promoted by policy alone, but there are pointers for policies and
programmes. Farmer-to-farmer learning, especially of agro-ecological approaches with
considerable local specificity, can be facilitated and promoted by innovative extension services;
research on conservation of soil and water need to recognise how and where local innovations
function. Security of tenure may be enhanced by formal recognition of collective tenure and
local control over access to land.
To these considerations may be added measures to deal with externalities where they arise —
for example, in drawing down of groundwater reserves. Governments need then either to
regulate or set incentives in the form of taxes and subsidies to make sure that private and
public calculations are aligned for sustainable use of natural resources.

Smallholder agriculture’s contribution to better nutrition
34
A major challenge is that since the environment and its functioning is so specific to particular
ecosystems and localities, public policy ideally needs to be adjusted to circumstances — an
ideal that does not match with the administrative possibilities that require a certain uniformity
of public action if it is to be feasible.
These issues become all the more important given the context in which environmental
concerns such as scarcity of water and the need to conserve biodiversity are becoming more
pressing, not to mention the looming imperative of adapting to and mitigating climate change.
Although this exceeds the scope of this paper, responses probably lie in further progress with
agro-ecological technology — innovation such as faidherbia trees planted amongst food crops
and other agro-forestry initiatives, minimal tillage, micro-dosing of nutrients, integrated pest
management, soil and water conservation, etc. Policies that seek to develop these techniques
and disseminate them, backed by incentives to encourage their use will be needed.
Specific agricultural interventions for nutrition
Patterns of agricultural production need in many countries, Bangladesh being a prominent
example, to be shifted to more diverse crops and livestock so as to make foodstuffs rich in
vitamins and minerals more available, and probably in the process, less costly. At very least,
research and extension systems need to be directed to give as much attention to
complementary foodstuffs as to staples. There may be scope beyond this for looking to see
what bottlenecks arise for farmers seeking to diversify their crops and livestock, then
designing appropriate policy responses.
More specifically, home gardens with small-scale livestock keeping are proven ways to
diversify diet and often to empower women farmers. Promotion of home gardens may require
little more than information, encouraging local groups to share ideas, some technical
assistance and providing access to seeds — that might, for example, be produced in village or
district nurseries. For best effect, however, home garden programmes need to be coupled with
education and behaviour change communication about diet, care and hygiene.
Fortifying staples with added minerals and vitamins through plant-breeding may have promise
as well: although it remains to be seen how much the varieties being developed are acceptable
to farmers and consumers.
5.2 Leadership and political conditions
Convincing narratives
It is one thing to specify the kinds of policies needed to make smallholder agricultural
development more effective for food security and nutrition, another to find the political will to
implement them. So what makes the difference in leadership?
Very little is known about how to create leadership for hunger reduction …
[Foresight 2011]
Clearly there needs to be support, and preferably at the highest level, for better food security
and nutrition. Presidential or Prime Ministerial support was a feature of success in
Brazil, Ethiopia and Peru (Mejía A. & Fanzo 2012). Clearly there is no science to firing the
imagination of leaders, but there are indications of factors that can contribute.
One of these is the creation of convincing narratives that are widely shared. In Bangladesh, for
example, the price of rice has become a point of reference for food security debates (Mejía A.
& Fanzo 2012). Although these authors do not consider the rice price central to nutrition in
Bangladesh, it is not hard to see why the rice price has come to have such importance. In the
famines of 1943 and 1974 rice prices rapidly doubled (1974) or even quadrupled (1943), so

Smallholder agriculture’s contribution to better nutrition
35
that many of the poor simply had no access to sufficient food, leading to widespread suffering
and many dying, largely from diseases.
For nutrition there is opportunity and threat with narratives: on the one hand, the simple
statistics of child malnutrition can create a dramatic sense of the problem; on the other, the
multiple causes of malnutrition impede the building of a simple, clear story of causes and
hence solutions. But this line of thought should not end in pessimism: good experiences build
narratives and inspire imitation. Piloting innovative approaches to smallholder
agricultural development and nutrition can capture the imagination. Programmes such
as MICAH or Shouhardo are good examples of eye-catching experiences where the first round
of evaluation suggests there are important lessons that can and should be taken on board by
government for potential replication. There is a role here for civil society in making these
results known, and for researchers in making sure that reviews are sufficiently rigorous that
they cannot be readily dismissed by sceptics.
Setting nutrition as a central aim of development can help, although that begs the question of
the processes by which nutrition can compete with other goals — such as economic growth.
Box A records the frameworks of policy aims and approaches proposed and agreed
internationally by the UN and other prominent agencies. These cover most priorities. The
question here is how to make sure that they become part of funded action plans.
Just drafting national strategies with nutrition as a goal does not mean that this will capture
the political imagination. Civil society initiatives, such as that for child nutrition in Peru, can
work.
In Peru, civil society movements and other stakeholders organised around the
Children’s Nutrition Initiative played a critical role to encourage the government to
include nutrition goals as part of Peru’s poverty reduction strategy. (Mejía A. &
Fanzo 2012)
Box A Policy frameworks for food security and nutrition
Reducing hunger forms part of the UN Millennium Development Goals [see http://www.un.org/millenniumgoals/bkgd.shtml] set in 2000 to be reached by 2015,
together with specific targets and indicators to measure progress towards them. Under the first goal of eradicating extreme poverty and hunger, the target (1.c) is to halve, between 1990 and 2015, the proportion of people who suffer from hunger. Two indicators to track progress have been selected: halving the proportion of children under five years of age who are underweight; and halving the proportion of people under-nourished, that is, those below a minimum level of dietary energy consumption (UN 2008, Statistical Annex). In the baseline years of 1990–1992, in developing regions 31% of children under five were
underweight and there were 817M people suffering from undernourishment.
In 2004 Voluntary Guidelines to support the progressive realization of the right to adequate food in the context of national food security were adopted by the FAO
Council, as a first attempt to interpret food security as an economic, social and cultural right. The guidelines include the identification of the food insecure and the causes of their
hunger; assessing the effectiveness of policies, laws and programmes influencing food insecurity; formulating national strategies to address the issues with budgets, roles of public agencies and responsibilities; integrating the right to food in national legislation; monitoring nutrition outcomes; and holding responsible agencies to account.
Following the unexpected spike in cereals prices on world markets in late 2007 and early
2008, the UN Secretary General appointed a High Level Task Force (HLTF) on the Global Food Security Crisis in April 2008, intended to help co-ordinate and galvanise international responses to the spike and its consequences. Later that year the Task Force produced the first draft of the Comprehensive Framework for Action (CFA) in 2008 that has subsequently been revised and updated, the latest version being from September 2010. This sets out twin objectives of short-term measures to ‘improve access to food and nutrition and to take immediate steps to increase food availability’, combined with longer
term steps to ‘Strengthen food and nutrition security in the longer-term by addressing the

Smallholder agriculture’s contribution to better nutrition
36
underlying factors driving the food crisis’.
Leading donors have also set out their visions. The European Commission (2010), for example has set out a food security framework. This recommends for the Commission and
member states measures that address the availability of food, access to it, nutrition, and responses to food crises. This emphasises agricultural production by small-scale farmers, since this will give growth with poverty production. It highlights environmental sustainability, recommending:
… intensification approaches that are sustainable and ecologically efficient,
respecting the diverse functions of agriculture. This means inter alia optimising agri-inputs, integrated pest management, improved soil and water management and stress resistant crop varieties.
Agricultural research thus needs to respect farmer needs, to incorporate traditional knowledge, and to provide access to intellectual property. It highlights gender dimensions,
recommending specific investment in women. Land rights of longstanding users need to be
respected.
To these frameworks can be added the Rome Principles for Sustainable Global Food Security adopted in 2009 by the World Summit on Food Security in Rome: country-owned plans; co-ordinate at national, regional and world level; take the twin-track to food security;
improve effectiveness of multilateral agencies; and, commit to invest in agriculture, food security and nutrition. These build on the wider aid effectiveness principles set out in the Paris Declaration: developing countries to own their development strategies; donors to align with those strategies and use local systems; donors to harmonise their procedures to avoid duplication; focus on results in development and measure outcomes; and donors and governments mutually accountable for results.
All the above have been incorporated into the Global Strategic Framework for Food Security and Nutrition, second draft, May 2012, of the Committee of Food Security (CFS). This confirms the simultaneous approach of ‘Direct action to immediately tackle hunger and malnutrition for the most vulnerable’; plus ‘medium to long-term actions to build resilience
and address the root causes of hunger.’ The latter includes:
Improve agricultural productivity and enhance livelihoods and food security in poor rural communities; promote productive activities and employment;
Develop and conserve natural resources; ensure access to productive resources;
Expand rural infrastructure, including capacity for food safety, plant and animal
health; and broaden market access;
Strengthen capacity for knowledge generation and dissemination (research, extension, education and communication’
For agriculture, this Framework recommends paying attention to the needs and potential of small-scale farmers; addressing gender issues including women farmers’ access to land, technology and inputs; promoting agriculture that is sustainable environmentally, socially, and economically; and protecting rights to land and water. It also recommends direct action to improve nutrition.
Some frameworks look at agriculture as a way to reduce poverty and hunger. A full list of those produced by the main international and bilateral development partners would be long, but three can be picked out to illustrate some of the main lines of thought.
The World Bank (2007) in its World Development Report 2008 focused on agriculture and how agricultural development could reduce poverty. It states the case for agricultural development in low income countries as a major route out of poverty. Smallholder
agriculture is seen as usually efficient, although the Report worries that larger-scale operations may become more appropriate as supply chains and technology change. It also recognises differences in context, especially between countries seen as being either agricultural, in transition or urbanised: as countries move along this spectrum, increasingly rural poverty will also be relieved by growth of the rural non-farm economy and by out-migration from rural areas.
The 2008 International Assessment of Agricultural Science and Technology for Development (IAASTD) addresses a wide range of issues in agriculture, moving beyond
the usual concerns of growth, poverty and hunger to emphasise environmental

Smallholder agriculture’s contribution to better nutrition
37
sustainability and indeed, cultural dimensions as well. It argues for revising technology policies to reflect these multiple concerns and to respect the diversity, natural and cultural, found in rural areas across the world.
IFAD’s (2010) Rural Poverty Report 2011 focuses on smallholder agriculture and poverty reduction, with an emphasis on the risks that poor farmers face and which deter them from investing and innovating. It stresses the need for sustainable intensification in farming worldwide, and a need to re-direct policies towards intensification that is environmentally sustainable.
Finally, and specifically for nutrition, the 2010 Scaling up Nutrition initiative has been signed by 95 UN and other international agencies, bilateral donors, NGOs and research organisations, plus seven private enterprises. This aims to accelerate investments to reduce malnutrition, within a framework ‘of key considerations, principles and priorities for action’. The immediate priorities are to scale up 13 direct interventions — covering good nutrition practices, increasing intake of vitamins and minerals, and therapeutic feeding of
malnourished children (listed in Annex H) — to address malnutrition that are known to be both effective and which offer high returns to investments. Action should take place across sectors, including agriculture, health, social protection, education, water and sanitation. That said, the framework focuses on the thirteen interventions, especially for the 36 countries where 90% of the world’s under-nourished children live.
At local level it may be possible to link nutrition programmes to electoral support, as occurred
in parts of Brazil:
In Brazil, the success of national poverty reduction schemes (such as Bolsa Familia)
encouraged local mayors from the government and opposition parties to further
support and sponsor these programmes in their own districts and benefit from the
electoral rewards. (Mejía A. & Fanzo 2012)
But there is a word of warning here: it is rarely the case that nutrition programmes alone draw
forth community interest according to Mason (2002). They thus need to be combined with
health and other programmes, in some cases agriculture, that may gain more support.
Aligning nutrition interventions with locally strongly felt priorities is an obvious point, but one
that can be overlooked.
Holding government to account
Pressure for governments to take food security and nutrition more seriously can come from
international and local sources. Internationally, the right to food — see Box A — can be very
useful since it allows UN agencies and staff to be more critical of national inaction than they
might otherwise be: the reports on national progress by the Special Rapporteur on the Right to
Food have been scathing about the situation in some countries.
Nationally, civil society can play a role in monitoring progress towards better food
security and nutrition, as well as commitment as seen in resources committed to nutrition
programmes. In some countries, the right to food, especially when part of national law, can
allow strong complaints over government inaction. For example, India has seen formal legal
complaint over the failure to ensure the right to food, in a country with very large public
reserves of grains.
In May 2001, the People's Union for Civil Liberties (registered in Rajasthan by a
small group of social activists) submitted a petition in the Supreme Court,
demanding that the country's gigantic food stocks should be used without delay to
prevent hunger and starvation. This Supreme Court hearing, which is likely to last
several years, has led to a larger “right to food campaign”.’ (Piron 2003, 11)
It may be possible for local civil society groups to monitor the disbursement of funds intended
for agriculture and nutrition programmes at district level — if such data are publicly available.

Smallholder agriculture’s contribution to better nutrition
38
Holding government and leaders to account depends on having information and data. Hence
having ready indices of commitment could be useful — at least internationally when comparing
across governments (Foresight 2011). At national level, data on food security and nutrition
outcomes, preferably disaggregated by sex, needs to be collected regularly. Not only does this
help focus political attention on food security and nutrition, but also helps monitor progress
and adjust programmes. (Mejía A. & Fanzo 2012) Civil society has a role to play here: at very
least in publishing, but in some cases also in generating statistics. Since national surveys of
food security and nutrition and its determinants are relatively costly for non-governmental
organisations, there is scope here for alliances of civil society to combine and underwrite costs.
With advances in information technology, most notably mobile phones, the possibility of much
more agile data collection and processing arises. (Foresight 2011) Text messaging coupled
with GPS, for example, might allow indicators of food security and nutrition to be collected
monthly from sentinel sites across nations and regions, with almost no delay in feeding the
results back to decision-makers and the public, the results being presented in easily
appreciated maps.
5.3 Delivering in the field: co-ordinating activity
Compared to technical issues, less has been written about the political and administrative
conditions for better food security and nutrition. Since these respond to multiple factors, it is
widely agreed that efforts need to proceed through several programmes and agencies, and
hence that this needs co-ordinating. But what kind of co-ordination works, and where in the
administration should this take place?
Central co-ordination units at high level may work, but not always:
Bodies set up to coordinate nutrition actions can play a critical role to facilitate
cooperation across government ministries, facilitate effective funding allocations,
monitor progress and include other stakeholders in the decision-making process.
But they can just as easily be ineffective fig-leaves, meeting infrequently and
without much power to demand change. (Mejía A. & Fanzo 2012)
Others also report that high-level food security and nutrition co-ordination units have
sometimes not achieved much (World Bank 2007). Complementary actions may be better
arranged locally:
More limited, lower-level opportunities for collaboration to address specific and local issues
contributing to malnutrition appear to offer greater promise for effective action. This local
collaboration offers the prospect of incrementally improving higher-level coordination of multi-
sectoral action to address food insecurity and malnutrition effectively on a national basis.
(World Bank 2007)
Funding mechanisms can contribute to co-ordination, so long as public funds are disbursed
from one source, such as finance ministries. The danger here is that external funds channelled
directly to operating agencies to avoid delays in disbursement, can then give them the liberty
to ignore other agencies. (Mejía A. & Fanzo 2012)
Programmes need to fit with local circumstances and capabilities. Typical lessons are those of
not overloading and overwhelming local structures and capacities. The art here is to simplify
the vertical structures of programmes, while allowing them to become more complex at the
field level as elements other than nutrition are combined to increase the coverage and
attractiveness of the programme. (Mason 2002) The MICAH programme, operating in four
African countries, found a way to do this. It planned for a broad package of interventions
rather than relying on single ‘magic bullets’, but then allowed community participation to tune
the package to local needs:

Smallholder agriculture’s contribution to better nutrition
39
… community participation in programme design, implementation and monitoring
and evaluation, such that some interventions could be tailored to suit community
preferences, especially regarding animal husbandry where existing practices
differed from community to community (Berti et al 2010)
The technical integrity of the programme was nevertheless ensured by technical support and
regular supervision of field staff, plus monitoring of results that allowed programmes to be
adjusted when it was clear that they were not making headway. (Berti et al. 2010)
A tension thus arises between accepting to do what may be possible, against impatiently
demanding that programmes are designed to allow proven interventions to be implemented.
Getting the balance right is a matter of fine judgment, rather than precise science.
6 Conclusions and recommendations
Four points stand out from this review and form the basis of policy conclusions and
recommendations.
1. Smallholder agricultural development can be an excellent way to reduce poverty
and tackle hunger in low income countries. It can increase food production, raise rural
incomes, and push down food prices; all of which should improve the access of poor and
vulnerable people to food and thereby contribute considerably to improving their food security.
Given that many of those who are food insecure work in agriculture, then its effects can be
direct.
The implication is to continue with efforts to develop agriculture and especially that of small-
scale family farms. Some of the ways to do this are reasonably well known, hence the first two
recommendations:
R1: Countries need to ensure that the rural investment climate is conducive to
investment and innovation. This means peace and security, a reasonably stable
macro-economy without major economic distortions, and the establishment and
recognition of critical institutions, such as property rights. Those who suffer most from
investment climates that deter investment are small-scale enterprises, including
smallholdings. Large businesses may be able to protect themselves from insecurity,
macro-economic chaos and the absence of property rights: smallholders can only do so
by retreating to autarkic subsistence economy, usually of low productivity.
This may seem a tall order for low income countries that face multiple challenges; but
experience shows that the rural investment climate does not have to be ideal; only that
the worst failings are eliminated.
R2: Countries need to invest in rural public goods, including: physical
infrastructure — rural roads, electricity, perhaps irrigation and drainage where
applicable; human development — education, water and sanitation, health; and public
knowledge through agricultural research and extension. Again, these are particularly
valuable for smallholders who cannot substitute private investments for most of these
public goods.
Spending on public goods in rural areas pays off, both in returns on investment and in
reductions of the numbers of people living in poverty: as can be seen from studies of
returns to these investments in Asia when agricultural development was particularly
rapid (Fan et al. 2007).
Prime responsibility for these lies with domestic governments, but donors can help with some
of the capital costs of public investments.

Smallholder agriculture’s contribution to better nutrition
40
After these, comes a more challenging matter where the responses to the problem are in
debate, but in any case will vary by circumstances.
R3: Improve the access to rural markets, especially for inputs, insurance and
finance, for smallholders and improve their terms of engagement in such
markets. Currently the majority of small-scale farmers in Africa engage much less with
markets than the gains to specialisation and use of external inputs would suggest. Part
of the reason for this lies in high costs of information and negotiations between
enterprises in the supply chain such as banks and small family farms. Responses will
need to be tailored to conditions, but promising ways to improve lie in institutional
innovations such as contracting and in producer organisations.
Finding effective solutions requires innovative programmes that may be too risky for
governments and donors, and hence may be better managed by NGOs, foundations and
private enterprise. More effort, however, needs to be made to learn from these experiences, so
that where effective solutions are proved, they can be replicated more widely by public
programmes.
While these policies will allow some smallholders to develop their farms, other farms marginal
either by their very small size, poor quality of soils and climate, lack of labour, or remoteness
from services and markets may need additional measures. In particular, on the more marginal
holdings farming is often part-time, one of several livelihoods that household members pursue.
Hence labour may be scarce, and working capital may also be lacking.
R4: Develop and promote innovations for marginal farms, focusing on higher
yields for staples but using few external inputs and where possible saving labour. These
will allow these farms to achieve the self-provisioning in staples that is often a primary
objective of the farm, as well as potentially allowing some of the land to be switched to
more diverse, nutrient-rich fruit, vegetables and small-scale livestock rearing.
Responsibility for this lies with agricultural research systems, although for some researchers
taking up this challenge may require setting aside the search for optimal yields. There is scope
here for NGOs to foster exchange of experiences from local innovations and NGO research.
Smallholders and especially the more marginalised, need assurance that their land rights are
respected both in recognition of their entitlements and to remove any disincentive there may
be to invest, innovate and conserve.
R5: Recognise and protect the rights of small farmers to their land. This may
mean some form of registration of rights, but it may mean recognising local authorities
that define land rights. Two particular issues are to ensure the recognition of women’s
rights as farmers, especially those of widows; and of safeguarding against land being
taken away in land deals without free, prior and informed consent.
Responsibility here lies with governments, although there are roles for civil society in making
sure that laws, rules and practice are respected and in bringing abuses to attention.
Last but not least, smallholder agriculture can be environmentally sustainable and increasingly
will have to be in a world where natural resources will be in short supply, further ecological
damage will carry too high a price for future generations and where global warming will lead to
climate change and increasingly volatile weather.
R6: Give sufficient support to make sure that smallholder agricultural
development is environmentally sustainable. This can be encouraged by
agricultural research & extension that engages with local needs, knowledge and
perceptions of the relation of farming to soil, water, and other parts of the local
ecology. When better farming practice confers external benefits, farmers should be
rewarded for this.
Given the size of this challenge this will require not only appropriate domestic policies, but also
support from international policy-making to promote global public goods — and prevent global

Smallholder agriculture’s contribution to better nutrition
41
bads, with major roles for research both technical and social to find responses to the
challenges including those of climate change.
2. Patterns of agricultural development need steering towards more diversified food
production. Progress on food security and better nutrition has been greater on food
availability than on food access, and on access to energy-rich foods than on those with more
diverse nutrients. For every person who suffers from undernourishment in the world, more
than twice as many suffer from deficiencies in minerals and vitamins. Part of the answer lies
with more diversified food production, that may also reduce risk in production and markets for
smallholders. The problem of the focus on energy-dense foodstuffs is likely to become ever
more pressing this century, with urbanisation and rising incomes allowing people to adopt diets
high in energy, sugar and salt that have already taken their toll in the diseases of affluence
seen in most OECD countries. Production of foodstuffs rich in micro-nutrients needs
encouragement.
Agricultural policy can contribute, even if wider changes in diet will be necessary in the
medium term.
R7: Promote home gardens, with small-scale livestock rearing — including fish,
and back this up with communications for nutrition, health and child care. This
costs little, while the returns can be disproportionate. A key challenge here is ensuring
smallholders have access to good seed.
R8: Monitor progress on bio-fortification of staples, especially their adoption
by farmers. Since this technology is not yet proven at scale, this should not be seen as
the primary and still less the only way to tackle micro-nutrient deficiencies. Home
gardens, for example, can be promoted at the same time. Even if bio-fortified crops do
become taken up widely, people will want to consume foods complementary to their
staples as well.
Responsibility here lies with domestic governments, with ministries of agriculture in the lead,
but working in co-operation with those of health, community development and so on. NGOs
have a role to play in piloting and demonstrating effective models, documenting them and
bringing them to the attention of governments.
3. Back up smallholder agricultural programmes, with complementary actions in
primary health care, clean water and sanitation, other direct interventions for
nutrition, and female empowerment. Agriculture can play a key role in reducing hunger,
but it needs to be supported by actions in these other spheres. Female empowerment may be
the outstanding complement to both agriculture and actions on health, water and so on.
Empowered and educated mothers are time and again shown to spend incomes on their young
children and to protect the nutrition and health of the household.
R9: Back up agricultural development with commensurate investments in
primary health care, clean water and sanitation, and BCC on diet, child care
and hygiene. These measures include the direct nutrition interventions recommended
in the SUN initiative, but they should not be the only ones, however valuable as they
may be. The concern that progress in shifting the deeper causes of malnutrition would
be too slow may exaggerate if the striking results of programmes such as Shouhardo in
Bangladesh are considered.
R10: Correct female disadvantages in farming: this will not only raise production
and improve the pattern of production, but also help empower rural women and
overcome longstanding unfairness. Priorities include recognising and strengthening
women’s rights to fields and common property resources; directing attention to
women’s needs in farming and finding ways to support them; and in general,
developing innovations both on field and in domestic tasks, such as water supply and
fuel collection, that save time and appropriate for women. Making sure that girls living

Smallholder agriculture’s contribution to better nutrition
42
in rural areas are schooled through until the end of secondary will underpin these
measures.
Prime responsibility lies with national governments, where the challenge is to co-ordinate the
actions of different agencies. At central level this may consist of little more than political
leadership and budget co-ordination by finance ministries: the detailed operational co-
ordination may be simpler at district level than attempting to decide this centrally. NGOs and
donors may support these efforts by funding innovative programmes that can show how these
programmes may work in specific countries.
4. Greater political support for improving food security and nutrition is needed. Political support to is often lukewarm: perhaps because of ignorance of the problems, or
because the remedies can seem dauntingly difficult for problems that have multiple causes.
How to generate political support may not be certain, but at least two things seem promising.
R11: Monitor and survey more often the state of food security and nutrition, to
highlight the problems and to see where and when progress is being made. At
the moment, statistics in many low income countries with high rates of food insecurity
and malnutrition are few, collected infrequently, and some, such as those for
undernourishment of individuals, are unreliable. Statistics on micro-nutrient deficiency
are particularly rare. Regular national surveys of nutrition and food security should be
conducted, at least once every five years, preferably every three years. Sentinel sites
could be established for more frequent monitoring of food and nutrition (see Barrett
2010). This could take advantage of text messaging to collect information in real time,
so that policy-makers and their advisers have information accurate to the month on the
state of food insecurity.
R12: Pilot innovative approaches, then evaluate these rigorously with counter-
factuals wherever possible, and publicise the results. Currently much is tried, but
much either passes without review or is not sufficiently well evaluated to convince
sceptical readers. Not all pilots will succeed of course, but some will: understanding in
broad terms what works can inspire action — and political will.
Civil society can play a role in generating information to draw attention to problems and
opportunities, then making sure that key messages reach leaders, opinion-makers and the
general public.
Final reflection: what will this cost?
These recommendations have not been costed item by item, partly because some are policies
that have low costs, if they have any monetary cost at all; but mainly because most of what is
recommended here is not additional spending over and above what would be needed for any
programme of development.
To single out the costliest item mentioned for public investment, rural roads: passable rural
roads that allow vehicles to reach rural communities at moderate cost are not needed for
nutrition-sensitive agriculture alone, nor for agriculture alone; but for almost any kind of rural
development one could imagine. The same applies to all the costly elements in rural public
goods (R2) and complementary public investments (R8): clean water, education — these are
not just for food security and nutrition.
Most of the recommendations are for adjusting the use of resources that are already being
funded, or would be funded under a serious development effort.
That said, two sets of costings have been made that are relevant what is proposed here.
The thirteen direct nutritional interventions recommended by the SUN initiative have
been estimated to cost US$11.8 billion a year for the 36 countries where 90% of the world’s
under-nourished children live (see Annex H). Expressed per person, for the 2,845M persons in
those countries, that is about US$4.15 for every person each year: the return for which would

Smallholder agriculture’s contribution to better nutrition
43
not only be a decent start in life, a fundamental birth-right for children, but also great benefits
in the greater capacity of future workforces.
Most comprehensively, FAO (Schmidhuber & Bruinsma, 2011) has estimated the extra annual
spending required to eliminate hunger by 2025 as US$50.2 billion, including US$7.5
billion for food and cash-based safety nets14 in keeping with the twin-track approach of dealing
with long-term chronic hunger while also addressing short-term needs. Figure 6.1 shows the
break-down of this spending by sector and region. Most of the extra investment is for physical
infrastructure, and mostly in Sub-Saharan Africa and South Asia.
Figure 6.1 Extra annual spending needed to end hunger by 2025, by sector and region
Source: Data from Schmidhuber & Bruinsma, 2011.
Notes. Numbers on the horizontal axis are sub-totals in US$ billions for spending groups.
Regional sub-totals: sub-Saharan Africa, USS$13.2 billion; South Asia, US$17.6 billion; Near East and North Africa, US$2 billion; Latin
America, US$7.3 billion; and East Asia, US$10 billion.
An extra US$50 billion a year may sound a lot, but consider the figure for sub-Saharan Africa
of US$13.3 billion more. This is about US$15.50 for each of the 854M living in the region. Not
to labour the point: the costs are small compared to the numbers who will potentially benefit,
and the importance to them of food security and nutrition.
14 Without the consumption safety nets, the extra spending is equal to around US$42 billion per year (constant 2009), the figure called for in the IF campaign launched in 2013.
0
1
2
3
4
5
6
7
8
0
1,000
2,000
3,000
4,000
5,000
6,000
7,000
8,000
Ru
ral r
oad
s
Mar
kets
, sto
rage
, pro
cess
ing
Foo
d s
afet
y &
qu
alit
y
Ru
ral e
lect
rifi
cati
on
Lan
d r
eso
urc
es
Wat
er &
irri
gati
on
Pla
nt
gen
eti
c re
sou
rce
s
An
imal
ge
net
ic r
eso
urc
es
Fish
eri
es
Fore
stry
Ru
ral F
inan
ce
Mec
han
isat
ion
(co
op
erat
ive
s)
Lan
d t
itlin
g te
nu
re s
ecu
rity
Res
ear
ch &
de
velo
pm
ent
Exte
nsi
on
Pro
du
ctiv
e f
arm
saf
ety
ne
ts
Co
nsu
mp
tive
saf
ety
ne
ts
Infrastructure, 18.5 Natural resource development, 9.4 Institutions, 5.6 R&D andextension,
6.3
Safety nets,10.4
US$
mill
ion
s (c
on
stan
t 2
00
9)
East Asia
Latin America & Caribbean
Near East & N Asia
South Asia
Sub-Saharan Africa

Smallholder agriculture’s contribution to better nutrition
44
References
ACF, 2010, Impact & capitalisation study, Final version, Municipalities of Gadougou I & Gadougou II, Kita district,
Kayes region, Republic of Mali, July 2010
ACF, 2012, Mali, Health gardens, a nutrition centred approach
Agble, Rosanna. 2011. Rethinking on How We Do Business: Regional and actors perspectives — The Ghana
experience. IFPRI International Conference 10-12 Feb 2011, New Delhi, India.
http://2020conference.ifpri.info/files/2010/12/20110212_parallel4A1_Agble_Rosanna_note.pdf
Agble, Rosanna; Estelle Bader; Amelie Solal-Céligny; Julia Palma & Marie Claude Dop (2009). Nutrition Country Profile:
Republic of Ghana. FAO & FIVIMS
Ahmed, Shamin; A.F.M. Arifur Rahman; Md. Ghulam Mustafa; M. Belal Hossain & Nazmun Nahar, 2012. Nutrient
Composition of Indigenous and Exotic Fishes of Rainfed Waterlogged Paddy Fields in Lakshmipur, Bangladesh.
World Journal of Zoology 7 (2): 135-140. http://idosi.org/wjz/wjz7%282%2912/10.pdf
Alauddin, Mohammad & Mosharaff Hossain (2001). Environment and Agriculture in a Developing Economy: Problems
and Prospects for Bangladesh. Edward Elgar Publishing Ltd. Cheltenham.
Anderson, Kym, and Ernesto Valenzuela (2008), "Estimates of Distortions to Agricultural Incentives, 1955 to
2007",spreadsheet at www.worldbank.org/agdistortions , World Bank, Washington DC, October.
Arimond, M, Hawkes, C, Ruel, MT, Sifri, Z, Berti, PR, Leroy, J, Low, JW, Brown, LR, Frongillo, EA, 2011,’Agricultural
Interventions and Nutrition: Lessons from the Past and New Evidence’, eds B. Thompson & L. Amoroso; 2011,
Combating Micronutrient Deficiencies: Food-based Approaches, FAO, Rome, 41–75
Arsenault, Joanne, E.; Elizabeth A Yakes; Bess Lewis; M Muniril Islam; Bakhtiar Hossain; Tahmeed Ahmed; Christine
Hotz & Kenneth H Brown. April 2010. Potential impact of zinc-biofortified rice on zinc intakes of young
Bangladeshi children. The Journal of the Federation of American Societies for Experimental Biology.
http://www.fasebj.org/cgi/content/meeting_abstract/24/1_MeetingAbstracts/334.4
Atser, Godwin, April 2010. Ghanaian farmers get quality protein, drought-tolerant, and Striga-resistant maize varieties
to boost production. Modern Ghana. http://www.modernghana.com/news/270067/1/ghanaian-farmers-get-
quality-protein-drought-toler.html
Badiane, Ousmane & Gerald E Shively, 1998. Spatial integration, transport costs, and the response of local prices to
policy changes in Ghana. Journal of Development Economics, 56, 2: 411-431.
Bangladesh Bureau of Statistics (BBS) & UNICEF, 2007. Child and Mother Nutrition Survey 2005. Bangladesh Bureau
of Statistics and UNICEF, Dhaka. http://www.unicef.org/bangladesh/Child_and_Mother_Nutrition_Survey.pdf
Bangladesh Bureau of Statistics. Report of the Household Income & Expenditure Survey 2010. Dhaka. Online
http://www.bbs.gov.bd/PageWebMenuContent.aspx?MenuKey=320
Bangladesh Demographic Health Survey (BDHS), 2011. Online http://www.measuredhs.com/pubs/pdf/PR15/PR15.pdf
Barrett, Christopher B., 2010, ‘Measuring Food Insecurity’, Science, 327 (12), 825–828 February 2010
Bassett, Thomas J., 1988, ‘Development theory and reality: the World Bank in northern Ivory Coast’, Review of
African Political Economy, 41, 45–59
Behnke, Roy H, Ian Scoones & Carol Kerven, Eds, 1993, Range ecology at disequilibrium: new models of natural
variability and pastoral adaptation in African savannas, Overseas Development Institute, London
Berti P, Krasevec J, FitzGerald S. A review of the effectiveness of agriculture interventions in improving nutrition
outcomes. Public Health Nutrition. 2004;7(5):599–609
Berti, Peter R., Alison Mildon, Kendra Siekmans, Barbara Main and Carolyn MacDonald, 2010, ‘An adequacy evaluation
of a 10-year, four-country nutrition and health programme’, International Journal of Epidemiology 2010;1–
17, doi:10.1093/ije/dyp389
Bhagowalia, Priya; Purnima Menon; Agnes R. Quisumbing & Vidhya Soundararajan, June 2012. What Dimensions of
Women’s Empowerment Matter Most for Child Nutrition? IFPRI Discussion Paper 01192.
http://www.ifpri.org/sites/default/files/publications/ifpridp01192.pdf
Binswanger-Mkhize, Hans & Alex F. McCalla, 2008, ‘The Changing Context and Prospects for Agricultural and Rural
Development in Africa’, Background Paper, AfDB-IFAD Joint Evaluation of ARD in Africa. Tunis: African
Development Bank & Rome: International Fund for Agricultural Development
Biswas, Soutik, March 2010. Conundrum of Kerala's struggling economy. BBC News.
http://news.bbc.co.uk/1/hi/world/south_asia/8546952.stm
CARE, 2012. Reaching New Heights: The Case for Measuring Women’s Empowerment.
http://www.care.org/getinvolved/iwd/images/CARE_IWD_2012.pdf
Central Statistical Office, (CSO) Zambia, 1992. Zambia: Demographic and Health Survey 1992.
http://www.measuredhs.com/pubs/pdf/FR42/FR42.pdf
Central Statistical Office, (CSO) Zambia, March 2009. Zambia: Demographic and Health Survey 1992.
http://www.measuredhs.com/pubs/pdf/FR211/FR211%5Brevised-05-12-2009%5D.pdf
Chianca, Thomaz, 2011. An Evaluation of Heifer's Work in Zambia. Heifer International. http://www.heifer.org/media-
standalone/world-ark/archives/2011/holiday/an_evaluation_of_heifers_work_in_zambia

Smallholder agriculture’s contribution to better nutrition
45
CIDA, 2012. Project profile for Protein-Enhanced Maize Development. http://www.acdi-
cida.gc.ca/CIDAWEB/cpo.nsf/vWebProjByPartnerEn/28C4B1FC27433D8F852571F4003C9160. Accessed 2012
Cravari, Thierry; John M. Pettifor; Tom D. Thacher; Craig Meisner; Josiane Arnaud; & Philip R. Fischer. March 2008.
Rickets: An Overview and Future Directions, with Special Reference to Bangladesh: A Summary of the Rickets
Convergence Group Meeting, Dhaka, 26–27 January 2006. Journal of Health, Population and Nutrition. 26(1):
112–121. http://www.ncbi.nlm.nih.gov/pmc/articles/PMC2740674/
Cudjoe, Godsway; Clemens Breisinger & Xinshen Diao. Dec 10, 2008. Local Impacts of a Global Crisis: Food Price
Transmission and Poverty Impacts in Ghana. IFPRI GSSP Background Paper 15.
http://www.ifpri.org/sites/default/files/publications/gsspwp15.pdf
Danida, Jan 2009. Impact Evaluation of Aquaculture Interention in Bangladesh.
http://www.oecd.org/countries/bangladesh/42410375.pdf
De Groote, Hugo; Keith Tomlins; Joyce Haleegoah; Manfred Awool; Benedicta Frimpong; Abijit Banerji; Shyam al
Chowdury; & J.V. Meenakshi, 2010. Assessing rural consumers' WTP for orange, biofortified maize in Ghana
with experimental auctions and a simulated radio message. CIMMYT. Paper prepared for submission to the
African Agricultural Economics Association Meetings -- Cape Town, 19-23 September, 2010.
Delgado, Christopher, Peter Hazell, Jane Hopkins & Valerie Kelly, 1994. Promoting intersectoral growth linkages in
rural Africa through agricultural technology and policy reform. American Journal of Agricultural Economics, 76,
1166–71
Dev, S. Mahendra, May 2012. Agriculture-Nutrition Linkages and Policies in India. IFPRI Discussion Paper 01184.
Poverty, Health, and Nutrition Division. http://www.ifpri.org/sites/default/files/publications/ifpridp01184.pdf
Devereux, S., Vaitla, B, and Hauenstein Swan, S. (eds). 2009. Hunger Watch Report 2009: Seasons of Hunger:
Fighting Cycles of Quiet Starvation among the World's Rural Poor. London: Action Against Hunger.
DeWalt, Kathleen M., 1993, ‘Nutrition and the commercialization of agriculture: Ten years later’, Social Science &
Medicine, 36, 11, 1407–1416
Dorward, Andrew, Jonathan Kydd & Colin Poulton, Eds, 1998. Smallholder cash crop production under market
liberalisation. A new institutional economic perspective, CAB International, Wallingford. ISBN 0-85199-277-3
Drèze, Jean & Amartya Sen, 1989. Hunger and Public Action. Oxford.
Ecker, Olivier; Katinka Weinberger & Matin Qaim, June 2010. Patterns and determinants of dietary micronutrient
deficiencies in rural areas of East Africa. African Journal of Agricultural and Resource Economics, Vol 4 No.2
Eckman, Karlyn, 2005. Lessons learned by the WIN project on livelihoods diversification and enterprise development
FAO. LSP Working Paper 19 http://www.fao.org/es/esw/lsp/cd/img/docs/LSPWP19.pdf
Ecowas, 2007. Mid-term review meeting of ECOWAS nutrition focal points: Country experience with implementation of
Cap Verde recommendations, GHANA. Presentation in Bobo Dioulasso, Aug 21-23, 2007
Eik, Lars Olav; G.C. Kifaro; S.M. Kiango; Ø. M. Nordhagen; J. Safari & L.A. Mtenga, Sep 2008. Productivity of goats
and their contribution to household food security in high potential areas of East Africa: A Case of Mgeta,
Tanzania. African Journal of Food Agriculture Nutrition and Development. Volume 8 no. 3.
http://www.ajol.info/index.php/ajfand/article/viewFile/19177/36622
European Commission, 2010, An EU policy framework to assist developing countries in addressing food security
challenges, Communication from the Commission to the Council and the European Parliament, COM(2010)127
final, SEC(2010)379, Brussels, 31.3.2010
Fairhead, James & Melissa Leach, 1996, ‘ Relics of colonial science: rethinking West Africa’s forest-savanna mosaic’ in
Leach & Mearns Ed.,
Fan, Shenggen & Neetha Rao, 2003, ‘Public spending in developing countries: trends, determination, and impact’,
EPTD Discussion Paper no. 99, Environment and Production Technology Division. International Food Policy
Research Institute, Washington, DC
Fan, Shenggen, Joanna Brzeska & Ghada Shields, 2007, ‘Investment Priorities for Economic Growth and Poverty
Reduction’, 2020 Focus Brief on the World’s Poor and Hungry People. Washington, DC: IFPRI
Fan, Shenggen, Michael Johnson, Anuja Saurkar & Tsitsi Makombe, 2008, ‘Investing in African Agriculture to Halve
Poverty by 2015’, IFPRI Discussion Paper 00751, February 2008, Washington DC
Fan, Shenggen, Peter Hazell & Sukhadeo Thorat, 2000, ‘Government spending, growth and poverty in rural India’,
American Journal of Agricultural Economics, 82 (4), 1038–1051
FAO. 2002. The state of food insecurity in the world 2002. Rome: FAO.
FAO, 2006, The State of Food and Agriculture 2006: Food Aid for Food Security? Rome: Food & Agriculture
Organization
FAO, 2008, An Introduction to the Basic Concepts of Food Security, Food Security Information for Action Practical
Guide, Rome: FAO
FAO. 2010. The state of food insecurity in the world 2010. Rome: FAO
FAO, 2011, The State of Food and Agriculture, 2010–11: Women in Agriculture: Closing the Gender Gap for
Development; Rome, 2011 http://www.fao.org/docrep/013/i2050e/i2050e.pdf
FAO, 2012, The State of Food Insecurity in the World 2012: Economic growth is necessary but not sufficient to
accelerate reduction of hunger and malnutrition. http://www.fao.org/docrep/016/i3027e/i3027e.pdf

Smallholder agriculture’s contribution to better nutrition
46
Feed the Future, May 2012. By Empowering Women, Groundbreaking Nutrition Program in Bangladesh Significantly
Reduces Child Stunting. From The Field. http://feedthefuture.gov/article/empowering-women-groundbreaking-
nutrition-program-bangladesh-significantly-reduces-child
Gabre-Madhin, E.Z. and Haggblade, S., 2001, ‘Successes in African agriculture: results of an expert survey’, Markets
and Structural Studies Division Discussion Paper 53, Washington, DC: International Food Policy Research
Institute
Ghana Statistical Service (GSS) & Ghana Health Service (GHS). September 2009. Ghana: Demographic and Health
Survey 2008. Accra, Ghana; ICF Macro, Maryland USA.
http://www.measuredhs.com/pubs/pdf/FR221/FR221%5B13Aug2012%5D.pdf
Ghana Statistical Service, 1995. Ghana Living Standards Survey: Report on the Third Round (GLSS3) September 1991
- September 1992. http://siteresources.worldbank.org/INTLSMS/Resources/3358986-
1181743055198/3877319-1190221709991/G3report.pdf
Ghana Statistical Service, 2008. GHANA LIVING STANDARDS SURVEY: REPORT OF THE FIFTH ROUND (GLSS 5)
September 2005 – September 2006. http://www.statsghana.gov.gh/docfiles/glss5_report.pdf
Ghosal, Ratan, 2012. Growth, Poverty and Inequality Paradox in India: A Panel Data Approach. Paper Prepared for the
32nd General Conference of The International Association for Research in Income and Wealth Boston, USA,
August 5-11, 2012. http://www.iariw.org/papers/2012/GhosalPosterPaper.pdf
Gillespie, Stewart & John Mason, 1991, ‘Nutrition-Relevant Actions: Some Experiences from the Eighties and Lessons
for the Nineties’, ACC/SCN State-Of-The-Art Series. Nutrition Policy Discussion Paper NO. 10, October 1991
(http://www.unsystem.org/scn/archives/npp10/begin.htm#Contents )
Gillespie, Stuart, Jody Harris & Suneetha Kadiyala, 2012, ‘The Agriculture-Nutrition Disconnect in India. What Do We
Know?’, IFPRI Discussion Paper 01187 Poverty, Health, and Nutrition Division June 2012, Washington DC:
IFPRI
Goldman, Abe & Joyotee Smith, 1995. Agricultural transformations in India and Northern Nigeria: exploring the nature
of green revolutions. World Development, 23 (2), 243–63
Govereh, Jones & T.S. Jayne, 2003, Cash cropping and food crop productivity: synergies or trade-offs?, Agricultural
Economics, 28 (1) 39–50 DOI: 10.1111/j.1574-0862.2003.tb00133.x
Government of Kerala (GoK), 2006. Human Development Report 2005: Kerala. State Planning Board,
Thiruvananthapuram. http://planningcommission.nic.in/plans/stateplan/sdr_pdf/shdr_kerala05.pdf
Government of Kerala, 2006. Area, production and productivity trend of important crops in Kerala (from 1985-86 TO
2004-05). Department of Economics & Statistics. Thiruvananthapuram.
http://www.ecostat.kerala.gov.in/pdf/areappt.pdf
Government of Kerala, Feb 2008. Agricultural Statistics 2006 – 2007. Department of Economics & Statistics, Kerala.
http://www.ecostat.kerala.gov.in/pdf/agri0607.pdf
Government of Kerala. Feb 2009. Agricultural Statistics 2007 – 2008. Department of Economics & Statistics, Kerala.
http://www.ecostat.kerala.gov.in/pdf/agristat0708.pdf
Government office for Science, 2011. Foresight Project on Global Food and Farming Futures. UK
Grove, Alison, 1993, ‘Water use by the Chagga on Kilimanjaro’, African Affairs, 92, 431–448
Guyer, Jane I., 1992. Small change: individual farm work and collective life in a western Nigerian savanna town,
1969–88. Africa, 62 (4), 465–489
Haddad, Lawrence, Harold Alderman, Simon Appleton, Lina Song & Yisehac Yohannes, 2003, ‘Reducing Child
Malnutrition: How Far Does Income Growth Take Us?’ World Bank Economic Review, 17 (1), 107–131
Haugerud, Angelique. 1988. Food surplus production, wealth, and farmers' strategies in Kenya. In R. Cohen, ed.,
Satisfying Africa's food needs. Boulder, Colorado: Lynne Rienner.
Hausmann, Ricardo; Laura D Tyson; & Saadia Zahidi, 2012. The Global Gender Gap Report 2012. WEF
http://www3.weforum.org/docs/WEF_GenderGap_Report_2012.pdf
Hazell, P. B. R. & C. Ramasamy, 1991. The Green Revolution reconsidered: the impact of high-yielding rice varieties in
South India. IFPRI. The Johns Hopkins University Press, Baltimore & London.
http://www.ifpri.org/sites/default/files/publications/hazell91.pdf
Hazell, Peter B.R., 2002. Green Revolution: Curse or Blessing? IFPRI Brief. Washington D.C.
http://www.ifpri.org/sites/default/files/pubs/pubs/ib/ib11.pdf
Hazell, Peter B. R., 2009. Transforming Agriculture: The Green Revolution in Asia. Millions Fed: Proven Successes in
Agricultural Development. IFPRI. http://www.ifpri.org/book-5826/millionsfed/cases/greenrev
Heifer International (Accessed 2012), Zambia Project Receives InterAction Best Practice Award.
http://www.heifer.org/ourwork/success/best-practice
Helen Keller International, 2012. Addressing Vitamin A Deficiency.
http://www.hki.org/file/resource/Addressing_Vitamin_A_Deficiency.pdf
Helen Keller Worldwide. Sep 2003. HKI's homestead food production program sustainably improves livelihoods of
households in rural Bangladesh. Homestead Food Production Bulletin No. 1.
http://www.hki.org/research/HFP_BD_Bul_1_Dec2003.pdf
Heltberg, R. (2001) Commercialization and specialisation in Mozambican Agriculture, mimeo, Institute of Economics,
University of Copenhagen, 2 January.

Smallholder agriculture’s contribution to better nutrition
47
Henao, Julio, and Carlos Baanante. 2006. Agricultural Production and Soil Nutrient Mining in Africa: Implications for
Resource Conservation and Policy Development. Muscle Shoals, AL: International Center for Soil Fertility and
Agricultural Development.
Hoben, Allan, 1995, 'Paradigms and politics: the cultural construction of environmental policy in Ethiopia', World
Development, 23 (6), 1007–21
Hoddinott, John, Mark Rosegrant & Maximo Torero, 2012, ‘Investments to reduce hunger and undernutrition’,
Challenge Paper, Global Copenhagen Consensus, March 30, 2012, This version April 9, 2012, Washington DC:
International Food Policy Research Institute
HortCRSP, 2010. Project highlight: Sweetpotato Flour: A 'Golden' Opportunity for Ghana. Horticulture CRSP news
http://hortcrsp.ucdavis.edu/main/2010_November_Newsletter.pdf
HortCRSP, 2012. Concentrated Nutritional and Economic Enhancement of Ghanaian Diets Using Orange-Fleshed
Sweetpotato Products. http://hortcrsp.ucdavis.edu/main/3Sweetpotato.html
Horton, Susan; Meera Shekar; Christine McDonald; Ajay Mahal & Jana Krystene Brooks. 2009. Scaling Up Nutrition:
What Will It Cost? Directions in Development, Human Development, The World Bank.
http://siteresources.worldbank.org/HEALTHNUTRITIONANDPOPULATION/Resources/Peer-Reviewed-
Publications/ScalingUpNutrition.pdf
Ianotti, Lora; Kenda Cunningham & Marie Ruel, 2009. Improving Diet Quality and Micronutrient Nutrition: Homestead
Food Production in Bangladesh. IFPRI Discussion Paper 00928.
http://www.ifpri.org/sites/default/files/publications/ifpridp00928.pdf
International Assessment of Agricultural Science and Technology for Development, 2008, Island Press, Washington,
DC
IFAD, 2010. Rural Poverty Report 2011. New realities, new challenges: new opportunities for tomorrow’s generation.
Rome. http://www.ifad.org/rpr2011/report/e/rpr2011.pdf
IFPRI, 2005, The future of small farms: Proceedings of a research workshop. Washington, DC
International Institute for Population Sciences (IIPS), August 1995. National Family Health Survey (MCH and Family
Planning) India 1992-93 (NHFS-1). Bombay. Available online: http://hetv.org/india/nfhs/india1.html
International Institute for Population Sciences (IIPS), Sep 2007. National Family Health Survey (NFHS-3) 2005-06.
Ministry of Health and Family Welfare, Government of India. Mumbai.
http://www.measuredhs.com/pubs/pdf/FRIND3/00FrontMatter00.pdf
International Institute for Population Sciences (IIPS) & ORC Macro. 2000. National Family Health Survey (NFHS-2),
1998–99: India. Mumbai: IIPS. http://www.measuredhs.com/pubs/pdf/FRIND2/FRIND2.pdf
IRIN, 2011. BANGLADESH: Bio-fortification - finding nature’s power foods: Zinc-rich rice - coming soon to markets if
scientists have their way. Dhaka, 8 March 2011. http://www.irinnews.org/Report/92132/BANGLADESH-Bio-
fortification-finding-nature-s-power-foods
Jose, D & N. Shanmugaratnam, 1993. Traditional homegardens of Kerala: a sustainable human ecosystem.
Agroforestry Systems, 24, 203–213
Kannan, K.P. & K.S. Hari. March 2002. Kerala's Gulf Connection: Emigration, Remittances and their Macroeconomic
Impact 1972-2000. Working Paper No. 328. http://www.cds.edu/download_files/328.pdf
Kapil, U; P.R. Jayakumar; P. Singh; B. Aneja; and P. Pathak. 2002. Assessment of iodine deficiency in Kottayam
district, Kerala State: a pilot study. Asia Pacific Journal of Clinical Nutrition 2002; 11 (1): 33-5.
Keats, Sharada & Steve Wiggins, 2010, Non-staple foods & micro-nutrient status: effects of the 2007/08 food price
spike, Paper, London: Overseas Development Institute
Kennedy, Eileen T. & Bruce Cogill, 1987, ‘Income and nutritional effects of the commercialization of agriculture in
southwestern Kenya’, IFPRI Research Report No 63, 1987
Kennedy, Eileen, 1989, ‘The effects of sugarcane production on food security, health, and nutrition in Kenya: a
longitudinal analysis’, IFPRI Research Report No. 78
Kidala D; T Greiner & M Gebre-Medhin, 2000. Five-year follow-up of a food-based vitamin A intervention in Tanzania.
Public Health Nutrition 3(4):425-431
Kinabo, Joyce; Estelle Bader, Giulia Palma; Marie Claude Dop, 2008. Nutrition Country Profile: United Republic of
Tanzania. FAO. Nutrition and Consumer Protection Division.
Koning, Niek & Eric Smaling, 2005, ‘Environmental crisis or ‘lie of the land’? The debate on soil degradation in Africa’,
Land Use Policy, 22 (2005) 3–11.
Krueger, A.O., M. Schiff and A. Valdés (1991), The Political Economy of Agricultural Pricing Policy, Volume 1: Latin
America, Volume 2: Asia, and Volume 3: Africa and the Mediterranean, Baltimore: Johns Hopkins University
Press for the World Bank.
Leach, Melissa & Robin Mearns, Ed., 1996, The lie of the land. Challenging received wisdom on the African
environment, James Currey, Oxford & Heinemann, NH
Leavy, Jennnifer, 2007. Social Networks and Economic Life in Rural Zambia. PhD in Economics, University of Sussex.
Leturque, Henri & Steve Wiggins, 2011, Ghana’s sustained agricultural growth: Putting underused resources to work,
Report, London: Overseas Development Institute
Lipton, M. & Longhurst, R. 1989. New seeds and poor people. London, UK, Unwin Hyman.

Smallholder agriculture’s contribution to better nutrition
48
Low, 1986. Agricultural Development in Southern Africa: Farm-household Economics and the Food Crisis. London:
James Currey.Mason, John B., 2002, ‘How nutrition improves and what that implies for policy decisions’,
Background Paper, World Bank/UNICEF Nutrition Assessment, September 2002, 57–110
Macwan'gi, Mubiana & Bernard Phiri, 2008. Differentials in Under-Five Mortality in Zambia: Persistent Gaps in Child
Survival Interventions? Medical Journal of Zambia, Volumen 35, No. 4.
http://www.ajol.info/index.php/mjz/article/viewFile/56069/44524
Mahesh, R., 2000. Farm size - productivity relationship: some evidence from Kerala. KIED Working Paper 2.
http://maheshr.com/Publication/FARM%20SIZE%20-%20PRODUCTIVITY%28paper%29.pdf
Mason, John B., 2002, ‘How nutrition improves and what that implies for policy decisions’, Background Paper, World
Bank/UNICEF Nutrition Assessment, September 2002, 57–110
Masset, Edoardo, Lawrence Haddad, Alexander Cornelius & Jairo Isaza-Castro, 2012, ‘Effectiveness of agricultural
interventions that aim to improve nutritional status of children: systematic review’, BMJ 2012; 344:d8222 doi:
10.1136/bmj.d8222 (Published 17 January 2012)
Maxwell, Simon & Adrian Fernando, 1989, ‘Cash crops in developing countries: the issues, the facts, the policies’,
World Development, 17 (11), 1677–1708
Mazzucato, Valentina & David Niemeijer, 2001, ‘Overestimating land degradation, underestimating farmers in the
Sahel’, Issues Paper No. 101, Drylands Programme, International Institute for Environment and Development,
London
Meenakshi, J.V.; A. Banerji; Victor Manyong; Keith Tomlins; Nitya Mittal; & Priscilla Hamukwala. Jan 2012. Using a
discrete choice experiment to elicit the demand for a nutritious food: Willingness-to-pay for orange maize in
rural Zambia. Journal of Health Economics, Volume 31, Issue 1.
Mejía Acosta, Andrés & Jessica Fanzo, 2012, Fighting Maternal and Child Malnutrition: Analysing the political and
institutional determinants of delivering a national multisectoral response in six countries. A synthesis paper.
Comparative study prepared for DFID, Brighton, Sussex: Institute of Development Studies
Menon, Purnima; Anl Deolalikar, & Anjor Bhaskar, Feb 2009.India State Hunger Index: Comparisons of Hunger Across
States. IFPRI, Welthungerhilfe, UC Riverside. http://www.ifpri.org/sites/default/files/publications/ishi08.pdf
Ministry of Health and Family Welfare (MHFW), 2009. Family Welfare Statistics in India - 2009: SECTION – A:
POPULATION & VITAL STATISTICS. Government of India http://nrhm-
mis.nic.in/UI/FamilyWelfare2009/03%20Section-A/03%20Sec-A-16-%281-70%29.pdf
Minten, Bart, Lalaina Randrianarison & Johan F.M. Swinnen. 2011, ‘Global Retail Chains and Poor Farmers: Evidence
from Madagascar’, World Development, 37 (11), 1728–41
Mitra, S.N.; M. Nawab Ali; Shahidul Islam; Anne R. Cross & Tulshi Saha. Dec 1994. , Bangladesh Demographic and
Health Survey 1993-1994. DHS (Demographic and Health Surveys) & Macro International Inc (MII).
http://www.measuredhs.com/pubs/pdf/FR60/FR60.pdf
Mohan, Soumya, 2004. An assessment of the ecologial and socioeconomic benefits provided by homegardens: A case
study of Kerala, India. A dissertation presented to the graduate school of the university of Floriday in partial
fulfillment of the requirements for the degree of doctor of philosophy. University of Florida.
http://etd.fcla.edu/UF/UFE0007640/mohan_s.pdf
Moore, Henrietta & Megan Vaughan, 1987. Cutting down trees: women, nutrition and agricultural change in the
Northern Province of Zambia, 1920–1986’, African Affairs, 86 (345), 523–540
Mosher, A.T. 1966. Getting Agriculture Moving: Essentials for Development and Modernization. New York: Praeger.
Muhimbula, Happiness S. & Abdulsudi Issa-Zacharia., Nov 2010. Persistent child malnutrition in Tanzania: Risks
associated with traditional complementary foods (A review). African Journal of Food Science Vol. 4 (11), pp
679-692. http://www.academicjournals.org/ajfs/pdf/pdf2010/Nov/Muhimbula%20and%20%20Issa-
Zacharia.pdf
Muiruri, Juliana, Philip Hulcome, Britta Schumacher, Monira Parveen, Farzana Bilkes & Syeda Sajia Mehjabeen, March
2012. WFP Bangladesh Nutrition Strategy 2012-2016. World Food Programme (WFP)
http://www.wfp.org/sites/default/files/Nutrition%20Strategy_Final_high%20res_5.pdf
Mulokozi, G.; L. Mselle; C. Mgoba; J.K.L. Mugyabuso, & G.D. Ndossi. March 2000. Improved Solar Drying of Vitamin A-
rich Foods by Women’s Groups in the Singida District of Tanzania Research Report Series 5.
http://www.icrw.org/files/publications/Improved-Solar-Drying-of-Vitamin-A-rich-Foods-by-Womens-Groups-in-
the-Singida-District-of-Tanzania.pdf
Nagayets, O. (2005). Small farms: Current status and key trends. In The future of small farms: Proceedings of a
research workshop, Wye, UK, June 26–29, 2005. Washington, DC: International Food Policy Research Institute.
http://www.ifpri.org/events/seminars/2005/smallfarms/sfproc.asp.
National Bureau of Statistics (NBS) & ORC Macro, 2005. Tanzania Demographic and Health Survey 2004-05.
http://www.measuredhs.com/pubs/pdf/FR173/FR173-TZ04-05.pdf
National Bureau of Statistics (NBS) Tanzania, Nov 2008. Tanzania HIV/AIDS and Malaria Indicator Survey 2007-08.
Tanzania Commission for AIDS (TACAIDS), Zanzibar AIDS Commission (ZAC), National Bureau of Statistics
(NBS), Office of Chief Government Statistician (OCGS), & Macro International inc.
http://www.tacaids.go.tz/dmdocuments/THMIS%202007-08.pdf

Smallholder agriculture’s contribution to better nutrition
49
National Bureau of Statistics (NBS) & ORC Macro, April 2011. Tanzania Demographic and Health Survey 2010.
http://www.measuredhs.com/pubs/pdf/FR243/FR243%5B24June2011%5D.pdf
National Sample Survey Organisation (NSSO), July 1999. Drinking water, sanitation and hygiene in India. NSS 54th
Round (January - June 1998). Report no. 449. Department of Statistics. Government of India.
National Sample Survey Organisation (NSSO), Sep 1997. Reported adequacy of food intake in India: 1993-94: Fifth
quinquennial survey of Consumer expenditure NSS 50th Round. July 1993 - June 1994. Government of India,
Department of Statistics. New Delhi
National Sample Survey Organisation (NSSO), 2007. Nutritional Intake in India 2004-2005: NSS 61st Round July 2004
- June 2005. Report No. 513(61/1.0/6). Government of India.
National Sample Survey Organisation (NSSO), Feb 2007.Perceived Adequacy of Food Consumption in Indian
Households 2004-2005. NSS 61st Round, July 2004 - June 2005. Ministry of Statistics & Programme
Implementation. Government of India. New Delhi
Nti, Christina A. 2011. Dietary Diversity is Associated with Nutrient Intakes and Nutritional Status of Children in
Ghana. Asian Journal of Medical Sciences 2: 105-109.
Nti, Christina A.; Joana Hagan; Florence Bagina & Mabel Seglah. June 2011. Knowledge of nutrition and health benefits
and frequency of consumption of fruits and vegetables among Ghanaian homemakers. African Journal of Food
Science Vol. 5(6), pp. 333 - 339.
http://www.academicjournals.org/AJFS/fulltext/2011/June/Nti%20et%20al.htm
Otsuka, Keijiro & Takashi Yamano, 2006, ‘Introduction to the special issue on the role of the nonfarm income in
poverty reduction: evidence from Asia and East Africa’, Agricultural Economics, 35, 393–397
Oyugi, L A, A W Mukhebi & W M Mwangi, 1987. The impact of cash cropping on food production: a case study of
tobacco and maize in Migori Division, South Nyanza District of Kenya. East Africa Economic Review, 1987, 3
(1), 43–50
Paolisso, Michael J; Kelly Hallman; Lawrence Haddad & Shibesh Regmi. 2001. Does cash crop adoption detract from
childcare provision? Evidence from rural Nepal. Washington DC, International Food Policy Research Institute
Pelletier, D. L. 2002. Toward a common understanding of malnutrition. Assessing the contribution of the UNICEF
framework’. Background Paper. World Bank/UNICEF Nutrition Assessment, September 2002, 2-24.
Peyre, A; A. Guidal; K.F. Wiersum; & F. Bongers, 2006. Dynamics of Homegarden Structure and Function in Kerala,
India. Agroforestry Systems, 66: 101–115
Piron, Laure-Hélène, 2003, Chronic Poverty and Human Rights: Background Paper, Overseas Development Institute
Pixley, Kevin & Bonnie McClafferty,2006. Biofortified Maize. CIMMYT & IFPRI.
http://www.dfid.gov.uk/r4d/PDF/Outputs/Misc_Crop/maize.pdf
Planning Commission of India (PCI), 2008. Kerala: Development Report. Government of India, New Delhi.
Preibisch, Kerry, Gladys Rivera H. & Steve Wiggins, 2002. Defending food security in a free-market economy: The
gendered dimensions of restructuring in rural Mexico. Human Organization, 61 (1), 68–79
Pushkaran, K., 2001. Home gardens in Kerala as an efficient agroecosystem for conservation and sustainable
management of biodiversity, in Watson, J.W. and P.B. Eyzaguirre, eds. Proceedings of the Second International
Home Gardens Workshop, 17–19 July 2001, Witzenhausen, Federal Republic of Germany: Home gardens and in
situ conservation of plant genetic resources in farming systems. IPGRI
REACH, August 2008. Acting at Scale: Implementation Case Studies: Local Homestead Food Production.
http://www.reachpartnership.org/c/document_library/get_file?uuid=fe62519f-7f7d-416a-8a50-
eb76dbd43b82&groupId=94591
Reaching Agents of Change, May 2012. Why Invest in Orange-fleshed Sweetpotato in Tanzania?
http://sweetpotatoknowledge.org/sweetpotato-introduction/ofsp-advocacy-toolkit/flyer-1d-why-invest-in-ofsp-
in-tanzania.pdf
Reij, C.P. & E.M.A. Smaling, 2008, ‘Analyzing successes in agriculture and land management in Sub-Saharan Africa: Is
macro-level gloom obscuring positive micro-level change?’, Land Use Policy 25 (2008) 410–420
Roberfroid, Dominique, Catherine Lucet, Thabani Dube, Simbarashe Dennis Zimunya & France Vrijens, 2011, Impact of
Low Input Gardens on the wellbeing of People Living with HIV in Chipinge District, Zimbabwe. Final ACF
program evaluation, Final Research Report, ACF Scientific and Technical Direction
Rodrik, Dani, 2003, In Search of Prosperity, Princeton University Press
Roos, N; S. Thilsted & MD.M. Islam, 2002. Small Indigenous Fish Species in Aquaculture in Bangladesh: Contribution
to Vitamin A, Calcium, and Iron intakes. In Roos, Nanna; Howarth E Bouis & Nazmul Hassan, Eds.,
ALLEVIATING MALNUTRITION THROUGH AGRICULTURE IN BANGLADESH: BIOFORTIFICATION AND
DIVERSIFICATION AS SUSTAINABLE SOLUTIONS. Gazipur & Dhaka, April 22-24. IFPRI
http://www.ifpri.org/sites/default/files/publications/alleviatingmal.pdf
Rosegrant, Mark, Claudia Ringler, Siwa Msangi, Tingju Zhu, Timothy Sulser, Rowena Valmonte-Santos, Stanley Wood,
2007, ‘Agriculture and food security in Asia: the role of agricultural research and knowledge in a changing
environment’, SAT eJournal, ejournal.icrisat.org, December 2007, 4 (1)
Rozel Farnworth, Cathy; Vincent M Akamandisa & Munguzwe Hichaambwa, Jan 2011. Zambia feed the Future Gender
Assessment. USAID.

Smallholder agriculture’s contribution to better nutrition
50
Sahoo, Harihar, June - 2011. Fertility behaviour among adolescents in India. Journal of Family Welfare. Vol. 57, No.1.
pp 22-33 http://medind.nic.in/jah/t11/i1/jaht11i1p22.pdf
Salam, Abdul M.; N. Mohanakumaran, & K Sathees Babu, 1995. Home garden agriculture in Kerala revisited. United
Nations University, FAO. http://archive.unu.edu/unupress/food/8F163e/8F163E07.htm
Sánchez, Pedro A., 2002, ‘Soil Fertility and Hunger in Africa’, Science, Vol. 295, 2019–20, 15 March 2002
www.sciencemag.org
Sanchez-Montero, Manuel; Nuria Salse Ubach & Morwenna Sullivan, 2010. Zero Hunger: Phase 1. Undernutrition:
What works? A review of policy and practice. ACF Action Against Hunger.
Schmidhuber, Josef & Jelle Bruinsma, 2011. Investing towards a world free of hunger; lowering vulnerability and
enhancing resilience. in eds Prakash, Adam; Safeguarding Food Security in Volatile Global Markets. FAO, Rome.
http://www.fao.org/docrep/013/i2107e/i2107e27.pdf
Sen, A. K. 1981. Poverty and famines. An essay on entitlement and deprivation. Oxford: Clarendon Press.
Sen, Amartya. 1990. More than 100 Million Women Are Missing. The New York Review of Books. Volume 37, Number
20 · December 20, 1990. http://ucatlas.ucsc.edu/gender/sen100m.html
Sen, Amartya. 1991. The Kerala Difference: Reply to Chasin & Franke, Oct 24, 1991. The New York Review of Books.
http://www.nybooks.com/articles/archives/1991/oct/24/the-kerala-difference/?pagination=false
Sharp, K., Ludi, E. and Samuel G., (2007). Commercialization of Farming in Ethiopia: Which Pathways? Ethiopian
Journal of Economics, Volume XVI, No1, April 2007. Paper presented at the Fifth International Conference on
the Ethiopian Economy, Addis Ababa, June 7-9, 2007.
Siamusantu, Ward S.; Estelle Bader; Giulia Palma; Maylis Razès; and Marie Claude Dop, 2009. Zambia Nutrition
Profile, FAO. ftp://ftp.fao.org/ag/agn/nutrition/ncp/zmb.pdf
Smith, Lisa C. & Lawrence Haddad, 2002, ‘How potent is economic growth in reducing undernutrition? What are the
pathways of impact? New cross-country evidence’, Economic Development & Cultural Change, 51 (1), 55–
76
Smith, Lisa C. & Lawrence James Haddad, 2000. Explaining Child Malnutrition in Developing Countries: A Cross-
Country Analysis. IFPRI Research Report 111
Smith, Lisa C., Faheem Kahn, Timothy R. Frankenberger & Abdul Wadud, 2011, ‘Admissible Evidence in the Court of
Development Evaluation? The Impact of CARE’s SHOUHARDO Project on Child Stunting in Bangladesh’, IDS
Working Paper 2011 (376), October 2011, Brighton: Institute of Development Studies
SUN, 2010, Scaling Up Nutrition. A Framework For Action
Taylor, Linnet. Feb 2012. The nutrition agenda in Bangladesh: ‘Too massive to handle’: Analysing Nutrition
Governance: Bangladesh Country Report. Institute of Development Studies.
http://www.ids.ac.uk/files/dmfile/DFID_ANG_Bangladesh_Report_Final.pdf
Templeton, S., Scherr, S.J., 1999. Effects of demographic and related microeconomic change on land quality in hills
and mountains of developing countries. World Development 27 (6), 903–918.
The Ghanaian Journal, 2009. Iodine Deficiency Disorders (IDD) incidence drop in Jirapa, Bongo. May 27, 2009, Local
News, Science. http://www.theghanaianjournal.com/2009/05/27/iodine-deficiency-disorders-idd-incidence-
drop-in-jirapa-bongo/
Tiffen, M. (ed), 1992. Environmental change and dryland management in Machakos District, Kenya, 1930–1990:
institutional profile. Overseas Development Institute (ODI) Working Paper 62. ODI, London, UK.
Tiffen, Mary & Michael Mortimore, 1994. Malthus Controverted: The Role of Capital and Technology in Growth and
Environment Recovery in Kenya. World Development, 22 (7), 997–1010
Tiffen, Mary, Michael Mortimore and Francis Gichuki, 1994, More people, less erosion: environmental recovery in
Kenya, John Wiley, Chichester
Timmer, Peter, 2008. Causes of High Food Prices, in ADB, 2008: Asian Development Outlook 2008: Update. Asian
Development Bank, Manila. 75–93. http://www.adb.org/sites/default/files/pub/2008/ado2008-update.pdf
Tonderayi Brian Makumire, 2012, Livelihoods for Improved Nutrition in Chipinge District, Zimbabwe, External
Evaluation, December 2011
Tripathi, Ruchi; Youjin B. Chung; Karl Deering; Nadia Saracini; Robin Willoughby; Olivia Wills; Monique Mikhail; Hilary
Warburton; Daphne Jayasinghe; Jenny Rafanomezana & Marina Churm. 2012. What Works for Women: Proven
approaches for empowering women smallholders and achieving food security. UK Hunger Alliance.
Tschirley, David L. & T.S. Jayne. 2009. Exploring the Logic Behind Southern Africa's Food Crises. World Development
Vol 38, No. 1 pp. 76-87, 2010.
Udry, Christopher, John Hoddinott, Harold Alderman & Lawrence Haddad, 1995, ‘Gender differentials in farm
productivity: implications for household efficiency and agricultural policy’, Food Policy, 20 (5), 407-23
UN SCN, 2004, 5th Report on the World Nutrition Situation. Nutrition for Improved Development Outcomes,
March 2004, United Nations System, Standing Committee on Nutrition (SCN).
UNDP, 2011. Human Development Report 2011. http://hdr.undp.org/en/reports/global/hdr2011/
UNESCO, 2006, Water: a shared responsibility. The United Nations World Water Development Report 2,
UNESCO, Paris
UNICEF, May 2011. The Situation of Children in India: A Profile. Unicef New Delhli.
http://www.unicef.org/sitan/files/SitAn_India_May_2011.pdf

Smallholder agriculture’s contribution to better nutrition
51
UNICEF, 2012, The State of the World’s Children 2012, New York: UNICEF.
UNICEF,2012. Bangladesh: Statistics. Accessed 2012.
http://www.unicef.org/infobycountry/bangladesh_bangladesh_statistics.html
UNICEF, 2012. Statistics — At a glance: Ghana. Accessed 2012.
http://www.unicef.org/infobycountry/ghana_statistics.html#90
UNICEF, 2012. Tanzania, United Republic of: Statistics.
http://www.unicef.org/infobycountry/tanzania_statistics.html#0
UNICEF, 2012. Zambia: Statistics. http://www.unicef.org/infobycountry/zambia_statistics.html#90
United Nations & Asian Development Bank (UN & ADB), 2012, Green Growth, Resources and Resilience. Environmental
Sustainability in Asia and the Pacific, Bangkok & Manila
USAID, PMI (President's Malaria Intiative), Oct 2009. Malaria Control in Mainland Tanzania. USAID, CDC, etc.
http://www.rti.org/files/irs_country_brief_Tanzania.pdf
von Braun, Joachim, (1995) Agricultural Commercialization: impacts on income, nutrition and implications for policy.
Food Policy 20(3): 87–202.
von Braun, Joachim, David Hotchkiss & Maartin Immink, 1989. Nontraditional Export Crops in Guatemala: Effects on
Production, Income and Nutrition Washington, D.C.: International Food Policy Research Institute
Wiggins, S., 2000, ‘Interpreting changes from the 1970s to the 1990s in African agriculture through village studies’,
World Development, 28 No 4: 631–62
Wiggins, Steve & Henri Leturque, 2011. Ghana’s sustained agricultural growth: Putting underused resources to work.
ODI.http://www.developmentprogress.org/sites/developmentprogress.org/files/resource_report/ghana_report-
full.pdf
Wikipedia, Accessed Oct 2012. Economy of Kerala. http://en.wikipedia.org/wiki/Economy_of_Kerala
World Bank, 2007, From Agriculture to Nutrition: Pathways, Synergies and Outcomes, Agricultural & Rural
Development Department, Washington DC: World Bank — with International Food Policy Research Institute
World Bank, 2007. World Development Report 2008: Agriculture for Development. World Bank, Washingtone
World Food Programme (WFP), 2007. Ghana: Home-Grown School Feeding field case study 2007.
http://documents.wfp.org/stellent/groups/public/documents/newsroom/wfp207421.pdf
World Health Organisation (WHO), 2008. Worldwide prevalence of anaemia 1993–2005. WHO Global Database. Eds.
de Benoist, Bruno; Erin McLean, Ines Egli and Mary Cogswell.
http://whqlibdoc.who.int/publications/2008/9789241596657_eng.pdf
World Vision, 2006. Improving nutrition of women and children: the MICAH program: Final Program Report: 2006.
http://www.worldvision.ca/About-Us/Newsroom/press-
releases/Africa/Documents/MICAH%20Final%20Program%20Report.pdf
World Vision, 2009. Nutrition & Health. http://www.worldvision.ca/Programs-and-Projects/International-
Programs/Documents/Nutrition_and_Health_web_v3_ICP-1230.pdf
World Vision, September 2011. The Best Start: Saving Children's Lives in Their First Thousand Days.
Yang, Hong & Mercedes de Onis, 2008. Algorithms for converting estimates of child malnutrition based on the NCHS
reference into estimates based on the WHO Child Growth Standards. BMC Pediatrics, 8:19.
http://www.biomedcentral.com/1471-2431/8/19
Yusuf, Harun K.M.; A.K.M. Mustafizur Rahman; Fatima Parveen Chowdhury; M. Mohiduzzaman; Cadi Parvin Banu; M
Arif Sattar; & M Nurul Islam. 2008. Iodine deficiency disorders in Bangladesh, 2004-05: ten years of iodized
salt intervention brings remarkable achievement in lowering goitre and iodine deficiency among children and
women. Asia Pacific Journal of Clinical Nutrition 17 (4): 620-628
http://211.76.170.15/server/APJCN/Volume17/vol17.4/Finished/13_1248_Yusuf_620-628.pdf

Smallholder agriculture’s contribution to better nutrition
52
Annex A. Ghana: Star agricultural performance, on track to meeting MDG1 – but disappointing progress in stunting of pre-school age children
Observed changes in nutrition
Underweight and Stunting
The prevalence of underweight children under-five fell from 25% in 1994 to 14% in 2008,
while stunting fell from 33.5% in 1994 to 29% in 2008, see Figure A.1. In both cases, Ghana
has moved from high to medium severity, by the WHO classification. Undernutrition is worse
among rural than urban children.
Figure A.1 Stunting and underweight in pre-school age children in Ghana, 1988-2008
Source: With data from WHO Global Database on Child Growth and Malnutrition. Note: Sub-national figures from 1988 and all figures
from 1994 are for under-3s only
Micronutrient deficiencies
Micronutrition problems also prevail, though survey data available on micronutrition are
sparse. In 2003, 70% of under-fives, and about 65% of pregnant women were at least
moderately anaemic15. While levels of dietary iron technically available in Ghana nationally as
reported by FAO appear good compared to other countries, and have been improving, the
problem of iron-deficiency anaemia remains severe in vulnerable populations. Analysts
attribute high levels of anaemia in Ghana to poor bio-availability of iron in diets owing to low
consumption of iron-absorption enhancing foods such as meat and vitamin-C rich foods, as
well as malaria16 and parasitic diseases such as hookworm (Agble, 2009).
15 This is from a 2003 survey. Moderate anaemia means having haemoglobin levels in blood below 110g/L. WHO classifies anaemia prevalence of 40% and over an issue of severe public health significance (WHO, 2008). 16 Malaria is hyper-endemic in Ghana, a leading cause of morbidity and mortality, especially among pregnant women and preschoolers [Estimates suggest malaria accounts for 22% of under-five mortality and 9% of maternal deaths (GSS & GHS 2009)]
5
10
15
20
25
30
35
40
45
19
88
19
90
19
92
19
94
19
96
19
98
20
00
20
02
20
04
20
06
20
08
Pe
rce
nt
of
un
de
r-fi
ves
Stunting
Moderate & Severe NationalModerate & Severe UrbanModerate & Severe Rural
5
10
15
20
25
30
35
40
45
19
88
19
90
19
92
19
94
19
96
19
98
20
00
20
02
20
04
20
06
20
08
Pe
rce
nt
of
un
de
r-fi
ves
Underweight
Moderate & Severe NationalModerate & Severe UrbanModerate & Severe Rural

Smallholder agriculture’s contribution to better nutrition
53
Vitamin-A deficiency is also a public health issue in Ghana, where diets provide inadequate
levels of vitamin A-rich foods. While statistics on vitamin A deficiency for preschoolers in
Ghana are inadequate, evidence suggests young children do not eat enough vitamin A rich
foods: See Figure A.2
Figure A.2 Complementary feeding of under-threes in Ghana, comparing 2003 and 2008: focus on vitamin A and selected animal products
Source: Constructed with data in Table 15 of Agble et al., 2009 & Table 11.5 in GSS & GHS 2009. Note: Meat, fish, and eggs, includes
poultry. Vitamin-A rich foods includes fruits and vegetables such as pumpkin, red or yellow yams or squash, carrots, red sweet potatoes, dark green leafy vegetables, mangoes, papayas, and other locally grown fruits and vegetables rich in vitamin A.
Iodine deficiency is a problem in Ghana, where people’s iodine levels are reportedly
influenced by poor iodine availability in the soil, by some compounds in certain cassava
varieties that aggravate iodine deficiency, and the fact that seafood rich in iodine, while in
relatively good supply in coastal Ghana, is less available further inland (The Ghanaian Journal,
2009).
Data, as for other micronutrients, are poor: only available for some sub-national populations of
school age children and women for the mid-1990s. While there is evidence that micro-nutrient
deficiencies have eased,17 in some districts from a severe to a mild public health issue18,
surveys are needed to determine extent and guide intervention.
Growth of economy
Economic growth has been good in Ghana since 1990. Real (2000) GDP per capita grew from
around US$221 in 1990 to US$402 in 2011, an 82% rise: enough for Ghana to move from low
income (LIC) to lower middle income country (LMIC) status.
Agriculture
Agricultural growth
Net production indices for Ghanaian cereals, crops and livestock show consistent growth from
1990 to 2010, overall at almost 5% a year. On a per-capita basis too they have been growing,
at an equivalent of 2.3% a year; except for livestock which fell slightly from 1990 to about
17 For instance, a recent study of two districts which had extremely severe rates of goitre in the 1994 survey shows there has been considerable improvement. One district in the Upper West Region saw total goitre rates (TGR) fall from 56% to 11%, and in another district in the Upper East Region rates fell from 57% to 18% between 1994 and 2007 (The Ghanaian Journal, 2009) 18 WHO classifies TGR as public health problems as follows: <5 = no public health problem; 5-19.9 = mild; 20 - 29.9 = moderate; >30% = severe
27.8
43.9
31.3 31.3
58.3
79.8
50.2 50.2
67.7
88.5
59.2 57.9
20
30
40
50
60
70
80
90
2003 2008 2003 2008
Meat/fish/eggs Fruit and vegetables rich in vitamin A
Pe
rce
nt
of
child
ren
eat
ing
in t
he
24
h
ou
rs b
efo
re t
he
su
rve
y
6 to 11 months, breastfeeding
12 to 23 months, breastfeeding
24 to 35 months, breastfeeding & non-breastfeeding

Smallholder agriculture’s contribution to better nutrition
54
2007 before it started to pick up again. Cereals growth also stuttered from around 2002 to
2007, before shooting up rapidly over the next 3 years. See Figure A.3
Figure A.3 Agricultural net production indices and growth rates for Ghana, 1990-2010
Source: with data from FAOSTAT. Note: Numbers in the legend are the average annual growth rates of the series depicted from 1990 – 2010.
Food availability — and its price
Overall calorie supply grew from around 2000 kilocalories per person a day to close to 3000
kilocalories per person a day from 1990 to 2009 (FAOSTAT data). Undernourishment has been
reduced dramatically, estimated by FAO at under 5% of the population by 2009, compared to
25 to 40%19 in the early 1990s.
Both staple20 and non-staple21 supply has grown, with the share of available food from fruits
and vegetables, oils and animal products rising from one quarter to one third. On average
therefore, diversity of diets ought to be improving as supply of all foodstuffs has grown faster
than population, see Figure A.4.
19 Recent revisions of FAO data put 1990 figures at 40% undernourishment, reportedly largely owing to larger estimates for food waste. By 1991 their estimates dropped to 30% and by 1992 to 25%. 20 While in the early 1990s about 1500 available average daily kilocalories came from cereals and starchy roots, by 2009, almost 2000 kcal/person/day was supplied from these sources. 21 Non-staples, which supplied only a little over 500 kcal/capita/day in the early 1990s were supplying double the amount by 2009.
50
100
150
200
250
19
90
19
91
19
92
19
93
19
94
19
95
19
96
19
97
19
98
19
99
20
00
20
01
20
02
20
03
20
04
20
05
20
06
20
07
20
08
20
09
20
10
Ind
ex:
19
90
- 1
99
2 =
10
0
Agriculture: 4.75
Cereals: 3.47
Crops: 5.01
Livestock: 2.20
Agriculture per capita: 2.28
Cereals per capita: 1.00
Crops per capita: 2.54
Livestock per capita: -0.27

Smallholder agriculture’s contribution to better nutrition
55
Figure A.4 Stacked supply of different foodstuffs in kilocalories per person per day in Ghana, 1990–2009
Source: With data from FAOSTAT. Note: On average, people’s energy requirement is around 1800kcal/day. The jump from 1990 to 1991 looks implausible, and could arise from some adjustment of how the data is calculated.
Though trends in real consumer prices for staple cereals have been relatively flat over the
period in question (they fell over a longer period – see for instance Wiggins & Leturque, 2011),
even increasing slightly in recent years. Prices for staple root crops like cassava have fallen
slightly. In addition, the food portion of the Consumer Price Index has fallen in real terms.
At the same time, there has been good news for farmers reportedly achieving higher prices for
many crops from cash crops like cocoa, to staples like maize and cassava, as well as
complementary vegetables like tomatoes and eggplants which women farmers often grow and
sell (FAOSTAT data).
Poverty
Overall poverty
Poverty rates at the national poverty line fell from 52% of the population in 1992 to 29% of
the population in 2006 (World Bank WDI).
Rural poverty
Rural poverty prevalence fell from 64% in 1992 to 39% in 2006 (World Bank WDI). Absolute
numbers of poor fell in rural areas by 1.7million, while absolute numbers of urban poor fell by
almost half a million, despite a boom in urban population of almost 80%, see Figure A.5.
0
500
1000
1500
2000
2500
3000
19
90
19
91
19
92
19
93
19
94
19
95
19
96
19
97
19
98
19
99
20
00
20
01
20
02
20
03
20
04
20
05
20
06
20
07
20
08
20
09
kcal
/ c
apit
a /
day
Other animal products
Meat
Fish & Seafood
Other vegetable products
Sugar & Sweeteners
Pulses
Oilcrops and Vegetable Oils
Fruits and Vegetables
Starchy Roots
Cereals

Smallholder agriculture’s contribution to better nutrition
56
Figure A.5 Absolute numbers of poor in Ghana compared to population, rural and urban: 1992–2006
Source: With data from World Bank WDI for poverty and FAOSTAT for population figures
Wealth is strongly
linked to
malnutrition of
children, with the
richest quintile
seeing far lower
levels of both
stunting and
underweight in their
preschoolers than
the poorest quintile:
See Figure A.6
Figure A.6 Stunting and underweight of preschoolers in Ghana in 2008 by wealth quintile
Source: With data from Table 11.1 in GSS & GHS 2009.
Health
Under-fives mortality rate
The mortality rate of under-fives fell from 121 deaths per 1,000 live births in 1990 to 78
deaths per 1,000 live births in 2011. While this level is below the low-income country average,
it is about 30 more than the world average.
Water & sanitation
Just over half the population had access to an improved water source in 1990, but by 2010 the
proportion had risen to 86%22. The biggest improvements were seen in rural areas, where in
1990 only 36% of the population had access to an improved water source. This had risen to
80% by 2010 (World Bank WDI).
22 This is close to the levels of access in lower middle income countries, and much higher than levels in low income
countries.
9.72 10.53
11.42
5.94
7.76
10.76
6.18 5.22
4.47
1.64 1.50 1.16 0
2
4
6
8
10
12
1992 1998 2006
Mill
ion
s o
f p
eo
ple
Rural population
Urban population
Rural poor
Urban poor
35.1 34.1
28.3
21.4
14.4
19.2 17.4
12.5
8.4 8.6
0
5
10
15
20
25
30
35
40
Lowest Second Middle Fourth Highest
Wealth quintile
% o
f u
nd
er-
five
s
Stunting
Underweight

Smallholder agriculture’s contribution to better nutrition
57
In contrast, progress in increasing access to improved sanitation has been discouraging. World
Bank estimates 7% of the population had access to improved sanitation in 1990 and only 14%
had access to improved sanitation by 2010—under half the levels of access seen in low income
countries on average.
Female empowerment
Female schooling
Literacy rates for young (15 to 24 years) females went from 65% in 2000 to 80% in 2009
(World Bank WDI data).
The female net enrolment in primary school for 2007-2010 was 77%. Secondary school female
net enrolment over the same period was 44% (UNICEF, 2012).
Schooling matters for the nutrition of future generations. In Ghana about 30% of under-fives
of mothers with no or only primary education are stunted, compared with about 18% of those
whose mothers have a complete secondary education or more. Underweight rates varied
similarly with education of mothers – from 17% of children of uneducated mothers
underweight, to only 7% of children with mothers with at least secondary education being
underweight (Data from GSS & GHS 2009).
Teenage pregnancy rate
Adolescent fertility fell from 90 births per 1000 girls aged 15 to 19 in 1997, to 66 births per
1000 girls aged 15 to 19 in 2010. Ghana’s trend on this indicator has followed a similar
trajectory as that of lower middle income countries; well below the average level for low
income countries.
Specific nutrition interventions
National nutrition interventions such as programmes for salt iodisation or vitamin A
supplementation have helped improve micronutrient availability, but in general coverage is still
not high (Agble, 2009). Furthermore, degree of implementation of various national nutrition
programmes—for instance deworming of school age children or programmes to improve infant
and young child feeding—are not well documented.
Agricultural interventions for nutrition
Agricultural interventions for nutrition can fall into three broad categories: Firstly, nutrition-
sensitive gender empowerment; secondly, home gardens, small livestock, and aquaculture;
and thirdly, bio-fortification of staple crops. Often the boundaries between the first two
categories overlap on a programme level. Furthermore, agricultural interventions are
frequently combined with non-agricultural initiatives, or included as part of larger programmes.
Some examples from Ghana of these types of programmes for which evidence on nutrition-
related outcomes can be found are set out below.
World Vision’s CIDA-funded programmes Micronutrient and Health (MICAH) and Expanding
Nutrition and Health Achievements through Necessary Commodities and Education
(ENHANCE), both of which have been active in Ghana, involve a package of interventions of
which agriculture is only a part.
MICAH began in 1996, and was predominantly a health and nutrition programme, involving
supplementation, fortification, promoting best practices in breastfeeding and infant feeding,
immunization campaigns, malaria control, treatment of worms and parasites, and improving
water and sanitation.
On the agriculture side it also involved promoting small animal rearing, vegetable gardens and
fruit trees, as well as providing education, information, and local capacity building. Though
evauation of various components is not available, in Ghana, MICAH is credited with helping to

Smallholder agriculture’s contribution to better nutrition
58
spread acceptance of exclusive breastfeeding for six months, improving immunization
coverage, and is also reported to have contributed to significant reduction in anaemia among
children, women of reproductive age, and pregnant women (World Vision, 2009)
It was followed by ENHANCE, also health-focussed23, but involving some training on home
gardens. This programme was shown to have resulted in Ghanaian children aged 12 to 23
months in target communities seeing a 10% increase in animal-source food consumption, and
a 33% increase in vitamin A intake (World Vision, Sep 2011).
Bio-fortification
Varieties of orange-fleshed sweet potato (OFSP), a good source of beta-carotene, were
introduced to Ghana in 2005. The extent to which they are grown and consumed nationally is
unknown, though white sweet potatoes have a relatively long history of cultivation in Ghana.
OFSP are a good candidate for promotion through home garden schemes.
Initial studies found positive responses in terms of people’s consumption, and are currently
being followed with programmes such as a USAID / HortCRSP project looking at how to
incorporate sweet potatoes into more diverse food preparations – to improve economic welfare
for farmers, processors, and others in the supply chain, as well as so boost OFSP consumption
(HortCRSP 2010, 2012). Evaluations are not yet available.
Maize is another contender for bio-fortification in Ghana. Ghana is one of the initial target
countries for dissemination of HarvestPlus maize24 biofortified with Vitamin A (Pixley &
Mcclafferty, 2006). Studies have shown that while people's preferences for maize are highly
varied within regions, people are willing to pay for bio-fortified maize in Ghana, and willing to
change preferences given clear information (De Groote et al., 2010). The need for public
campaigns through channels such as rural radio have been discussed (ibid).
In 2005, potential new maize sources for high iron and zinc were identified by CIMMYT (Pixley
& McClafferty, 2006) though varieties are not available yet in Ghana.
High quality protein maize is another type of bio-fortified food that has been developed and
transferred to Ghana, where the varieties are drought tolerant as well as resistant to Striga, a
parasitic weed (Atser, 2010). It is possible that this combination of physical hardiness and
nutritional character could aid adoption.
While opportunities for bio-fortification in Ghana appear strong, not enough is known about the
extent to which biofortified crops are being taken up by farmers; the suspicion is that as yet
none of these varieties are widespread.
Interpretation
It seems that good agricultural and economic growth has improved food access and diversity,
while reduced poverty means wasting has been reduced considerably since destitution is so
much less common. But the high and only slowly declining stunting may reflect a combination
of (a) Low birth weights from previously undernourished mothers, (b) inadequate care, too
little breastfeeding, low quality weaning foods, dirty water, (c) infant diseases, (d) micro-
nutrient effects whereby deficiencies cause disease and otherwise prevent normal growth.
Agble et al (2009) cite feeding practices and low access to health services as among the main
causes of chronic malnutrition in preschoolers.
Ghana emerges as a clear case in which agriculture can play its role in reducing malnutrition —
up to a point. From here on, it looks as though priorities lie with health, water, sanitation,
education, and so forth.
What could agriculture do for better nutrition in this case? At the margin:
23 ENHANCE focused on full & timely immunisation, treated bednets, vitamin A supplements, hygiene practices, ORS
to treat diarrhoea, antibiotics to treat pneumonia, health worker training and health education for caregivers. 24
A CIMMYT initiative. Other initial target countries are Brazil, Ethiopia, Guatemala, and Zambia.

Smallholder agriculture’s contribution to better nutrition
59
Bio-fortification of staple foods — clear potential exists
Home gardens, as a way to combat micro-nutrient deficiency, in particular to
encourage consumption of vitamin-A and vitamin C-rich foods.
On top of home gardens, growth in a more diverse range of agricultural products
ought to improve availability of complementary foods high in nutrients – as for
instance a thriving green bean export sector in Kenya has contributed to higher
availability of green beans domestically25. Better availability ought to help bring
down prices and help people to choose healthier diets26
To realize the full potential of strategies like these, they need to be accompanied with good
education about nutrition and child feeding and care practices.
25 Bean production took off in Kenya driven mainly as an export crop, but production increases have helped to boost
domestic supply; from about 3kg per capita a year in 1990 to close to 10kg per capita a year in 2009. It is likely that this is partly supply-driven, though growing demand particularly from increasingly affluent urban markets has undoubtedly played a key role. 26
While more educated people report knowing more about benefits of diverse diets rich in fruits and vegetables, this
doesn’t necessarily translate to higher consumption in these groups (See Nti et al., 2011), indicating other factors including potentially cost may be contributing
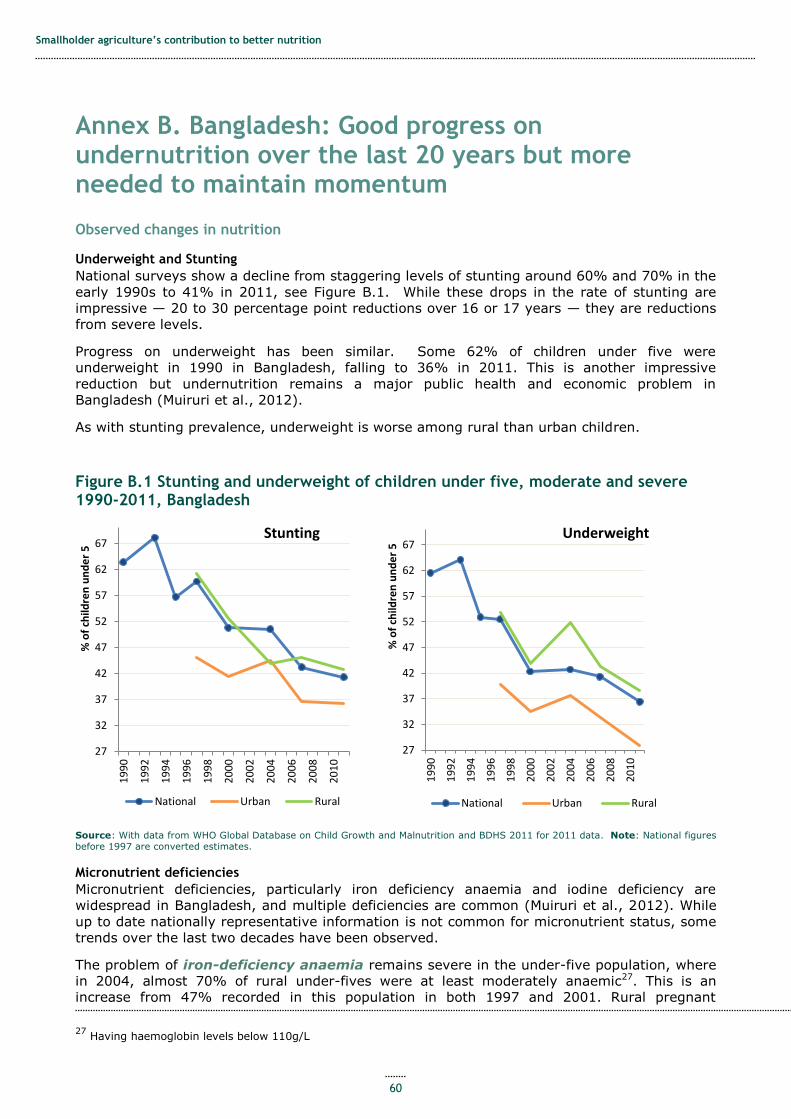
Smallholder agriculture’s contribution to better nutrition
60
Annex B. Bangladesh: Good progress on undernutrition over the last 20 years but more needed to maintain momentum
Observed changes in nutrition
Underweight and Stunting
National surveys show a decline from staggering levels of stunting around 60% and 70% in the
early 1990s to 41% in 2011, see Figure B.1. While these drops in the rate of stunting are
impressive — 20 to 30 percentage point reductions over 16 or 17 years — they are reductions
from severe levels.
Progress on underweight has been similar. Some 62% of children under five were
underweight in 1990 in Bangladesh, falling to 36% in 2011. This is another impressive
reduction but undernutrition remains a major public health and economic problem in
Bangladesh (Muiruri et al., 2012).
As with stunting prevalence, underweight is worse among rural than urban children.
Figure B.1 Stunting and underweight of children under five, moderate and severe 1990-2011, Bangladesh
Source: With data from WHO Global Database on Child Growth and Malnutrition and BDHS 2011 for 2011 data. Note: National figures before 1997 are converted estimates.
Micronutrient deficiencies
Micronutrient deficiencies, particularly iron deficiency anaemia and iodine deficiency are
widespread in Bangladesh, and multiple deficiencies are common (Muiruri et al., 2012). While
up to date nationally representative information is not common for micronutrient status, some
trends over the last two decades have been observed.
The problem of iron-deficiency anaemia remains severe in the under-five population, where
in 2004, almost 70% of rural under-fives were at least moderately anaemic27. This is an
increase from 47% recorded in this population in both 1997 and 2001. Rural pregnant
27 Having haemoglobin levels below 110g/L
27
32
37
42
47
52
57
62
67
19
90
19
92
19
94
19
96
19
98
20
00
20
02
20
04
20
06
20
08
20
10
% o
f ch
ildre
n u
nd
er
5
Stunting
National Urban Rural
27
32
37
42
47
52
57
62
67
19
90
19
92
19
94
19
96
19
98
20
00
20
02
20
04
20
06
20
08
20
10
% o
f ch
ildre
n u
nd
er
5 Underweight
National Urban Rural

Smallholder agriculture’s contribution to better nutrition
61
women’s rate of anaemia improved: from 49% in 1997 to 39% in 2004 (WHO Global Database
on Anaemia)28.
Probably the most progress has been made combatting vitamin A deficiency. Night blindness
is often caused by diets with insufficient vitamin A. In Bangladesh this deficiency is not as
prevalent as others and is now likely below WHO’s threshold of 1% (Muiruri et al., 2012).
Some progress has also been made in combatting iodine deficiency in Bangladesh — with
prevalence of low iodine levels in urine falling nationally from close to 70% in 1993 to about
43% in 1999 (Who Global Database on Iodine deficiency). Though later comparable statistics
do not appear in the WHO database, a 2004 survey revealed 39% of women and girls of
reproductive age (15–44) were iodine deficient, while in pregnant women the prevalence was
56% (Muiruri et al., 2012). Prevalence in rural areas was higher than in urban areas.
Rickets, caused by calcium and or vitamin D deficiency29 has emerged as a public health
problem over the last two decades, with up to 8% of children clinically affected in some areas
(Cravari et al., 2008). Muiruri et al. (2012) contend over half a million children in Bangladesh
are currently affected by rickets.
Growth of economy
The World Bank classifies Bangladesh as a low income country (LIC). GDP per capita measured
in constant 2000 USD grew from around US$280 in 1990 to US$588 in 2011, a rise of 110%.
Agriculture
Agricultural growth
Net production indices for Bangladeshi cereals, crops and livestock show overall growth from
1990 to 2010 at an annual equivalent of 3.7%. On a per-capita basis too they have been
growing, at an average of 1.9% a year, though mostly since the late 1990s. Growth in the
livestock indices has been the most consistent, while growth for cereals (agriculture and crops
are largely driven by the cereals index) was slow over the first half of the 2000s, see Figure
B.2.
28 WHO considers anaemia prevalence of 40% and over an issue of severe public health significance (WHO, 2008) 29 Cravari et al. (2008) say insufficiency of dietary calcium is thought to be the underlying cause, while treatment with calcium (350–1,000 mg elemental calcium daily) is curative.

Smallholder agriculture’s contribution to better nutrition
62
Figure B.2 Agricultural net production indices and growth rates for Bangladesh, 1990-2010
Source: With data from FAOSTAT
Food availability — and its price
Increased supply of cereals in particular has contributed to reduced calorie undernourishment
by FAO’s estimates, though the rate of reduction has plateaued in recent years. While the
estimates show a sharp improvement from the mid-1990s to the early 2000s (from 38% in
1994 to 18% in 2000), for most of the 2000s progress appears to have stagnated, leaving
around 17% of the population estimated undernourished in 201130.
This growth in cereal production has unfortunately not contributed much to dietary diversity.
Bangladesh has the dubious distinction of being the country with the second highest staple
(cereals plus starchy roots) contribution to total calories in the world, at 81% in 2009, after
only Eritrea (82%). Diets in Bangladesh depend heavily on rice, with insufficient diversity to
guarantee good micro-nutrition. Other Asian countries with similar poverty prevalence which
had in 1990 similarly restricted sources of food supply (Cambodia and Lao PDR for example)
have made more progress than Bangladesh on diversifying diets.
30 This figure is still closer to that of LMIC economies rather than LICs as a whole (of which Bangladesh is one) that
have an average undernourishment rate in 2011 of 30%
80
100
120
140
160
180
200
19
90
19
91
19
92
19
93
19
94
19
95
19
96
19
97
19
98
19
99
20
00
20
01
20
02
20
03
20
04
20
05
20
06
20
07
20
08
20
09
20
10
PIN
, 19
90
- 1
99
2 =
10
0
Agriculture, 3.7
Cereals, 3.5
Crops, 3.7
Livestock, 3.6
Agriculture percapita, 1.9Cereals percapita, 1.7Crops per capita,1.9Livestock percapita, 1.9

Smallholder agriculture’s contribution to better nutrition
63
Figure B.3 Stacked supply of different foodstuffs in kilocalories per person per day, 1990-2009, Bangladesh
Source: With data from FAOSTAT. Note: On average, people’s energy requirement is around 2000kcal/day.
The price of rice has remained relatively the same in real terms since the late 1990s (FAO
GIEWS coarse rice price data); except for two periods of crisis in 2007/08 and 2010/11.
Bangladesh is vulnerable to food crises, though its vulnerability appears to have decreased
from 1990 to 2011. Food aid deliveries which might indicate vulnerability have tended to
decline over the last few decades31. This in spite of the fact that relative food prices in
general32 rose about 10% from their 2000 levels by mid-2011.
On average, household expenditure on cereals was 38% of food expenses in 2000, and 36% in
2010. Expenditure on a more diverse variety of food was stronger in urban areas, where 28%
of food expenses went on cereals in 2010, compared to about 40% in rural areas in 2010.
Poverty
Overall poverty
Poverty prevalence at the national poverty line has decreased from 57% in 1992 to 32% in
2010 (World Bank WDI). Of the 32% poor, about 50 million people, 18% (about 27 million)
are below the lower poverty line, which means they cannot afford a basic diet (Muiruri et al.,
2012).
Bangladesh’s latest Demographic and Health Survey identifies very clear connections between
income and stunting and underweight of preschoolers, see Figure B.4
31 Food aid (grain equivalent) which was around 10kg/capita in 1990 was only around 2kg per capita for the mid-2000s onward. To put it another way, while per capita annual food aid exceeded 4kg in 9 out of 10 years from 1990-1999, from 2000 - 2011 it exceeded 4kg/capita in only 1 year, and 2kg per capita in only 3 years. 32 As measured by the food CPI deflated by the CPI in general
0
200
400
600
800
1000
1200
1400
1600
1800
2000
2200
2400
19
90
19
91
19
92
19
93
19
94
19
95
19
96
19
97
19
98
19
99
20
00
20
01
20
02
20
03
20
04
20
05
20
06
20
07
20
08
20
09
kcal
/ c
apit
a /
day
Other animal products
Meat
Fish & seafood
Other vegetable products
Sugar & sweeteners
Fruits & vegetables
Oilcrops & vegetable oils
Pulses
Starchy roots
Cereals
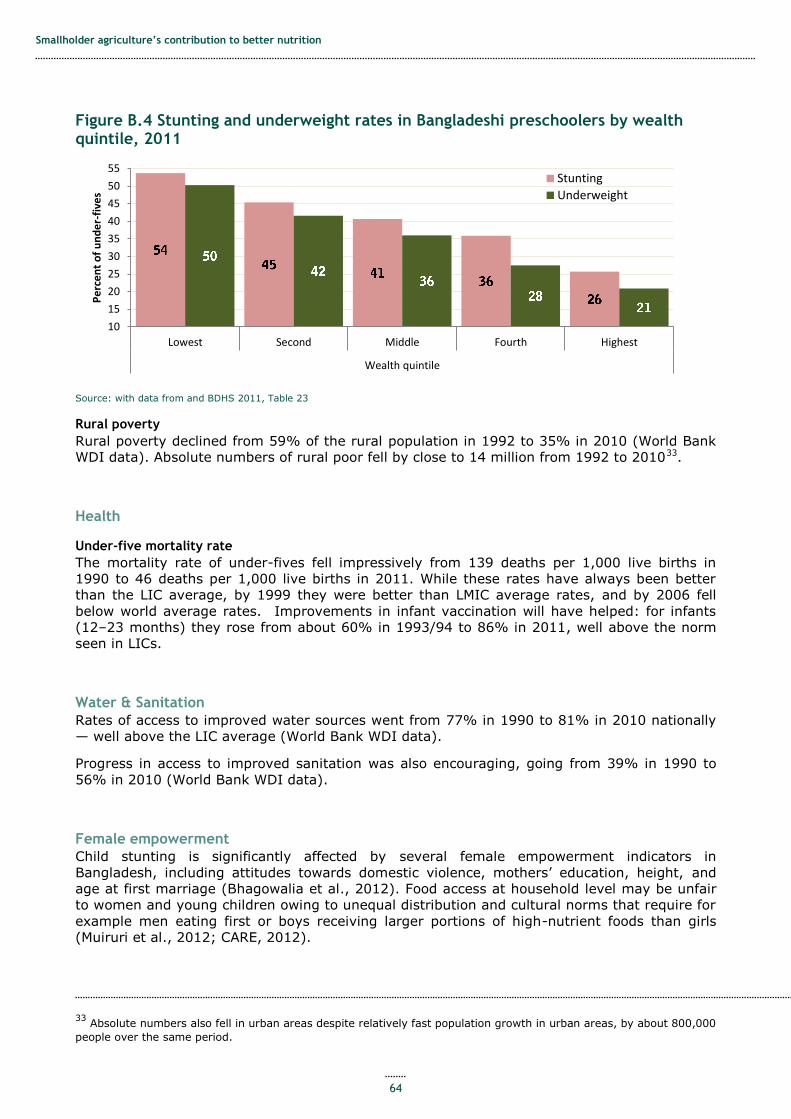
Smallholder agriculture’s contribution to better nutrition
64
Figure B.4 Stunting and underweight rates in Bangladeshi preschoolers by wealth quintile, 2011
Source: with data from and BDHS 2011, Table 23
Rural poverty
Rural poverty declined from 59% of the rural population in 1992 to 35% in 2010 (World Bank
WDI data). Absolute numbers of rural poor fell by close to 14 million from 1992 to 201033.
Health
Under-five mortality rate
The mortality rate of under-fives fell impressively from 139 deaths per 1,000 live births in
1990 to 46 deaths per 1,000 live births in 2011. While these rates have always been better
than the LIC average, by 1999 they were better than LMIC average rates, and by 2006 fell
below world average rates. Improvements in infant vaccination will have helped: for infants
(12–23 months) they rose from about 60% in 1993/94 to 86% in 2011, well above the norm
seen in LICs.
Water & Sanitation
Rates of access to improved water sources went from 77% in 1990 to 81% in 2010 nationally
— well above the LIC average (World Bank WDI data).
Progress in access to improved sanitation was also encouraging, going from 39% in 1990 to
56% in 2010 (World Bank WDI data).
Female empowerment
Child stunting is significantly affected by several female empowerment indicators in
Bangladesh, including attitudes towards domestic violence, mothers’ education, height, and
age at first marriage (Bhagowalia et al., 2012). Food access at household level may be unfair
to women and young children owing to unequal distribution and cultural norms that require for
example men eating first or boys receiving larger portions of high-nutrient foods than girls
(Muiruri et al., 2012; CARE, 2012).
33 Absolute numbers also fell in urban areas despite relatively fast population growth in urban areas, by about 800,000
people over the same period.
10
15
20
25
30
35
40
45
50
55
Lowest Second Middle Fourth Highest
Wealth quintile
Pe
rce
nt
of
un
de
r-fi
ves
Stunting
Underweight

Smallholder agriculture’s contribution to better nutrition
65
Female schooling
Women’s status in Bangladesh is playing catch-up34, though laudable improvements have been
seen in indicators such as literacy of young women that rose from 38% in 1991 to 79% in
2000.
Net enrolment ratio for girls in primary school was 93% over 2007 to 2010. The same ratio for
secondary school female participation over the same period was 43% (UNICEF, 2012).
Teenage pregnancy rate
The adolescent fertility rate dropped from about 130 births per 1000 women aged 15-19 to
about 73 births per 1000 women aged 15–19 from 1997 to 2010. This is important for child
nutritional status as early pregnancy exacerbates risks of perpetuating the intergenerational
cycle of undernutrition (Muiruri et al., 2012). In Bangladesh, more than two thirds of girls are
married before they turn 18, with early pregnancy contributing to the negative cycle of small
mothers, stunted by chronic undernutrition, giving birth to low birth-weight (LBW) babies35.
Specific nutrition interventions
Specific national nutrition interventions such as vitamin A supplementation and salt iodisation
have seen success in improving features like vitamin A status or iodine deficiency. About 60%
of under-fives in 2011 had received a vitamin A capsule in the 6 months prior to the survey
(BDHS, 2011); though rates varied considerably across regions, as well as according to
mothers’ levels of education and wealth (see Figure B.5.). Vitamin A deficiency has been
reduced significantly, but even here coverage is lacking.
Figure B.5 Children aged 6 to 59 months in receipt of a vitamin A capsule in the last 6 months, by characteristic
Source: With data from BDHS 2011
Bangladesh’s first large-scale nutrition intervention, formed in the 1980s and active from 1995
to 2002, the Bangladesh Integrated Nutrition Plan (BINP) spent only 6% of its budget
34 Of the case study countries, Bangladesh is the only one to have a ratio of female to male life expectancy of less than 1 at any point in the last 20 years; although this improved to 1.02 by 2010, the low income country average was 1.04. 35 LBW babies are more likely to fail to grow properly, which, combined with inadequate food intake and caring practices, leads to stunting and childhood and youth underweight. To break this cycle, it is important not only to improve nutritional status of women, adolescent girls and children, but also to delay marriage and first pregnancy, while improving education and livelihood opportunities for women (Muiruri et al., 2012)
60 59 60 58
60
72
66
49
56
66
56
69
53 55
64 62
64
55 57
61
64 62
45
50
55
60
65
70
75
ALL
Bo
ys
Gir
ls
Urb
an
Ru
ral
Bar
isal
Ch
itta
gon
g
Dh
aka
Kh
uln
a
Raj
shah
i
Ran
gpu
r
Sylh
et
No
ed
uca
tio
n
Pri
mar
y in
com
ple
te
Pri
mar
y co
mp
lete
Seco
nd
ary
inco
mp
lete
Seco
nd
ary
com
ple
te o
r h
igh
er
Low
est
seco
nd
Mid
dle
Fou
rth
Hig
hes
t
General District Mother's education Wealth quintile
%

Smallholder agriculture’s contribution to better nutrition
66
during the 1990s. Evaluation of its aim (to reduce severe underweight by 40% and moderate
underweight by 25%) was hampered by lack of necessary monitoring and evaluation
guidelines36 (Taylor, 2012).
Its successor, the National Nutrition Programme (NNP), ran from 2002 to 2011. This
programme reportedly provided some 20% of the population (and 30% in 2009), with
information, advice and counselling by Community Nutrition Promoters (Taylor, 2012).
Behaviour Change Counselling has a large role to play in improved nutrition, particularly where
wealth and education are no guarantee of ensuring best practices. Consider for example Figure
B.6 which shows a clear relationship between better child feeding practices and better child
nutrition outcomes with increasing wealth and education of mothers. Even among the most
wealthy and well-educated, less than two-fifths adhere to the recommended child diets.
Figure B.6 Percent of infants fed adequately diverse diets frequently compared to stunting rates in Bangladesh by area, wealth quintile, and mothers’ education, 2011
Source: With data from BDHS 2011, Table 25. Note: Among children 6 =- 23 months, 97% are breastfed. Red columns refer to children getting fed four or more food groups at at least the minimum recommended frequency.
Achievements of the NNP beyond Behavior Change Counselling were lacking, notably in
therapeutic malnutrition treatment. In 2008 only 20% of Bangladesh’s severely malnourished
children could be managed in health facilities (Taylor, 2012). Plans were similarly unambitious
in terms of coverage 37.
Some large-scale specific nutrition interventions have seen impressive results in Bangladesh.
In collaboration with USAID and the GoB, CARE's Strengthening Household Ability to Respond
to Development Opportunities (SHOUHARDO) project is an excellent example; described as the
36 Severe underweight rates in Bangladesh fell from 26% in 1991 to 12% in 2002, while moderate underweight rates fell from 62% to 43%, but attribution of these falls to the BINP is not possible. 37 For example, Bangladesh’s National Nutrition Programme (see for instance World Bank, 2006) only aimed to cover 105 of Bangladesh’s 464 upazilas (less than 25% coverage).
5
10
15
20
25
30
35
40
45
50
55
BA
NG
LAD
ESH
Bar
isal
Ch
itta
gon
g
Dh
aka
Kh
uln
a
Raj
hah
i
Sylh
et
Low
est
Seco
nd
Mid
dle
Fou
rth
Hig
hes
t
No
ed
uca
tio
n
Pri
mar
y in
com
ple
te
Pri
mar
y co
mp
lete
Seco
nd
ary
inco
mp
lete
Seco
nd
ary
com
ple
te o
r h
igh
er
Division Wealth quintile Education of mother
%
Both 4+ groups & at least minimum times
Under-five stunting
Smallholder agriculture’s contribution to better nutrition
67
first large-scale project using a rights-based livelihoods approach to addressing malnutrition38
(Smith et al., 2011). An evaluation found extraordinary impact on stunting among children 6–
24 months old: around 4.5 percentage points per year rate of reduction from early 2006 to
late 2009. Over the same period for the same age group in Bangladesh, stunting declined only
0.1 percentage points per year. Targeting the poor helped to accelerate these reductions
(ibid). More detail on SHOUHARDO is provided in the next section as an example of nutrition
sensitive gender empowerment.
Agricultural interventions for nutrition in Bangladesh
Nutrition sensitive gender empowerment
SHOUHARDO is an outstanding example of a direct intervention putting women’s
empowerment at its centre (Feed the Future, 2012). Agricultural interventions were only one
part of a package of interventions carried out at community level in rural areas, targeting the
most vulnerable, including (numbers are % of participating households) (Smith et al., 2011):
Mother and Child Health and Nutrition (MCHN) - 33%
Sanitation - 19%
Women's empowerment – 25%
Field crop production / fisheries - 36%
Homestead gardening & livestock rearing - 46%
Income generating activities - 37%
Food/cash for work - 11%
Savings groups - 32%
An evaluation of SHOUHARDO discovered the single-most effective intervention was women's
empowerment (Smith et al., 2011). Another key finding was the presence of strong synergies
between different types of intervention. Regarding agricultural interventions, extremely strong
synergies were observed between agricultural production/fisheries interventions and MCHN
interventions, implying a very large reduction in stunting could be achieved by combining
these interventions compared to small reductions they might achieve alone (Smith et al,
2011).
Significant synergies were also demonstrated between sanitation and MCHN; women's
empowerment and MCHN; women's empowerment and participation in savings groups; and
field crop production / fisheries promotion and participation in sanitation.
Home gardens and small livestock
Helen Keller International (HKI) began a homestead food production (HFP) programme in
the early 1990s which has since expanded dramatically. In 20 years, HFP reached nearly 4% of
Bangladesh's population, covering just over half the country's subdistricts (Ianotti et al.,
2009).
HFP promotes home gardens, small livestock production, and nutrition education with the aim
of increasing consumption of micronutrient-rich foods and improving health and nutritional
status of women and children. Establishing HFP systems crucially involved agricultural and
non-agricultural aspects (Ianotti et al., 2009):
Establishing village model farms;
Forming mother's groups
Providing gardening and livestock inputs
Behaviour Change Communication
Community mobilization
38 Consistency with this approach requires relying on both direct nutrition interventions and those that address underlying structural causes including poor sanitation, poverty, and deeply-entrenched inequalities in power between women and men (Smith et al., 2011).

Smallholder agriculture’s contribution to better nutrition
68
Making links with health and other sectors
The programme, implemented by NGO partners and government has improved food security
for nearly five million vulnerable Bangladeshis across the country via: increased production
and consumption of micronutrient-rich foods; increased income from gardens and expenses on
micronutrient-rich foods; women’s empowerment; enhanced partner capacity; and community
development (Ianotti et al., 2009).
HFP also had more diverse impacts on people’s welfare owing to the extra income generated.
One study showed that extra income from sale of HFP garden products was spent on food
(36%), education (35%), clothes (26%), productive assets (18%), health care (15%), housing
(5%), and social activities (3%) (Ianotti et al., 2009). Another found that income from sale of
poultry products went for savings (40%), followed by productive assets (37%), education
(33%), food (30%), and clothes (14%) (ibid).
Home gardens for nutritious food appear sustainable beyond interventions by implementers.
One study comparing household production and consumption of vegetables compared levels of
those active in HKI programmes, those who had completed programmes, and a control group.
Households involved in the programmes grew about 10 varieties of vegetable in their gardens,
compared to 6 in those who had completed the programme, and only 3 in the control group.
Production in the active group for the 3 months of the study was 130kg, compared to 120kg in
the completed group, and only 40kg in the control. Household consumption was better in both
the active and completed groups, at 85 and 70kg respectively over the 3 months, compared to
38kg for the control group (Helen Keller Worldwide, 2003).
While evidence on increased consumption and food diversity is clear, more evidence is needed
to demonstrate HFP programme impact on improving maternal and child micronutrient status
(Iannotti et al., 2009). Some studies have nonetheless found clear benefits of HKI home
gardens for intake and nutrition outcomes in Bangladesh, for instance a case where HKI
sponsored home gardens in Northern Bangladesh led to increased intakes of vegetables by
children and infants, improved stunting and underweight rates, and reduced their incidence of
anaemia and night blindness (Berti et al., 2004).
Some studies of home gardens in Bangladesh show less clear nutrition outcomes. For example,
another case in Berti et al., 200439 where although home gardens led to increased intake of
vitamin A rich foods by some 10 to 20%, this did not lead to any change in incidence of night
blindness.
This highlights the importance of combining home gardens with BCC and other nutrition-
enhancing strategies such as women’s empowerment, as well as in designing monitoring and
evaluation to capture anthropometric or micronutrient status impacts.
Aquaculture
For Bangladesh's rural poor, fish provides an important source of protein. Small indigenous fish
species (SIS) dominate, but supply is under pressure and a growing share of available fish is
supplied by rural carp culture of both indigenous and exotic species. SIS have higher vitamin A
than the cultured species, and are also a better source of calcium as most of their bones are
eaten (Ahmed et al., 2012).
While studies show households with aquaculture ponds (there were some 1.3M of these in
Bangladesh around 2000) do not consume more fish than those without ponds, there is
potential for high vitamin A species of fish to be grown in ponds with good potential to improve
levels of vitamin A available in average diets (Roos et al., 2000).
Mola for instance is a fish high in vitamin-A commonly eaten in Bangladesh. Researchers found
that of the mola harvested in ponds, around 47% were eaten by pond-owning households,
39 Worldview International Foundation's Nutritional Blindness Prevention Programme

Smallholder agriculture’s contribution to better nutrition
69
which contributed around 21% of vitamin A required over the period examined (Roos et al.,
2000).
An evaluation of two Danida aquaculture extension project/components40 running from 1989 to
2006, one in Mymensingh and the other in Greater Noakhali, found participants in the
programmes had increased fish consumption, improved diets, nutrition, and health. Rising
incomes were also used to buy more nutritional food and to access health care services. Non-
participating households however showed similar improvements in diet, nutrition, health, and
access to health services, making attribution to the aquaculture programmes difficult (Danida,
2009).
What is clear is that aquaculture has increased availability of fish nationally. In 1990,
Bangladesh aquacultured fish production was around 200,000 tonnes, around 20% of fish
production nationally. By 2005, this had risen to nearly 900,000 tonnes; contributing around
40% of total fish produced in Bangladesh (Danida, 2009).
Bio-fortification
Bio-fortification is in early stages in Bangladesh, with little evidence of programmes for bio-
fortification or impacts. A number of species appear to have potential, including orange-fleshed
sweet potato (OFSP), golden rice currently being investigated for efficacy by HKI (HKI, 2012),
and high-zinc rice, which is currently under development in the hope it may become available
in Bangladesh within the next five years (IRIN 2011).
Interpretation
Progress on nutrition indicators has been encouraging in Bangladesh, but several come from
extreme positions. Empowerment of women for instance may produce impressive results in
Bangladesh owing to low starting levels of women’s empowerment41. From 1990 to 2011,
Bangladesh reduced stunting by 1 percentage point a year: an impressive rate, close to that
achieved by China over a similar period. The trick for Bangladesh will be to maintain—or even
accelerate this rate over the next decade.
Agriculture certainly has a role to play in reducing undernutrition in Bangladesh; as it already
has. Agricultural growth has been good at improving staple access but diets depend too
heavily on rice42. This is not good news for people’s micro-nutrition. It may not be good for
macro nutrition either, as high dependency on one staple does not spread risk43. Furthermore,
improvements in fundamentals such as public health and education need to continue – as also
do campaigns to change unhelpful behaviours in feeding and care of infants, and the cycle of
stunted mothers bearing stunted babies44.
Political accountability for nutrition is a grey area in Bangladesh, owing to involvement of many
government agencies, as well as strong involvement of large NGOs such as BRAC or HKI which
step in to implement programmes the government might not otherwise implement. Particular
problems arise when states are weak; NGOs take over public functions, thus leaving the state
perhaps even weaker (Mason, 2002). NGOs might be less accountable to local people, though
not necessarily. Furthermore, local accountability may not always be appropriate. For instance,
40 Since 2000 the interventions which were originally projects became official components of Bangladesh’s Agriculture
Sector Programme Support 41 The Global Gender Gap Index (a composite measure of women's economic participation and opportunity; educational attainment; health and survival; and political empowerment) for Bangladesh ranked 86th in 2012, compared to Tanzania's rank of 46th and Ghana's of 71st. It was however still above India's rank of 105th, and Zambia, which had the worst rank at 114th (135 countries were measured, ranked from 1: Iceland, to 135: Yemen) (Hausmann et al., 2012) 42 Agricultural policy in Bangladesh centres heavily on rice; perhaps not surprising as the famine of 1974 continues to influence politicians and citizens. 43 Rice production in Bangladesh remains vulnerable to natural disasters which are relatively frequent. 44 More than one in five (22%) of newborns have low birth weight and as many as 18% of mothers are acutely undernourished (Muiruri et al., 2012).

Smallholder agriculture’s contribution to better nutrition
70
the much-admired Grameen Bank makes a point of not adapting its programmes to local
circumstances to avoid bias and corruption.
Nonetheless the political profile of Bangladesh's fight against hunger has been cited as a key
factor underpinning its success to date (Sanchez-Montero et al., 2010.) Gender focussed non-
farm employment opportunities and development of microcredit especially for women also
contributed to Bangladesh's success to date (ibid).
What could agriculture do for better nutrition in this case? At the margin:
Given the strong pressures on land in Bangladesh, the dangers of mono-cultivation,
and the widespread micro-nutrient deficiencies, there is a strong case for
Bangladesh to reduce rice production in favour of a more diversified production of
crops and animals that are both more diverse ecologically as well as nutritionally.
With extra earnings from this, the country can import rice, for example from Burma
or Thailand45.
Home gardens, aquaculture, and small livestock are a part of this, particularly as
they are a practice well established in Bangladesh with proven impacts on people’s
nutrition.
Bio-fortification of staples – this appears to have potential, though largely
unexplored.
Diversify production to encourage better consumption of micronutrient rich food
and diverse weaning diets. Home gardens are a good way to do this46, with
agricultural interventions particularly effective when combined with Mother & Child
Health and Nutrition interventions.
45 Though high and volatile international prices for imported rice may complicate this strategy. In addition, while rice
is the main calorie source in Bangladesh, staple supply is not high in absolute terms. Compared to Ghana for example, in 2009, when FAO estimates for Ghana’s undernourishment reached <5%, it had about 260kg/capita more staple (staples for Ghana include cereals, starchy roots & plantain) supply than Bangladesh (some 13% more), while total calorie availability was some 15% higher. 46
HKI reported studies have shown that children in households with developed gardens consume 1.6 times more
vegetables and have a lower risk of night blindness than children in homes without homestead gardens.

Smallholder agriculture’s contribution to better nutrition
71
Annex C. Tanzania: Disappointing agricultural growth and not enough focus on health or education of girls means poor progress on child malnutrition
Observed changes in nutrition
Underweight and Stunting
Tanzania has achieved good progress on underweight. It is possible the country
could even achieve this indicator of MDG1, though not if the slow rate of
improvement over the second half of the 2000s persists. A quarter of children
under five were underweight in 1992. By 2010, underweight prevalence had
fallen to 16.2%, a drop from high to medium severity by WHO’s classification.
It is worse among rural than urban children – though the gap has lessened since
the mid-1990s.
Progress on stunting rates has been discouraging. Nationally, 50% of under-fives
were stunted in 1992. By 2010, the rate had fallen to only 43%. This is almost
20 years of ‘very high’ severity with disappointingly slow improvement. Though
rates fell rapidly in urban areas from the early to late 1990s, this was not the
case for rural preschoolers, and the decrease in urban areas reversed over the
first half of the 2000s.
As with underweight prevalence, stunting of children in rural areas is far worse
than urban areas. In 2010 the margin was 13 percentage points: See Figure C.1.
Figure C.1 Stunting and underweight of children under five in Tanzania, moderate and severe, 1992–2010
Source: With data from WHO Global Database on Child Growth and Malnutrition.
Micronutrient deficiencies
Data on micronutrient status are not encouraging. The problem of iron-deficiency anaemia is
severe in vulnerable populations. In 2004/05, 71.8% of pre-school age children had at least
moderate anaemia (Haemoglobin below 110g/L) (WHO Global Database on Anaemia). At the
10
15
20
25
30
35
40
45
50
19
90
19
92
19
94
19
96
19
98
20
00
20
02
20
04
20
06
20
08
20
10
% o
f ch
ildre
n u
nd
er
5 s
tun
ted
Stunting
Tanzania, nationalUrbanRural
10
15
20
25
30
35
40
45
50
19
90
19
92
19
94
19
96
19
98
20
00
20
02
20
04
20
06
20
08
20
10
% o
f ch
ildre
n u
nd
er
5 u
nd
erw
eig
ht
Underweight
Tanzania, national
Urban
Rural

Smallholder agriculture’s contribution to better nutrition
72
same time, 58.2% of lactating women were at least moderately anaemic47. By 2010, anaemia
prevalence in under-fives had declined to 58.6% (NBS & ORC Macro 2011) — still a major
public health problem, if 10 percentage points lower than the previous survey. Kinabo et al.,
(2008) wrote:
Iron deficiency due to the low level of consumption of foods of animal origin is the main cause, but incidence
of malaria and other parasitic diseases are contributing causes.
…
‘One of the factors contributing to the high prevalence of anaemia in the Southern zone is low consumption
of fruit and animal foods, and low awareness about the relationship between food consumption and
nutritional status.’
Vitamin A deficiency is thought to be widespread, mainly owing to low intake of animal
products48 high in absorbable retinol and not enough fruit and veg rich in vitamin A in diets.
There are not however any surveys of national level vitamin A deficiency in children.
Growth of economy
Economic growth, while sluggish for most of the 1990s, with constant 2000 GDP per capita
actually falling from 1990 to 1994, began to grow more rapidly after 2000, and by 2011 was
about 55% higher than in 1990 (World Bank WDI).
Agriculture
Agricultural growth
Tanzania’s economy is heavily dependent on agriculture, which accounted for about 45% of
GDP and 2/3 of the country’s export earnings in 2005. Furthermore, the agriculture sector is
the main source of employment and livelihood for 76% of the population (Kinabo et al., 2008).
Agricultural growth, however, has fallen short of its potential over the last 20 years, with per
capita rates of growth discouragingly slow. While the net production index for agriculture has
grown at a rate of 3.3% per year from 1990 to 2010, per capita it grew only half a percent per
year over the same period, see Figure C.2.
47 The WHO considers anaemia prevalence of 40% and over an issue of severe public health significance (WHO,
2008). 48
Poverty limits consumption of animal products. Plant sources of vitamin A are more affordable, but bio-availability
of animal sources is higher (Kinabo et al., 2008).

Smallholder agriculture’s contribution to better nutrition
73
Figure C.2 Agricultural net production indices and growth rates for Tanzania, 1990-2010
Source: with data from FAOSTAT. Note: Numbers in the legend are the average annual growth rates of the series depicted from 1990 – 2010.
Tanzania’s agriculture is furthermore vulnerable to environmental shocks as the majority of
production is rainfed and variable. Lean periods can last three or four months (FAO GIEWS),
and in regions with one rainy season shortages are common. Inadequate storage also
contributes (Kinabo et al., 2008).
Food availability — and its price
Overall calorie supply saw next to no change in per capita values over the 20 years from 1990
to 2009: see Figure C.3. The share coming from staples has fallen in favour of complementary
foods.
Calories supplied from cereals per capita decreased at a rate of 0.3% a year from 1990 to
2009, while calories from starchy roots available per capita decreased at a rate of 2.9% per
year over the same period. Other vegetable products supply grew at a rate of 2.9% per year
and animal products49 at 0.1%.
49 A recent survey in 2008 found very infrequent meat consumption, particularly in rural areas
70
90
110
130
150
170
190
19
90
19
91
19
92
19
93
19
94
19
95
19
96
19
97
19
98
19
99
20
00
20
01
20
02
20
03
20
04
20
05
20
06
20
07
20
08
20
09
20
10
Ind
ex:
19
90
-92
= 1
00
Agriculture, 3.3
Cereals, 3.3
Crops, 3.5
Livestock, 3.2
Agriculture per capita, 0.5
Cereals per capita, 0.6
Crops per capita, 0.7
Livestock per capita, 0.4

Smallholder agriculture’s contribution to better nutrition
74
Figure C.3 Stacked supply of different foodstuffs in kilocalories per person per day, 1990–2009, Tanzania
Source: With data from FAOSTAT. Note: On average, people’s energy requirement is around 1800kcal/day.
While diversity of average diets appears to have increased, diversity of children’s weaning
diets is still not good enough, with complementary foods comprising mainly cereal-based
porridges with few or no vegetables and often lacking animal proteins (Muhimbula & Issa-
Zacharia, 2010).
Staple food prices increased in real terms from 2006 to current levels. While longer term
trends in staple food prices are difficult to track, wholesale maize prices in Dar es Salaam
increased by over 50% in real terms from their average levels in 2006 to their average levels
in 2011. They are also relatively volatile, which contributes to food insecurity (FAO GIEWS).
If food aid deliveries are an indication of trends in food security, they appear to have been
getting worse. While it is difficult to pick out a trend in food aid deliveries, per capita deliveries
from 1990 to 1999 were on average less than from 2000 to 2010, by more than half a kg per
capita. Also, in 7 years of the most recent decade, food aid per capita was above 2 kg per
capita, compared to being over 2 kg per capita in only 3 years of the earlier decade (WFP
FAIS).
Poverty
Overall poverty
The proportion of poor people in Tanzania has reduced very slightly since the early 1990s.
Poverty prevalence as measured at the national poverty line fell from 39% of the population in
1992 to 33% in 2007 (World Bank WDI).
Rural poverty
Rural poverty rates fell a little from 41% in 1992 to 37% in 2007 (World Bank WDI). The gap
between urban and rural poverty rates is pronounced: 15 percentage points in 2007.
Moreover, the absolute number of poor people has been rising, as reductions in poverty
prevalence are not enough to lead to absolute reductions in the face of a relatively rapidly
growing population50.
50 Tanzania's population has been the fastest growing of all the case studies, at a rate of 2.8% per year from 1990 –
2012 (Data from FAOSTAT)
0
500
1000
1500
2000
19
90
19
91
19
92
19
93
19
94
19
95
19
96
19
97
19
98
19
99
20
00
20
01
20
02
20
03
20
04
20
05
20
06
20
07
20
08
20
09
kcal
/ c
apit
a /
day
Other animal products
Meat
Milk
Other vegetable products
Sugar & Sweeteners
Pulses
Oilcrops and Vegetable Oils
Fruits and Vegetables
Starchy Roots
Cereals

Smallholder agriculture’s contribution to better nutrition
75
In 2007 there were 2.6M more poor people in rural areas than in 1992, while the number of
urban poor grew by 460,000 from 1992 to 2007: See Figure C.4
Figure C.4 Poverty numbers in absolute terms, compared to urban and rural populations, Tanzania, 1992-2007
Source: With data from World Bank WDI and FAOSTAT for population.
Health
Under-fives mortality rate
The mortality rate of under-fives has been declining in Tanzania at a dramatic rate since the
mid-to late 1990s, especially when compared to the average rates of decline in LICs and
LMICs. It fell from levels of about 157 per 1000 in 1990 to about 68 per 1000 in 2011. This is
less than LICs as an aggregate and approaching the average for LMICs (World Bank WDI). A
significant number of children continue to suffer malaria, acute respiratory infections, fever
and diarrhoea and other diseases, the underlying causes of which are described (Kinabo et al.,
2009) as: poor sanitation and care practices; low levels of education and awareness; and, low
access to clean and safe drinking water and to adequate health services.
Water & Sanitation
Tanzania has seen a modest deterioration in prevalence of access to improved water sources
over the last 20 years, with improvements failing to keep up with population growth,
particularly in urban areas. While 55% of the total population had access to an improved water
source in 1990, by 2010 the proportion had fallen to 53% (urban access levels dropped
dramatically from 93% to 79%). Levels of access in general were above the LIC average until
1996, when they dropped below (World Bank WDI).
Progress with increasing access to improved sanitation has been a bit more encouraging,
though absolute levels of access remain well below the LIC average. Nationally, percent of
people with access to improved sanitation grew from 7% in 1990 to 10% in 2010. Access
levels for urban Tanzania saw the most growth, while levels for rural Tanzanians have not
grown since 1995 (World Bank WDI).
21.9
26.4
30.8
5.3
7.6
10.3
8.9 10.2 11.5
1.6 1.8 2.2 0
5
10
15
20
25
30
0
5
10
15
20
25
30
1992 2000 2007
Millions of people
Rural population
Urban population
Rural poor
Urban poor

Smallholder agriculture’s contribution to better nutrition
76
Female empowerment
Female empowerment has significant consequences for the nutrition of children. Infant feeding
practices improved slightly from 1992 to 2005, for example with more exclusive breastfeeding
of children up to three months old, although there are large numbers of children still receiving
complementary foods too early — and a smaller number too late.
“Poor breastfeeding and child feeding practices augmented by very early
introduction of nutritionally inadequate and contaminated complementary foods are
major factors contributing to persistent child malnutrition in Tanzania.” (Muhimbula
& Issa-Zacharia, 2010)
Female schooling
While there have been increases in the proportion of girls achieving some primary education,
this suffered recently. Only a very small percent of girls have some secondary education, and
even fewer complete or go beyond secondary level. Only in the highest wealth quintile is there
any completion of secondary school and the figures are very low. Ten percent of females in the
highest wealth quintile in 2007/08 had no education, compared to 45% in the lowest wealth
quintile.
Net enrolment ratio for girls in primary school was 97% in recent data (2007-2010), while the
net attendance ratio over the same period was 82%. Net attendance ratio for female
secondary school participation was 24% for 2005 to 2010.
Women’s literacy levels have actually declined slightly from their levels in the late 1980s. They
were above the LMIC country average until about 2005, after which they fell below. They
remain above the LIC average, but may not longer if current trends continue; see Figure C.5.
Figure C.5 Literacy levels of young women in Tanzania, compared to selected regions, 1991-2011
Source: With data from World Bank WDITeenage pregnancy rate
The adolescent fertility rate for Tanzania fell only very slightly from 1997 to 2007, from 133 to
129 per 1000 teens 15–19. These rates are well above those for the LIC group, and the 11th
highest in the world51.
51 Tanzania’s population is quite young (43% below 15 years old), and the dependency ratio is high (85%), placing a
heavy economic burden on the productive age groups (Kinabo et al., 2008).
50
55
60
65
70
75
80
85
90
19
88
19
89
19
90
19
91
19
92
19
93
19
94
19
95
19
96
19
97
19
98
19
99
20
00
20
01
20
02
20
03
20
04
20
05
20
06
20
07
20
08
20
09
20
10
Lite
racy
rat
e, y
ou
th f
em
ale
(%
of
fem
ale
s ag
es
15
-24
)
Tanzania Low income Lower middle income World

Smallholder agriculture’s contribution to better nutrition
77
Specific nutrition interventions
National nutrition interventions have been undertaken, though success and coverage has been
mixed, or undocumented. For instance, in 1995, a Salt Act was approved to ensure salt for
human consumption was iodized. In 2005 as a result of this initiative, 84% of households used
iodized salt (Kinabo et al., 2008, citing Tanzania Food and Nutrition Centre). Another survey
found that about 74% of households used iodized salt, but that only 43% were using
adequately iodized levels (>15ppm) (NBS and ORC Macro, 2005).
Some sub-national interventions show clearer improvements. World Vision's Micronutrient and
Health (MICAH) programme in in Tanzania's Eastern zone for example resulted in a significant
increase in rate of exclusive breastfeeding for the first six months (World Vision 2006),
improved indicators for children's vitamin A and Iodine intake, as well as for their stunting and
underweight (Berti et al., 2010). This programme involved vitamin A and iron
supplementation, maize fortification; agricultural interventions such as home gardens, supply
of fruit trees and small animals; water and sanitation; deworming and other health
interventions, training of staff and volunteers, and education and media dissemination (World
Vision, 2006).
While there is considerable overlap between specific agricultural nutrition interventions and
other elements of nutrition programming, some examples are provided below.
Gender empowerment in food processing
Home gardens in Tanzania have a strong gender focus as women tend to be most heavily
involved in this kind of agriculture. In Tanzania, women are usually responsible for food
processing activities as well.
The Tanzania Food and Nutrition Centre (TFNC) implemented a project from 1995 to 1998 in a
region where TFNC in collaboration with the Ministry of Agriculture had initiated a horticulture
project to encourage vegetable gardens and fruit trees in 1992. The project aimed to
encourage women who processed fruit and vegetables to use improved solar dryers which
enhanced nutritional quality of the dried products as well as increasing women's income
through dried food products. The intervention included education about nutrition and business
training (Mulokozi et al., 2000). Results showed that while there was demand and good
adoption of the improved solar drying technology, leading to more year-round availability of
vitamin-A rich foods, most of the positive results on children's intake of such foods came from
the nutrition education part of the intervention; highlighting the importance of nutrition
education (ibid).
Home gardens and small livestock
Studies have associated home gardens in Tanzania with households eating statistically
significant higher levels of vitamin A rich foods (Ecker et al., 2010).
One evaluation of a home gardening project in rural Tanzania in 1992–93 found five years
later it had resulted in more gardens growing guava and pawpaw (Kidala et al., 2000). People
were also eating more vitamin A rich food; 50% more than the control group. Though
biochemical indicators were unchanged, behaviours related to vitamin A intake had changed,
as helminth infections were lower than in the control areas, with 79% being infection free
compared to 49% in control areas (Berti et al., 2004)
Small livestock systems have also been associated with better diets. For example, introduction
of dairy goats from Norway in 1988 has led to improved diets and food security among
smallholder farmers in the Mgeta area of Tanzania. The new technology is adapted and rapidly
spreading to other parts of the country (Eik et al., 2008).
Bio-fortification
Projects promoting orange-fleshed sweet potato have been undertaken in Tanzania. For
example, the Tanzanian National Sweetpotato Research Program has incorporated OFSP into
its conventional breeding efforts (RAC, 2012). Though it is difficult to find evidence of impacts
as yet, it appears to have considerable potential, as sweet potatoes are already part of the

Smallholder agriculture’s contribution to better nutrition
78
diet, and the orange-fleshed sweet potato has been accepted and enjoyed, particularly by
children, in trials (RAC, 2012).
Quality Protein Maize (QPM) has also made some inroads in Tanzania. For instance it was
promoted under CIDA's QPM Development project, which ran 2003 to 2010 in Ethiopia, Kenya,
Tanzania, and Uganda, with 15% of funds for Tanzania. Results for Tanzania specifically are
unavailable, but reportedly the project increased QPM production by an average of 31%. It
increased consumption of QPM, especially by children and female members of farm families by
90% on average (CIDA, 2012). The extent to which it is cultivated in Tanzania and its impacts
are not known, though its uptake is thought to be small scale to date. A key issue for adoption
is availability of seed.
Interpretation
Restricted agricultural growth in Tanzania has likely contributed to disappointing improvements
in child undernutrition though pathways including failure to reduce poverty. Poor care
practices, low feeding frequency, low diversity of diet, and poor access to health care services
also contribute. Neglect of attention to women’s empowerment also stands out in the
Tanzanian case.
What could agriculture do for better nutrition in this case?
Improve production, particularly yield, of staple foods, particularly maize, where
there is much scope to raise yields by, for example, raising fertilizer use from the
very low levels seen in Tanzania, Figure C.6. Removing barriers to trade,
particularly with neighbouring countries, would raise incentives to domestic
producers.
Focus on women farmers
Bio-fortification of the staple, maize, particularly with vitamins like A and minerals
like Iron could help.
Diversify to encourage better consumption of micronutrient rich food and diverse
weaning diets (combined with better education). Home gardens are a good way to
do this, and if women in particular are involved, could help empower women.
Figure C.6 Fertilizer use per unit of arable and permanent cropland in case study countries
Source: With data from FAOSTAT
17
8
2
95
3
26
24
9
12
15
6
8
27
0
50
100
150
200
250
Bangladesh Ghana India Tanzania Zambia
Kg
NP
K n
utr
ien
ts a
pp
lied
pe
r h
a o
f 'a
rab
le &
p
erm
ane
nt
cro
p' l
and
2002 2003 2004 2005 2006 2007 2008 2009

Smallholder agriculture’s contribution to better nutrition
79
Annex D. Zambia: Faltering agriculture, slow progress on fundamentals, and high inequality means high levels of chronic child malnutrition
Observed changes in nutrition
Underweight and Stunting
In almost 20 years there has been almost no improvement in stunting of under-fives: it was
46% nationally in 1992 and still 46% in 2007. There has, however, been some progress in
reducing underweight prevalence, reduced from 21% of under-fives in 1992 to 15% in 2007—
a drop from the WHO classification of high to medium severity.
Stunting of children in rural areas is far worse than urban areas. In 2010 the margin was about
8 percentage points; an improvement on the gap in 1992 which was more than 12, see Figure
D.1.
As with stunting prevalence, underweight is worse among rural than urban children – though
the gap has lessened since the early-1990s.
Figure D.1 Stunting and underweight of children under five, moderate and severe 1992–2010, Zambia
Source: With data from WHO Global Database on Child Growth and Malnutrition.
Micronutrient deficiencies
Micronutrient status is not good, though on some indicators it has improved owing to
interventions. In the early 1990s, iodine deficiency was a severe public health problem, but
since the enforcement of salt iodization in 1996, recent surveys of urinary iodine levels indicate
sufficient iodine intake. Vitamin A deficiency has also decreased among women owing to
supplementation. However, only about half of mothers receive these supplements during the
post-partum period, and among children, vitamin A deficiency remains very high, in spite of
supplementation covering almost two thirds of children.
12
17
22
27
32
37
42
47
52
57
19
90
19
92
19
94
19
96
19
98
20
00
20
02
20
04
20
06
% o
f ch
ildre
n u
nd
er
5 s
tun
ted
Zambia, national
Urban
Rural12
17
22
27
32
37
42
47
52
57
19
90
19
92
19
94
19
96
19
98
20
00
20
02
20
04
20
06
% o
f ch
ildre
n u
nd
er
5 u
nd
erw
eig
ht
Zambia, National
Urban
Rural

Smallholder agriculture’s contribution to better nutrition
80
Iron deficiency anaemia is found in more than half of pre-school age children, and almost one
third of non-pregnant women. High malaria incidence and incidence of other parasitic
infections contributes to high anaemia prevalence.
Growth of economy
Economic growth in Zambia has been patchy and poor. GDP per capita measured in constant
2000 USD fell from 1990 to 1999, following a decline nearly two decades long (Siamusantu,
2009), after which it began rising again. Overall, the change from 1990 to 2011 is an increase
of only 14% in real GDP per capita terms (World Bank WDI).
Agriculture
Agricultural growth
Net production indices for Zambian crops, agriculture in general, and livestock seem to have
grown from about the mid-1990s. Cereals, which looked to be falling from 1990 to 2002 —
though volatile — took off after that point, particularly after 2008, which meant overall they
have a positive annual average growth rate of 3% in absolute terms, and 0.5% per capita, see
Figure D.2. Livestock production declined in per capita terms.
Despite this weak growth, Zambia is the only country of the case study locations where
agricultural contribution to GDP and employment in the agriculture sector have been rising
since 1990: farming accounted for 50% of all employment in 1990, but 72% in 2005 —
reflecting the low growth of other sectors in the economy.
Figure D.2 Agricultural net production indices and growth rates for Zambia, 1990-2010
Source: with data from FAOSTAT. Note: Numbers in the legend are the average annual growth rates of the series depicted from 1990-
2010.
50
100
150
200
250
300
19
90
19
91
19
92
19
93
19
94
19
95
19
96
19
97
19
98
19
99
20
00
20
01
20
02
20
03
20
04
20
05
20
06
20
07
20
08
20
09
20
10
Ind
ex:
19
90
-92
= 1
00
Agriculture, 3.4
Cereals, 3.0
Crops, 4.3
Livestock, 1.7
Agriculture per capita, 0.8
Cereals per capita, 0.5
Crops per capita, 1.8
Livestock per capita, -0.8

Smallholder agriculture’s contribution to better nutrition
81
Food availability — and its price
Diets in Zambia are mainly composed of cereals, predominantly maize, starchy roots and, to a
lesser extent, fruit and vegetables. The heavy dependency on a single staple, maize, makes it
especially vulnerable to droughts and floods, particularly for rural residents as urban farmers
diversify staples increasingly towards other crops like rice and sweet potatoes (Siamusantu et
al., 2009).
Per capita food supply, (production, including net trade and changes in stocks) in Zambia has
declined from 1990 to 2009 overall, though there have been some increases in sub-groups.
Most of the decline came from cereals, followed by sugar and sweeteners. Cereals and starchy
roots, which made up over 70% of staples in 1990 fell to just under 60% in 2009. Proportion
of calories supplied by oilcrops, pulses, fruits and vegetables, and sugar all increased slightly:
See Figure D.3.
Figure D.3 Stacked supply of different foodstuffs in kilocalories per person per day, 1990–2009, Zambia
Source: With data from FAOSTAT. Note: On average, people’s energy requirement is around 1800kcal/day.
There is little evidence of either improved supply of food in terms of quantity, or even in terms
of relative quantity changes that might indicate diets becoming more diverse: discouraging
statistics.
Maize production’s decline, particularly in per capita terms, contributes to food insecurity in
Zambia (Siamusantu et al., 2009). Owing, however, to rising wages, staple foods in Zambia
(and Kenya) have become more affordable over time:
Mason et al. (2009) show that average formal sector wages (in various public and
private sector categories) in urban Kenya and Zambia rose at a faster rate than
retail maize meal and bread prices between the mid-1990s and 2007. Although the
recent food price crisis partially reversed this trend, the quantities of maize grain,
and maize and wheat flour affordable per daily wage in urban Kenya and Zambia
during 2008–09 marketing season were still roughly double their levels of the mid-
1990s. (Tschirley & Jayne 2009)
Seasonal price volatility does continue to be significant, however, particularly in years with
smaller harvests. This volatility in prices contributes to food insecurity: See Figure D.4
0
500
1000
1500
2000
19
90
19
91
19
92
19
93
19
94
19
95
19
96
19
97
19
98
19
99
20
00
20
01
20
02
20
03
20
04
20
05
20
06
20
07
20
08
20
09
kcal
/ c
pai
ta /
day
Other animal products
Meat
Milk & eggs
Other vegetable products
Sugar & Sweeteners
Pulses
Oilcrops and Vegetable Oils
Fruits and Vegetables
Starchy Roots
Cereals

Smallholder agriculture’s contribution to better nutrition
82
Figure D.4 White maize prices in Zambia, 2004-2012
Source: With data from FAO GIEWS
Poverty
Overall poverty
Poverty rates in Zambia have shown slow improvement since the early 1990s. Poverty
prevalence as measured at the national poverty line fell from about 70% of the population in
1991 to just under 60% in 2010 (World Bank WDI).
Rural poverty
Rural poverty, over 90% in 1993, fell to 77% in 2006, but the largest reductions were in urban
poverty: already much lower than in rural areas, this fell from close to half of urbanites in
1991 to 27% in 2006 (World Bank WDI).
In absolute numbers, urban poor have shrunk slightly – from 1.5 to 1.1 million, but rural poor
have increased, from 4.3 to 5.9M people: See Figure D.5. In addition, income inequality is very
high in Zambia, among the highest in Africa.
Figure D.5 Poverty rates in absolute numbers, compared to urban and rural populations: Zambia, 1991-2006
Source: With data from World Bank WDI and population statistics from FAOSTAT
400
600
800
1,000
1,200
1,400
1,600
1,800
2,000Ja
n-0
4
Jul-
04
Jan
-05
Jul-
05
Jan
-06
Jul-
06
Jan
-07
Jul-
07
Jan
-08
Jul-
08
Jan
-09
Jul-
09
Jan
-10
Jul-
10
Jan
-11
Jul-
11
Jan
-12
Tho
usa
nd
s o
f K
wac
ha
White maize, national average, retail, nominal
White maize, national average, retail, real
4.9 5.2
5.8 6.2
7.1 7.3 7.6
3.2 3.2 3.3 3.4 3.8 3.9
4.1
4.3 4.8 4.9 5.2 5.3 5.6 5.9
1.5 1.5 1.4 1.4 2.0
1.1 1.1
0
1
2
3
4
5
6
7
0
1
2
3
4
5
6
7
1991 1993 1996 1998 2003 2004 2006
Millions of people
Rural population
Urban population
Rural poor
Urban poor

Smallholder agriculture’s contribution to better nutrition
83
Health
Under-fives mortality rate
On under five mortality, Zambia has the worst rates of all the case studies. Nonetheless, it has
been declining rapidly, faster than the rates of decline in LICs and LMICs on average: in 1990
the rate was 193 deaths per 1000 live births; by 2011 this had become 83 deaths per 1000.
While malnutrition and micronutrient deficiencies are important contributing factors to overall
morbidity and mortality among young children, major causes of under-five deaths were
reportedly: neonatal (23% of deaths in 2000-2003), pneumonia (22%) malaria (19%),
diarrhoeal diseases (17%) and HIV/AIDS (16%) (Siamusantu et al., 2009; citing WHO data).
Water & Sanitation
Zambia has seen only modest and disappointing progress in access to improved water and
sanitation. While about half the population had access to improved water sources in 1990, by
2010 this had risen to only 61%; below the average for low income countries in general (WDI
data). Access of the urban population in Zambia is reportedly good (according to World Bank
WDI), and it is the rural population where the most progress needs to be made. Rate of
improved access in rural Zambia appears to have stagnated from 2008.
Another source, Siamusantu et al., (2009), reported declining levels of access to good water
supplies from the early 1990s, as reportedly commercialization of water begun in the early
1990s has made it unaffordable for 40 to 60% of urban dwellers in Lusaka and the Copperbelt,
where most of Zambia’s urban population lives. They cited estimates of access to safe water
declining from 72% nationally in 1992 to 57% in 2002.
Progress with increasing access to improved sanitation has been less encouraging. Nationally,
percent of people with access to improved sanitation changed little; from 46% in 1990 to only
48% in 2010.
Female empowerment
Female schooling
Zambia’s progress on women’s empowerment has been disappointing. Young female literacy
levels increased only very slightly from 66% in 1990 to 67% in 2010. This rate dropped and
remained below the LIC average levels from 2005.
In 2002, the government has declared free education for all for grades 1-7 (primary
education) (CSO et al., 2003). This measure, coupled with expansion of school
facilities, curriculum development, provision of education materials, provision of
bursaries for vulnerable children and orphans (from primary up to tertiary level),
and improvement of equity and gender balance, had a positive impact on school
enrolment (OECD, 2006). The net primary enrolment ratio has increased for both
male and female pupils from 68% in 1999 to 94% in 2007, but disparities remain
between male and female rates of progression and completion of education
(UNESCO, 2008). In 2005, 89% of boys but only 66% of girls completed a full
course of primary education (UNESCO, UIS Statistics in brief, Zambia).
(Siamusantu et al. 2009)
Net enrolment ratio for primary school girls (2007-2010) was 94%, and net attendance ratio
82%. For secondary school girls, net attendance ratio (2005-2010) was only 36%.

Smallholder agriculture’s contribution to better nutrition
84
Teenage pregnancy rate
The adolescent fertility rate rose from 1997 to 2002, after which it fell, but only slightly, and
from extremely high levels, well above those for the LIC group. At 142 per 1000 in 2010, they
were the 7th highest in the world.52
Specific nutrition interventions
Zambia has had some success with iodine fortification. Serious shortfalls remain in iron and
vitamin A status. Sugar fortification with vitamin A was reportedly begun in Zambia, in 1998,
with only some success in urban areas. While fortification of sugar has worked successfully in
Latin America, in Africa where sugar consumption is not as high, it is not very successful
(World Bank, 2006).
Some success has also been seen in infant and young child feeding practices. Exclusive
breastfeeding for instance has increased sharply since the early 2000s (Siamusantu et al.,
2009).
Agricultural interventions for nutrition
Nutrition sensitive gender empowerment, home gardens, aquaculture and small livestock
There is plenty of potential for improving women’s status in Zambian agriculture. A recent
gender assessment for Zambia (Rozel Farnworth et al., 2011) reported that women typically
lack command over household assets which in turn inhibits their ability to take risks in
production:
Programmes aiming to integrate women into value chains generally pre-suppose a
certain level of resources and capabilities that enable them to take on the risks
inherent with engaging with value chains and entrepreneurship. Zambia’s gender
profile indicates that whilst women and men both face challenges to
entrepreneurship due to poverty, men are much more able to engage in risk taking
and grow their businesses due to their ability to build and command capital. This
ability is critically linked to the superior position of men in relation to the ownership
and deployment of household assets, and expenditure decisions. By way of
contrast, women within male-headed households generally depend on their ability
to maintain relations with male kin to secure access to productive assets. Their
decision-making capacity over the use of those assets is demonstrably low in many
cases. Female-headed households may well be able to take autonomous decisions,
but they frequently lack sufficient assets for truly viable livelihoods. To engage
women in value chain development will take several years of carefully staged
engagement and withdrawal.
Women’s disempowerment in Zambia is likely contributing to poor nutrition outcomes for
under-fives.
There is evidence however that agricultural interventions including home gardening, for which
women are often predominantly responsible, have positive outcomes for nutrition in Zambia.
For instance, the Empowerment of Women in Irrigation and Water Resources
Management for Improved Household Food Security Nutrition and Health (WIN)
programme in Zambia, which involved vegetable gardens and aquaculture had positive results.
Diversified vegetable production led to improved household incomes, better nutrition, and
provided new links to local markets which enabled some participating households to move
beyond subsistence level agricultural production. Fish production under the WIN programme
increased available protein at a household level as well as providing participants with a high-
value product for sale at local markets. The programme also involved food preservation and
post-harvest value added processing, which contributed to improved nutrition (Eckman 2005)
52 After Niger, DR Congo, Mali, Angola, Chad & Guinea.

Smallholder agriculture’s contribution to better nutrition
85
A positive example of small livestock interventions for nutrition can be found in Heifer
International’s final report for its Miyoba Women's Draft Cattle Project which ran from
2001 to 2007. They found significant evidence of improved nutrition and income for
participants, better employment, and more resilience in the face of natural disasters among
other benefits (Heifer International, Accessed 2012). An evaluation was able to document
substantial improvements in nutrition, income and assets, knowledge on basic care and
management of animals, children's access to education, and gender equity (Thomaz, 2011).
Bio-fortification
Like Ghana, Zambia is one of the initial target countries for dissemination of HarvestPlus high
vitamin-A maize.
Recent studies show orange maize is acceptable to consumers in Zambia, with potential to
compete with white maize even without nutrition campaigns — and could fetch a premium over
white maize where nutrition information is provided (Meenakshi et al., 2012).
As in other case studies, while potential for bio-fortified crops including OFSP and special types
of maize appears high, there is little documentation of uptake: it is suspected that these types
of intervention remain small scale.
Interpretation
Zambia is a case where not only agricultural but also overall economic growth has been poor.
On indicators of women’s empowerment it stands out as particularly disappointing.
Child care, health, schooling, all contribute as do highly risky and variable agricultural systems.
What could agriculture do for better nutrition in this case?
Similar to the Tanzania case, Zambian producers and consumers would benefit from
improved production, particularly yield, of staple foods, particularly (but not only
maize). This will help contribute to a dietary energy supply that is currently
insufficient to meet the population’s energy requirements (Siamusantu et al.,
2009).
Diversifying more into other staples, such as cassava, ought to help overcome
some of the risk associated with a single rainfed staple with poor drought tolerance
in a country where droughts have such a high return period.
Bio-fortification of staples, particularly maize could help.
Quality and diversity of available food is not good enough, contributing to
micronutrient deficiency (Siamusantu et al., 2009). As in the case of Bangladesh,
diversify to encourage better consumption of micronutrient rich food and diverse
weaning diets (combined with better education). Home gardens are a good way to
do this, and if women in particular are involved, could help empower women.
Working on agricultural development at the same time as improving the general health
environment, educating girls, and improving basic infrastructure, ought to pay dividends in
nutrition rates of Zambian children.

Smallholder agriculture’s contribution to better nutrition
86
Annex E. Kerala: Focus on the fundamentals of health and education means Kerala is a leading Indian state for child nutrition
A case study of India would be a task beyond the resources available. Although Kerala is only
one state of India, with around 33M inhabitants, it is larger than Ghana and Zambia.
Populations and growth rates for the cases are shown in the figure below.
Figure E.1 Population and average annual growth rates (in boxes) of case study locations, 1990-2012
Source: With data from FAOSTAT and Indian Census data. Note: Kerala data was imputed using census data from 1981, 1991, 2001 and 2011
Observed changes in nutrition
Underweight and Stunting
Stunting rates fell from 36% in 1993 to 25% in 2005. Surprisingly, then, rates of underweight
have seen no progress in Kerala from 1990 to 2010, remaining at just under one in four. It
appears the gains in reduced stunting are being offset by rising rates of wasting, from 13% to
16%. Relative to the national rate and rates in its neighbouring states however, figures for
Kerala are better: indeed, Kerala has the lowest rate of stunting in all Indian states, and the
fourth lowest rates for underweight amongst Indian states.
0
20
40
60
80
100
120
140
160
5
10
15
20
25
30
35
40
45
50
19
90
19
91
19
92
19
93
19
94
19
95
19
96
19
97
19
98
19
99
20
00
20
01
20
02
20
03
20
04
20
05
20
06
20
07
20
08
20
09
20
10
20
11
20
12
Po
pu
lati
on
in B
angl
ade
sh (
Mill
ion
s)
Po
pu
lati
on
(M
illio
ns)
Ghana Zambia Tanzania Kerala Bangladesh - R axis
Bangladesh: 1.7% per year
Kerala: 0.7% per year
Ghana: 2.5% per year
Zambia: 2.5% per year
Tanzania: 2.8% per year

Smallholder agriculture’s contribution to better nutrition
87
Figure E.2 Stunting and underweight rates in Kerala, compared to neighbouring states and the national average 1993-2006
Source: With data from WHO Child Growth Database. Note: 1999 figures are from IIPS & ORC Macro (2000), converted using the Yang & de Onis (2008) algorithm. No data is available for 1993 stunting in Tamil Nadu.
Micronutrient deficiencies
Anaemia rates in women in Kerala increased from 1998/99 to 2005/06, going from 23% in
1998/99 to 33% in 2005/06, although only 0.5% of women in either year had severe anaemia.
Children’s anaemia prevalence in Kerala barely moved from 1998/99 to 2005/06, and is high
at about 45%. Very few cases are severe in Kerala. Rates in Kerala are also better than the
rest of India.
While there are few data assessing iodine deficiency in Kerala, in one district of Kerala in 1999
school children were considered to be in a transitional phase from iodine deficit to sufficiency,
revealed by a total goiter rate in the children of 7.05 and a median urinary iodine level of 17.5
µg/dL (Kapil et al., 2002). In 2005/06, surveys revealed some 70% of children under five were
living in households with adequate salt iodization levels, while 74% of households were
estimated to have adequate salt iodization in 2005/06 (IIPS, 2007).
Vitamin A deficiency levels in Kerala are not a public health problem for young children. A
2001–2003 survey of children 1 to 5 years old indicated no night blindness.
Although there are no up-to-date figures for women’s vitamin A deficiency in the WHO
database, in a 1998/99 survey, women aged 15 to 50 in urban Kerala had rates of 1.20%
(slightly above the 1% WHO threshold), and women in rural Kerala had rates of 2.3%,
indicating a public health problem.
Growth of economy
Economic growth in Kerala has been disappointing over the last 20 years, lagging compared to
the rest of India and heavily dependent on remittances and tourism (Biswas, 2010). One
feature of Kerala that makes its economy unusual is the high dependence on emigrants
working overseas, particularly in the Middle East region, who send home remittances that
annually contribute as much as a fifth of gross state product (GSP) (Kannan & Hari, 2002).
35.6
27.7 25.1
20
25
30
35
40
45
50
55
60
19
90
19
92
19
94
19
96
19
98
20
00
20
02
20
04
20
06
% o
f ch
ildre
n u
nd
er
5 s
tun
ted
Kerala India
Tamil Nadu Karnataka
23.5 23.8 23.9
20
25
30
35
40
45
50
55
60
19
90
19
92
19
94
19
96
19
98
20
00
20
02
20
04
20
06
% o
f ch
ildre
n u
nd
er
5 u
nd
erw
eig
ht
Kerala IndiaTamil Nadu Karnataka

Smallholder agriculture’s contribution to better nutrition
88
Agriculture
Agricultural growth
In 2004/05, agriculture contributed 17% of Kerala’s Gross State Product (GSP), but by
2010/11 this is estimated to have fallen to 10.6% (Government of Kerala). Nonetheless, nearly
half of Kerala’s population is dependent on agriculture alone for income (Government of Kerala
data from around the mid-2000s.). Over 70% of Kerala’s agricultural land is reportedly used
by small or marginal farmers.
Dev (2012) estimated the average annual growth rate of agricultural production in Kerala from
1999/2000 to 2008/09 at only 0.55%, India’s second-worst performing state on this measure.
Kerala’s key agricultural staple is rice. However rice production has been shrinking since the
1970s when it began to be more cost-effective to produce rice in other parts of India.
Profitability of growing crops in general in Kerala is decreasing owing to a shortage of farm
labour, high land prices, and small size of holdings (PCI, 2008). Agricultural production has
consequently shifted towards perennial tree crops and home gardens which make up a
significant proportion of Kerala’s agricultural production (Mohan, 2004).
Food availability — and its price
Average calorie consumption in Kerala is lower than in India nationally, and appears barely
changed from 1965 kcal per rural person a day in 1993/94 to 2014 kcal per rural person a day
in 2004/05 (a 2.5% increase) and from 1966 kcal per urban person a day to 1996 kcal per
urban person a day (1.5% increase) over the same period. These statistics describe
consumption, and may not be comparable to the statistics in the other cases which show
supply. This might explain why the Kerala levels seem low; quite close to being insufficient.
Average protein consumption in Kerala is close to national levels for urban areas, and just
below national levels for rural areas. It has increased considerably from 1993/94 to 2005/06 in
both rural and urban areas, by 9.1% and 8.2% respectively.
Average fat consumption in Kerala is above the national average for rural areas, and only
slightly below the national average for urban areas. This has increased most strongly over the
period in question, by 25% in rural areas and by 21% in urban areas.
Compared to neighbouring states of Karnataka and Tamil Nadu, consumption in Kerala was
higher for average calories, protein, and fat. There was also less difference between urban and
rural areas as well.
Diets in Kerala are about half cereal-based, with the fraction slightly higher in rural than urban
areas. The contribution of cereals to the diet is lower in Kerala than in India nationally, and
also than the neighbouring states. Of the non-cereal products, pulses, nuts, and oilseeds
make up the next-largest share of calories. Fruits and vegetables share is low, though still
above national proportions. Meat, eggs and fish make up a considerably larger share in Kerala
than in the other regions to which it is compared, indicating potentially better consumption of
micronutrient-rich livestock foods.
Kerala saw moderate improvements in average women’s diversity of consumption from the
late 1990s to the mid-2000s.While on average, more women in Kerala consume chicken meat
or fish, eggs, and fruits in any given week than the national average, they lag behind the
national average on prevalence of consumption of green leafy vegetables and pulses.
Real rice prices in Kerala were relatively stable from the early 2000s to early 2008, after which
they became higher and more volatile. They have also tended to be a bit higher than in the
neighbouring state of Tamil Nadu. Real wheat prices in Kerala rose from the early 2000s to the
mid-2000s, and remained relatively flat across 2005 to early 2011, after which they dipped
and rose (Retail price information system, GoI).

Smallholder agriculture’s contribution to better nutrition
89
Poverty
Overall poverty
Kerala leads India on the Human Development Index. Poverty rates in Kerala have also
declined dramatically over the last few decades, from 25% in 1994 to 12% in 2010.
Rural poverty
Poverty prevalence in urban and rural areas appear to have converged. Rural poverty fell from
26% of the rural population in 1994 to 12% of the rural population in 2010.
Poverty in absolute numbers has fallen overall from 1994 to 2010, however it has risen slightly
in the fast growing urban population, see Figure E.3. While there were around 3.4 million rural
poor and 1.3M urban poor in 1994, there were an estimated 2.2M rural poor and 1.8M urban
poor in 2010.
Rural-urban gaps in Kerala are far less pronounced than in the other cases, where commonly
urban poverty prevalence is 10 percentage points below rural ones.
Figure E.3 Numbers of poor in Kerala compared to population, rural and urban: 1994-2010 estimate
Source: With data from India’s Planning Commssion, GoK 2006, Ghoshal 2012, and Indian Census data
Health
Under-fives mortality rate
The under-five mortality rate is one of Kerala’s most impressive achievements. At 16.3 per
1000 live births in 2006, it was well below the rate for India, LMICs, and MICs on average.
Childhood vaccinations levels in Kerala slipped slightly for all basic vaccinations from 1998/99
to 2005/06. They remain however at relatively high levels, with three quarters of children in
Kerala receiving all basic vaccinations, well above the average of less than half for Indian
children in general. The administration surrounding immunization also appears stronger in
Kerala, with a much higher percent using vaccination cards than do nationally and in
neighbouring states; even Tamil Nadu where rates of vaccination are slightly higher.
14.4
22.3 21.1
18.1
5.1
7.8
11.3
15.2
3.7 2.1
4.3 2.2 1.3 1.5 2.1 1.8
0
5
10
15
20
1994 2000 2005 2010
Mill
ion
s o
f p
eo
ple
Rural population
Urban population
Rural poor
Urban poor
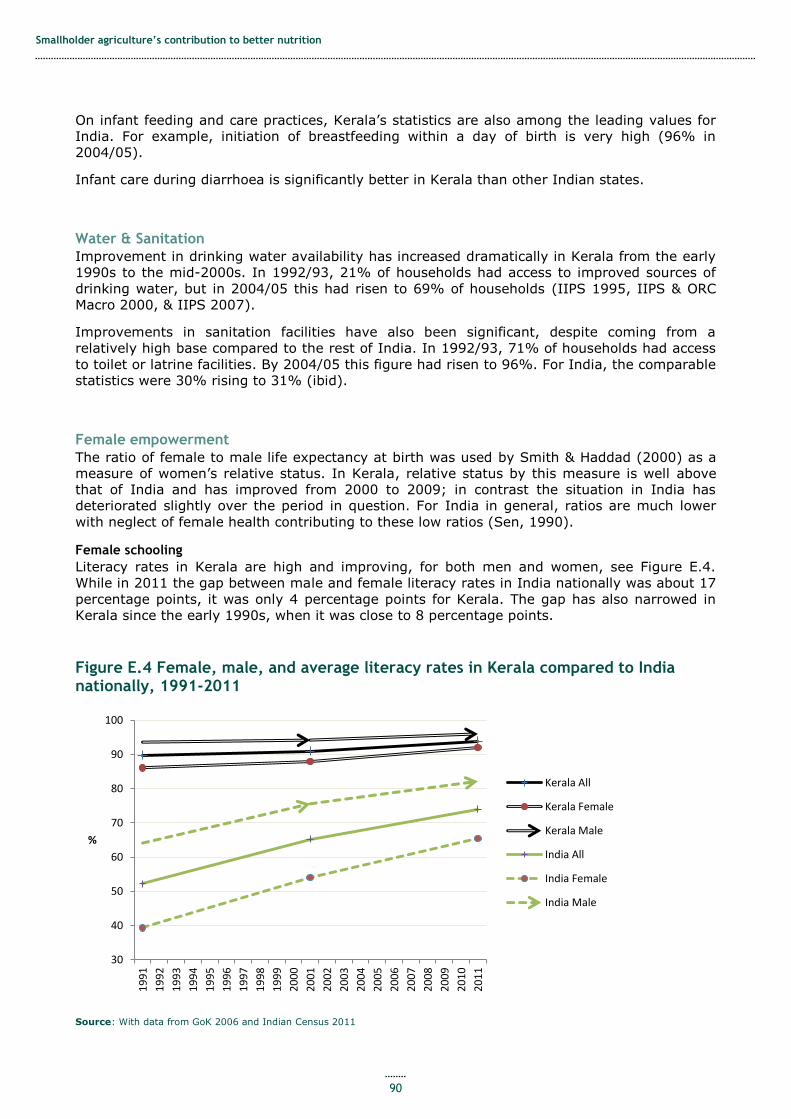
Smallholder agriculture’s contribution to better nutrition
90
On infant feeding and care practices, Kerala’s statistics are also among the leading values for
India. For example, initiation of breastfeeding within a day of birth is very high (96% in
2004/05).
Infant care during diarrhoea is significantly better in Kerala than other Indian states.
Water & Sanitation
Improvement in drinking water availability has increased dramatically in Kerala from the early
1990s to the mid-2000s. In 1992/93, 21% of households had access to improved sources of
drinking water, but in 2004/05 this had risen to 69% of households (IIPS 1995, IIPS & ORC
Macro 2000, & IIPS 2007).
Improvements in sanitation facilities have also been significant, despite coming from a
relatively high base compared to the rest of India. In 1992/93, 71% of households had access
to toilet or latrine facilities. By 2004/05 this figure had risen to 96%. For India, the comparable
statistics were 30% rising to 31% (ibid).
Female empowerment
The ratio of female to male life expectancy at birth was used by Smith & Haddad (2000) as a
measure of women’s relative status. In Kerala, relative status by this measure is well above
that of India and has improved from 2000 to 2009; in contrast the situation in India has
deteriorated slightly over the period in question. For India in general, ratios are much lower
with neglect of female health contributing to these low ratios (Sen, 1990).
Female schooling
Literacy rates in Kerala are high and improving, for both men and women, see Figure E.4.
While in 2011 the gap between male and female literacy rates in India nationally was about 17
percentage points, it was only 4 percentage points for Kerala. The gap has also narrowed in
Kerala since the early 1990s, when it was close to 8 percentage points.
Figure E.4 Female, male, and average literacy rates in Kerala compared to India nationally, 1991-2011
Source: With data from GoK 2006 and Indian Census 2011
30
40
50
60
70
80
90
100
19
91
19
92
19
93
19
94
19
95
19
96
19
97
19
98
19
99
20
00
20
01
20
02
20
03
20
04
20
05
20
06
20
07
20
08
20
09
20
10
20
11
%
Kerala All
Kerala Female
Kerala Male
India All
India Female
India Male

Smallholder agriculture’s contribution to better nutrition
91
Enrolment in education in Kerala is high, at more than 95% and much more equitable across
income groups compared to neighbours and the rest of India, see Figure E.5. These data,
almost two decades old, show education in Kerala has been equitable for some time.
Figure E.5 School enrolment of children in different income groups in rural Kerala, compared to India nationally and neighbouring states, 1993-94
Source: GoK 2005
Kerala is set apart from other states by its high literacy rate – much higher than in India, and
also substantially higher than in China, especially for women (Sen, 1990).
Kerala’s experience was one of state-funded expansion of basic education that begun two
centuries ago by the rulers of the kingdoms of what was then Travancore and Cochin53 -- and
consolidated by a left-wing state government from about 1957 (Sen, 1990, Sen, 1991).
‘The causal chain of Kerala’s exceptional record goes back in history and includes
among other things such steps as the public policy of “enlightenment” and
“diffusion of education,” clearly articulated by the reigning queen … as early as
1817. The high level of education also contributed to the development and
utilization of Kerala’s extensive public health services, by making the population
more informed, more articulate, more keen on demanding health services, and
more able to make use of what is offered...
Literacy and basic education have also contributed, it can be argued, to Kerala’s
radicalism, by making it easier to depart from the traditional mold of Indian
conservative politics.’ Sen (1991)
Teenage pregnancy
The adolescent fertility rate is low in Kerala: in 2008 it was only 18.3 per 1000 women aged 15
to 19.
53 These were two native states not part of British India that joined with a small part of the old Madras presidency to
form the new state of Kerala post-independence (Sen, 1990). In 1817, the queen of Travancore gave instructions for public support of education as follows: “The state should defray the entire cost of education of its people in order that there might be no backwardness in the spread of enlightenment among them, that by diffusion of education they might be better subjects and public servants and that the reputation of the State might be advanced thereby.” (Sen, 1990)
50
55
60
65
70
75
80
85
90
95
100
Kerala India Karnataka Tamil Nadu
Rural
Pe
rce
nt
of
child
ren
en
rolle
d in
sch
oo
l
<20,000
20,001 - 40,0000
40,001 - 62,000
>62,000
Household income, Rupees, 1993-94

Smallholder agriculture’s contribution to better nutrition
92
Specific nutrition interventions
Kerala has made great progress with salt iodization from the late 1990s to the mid-2000s.
While in 1998/99, some 48% of households did not have iodized salt (worse than the national
average of 28% of households), by 2005/06, 74% of Kerala’s households had adequately
iodized salt, and only 17% had no iodization of salt. In contrast, the national average levels of
iodization barely moved over his period.
Iron and folic acid supplementation for pregnant and post-partum women is also high in
Kerala, and has risen from already high levels in 1992/93 to 2005/06. The percent of women
using (given or bought) IFA tablets or syrup who had given birth in years just before the
survey went from 91% in 1992/93 to 96% in 2005/06, compared to national rates that rose
from about 51% to 65% in the same period.
Agricultural interventions for nutrition
Home gardens and small livestock
Home gardens are the main form of agriculture in Kerala, where the average size of holdings is
very small — in 1990/91, 84% of Kerala's land holdings were less than half a hectare (Mahesh,
2000) — and tending to reduce with further subdivision. Home gardens have emerged as a
result of these small farm sizes in lowland areas and from growing lack of competitiveness for
staple crops such as rice; the production of which has been shrinking in Kerala since the
1970s, as the state imports from other regions of India where rice is more economically viable.
Kerala's home gardens contain diverse species, tree crops as well as annual crops, pulses,
vegetables, and in many cases animals — most commonly cattle and poultry. They are thought
to be sustainable and efficient systems (Mohan, 2004; Salam et al, 1995). In the smaller
gardens, households consume more than 50% of the produce, compared to about 20% for
medium, large and commercial sized farms (Mohan, 2004), so home gardens clearly have an
influence on food consumption in Kerala, with likely positive impacts for nutritional outcomes,
particularly where food types cultivated are of high nutritional value. The role of home gardens
in nutrition for Keralites however is not well documented and deserves more attention.
Bio-fortification
While sweet potato is produced widely in Kerala, how much is orange-fleshed is not clear.
While there is clear potential for production and consumption of bio-fortified crops to have a
positive impact on nutrition, as yet there is little evidence of programmes involving bio-
fortification in Kerala.
Interpretation
Modern Kerala does deserve credit for consolidating and building on past
achievements. But the background to these developments has to be traced, to a
considerable extent, back to Kerala’s remarkable past, and we have to take note,
among other things, of its old policy of educational expansion. These issues are
important since the role of education, and in particular of female education, may
well be central to many problems of the contemporary world. Sen (1991)
Kerala has an unusual and enviable record on some of the basic determinants of nutrition,
such as education, female status and health care: particularly when compared to the rest of
India. Kerala shows how much can be done to improve child nutrition even where food
availability and agricultural progress disappoint. There are connections between education,
public activism, and the development and use of health facilities that are by no means unique
to Kerala (Drèze & Sen, 1989).
What could agriculture do for better nutrition in this case?
Smallholder farm development to improve incomes for Kerala’s smallholder farmers
would help as far as poverty alleviation is concerned, though there is no imperative
to improve food production for the sake of availability in Kerala, where sufficiency
can be met with supplies from other Indian states.

Smallholder agriculture’s contribution to better nutrition
93
Bio-fortification of staples and sweet potatoes
Diversify to encourage better consumption of micronutrient rich food and diverse
weaning diets. Home gardens and small livestock, already reportedly widespread in
Kerala, are a good way to do this, perhaps through promotion of more nutritious
products.

Smallholder agriculture’s contribution to better nutrition
94
Annex G. WHO classifications of stunting, underweight, and wasting indicators
Uses WHO Child Growth Standards adopted in
2006
Severity of malnutrition prevalence (%)
Low Medium High Very high
Prevalence of low height-for-age (stunting)
in preschool children
Children’s skeletal (linear) growth compromised due to constraints to one or more of nutrition, health, or
mother-infant interactions.
This is an indicator of chronic
nutritional deprivation.
<20 20 – 29 30 –
39 >=40
Prevalence of low weight-for-age
(underweight) in preschool children
This is a composite measure of child nutritional status, reflecting both chronic and transitory nutritional
deprivation.
This is a Millennium Development Goal indicator.
<10 10 – 19 20 –
29 >=30
Prevalence of low weight-for-height
(wasting) in preschool children
Children suffer thinness resulting from energy deficit and/or disease-induced poor appetite, malabsorption, or loss
of nutrients.
This is an indicator of transitory
nutritional deprivation.
<5 5 – 9 10 – 14
>=15
Source: Adapted from Table 7.1 in Alderman, Harold; Jere R. Behrman, and John Hoddinott. 2005. Nutrition, Malnutrition, and
Economic Growth, in eds López-Casasnovas, Guillem; Berta Rivera & Luis Currais. Health and Economic Growth: Findings and Policy
Implications. MIT & WHO website: http://www.who.int/nutgrowthdb/about/introduction/en/index5.html

Smallholder agriculture’s contribution to better nutrition
95
Annex H. Scaling Up Nutrition: the thirteen recommended direct interventions
Evidence Based Direct Interventions to Prevent and Treat Undernutrition
Promoting good nutritional practices ($2.9 billion):
breastfeeding
complementary feeding for infants after the age of six months
improved hygiene practices including hand-washing
Increasing intake of vitamins and minerals ($1.5 billion)
Provision of micronutrients for young children and their mothers:
periodic Vitamin A supplements
therapeutic zinc supplements for diarrhoea management
multiple micronutrient powders
de-worming drugs for children (to reduce losses of nutrients)
iron-folic acid supplements for pregnant women to prevent and treat anaemia
iodized oil capsules where iodized salt is unavailable
Provision of micronutrients through food fortification for all:
salt iodization
iron fortification of staple food
Therapeutic feeding for malnourished children with special foods ($6.2 billion):
prevention or treatment for moderate undernutrition
treatment of severe undernutrition (“severe acute malnutrition”) with ready-to-use
therapeutic foods (RUTF).
Source: SUN 2010, with costs taken from Scaling Up Nutrition: What Will it Cost? Horton, et.al. 2009
Note: Figures in brackets are the estimated costs of these for the 36 countries where 90% of malnourished children live.

Smallholder agriculture’s contribution to better nutrition
96
The Hunger Alliance is a joint DFID-NGO consortium which addresses food insecurity and
undernutrition and promotes predictable long term responses to food insecurity. We bridge
institutional differences between development and humanitarian responses to hunger (food
insecurity and undernutrition) in contexts that have a particular vulnerability to crisis. We share
information and generate learning around multi-faceted interventions to address food insecurity,
including livelihood support to vulnerable groups (such as women, smallholder farmers, pastoralists
and agro-pastoralists); safety nets and social protection and nutrition interventions. The Alliance
provides a forum for formalising agreement on specific aspects of policy, enabling parties to join
forces on policy influence and programming.
The following organisations within the Hunger Alliance supported this project:
Action Against
Hunger UK
Action Against Hunger is committed to ending child hunger. We work to save
the lives of malnourished children while providing communities with sustainable access to safe water and long-term solutions to hunger.
ActionAid
Founded as a British charity in 1972, ActionAid is an international NGO working in 45 countries worldwide, and our positions and recommendations reflect the
experiences of our staff and partners in Africa, Asia, the Americas and Europe. Our vision is a world without poverty and injustice in which every person enjoys the right to a life with dignity. We work with poor and excluded people to eradicate poverty and injustice.
British Red Cross The British Red Cross helps people in crisis, whoever and wherever they are. We are part of a global voluntary network, responding to conflicts, natural disasters and individual emergencies.
CARE International
CARE International is a leading humanitarian organisation which fights global poverty and provides lifesaving assistance in emergencies. We place special focus on working with poor girls and women because, equipped with the proper
resources, they have the power to help lift families and communities out of poverty. Last year, we worked in 84 countries assisting more than 122 million people
Christian Aid Christian Aid works in more than 40 countries across the world, in partnership with local organisations, the private sector, churches, and governments, to tackle the effects of poverty, as well as its root causes.
Concern Worldwide
Concern Worldwide helps the poorest people in the poorest countries to transform their lives. We seek out those who most urgently need our support,
and work with them through thick and thin to tackle poverty, hunger and disaster.
Oxfam
Oxfam GB delivers emergency assistance to people affected by disasters or conflict, and helps to build vulnerable people’s resilience to future crises. We also work with others on long-term programmes to eradicate poverty and combat injustice.
Save the Children Save the Children is the world’s independent children’s rights organisation. We’re outraged that millions of children are still denied proper healthcare, food, education and protection and we’re determined to change that.
Tearfund
Tearfund is a Christian relief and development agency working with a global network of churches to help eradicate poverty. Tearfund supports local partners in more than 50 developing countries and has operational programmes in response to disasters.
World Vision UK World Vision is a Christian relief and development organisation working with children, their families and communities to overcome poverty and injustice in 100 countries around the world.