Smaller, Closer, Dirtier - EDF
92
DIESEL BACKUP GENERATORS IN CALIFORNIA Smaller, Closer, Dirtier
Transcript of Smaller, Closer, Dirtier - EDF

DIESEL BACKUP GENERATORS IN CALIFORNIA
Smaller, Closer, Dirtier


Smaller, Closer, DirtierDIESEL BACKUP GENERATORS IN CALIFORNIA
AUTHORSNancy E. Ryan
Kate M. Larsen
Peter C. Black

Cover photo: Diesel backup generator. Photo by Kate M. Larsen
Our missionEnvironmental Defense is dedicated to protecting the environmental rights of allpeople, including the right to clean air, clean water, healthy food and flourishingecosystems. Guided by science, we work to create practical solutions that win lastingpolitical, economic and social support because they are nonpartisan, cost-effectiveand fair.
©2002 Environmental Defense
Printed on 100% post-consumer recycled paper, 100% chlorine-free.

iii
Acknowledgments iv
Executive summary v
CHAPTER 1Introduction 1
CHAPTER 2What is a BUG? 3
CHAPTER 3Where are BUGs found? 9
CHAPTER 4How are BUGs regulated? 15
CHAPTER 5What constitutes an emergency? 19
CHAPTER 6What are the health risks from BUGs? 26
CHAPTER 7How close is too close? 34
CHAPTER 8Who bears the risks? 47
CHAPTER 9Policy recommendations 54
Glossary of technical terms 57
List of abbreviations 62
APPENDIX AGIS data and methods used in this study 63
APPENDIX BRisk assessment methods and toxicity factors 64
APPENDIX CIntake fraction analysis approach 69
Notes 71
Contents

iv
Support for Environmental Defense’s work related to this report was generouslyprovided by the Hewlett Foundation, the Energy Foundation and the Stevenand Michele Kirsch Foundation.
The detailed mapping and geostatistical analysis contained in this report weremade possible by generous grants of software and data from the EnvironmentalSystems Research Institute of Redlands, California.
We owe a special thanks to our technical consultants for their significant con-tributions to this report. Julian Marshall and Professor William Nazaroff, of theUniversity of California, Berkeley conducted the health risk assessment of BUGs,and Howard Gebhart, Jessica Karras-Bailey and Andrea Hicks of Air ResourceSpecialists, Inc. completed the dispersion modeling. Garvin Heath of U.C. Berke-ley surveyed the literature on health risks from diesel engines.
We are grateful to Bill Pease and Kristin Lawton of GetActive Software forproviding data on background exposures to diesel pollution.
Our thanks also go out to the many state and federal agency staff who pro-vided data, answered our questions and commented on the technical analysis.
We would especially like to acknowledge the help and encouragement that wereceived at every stage of this project from members of the California Clean Dis-tributed Generation Campaign, part of a national initiative funded by the EnergyFoundation with support from the Pew Charitable Trusts.
We very much appreciate the efforts of several people who were instrumentalto the report’s production in many ways, including proof-reading, editing, photoresearch, data collection, other elements of production, and moral support. Wethank Marcia Aronoff, Audrey Bowers, Yolanda Cazessus, Allison Cobb, PeterKlebnikov, Jim Martin, Angela Sherry, Pam Vivian.
The opinions expressed in this report, and any error of fact or interpretation,are ours alone.
Copy editor: Margaret YamashitaArt direction: Janice CaswellDesign and production: Bonnie Greenfield
Acknowledgments

v
Late one Thursday afternoon in March, a massive power outage darkened muchof the University of California’s Berkeley campus. Classes ended abruptly, stu-dents were herded out of darkened dormitories, and the campus server went down.But the lights did not stay off everywhere on campus. Tucked away in basementsand behind buildings was a secret weapon, 40 backup generators or BUGs, 29 ofthem diesel-fired. During the blackout all but one were switched on to protectsensitive laboratory experiments, power dining facilities, and light hallways. Theirservice came at a steep cost, however. Toxic diesel exhaust from the BerkeleyBUGs wafted across the busy campus and into nearby residential and commercialareas. Alarmed to see plumes of smoke from exhaust outlets, several staff and stu-dents dialed 911.
Although there wasn’t a fire, there was still plenty to worry about. BUGs arelarge diesel engines, similar to those found in Greyhound buses, eighteen-wheeltrucks, or locomotives. Because they are intended to operate only in the rare eventof a power failure, they lack even rudimentary pollution controls. BUGs exposepeople living, working, and going to school nearby to high levels of toxic dieselemissions. Diesel BUGs emit smog-forming chemicals, fine particles and cancer-causing compounds at many times the rate of newer diesel engines with pollutioncontrols. At their worst, BUGs pollute up to 100 times as much as conventionalpower plants. This report analyzes the health impacts of BUGs and provides rec-ommendations on how these impacts can be lessened.
BUGS and California’s recent electricity supply shortagesThe California Air Resources Board (ARB) estimates there are more than 11,000diesel BUGs in the state. Regulators’ records indicate that BUG use increasedsubstantially from December 2000 to May 2001, when rolling blackouts occurred.
Faced with the threat of recurring outages, the administration of GovernorGray Davis developed a plan to use California’s largest diesel BUGs as blackout“busters,” a function for which they were never approved. Under the plan, BUGowners would have received cash payments to operate BUGs when power sup-plies got tight. Legislation was even proposed to roll back restrictions on BUGuse and provide taxpayer-financed cash incentives for companies to purchaseBUGs. Fortunately Californians were spared the predicted nightmare scenario offrequent summer blackouts, and these plans were never implemented. But someexperts predict California could face more shortages. If they’re right, BUGs couldonce again emerge as an under-regulated, highly polluting antidote.
BUGS remain a serious health threatEven if the shortages do not materialize, California’s newly expanded crop ofBUGs still poses a significant public health threat that merits greater oversight.Five influential governmental or scientific bodies have designated diesel exhaustas a probable or potential human carcinogen. Recent studies have found that dieselexhaust contributes more than 70% of the cancer risk from air toxics in the United
Executive summary

vi
States.1 The cancer risk from diesel exhaust is about ten times higher than allother toxic air pollutants combined.2
Diesel exhaust also has numerous acute and chronic noncancer effects, involv-ing the respiratory, neurological and immunological systems.3 Diesel exhaust con-tains or creates nitrogen oxides (NOx) and volatile organic compounds (VOCs),both precursors to ground-level ozone, or smog; carbon monoxide (CO); and par-ticulate matter (PM).
Especially worrisome is the fact that diesel BUGs emit fine particles at extremelyhigh rates. Studies have linked fine particles to many adverse health effects, includ-ing asthma, cardiovascular and respiratory problems, strokes, and heart attacks.4
Researchers estimate that as many as 60,000 Americans die prematurely each yearbecause of exposure to fine particles.5 Children, the elderly, and the ill (especiallythose who have existing respiratory problems) are particularly vulnerable.
California is swarming with BUGsThere are likely many more BUGs in California today than the 11,000 estimatedby the Air Resources Board before the electricity shortages. Regulators can onlymake informed guesses about the num-ber of BUGs, because until recentlysome air districts did not even requireBUG owners to get a permit. Regula-tors not only had no way of knowingwho had a BUG, they could not con-duct inspections to detect and penalizeunauthorized use.
Air quality regulators need to knowwhere the BUGs are, especially as BUGowners everywhere face growing incentives for unauthorized use. Foremost amongthese incentives are demand-response programs, which compensate customersacross the nation for cutting their use of grid power when electricity supplies aretight. While these programs can save consumers money and reduce the threat ofpower outages, they also tempt BUG owners to reap incentive payments by sub-stituting dirty BUG power for much cleaner grid power. The complex utility rates
for large commercial and industrial cus-tomers can create additional financialincentives for unauthorized BUG use.
Using data from the CaliforniaEnergy Commission (CEC) inventory ofnearly 4,000 large BUGs, Environmen-tal Defense found that most CaliforniaBUGs are clustered near where peoplelive, work, and go to school, as illustratedin Figure 3-2, page 10. Even within heav-ily urbanized regions BUGs are likely tobe found where populations are most
dense, as is the case in Los Angeles (see Figure 3-3, page 10). That means thepotential health damage caused by BUGs is compounded.
Figure 3-2. See page 10 for full-color version.
Figure 3-3. See page 10 for full-color version.

vii
The CEC BUG database, compiled in 2001, is based on permitting recordsfrom 27 of the state’s 35 local air districts. The Bay Area air district and somerural districts were unable to provide the necessary data because they did notrequire BUG owners to obtain permits, so they are not included in the database.The inventory documents the owner, location, and specifications of each BUG300 kilowatts and larger. The CEC inventory is the most complete record ofBUGs in California.
How close is too close: The Risk ZonePeople in close proximity to BUGs are exposed to more harmful diesel emissionsthan those living and working further away. In this report, Environmental Defensehas attempted to determine the “risk zone” for BUGs, or the area surrounding aBUG in which people are exposed to concentrations of diesel pollution that resultin unacceptably high health risks. We chose as a threshold a cancer risk of one permillion, consistent with regulatory benchmarks. Our analysis focused on five citieswhere most BUGs are located-San Francisco, Los Angeles, San Diego, Fresno,and Sacramento.
Even if BUGs are operated as little as 100 hours per year—the limit of typi-cal permits—the surrounding risk zone ranges from 63 to 118 acres. That’s 10 to20 average city blocks. In general, the more BUGs are used, the larger the riskzone. Since BUGs are concentrated in densely populated areas, expanding therisk zone means increasing the number of people exposed to unacceptably highlevels of pollution.
BUG HOT SPOTS ARE COMMON IN MAJOR CALIFORNIA CITIESOur risk zone analysis also demonstrates that many BUGs are located close enoughto each other that their risk zone circlesoverlap. Health risks may increaseconsiderably when individuals areexposed to emissions from more than oneBUG. Figure 8-5, page 52, shows that inthe San Diego area, BUG clusters occurboth inside and outside the core down-town area. We found many similar BUGhot spots throughout California in citiessuch as Los Angeles, Fresno, and Sacra-mento.
THE BURDENS FALL DISPROPORTIONATELY ON THE POOR, ELDERLY,AND MINORITIESBy integrating demographic data with the CEC BUG inventory, we show that ineach of the districts we analyzed, the population within the BUG risk zone ismore likely to be low income, elderly, and of a racial minority. While absolute dif-ferences are sometimes small, they are generally statistically significant, and thepattern of disparities is consistent across districts. In some instances the propor-tional differences are substantial: For example in the Sacramento metropolitan airdistrict the proportion of elderly residents within the risk zone is 26% higher than
Figure 8-5. See page 52 for full-color version.

viii
for the entire district. BUG areas also tend to have higher existing backgroundconcentrations of diesel pollution, so emissions from BUGS affect a populationthat is already disproportionately burdened.
BUGs affect the health of over 150,000 schoolchildren To better analyze the impact on children, who are most vulnerable to developingasthma or other respiratory ailments from air pollution, we examined the proxim-ity of primary and secondary schools to BUGs in the four surveyed districts. Wefound that over 200 schools are within the boundaries of a BUG risk zone (see“School children’s exposure to BUG emissions, operation as permitted,” below).Based on this mapping exercise and the average enrollment of a California school,6
we estimate that over 150,000 school children may be exposed to unacceptablyhigh emissions from BUGs in just the four districts studied. Statewide figureswould be significantly higher.
Schoolchildren’s exposure to BUG emissions, operation as permitted
Air district Schools within Risk Zone Estimated children enrolled
South Coast 140 96,600San Diego 27 18,630San Joaquin Valley Unified 34 23,460Sacramento Metro 18 12,420
Policy recommendationsCalifornia’s recent electricity shortages highlighted the critical role BUGsplay during outages, but also illuminated regulatory gaps and potential abuses.The California Air Resources Board (ARB) and many of the local air districtsalready have taken several important steps to remedy these problems.
Following are Environmental Defense’s recommendations to reduce toxicemissions from diesel BUGs.
• Adopt uniform permitting requirements for BUGsAll California air districts should require BUGs of 50 hp and larger to have per-mits so that local air regulators will know how many BUGs are in their districts,where they are located, and who owns them. This information will make itpossible for the districts to enforce appropriate restrictions on BUG use.
• Confine BUG use to emergenciesAir districts should ensure that BUG use is confined to true emergencies—those rare occasions when natural disasters or other events cause a loss of gridpower at the site where the BUG is located. All air districts should adopt the ARBdefinition of an emergency: “when electrical or natural gas service fails or emer-gency pumping for fire protection or flood relief is required.”7 Air districts alsoshould make clear that compensated curtailments do not justify BUG opera-tion. All load-shedding programs should explicitly forbid using BUGs to meet

ix
curtailment calls or respond to price signals. Program operators should requireBUG owners to inform the local air district of their participation in real-time pricing programs, interruptible rates or other load-shedding programs.
• Require pollution controls on BUGsThe California Air Resources Board’s staff has proposed tough new emissionsstandards for BUGs to take effect in 2004. These call for BUG owners toreduce emissions of diesel PM by 85% and to comply with a 0.15 g/bhp-hrdiesel PM emission rate or to replace any existing BUG with one that meetsthe requirements for new BUGs. New or rebuilt BUGs greater than 50 bhpwould be required to meet an emissions standard of at least 0.15 g/bhp-hr.Environmental Defense supports adoption of these proposed standards bythe Board. In particular, the oldest engines-for which no retrofit technology isavailable to meet the new emissions standards-must not be grandfathered. Astrict timeline needs to be established for replacing or retiring these BUGs.
• Adopt effective enforcement measuresEven if emissions limits are implemented, effectively enforcing restrictionson operating hours will be essential to guarantee that emissions remainbelow acceptable levels. Because BUGs are expected to run only a few dozenhours per year, the proposed new standards allow BUGs to emit fine parti-cles at 15 times the rate allowed for prime engines, which typically run forhundreds of hours. The different emissions limits make sense only if BUGsstay within their allotted annual operating hours.
In addition to the ARB’s recommendation that air districts require run-time meters, BUG owners should be required to maintain records of hoursof operation, purpose of operation (i.e. testing, maintenance, emergency),and the nature of emergency hours. This data should be reported once ayear and made available to the public.
To ensure honest reporting, the air districts should conduct routine inspec-tions of meters and run-time logs. Once emissions limits are implemented,inspectors should verify that control equipment has been installed. At largefacilities, regular inspections should be expanded to include BUGs. The major-ity of BUGs, however, are located at facilities that would not otherwise beinspected. To provide an effective deterrent, a program of random inspectionsshould be instituted for these facilities, with severe penalties for violations.
• Use financial incentives to reduce pollution from BUGsThe legislature should consider providing direct financial incentives to retro-fit or retire the dirtiest diesel BUGs. In fact, $14 million allocated to lessenthe impacts of increased BUG use during last year’s electricity shortages wasaxed from the budget in the first round of cuts. It should be restored.
• Encourage alternative backup power sourcesCleaner options for backup power exist or are being developed. Althoughsome on-site fuel storage considerations must be addressed, fuel cells are anespecially promising alternative. Because fuel cells are a relatively new tech-nology, operating experience must be gained to ensure they are an efficient

x
and reliable option. Facilities planning backup power upgrades should intro-duce fuel cells to provide this experience.
• Protect the public’s right to know about risks from BUGsThe ARB plans to expand the inventory to include all BUGs. In addition todata on engine characteristics and type of use, Environmental Defense recom-mends that the inventory include information on engine location, ownershipand retrofit status. The legislature should allocate sufficient funds to ensure thatthe inventory will be comprehensive and that ARB can update it as new BUGsare permitted and retrofits are completed. The inventory should be available inan easy to access form on ARB’s Web site so that Californians can find outif there is a BUG near where they live, work, or go to school. In addition,the air districts should collect and make available data on BUG run-times.
Conclusion: The health risks of BUGs are too high to ignoreBy keeping essential functions running during an emergency, backup generators pro-vide a critical service. But BUGs are the dirtiest form of power generation available,and their use threatens the health of millions in California and across the nation.These engines especially impact the health of the most vulnerable: children, theelderly, and low-income and minority groups. Increased reliance on BUGs sets adangerous precedent. Standards to reduce pollution from BUGs are criticallyneeded. In addition, BUG use should remain confined to true emergencies andcleaner alternatives should be put in place to protect the health of all citizens.

1
More than 11,000 diesel backup generators, or BUGs, can be found at Californiafactories, offices, data centers, government buildings, hospitals, sewage treatmentplants, and other facilities. BUGs are large diesel engines similar to those found inGreyhound buses, 18-wheel trucks, or even locomotives. Because they are in-tended to operate only in the rare event of a power failure, they lack even rudi-mentary pollution controls. When BUGs do operate—during emergencies butalso for routine testing and maintenance—their smokestacks belch out a highlytoxic brew of smog-forming chemicals, fine particles, and cancer-causing com-pounds. The height of a typical BUG stack is no more than a few feet, so the peo-ple living, working, and going to school nearby are the most affected. Eventuallya BUG’s emissions are dispersed, adding to the already excessive exposure to dieselpollution that most Californians face.
Before California’s recent electricity supply shortages, policymakers paid littleattention to BUGs. Indeed, many of the local air districts, which have primaryjurisdiction over BUGs, did not even require their owners to have permits. Thecrisis that began with surging wholesale electricity prices in the summer of 2000and progressed to recurring rolling blackouts between December 2000 and May2001 created new notions of what constituted an emergency. Facing dire predic-tions of dozens to hundreds of hours of outages during the upcoming summer,some California leaders looked to BUGs for salvation. Lawmakers and regulatorsdrew up proposals to systematically dispatch BUGs during stage 2 and 3 alertsand even to provide new financial incentives for businesses to buy BUGs. Sud-denly it appeared likely that these very dirty engines, which previously had oper-ated only during rare events like earthquakes, fires, and severe storms, might runfor hundreds of hours. Making matters worse, these measures would haveincreased BUG pollution during the summer afternoon hours when California’ssmog problems were already at their worst.
Fortunately, Californians were spared the nightmare scenario of frequent sum-mer blackouts that many experts had predicted. But even before it became clearthat conservation and new federal price caps would get them through the sum-mer, California air regulators, progressive legislators, and environmental groupsbanded together to prevent the implementation of such extreme measures. Plansby the administration of Governor Gray Davis to dispatch BUGs were quietlyshelved, and proposed legislation to provide tax credits for BUG purchasers diedin committee. But thousands of new BUGs were installed at facilities throughoutCalifornia, and the available evidence indicates that on average, BUGs were usedmore often during the energy crisis.
Depending on which expert you consult, today California is either emerging fromthe woods or in the eye of the hurricane. Optimists point to the host of new powerplants that have already come on line or are in various stages of regulatory reviewor construction. Pessimists worry about the difficulty that power plant developerscurrently face in financing new projects or note that federal price controls are setto expire later this year, once again exposing California to the ravenous powermarketers increasingly seen as the architects of last year’s crisis. If the pessimistsare right, shortages could soon return, and BUGs could once again emerge as the
CHAPTER 1
Introduction

2
antidote. Even if shortages do not materialize, California’s newly expanded fleetof BUGs still poses a significant public health threat that merits greater oversight.
This report presents the results of a comprehensive study of California BUGsconducted by Environmental Defense. Our analysis looks both backward and for-ward. Looking back to the summer of 2001, we ask what might have happened ifBUGs had been systematically dispatched as planned; what the health conse-quences would have been. Looking ahead, we evaluate the risks of both routinetesting and maintenance and the more extended operation of BUGs as distrib-uted, or small scale, power sources. Although the regular operation of BUGs toreplace grid power is illegal, they may be used anyway, because the air districts’limited enforcement capabilities mean that the detection and punishment of per-mit exceedances are highly unlikely.
We also look at how the health risks of BUG emissions are distributedthroughout California, using a detailed inventory of large BUGs developed by theCalifornia Energy Commission (CEC). By combining the CEC inventory withdetailed demographic, land use, exposure, and health status data in an integrateddatabase, we were able to examine the environmental justice implications of theincreased use of BUGs.
The remainder of the report is organized as follows: Chapter 2 introduces thekinds of engines typically used for emergency generation and offers a statisticaloverview of California’s BUG population. Chapter 3 analyzes the types of facilitiesat which BUGs are located and presents the findings on the geographic distributionof BUGs. Chapter 4 describes the regulation of BUGs in California. Chapter 5 out-lines the policy issues relating to BUGs, those that arose during California’s elec-tricity shortages as well as emerging concerns. Chapter 6 summarizes the scientificliterature on the health risks of exposure to emissions from diesel engines like BUGs.Chapter 7 describes the findings from the original research that EnvironmentalDefense commissioned, quantifying the public health risks of various scenarios ofBUG operation. Chapter 8 details the results of Environmental Defense’s geo-statistical analysis of the distribution of health risks from near-field exposure toemissions from BUGs. Finally, chapter 9 concludes the report with EnvironmentalDefense’s policy recommendations for California lawmakers and regulators.

3
Diesel generators are a common source of emergency backup power in Californiaand across the United States. A combination of low capital costs, quick start-up, andhigh overall efficiency have made diesel BUGs a popular option for both businessand residential consumers.8 Because BUGs are intended to operate only infre-quently, they lack even basic pollution controls, making them the dirtiest form ofdistributed power. Other sources of backup power exist, or are currently beingdeveloped, that will provide comparable efficiency and reliability in the case of apower failure, without jeopardizing the health and safety of those who live nearby.
Most people have seen the dirty black plume of exhaust spewed out by dieseltrucks or construction equipment. Diesel backup generators are similar to theseengines in size, but because they lack even basic controls, they emit more dangerouspollution (see Figure 2-1). The average BUG in the CEC inventory is about 600horsepower (hp), or about 450 kilowatts (kW),9 just slightly larger than the engineof an 18-wheel truck. Although the majority of BUGs in California are under300 kW, some diesel BUGs are as large as 2000 to 4000 hp (1.3 to 2.6 MW), thesame size range as locomotive engines. Figure 2-2 gives an idea of the size rangeof BUGs compared with other engine types.
BUGs represent just one subsection of a larger category of diesel engines.Diesel engines can be divided into stationary sources, those that generally remainin one location for their entire lifetime, and mobile sources, those that move fromlocation to location. Mobile sources include on-road engines, or all vehicles onthe road that run on diesel fuel, and off-road engines. This category includes vehicleequipment, such as cranes and bulldozers, and portable generators, many of which
CHAPTER 2
What is a BUG?
FIGURE 2-1A diesel BUG

4
are used in construction and moved from one work site to the next. Portables canalso be used as backup generators. BUGs fall under the stationary engine cate-gory, along with prime engines. Prime engines differ from BUGs in that they arepermitted to run on a regular basis, usually to supplement or substitute for energyfrom the power grid.
The greater dependence of businesses and public services on an uninterruptedsource of power and the current unstable energy situation in California has causedthe purchase and use of BUGs to grow (see Chapter 5). Indeed, because dieselBUGs and other forms of backup power often are vital to maintaining publichealth and safety, providing hospitals and other public services with a constantsupply of power, many of these facilities are required by building codes or other localordinances to have some form of backup generation on site in case of emergency.
Except for routine maintenance and testing, BUGs are usually permitted torun only during emergencies, which, in most air districts, means during an unfore-seen failure of the regular electric power supply from the grid or of on-site equip-ment (see chapter 4 for details of district regulations). When this happens, a BUGowner is allowed to operate the engine for as long as the facility is without power. Inthe event of an earthquake, flood, or fire, BUGs are also allowed to run, serving as
0 400 800 1200 1600 2000
BUGs
Cummins UndergroundMining Excavators
Cummins ISM SeriesTransit Bus
Peterbilt Model 379 Truck
Caterpillar 3500 SeriesMarine Engine
Caterpillar 3500 SeriesLocomotive
Engine size (kW)
FIGURE 2-2Size of BUGs relative to other common diesel engines

5
a power source for services such as pumping water and emergency lighting.10
BUGs are not required to meet the more stringent emission controls that apply tolonger-running prime and off-road engines. Prime stationary and nonroad enginesare required to be equipped with pollution control equipment that will allow themto pass federal Clean Air Act requirements for new or modified sources of air pollu-tion. Most air districts have established standards for nitrogen oxide (NOx) and car-bon monoxide (CO), although they have not set standards for diesel particulatematter (PM).11 BUGs are not required to meet such standards. The California AirResources Board (ARB) has proposed airborne toxic control measures (ATCM)for emissions of PM from all stationary engines, whether prime or emergency.
California’s BUG populationThe California Air Resources Board estimates that at present, more than 16,000diesel engines are located throughout the state, including both emergency standbyand prime engines.12 Using district permitting records and extrapolating fromcensus population data when district permit data were not available, the ARBestimated that more than 11,300 of these engines were BUGs. The ARB alsoestimated the diesel PM and NOx emissions for all engines and found that theemissions levels of the 4,804 prime engines were three times higher than those ofthe 11,300 BUGs. Note that these numbers are estimated, not measured, andassume that all engines are operated as permitted. Diesel prime engines, whichrun longer hours, are believed to have significantly higher aggregate emissionsthan BUGs. However, with the large number of BUGs in California, even a smallincrease in the number of these engines’ annual operating hours would mean adramatic increase in their total emissions.
In 2001, the California Energy Commission (CEC) compiled an extensive anddetailed inventory of diesel BUGs in the state, based on permitting records from 27of the state’s 35 local air districts13 (see Table 2-1). The Bay Area Air Quality Man-agement District (AQMD) and some rural districts were unable to provide thenecessary data because until 2001 they did not require BUG owners to obtain per-mits.14 This inventory documents the owner, location, and physical specifications ofeach BUG of 300 kW and larger that was permitted in the state before April 2001.
TABLE 2-1Summary of the California Energy Commission’s BUG inventory
NUMBER OF BUGS Total diesel generatingSource Diesel Non-Diesel Total capacity (MW)
South Coast AQMD 1,967 67 2,034 1,694San Diego County APCD 478 5 483 324San Joaquin Valley Unified APCD 302 11 313 219Sacramento Metro AQMD 281 5 286 223Monterey Bay Unified APCD 111 1 112 76Mojave Desert AQMD 59 3 62 35Yolo/Solano AQMD 58 1 59 47All Other Air Districts 215 69 284 215Total 3,471 162 3,633 2,833
* Only very limited data are available from the Bay Area AQMD. No data exist for Calaveras, Siskiyou, Modoc, Lassen, Tuolumne, Northern Sonoma, orNorthern Sierra Air Districts. Since these data are incomplete, they are omitted from this summary.

6
Although there are many BUGs smaller than 300 kW across the state, the CECinventory was originally compiled in order to catalog the larger BUGs available fordispatch to avert rolling blackouts during the energy crisis. Because the CEC inven-tory is the most complete record of BUG locations across the state, we chose to useit as the basis for our analysis and will refer to it throughout this report. It is importantto note that the CEC inventory is only a partial snapshot of California’s BUGs inearly 2001 and does not include the new BUGs acquired since that time.
The South Coast Air Quality Management District, which includes LosAngeles and surrounding communities, is home to more than half the BUGs inthe state. Almost one-third of the state’s BUGs are in San Diego, San JoaquinValley, and Sacramento. The majority of the documented BUGs in the state arediesel engines. Of the total number of BUGs listed in the CEC inventory, 96 per-cent use diesel fuel, and 93 percent of the megawatts are produced by dieselengines (see Figure 2-3).
PORTABLE ENGINESPortable engines, often referred to as off-road engines, are used all over Californiafor agricultural irrigation, commercial construction, dredging, drilling, and militarytactical support activities. Although they operate much like diesel BUGs, theseengines often are smaller and mounted on wheels for added mobility. The ARBestimates that more than 49,000 portable diesel-fueled engines are operatingstatewide.15 Approximately 85 percent of the state’s portable engines are located inthe five air districts surveyed in this report, with 16,000 in the South Coast districtalone. Most portable engines are used for short-term activities in various locations.Some facilities, however, regularly use portable engines, such as aircraft groundsupport at major airports, dredging equipment at harbors, waste reduction equip-ment at landfills, and oil and gas well drilling at oil and gas fields. Portable gener-ators are regulated at the district level by local registration and regulation programsand also a voluntary statewide registration program.16 During California’s recentpower shortages, portable engines were widely used for backup electricity supply.
7%
93%
Diesel MW
Non-Diesel MW
Diesel as percent of total MW capacity
FIGURE 2-3The majority of BUG generating capacity is diesel-fueled
Source: Derived from California Energy Commission, “BUGS 1: Database of Public Back-up Generators (BUGS) inCalifornia,” August 15, 2001.

7
Cleaner alternatives to BUGsAlthough diesel-fueled generators are the most widely used sources of distributedgeneration in California, other technologies provide the same reliability and powerbenefits without the high levels of air pollution associated with diesel. Figure 2-4shows the differences in polluting emissions from various distributed generationtechnologies, of which diesel BUGs and their alternatives are a subset. For everypollutant listed, diesel engines clearly rank the highest, with four times more CO andfive times more NOx emissions than natural gas engines, the second highest polluter.
Only a few sources of distributed generation are cleaner alternatives to dieselgenerators for backup power.17 Some technologies, such as alternative-fuel ICengines, are already commercially available. Emerging technologies, such as fuelcells, whose availability is currently limited, will be more widely accessible in thecoming months and years.
ALTERNATIVE-FUEL INTERNAL COMBUSTION ENGINESInternal combustion (IC), or reciprocating engines, are the most common distrib-uted generation technology. Although IC engines run primarily on diesel, theycan also use cleaner-burning fuels like natural gas, propane, gasoline, and landfillgas. Although most IC engines require pollution controls, their emissions rankthe highest of the distributed generation technologies. IC engines fueled by nat-ural gas, despite its being much cleaner than diesel, emit comparatively high lev-els of dangerous air pollutants.
FUEL CELLSFuel cells, first used as an energy source for U.S. spacecraft in the 1960s, haverecently been developed for use as distributed generation. Only one of the threetypes of fuel cells is now commercially available, but given the recent technologi-cal improvements and the large investments by NASA, auto companies, and util-ities, the market for this technology is growing rapidly.18
0
1
2
3
4
5
6
7
8
9
10
11
WindSolarFuel CellMicroturbineNatural GasEngine
Diesel Engine
CONOxPMVOCsSOx
Emis
sion
fact
ors
(g/b
hp)
FIGURE 2-4Polluting emissions from distributed generation technologies
Source: Distributed Utility Associates, prepared for the California Air Resources Board, Air Pollution EmissionsImpacts Associated with Economic Market Potential of Distributed Generation in California. June 2000.

8
A fuel cell converts hydrogen and oxygen into electricity and heat.19 It is muchlike a battery that can be recharged while power is being drawn from it. Butinstead of being recharged by using electricity, a fuel cell uses hydrogen and oxy-gen. Because natural gas is the primary source of this hydrogen, fuel cells havefewer emissions than from any other fossil fuel-burning technology. Besides theemissions associated with turning natural gas into hydrogen, the emissions fromfuel cells are mainly CO2 and water. With further development, especially inresolving difficulties with on-site fuel storage, fuel cells will be able to supply anemissions-free source of hydrogen.

9
BUGs can be found in commercial and office buildings, hospitals, and govern-ment facilities all over California, most often in or near urban centers where themajority of Californians live, work, and go to school.
California is swarming with BUGsFigure 3-1 shows that BUGs exist in every air basin but that most are found inthe South Coast and San Francisco air basins. Moreover, BUGs are not evenlydistributed across California or even within the air basins. Some are at isolatedsites on mountaintops or in the desert, but most are concentrated in densely pop-ulated areas. Figure 3-2 charts the correlation between population density andBUG location in California. Urban centers like Los Angeles, San Diego, andSacramento have the most BUGs. In sum, BUGs are where the people are.
This pattern is consistent within cities as well. Using the CEC inventory, weoverlaid the location of BUGs in major urban areas on population density datafrom the 2000 U.S. Census. Figure 3-3 shows that in the Los Angeles area, BUGstend to be clustered in the darkest shaded areas where the population is mostdense. This makes sense because BUGs are used in office buildings and commer-cial centers. We observed similar patterns for other major California cities.
Land use is important to consider when determining the types of people andplaces affected by BUG emissions. To better understand the distribution of BUGs
CHAPTER 3
Where are the BUGS found?
NorthCoast
Northeast Plate
Mountain Counties
Sacramento Valley
San FranciscoBay Area
LakeCounty Lake Tahoe
San Joaquin Valley
Great Basin ValleysNorth Central Coast
South Central Coast
South Coast
San Diego County
Southeast Desert
FIGURE 3-1CARB estimates of the number of diesel BUGs by air basin: 2000
Source: California Air Resources Board, "Diesel Risk Reduction Plan: Appendix 2 Stationary and Portable Diesel-Fueled Engines." page II-13, 2000.
Air basin No. of BUGsSouth Coast . . . . . . . . . . . . . . . . . . . . . . . . . . 5350San Francisco . . . . . . . . . . . . . . . . . . . . . . . . 2021San Joaquin Valley . . . . . . . . . . . . . . . . . . . . . 964San Diego . . . . . . . . . . . . . . . . . . . . . . . . . . . . 877Southeast Desert . . . . . . . . . . . . . . . . . . . . . . 548Sacramento Valley. . . . . . . . . . . . . . . . . . . . . . 544South Central Coast . . . . . . . . . . . . . . . . . . . . 428North Central Coast . . . . . . . . . . . . . . . . . . . . 207Mountain Counties . . . . . . . . . . . . . . . . . . . . . 197North Coast . . . . . . . . . . . . . . . . . . . . . . . . . . . . 95Lake Tahoe . . . . . . . . . . . . . . . . . . . . . . . . . . . . 44Lake County. . . . . . . . . . . . . . . . . . . . . . . . . . . . 32Northwest Plateau . . . . . . . . . . . . . . . . . . . . . . 28Great Basin Valley . . . . . . . . . . . . . . . . . . . . . . . . 9Total. . . . . . . . . . . . . . . . . . . . . . . . . . . . . . . 11344

10
NODATA
BUGsPopulation density 2000 1 dot= 5000 people
FIGURE 3-2Population density and diesel BUGs in California
BUGs
0–20002000–60006000–10000More than 10000
Population persquare mile
FIGURE 3-3Population density and diesel BUG location in the Los Angeles region

11
Selected land uses and BUGsin Los Angeles
Low density residential
County boundariesBUGsCommercial, industrial, transportationHigh density residential
FIGURE 3-4Land use and diesel BUG location in the Los Angeles region
0–10001000–20002000–4500More than 4500
Los Angeles County— employees per square mile
BUGs
FIGURE 3-5Employment density and diesel BUG location in Los Angeles County

12
for different land uses, we used U.S. Geological Survey (USGS) land coverage datato differentiate commercial, industrial, and transportation zones and high- andlow-density residential areas from regions where other land uses predominate.20
Figure 3-4 lays out our analysis of Los Angeles. When the city’s BUG populationis overlaid on the land use map, most of the area’s BUGs are found in areas usedfor commerce, industry, or transportation. But as the map also shows, these areasare closely surrounded by high- and low-density residential areas. This means thateven though most BUGs inhabit nonresidential areas, they still are very nearwhere people live. Similar patterns were evident for other California cities.
Because BUGs are used mostly during business hours, we next looked at notonly where people live but also where they work. Figure 3-5, which overlays theBUG locations on a map of worker density (employees per square mile) in LosAngeles County, shows that BUGs are also concentrated in areas where peoplework,21representing an additional risk to people working in urban and commercialcenters who are already heavily exposed to dangerous pollutants.
BACKGROUND EXPOSURESMost BUGs are found in areas of California where air pollution is already a seri-ous problem. According to Figure 3-6, the greatest concentration of BUGs is in
FIGURE 3-6PM10 concentration and diesel BUGs by air basin
The 2002 California Almanac of Emissions and Air Quality, Appendix B: Air Quality Trend Data by Pollutant: Ozone,PM10, CO, NO2, SO2
9.6–19.819.8–23.523.5–24.724.7–26.226.2–73
PM10 concentrationin µg/m3 by quintiles
BUGs

13
air basins with the highest particulate matter (PM) exposures. A growing body ofresearch has shown that particulate matter contributes to asthma, allergies, car-diopulmonary disease, and premature death. Even though the contribution ofBUGs to California’s overall particulate matter is small, incremental exposuresfrom BUGs in these already heavily polluted areas should be avoided.
FACILITIES WITH BUGSOur analysis of the CEC’s BUG inventory revealed that BUG ownership is highlydiverse. Because the CEC’s database provided the name of the facility where eachinventoried BUG is located, we were able to classify the BUGs by facility type:commercial/industrial, government and utilities, medical, telecommunications,and educational (see Figure 3-7).
Many BUGs are located at facilities where backup power is essential to, andrequired for, saving lives or protecting public health and safety. For example, 16percent are located at medical facilities, mostly hospitals. Facilities classified asgovernment and utilities account for almost a third of the classified BUGs andinclude city, county, and state government buildings and offices; prisons, policeservices, and military facilities. Facilities classified as utilities are municipal waterdistricts, sanitation facilities, and municipal or public utility providers.
Almost half the classified BUGs are located at facilities owned by privatecompanies, which we assigned to the commercial and industrial or telecommuni-
HospitalsMedical facilities, including hospitals, health clinics, and medical centers, makeup approximately 16 percent of classified BUG facilities from the CEC inventory.Today’s hospitals depend on electricity more than ever before. Almost everyaspect of patient care, especially monitoring and critical life support systems,depend on increasingly large supplies of reliable power.
National and state electrical codes have been upgraded to reflect the grow-ing need for an uninterrupted power supply. Regulations developed by severalauthorities, ranging from the National Fire Protection Association (NFPA), theJoint Commission on Accreditation of Healthcare Organizations (JCAHCO), to thestate of California, cover almost all hospitals that have emergency diesel gener-ators. The National Electric Code 517-13 and the California Electrical Coderequire all hospitals and critical care facilities to have backup power systemsthat can be running at full capacity within ten seconds after power failure.
Several leading hospitals are looking for alternatives to traditional diesel gen-erators, and fuel cells have proved to be clean and reliable. The major benefit of afuel cell system is its extremely low emissions. In addition, its design providesgreater protection against failure than does the average hospital diesel unit.
Many hospitals in California are currently upgrading their facilities to meetnew seismic requirements as well as the requirement of the Office of StatewideHealth Planning and Development (OSHPAD) that they have three days of backupgeneration in place. While switching completely to fuel cells may not be feasibleat present, the decision to introduce fuel cells slowly into the backup power mixat certain facilities will increase their operating experience and eventually lead toa wider range of options for cleaner, less polluting backup technologies.
Source: Clean Energy Group, Materials from “Draft Report on Fuel Cell and Health Care Project,” 2002.

14
cations categories. Commercial and industrial facilities include hotels; entertain-ment, manufacturing, electronics, financial, and insurance corporations; and com-munications. Many rely on backup generation to safeguard against businessdisruptions and the consequent financial losses.
Server farms, or data centers, are a prime example of a business that cannotafford to let the lights go out. Clustered mostly in Silicon Valley and parts of theLos Angeles metropolitan area, they require enormous amounts of electricity torun their computers. To ensure a reliable power supply, many have installed dieselBUGs. According to the CEC inventory, one company, Exodus Communica-tions, has 30 BUGs located at three different server farm facilities in the LosAngeles area.
Medical16%
Commercial/Industrial
32%
Education3%
Unknown/Other
5%
Governmentand Utilities
29%
Telecommunications15%
FIGURE 3-7Classification of facilities with BUGs

15
The primary responsibility for regulating diesel BUGs in California belongs tothe 35 local air quality management districts. Because no emissions controls arenow required for BUGs, the districts are concentrating on limiting the BUGs’annual number of operating hours and enforcing compliance with these limits.Until the California Air Resources Board draws up new emissions standards forBUGs and the BUGs are retrofitted or replaced, how well the local air districtscan regulate the operation of diesel BUGs will determine the impact of BUGemissions on public health and the environment.
Air quality management districtsWhile district permit requirements for most internal combustion engines requirecontrols on emissions of criteria air contaminants, most districts exempt dieselBUGs from such controls.22 Because BUGs are expected to operate purely in theevent of an emergency, or for basic testing and maintenance purposes, the districtsdo not require them to meet the same strict standards as those engines permittedto run more frequently.
Environmental Defense surveyed the permitting regulations of the five airdistricts that account for more than three-quarters of California’s BUG pop-ulation: the South Coast AQMD, San Diego AQMD, Sac Metro AQMD, Bay
CHAPTER 4
How are BUGs regulated?
TABLE 4-1BUG regulations and enforcement in the five surveyed air districts
District Minimum hp Year Max annual Max annual Run-time metersrequiring permits hours of hours for required?
permit first operation testing andrequired maintenance
Bay Area AQMD 50 hp 2001 Unlimited 100 hours Required for allemergency (200 for BUGs>50hp butsituation hours essential not all equipped
services)
SAC Metro AQMD 50 hp 1977 200 hours 100 hours Required for allpost-1991 BUGs;almost all enginesequipped.
South Coast AQMD 50 hp 1988 200 hours 50 hours Required for allnew BUGs; olderengines (pre-1990)not required.
San Diego AQMD 50 hp 1995 Unlimited 52 hours Required on allemergency post 11/00 enginessituation hours and by 2002 for all
other engines.
San Joaquin Valley APCD 50 hp 1991 Unlimited 200 hours Not required foremergency BUGs.situation hours

16
Area AQMD, and San Joaquin Valley APCD. As outlined in Table 4-1, the basicregulations for diesel BUGs are fairly consistent throughout the districts. OnlyBUGs 50 hp and larger are required to obtain a permit to operate23 but the dis-tricts did not always require BUGs of even this size to obtain a permit. In SanDiego, BUGs smaller than 500 hp were not regulated until 1995, and in the BayArea, all engines smaller than 250 hp were exempt from regulation until May2000.24
Hours of operationBecause their emissions are not now controlled, the pollution released from dieselBUGs is limited by the amount of time they run. The main permit condition fordiesel BUGs is a ceiling on the annual number of hours of operation. All the dis-tricts we surveyed cap the number of hours that a BUG may run for testing andmaintenance purposes. South Coast and San Diego set the limit at 50 to 52 hoursper year, respectively. The Sacramento Metro and Bay Area AQMDs set the limitat 100 hours, and the San Joaquin area’s BUGs and those located at essential pub-lic service facilities, such as hospitals and police stations in the Bay Area, areallowed to run up to 200 hours for testing and maintenance.25
Of the five air districts surveyed, only the Sacramento and South Coast dis-tricts place an upper limit on the annual number of hours of BUG operation. The200-hour annual maximum limit set by both districts is equivalent to running aBUG for more than half an hour a day, every day, for a year.
The critical determinant of overall run time, and ultimately the total amountof emissions from diesel BUGs, is the districts’ definition of what constitutes anemergency. Most air districts define an emergency as an unforeseen failure of reg-ular electric power supply from the serving utility or of on-site equipment or ofemergency water pumping in the event of a fire or flood.26
Enforcement and monitoringDetermining exactly when and for how long it is safe to run diesel BUGs is thefirst step in regulating their operation. It is the second step, enforcing these regu-lations and monitoring BUGs to ensure compliance, that is vital to preventing theserious health risks caused by diesel BUG emissions.
METERSFor its run time to be tracked accurately, a BUG must be equipped with a meterthat measures its hours of operation. Most BUGs purchased within the last fewyears come with a nonresettable meter that clocks its operation hours, just as theodometer on a car records the number of miles driven. But because many of theolder engines are not equipped with such meters, their run time cannot be reliablymonitored. Neither the Sacramento Metro nor the South Coast AQMD requiresthat engines purchased before 1990 have meters. Those bought before 1990 inSan Diego are required to install meters this year. The Bay Area AQMD, whichuntil now had no meter requirements, requires that beginning this year, all BUGsin its district be equipped with meters. And even though many BUGs in the SanJoaquin Valley do have meters, the district still has no meter requirements. This

17
lack of strict and uniform metering requirements throughout the state illustratesthe difficulty of ensuring compliance.
INSPECTIONAnother important aspect of enforcing permit restrictions is the districts’ inspec-tion and reporting systems. At all five of the air districts surveyed, inspection issupposed to be annual, but the staff at most districts admitted that BUGs wereoften inspected only once every two years or even less frequently. In many dis-tricts, the number of engines is far greater than the number of available inspec-tors, who must inspect both emergency generators and all engines permitted inthe district. Consequently, some districts extend the required time between inspec-tions; for example, the San Joaquin Valley APCD inspectors review smallerengines only once every three years.
During inspections, district personnel review the BUG owners’ records of theannual number of hours of operation. The BUG owners are required to keep theserecords for up to two years and to make them available to district inspectors uponrequest. Little is known, however, about the general frequency and length of BUGuse, as most districts have no centralized aggregate reporting of BUG run time.Instead, the districts use the number of hours permitted to calculate the totalnumber of hours run. Some districts are currently conducting studies to get a bet-ter idea of BUG run time. It is important to note, however, that without run-timemeters, inspection cannot consistently verify the number of run time hoursreported in operating logs.
When inspectors do find that a BUG has been run more than the number ofhours allowed by the operating permit, they can impose penalties on the owner,usually a monetary penalty, which can be up to $1,000 per day. In the Bay Areaand South Coast districts, BUGs consistently run more than the permitted hourslose their emergency standby status and are required to be retrofitted to meet thestricter emissions standards of a prime engine.
State and Federal policies for BUGsThe districts directly manage the permitting and enforcement of BUGs’ opera-tion, but they also incorporate the state and federal permitting requirements andguidelines in their programs. Federal regulation focuses on controlling mobilesources of diesel exhaust, and the U.S. Environmental Protection Agency (EPA)has established diesel fuel registration and formulation regulations that affect thefuels used by BUGs in California. Another federal regulation that applies to Cal-ifornia’s diesel engine population is the federal Clean Air Act amendments of1990 (CAA), which preempt state and local authorities’ control of emissions fromnew farm equipment under 175 hp. Because local air districts do not require dieselengines used as farm equipment to obtain a permit, their operation and emissionsare virtually unregulated.27
The state’s air pollution regulator, the California Air Resources Board, hasmore influence on diesel BUG regulation than the EPA does. Although the ARB’scentral responsibility is to control emissions from mobile sources of diesel exhaust,it also is responsible for guiding the local districts on setting standards and estab-lishing permitting requirements for stationary sources. The ARB’s Diesel Risk

18
Reduction Plan also provides support in reducing particulate emissions fromdiesel-fueled engines.
California’s Diesel Risk Reduction PlanIn 1998, following a ten-year review, the ARB identified particulate matter (PM)from diesel exhaust as a toxic air contaminant. Because of the high risk associatedwith PM, the ARB directed its staff to create a plan to significantly reduce dieselemissions. The Diesel Risk Reduction Plan (DRRP) proposes to reduce, in threesteps, diesel PM emissions by about 85 percent from current levels. The first stepsets new regulatory emission standards for all new on-road, off-road, and station-ary diesel-fueled engines and vehicles. The second requires that existing on-road,off-road, and stationary engines and vehicles be retrofitted with pollution controlswhen it is determined to be technically feasible and cost effective. And third, newdiesel fuel standards will be established to reduce the sulfur content of diesel fuelto ensure the best result from advanced diesel PM emission controls.
The DRRP also recommends the development of airborne toxic controlmeasures (ATCMs) to define emissions control requirements for emergency back-up generators. The plan places separate limits on PM emissions from new BUGsand on those already in use, treating them as two distinct categories. Although itstill is in draft form, the proposed ATCMs require both new and existing BUGsto meet strict PM standards of 0.15 g/bhp-hr by 2004.28 In contrast, existingprime engines will be required to meet a PM standard of 0.01 g/bhp-hr or to bereplaced with a new engine that meets the stricter standards.29 The more stringentrequirements for prime engines are based on the assumption that they operate formore hours than BUGs do. The ARB staff hopes to achieve the planned reduc-tion of up to 105 tons of diesel PM by 2010, reducing PM emissions by at least85 percent.

19
California’s more than 11,000 diesel BUGs were originally intended to be usedonly in emergencies such as fires, floods or earthquakes that caused a loss of gridpower on site. But in 2001, the collapse of California’s restructured electricitymarket and the utilities’ ensuing financial crises led to a near constant state ofemergency and new notions of what constituted an emergency. Rolling blackoutsacross the state and the extensive curtailment of those customers that opted forinterruptible rates during the winter and spring of 2001 confronted BUG ownerswith more (in some cases, a lot more) hours of service interruptions than experi-enced in a typical year, leading to an increased use of BUGs.
As summer approached, these unprecedented circumstances led policymakersto consider paying businesses to run diesel BUGs during peak load periods toprevent further rolling blackouts. Some local air quality management districtsrevised their restrictions on diesel BUGs’ run time to facilitate their use as black-out “busters.” Although blackouts and the systematic dispatch of diesel BUGswere averted last summer, neither threat has been eliminated: although powersupplies appear sufficient this summer, California’s notorious transmission bottle-necks may cause local shortages at any time of year. More ominously, the recentcancellations of several power plant construction projects raise the possibility thatthe boom-bust roller coaster of California’s electric generation sector may againbring blackouts. Furthermore, electricity rate schedules for large customers andnew load-shedding programs may provide financial incentives for unauthorizedBUG use in excess of permitted levels.
THE PROLIFERATION OF BUGS DURING THE ENERGY CRISISWith blackouts looming on the horizon, retailers, manufacturers, e-commercefirms, and local governments scrambled to make sure that service interruptionswould not disrupt their operations. Even though many businesses and com-munities made significant efforts to conserve energy, for some avoiding theblackouts also meant buying or renting BUGs. In January 2001, a Bay Area Cater-pillar dealer reported that the backlog for his $400,000, 2 MW generators hadgrown from two months to five months, and a Southern California generatorretailer observed that inquiries from frightened business people had increasedthree- to fourfold.30
Newspaper accounts of the energy crisis frequently described businesses’ andlocal governments’ plans to acquire diesel BUGs. For example, Costco wasreported to be considering buying or leasing BUGs for its more than 75 Californiastores,31 and high-tech firms Sun Microsystems, WorldCom, and Web site hostVerio all received permits for BUGs from the Bay Area AQMD.32 Municipalutilities also turned to BUGs to keep the power flowing when the indepen-dent systems operators (ISOs) could not deliver the juice. Alameda’s public util-ity leased four tractor trailer-size portable 1.5 MW diesel BUGs. Healdsburg,Santa Clara, and Palo Alto initiated similar backup plans for their municipalutilities.33 Municipalities bought or rented diesel BUGs to ensure that theiroffices34 and vital facilities such as sewage treatment facilities could operate duringa blackout.35
CHAPTER 5
What constitutes an emergency?

20
Home owners, too, sought insurance against anticipated blackouts. Home Depotsaw a surge in sales of portable, manual generators. “The sales are comparable tothe Y2K scare,” said a Corona Home Depot sales representative, noting that salesof portable generators had doubled since the onset of the crisis.36
The rush to acquire BUGs translated into a surge in permit applications sub-mitted to California’s local air regulators. In late 2001, the California Air Pollu-tion Control Officers’ Association (CAPCOA) surveyed its members to assess theeffects of the crisis on BUG ownership and operation and found that “a signifi-cant number of new engines were permitted and registered in California.”37 Twelveair districts, including the five most populous, responded to a survey of new per-mits for BUGs. These 12 districts reported that 3,064 new diesel BUGs had beenpermitted since the start of the crisis, in most cases at least a 400-percent increaseover previous permit activity. The CAPCOA was unable to obtain data on the useof portable generators but noted that “district inspectors have widely reported anincreased presence of the registered engines in the field.”
EXISTING BUGS MAY HAVE RUN MORE HOURSDue to the lack of centralized reporting of BUGs’ operating hours, less is knownabout how much longer BUGs ran as a result of the crisis. From the available sta-tistical and anecdotal evidence, it appears that the average run time did increaseduring this period, for two reasons. First, between June 2000 and December 2001,California experienced a total of 103 hours of rolling blackouts, 796 hours of stage3 emergencies, and 650 hours of stage 2 emergencies,38 and many BUG ownersturned to backup power during blackouts or in anticipation of them. BUGs alsomay have been used more often because of the ISOs frequent shutdowns of cus-tomers that had opted for the lower rates of interruptible power. Another reasonthat BUG use may have increased during the crisis is that their owners begantesting their engines more frequently to ensure that they would be available whena blackout actually occurred.
When power supplies first became tight during the summer of 2000, the Cal-ifornia ISOs began relying on a little known tool—interruptible contracts—tokeep the lights on. Interruptible contracts are special deals usually offered to largeindustrial and commercial customers that agree to cut their electricity use for alimited number of hours per year in exchange for lower utility rates. Participantswho fail to turn off their power when called are assessed penalties. After years offew or no curtailments, the utilities’ interruptible customers were called as manyas 20 times during the summer of 2000, and these calls resumed with increasedfrequency in December 2000 when the market meltdown began in earnest.Indeed, by February 2001 Pacific Gas & Electric (PG&E) had shut down thepower of its interruptible customers so many times that it had already reached theprogram’s annual ceiling of 100 hours. Southern California Edison (SCE) hadused 50 percent of its annual limit of 25 events or 150 hours.39 Pointing to themany years of discounted rates that these customers had received, the CaliforniaPublic Utilities Commission (CPUC) asked them to continue heeding the ISOs’curtailment calls voluntarily.
The ISOs’ extensive reliance on the interruptible contracts, however, turnedCalifornia’s power shortages into a financial emergency for these customers,which were confronted with difficult choices. Some accepted the business dis-

21
ruptions; others simply ignored the calls and accrued penalties; and some countedon their BUGs to help them weather the service interruptions. For example, air-plane parts manufacturer Moog Inc.’s Torrance operations plant first responded toSCE’s curtailment calls by sending its 350 workers home, then accumulated thou-sands of dollars in fines, and finally looked to BUGs for economic salvation. Thecompany leased a 1500 kW diesel generator to supplement its existing 500 kWunit. Plant operations manager Dan Aynesworth told the Los Angeles Times, “Ifwe really get into a bind, we’ll run the damn generators whether the air qualitymanagement district likes it or not. We won’t be the only ones in this boat. I’mhoping that the gravity of this situation will allow the AQMD to relax the per-mitting requirements.”40
Such choices were especially hard for local governments and other publicentities participating in SCE’s interruptible program. Enticed by discounts andthe perception that outages were unlikely, many of them had enrolled in the pro-gram, even though they lacked the necessary operating flexibility. The result was apoor compliance rate.41
Faced with non-compliance penalties of $13,000 per hour, Ventura Countyendured 27 voluntary outages between June 2000 and February 2001.42 The black-outs disrupted work in county offices, delayed trials and crippled the main jail.Ventura County supervisors voted in May 2001 to purchase additional diesel gen-erators to supplement existing BUGs and ensure that back-up generation wasenough to keep the county’s Government Center running at 100% during thevoluntary shutdowns. The generators enabled the county to stay on the discountedinterruptible rate, avoiding penalties or quitting the program, which would haveobliged the county to repay the more than $300,000 in discounts it received dur-ing 2001.43
Evidence assembled by the CAPCOA and the South Coast AQMD stronglysuggests that BUGs did run more hours during the crisis. The CAPCOAsurveyed its members on changes in diesel fuel consumption, and the SouthCoast AQMD assembled a sample of data on engine run time between July 1999and September 2001. The CAPCOA concluded that as a result of the crisis,“existing engines experienced higher than baseline use.”44 Eight of the 11 air dis-tricts that responded to the survey reported that diesel fuel use at stationarysources had risen during the crisis. The greater use of BUGs by customers in theutilities’ interruptible programs may have accounted for some of the increase.CAPCOA noted anecdotal evidence that “the sources reporting the largestincreases in BUG use over the baseline have these contracts in place.”45 The sur-vey also uncovered anecdotal evidence of longer run times and operation incon-sistent with permits:
Districts have also identified other examples of increased engine operation,based on reports from field inspectors, complaint investigation, and isolated obser-vances. Examples include hospital operation to cut energy costs, banks runningBUGs to guarantee secure systems, increased municipal use of BUGs for a varietyof reasons, and load shedding and peak-shaving at industrial and commercialfacilities, as well as residential uses.46
Consistent with this anecdotal evidence, the CAPCOA also noted a 15 per-cent statewide increase in the production and sale of CARB diesel47, which theyconcluded was “significant during what is clearly an economic downturn.”48

22
Our analysis of the South Coast AQMD’s sample of engine run-time dataconfirms that BUG use was higher throughout the crisis.49 Figure 5-1 contraststhe average number of hours of BUG operation with the number of hours of stage1, 2, and 3 alerts by quarter for July 1999 through September 2001. During eachthree-month period from July 2000 to June 2001, the average number of hours ofBUG use was at least 20 percent higher than that during the corresponding period12 months earlier, before the crisis started. In the first three months of 2001, theaverage number of hours of operation was nearly double that of the same periodin 2000. January to March 2001 was the worst period of the crisis when 85 hoursof rolling blackouts occurred50 and interruptible customers were shut down mostfrequently. The South Coast AQMD data show that although most engines oper-ate no more than a few dozen hours a year, a few engines run much more. A hand-ful of engines reported operating for more than 300 hours that year. The SouthCoast AQMD’s survey also revealed that many BUG owners do not consistentlymaintain the records required for enforcement, that almost one-third of the per-mittees reported no data for at least one quarter.
BUGS AS BLACKOUT BUSTERSAs the summer of 2001 approached, genuine supply shortages loomed, and expertspredicted as many as 260 hours of rolling blackouts.51 State government officialsscrambling to secure all available electricity generation resources looked to a sys-tematic dispatch of BUGs as a means of avoiding outages. In May 2001, Gover-nor Gray Davis was reported to be considering issuing an executive order thatwould have paid BUG owners to operate during stage 3 alerts.52 S. David Free-man, one of Davis’s advisers, outlined the governor’s plan: “The backup generatorswill help us get through the summer.”53
In preparation for this initiative, Governor Davis directed the CaliforniaEnergy Commission (CEC) to investigate the generating capacity that BUGscould contribute to the grid. The CEC’s investigation resulted in the creation and
0
5
10
15
20
Ave
rage
num
ber
of o
pera
ting
hou
rs
0
200
400
600
800
1000
1200
Ho
urs o
f staged
alerts
July–Sept1999
Oct–Dec1999
Jan–Mar2000
Apr–June2000
Stage 3Stage 2Stage 1Weighted average operating hours
July–Sept2000
Oct–Dec2000
Jan–Mar2001
Apr–June2001
July–Sept2001
FIGURE 5-1BUGs operated more during California electricity shortages,summer 2001
Source: South Coast AQMD, California, ISO.

23
publication of the inventory of large (> 300 kW) BUGs that is the basis for theGIS analysis contained in this report. The inventoried BUGs, which account forfewer than a third of all the BUGs statewide, have a total generating capacity of3233 MW, equivalent to three nuclear reactors or ten new base-load gas-firedpower plants. Portable BUGs of more than 300 kW numbered 969 and addedanother 825 MW to the total.
Governor Davis was not alone in looking to BUGs to supplement the state’sgenerating resources. On May 3, 2001, San Diego Gas & Electric (SDG&E)sought permission from the California Public Utilities Commission (CPUC) fora new program that would pay customers to operate their BUGs during stage 3emergencies. The idea was that when the independent systems operators askedSDG&E to reduce its load during stage 3 emergencies, it could call on partici-pants to switch on their BUGs instead of instituting rolling blackouts. While theprogram would have reduced the number of unexpected outages for San Diegans,it also would have led to the systematic operation of participating BUGs, therebysignificantly increasing the surrounding population’s exposure to harmful dieselemissions. The San Diego AQMD filed comments with the CPUC supportingthe program.
Despite opposition from the ARB and environmental groups, the CPUCapproved a modified version of SDG&E’s plan, dubbed the Rolling BlackoutReduction Program.54 By August 2001, SDG&E reported to the CPUC that ithad enrolled 35 customers in the program. These customers owned 136 engineswith a total potential load reduction (and hence BUG capacity) of 73.56 MW.55
Although most air quality regulators tried to curb BUG use during the crisis,some legislators attempted to weaken their authority and make it easier for theBUGs to run longer. In February 2001, State Senator Rico Oller (R, Granite Bay)introduced a bill that would have suspended any state or local regulations thatrestricted BUG operation during stage 1, 2, and 3 emergencies. This bill couldhave allowed hundreds of hours of BUG operation, as there were more than 500hours of staged alerts between July and December of 2000,56 and the shortageswere expected to be much worse in 2001. Oller’s proposed legislation would notonly have exposed Californians to much higher BUG emissions, it would alsohave made taxpayers pay for the privilege. In addition, the bill would have creatednew incentives for Californians to buy BUGs, by providing a 100 percent taxcredit for the cost of buying and installing one.57 Fortunately, Oller’s bill stalled incommittee and never became law.
THE RESPONSE OF LOCAL AIR QUALITY REGULATORSThe blackout threat and financial pressures faced by interruptible customers shonea spotlight on the local air districts, which have primary jurisdiction over BUGs.The air regulators faced intense pressure to relax restrictions on the BUGs’ oper-ations to facilitate their use as blackout busters. But with a few exceptions, thedistricts generally held the line against an unconventional use of BUGs (to theextent permitted by their limited enforcement resources) and also helped discour-age implementation of some of the more extreme measures proposed at the heightof the crisis.
Some districts did, however, temporarily expand the definition of an emer-gency to allow BUGs to operate for extended hours. Executive orders issued by

24
the Sacramento Metro and South Coast AQMDs allowed essential services (e.g.,hospitals, police, prisons, schools) to operate their BUGs for 400 and 500 hours,respectively, during actual or imminent blackouts.58 The San Diego AQMD andthe San Joaquin Valley APCD altered their diesel BUG regulations to includeindependent systems operators’ stage 3 emergencies, in which their operatingreserve falls to less than 1.5 percent, as an acceptable circumstance for BUG oper-ation. The South Coast AQMD expanded its emergency allowance to includeboth ISO stage 2 and 3 electrical emergencies and actual or imminent blackouts.These modifications of district regulations, although temporary, greatly expandedthe allowance for diesel BUG operation throughout California during the sum-mer of 2001.
DEMAND RESPONSE PROGRAMS COULD LEAD TO WIDER BUG USENew programs being devised to prevent last year’s shortages may create newincentives for the unconventional and greater use of BUGs. Many of the studiesof California’s energy crisis stressed the importance of expanding programs thatmake electricity demand more responsive to short-term price fluctuations.59 Thecommon theme of all these programs is creating incentives or imperatives for par-ticipating customers to curtail their electricity consumption when supplies aretight and spot prices soar. Such programs can yield both financial and environ-mental benefits to all ratepayers by lowering utilities’ power procurement costs,reducing the operation of polluting peaking plants and deferring the building ofnew generating facilities.
Without proper safeguards, program participants may simply substituteenergy from dirty BUGs for costly but cleaner central station power. Apparentlyat least some interruptible customers fired up their BUGs last year when asked tocurtail their grid power use. Environmental advocates and air quality regulatorsrecognized this risk in 2001 when the California independent systems operatorswere designing their summer 2001 demand relief program, which offered cashpayments in exchange for load reductions during periods of peak demand. Cali-fornia air quality regulators successfully dissuaded the ISOs from recruiting BUGowners to participate in the demand response programs, but concerns remainedthat the programs might create new incentives for unauthorized BUG operation.Most California air districts do not consider compensated curtailments to beemergencies justifying BUG operation, but the ISOs’ confidentiality agreementswith program participants have stymied their enforcement. Air regulators have noway of knowing which permittees are participating in the ISOs’ programs. ISOsenior operations engineer Ali Amirali explained that “generation owners have theresponsibility to work with local air districts. We leave the onus on them.”60 ButCAPCOA chair Fred Thoits countered that the program created incentives thatencouraged BUG owners to gamble that they wouldn’t get caught, noting that“the ISO’s incentives to run dwarf our fines.”61
The role of backup generation remains a critical concern in designing demandresponse programs in California and elsewhere. Many utilities and independentsystem operators throughout the country now operate or are planning to operatesuch programs. Two recent studies of existing utility programs and tariffs foundthat customers with on-site generation (which includes, but is not limited to,BUGs) were more likely to participate in them.62 An analysis of Duke Power’s

25
dynamic pricing program found that “customers with self-generation respond sig-nificantly to electricity prices above a threshold point at which self-generationbecomes economical.”63 In a recent survey of 627 North American businesses byPrimen, the market intelligence affiliate of the Electric Power Research Institute,94 percent of those respondents who considered themselves strong candidates toacquire on-site generation in the next two years said that they “would be willingto dispatch their generators during peak demand if given the proper incentives.”Among the likely adopters (more than 10 percent of those sampled), 54 percentadmitted that diesel generators were their “preferred technology.”64 Unless BUGowners are explicitly prohibited from participating or air quality regulators areapprised of who they are, an increase in unauthorized BUG operation remains apotential drawback of these otherwise beneficial programs.
BUGS COULD BE USED AS “UNDER THE RADAR”DISTRIBUTED GENERATIONIn addition, some BUG owners may be operating their BUGs to save money ontheir utility bills. The complex rate structure for the large industrial and commer-cial customers that are most likely to own BUGs includes both energy anddemand charges. Just as it is on residential and small commercial customers’ bills,the month’s total energy use (measured in kilowatt-hours) is multiplied by anenergy charge. Energy charges for large customers are lower than for small users,because their bills also include one or more demand charges which are calculatedbased on their maximum rate of consumption during peak hours. Demand chargescan account for a substantial component of large customers’ monthly utility bills.Within a range of realistic assumptions about fuel prices, the cost of generatingelectricity with a diesel BUG exceeds the energy charges for large customers. ButBUG owners may be able to save by shaving their peak demand—and hence theirdemand charge—if they routinely run their BUG during hours when they expecttheir energy use to be highest. Savings are especially likely if a facility’s peakenergy use predictably occurs on summer afternoons, when system-wide demandis greatest and demand charges are highest. This would be the case for large officecomplexes whose summer demand for electricity is driven by the use of air condi-tioning. Large customers with sophisticated energy management systems mayunderstand their consumption patterns well enough to devise such strategies.

26
Diesel exhaust is a significant health concern. Formed mostly in the engines’ com-bustion process, diesel exhaust is a complex mixture of particles and hundreds ofgases. Five influential governmental or scientific bodies have designated dieselexhaust as a probable or potential human carcinogen; the U.S. EnvironmentalProtection Agency (EPA) is considering labeling it a probable human carcino-gen.65 In 1998, the California Air Resources Board (ARB) listed diesel exhaust asa toxic air contaminant (TAC).66 Because the EPA’s health assessment still is indraft form, this chapter relies on the California assessment as the most crediblereview to date of the health effects of diesel exhaust.
Recent studies have found that diesel exhaust contributes more than 70 percentof all cancer risk from air toxics in the Los Angeles air basin,67 in California,68 and inthe entire United States.69 The risk from diesel exhaust is about ten times greaterthan that from all other toxic air pollutants combined.70 Diesel exhaust also hasnumerous acute and chronic noncancer effects on the respiratory, neurological,and immunological systems of the human body.71 In addition, diesel exhaust con-tains or creates four of the six criteria air pollutants: nitrogen oxides (NOx) andvolatile organic compounds (VOCs), both precursors to elevated ground-levelozone, or smog; carbon monoxide (CO); and particulate matter (PM).
By far the largest sources of diesel exhaust are mobile sources (cars, trucks,trains, etc.), but a nonnegligible fraction of diesel particulate matter is emittedfrom stationary engines. This category includes engines used for agriculturalpumping, industrial processes, and backup electrical generation, or BUGs.72
Because most BUGs are located in densely populated urban areas and their emis-sions of pollutants are relatively high, BUGs could have an amplified effect on thehealth risks for people living or working nearby. This chapter surveys the evidencefor a range of the health effects from exposure to diesel exhaust.
WHAT IS DIESEL EXHAUST?Diesel exhaust occurs as a gas, liquid, or solid and is a result of the combustion ofdiesel fuel in a compression ignition engine. Its composition varies depending on thetype of engine, the operating conditions, and the presence of a control system,73
but it always contains both particulate matter and a complex mixture of hundredsof gases. The principal gases are nitrogen, oxygen, carbon dioxide, and water vapor,but diesel exhaust also contains carbon monoxide, nitrogen oxides, volatile hydro-carbons, and low-molecular-weight polycyclic aromatic hydrocarbons (PAH) andPAH-derivatives, some of which are known or suspected to cause cancer.74
Diesel particulate matter (DPM) is actually not one solid particle butgroups of spherical carbon particles clustered together to form irregular shapes(see Figure 6-1). The elemental carbon core can also contain small amounts oftrace metals.
By the time the diesel exhaust is released into the atmosphere, some of thegases are present as vapors (“Gaseous Hydrocarbons” in Figure 6-1), while othersstick onto the surface of the particles (the “Soluble Organic Fraction”). Because ofits large surface area, DPM can adsorb large amounts of organic materials, someof which have been identified as mutagenic or carcinogenic.
CHAPTER 6
What are the health risks from BUGs?

27
Particles are released from diesel vehicles about 20 times faster than thoseemitted by comparable gasoline-powered vehicles,75 a rate that may also apply tostationary diesel-powered engines. DPM is typically fine (< 2.5 microns) or ultra-fine (< 0.1 micron) in size; most of diesel exhaust particle mass has a diameter ofless than 10 microns, 94 percent less than 2.5 microns, and 92 percent less than1.0 microns.76 While most of the mass of DPM ranges from 0.1 to 1.0 microns,the majority of the particles (by number) are smaller than 0.1 micron. These“ultrafine” or “nanoparticles” have a greater surface area for a given mass and thusaffect a larger surface area of lung tissue than does an equal mass of larger parti-cles.77 Because of the preponderance of small particles, DPM is easily inhaleddeep into the lungs’ bronchial and alveolar regions, where their clearance is slowcompared with that of particles deposited on airways.78 Exposure to diesel exhaustis mainly a result of inhalation, with an undetermined but likely insignificant frac-tion from ingestion or through the skin.
More than 40 gaseous and particulate constituents of diesel exhaust are listedas hazardous air pollutants by either the U.S. Environmental Protection Agencyor the California Air Resources Board as toxic air contaminants (see Table 6-1).At least 21 of these substances are listed by the state of California as known car-cinogens or reproductive toxicants.
HEALTH EFFECTS OF VARIOUS COMPONENTS OF DIESEL EXHAUSTAn uncontrolled diesel engine emits 30 pounds of nitrogen oxides per megawatt-hour of electricity produced (lbs/MWh), whereas a comparable natural gas enginewithout controls emits 5.9 lbs/MWh.79 Diesel engines also contribute significantlyto particulate pollution. In California, diesel exhaust contributes 3 and 8 percentof the total statewide inventories of PM10 and PM2.5, respectively.80 Of thisamount, stationary and portable diesel electricity generators—the category thatincludes BUGs—account for approximately 7 percent.81 Because of the low num-ber of hours that BUGs are allowed to operate, they are estimated to contributeonly 0.5 percent of the total. But BUGs’ contribution to the overall health impactsof diesel pollution may significantly exceed their share of emissions because theytend to be located in densely populated areas.
Soluble organic fraction Soluble organic fraction
Gaseous hydrocarbons
FIGURE 6-1Schematic of diesel particulate matter
Sources: California Office of Environmental Health Hazard Assessment/Air Resources Board, “Proposed Identifica-tion of Diesel Exhaust as a Toxic Air Contaminant,” P. ES-5.

28
While much of the recent regulatory attention has focused on “whole dieselexhaust” and DPM, many of the individual components of diesel exhaust havehealth impacts worth noting. Diesel exhaust is found in ambient concentrationsof NOx and VOCs, both of which are harmful to the respiratory system.82 Withthe addition of sunlight, these chemicals combine to form ground-level ozone, orsmog, a known lung irritant linked to asthma attacks and respiratory illnesses.
Particles with a median aerodynamic diameter of less than 10 micrometers(PM10) have been epidemiologically associated with many adverse health effects,including asthma attacks in patients with preexisting asthma; admission to hospi-tals for cardiovascular and respiratory causes; and deaths from heart attacks,strokes, and respiratory causes.83 Other studies have shown that the associationbetween PM exposure and premature death is stronger for particle diameters ofless than 2.5 microns (PM2.5) than for PM10.84 Researchers estimate that asmany as 60,000 Americans die prematurely each year because of exposure to fineparticles.85 Because diesel BUGs emit fine particles at extremely high rates, thesefindings are especially worrisome for those exposed to high concentrations ofdiesel particulate matter.
HEALTH EFFECTS OF WHOLE DIESEL EXHAUST AND DIESELPARTICULATE MATTERAlthough the toxic contribution of each of the gaseous components of dieselexhaust is substantial, the EPA concluded that the total carcinogenic effect esti-mated for all these compounds does not account for the complete carcinogeniceffect of whole diesel exhaust.86 Only 50 to 90 percent of the mutagenic potency
TABLE 6-1Toxic air contaminants and hazardous air pollutants found in dieselexhaust
Acetaldehyde* Chlorine Methyl ethyl ketoneAcrolein Chlorobenzene Naphthalene*Aluminum Chromium compounds* Nickel*Ammonia Cobalt compounds* 4-nitrobiphenyl*Aniline* Copper PhenolAntimony compounds* Cresol PhosphorusArsenic* Cyanide compounds POM (including PAHs)Barium Dibenzofuran PropionaldehydeBenzene* Dibutylphthalate Selenium compounds*Beryllium compounds* Ethyl benzene SilverBiphenyl Formaldehyde* Styrene*Bis [2-ethylhexyl]phthalate* Hexane Sulfuric acidBromine Lead compounds* Toluene*1,3-butadiene* Manganese compounds Xylene isomers and mixturesCadmium* Mercury compounds* ZincChlorinated dioxins* Methanol
*This compound or class of compounds is known by the state of California to cause cancer or reproductive toxicity.See California EPA, Office of Environmental Health Hazard Assessment, “Chemicals Known to the State to CauseCancer or Reproductive Toxicity,” May 31, 2002.
Note: This list of toxic air contaminants either have been identified in diesel exhaust or are presumed to be in theexhaust, based on observed chemical reactions and/or presence in the fuel or oil. See California Air ResourcesBoard, “Toxic Air Contaminant Identification List Summaries, Diesel Exhaust,” September 1997, available online athttp://www.arb.ca.gov/toxics/tac/factshts/diesex.pdf.

29
of whole diesel exhaust, however, is associated with DPM.87 While neither the gasphase nor the solid phase alone explains the potency of diesel exhaust, studiesoften use DPM as a surrogate measure for exposure to whole diesel exhaust. Thus,depending on the study cited, the concentration of either whole diesel exhaust orDPM is used as the exposure metric.
Acute health effectsEven a brief exposure to diesel exhaust can have immediate respiratory, neurolog-ical, and immunological effects. Healthy volunteers exposed to diesel exhaust forone hour showed a significant increase in airway resistance and increases in eyeand nasal irritation.88 Other symptoms caused by exposure to diesel exhaustinclude coughs, headaches, light-headedness, and nausea.89 Epidemiological stud-ies of occupationally exposed individuals (e.g., bus garage workers and miners)found decreased lung function, increased cough, labored breathing, chest tight-ness, and wheezing.90 Although all epidemiological studies of workers have limi-tations—especially in regard to information about their exposure—theyconsistently show respiratory impairment and corroborate similar findings in ani-mal studies.91
Some experts believe that air pollution in general and DPM in particular maybe a cause of the greater incidence of asthma and other allergic respiratory dis-ease.92 Furthermore, exposure to DPM can induce allergic reactions and localizedinflammation in humans.93 Even more interesting, simultaneous exposure to DPMand ragweed pollen causes an allergic response greater than that from exposure toeither pollutant alone; similar results were found with Japanese cedar pollen inanimals.94 There also is some evidence that DPM exposed to ozone (at levels simi-lar to those found in polluted urban air) has an enhanced inflammatory effect onrat lungs compared with DPM not exposed to ozone.95 If confirmed, this resultcould mean that DPM in polluted regions, like many in California, is much morepotent than previously believed.
Chronic noncancer health effectsA number of chronic health effects have been associated with exposure to dieselexhaust, although the evidence for humans is more limited than it is for acuteeffects. Some studies have found that long-term exposure in occupational settingsproduced a greater frequency of bronchitic symptoms, cough, phlegm, and reduc-tions in lung function.96 Test animals provided additional results, including chronicinflammation of lung tissue and reduced resistance to infection in rats, as well assignificant noncarcinogenic pulmonary effects from long-term exposure in rats,mice, rabbits, guinea pigs, and primates.97 Based on the animal studies, the EPAestablished a chronic inhalation reference concentration (RfC) of 5 microgramsper cubic meter (µg/m3); California’s Reference Exposure Level (REL) is set at thesame concentration. An RfC or REL is the concentration below which no noncanceradverse health effects are likely to occur from a lifetime exposure (70 years), tak-ing into account sensitive populations.
CarcinogenicityNumerous governmental agencies and scientific bodies have determined the cancer-causing potential of exposure to diesel exhaust. Even though all acknowledge the
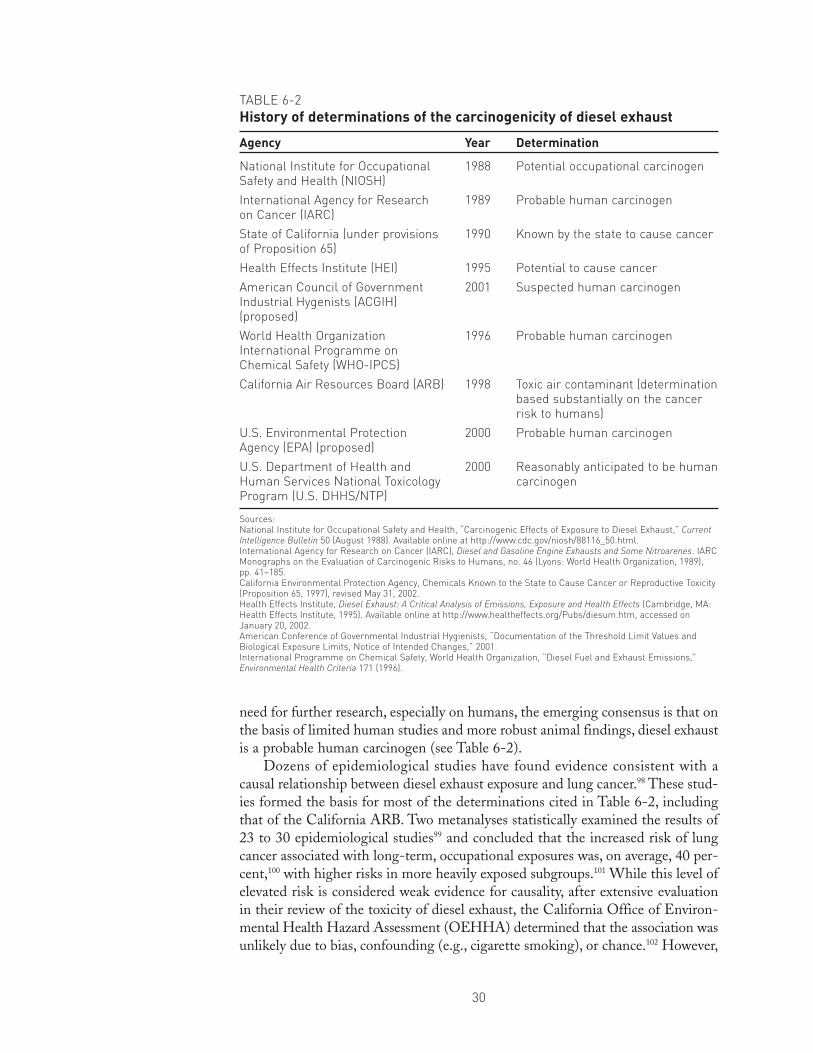
30
need for further research, especially on humans, the emerging consensus is that onthe basis of limited human studies and more robust animal findings, diesel exhaustis a probable human carcinogen (see Table 6-2).
Dozens of epidemiological studies have found evidence consistent with acausal relationship between diesel exhaust exposure and lung cancer.98 These stud-ies formed the basis for most of the determinations cited in Table 6-2, includingthat of the California ARB. Two metanalyses statistically examined the results of23 to 30 epidemiological studies99 and concluded that the increased risk of lungcancer associated with long-term, occupational exposures was, on average, 40 per-cent,100 with higher risks in more heavily exposed subgroups.101 While this level ofelevated risk is considered weak evidence for causality, after extensive evaluationin their review of the toxicity of diesel exhaust, the California Office of Environ-mental Health Hazard Assessment (OEHHA) determined that the association wasunlikely due to bias, confounding (e.g., cigarette smoking), or chance.102 However,
TABLE 6-2History of determinations of the carcinogenicity of diesel exhaust
Agency Year Determination
National Institute for Occupational 1988 Potential occupational carcinogenSafety and Health (NIOSH)
International Agency for Research 1989 Probable human carcinogenon Cancer (IARC)
State of California (under provisions 1990 Known by the state to cause cancerof Proposition 65)
Health Effects Institute (HEI) 1995 Potential to cause cancer
American Council of Government 2001 Suspected human carcinogenIndustrial Hygenists (ACGIH)(proposed)
World Health Organization 1996 Probable human carcinogenInternational Programme onChemical Safety (WHO-IPCS)
California Air Resources Board (ARB) 1998 Toxic air contaminant (determinationbased substantially on the cancerrisk to humans)
U.S. Environmental Protection 2000 Probable human carcinogenAgency (EPA) (proposed)
U.S. Department of Health and 2000 Reasonably anticipated to be humanHuman Services National Toxicology carcinogenProgram (U.S. DHHS/NTP)
Sources:National Institute for Occupational Safety and Health, “Carcinogenic Effects of Exposure to Diesel Exhaust,” CurrentIntelligence Bulletin 50 (August 1988). Available online at http://www.cdc.gov/niosh/88116_50.html.International Agency for Research on Cancer (IARC), Diesel and Gasoline Engine Exhausts and Some Nitroarenes. IARCMonographs on the Evaluation of Carcinogenic Risks to Humans, no. 46 (Lyons: World Health Organization, 1989),pp. 41–185.California Environmental Protection Agency, Chemicals Known to the State to Cause Cancer or Reproductive Toxicity(Proposition 65, 1997), revised May 31, 2002.Health Effects Institute, Diesel Exhaust: A Critical Analysis of Emissions, Exposure and Health Effects (Cambridge, MA:Health Effects Institute, 1995). Available online at http://www.healtheffects.org/Pubs/diesum.htm, accessed onJanuary 20, 2002.American Conference of Governmental Industrial Hygienists, “Documentation of the Threshold Limit Values andBiological Exposure Limits, Notice of Intended Changes,” 2001.International Programme on Chemical Safety, World Health Organization, “Diesel Fuel and Exhaust Emissions,”Environmental Health Criteria 171 (1996).

31
because most of these studies used inadequate measures of exposure, uncertaintiesremain as to whether diesel exhaust fully explains the cancer incidence observed.103
The composition of diesel exhaust and the results of animal and bioassaystudies provide additional evidence of its carcinogenicity. For example, DPM orextracts from DPM are mutagenic in bacteria and mammalian cell systems.104
Many other studies have shown that diesel exhaust causes mutation in chromo-somes and damage to DNA, processes that are believed to be important to thecausation of cancer.105 The carcinogenicity of diesel exhaust has been demon-strated in test animals based on inhalation bioassays in the rat and, with less cer-tainty, in mice.106 But even though rats show a consistent lung tumor response,mice and hamsters have not demonstrated the same response.107 Because of uncer-tainties in extrapolating results in animals to humans and in the animal resultsthemselves, OEHHA decided to base its risk estimates on the human data.108
SPECIAL RISKS TO VULNERABLE SUBPOPULATIONSEven more susceptible to the health effects of diesel exhaust are vulnerable groups,such as children, the elderly, the infirm (especially those who have existing respira-tory problems), and those who have predisposed their lungs to increased particleretention (e.g., from smoking, high particulate burdens from nondiesel sources).109
Recently, many researchers explored why children are an especially sensitive sub-population. Air pollution affects children more than adults because they inhalemore pollutants per pound of body weight and have a more rapid rate of respira-tion, narrower airways, and a less mature ability to metabolize, detoxify, andexcrete toxins.110 Children also spend more time outdoors engaged in vigorousactivities;111 athletes are similarly susceptible for this reason. Exposures that occurin childhood are of special concern because children’s developmental processescan easily be disrupted and the resulting dysfunctions may be irreversible.112 Inaddition, exposures that occur early in life appear more likely to lead to diseasethan do exposures later in life.113
HEALTH RISK ASSESSMENTSThe health risks of exposure to diesel exhaust are great. In fact, OEHHA stated thatthe “long-term exposure to diesel exhaust particles poses the highest cancer risk ofany toxic air contaminant evaluated by OEHHA.”114 The first major study to in-vestigate the contribution of diesel exhaust to people’s exposures to toxic air pol-lutants was the Multiple Air Toxics Exposure Study (MATES-II), conducted bythe South Coast Air Quality Management District in 1998 and 1999. The resultswere alarming: fully 70 percent of the cancer risk from air toxics for those living inthe Los Angeles air basin (one of the most polluted in the country) was due todiesel particulate emissions alone.115 As a result of this finding, the ARB expandedthe study to include all of California. The findings were similar: about 70 percentof the total inhalation cancer risk from air toxics for the average Californian is dueto diesel exhaust (see Table 6-3). This result is slightly lower than the estimate forthe United States as a whole: 80 percent of the total cancer risk from all haz-ardous air pollutants is associated with the inhalation of diesel exhaust.116
A concentration below which no carcinogenic effects are anticipated has not beendetermined.117 Based on the California exposure estimates, OEHHA calculatedthe range of cancer unit risk to be 1.3 x 10⁻⁴ to 2.4 x 10⁻³ (µg/m3)–1, with 3 x 10⁻⁴,

32
or, equivalently, 300 cases per million per (µg g/m3), as a reasonable point esti-mate.118 A cancer unit risk represents the probability of a person’s contracting can-cer (at the 95 percent upper confidence limit) as a result of constant exposure toan ambient concentration of diesel exhaust of one microgram per cubic meterover a 70-year lifetime.
The population time-weighted average diesel exhaust exposure concentra-tions across all environments (both indoors and outdoors) in California is esti-mated by OEHHA to be 1.54 µg/m3 in 1995 (2.2 µg/m3 outdoors and 1.5 µg/m3
indoors).119 OEHHA acknowledges that its analysis underestimates the true expo-sure because of the lack of data for areas with elevated exposures. An organizationof air quality control officers used the California data to estimate the concentra-tion of diesel exhaust throughout the country and found that on average, othermetropolitan areas would have concentrations one-half that of Los Angeles, andnonmetropolitan areas, one-tenth that of Los Angeles.120
Based on their exposure concentration estimates, OEHHA estimates that thenumber of potential additional cancer cases in California is 200 to 3,600 per year(assuming a 70-year lifetime exposure to diesel exhaust) at the exposure concentra-tions that it calculated.121 State and Territorial Air Pollution Program Administratorsand the Association of Local Air Pollution Control Officers (STAPPA/ALAPCO)used their national estimates of the exposure concentrations along with the Cali-fornia unit risk factor and estimated that across the United States, 125,000 addi-tional cancers are caused by exposure to diesel exhaust.122
These cancer-risk figures are derived from averages and, as such, do not rep-resent individuals’ actual exposures, nor do they take into account the greatersusceptibility of some groups, such as children, those with preexisting conditions, andthe elderly. In 1989, the National Institute for Occupational Safety and Health(NIOSH) estimated that 1.35 million workers were occupationally exposed to
TABLE 6-3Estimated statewide average potential cancer risk from outdoorambient air levels of air toxics for the year 2000
Compound Potential cancer risk* Percent contributionexcess cancers/million to total risk
Diesel exhaust PM10 540 71.21,3-Butadiene 74 9.8Benzene 57 7.5Carbon tetrachloride 30 4.0Formaldehyde 19 2.5Hexavalent chromium 17 2.2Para-dichlorobenzene 9 1.2Acetaldehyde 5 0.7Perchloroethylene 5 0.7Methlene chloride 2 0.3TOTAL 758 100.0
*Diesel exhaust PM10 potential cancer risk is based on 2000 emission inventory estimates. All other potential cancerrisks are based on air toxics network data: 1997 data were used for para-dichlorobenzene, and 1998 monitoringdata were used for all others. Measured concentrations are assumed to be equivalent to annual averageconcentrations, and the duration of exposure is 70 years, inhalation pathway only.
Source: California Air Resources Board, “Diesel Risk Reduction Plan,” October 2000, p. 16.

33
diesel exhaust, many at significantly elevated levels.123 Owing to population andeconomic growth, the numbers exposed today are probably much higher. Concen-trations of diesel exhaust PM10 near freeways can reach as high as 10 µg g/m3,124
and concentrations in occupational and other near-source settings may be evenhigher.125 Thus, individuals can be exposed to much greater cancer and noncancerrisk depending on where they live and work.
The ARB analyzed seven typical activities in which diesel-fueled engines areused and calculated the potential range of excess cancer risks; the results can beseen in Figure 6-2.126 They wanted to find out whether the operation of certaindiesel-fueled engines could expose nearby individuals to locally elevated DPMconcentrations. Their estimates assumed a 70-year exposure by the maximallyexposed individual at current concentrations. Ranges in the results are the resultof variations in assumptions of operating durations, stack parameters, facility sizes,and meteorological conditions, among other things. As can be seen from theseresults, being exposed to emissions from diesel BUGs could lead to an additional100 cancers per year in a population of 1 million people, or 1 in 10,000; if thosesame diesel engines were operated as prime engines (increasing their hours ofoperation from less than 100 to several hundred hours per year), the excess cancerrisk would increase nearly tenfold.
0 100 200 300 400 500 600 700 800 900
BUGŁ(operation as permitted)
Truck stop
Low-volume freeway
Distribution center
Prime engineŁ(unauthorized BUG use)
High-volume freeway
Potential excess cancers(chances per million based on 70-years exposure)
FIGURE 6-2Potential cancer risk range for activities using diesel-fueled engines
Source: California Air Resources Board, Risk Reduction Plan to Reduce Particulate Matter Emissions from Diesel-Fueled Engines and Vehicles, app. 5,p. 17, October 2000.

34
When a BUG is running, the people nearby are exposed to more harmful dieselemissions than are the people living and working farther away. Our initial GISanalysis, presented in Chapter 3, showed that BUGs tend to be clustered in partsof California where both residential and worker populations are most dense. Aquestion that naturally follows is, how close is too close? Put in another way, howlarge is the “risk zone” (the area surrounding a BUG in which people will beexposed to incremental concentrations of diesel pollution that result in acceptablyhigh health risks)? Other questions are, what are the most important health risksinside the risk zone, and how important are they? This chapter presents the resultsof studies commissioned by Environmental Defense that explored these questions.
While exposures to fine particles—and health risks—are greatest in theimmediate vicinity of a BUG, its emissions are dispersed into the atmosphere andcontribute to the background, or ambient, concentration of diesel pollution in theair basin in which it is located. A second question that Environmental Defenseexamined was how much the increased operations of BUGs would contribute tothe overall exposure to diesel particulate matter and the associated mortalitystatewide. This analysis concluded that even if the run time of California’s morethan 11,000 BUGs averaged as few as 25 hours per year, at least 20 deaths peryear would be attributable to BUG emissions. Many more deaths would resulteach year with an increase in the annual average number of operating hours, whichcould result from the systematic dispatch of BUGs as a peaking resource or fromthe extended (i.e., by several hundred hours) operation of a few BUGs in violationof permit restrictions.
METHODSThe health risk from toxic air contaminants emitted from diesel BUGs can beestimated as the product of three elements: (1) the quantity of contaminantreleased, (2) the increase in exposure concentration per unit release, and (3) therisk of adverse effect per unit increase in exposure concentration. The first ele-ment is determined by multiplying an emission factor by the amount of engineuse. The emission factor indicates the amount of pollutant emitted per unit ofengine use. Air dispersion models are used to evaluate the second element, whichis based on information about the emission’s characteristics and meteorology. Thethird element is addressed by toxicity values, which quantify the risk of an adversehealth outcome’s occurring because of exposure to toxic substances such as dieselparticulate matter (DPM) and its constituents.
Government data on emissions factors and a regulatory-approved air dispersionmodel were used to estimate exposures from BUG operations. EnvironmentalDefense commissioned Air Resource Specialists (ARS) from Fort Collins, Colorado,to conduct air dispersion modeling of generic BUGs using weather data from fiveCalifornia cities. Emission factors (EFs) were taken from the EPA’s compilationof emission factors, known as AP-42.127 The specialists used a standard air disper-sion model, Industrial Source Complex (ISC),128 to predict the increases in theambient concentration of diesel pollutants owing to atmospheric emissions fromindividual diesel BUGs. ISC is a regulatory-approved model typically used (e.g.,
CHAPTER 7
How close is too close?

35
when permitting new sources) to determine the impact of emissions on the sur-rounding community. Additional information on dispersion modeling and theanalysis performed by ARS is contained in Appendix B.129
Toxicity factors were derived from government sources and academic publica-tions. The initial phase of this process was a screening analysis of the varioushealth risks associated with exposure to BUG emissions. The purpose of this pre-liminary screening was to review the published literature on health risks fromdiesel emissions in order to (1) identify the substances and health end points forwhich the risk from BUG operations was greatest, and (2) determine toxicity fac-tors for these substances and end points to use in the health risk assessment. Thisanalysis was performed by researchers from the University of California at Berke-ley, who also conducted the health risk assessment described later in this chap-ter.130 Their findings are summarized next and described in greater detail inAppendix B.
The screening analysis encompassed three health risks typically considered ina health risk assessment for toxic air contaminants and that have associated toxic-ity values: acute, chronic cancer, and chronic noncancer risks. Acute health risks arethose resulting from short-term exposure, usually defined as less than 14 days,whereas chronic health risks are associated with long-term exposures, usuallydefined as longer than three months. The screening analysis also included anassessment, based on recent epidemiological evidence, of a new category: directmortality effects due to the inhalation of particulate matter. A growing body ofscientific literature has demonstrated that elevated ambient PM levels correlatewith increased rates of morbidity and mortality in exposed populations.
This screening analysis determined that the direct PM mortality risk posesthe single largest concern for the health effects of diesel BUG emissions. In addi-tion, of the three types of health risks typically considered in a risk assessment(acute, chronic cancer, and chronic noncancer), chronic cancer risk poses thelargest public health concern. This finding was based on a comparison of pub-lished values for chronic cancer and chronic noncancer toxicity. The most strin-gent constraint appears to be the cancer risk for diesel particulate matter, which isa mixture of many different chemical species. Based on the available data—whichare quite limited—acrolein was identified as the specific chemical constituent ofdiesel exhaust most likely to cause acute health effects.
A toxicity value for direct PM mortality risk was derived using informationfrom peer-reviewed literature for populationwide exposure surveyed in an articleby the chairperson and the chief deputy executive officer of the California AirResources Board (Lloyd and Cackette 2001). Based on Lloyd and Cackette’s esti-mated health outcome of 3,566 deaths/year in California owing to average ambi-ent levels of 1.8 µg/m3 of direct PM2.5, and a state population of 33 million,Environmental Defense’s consultants estimated that the toxicity was 60 deathsper million per year per µg/m3.131 Lloyd and Cackette based their estimates of thehealth effects from DPM on epidemiological studies that investigated the linkbetween ambient PM2.5 and population mortality. Given the size and chemicalcomposition of DPM, it is probably more toxic than ambient PM2.5. Thus, whilethe studies that Lloyd and Cackette cited probably represent the best availableevidence of the risk of direct mortality effects from DPM exposure, the valuesthey used were based on studies of ambient PM2.5, and they therefore may have

36
underestimated the true hazard posed by DPM. The values that Lloyd and Cack-ette derived represent the risk to the general public. But the risks to sensitive pop-ulations are likely to be even greater than for the general public. For diesel PM,we expect the list of sensitive populations to include young people, the elderly,and the infirm. It is important to note that this mortality risk is in addition to theother effects calculated in this report (e.g., the chronic cancer risk).
Toxicity for chronic cancer risk is typically expressed as the lifetime (70 years)risk of excess cancer cases per unit of exposure concentration. This value is multipliedby the lifetime average exposure concentration to obtain the incremental cancerrisk. According to the California EPA, the cancer risk potency of diesel exhaust is300 per million per µg/m3. This means that chronic exposure to one µg/m3 wouldyield a lifetime excess cancer risk of 300 cases per million people so exposed.
An important difference between the direct PM mortality risk and the chroniccancer risk is that the former is calculated based on one year of exposure, whereasthe later is calculated based on 70 years of exposure. While the PM2.5 risk valueof 60 per million per µg/m3 appears to be five times lower than the DPM chroniccancer toxicity (300 per million per µg/m3), the former occurs after only one-sev-entieth of the exposure, and thus after only one-seventieth of the intake. There-fore, the direct mortality risk is estimated to be 14 times higher than the chroniccancer risk (60 µg/m3 x 70 years of exposure equals 4,200 deaths per millionexposed per µg/m3, which is 14 x the chronic cancer risk of 300 per millionexposed per µg/m3).
PARTICULATE MATTER EXPOSURE FROM BUG OPERATIONARS conducted air dispersion modeling for Fresno, Los Angeles, Sacramento,San Francisco, and San Diego to find ground-level concentrations of PM10 on agrid surrounding a generic BUG.132 Then ARS developed three sets of results foreach model run:
• The annual average, which is used to evaluate the chronic cancer risk fromexposure to diesel particulate matter. These results were also used to esti-mate the direct mortality risk of PM2.5 exposure. Other chronic cancer andchronic noncancer risks were not evaluated because the available evidenceindicated that they were less stringent than the chronic cancer risk fromDPM.
• The maximum 24-hour average, which is used to evaluate the likelihood ofexceeding the state of California’s 24-hour PM10 standard of 50 µg/m3.
• The maximum 1-hour average, which is used to evaluate acute risks foracrolein and total PAH.
As illustrated in Figure 7-1, the results of air dispersion modeling are typicallypresented as isopleth maps. Like a topographic map, which uses contour lines torepresent a three-dimensional landscape in two dimensions, isopleth maps showhow the average concentration of a pollutant diminishes when moving away fromthe source.
Panels A, B, and C of Figure 7-1 present isopleth maps for PM10 emissionsfrom a 500 hp engine located in Los Angeles for 1-hour, 24-hour, and 1-yearaveraging periods, respectively. The 1-year averages represent average modeled

37
concentrations, and the 1-hour and 24-hour concentrations represent the highestmodeled concentration of PM10 at each point on the receptor grid. Note that themaximum modeled concentrations at various points on the receptor grid mayoccur at different days or hours, so the isopleth maps do not represent a snapshotof concentrations for any particular day or hour. Instead, panels A and B summa-rize extreme conditions over time and so are useful for determining whether reg-ulatory limits for maximum exposures may be exceeded at the site. Panel C, anannual average isopleth map, represents the average conditions in the vicinity of aBUG over all hours in a year. This type of map is most useful for understandingthe contribution of cumulative exposures to chronic health effects.
Note that even though the figures are for the same location, they differmarkedly in both shape and orientation. The isopleths of maximum 1-hour and24-hour concentrations occur in a roughly circular shape around the BUG. The
FIGURE 7-1PM concentration (µg/m3) isopleths for a generic 500hp BUG in Los Angeles
Note: Grid measures distance from BUG in meters.
(a) Maximum 1-hour (b) Maximum 24-hours
(c) Annual average

38
FIGURE 7-2Cancer risk isopleths for a generic 500hp BUG running 100 hours per year
Notes: (1) Grid measures distance from BUG in meters. (2) Isopleth lines show incremental cancer risk per million resulting from BUG operation.
San Diego
Los Angeles
San Francisco
Fresno
Sacramento

39
upwind and downwind concentrations are similar because the meteorology thatleads to the maximum 1-hour and 24-hour concentrations at a given distance islikely to occur at least once during a year when the wind is blowing from anydirection. In contrast, the annual average concentrations tend to be higher in theprevailing downwind direction. The reason is that the meteorology at a specificlocation tends to follow consistent patterns over the course of a year. The caseillustrated in panel C of Figure 7-1 shows that the winds in Los Angeles blowmost often from west to east but that the next most common direction is east towest. Therefore, the risks from chronic exposures in this region are concentratedin a west-to-east corridor in the vicinity of the emissions.
BOUNDING THE RISK ZONEBy combining the results of the dispersion modeling with toxicity factors forDPM, ARS was able to address the question, how close is too close? To summarizethe results of the dispersion modeling and facilitate its integration with the GIS-based BUG inventory, Environmental Defense used the concept of a risk zone.
A risk zone is defined as the farthest distance away from the BUG when theincremental chronic cancer risk from the BUG’s operation exceeds one per mil-lion. This definition of the risk zone is consistent with existing regulatory bench-marks, which establish the risk level that is small enough to be consideredinsignificant, or de minimus. For example, the California EPA defines de minimusto be one per million or fewer for chronic cancer risks,133 and OEHHA uses a riskof one per million to define risk zones in analyzing urban-air toxic “hot spots.”134
The 1990 Clean Air Act allows sources to be exempt from regulation and residualrisk to be considered negligible when posing a risk of fewer than a one in a mil-lion to the most exposed individual.135 In some instances, though, even a chroniccancer risk of less than one per million may not be considered insignificant.136
To determine the extent of the risk zones, it was necessary to translate theresults from the dispersion modeling, which are expressed as the concentration ofDPM in the vicinity of the modeled BUGs (measured in µg/m3), into chroniccancer risk. This was accomplished by multiplying the modeled annual-averageconcentration of DPM by OEHHA’s toxicity factor of 300 excess cancer cases permillion per µg/m3 of DPM. Figure 7-2 illustrates the results of this calculation fora 500 hp BUG running 100 hours per year during business hours (7:00 A.M. to7:00 P.M.). The figures present isopleth maps for five California cities expressedin terms of excess chronic cancer risk. In each diagram the contour line labeled“1/million” represents the boundary of the area in which the incremental cancerrisk from BUG operation under that scenario is at least one per million. Thismeans that within that area, operation of the BUG increases each exposed indi-vidual’s preexisting probability of contracting cancer by a factor of 1/1,000,000over a 70-year lifetime. It is important to note that the overall health risk in thisarea is actually much greater than one in a million, because the direct PM mortal-ity risk is so much greater than the chronic cancer risk.
As illustrated in Figure 7-2, the risk zone may extend hundreds of metersdownwind of a BUG. Table 7-1 shows that the size of the risk zone depends onhow a BUG is operated, which varies among air districts because of the differ-ences in meteorology. The table summarizes the risk zone parameters for a 500 hpengine for the five cities and three operating scenarios. In general, the risk zone

40
grows larger as the number of operating hours rises. The reason is that the cumu-lative annual emissions climb in proportion to the number of hours of operation,raising the total annual exposure at each point around the BUG. As annual expo-sures increase at every point on the receptor grid, people farther and farther fromthe BUG receive greater exposures, and the distance to a de minimus exposurelengthens. Appendix B contains a table summarizing this risk zone analysis foradditional operating scenarios for both 500 and 1500 hp engines.
Operating BUGs for more than 200 hours per year is not typical, nor is itgenerally consistent with permit restrictions. However, as discussed in Chapter 5,the systematic dispatch of BUGs to avert blackouts during California’s recentelectricity shortages may have meant that some BUGs ran as long as 500 hours,mainly during summer afternoons. Furthermore, the available evidence suggeststhat some BUG owners have, and in some instances responded to, economicincentives to substitute energy from their BUG for grid power. The systematicoperation of a BUG as distributed generation would mean that BUGs would runfor hundreds or more hours a year. This case is represented in Table 7-1 as Oper-ation as Distributed Generation. Note that while the downwind distance to therisk zone boundary increases with the number of operating hours, this trend doesnot occur in the upwind direction. The reason is that the scenarios differ in boththe number of operating hours and when those hours occur.137
In order to extrapolate this analysis to the entire BUG inventory for each airdistrict analyzed,138 Environmental Defense developed a simplified summary mea-sure of the risk zone. As illustrated in Figure 7-3, we substituted offset circles forthe irregularly shaped one-per-million contour lines shown in the isopleth maps.The circles are offset in the direction of the prevailing wind direction, and theirdiameter equals the sum of the distance to the one-per-million contour line in theupwind and downwind directions. Although the risk zone circles in some places lieoutside the one-per-million cancer risk boundary (since these tend to be somewhatelliptical), much if not all of the area they contain still has much more than a one-per-million overall health risk owing to the added risk of direct PM mortality.
TABLE 7-1Risk zone radii, or distance to one per million risk in meters
South Coast San San Joaquin San Diego SacramentoFrancisco Valley
Downwind Upwind Downwind Upwind Downwind Upwind Downwind Upwind Downwind Upwind
Scenario/wind direction NE SW SE NW SE SW SE NW NE SW
Operation as permitted410 160 410 220 660 120 650 120 500 90100 hours, per year
7 A.M.—7 P.M.
Summer 2001 BUG
720 0 1100 110 1500 220 1300 0 1300 140dispatch500 hours per year12—6 P.M.June—Sept. only
Operation as distributed
1400 660 1400 860 2600 600 2600 540 1700 500generation1,000 hours per year7 A.M.—7 P.M.

41
The risk zone parameters for the Operation as Permitted scenario provide thebasis for the geostatistical analysis presented in Chapter 8, which compares thedemographic composition and cumulative exposures of the population within therisk zone to the district at large.
Developing this simplified representation of the risk zones also enabled Envi-ronmental Defense to investigate the issue of BUG clusters, in which BUGs areclose enough to one another that people are exposed to emissions from more thanone BUG. Clustering could lead to a total impact from BUGs on a person orcommunity that is higher than the impact from a single BUG. Chapter 8 alsopresents the results of the analysis of BUG clusters.
INSIDE THE RISK ZONEThe cancer risk for people living or working inside the risk zone may be much
higher than one per million. Indeed, in that case, the isopleth maps depicted inFigure 7-2 show that the cancer risk exceeds ten per million within approximately
FIGURE 7-3Example of deriving risk zones for geostatistical analysis (100 annual hours), 500 hp engine
Risk zone

42
100 meters of the modeled BUG. In the majority of cases analyzed, the modeledconcentrations yield chronic cancer risks at or above ten per million within closeproximity of the BUG. In many instances, risks are this high even when BUGsare expected to run as few as 50 hours per year. This is significant because emis-sions leading to risks in excess of ten per million trigger California’s Proposition65, which requires that businesses139 provide a “clear and reasonable” warningbefore knowingly exposing people to carcinogenic chemicals.140 Since 1990, dieselengine exhaust has been included on the list141 of chemicals known to the state ofCalifornia to cause cancer, birth defects, or other reproductive harm.
Regulatory decisions are often made based on the risk at the location of ahypothetical maximally exposed individual (MEI). The analysis indicates thatlong-term health risks to the MEI from BUG operation are greatest on summerafternoons, precisely when they would have operated had they been dispatched toavert rolling blackouts during the summer of 2001. Figure 7-4 shows the esti-mated cancer risk for each city and modeling scenario, assuming 100 annual hoursof operation. This metric—the maximum ground-level concentration for annualaverage conditions—represents the long-term risk for the MEI who spends all hisor her time at the location of maximum average impact. In all five cases, the riskbased on the maximum-modeled concentration is much higher for the summer
0
20
40
60
80
100
120
140
160
FresnoSacramentoSan DiegoSan FranciscoLos Angeles
Can
cer
risk
per
mill
ion
All hours
Business hours
Summer
BUG operation scenario
FIGURE 7-4Maximum cancer risk from PM exposure, operation as permitted(100 annual hours), 500 hp engine
TABLE 7-2Number of violations of the State of California’s24-Hour PM10 standard: 1999
Air basin Number of violation days
Sacramento Valley 66San Diego 126San Francisco 36San Joaquin Valley 174South Coast 258

43
modeling scenario than for either the business hours or all-hours scenarios. Twofeatures of summer meteorology, increased air turbulence and more consistentwind direction, cause this pattern.142
Particle emissions from BUGs are high enough that extended BUG operationcould cause local exceedances of California’s existing 24-hour standard for PM10.Themodeled concentrations presented in this report represent incremental increases inconcentration attributable to a generic BUG. In reality, as shown in Table 7-2, BUGemissions take place in already polluted urban areas, where these health-based stan-dards are already routinely exceeded. BUG operation on days when there already areexceedances will exacerbate exposures, especially in the immediate vicinity of the BUGwhere the PM concentrations are most elevated. As illustrated in Figure 7-5, themaximum modeled 24-hour concentrations can be quite high. Although not highenough to lead to local exceedances of the 24-hour standards owing only to BUGemissions, these concentrations would be added to existing ambient concentra-tions, greatly raising the possibility that a BUG would cause localized exceedancesof the 24-hour PM10 standard. This risk would be compounded in cases in whichtwo or more BUGs in close proximity are operating simultaneously.
In addition to fine particulate matter, diesel exhaust also includes specifictoxic chemicals, such as acetaldehyde, acrolein, 1,3-butadiene, benzene, formalde-hyde, and polycyclic aromatic hydrocarbons, many of which have been found tobe carcinogenic or to cause acute health effects.143 Little is known about the ratesat which these chemicals are emitted by stationary engines (such as BUGs), andknowledge of their toxicities is also quite limited. A preliminary screening analy-sis identified acrolein as the chemical most likely to pose an acute health risk fromBUGs. Using the available data on emissions factors and toxicity values, Environ-mental Defense’s consultants tentatively concluded that the modeled 1-hour aver-age concentrations of acrolein do not exceed acceptable exposure levels for specificchemical compounds. This conclusion is tentative, because the data are incom-plete regarding emission factors and toxicity values for the whole suite of toxic aircontaminants emitted from BUGs.
0
2
4
6
8
10
12
14
16
18
20
SacramentoSan FranciscoFresnoSan DiegoLos Angeles
PM
10 (µ
g/m
3 )
California 24 hour PM10 standard: 50µg/m3
FIGURE 7-5Maximum 24-hour concentration of PM10, 500 hp BUG operating12:00–6:00 PM summer afternoons

44
Statewide Health Risk: Intake Fraction AnalysisAs Chapter 3 explained, BUGs tend to be concentrated in densely populatedareas where the air quality is already degraded. These are also the parts of the statewhere exposure to DPM is the highest. We have already used the results of dis-persion modeling to show how health risks in the immediate vicinity of a BUGwould be affected by increased operation. Even though the relatively small num-ber of people who live or work closest to a BUG will experience the greatestimpact from increased BUG operation, the entire population of the air basin willbe affected as the increased emissions elevate their exposure to ambient concen-trations of DPM. Now we use a novel method, the intake fraction approach,144 toquantify the populationwide health risks of operating BUGs. This approachfocuses on the chronic cancer and direct mortality risks resulting from increasedexposure to DPM. Unlike the risk zone analysis present earlier in this chapter,here we consider the health risks that would likely result from higher levels ofphotochemical smog caused by emissions of oxides of nitrogen from BUGs.
An intake fraction approach summarizes the impact of BUG emissions onthe total population’s intake of DPM and the incremental risk based on this expo-sure.145 Three pieces of information are needed to calculate the excess population-wide health-effect burden using an intake fraction approach: the intake-basedtoxicity, the total amount of emissions from the source, and the intake fraction forthe source. This analysis employs the same toxicity factors discussed earlier in thischapter. The total amount of emissions from all California BUGs were estimatedfor various operating scenarios using the AP-42 emissions factors just describedand the engine size and population data from the California ARB and CECinventories. The intake fraction for DPM emitted by BUGs was derived usingpublic data from the California ARB on emissions and ambient concentrations ofDPM in California’s most populous air basins.
The intake fraction is the fraction of emissions from a source that are breathed(taken in) by the exposed population. It is calculated as the ratio of the total intake,summed over all people, and divided by the total emissions. The intake fraction(iF) for inhalation of atmospheric emissions depends on three main factors:
TABLE 7-3Estimated annual excess cancer and PM mortalityper year of BUG operation
Average annual Chronic cancer cases PM mortalityoperating hours per year per year
per BUG of BUG operation of BUG operation
25 hours 1 2050 hours 3 40
100 hours 5 70250 hours 10 180500 hours 30 360
1000 hours 50 720
Notes:1. The mortality values in this table have been rounded from those in appendix 4 of the Health Risk Assessment
Study by Nazaroff and Marshall.2. These estimates assume BUGs operate at full capacity. If the BUG idles or runs at less than full load, emissions
and health risks may be lower.3. Based on the ARB estimate of 11,344 BUGs in California.

45
• The proximity between the source and those exposed.• The size of the population that is exposed to a source (and their breathing rate).• The persistence of the pollutant in the environment.
Most DPM derives from mobile sources, which, like BUGs, are widely dis-tributed throughout California’s air basins. Whether emitted by a mobile or a sta-tionary source, DPM is nonreactive on the time scale of airflow through a basinand thus equally persistent for the purposes of the iF analysis. Appendix C pre-sents the data and calculations used to derive the iF used here.
For the DPM from BUGs, the estimated statewide average intake fraction is15 per million. This means that 15 grams of DPM are inhaled for every milliongrams (metric tonnes) emitted by BUGs. This estimate is consistent with intakefractions of 7 to 31 per million previously calculated from similar data for primarynonreactive pollutants from well-distributed sources in major California air basins146
(South Coast, San Francisco Bay Area, San Diego, San Joaquin Valley, and Sacra-mento Valley).
Table 7-3 shows that the number of chronic cancer cases and PM mortalityfrom each year of BUG operation go up as the average annual number of runhours rises. Even an average annual run time of just 25 hours (which is consistentwith the South Coast AQMD’s precrisis data discussed in chapter 5) would leadto nearly two dozen deaths statewide each year based on the ARB’s estimate of11,344 BUGs in California. A fairly conservative regimen of running an enginehalf an hour per week for testing and maintenance would lead to 25 operatinghours per year. As the South Coast AQMD’s data and other anecdotal reportssuggest, many BUGs ran much longer during last year’s crisis, and the results pre-sented in Table 7-3 show that the higher number of run hours would have led tomany additional deaths. The widespread dispatch of BUGs—as the Davis admin-istration considered doing—could have caused dozens of extra deaths owing to
0
100
200
300
400
500
600
700
800
100%90%80%70%60%50%40%30%20%10%0%
PM
mor
talit
y ca
ses
1000 hours per year500 hours per year250 hours per year
Percent of total BUGs run as unauthorized distributed generation
3x BASELINE RISK
2x BASELINE RISK
BASELINE RISK
FIGURE 7-6PM mortality from BUGs with increasing unauthorized operation asdistributed generation
Annual operating hours for BUGs run as distributed generation. This analysis assumes that all otherBUGs operate 100 hours per year.

46
operations in 2001 alone.147 It is important to note that the emission factors onwhich these estimates are based assume operation at full load/capacity. But if aBUG is idling, its emissions are smaller, and therefore so is the risk.
Although BUGs are permitted only for use during emergencies, the local airdistricts’ limited policing resources means that some owners may operate theirBUGs for other purposes with little fear of detection and punishment. For exam-ple, BUG owners participating in a demand-response program or facing a real-time pricing tariff could substitute on-site power from the BUG for grid powerduring a curtailment call or a period of high prices. Or BUG owners with a suf-ficient understanding of their facility’s energy usage patterns could devise a strat-egy of systematically running their BUG to shave their peak demand and lowertheir utility bill.
Figure 7-6 shows that if even a small number of BUGs were used regularly asdistributed generation (instead of only for emergency standby operation), theoverall run time, emissions, and mortality could still rise significantly. For exam-ple, assume that BUGs used for distributed generation run for 1,000 hours annu-ally. If just 10 percent of the entire BUG population is operated as distributedgeneration, the PM mortality will almost double. Although not illustrated here,the number of cancer cases would also be expected to double in this example. Thisanalysis underscores the importance of ensuring that California’s air districts haveadequate means to verify compliance with permits and that penalties for noncom-pliance are commensurate with both the rewards of cheating and the risks of get-ting caught.

47
People living, working, and going to school close to BUGs are most heavily exposedto their toxic diesel emissions. Even under routine operating conditions individualswithin a few hundred meters of a BUG experience an unacceptable cancer risk andmay also be exposed to short-term concentrations of five particles that exceed thestate’s 24-hour standard. This chapter integrates the results of the health assess-ment with Environmental Defense’s GIS database to examine how these risks aredistributed within each of four air districts that have high numbers of BUGs.
Our geostatistical analysis examines the impact of BUGs from an environ-mental justice (EJ) perspective, asking how the burden of increased BUG emis-sions is distributed among residents of these districts. We employ specificdemographic variables, which have been shown to be reliable indicators of com-munities in which a disproportionate pollution impact may exist. These variablesinclude measures of race and ethnicity, age, and income level.148 Youth and elderlyresidents are especially vulnerable to air pollution and they have been shown, likeracial minorities and low-income families, to lack adequate access to health careand political and economic power. In addition this analysis explores the impact ofBUGs relative to cumulative exposures to air pollution and assesses the potentialfor BUG hot spots.
By integrating demographic data with the CEC BUG inventory we showthat in each of the districts we analyzed the population exposed is more likely tobe low income, elderly, and of a racial minority than the larger population. Wealso find that BUGs are clustered in the more densely populated areas of each dis-trict. The areas where BUGS are located also tend to have higher existing backgroundconcentrations of diesel pollution, so emissions from BUGS affect a populationthat is already disproportionately burdened with diesel exhaust.
Demographic analysisUsing results from the risk assessment described in Chapter 7, we created riskzone circles around each BUG. The diameter of a risk zone circle equals the sumof the down and upwind distances in which a person would be exposed to a one-in-a-million or greater cancer risk from PM emissions.149 Each of the four citiesin our analysis has a unique risk zone because of differences in wind patterns.Using Geographic Information Systems (GIS) mapping, we drew risk zone cir-cles around each BUG in the CEC inventory, offset in the downwind direction toaccount for prevailing wind patterns. As shown in Figure 8-1, we then overlaidthe risk zone circle on demographic data from the 2000 U.S. Census.150
For the purposes of this analysis, the term risk zone refers to the entire non-contiguous area covered by the risk zone circles. Combining these data enabled usto compare the demographic characteristics of the exposed population (i.e. withinthe risk zone) with the general population of each air district. To determine thepercentage of different groups residing within the risk zone, we multiplied thepercent of each subpopulation in each census block group by the percentage of itsarea covered by the risk zone. We then compared this figure with the correspond-ing percentages for the entire air district.
CHAPTER 8
Who bears the risks?

48
For this analysis we looked at race and ethnicity in terms of white (non-Hispanic)versus nonwhite as defined by the U.S. Census Bureau.151 We also broke the nonwhitecategory down into individual minority groups: African-American, Asian-American,and Hispanic or Latino. In addition, we focused on low-income households,which we define as those earning $25,000 or less a year. Finally, we looked at age,focusing on the young (under 18) and the elderly (65 and older). Both groups areespecially vulnerable to adverse health impacts from air pollution. In the discus-sion below we use the term “EJ individuals” to refer to members of any of thesedemographic groups.
We found that in almost all cases there is a statistically significant152 dispro-portionate impact on EJ individuals within the risk zone in all four districts. Atthe 5 percent level of significance, and even at the 1 percent level, we found a sta-tistically significant difference between the risk zone and the district as a wholefor the three main EJ factors of race, age, and income. Although the absolute dif-ferences are fairly small, they are sometimes proportionately large. To facilitatecomparisons between the demographic makeup of the risk zone and the district,we created an “EJ Index,” which is a ratio of the percent of EJ individuals withinthe risk zone divided by the percent in the district as a whole. When the EJ Indexis greater than one, the proportion of EJ individuals within the risk zone is greaterthan the in the entire district; this indicates a disproportionate impact from BUGs.As shown in Table 8-1, in all but two cases (African-Americans in the SouthCoast, and Asian-Americans in Sacramento) the EJ Index was greater than one.
Block groups
Risk zones
BUGs
MethodologyBy using GIS it is possible to calculate the area of a block group that is covered by a risk zone or a set of risk zones. We then use that percentage as a multiplier for the demo-graphic data to infer envi-ronmental justice impacts.
FIGURE 8-1Illustration of risk zone methodology used in environmental justiceanalysis

49
EJ FACTORSRace and ethnicityFor the four districts we surveyed, South Coast, San Joaquin, Sacramento, andSan Diego, we found that a slightly higher percentage of nonwhite residents livewithin the risk zones than in the districts as a whole. The EJ Index ranges fromabout 1.04 in Sacramento to 1.13 in San Diego. When the nonwhite categorywas broken down into individual minority groups, the results were less consistent,but an overall slight and consistent pattern remained. In some cases the discrep-ancy is quite large. In the San Joaquin Valley for example, the EJ Index for Asian-Americans is 1.46, meaning those living inside the risk zone are nearly twice aslikely to be Asian-American as those living outside of it. In Sacramento, the riskzone population is almost a third more African-American than the rest of the dis-trict, with an EJ Index of 1.27.
AgeIn our risk zone demographic analysis, we found no disproportionate impact onthose under 18 years old. We did, however, consistently find a higher percentage
TABLE 8-1Risk zone demographic analysis
Air district EJ variable Percent of population in z statistic EJ indexRisk zone Entire district
South Coast Nonwhite 62.9% 60.3% 5.50** 1.04African-American 7.4% 7.4% –0.46 0.99Asian-American 11.4% 11.0% 2.46** 1.04Hispanic/Latino 43.8% 41.7% 5.10** 1.05Over 65 12.3% 10.4% 8.34** 1.18Household income < $25,000 3.8% 3.3% 6.87** 1.13
San Diego Nonwhite 50.2% 44.7% 5.77** 1.13African-American 7.3% 6.0% 3.48** 1.21Asian-American 11.4% 10.1% 3.46** 1.13Hispanic/Latino 31.1% 28.1% 4.17** 1.11Over 65 13.2% 11.8% 2.28* 1.12Household income < $25,000 4.3% 3.6% 6.74** 1.20
Sacramento Nonwhite 41.3% 39.8% 1.92* 1.04African-American 11.2% 8.8% 5.57** 1.27Asian-American 10.3% 12.1% –2.34 0.86Hispanic/Latino 18.8% 18.1% 1.21 1.04Over 65 14.3% 11.4% 5.08** 1.26Household Income < $25,000 4.6% 4.3% 0.18 1.06
San Joaquin Valley Nonwhite 56.3% 51.5% 3.62** 1.09African-American 4.8% 4.1% 1.29 1.16Asian-American 11.6% 8.4% 8.00** 1.37Hispanic/Latino 56.3% 51.5% 0.38 1.09Over 65 12.0% 10.0% 4.64** 1.20Household Income < $25,000 6.7% 5.8% 5.32** 1.16
EJ Index = percent of EJ individuals in risk zonepercent of EJ individuals in entire district
* Significant at the 5% level** Significant at the 1% level

50
of elderly residents (65 and older) living inside the risk zone. With an EJ Indexranging from 1.08 in San Diego to 1.21 in Sacramento, it is clear that the elderlyface a somewhat disproportionate amount of risk from BUGs in the four districtswe surveyed.
IncomeIn our risk zone demographic analysis we found that low-income populations,households earning $25,000 or less, are more impacted by BUG emissions. FromSacramento to San Diego, the EJ Index ranges from 1.08 to 1.22, showing a sig-nificant disproportionate impact on low-income households inside the risk zone.
Proximity of schools to BUGSTo better analyze the impact on young children, the age category most vulner-able to developing asthma or other respiratory ailments due to exposure to airpollution, we looked at the proximity of primary and secondary schools to BUGsin the four surveyed districts. Because the time children spend at school coin-cides with the hours BUGs are likely to run, it is important to consider the impactof BUG emissions on school-age children. More than 200 schools are locatedwithin the boundaries of a BUG risk zone in the four districts we analyzed (seeTable 8-2). In the South Coast AQMD alone, 140 schools are located within
TABLE 8-2School children’s exposure to BUG emissions, operation as permitted
Air district Schools within Risk Zone Estimated children enrolled
South Coast 140 96,600San Diego 27 18,630San Joaquin Valley Unified 34 23,460Sacramento Metro 18 12,420
0
1000
2000
3000
4000
5000
6000
7000
San JoaquinSacramentoSouth CoastŁ(LA County only)
San Diego
Peo
ple
per
squa
re m
ile
Risk Zone
District
FIGURE 8-2Comparative demographics, population density, risk zone vs. air districts

51
approximately 300 meters of a BUG, exposing children to high levels of harmfuldiesel emissions that carry an increased risk of cancer and PM mortality. Basedupon this mapping exercise and the average enrollment of a California school,153
we estimate that over 150,000 school children may be exposed to unacceptablyhigh emissions from BUGs in just the four districts studied. Statewide figureswould be much higher.
BUGs are concentrated in densely populated areasUsing 2000 Census data, we compared the population density inside the risk zoneto the overall population density for the entire district. For each of the four dis-tricts we surveyed, the population density in the risk zone was more than twicethat of the district as a whole. In the San Joaquin Valley, the risk zone was almost25 times more densely populated than the district average. See Figure 8-2.
Cumulative exposures to PMEmissions from BUGs can cause more significant risks when added to the alreadyhigh background concentration of diesel exhaust in the surrounding air. Usingmethods similar to the demographic analysis, we looked at the background con-centration of diesel PM emissions in census tracts in which a BUG is located andcompared that to the average for each district as a whole.154
We found that in each of the four districts we analyzed, census tracts with atleast one BUG have higher background concentrations of diesel PM emissions,and therefore higher cancer risk levels, than the district as a whole. In the SanDiego AQMD, census tracts with BUGs had average cancer-risk levels fromdiesel concentrations that were over 30 percent higher than the district average,while in the San Joaquin Valley the risk level was 20 percent higher. Figure 8-3shows the elevated cancer risk levels in census tracts with BUGs compared to thedistricts as a whole.
0
100
200
300
400
500
600
700
800
900
1000
San Joaquin ValleySan DiegoSouth CoastSacramento
Can
cer
risk
per
mill
ion
Census tracts with a BUG
Entire district
FIGURE 8-3Cancer risk from background diesel PM concentrations, census tractaverages

52
Sacr
amen
toR
iver
American RiverRisk zonesBUGs
�Capitol
Building
I Street
M Street
10th
Stre
et
14th
Stre
et
FIGURE 8-4Risk Zone clusters in downtown Sacramento
52
15
5
805
8
94
Risk zones: operation as permittedRoad
FIGURE 8-5Risk zone clusters in the San Diego region

53
BUG hot spots are common in major California citiesOur risk zone analysis also demonstrates that many BUGs are located closeenough together that their risk zone circles overlap. Health risks may increaseconsiderably when individuals are exposed to emissions from more than one BUG.Figure 8-4 shows that a large portion of downtown Sacramento is at risk fromexposure to multiple BUGs. We found many similar incidences of BUG hot spotsin downtowns and other areas throughout California. Figure 8-5 shows BUGclusters in the San Diego area, inside and outside the downtown.
MULTIPLE BUGS AT SINGLE LOCATIONSMany facilities in the CEC inventory have multiple BUGs at each location. Onecommercial facility in Irvine has 15 BUGs. In our geostatistical analysis we wereunable to account for occasions when multiple BUGs are located at one facilityaddress. For this reason, the actual cancer and PM mortality risk may be manytimes higher in locations with multiple BUGs.

54
California’s recent electricity shortages highlighted the critical role BUGs playduring outages, but also illuminated regulatory gaps and potential abuses. TheCalifornia Air Resources Board (ARB) and many of the local air districts alreadyhave taken several important steps to remedy these problems. Though the energycrisis apparently is waning and a new budget crisis is looming, necessary reformsshould not be abandoned. This chapter summarizes Environmental Defense’s rec-ommendations for air regulators and the legislature to reduce Californians’ expo-sure to toxic emissions from diesel BUGs.
Adopt uniform permitting requirements for BUGsAll California air districts should require BUGs of 50 hp and larger to have per-mits so that local air regulators will know how many BUGs are in their districts,where they are located, and who owns them. This information will make it possi-ble for the districts to enforce restrictions on BUG use. Collecting permit fees willalso provide the funding needed to finance enforcement efforts. When used aspermitted, BUGs provide valuable benefits to their owners: It’s only fair to askBUG owners to help pay for enforcement to prevent abuses. In fact, requiringpolluters to pay permitting fees that fund enforcement is a well-established regu-latory principle of the federal Clean Air Act.
Ensure BUG use is confined to genuine emergenciesThe local air districts also should ensure that BUG operation is confined to true emer-gencies—those rare occasions when natural disasters or other events cause a loss ofgrid power at the site where the BUG is located. Environmental Defense endorses theARB’s recommendation in its September 2001 Guidance for the Permitting of Elec-trical Generation Technologies that the local air districts define a situation as an emer-gency “when electrical or natural gas service fails or emergency pumping for fireprotection or flood relief is required.”155 Air districts that have not already done soalso should explicitly advise BUG owners that compensated curtailments—suchas participating in interruptible rate programs or responding to price signals fromreal-time pricing or demand-bidding programs—do not justify BUG operation.
The California ISO, the California Power Authority, the CPUC, and the util-ities can reinforce these regulations by ensuring that new load-shedding programsdo not counteract permit restrictions. All load-shedding programs should explic-itly forbid operation of BUGs to meet curtailment calls or respond to price sig-nals. Program operators also should require BUG owners to inform their local airdistrict of their participation in real-time pricing programs, interruptible tariffs orother load-shedding programs.
Require pollution controls on new and existing BUGs The California Air Resources Board, as part of its comprehensive Diesel RiskReduction Program, has proposed tough new emissions standards for BUGs. The
CHAPTER 9
Policy recommendations

55
draft regulations call for owners of in-use BUGs to reduce emissions of diesel PMby 85% and comply with a 0.15 g/bhp-hr diesel PM emission rate, or replace theengine with one that meets the requirements for new BUGs. New or rebuilt BUGsgreater than 50 bhp would be required to meet an emissions standard of at least0.15 g/bhp-hr. In addition, the proposed standards would mandate low-sulfur(CARB) diesel. The ARB expects to promulgate new regulations in early 2003,with the standards becoming effective in 2004.
Environmental Defense supports prompt implementation of the proposedguidelines with few exceptions. In particular, the oldest engines—for which noretrofit technology is available to meet the new emissions standards—must not begrandfathered. A strict timeline needs to be established for replacing or retiringthese BUGs.
Adopt effective enforcement measures Even if the ARB’s proposed emissions limits are implemented, effective enforce-ment of restrictions on operating hours will be essential to guarantee that emis-sions from BUGs remain at acceptable levels. Because BUGs are normallyexpected to run only a few dozen hours per year, the ARB’s proposed standardsallow BUGs to emit fine particles at 15 times the rate allowed for prime engines,which typically run hundreds of hours per year. The different emissions limitsmake sense only if BUGs stay within their allotted annual operating hours.
The essential ingredients of effective enforcement include metering, recordkeeping, inspections and penalties. Environmental Defense supports the ARB’srecommendation that the air districts require non-resettable run-time meters onall BUGs. Like the familiar, tamper-proof odometers found in cars, the run-timemeters provide basic data on the total hours of operation—the single most impor-tant aspect of BUG use. In addition, BUG owners should be required to maintainrecords tracking the number of hours of operation, the purpose of operation (i.e.testing, maintenance, or emergency), and the nature of emergency hours. The airdistricts should require this data to be reported once a year and should make itavailable on request. A simple Internet-based system would allow centralizedreporting and record keeping of actual operating hours.
To ensure honest reporting, the air districts should conduct routine inspec-tions of meters and run-time logs. Once emissions limits are implemented, inspec-tors should verify that control equipment has been installed. At large facilities,regular inspections should be expanded to include BUGs. The majority of BUGs,however, are located at facilities that would not otherwise be inspected. Sinceenforcement dollars are scarce, inspections at these facilities necessarily will be lessfrequent. To provide an effective deterrent, a program of random inspectionsshould be instituted for these facilities, with severe penalties for violations.
Use financial incentives to reduce pollution from BUGsWhen California emerges from its current budget crunch, the legislature should con-sider providing direct financial incentives to retrofit or retire the dirtiest diesel BUGs.A model for this is California’s Carl Moyer Program, which provides grants to coverthe cost of reducing NOx emissions from heavy-duty vehicles and equipment. In

56
fact, the legislature allocated $14 million for air districts to mitigate the impactsof increased BUG use during last year’s electricity shortages. This funding wasaxed from the budget in the first round of cuts. It should be restored.
Encourage alternative backup power sourcesCleaner options for backup power exist or are being developed. Fuel cells are anespecially promising alternative. Because fuel cells are a relatively new technology,operating experience must be gained to ensure they are an efficient and reliableoption. Facilities planning backup power upgrades, especially hospitals and otherlarge facilities with multiple power sources, should introduce fuel cells into theirbackup mix to provide essential operating experience in these settings.
Protect the public’s right to know about risks from BUGsThe CEC’s BUG inventory paints only a partial picture. The ARB plans to expandthe inventory to include all BUGs, using permitting data from the air districts. Inaddition to data on engine characteristics and type of use, Environmental Defenserecommends that the inventory include information on engine location, owner-ship and retrofit status. The legislature should allocate sufficient funds to ensurethat the inventory will be comprehensive and that ARB can update it as newBUGs are permitted and retrofits are completed. The inventory should be avail-able in an easy to access form on ARB’s Web site so that Californians can find outif there is a BUG near where they live, work, or go to school. In addition, the airdistricts should collect and make available data on BUG run-times.

57
Acute noncancer effects Any noncancer health effect that occurs over a relativelyshort period of time, such as two weeks. The term is used to describe brief expo-sures and effects which appear promptly after exposure.
Acute toxicity Involves harmful effects in an organism through a single or short-term exposure.
Air basin A land area with generally similar meteorological and geographic con-ditions throughout. To the extent possible, air basin boundaries are defined alongpolitical boundary lines and include both the source and receptor areas. Californiais divided into 15 air basins.
Air dispersion modeling A mathematical relationship between emissions and airquality which simulates on a computer the transport, dispersion, and transforma-tion of compounds emitted into the air.
Ambient concentrations The concentration of a substance or pollutant withinthe immediate environs of an organism, related to the amount of possible exposurein that location.
Background concentration In exposure assessment, the concentration of a sub-stance in a defined control area during a fixed period of time before, during, orafter a data-gathering operation.
Bioassay A test to determine the relative strength of a substance by comparingits effect on a test organism with that of a standard preparation.
California’s Proposition 65 The Safe Drinking and Toxic Enforcement Act of1986. This Act, codified in California Health and Safety Code Section 25249.5,et seq., states “No person in the course of doing business shall knowingly dis-charge or release a chemical known to the state to cause cancer or reproductivetoxicity without first giving clear and reasonable warning to such individual.”
Carcinogen Any substance that can cause or aggravate cancer.
Chronic health effects An adverse effect on a human or animal in which symp-toms recur frequently or develop slowly over a long period of time.
Chronic noncancer effects Any noncancer health effect that occurs over a rela-tively long period of time (e.g., months or years).
Chronic toxicity The ability of a substance or mixture of substances to causeharmful effects over an extended period, usually from repeated or continuousexposure, sometimes lasting for the entire life of the exposed organism.
Cogenerator unit The consecutive generation of useful thermal and electricenergy from the same fuel source, in the same machine.
Criteria air pollutants As required by law, EPA has identified and set standardsfor six pollutants: ozone, carbon monoxide, total suspended particulates, sulfurdioxide, lead, and nitrogen oxide. These are known as “criteria” pollutants because
Glossary of technical terms

58
EPA is required to set or revise these standards based on the criteria of theirpotential health and welfare effects.
Cumulative exposures The sum of exposures of an organism to a pollutant overa period of time.
De minimus level A risk level that is small enough to be considered insignificant
Demand-response program A program, usually voluntary, in which participantsare offered a financial incentive to reduce energy consumption during a period oftight supply or high spot prices.
Distributed generation A distributed generation system involves small amountsof generation located on a utility’s distribution system for the purpose of meetinglocal (substation level) peak loads and/or displacing the need to build additional(or upgrade) local distribution lines.
Dynamic pricing A real-time adjustment of prices based on supply, demand, andcompetitor’s price fluctuations. A type of demand-response or load-shedding program.
Environmental justice The pursuit of equal justice and equal protection for all peo-ple under the environmental statutes and regulations. Environmental impacts donot fall equally on everyone in society. Studies have shown that chemical manu-facturing plants, hazardous waste landfills, highways and other developments withnegative environmental consequences are more likely to be located in low-incomeand minority communities. Low-income populations and minority populationsare more likely to be exposed to physical displacement and adverse impacts ontheir cultural institutions, traditional forms of land use, community cultural char-acter, religious practices, and financial well being. The idea behind environmentaljustice is to recognize these disproportionate impacts and try to avoid them.
Fine particles Particulate matter less than 2.5 microns in diameter, also referredto as PM2.5.
Gensets Diesel or gas-fired engines used for the purpose of generating electricity.
Horsepower A unit of power in the U.S. Customary System, equal to 745.7 wattsor 33,000 foot-pounds per minute, often a standard measure of engine size.
Intake fraction The fraction of emissions from a source that is breathed by anexposed population. It is calculated as the ratio of the total intake, summed overall people, divided by the total emissions.
Interruptible contracts Electrical supply contracts that allow the supplier to cur-tail or stop service at times.
Load-shedding Reduction of peak demand through voluntary curtailment ofelectrical loads, often accomplished by simply turning off equipment.
Median aerodynamic diameter The average diameter of a particle of matter of agiven type (e.g., diesel particulate matter), used for modeling and other purposes.
Meta-analyses The process or technique of synthesizing research results by usingvarious statistical methods to retrieve, select, and combine results from previousseparate but related studies.

59
Metabolize Processing of a specific substance by the living body. In the context ofair pollution, this indicates a movement of particles out of the body or into fattytissue.
Mobile sources Sources of air pollution such as automobiles, motorcycles, trucks,off-road vehicles, boats, and airplanes.
Mortality risk The expected likelihood of death from a particular exposure orseries of exposures.
Mutagen An agent that causes a permanent genetic change in a cell other thanthat which occurs during normal growth.
Mutagenic potency The capacity of a chemical or physical agent to cause perma-nent genetic changes.
New Source Review The permittering process for new and modified stationarysources, mandated by the federal Clean Air Act.
Nitrogen oxide or NOx, is the generic term for a group of highly reactive gases,all of which contain nitrogen and oxygen in varying amounts. They form whenfuel is burned at high temperatures, as in a combustion process. The primarysources of NOx are motor vehicles, electric utilities, and other industrial, com-mercial, and residential sources that burn fuels.
Occupational exposure Exposure to compound or class of compounds throughroutine work performance. Of special concern due to the repeated, prolongedcontact.
Off-road engines Any non-stationary device, powered by an internal combustionengine or motor, used primarily off the highways to propel, move, or draw personsor property, and used in the following applications: marine vessels, construc-tion/farm equipment, locomotives, utility and lawn and garden equipment, andoff-road motorcycles..
Particulate matter (PM2.5,PM10) A criteria air pollutant, particulate matterincludes dust, soot and other tiny bits of solid materials that are released into andmove around in the air. Particulates are produced by many activities, includingburning of diesel fuels by trucks and buses, incineration of garbage, mixing andapplication of fertilizers and pesticides, road construction, industrial processessuch as steel making, mining operations, agricultural burning (field and slashburning), and operation of fireplaces and woodstoves. Particulate pollution cancause eye, nose and throat irritation and other health problems. The number afterPM refers to the diameter of the particles in microns.
Peaking capacity The maximum electrical output of a given facility.
Peaker Plant An electric generating unit used mainly or exclusively during peri-ods of peak electrical demand.
Polycyclic Aromatic Hydrocarbons (PAHs) Organic compounds that contain car-bon and hydrogen with a fused ring structure containing at least two benzene (six-sided) rings. PAHs may also contain additional fused rings that are not six-sided. Thecombustion of organic substances is a common source of atmospheric PAHs.

60
Portable generators An internal combustion engine which is designed and capa-ble of being carried or moved from one location to another and does not remainat a single location for more than 12 consecutive months.
Prime engines Engines that are permitted to run on a regular basis, usually forhundreds or thousands of hours per year.
Real-time pricing The instantaneous pricing of electricity based on the cost of theelectricity available for use at the time the electricity is demanded by the customer.
Receptor grid The division of a sampling location into defined, symmetric areasfor the purpose of measuring the air pollution at the location.
Reference Exposure Concentration (RfC) An estimate derived by the U.S. EPAof a daily exposure to the human population (including sensitive subgroups) thatis likely to be without appreciable risk of deleterious effects during a lifetime ofexposure. The RfC is derived from a no- or lowest-observed adverse effect levelfrom human or animal exposures, to which uncertainty or “safety” factors areapplied.
Reference Exposure Level A health risk value measure developed by theNational Institute for Occupational Safety and Health to gauge exposure in theworkplace; based on a time-weighted average for up to a ten-hour workday dur-ing a 40-hour work week.
Residual risk The quantity of health risk remaining after emissions controls areapplied.
Retrofit Addition of a pollution control device without making major changes tothe generating plant. Also called backfit.
Risk assessment The characterization of the potential adverse health effects ofhuman exposures to environmental hazards.
Rolling blackouts A controlled and temporary interruption of electrical service.These are necessary when a utility is unable to meet heavy peak demands becauseof an extreme deficiency in power supply.
Run-time The number of hours an engine operates during the course of one year.
Self-generation A generation facility dedicated to serving a particular retail cus-tomer, usually located on the customer’s premises. The facility may either beowned directly by the retail customer or owned by a third party with a contractualarrangement to provide electricity to meet some or all of the customer’s load.
Small-scale generation Electric power generation systems from 1-kilowatt to5-megawatt in capacity, such as fuel cells, engine/generator sets, advanced com-bustion turbines, and microturbines.
Stack parameters Limits on chimney, smokestack, or vertical pipe discharges ofused air.
Stage 1 Alert Declared by the California independent systems operators when itis clear that an operating reserve shortfall is unavoidable or the operating reserveis forecast in real-time to be less than the minimum after using available resources.

61
Stage 2 Alert Declared by the California independent system operators when itis clear that an operating reserve shortfall (less than 5%) is unavoidable or theoperating reserve is forecast in real-time to be less than 5 percent after dispatch-ing all available resources.
Stage 3 Alert Declared by the California independent system operators when itis clear that an operating reserve shortfall (less than 1.5%) is unavoidable or theoperating reserve is forecast in real-time to be less than 1.5 percent after dis-patching all available resources.
Stationary source A place or object from which pollutants are released that doesnot move. Stationary sources include power plants, gas stations, incinerators,houses, etc.
Toxic air contaminant An air pollutant, identified in regulations by the ARB,which may cause or contribute to an increase in deaths or in serious illness, orwhich may pose a present or potential hazard to human health. TACs are consid-ered under a different regulatory process (California Health and Safety Code Sec-tion 39650 et seq.) than pollutants subject to CAAQS. Health effects from TACsmay occur at extremely low levels, and it is typically difficult to identify levels ofexposure that do not produce adverse health effects.
Toxicity factor The degree to which a substance or mixture of substances canharm humans or animals.
Uninterrupted power supply A battery with sophisticated electronic control cir-cuitry which switches to battery power when the main power fails so that there isno break in the electricity provided to equipment.
Sources:EPA environmental glossary: http://www.epa.gov/OCEPAterms/intro.htmCEC energy glossary: http://www.energy.ca.gov/glossary/index.htmlElectric Power Industry glossary:http://www.energycentral.com/sections/directories/glossary/

62
ACGIH American Council of Government Industrial HygienistsAPCD Air Pollution Control DistrictAQMD Air Quality Management DistrictATCM Airborne Toxic Control MeasuresATSDR Agency for Toxic Substances and Disease RegistryBACT Best Available Control TechnologyBUG Backup GeneratorCAA Clean Air ActCAPCOA California Air Pollution Control Officers’ AssociationCARB California Air Resources BoardCO Carbon monoxideCEC California Energy CommissionDG Distributed GenerationDRRP Diesel Risk Reduction PlanDPM Diesel Particulate MatterEF Emission FactorEPA Environmental Protection AgencyGIS Geographic Information SystemsHEI Health Effects InstituteHI Hazard IndexIARC International Agency for Research on CancerIC Internal CombustioniF Intake FractionISC Industrial Source ComplexkW KilowattMEI Maximally Exposed IndividualMRL Maximum Risk LevelMW MegawattNIOSH National Institute for Occupational Safety and HealthNOx Nitrogen OxidesOEHHA Office of Environmental Health Hazard AssessmentOSHPAD Office of Statewide Health Planning and DevelopmentPAHs Polycyclic Aromatic HydrocarbonsPM Particulate MatterUS DHHS/NTP United States Department of Health and Human Ser-
vices/National Toxicology ProgramUSGS United States Geological SurveyVOCs Volatile Organic CompoundsWHO (IPCS) World Health Organization (International Programme on
Chemical Safety)
Abbreviations

63
The BUG database was derived from the CEC BUG inventory. Facility addresseswere geocoded using the Geographic Data Technology (GDT) Streetmap 2000database extension and Arcview 3.2 software. Address information was availablefor the majority of BUGs in the inventory, except in the Bay Area AQMD PG&Edata. Those BUGs with inaccurate, incomplete or missing facility addresses werenot included in the GIS analysis.
In the geocoding process, complete street addresses were individually matchedto latitude and longitude coordinates by the Streetmap program, which plots dis-tances along a street line segment based on the address number. Each segment ofeach street line contains a code for the address number. Since all streets in theUnited States are standardized to have even addresses on one side and oddaddresses on the other, the geocoder can plot points on the correct side of thestreet. This system is extremely accurate, especially in urban and suburban areasDropping all BUGs without address data or those that did not match with streetsegment coordinates ensures the highest possible accuracy.
Of the 3,342 BUGs in the CEC database for which an address was available,3,328 were successfully geocoded. An additional 451 BUGs without address infor-mation were excluded. We projected the resulting data set onto the state of Cali-fornia’s official projection system: Albers Equal Area Conic along with all otherdata sets to facilitate overlay analysis.
GIS data sets and sourcesBUG risk zones were derived from a general buffer program and shifted down-wind from the location of each BUG. Following the detailed analysis of the windpatterns in each air basin, we derived a buffer radius congruent with the limit ofthe one in 1 million added cancer risk of the generators. These buffers were shifteda modeled distance downwind from each generator according to the prevailingwinds of the air basin.
All demographic layers, including race, income, age, and population densitywere taken from 2000 U.S. census data. We used both the block group and tractlevels of geography for overlay analysis with the risk zones. The block group datawas the most appropriate level of geography and was used in most analyses.
Data layers of schools and parks were provided by Environmental SystemsResearch Institute (ESRI) but were originally derived from the GeographicNames Information System, a federal government resource.
For land-use data we used the National Land Cover Database, a product ofthe USGS based on satellite imagery.
Worker density data for Los Angeles was provided by the South Coast AreaGovernments (SCAG) Regional Transportation Plan. This data was only avail-able for Los Angeles County by census tract for 1997.
Data on background exposures to diesel particulate matter were taken fromthe Environmental Defense Scorecard website (www.scorecard.org). The sourcefor the Scorecard data is the U.S. Environmental Protection Agency’s National-Scale Air Toxics Assessment.
APPENDIX A
GIS methodology and data sources

64
For toxic air contaminants emitted from diesel BUGs, the health risk can be esti-mated as the product of three elements: (1) the quantity of contaminant released;(2) the increase in exposure concentration per unit release; and (3) the risk ofadverse effect per unit increase in exposure concentration. The first element isdetermined by multiplying an emission factor by the amount of engine use. Theemission factor indicates the amount of pollutant emitted per unit of engine use.Air dispersion models are used to evaluate the second element, based on informa-tion about emission characteristics and meteorology. The third element isaddressed by toxicity values, which account for acute, chronic cancer, and chronicnoncancer effects, respectively.
The three elements summarize a more general framework, presented in Fig-ure B-1, for evaluating risk from environmental sources.
Emission factorsEmission factors (EFs) indicate the mass of emissions that will occur per amountof BUG activity. Emission factors for the evaluations presented here were takenfrom the EPA’s compilation of EFs, known as AP-42156. For diesel engines (suchas BUGs) the EFs are expressed in terms of grams of pollutant emitted per horse-power-hour of electrical power generated by the engine. EFs for particulate mat-ter with a mean diameter of 10 micrometers or less (PM10), in pounds per millionBTU, are listed in AP-42 as 0.31 and 0.1, for small (<600 hp) and large (>600 hp)engines, respectively. Essentially all of the diesel particulate emissions are expectedto be smaller than 2.5 micrometers in diameter. Thus, for this investigation thefollowing terms may be considered to be synonymous: diesel particulate matter(DPM), diesel PM10, and diesel PM2.5.
Air dispersion modelingTo explore the health impacts of increased BUG operation on nearby populationsEnvironmental Defense commissioned an analysis of predicted increases in ambientconcentration of diesel pollutants owing to atmospheric emissions from individualdiesel BUGs. Air Resource Specialists (ARS) conducted air dispersion modeling ofgeneric BUGs using weather data from five California cities. ARS used a standardair dispersion model, Industrial Source Complex (ISC)157. ISC is a regulatory-approved model used to determine the impact of emissions on the surroundingcommunity, for purposes such as permitting new sources. Using local weather dataand information on how an engine is situated in relation to surrounding build-ings, ISC models the ground-level concentration at a grid of discrete receptor
APPENDIX B
Risk assessment methods
Emissionssource
Ambientconcentration
Personalexposure Dose Health risk
FIGURE B-1General framework for evaluating environmental health risks

65
points in the vicinity of the source. Wind speed and atmospheric stability are keydeterminants of how the plume of emissions from a source is dispersed. Windspeed determines how rapidly clean air dilutes the emissions. Atmospheric stabil-ity determines the rate of vertical mixing in the atmosphere. Unstable conditionslead to more rapid vertical mixing. This spreading or mixing dilutes the emissions,thereby decreasing the concentration while spreading it over a larger volume. ARSconducted air dispersion modeling using hourly meteorological data for SanDiego, San Francisco, Fresno, Los Angeles, and Sacramento. Five years of histor-ical meteorological data were used for each city. Because a generic BUG was mod-eled, researchers assumed it would run only a small proportion of hours each year,without knowing when those hours would occur. Different operating scenarios forBUGs would result in different seasonal and daily patterns of BUG operation. Tosupport analysis of a plausible range of potential operating scenarios for BUGs,ARS conducted three separate modeling runs for each BUG:
• In the “All” scenario, which BUGs can operate at any time and any day ofthe year, and BUG use is randomly allocated to a fixed number of operatinghours, selected from among 24 hours per day and 365 days per year (8,760possible hours).
• In the “Business” scenario, BUGs operate only between 7 am and 7 pm, andBUG use is randomly allocated to a fixed number of operating hours, selectedfrom among 12 hours per day and 365 days per year (4,380 possible hours).
• In the “Summer” scenario, BUGs only operate between noon and 6 pm duringthe months of June, July, August, and September, and BUG use is randomlyallocated to six hours per day, 122 days per year (732 possible hours).
Results generated by these modeling scenarios were combined with assumptionsabout annual run-time to develop results by operating scenarios. ISC model resultsare expressed in terms of the highest one-hour concentration, the highest 24-hourconcentration, and the annual average (for a specified number of operating hoursand season/time of operation)158.
ToxicityThe toxicity of a chemical indicates the risk of an adverse health outcome occur-ring because of exposure to that chemical. The three health risks that are typicallyconsidered in a health-risk assessment for toxic air contaminants and that haveassociated toxicity values are acute, chronic cancer, and chronic noncancer risks. Inaddition, we have estimated direct mortality effects due to PM2.5 using recentepidemiological evidence.
Based on our analysis, we conclude that the direct mortality risk poses thesingle largest concern for the health effects of diesel BUG emissions. Of the threehealth risks typically considered in a risk assessment (acute, chronic cancer, andchronic noncancer), chronic cancer risk is the largest public health concern.
Toxicity values for selected pollutants for acute, chronic cancer, and chronic non-cancer risks are listed in Table B-1. These values have been peer-reviewed and ap-proved by regulatory agencies. They are designed protect public health, meaning thatthey should include a margin of safety to protect children, the elderly, and the infirm.

66
The toxicity value for direct mortality risk is taken from peer-reviewed litera-ture for populationwide exposure, based on an article by the Chairman and theChief Deputy Executive Officer of the California Air Resources Board.
Acute toxicityAcute health risks are those that result from short-term exposure, typically definedas less than 14 days, whereas chronic health risks are associated with long-termexposures, typically defined as longer than three months. The toxicity for acute andchronic noncancer is expressed in terms of a threshold concentration that should notbe exceeded during a specified exposure period. The acute and chronic noncancerrisk is often presented as a Hazard Index (HI), which is the actual concentrationdivided by the threshold concentration. For example, an HI of two indicates thatthe estimated exposure concentration is twice the threshold concentration.
The acceptable threshold concentrations for acute toxicity are given by theReference Exposure Level159 (REL) values maintained by the Office of Environ-mental Health and Hazard Assessment. To understand the significance of theone-hour maximum concentration results predicted for BUGs, they are presentedas a fraction of the respective REL. This comparison provides a partial basis forassessing which chemicals pose the greatest acute hazards. Among those chemi-cals for which both emission factors and REL values are available, the chemicalwith the most stringent acute concentration limit for BUGs is acrolein. We deter-mined this by comparing all chemicals for which we have an emission factor andan REL, and choosing the one with the highest EF/REL ratio.
Chronic cancer and noncancer risksToxicity for chronic cancer risk is typically expressed in terms of the lifetime riskof excess cancer cases per unit concentration. This value is multiplied by the con-
TABLE B-1Health risk values*
Chemical Chronic AcuteReference Exposure Level Reference Exposure Level
(REL) (REL)
Acrolein 0.06 0.19Formaldehyde 3 94Propylene 3000 NATotal PAHs NA NABenzene 60 1300Acetaldehyde 9 NAButadiene 20 NAToluene 300 37,000Xylenes 700 22,000PM-10 NA NADiesel exhaust 5 NANaphthalene 9 NA
*in micrograms per cubic meterSource: Office of Environmental Health Hazard Assessment (OEHHA), May 2000.

67
centration to obtain the incremental cancer risk. For example, if the average con-centration increase of a certain chemical is 2 micrograms per cubic meter (µg/m3),and the toxicity is 3 per million per µg/m3, then the risk from that source is esti-mated to be 6 per million. This is interpreted to mean that if one million peoplewere exposed to the given concentration for the duration of a 70-year lifetime, wewould expect six people to contract cancer because of their exposure to this chem-ical from this source.
To determine whether a risk is large or small, one compares the estimated riskto respective benchmarks. One benchmark for comparison is a risk level that issmall enough to be considered insignificant, or de minimus. The California Envi-ronmental Protection Agency (CalEPA) defines de minimus to be one per millionor less for chronic cancer risks, and an HI of 0.2 or less for acute and chronic non-cancer risks. The benchmark for chronic cancer risk is based on the 1990 CleanAir Act, which allows sources to be exempt from regulation and residual risk to beconsidered negligible when posing less than a one in a million risk to the mostexposed individual. CalEPA considers an HI greater than 10 to be sufficientgrounds for denial of an emissions permit for regulated emission sources. Achronic cancer risk greater than 10 times the de minimus level, or 10 per million,is large enough to warrant risk reduction actions. A risk greater than 100 timesthe de minimus level, or 100 per million, may be grounds for denying a permit.
Based on a comparison of published values for chronic cancer and chronicnoncancer toxicity, the most stringent constraint appears to be the cancer risk fordiesel exhaust. The cancer risk potency of diesel exhaust, according to CalEPA, is300 per million per µg/m3. This means that chronic exposure to one µg/m3 wouldyield a lifetime excess cancer risk of 300 per million, i.e. 300 times the de minimusrisk level. The incremental increase in chronic exposure concentration must beless than 0.0033 µg/m3 to be below the de minimus risk level.
Mortality riskBecause most PM emissions from diesel engines are smaller than 1 (m in diameter,it is appropriate to consider all DPM as PM2.5. Recent evidence—summarizedby Lloyd and Cackette (2001)160—concludes that the largest public health con-cern for PM2.5 is the mortality risk. Furthermore, current research161 indicatesthat the risks from PM2.5 may be even greater than previously thought.
Lloyd and Cackette (2001) base their estimates of the toxicity of DPM onstudies investigating the link between ambient PM and population mortality. Giventhe size and chemical composition of DPM, we would expect DPM to be more toxicthan ambient PM2.5. Thus, while the studies that Lloyd and Cackette cite representthe best available evidence of DPM toxicity, the values they use are based on studiesof ambient PM2.5, and may therefore underestimate the true toxicity of DPM.
Lloyd and Cackette provide four estimates of the short-term mortality andtwo estimates of the long-term (one-year) mortality attributable to direct (pri-mary) DPM concentrations162 of 1.8 µg/m3. Each estimate is presented in termsof the mean, 5th percentile, and 95th percentile value, with mean values for short-term effects from 665 to 2,531 deaths/year, and mean values for combined short-and long-term effects163 of 2,880 and 3,566 deaths/year. Because BUGs areinstalled to operate intermittently over periods of many years, it is appropriate to

68
consider the combined short- and long-term effects of DPM exposure. We used thehigher of the two mean values from Lloyd and Cackette (3,566 deaths/year)164 forestimating direct mortality effects. Even this value may underestimate the toxicityof DPM, because these toxicity values are for ambient PM2.5 rather than DPM.
PM2.5 may be even more toxic than was thought at the time that Lloyd andCackette completed their review article, and recent research165 indicates a PM2.5toxicity value approximately twice the value in Lloyd and Cackette (2001). Never-theless, we have used the results from Lloyd and Cackette because they are morecomprehensive and compare several studies.
Based on the estimated health outcome of 3,566 deaths/year in Californiaowing to average ambient levels of 1.8 µg/m3 of direct DPM, and a state popula-tion of 33 million, we estimate a toxicity of 60 deaths per million per ug/m3.166
Note that this risk is in addition to the other effects calculated elsewhere in thisreport (e.g., the chronic cancer risk).
An important difference between the mortality risk and the chronic cancerrisk is that the former is calculated based on a one-year exposure scenario, whilethe latter is calculated based on a 70-year exposure scenario. While the PM2.5risk value of 60 per million per µg/m3 appears to be five times lower than theDPM chronic cancer toxicity (300 per million per µg/m3), the former occurs afteronly one-seventieth of the exposure, and thus after only one-seventieth of theintake. Therefore the direct mortality risk is estimated to be 14 times higher than thechronic cancer risk.
Unlike the REL toxicity values, which are designed to be protective of sensi-tive populations, the toxicity values used in Lloyd and Cackette (2001) representthe risk to the general public. The risks to sensitive populations will be evengreater than is presented in this report. For diesel PM, we expect the list of sensi-tive populations to include young people, the elderly, and the infirm.

69
The first step in the analysis was to derive an estimate of the intake fraction forDPM emitted by BUGs. An estimated intake fraction of 15 grams inhaled pertonne of DPM emitted was derived from published data on the concentration andemissions of DPM in major California air basins. We start by converting the unitsused to express the toxicity of DPM. CalEPA uses a concentration-based toxicityof 0.000300 per µg/m3 167, meaning that if a person were exposed to 1 µg/m3 ofDPM for their entire 70-year lifetime, we would predict an excess cancer risk of300 per million. This is converted to an intake-based toxicity of 0.00078 per mil-lion per gram of intake, meaning that if a person inhales 1 gram of DPM over thecourse of their entire 70-year lifetime, we would predict an excess cancer risk of780 per million. Conversely, a population intake of 1.0 kg will be expected to leadto one cancer case. Similarly, a population intake of 0.07 kg per year is estimatedto cause one excess death per year owing to the direct mortality effect of PM.
The final step in this calculation is to determine the total emissions from allBUGs. This calculation, which is presented in Table C-1, assumes that there are atotal of approximately 11,000 BUGs in California168 operating an average of 100hours per year.169 Consequently, the total run-time of BUGs is 1,100,000 hours.Using emission factors170 of 0.0022 pounds (1 gram) of PM per horsepower-hourfor smaller BUGs (ranging from 100 to 600 hp) and 0.0007 lb/hp-hr (0.32 grams)for larger BUGs (601 to 2100 hp), these 1.1 million hours of operation cause atotal of 380 million grams (380 metric tonnes) of DPM emissions.171
• The data points are Emissions, 380 tonnes of PM emitted each year;• Intake fraction, 0.015 kg inhaled per tonne emitted;• Toxicity, one cancer case per 1.0 kg of DPM inhaled, and one death per
0.073 kg of PM inhaled.
The numbers are combined to yield a prediction of approximately five excess can-cer cases per year and approximately 70 excess deaths per year due to BUG PMemissions.
In this intake fraction calculation, mortality is directly (i.e. linearly) propor-tional to average annual operating hours. To calculate mortality effects for differ-ent assumptions about operating hours, as presented in Table 7-3 and Figure 7-6,we simply scaled the above estimates. For example, increasing the number ofannual operating hours from 100 to 200 doubles the expected number of deathsfrom both cancer and direct PM mortality.
APPENDIX C
Intake fraction analysis approach

70
TAB
LE C
-4In
take
frac
tion
, eng
ine
size
dis
trib
utio
nM
iddl
eAn
nual
CHR
ON
IC C
ANCE
R C
ASES
(PER
YEA
R)
PM M
OR
TALI
TYB
UG
siz
eN
umbe
rru
n ho
urs
IFB
UG
ran
gefo
r th
isof
BU
Gs
per
Tota
lpe
rEF
Size
size
(kW
)ra
nge
(kW
)in
sta
teen
gine
run
hour
sm
illio
n(l
b/hr
)(h
p)25
5010
025
050
010
0025
5010
025
050
010
00
0-10
050
2,26
910
022
6,93
314
.60.
1567
0.05
0.11
0.22
0.54
1.09
2.18
0.76
1.52
3.0
7.6
1530
101-
200
150
2,26
910
022
6,93
314
.60.
4420
10.
160.
330.
651.
633.
276.
542.
284.
559.
122
.846
9120
1-30
025
02,
269
100
226,
933
14.6
0.74
335
0.27
0.54
1.09
2.72
5.45
10.9
03.
797.
5915
37.9
7615
230
1-40
035
011
810
011
,839
14.6
1.03
469
0.02
0.04
0.08
0.20
0.40
0.80
0.28
0.55
1.1
2.8
611
401-
500
450
868
100
86,8
2214
.61.
3360
30.
190.
380.
751.
883.
757.
512.
615.
2210
26.1
5210
450
1-60
055
068
810
068
,764
14.6
1.62
738
0.18
0.36
0.73
1.82
3.63
7.27
2.53
5.06
1025
.351
101
601-
700
650
588
100
58,8
3814
.60.
6187
20.
060.
120.
230.
581.
172.
340.
811.
633
8.1
1633
701-
800
750
255
100
25,4
7314
.60.
701,
006
0.03
0.06
0.12
0.29
0.58
1.17
0.41
0.81
1.6
4.1
816
801-
900
850
508
100
50,8
2614
.60.
801,
140
0.07
0.13
0.26
0.66
1.32
2.64
0.92
1.84
49.
218
3790
1-10
0095
018
410
018
,417
14.6
0.89
1,27
40.
030.
050.
110.
270.
531.
070.
370.
741.
53.
77
1510
01-1
100
1,05
025
510
025
,473
14.6
0.99
1,40
80.
040.
080.
160.
410.
821.
630.
571.
142.
35.
711
2311
01-1
200
1,15
016
110
016
,145
14.6
1.08
1,54
20.
030.
060.
110.
280.
571.
130.
390.
791.
63.
98
1612
01-1
300
1,25
073
100
7,29
514
.61.
171,
676
0.01
0.03
0.06
0.14
0.28
0.56
0.19
0.39
0.8
1.9
48
1301
-140
01,
350
159
100
15,9
0514
.61.
271,
810
0.03
0.07
0.13
0.33
0.66
1.31
0.46
0.91
1.8
4.6
918
1401
-150
01,
450
3710
03,
707
14.6
1.36
1,94
40.
010.
020.
030.
080.
160.
330.
110.
230.
51.
12
515
01-1
600
1,55
026
010
025
,951
14.6
1.45
2,07
90.
060.
120.
250.
611.
232.
460.
861.
713
8.6
1734
1601
-170
01,
650
4410
04,
425
14.6
1.55
2,21
30.
010.
020.
040.
110.
220.
450.
160.
310.
61.
63
617
01-1
800
1,75
039
100
3,94
614
.61.
642,
347
0.01
0.02
0.04
0.11
0.21
0.42
0.15
0.29
0.6
1.5
36
1801
-190
01,
850
2810
02,
751
14.6
1.74
2,48
10.
010.
020.
030.
080.
160.
310.
110.
220.
41.
12
419
01-2
000
1,95
074
100
7,41
514
.61.
832,
615
0.02
0.04
0.09
0.22
0.44
0.88
0.31
0.62
1.2
3.1
612
2001
-210
02,
050
164
100
16,3
8414
.61.
922,
749
0.05
0.10
0.21
0.51
1.03
2.05
0.71
1.43
2.9
7.1
1429
mor
e2,
150
3210
03,
229
14.6
2.02
2,88
30.
010.
020.
040.
110.
210.
420.
150.
300.
61.
53
6
Tota
l11
,344
100
1,13
4,40
426
.31.
42.
75.
414
2754
1938
7618
937
875
7
EF w
eigh
ted
aver
age
Tota
l cap
acity
(by
# o
f BU
Gs)
lb/h
r(b
ased
on
the
# o
f BU
Gs)
kW
335
113,
467
1004
340,
400
1674
567,
333
122
41,4
3811
5339
0,70
011
1637
8,20
335
938
2,44
917
919
1,04
540
643
2,01
916
417
4,96
025
126
7,46
317
418
5,66
386
91,1
8720
221
4,72
450
53,7
5637
840
2,24
169
73,0
1065
69,0
6348
50,8
8613
614
4,58
431
533
5,86
865
69,4
228,
349
4,96
9,88
0
EF (>
600
hp)
0.00
07lb
/hp-
hrEF
(<60
0 hp
)0.
0022
lb/h
p-hr
Can
cer
case
s pe
r (r
un h
r*IF
*EF)
4.4E
-07
Exce
ss d
eath
s pe
r (r
un h
r*IF
*EF)
6.2E
-06
Tota
l gen
erat
ing
capa
city
4,97
0M
WTo
tal n
umbe
r of
BU
Gs
11,3
44—
Ave
rage
BU
G s
ize
438
kWA
vera
ge B
UG
siz
e58
7hp
Wei
ghte
d av
erag
e em
issi
on fa
ctor
0.74
lb/h
rW
eigh
ted
aver
age
emis
sion
fact
or0.
0012
5lb
/hp-
hr

71
1 Environmental Defense Scorecard, 2002, calculated from 1999 EPA National Scale Assessmentof Air Toxics data.
2 Ibid.3 California Office of Environmental Health Hazard Assessment, Air Toxicology and Epidemiol-
ogy Section, “Proposed Identification of Diesel Exhaust as a Toxic Air Contaminant,” HealthRisk Assessment for Diesel Exhaust app. III, part B, as approved by the Scientific Review Panel,April 22, 1998. Available on-line at ftp://ftp.arb.ca.gov/carbis/regact/diesltac/partb.pdf, accessedon January 20, 2002.
4 K. Donaldson, V. Stone, A. Clouter, L. Renwick, W. MacNee, “Ultrafine particles,” OccupationalEnvironmental Medicine 58 no. . (March 2001):199, 211-6. R.D. Morris, “Airborne Particulatesand Hospital Admissions for Cardiovascular Disease: A Quantitative Review of the Evidence,”Environmental Health Perspectives 109, supp. 4 (August 2001): 495–500.
5 R. Wilson and J. Spengler, eds., “Particles in Our Air: Concentrations and Health Effects,”(1999): 212.
6 Available on-line at http://www.cde.ca.gov/resrc/factbook/fingertip.htm.7 California Air Resources Board, “Guidance for the Permitting of Electrical Generation Tech-
nologies,” Sacramento, CA, September 2001, p. 10.8 California Energy Commission, “California Distributed Energy Resources: DER Equipment.”
Available online at http://www.energy.ca.gov/distgen/equipment/reciprocating_engines/strengths_weakness.html. 1/30/01.
9 Derived from California Energy Commission, “BUGS 1: Database of Public Back-up Gen-erators (BUGS) in California,” August 15, 2001. Available online at http://www.energy.ca.gov/database/index.html#powerplants; and California Air Resources Board, “Risk Reduction Plan toReduce Particulate Matter Emissions from Diesel-Fueled Engines and Vehicles,” October 2000,app. 2, p. 13. Available online at http://www.arb.ca.gov/diesel/documents/rrpapp5.PDF
10 California Air Resources Board, “Risk Reduction Plan,” app. 2, p. 5.11 Ibid., app. 5, p. 5.12 Ibid., app. 2, p. 13.13 California Energy Commission, “BUGs 1: Database.”14 The Bay Area AQMD now requires all BUGs greater than 50 hp to obtain a permit. Data on
Bay Area permits will be included in future updates of the CEC inventory.15 California Air Resources Board, “Risk Reduction Plan,” app. 2, p. 17.16 California Air Resources Board, Portable Equipment Registration Program. Available online at
http://www.arb.ca.gov/perp/perp.htm.17 California Energy Commission, “California Distributed Energy Resources: DER Equipment.”
Available online at http://www.energy.ca.gov/distgen/equipment/equipment.html, January 30,2002.
18 Ibid. See, online, http://www.energy.ca.gov/distgen/equipment/fuel_cells/fuel_cells.html.19 California Energy Commission, “Distributed Energy Resources: DER Technologies: Fuel Cells.”
Available online at http://www.eren.doe.gov/der/fuel_cells.html, February 5, 2002.20 U.S. Geological Survey, “National Land Use, Land Cover Database. Landstat Imagery.”21 GIS data for Los Angeles County employment density provided by South Coast Area govern-
ments. Maps can be viewed at Regional Transportation Plan 2001, Community Link 21, Employ-ment Density Map, 1997. Available online at http://www.scag.ca.gov/rtp/maps/exhibit4.4.pdf.
22 California Air Resources Board, “Risk Reduction Plan, “ app. 2, p. 3.23 California Air Resources Board, “Air Resources Board Compilation of District Rules and Poli-
cies for Back-up Generators,” 2002.24 E-mail correspondence with Bay Area AQMD staff.25 All information on district-specific rules and regulations of diesel BUGs was obtained from dis-
trict officials in the five districts surveyed.26 California Air Resources Board, “Air Resources Board Compilation of District Rules and Poli-
cies for Back-up Generators,” 2001.
Notes

72
27 After a series of lawsuits brought against the U.S. EPA by environmental and community groups,the EPA must end California’s permit exemption for agricultural operation under the Clean AirAct. In the settlement, the EPA agreed to withdraw its approval of California’s Title V program,which exempted agricultural sources of air pollution. Until the California legislature amends thestate law to remove the exemption, which it must do before November 2003 to avoid sanctions,the EPA will retain regulatory authority over agricultural sources.
28 California Air Resources Board, “Draft Airborne Toxic Control Measure to Reduce Diesel Par-ticulate Matter Emissions from New Stationary Diesel-Fueled Engines,” April 4, 2002.
29 Ibid.30 Leslie Berkman, “Generator Business Booming,” Press-Enterprise (Riverside, CA), January 13,
2001, p. C-11.31 Ibid.32 Joseph Menn, “Silicon Valley Scrambling for Protection against Blackouts,” Los Angeles Times,
January 8, 2001, p. A-1.33 Matthew Yi, “Alameda Public Utility Rents Four Backup Generators,” San Francisco Chronicle,
April 19, 2001, p. A-18.34 Rich Saskal, “Annex Back-up Power Wanted,” Press Democrat (Riverside, CA), February 13,
2001, p. B-01.35 Seema Mehta, “Black-outs May Test the Sewer Districts,” Los Angeles Times (Orange County
ed.), June 22, 2001, p. CA-1.36 Berkman, “Generator Business Booming.”37 California Air Pollution Control Officers Association, “Operation of Diesel Engines during the
Energy Crisis,” mimeo, November 2, 2001, p. 1.38 California Independent Systems Operators, System Status Log. Available online at http://www.
caiso.com/docs/09003a6080/08/8a/09003a6080088aa7.pdf.39 California Public Utilities Commission, “Energy Division’s Report on Interruptible Programs
and Rotating Outages,” February 2001.40 Lois Hutchinson, “Energy Crunch Causes Flow of Conservation Dollars,” Energy User News,
July 1, 2001, p. 28.41 Energy Division’s Report.42 Charles Levin, “Government Center Decides on Backup Diesel Generators,” Ventura County
Star, February 13, 2001, p. B01.43 David Montero, “County Could Have Power, Still Save on Electricity,” Ventura County Star,
May 5, 2001, p. A01.44 California Air Pollution Control Officers Association, “Operation of Diesel Engines during the
Energy Crisis,” p. 1.45 Ibid., p. 3.46 Ibid.47 CARB Diesel is a California-certified diesel fuel with significantly reduced sulfur and hydrocar-
bon content and emissions. California diesel regulations were adopted in 1988 and enacted in1993. The regulation caps sulfur content at 0.5 percent, about one fifth the level of non-regulateddiesel fuel. The lower sulfur content reduces emissions of both sulfur dioxide and particulatematter. The aromatic hydrocarbon content is capped at 10 percent, about one third the level ofnormal diesel fuel. The lower levels of aromatic hydrocarbons reduce emissions of both particu-late matter and NOx. See http://www.arb.ca.gov/fuels/diesel/dieselfs.pdf for more information.
48 CAPCOA memo, p. 3.49 South Coast Air Quality Management District, “Emergency Standby ICE Survey: Summary of
Operating Hours 7-1-99 to 9-31-01.” Available from the AQMD through public informationrequest.
50 California Independent Systems Operators, System Status Log.51 North American Electric Reliability Council, “2001 Summer Special Assessment: Reliability of
the Bulk Electricity Supply in North America,” May 2001, p. 11.52 Chris Bowman, “Davis to Push Backup Diesel,” Sacramento Bee, May 24, 2001, p. A-1; and Cali-
fornia Energy Markets n. 619, May 25, 2001, p. 12.53 Bowman, “Davis to Push Backup Diesel.”

73
54 California Public Utilities Commission, Decision 01-06-009 (Rulemaking 00-10-002), “InterimOpinion on Rolling Blackout Reduction Program,” June 7, 2001.
55 San Diego Gas & Electric Company, “August 2001 Report on Interruptible and Outage Pro-grams,” September 7, 2001.
46 California Independent Systems Operators, System Status Log.57 Cal. Sen. 38, 2001-02 1st ex. sess., April 16, 2001.58 South Coast Air Quality Management District, Rule 118 Executive Order #01-01. Available
online at http://www.aqmd.gov/news1/exec_order_01_01.htm.59 See, for example, Severin Borenstien, “The Trouble with Electricity Markets and California’s
Electricity Restructuring Disaster,” POWER Working Paper no. PWP-081, University of Cali-fornia Energy Institute, Berkeley, CA, September 2001; Eric Hirst, “The California ElectricityCrisis: Lessons for Other States,” report prepared for the Edison Electric Institute, July 2001;and Justin A. Colledge, et. al., “Power by the Minute,” McKinsey Quarterly, no. 1, 2002.
60 Quoted in California Energy Markets, n. 588, October 13, 2000, p. 12.61 Ibid.62 Ahmed Faruqui, Joe Hughes, and Melanie Mauldin, “Real Time Pricing in California: R&D
Issues and Needs,” report prepared for the California Energy Commission, October 28, 2001;and Eric Hirst and Brendan Kirby, “Retail-Load Participation in Competitive Wholesale Elec-tricity Markets,” report prepared for Edison Electric Institute (Washington, DC) and Project forSustainable FERC Energy Policy (Alexandria, VA), January 2001.
63 Hirst and Kirby, “Retail-Load Participation in Competitive Wholesale Electricity Markets,”p. 17.
64 Primen, “Research Highlights: Distributed Energy Market Survey 2001.” Available online athttp://www.primen.com/about/pr_strong.asp.
65 U.S. Environmental Protection Agency, “Health Assessment Document for Diesel Exhaust,”SAB Review Draft, July 2000.
66 California Air Resources Board, “Proposed Identification of Diesel Exhaust as a Toxic Air Con-taminant, Initial Statement of Reasons for Rulemaking,” as approved by the Scientific ReviewPanel, April 22, 1998.
67 South Coast Air Quality Management District, “Multiple Air Toxics Study in the South CoastAir Basin (MATES-II),” March 2000. Available online at http://www.aqmd.gov/matesiidf/es.pdf, accessed on February 2, 2002.
68 California Air Resources Board, “Diesel Risk Reduction Plan,” October 2000.69 Scorecard, 2002, calculated from 1999 EPA National-Scale Assessment of Air Toxics data.70 Ibid.71 California Office of Environmental Health Hazard Assessment, Air Toxicology and Epidemiol-
ogy Section, “Proposed Identification of Diesel Exhaust as a Toxic Air Contaminant, app. 3, partB: Health Risk Assessment for Diesel Exhaust,” as approved by the Scientific Review Panel,April 22, 1998. Available online at ftp://ftp.arb.ca.gov/carbis/regact/diesltac/partb.pdf, accessedon January 20, 2002.
72 California Air Resources Board, “Risk Reduction Plan,” app. 5, p. 5.73 U.S. Department of Health and Human Services, “Ninth Report on Carcinogens,” National
Toxicology Program, Research Triangle Park, NC, 2000. Available online at http://ehis.niehs.nih.gov/roc/ninth/rahc/diesel.pdf, accessed on February 2, 2002.
74 California Office of Environmental Health Hazard Assessment and Air Resources Board, “Pro-posed Identification of Diesel Exhaust as a Toxic Air Contaminant.” Available online athttp://arbis.arb.ca.gov/toxics/dieseltac/finexsum.pdf, accessed on January 20, 2002.
75 California Energy Commission, “BUGS 1: Database”; and California Air Resources Board,“Risk Reduction Plan,” app. 2, p. 13.
76 Air Resources Board, Emissions Inventory 1995, Technical Support Division, October 1997.77 A.C. Lloyd and T.A. Cackette, “Diesel Engines: Environmental Impact and Control,” Journal of
the Air and Waste Management Association 51 ( June 2001): 809–47.78 J. Schwartz, D. Dockery, and L. Neas, “Is Daily Mortality Associated Specifically with Fine Par-
ticles?” Journal of the Air and Waste Management Association 46 (1996): 927–39.79 California Energy Commission, “Environmental Performance Report of California’s Electric
Generation Facilities,” July 2001.

74
80 California Air Resources Board, “Risk Reduction Plan,” app. 5, p. 5.81 Ibid.82 California Energy Commission, “BUGS 1: Database”; and California Air Resources Board,
“Risk Reduction Plan,” app. 2, p. 13.83 K. Donaldson, V. Stone, A. Clouter, L. Renwick, and W. MacNee, “Ultrafine Particles,” Occupa-
tional Environmental Medicine 58 (March 2001):211-16, 199; and R. D. Morris, “Airborne Par-ticulates and Hospital Admissions for Cardiovascular Disease: A Quantitative Review of theEvidence,” Environmental Health Perspectives 109 (August 2001, supp. 4): 495–500.
84 Schwartz et al., “Is Daily Mortality.”85 R. Wilson and J. Spengler, eds., “Particles in Our Air: Concentrations and Health Effects,” 1999.
p. 212.86 W. Pepelko and C. Ris, “Update on US Environmental Protection Agency Activities in the Assess-
ment of Mobile Source Air Toxics: Emissions and Health Effects,” proceedings of U.S. EPA/A&WMA International Specialty Conference, Air and Waste Management Association, 1992,pp. 193–200; and California Office of Environmental Health Hazard Assessment, Air Toxicologyand Epidemiology Section, “Proposed Identification of Diesel Exhaust as a Toxic Air Contaminant.”
87 California Energy Commission, “BUGS 1: Database”; and California Air Resources Board,“Risk Reduction Plan,” app. 2, p. 13.
88 Ibid.89 California Office of Environmental Health Hazard Assessment and American Lung Associa-
tion, “Health Effects of Diesel Exhaust: A Fact Sheet,” 2001.90 California Energy Commission, “BUGS 1: Database”; and California Air Resources Board,
“Risk Reduction Plan,” app. 2, p. 13.91 California Energy Commission, “California Distributed Energy Resources: DER Equipment.”92 The Bay Area AQMD now requires all BUGs greater than 50 hp to obtain a permit. Data on
Bay Area permits will be included in future updates of the CEC inventory. Brett Peterson andAndrew Saxon, “Global Increases in Allergic Respiratory Disease: The Possible Role of DieselExhaust Particles,” Annals of Allergy, Asthma, & Immunology 77 (October 1996): 263–70.
93 California Energy Commission, “BUGS 1: Database”; and California Air Resources Board,“Risk Reduction Plan,” app. 2, p. 13.
94 The Bay Area AQMD now requires all BUGs greater than 50 hp to obtain a permit. Data onBay Area permits will be included in future updates of the CEC inventory.
95 M.C. Madden et al., “Effect of Ozone on Diesel Exhaust Particle Toxicity in Rat Lung,” Toxicol.Appl. Pharmolcol 168 (2000): 140–48.
96 California Office of Environmental Health Hazard Assessment, Air Toxicology and Epidemiol-ogy Section, “Proposed Identification of Diesel Exhaust as a Toxic Air Contaminant”; and Cali-fornia Air Resources Board, “Proposed Identification of Diesel Exhaust as a Toxic AirContaminant.”
97 California Office of Environmental Health Hazard Assessment, Air Toxicology and Epidemiol-ogy Section, “Proposed Identification of Diesel Exhaust as a Toxic Air Contaminant,” app. 3,part B, and “Initial Statement of Reasons for Rulemaking.”
98 The Bay Area AQMD now requires all BUGs greater than 50 hp to obtain a permit. Data onBay Area permits will be included in future updates of the CEC inventory.
99 M. Lipsett and S. Campleman, “Occupational Exposure to Diesel Exhaust and Lung Cancer: AMeta-Analysis,” American Journal of Public Health 89 ( July 1999): 1009–17; R. Bhatia, P. Lopipero,and A. H. Smith, “Diesel Exhaust Exposure and Lung Cancer,” Epidemiology 9 ( January 1998):84–91.
100 Lipsett et al., “Occupational Exposure”; Bhatia et al., “Diesel Exhaust Exposure”; CaliforniaOffice of Environmental Health Hazard Assessment, Air Toxicology and Epidemiology Section,“Proposed Identification of Diesel Exhaust as a Toxic Air Contaminant,” app. 3, part B.
101 California Air Resources Board, Portable Equipment Registration Program.102 The Bay Area AQMD now requires all BUGs greater than 50 hp to obtain a permit. Data on
Bay Area permits will be included in future updates of the CEC inventory.103 California Air Resources Board, Portable Equipment Registration Program.104 The Bay Area AQMD now requires all BUGs greater than 50 hp to obtain a permit. Data on
Bay Area permits will be included in future updates of the CEC inventory.

75
105 Ibid.106 Ibid.107 California Air Resources Board, Portable Equipment Registration Program.108 The Bay Area AQMD now requires all BUGs greater than 50 hp to obtain a permit. Data on
Bay Area permits will be included in future updates of the CEC inventory.109 South Coast Air Quality Management District, “Emergency Standby ICE Survey.”110 American Academy of Pediatrics, “Ambient Air Pollution: Respiratory Hazards to Children,
American Association of Pediatrics News,” 1993. Available online at http://www.aap.org/pol-icy/04408.html, accessed on February 9, 2002; and P. Landrigan et al., “Children’s Health andthe Environment: A New Agenda for Prevention Research,” Environmental Health Perspectives106 (1998, suppl. 3): 787–94.
111 American Academy of Pediatrics, “Ambient Air Pollution.”112 Landrigan et al., “Children’s Health and the Environment.”113 Ibid.114 Berkman, “Generator Business Booming.”115 California Air Resources Board, “Risk Reduction Plan,” app. 2, p. 5.116 Ibid., app. 2, p. 13.117 California Energy Commission, “BUGS 1: Database of Public Back-up Generators (BUGS) in
California.”118 The Bay Area AQMD now requires all BUGs greater than 50 hp to obtain a permit. Data on
Bay Area permits will be included in future updates of the CEC inventory.119 Ibid.120 State and Territorial Air Pollution Program Administrators and the Association of Local Air
Pollution Control Officers, “Cancer Risk from Diesel Particulate: National and MetropolitanArea Estimates for the United States,” March 15, 2000. Available online at http://www.4cleanair.org/comments/cancerriskreport.pdf, accessed on February 2, 2002.
121 The Bay Area AQMD now requires all BUGs greater than 50 hp to obtain a permit. Data onBay Area permits will be included in future updates of the CEC inventory.
122 U.S. Department of Health and Human Services, “Ninth Report on Carcinogens.”123 U.S. Department of Health and Human Services, Public Health Service, Centers for Disease
Control, National Institute for Occupational Safety and Health, Division of Surveillance, Haz-ard Evaluations, and Field Studies, Surveillance Branch, “National Occupational Exposure Sur-vey, 1981-1983: Estimated Total and Female Employees, Actual Observation and Trade-NamedExposure to Products of Combustion—Diesel Fuels,” unpublished database cited at http://www.cdc.gov/niosh/88116_50.html according to Number of Exposed Workers section.
124 The Bay Area AQMD now requires all BUGs greater than 50 hp to obtain a permit. Data onBay Area permits will be included in future updates of the CEC inventory.
125 California Energy Commission, “California Distributed Energy Resources: DER Equipment.”126 California Air Resources Board, “Risk Reduction Plan,” app. 5, p. 5.127 AP-42 is available online at http://www.epa.gov/ttn/chief/ap42/.128 ISC is available online at http://www.epa.gov/ttn/scram/.129 A copy of ARS’s report to Environmental Defense is available on request.130 This work was performed by Professor William Nazaroff, Department of Environmental Engi-
neering, and Julian Marshall, graduate student in the Energy and Resources Group, University ofCalifornia at Berkeley. A copy of their report to Environmental Defense is available on request.
131 Lloyd and Cackette’s estimate of annual PM mortality includes the effects of 1.8µg/m3
of primary particles and 0.81µg/m3 of secondary particles, meaning particles formed in the airfrom precursor emissions. Note that while the present report focuses on diesel BUGs, Lloyd andCackette look at all diesel engines in aggregate, including on-road, off-road, and stationary dieselengines. By using their results, we are implicitly assuming that the formation of secondary PM2.5nitrate calculated by Lloyd and Cackette for all diesel engines also applies to diesel BUGs. Thisis correct only if the ratio of PM emissions to NOx emissions is the same for BUGs as for thediesel engines considered by Lloyd and Cackette. But this is not necessarily the case.
132 Actual BUG operating conditions such as engine load, exhaust temperature, volumetric flowrate, and meteorology affect the exposure from BUG emissions. Some of the assumptions madein this report for dispersion-modeling purposes, for example, assuming that BUGs operate at

76
full-load conditions rather than at no load or low load, may result in an overestimation or under-estimation of the actual exposure impact.
133 Risk Assessment Advisory Committee, A Review of the California Environmental ProtectionAgency’s Risk Assessment Practices, Policies, and Guidelines. Office of Environmental Health HazardAssessment, California Environmental Protection Agency, 1996), p. A-4.
134 Office of Environmental Health Hazard Assessment, “Air Dispersion Modeling: Technical Sup-port Document for Exposure and Stochastic Analysis,” chap. 2, September 2000. Available onlineat http://www.oehha.ca.gov/air/hot_spots/pdf/chap2.pdf.
135 A chronic cancer risk ten times greater than the de minimus level, or ten per million, is largeenough to warrant risk reduction actions. A risk greater than 100 times the de minimus level, or100 per million, may be significant grounds for denying a permit.
136For example, the ARB’s Risk Management Guidance for the Permitting of New StationaryDiesel-Fueled Engines (http://www.arb.ca.gov/diesel/documents/rmg.htm), recommends thatthe best available control technology be applied if the risk is greater than or equal to one in a mil-lion and that reasonably available control technology be applied when the risk is less than one ina million.
137 In the coastal regions of the California, the prevailing winds tend to blow more consistently in thedownwind direction. This causes average annual exposures in the downwind direction to be lowerwhen operation is confined to the summer months, as in the Summer 2001 Dispatch scenario.
138 The isopleth maps for each air district illustrate the influence of prevailing local weather condi-tions at one location in each district (usually the largest airport) for a hypothetical BUG. Actualdispersion patterns and health risks vary from one location to another within an air district basedon a number of factors, including microclimate effects, individual BUG characteristics, topography,and configuration of neighboring buildings.
139 Businesses employing fewer than ten persons and all government agencies are exempt from this law.140 Further information on this regulation is available online from http://www.oehha.org/prop65.html.141 Available online at http://www.oehha.org/prop65/prop65_list/12502LSTA.pdf.142 There are two reasons that the summer hours have higher maximum annual averages. First, in some
locations, the wind direction is more consistent during summer afternoons than during the wholeyear. This means that emissions from different hours are more likely to affect the same locationunder the Summer scenario than under the All scenario. Second, vertical dispersion is relativelystrong during summer afternoons because the sunlight warms the ground and causes unstableatmospheric conditions. Far away from the BUG, the greater mixing caused by this instabilityproduces lower concentrations; however, in the immediate vicinity of the BUG, increased disper-sion causes the plume to mix down to the ground rapidly, leading to high local concentrations.
143 See online http://www.nrdc.org/air/transportation/ebd/chap2.asp#table1.144 For an introduction and illustration of the intake fraction approach, see D. H. Bennett et al.,
“Defining Intake Fraction,” Environmental Science & Technology 36 (2002): 207A–211A.145 For an introduction to the intake fraction approach, see W. Nazaroff et al., “Environmental Health
Implications of Electricity Generation Choices: Pollutants of Concern and Exposure Issues,” paperpresented to the second Haagen-Smit Symposium, Lake Arrowhead, CA, April 9–12, 2002.
146 The results of the analysis were presented at the Haagen-Smit Symposium; see Nazaroff et al.,“Environmental Health Implications.”
147 Some of the mortality effects, for example, for cancer, would not be expressed in the same year asthe exposure.
148 J.L. Sadd, M. Pastor, T. Boer, and L.D. Snyder, “‘Every Breath You Take...’: The Demographicsof Toxic Air Releases in Southern California,” Economic Development Quarterly. Vol. 13, No. 2(1999):107–123. Rachel Morello-Frosch, M. Pastor, and J.L. Sadd, “Environmental Justice andSouthern California’s ‘Riskscape’ The Distribution of Air Toxics Exposures and Health RisksAmong Diverse Communities,” Urban Affairs Review, Vol. 36, No. 4 (March 2001): 551–578.V. Brajer and J.V. Hall, “Recent Evidence on the Distribution of Air Pollution Effects,” Contem-porary Policy Issues, Vol. 10 (1992): 63–71.
149 See figure 7-3 for an illustration of how the risk zone circles were derived from the modelingresults used in the health risk assessment.
150 The resolution of U.S. Census data used was the block group. Within major California cities, ablock group typically covers 10 to 25 square miles.

77
151 The U.S. Census Bureau’s definition of “white” includes some Hispanics who do not identify withanother race. For the purposes of this study, we included all Hispanics in the nonwhite category.
152 We assessed statistical significance using a one-tailed test, one-sample test. Since the district-level data are population statistics derived from the U.S. Census, we treated the mean and vari-ance of the proportion of EJ individuals in the entire district as population parameters and thevariances of the risk zone proportion as unknown. Under the null hypothesis, which holds thatthe composition of the risk zone’s population differs systematically from the district at large, thevariance of the risk zone is expected to be less than that of the district. Using the district levelvariance in our z-statistic therefore imparts a conservative bias to the test, making it less likelythat EJ impacts will be found to be statistically significant.
153 Available online at http://www.cde.ca.gov/resrc/factbook/fingertip.htm.154 Scorecard Background Diesel PM Data. Online at http://www.scorecard.org.155 California Air Resources Board, Guidance for the Permitting of Electrical Generation Technologies,
Sacramento, CA, Sepetmber 2001, p. 10.156 AP-42 is available online at http://www.epa.gov/ttn/chief/ap42/.157 ISC is available online at http://www.epa.gov/ttn/scram/.158 The annual averages in this report are the average of five annual averages (from five years of
meteorological data).159 Reference Exposure Level (REL) values are available online through the OEHHA website:
http://www.oehha.org/air/acute_rels/index.html160 AC Lloyd and TA Cackette. “Diesel Engines.” For a more detailed look at the health effects of
diesel, the reader may wish to review an analysis by the ARB and OEHHA, “Review of the Cal-ifornia Ambient Air Quality Standards For Particulate Matter and Sulfates,” Public ReviewDraft, November 30, 2001. As this latter document is currently in the draft stage, we do not useit in our analysis.
161 Pope et al. “Lung Cancer, Cardiopulmonary Mortality, and Long-term Exposure to Fine Partic-ulate Air Pollution.” Journal of the American Medical Association. 2002; 287:1132–1141. WhileLloyd and Cackette (2001) only provide estimates of total mortality, Pope et al. provide resultsbased on the cause of death. Their four categories for cause of death are all causes (i.e., total mor-tality), lung cancer, cardiopulmonary, and all causes other than lung cancer and cardiopulmonary.
162 Lloyd and Cackette estimate that each 1.8 µg/m3 of direct (primary) PM2.5 causes 0.18 µg/m3 ofindirect (secondary) PM2.5. Thus, the health effects due to primary and secondary PM2.5 are10% greater than the health effects of only primary PM2.5. The health effects presented here asattributable to each 1.8 µg/m3 of direct PM2.5 are the combined effects of direct and indirect PM2.5.
163 Lloyd and Cackette label the combined short- and long-term effects as “long-term exposuresmortality,” and then point out in a footnote that this category includes both short- and long-term effects.
164 Note that the value we used (3,566 deaths/year) is lower than the 95th percentile estimates,which were 4,341 and 5,257 deaths per year, respectively, for the two long-term studies.
165 Pope et al. op. cit.166 Lloyd and Cackette estimate that each 1.8 µg/m3 of direct (primary) PM2.5 corresponds to
0.81 µg/m3 of indirect (secondary) PM2.5 nitrate formation attributable to NOx emissions.Thus, the combined health effects due to primary and secondary PM2.5 are 45% greater than thehealth effects of only primary PM2.5. The health effects presented here as attributable to each1.8 µg/m3 of direct PM2.5 are the combined effects of direct and indirect PM2.5. Note thatwhile the present report focuses on diesel BUGs, Lloyd and Cackette look at all diesel engines inaggregate, including on-road, off-road, and stationary diesel engines. By using their results, weare assuming that the formation of secondary PM2.5 nitrate calculated by Lloyd and Cackettefor all diesel engines applies to diesel BUGs. This will only be correct if the ratio of PM emis-sions to NOx emissions is the same for BUGs as for the diesel engines considered by Lloyd andCackette. This is not necessarily the case. If the NOx-to-PM ratio is significantly higher forBUG engines than for those engines considered by Lloyd and Cackette, there will more sec-ondary PM2.5 formed by BUGs than Lloyd and Cackette calculate. Similarly, if the NOx-to-PM ratio is significantly lower for BUGs than for those engines considered by Lloyd andCackette, then less secondary PM2.5 will be formed by BUGs than Lloyd and Cackette calcu-late. Detailed analyses of the PM-to-NOx ratio for BUGs and other engines, and of secondary

78
PM2.5 nitrate formation from NOx emissions from BUGs, are beyond the scope of this work.The EPA’s compilation of emissions factors, called AP-42, does not distinguish between the enduse of the diesel engine (e.g., BUGs versus on-road engines), implying that differences betweenengine uses (i.e., diesel BUGs versus other diesel engines) are not overly important. Note that thevalue we used (3,566 deaths/year) is lower than the 95th percentile estimates, which were 4,341and 5,257 deaths per year, respectively, for the two long-term studies. Because of lack of availableinformation, we have not investigated the potential for synergistic effects between DPM, otherPM, and other air pollutants.
167 300 per million per µg/m3is the same as 0.000300 per µg/m3.168`Taken from the CARB Diesel Risk Reduction Plan Appendix II: Stationary and Portable Diesel-
Fueled Engines. Available online at http://www.arb.ca.gov/diesel/documents/rrpapp.htm.169 A survey of permitting regulations for BUGs indicates that most California air quality manage-
ment districts allow 100-250 hours of operation per year.170 Taken from EPA’s Compilation of Air Pollutant Emission Factors AP-42. Available online at
http://www.epa.gov/ttn/chief/ap42/index.html.171 This analysis uses information from the California Energy Commission’s BUGs database about
the number of BUGs in various ranges of generating capacity. The results, presented in CECAppendix 4-3, indicate that the average BUG size, weighted by the number of BUGs in eachcategory, is approximately 590 hp.


National Headquarters257 Park Avenue SouthNew York, NY 10010212-505-2100
Capital Office1875 Connecticut Avenue, NWWashington, DC 20009202-387-3500
California Office5655 College AvenueOakland, CA 94618510-658-8008
Rocky Mountain Office2334 North BroadwayBoulder, CO 80304303-440-4901
North Carolina Office2500 Blue Ridge RoadRaleigh, NC 27607919-881-2601
Texas Office44 East AvenueAustin, TX 78701512-478-5161
PROJECT OFFICES
18 Tremont StreetBoston, MA 02108617-723-2996
3250 Wilshire BoulevardSuite 1400Los Angeles, CA 90010213-386-5501