SMALL PILOT SCALE STUDY FOR NEW (HYBRID VERTICAL …
97
Transcript of SMALL PILOT SCALE STUDY FOR NEW (HYBRID VERTICAL …

SMALL PILOT SCALE STUDY FOR NEW
WASTEWATER TREATMENT PROCESS: HyVAB
(HYBRID VERTICAL ANAEROBIC BIOFILM)
María del Mar Batista Seguí
Department of Mathematical Sciences and Technology (IMT)
Norwegian University of Life Sciences (NMBU)
May 2014
Thesis submitted to NMBU in partial fulfillment of the requirements for
MSc Environment and Natural Resources: Specialization Sustainable Water and Sanitation,
Health and Development

I
ABSTRACT
Due to strict pollutant discharge limits the wastewater industry faces the challenges to find
more effective treatments but without increasing energy, space requirements or operational
cost, especially for industrial wastewater with high amount of pollutants, such as chemical
oxygen demand (COD). Conventional biological treatments have shown good treatment
efficiency for this type of industrial wastewater, but these systems have operational
limitations (large space requirements, no possibility of biogas collection or long retention
times). High rate integrated bioreactors are able to overcome these limitations. This type of
reactor combines wastewater processes in a single bioreactor unit that are normally done in
separate steps.
The objective of this study is to investigate the start-up and the treatment performance of the
novel high rate aerobic–anaerobic reactor called the Hybrid Vertical Anaerobic Biofilm
(HyVAB). The reactor operates as a single treatment unit consisting in two chambers
connected vertically. The upper chamber is working using Continuous Flow Intermittent
Cleaning (CFIC) system, which is a technology developed by Biowater AS, and the lower
chamber incorporates the Up Flow Anaerobic Sludge Blanket (USAB) technology. HyVAB
offers important improvements for biological wastewater treatment systems. These are: less
space requirements, lower sludge production and biogas collection without compromising the
COD removal treatment efficiency. The biogas can be used as a renewable source of energy.
The study was carried out with two different sized pilot scale reactors placed in different
locations treating high strength wastewater (COD >10.000 mg/L) sourced from Norsk
Spesialolje (NSO), Kambo (Norway). The main findings are that the start-up was
accomplished in only 20 days. During the 20 days, HyVAB exhibited treatment efficiencies
with an average of 82% COD removal and attaining 97% after three months of operation. The
reactor also recovered fast after periods of organic overloads The results make this reactor a
worthy candidate for further studies of economic feasibility and in steady state operations.

II
SAMMENDRAG
På grunn av strengere utslippskrav står avløpsbransjen overfor utfordringen med å finne mer
effektive behandlingsprosesser, men uten å øke energi, plassbehov eller operasjonelle
kostnader, spesielt for industrielt avløpsvann med høyt innhold av forurensende stoffer (det
vil si, med høy kjemisk oksygenforbruk, KOF). Konvensjonelle biologiske behandlinger har
vist god renseeffekt for denne typen av industrielt avløpsvann, men disse systemene har
vanligvis operasjonelle begrensninger (store plassbehov, ingen mulighet for biogass samling
eller lang oppholdstid). High rate integrated bioreaktorer er i stand til å unngå disse ulemper.
Denne type reaktor kombinerer flere vanlige avløpsrensingprosesser som normalt utføres i
separate trinn i en enkel enhet.
Målet med denne studien er å undersøke oppstart og utførelsen av den nye høy aerob -
anaerob reaktoren nevnt Hybrid Vertikal Anaerob Biofilm (HyVAB). Reaktoren opererer som
en enkelt behandlingsenhet som består i to kameer som er koblet vertikalt. Det øvre
kammeret fungerer ved hjelp av Continuous Flow Intermittent Cleaning (CFIC) system,
som er en teknologi utviklet av Biowater AS. Det nedre kammeret inkorporerer Up Flow
Anaerobic Sludge Blanket (USAB) teknologi. HyVAB tilbyr viktige forbedringer for
biologisk avløpsrensingsystemer: mindre plassbehov, lavere slamproduksjon og samling av
biogass uten å redusere renseeffekten (KOF fjerning). I tillegg kan biogass brukes som en
fornybar energikilde.
Studien ble utført med to pilotskala-reaktorer med ulike størrelse som var plassert på
forskjellige steder. Begge to behandlet høyforurenset avløpsvann (KOF > 10,000 mg/L)
hentet fra Norsk Spesialolje (NSO), Kambo (Norge). Hovedfunnene er at oppstarten ble
oppnådd på bare 20 dager. I løpet av disse 20 dagene, oppnådde HyVAB
behandlingseffektiviteter med et gjennomsnitt på 82 % KOF fjerning og 97 % etter tre
måneders drift. Reaktoren utvant også raskt etter perioder med organiske overbelastning..
Resultatene gjør denne reaktoren til en god kandidat for videre studier av økonomisk
gjennomførbarhet og rensingeffektivitet i steady-state avløpsvannbehandling.

III
ACKNOWLEDGEMENTS
First of all I would like want to thanks Biowater AS for giving me the opportunity of being
part of this exciting and challenging research project. Thanks to Jon, Terje, Lars, Atle, Peter
and especially to Karolina and Morten who made my work much easier providing everything
that I needed. Thank you also to Norsk Spesialolje (NSO), especially to Vidar, who was
always willing to help me. I owe Elin Måleng Tingstad huge thanks for teaching me some of
her lab skills, for taking care of me and for her big smile everyday for almost a year. It was a
pleasure to work with all of you.
My special thanks to my advisors: Dr. Lars J. Hem (NMUB) and Dr. Gang Xin (Biowater).
Thank you Lars for your support and guidance during this process. Thank you Gang for your
patience, thank you for your advices, thank you for sharing with me the beauty and the
challenges of research.
I also wish to thanks all the people that had made possible this master and this thesis. To the
ones that supported being close and the ones that did it from the distance. Thanks to Paul
Beaumont from the Writing Center and Kristin Pedersen who read through the document and
helped with the English, Manuel Franco for the Norwegian translation and foremost my
special thanks to my dear friend Ronja Hüppe for keeping me sane and grounded.

IV
TABLE OF CONTENTS
1 INTRODUCTION 1
1.1 Wastewater treatment for industrial wastewater 2
1.2 Biological treatments for wastewater 3
1.3 Biogas production 4
1.4 Combined aerobic-anaerobic reactors 5
1.5 Objectives 6
2 LITERATURE REVIEW 7
2.1 Biological processes for wastewater treatment 7
2.1.1 Anaerobic suspended- growth treatment processes 8
2.1.2 Aerobic attach-growth treatment processes 9
2.2 Operational parameters in integrated anaerobic-aerobic reactors. 11
2.2.1 Temperature 11
2.2.2 Alkalinity, pH and volatile acids 12
2.2.3 Nutrients 12
2.2.4 Volumetric hydraulic load, hydraulic retention time organic loading rate. 13
2.3 Biogas potential production from high strength wastewater 14
2.3.1 Process microbiology 14
2.3.2 Process challenges 15
2.4 Start–ups strategies for combined reactors 16
3 MATERIALS AND METHODS 17
3.1 General description of the reactor 17
3.1.1 Wastewater preparation 19
3.1.2 Operating conditions and procedure 21
3.1.3 Sampling location, frequency and analyses 23
3.1.4 Seed sludge 24
3.1.5 Bioreactor start up 24
3.2 Analytical methods 24
4 RESULTS AND DISCUSSION 25
4.1 Tønsberg Bioreactor start up 25
4.1.1 Anaerobic process 25
4.1.2 Aerobic process 32

V
4.2 COD removal efficiency in Moss reactor 33
4.3 Sludge production 35
4.4 Biogas production 37
4.5 Mass balance 42
5 CONCLUSION 44
6 FUTURE RESEARCH NEEDS 45
7 REFERENCES 46

VI
LIST OF FIGURES
Figure 1: Schematic representation of an UASB reactor (Von Sperling & de Lemos
Chernicharo 2005) ............................................................................................................. 9
Figure 2 Principle of the MBBR and shape of the original biofilm carrier (K1). (a) Aerobic
reactor; (b) Anoxic and anaerobic reactor; (c) The biofilm carrier (K1) (Ødegaard
2006a) .............................................................................................................................. 10
Figure 3 The CFIC during a) normal operation, and during b) the cleaning cycle. Rusten et
al, 2011. ............................................................................................................................ 11
Figure 4 Metabolic pathways and microbial groups involved in anaerobic digestion (Lemos
Chernicharo 2007) ........................................................................................................... 15
Figure 5 Systematic diagram for HyVAB reactor ................................................................... 18
Figure 6 Processing diagram in NSO....................................................................................... 20
Figure 7 Process flow diagram of the wastewater treatment using HyVAB pilot plant. ......... 22
Figure 8 COD removal efficiency during start-up period. ....................................................... 26
Figure 9 COD removal efficiencies in the reactor ................................................................... 27
Figure 10 pH concentration along the reactor processes | .................................................. 28
Figure 11 VFA concentration along the height of the anaerobic compartment ....................... 28
Figure 12 COD loading, pH and VFA concentration on anaerobic bottom during start-up
period ............................................................................................................................... 31
Figure 13 BTW S biofilm carrier ............................................................................................. 32
Figure 14 DO in aerobic compartment .................................................................................... 32
Figure 15 Efficiency removal and COD loading and temperature in Moss reactor. ............... 34
Figure 16 Trend of sludge yield in Tønsberg reactor .............................................................. 35
Figure 17 Differences in yield between summer and winter in Moss reactor ......................... 36
Figure 18 Theoretical methane dissolved in HyVAB at different temperatures ..................... 41
Figure 19 Temperatures monitoring in Tønsberg´s pilot. ........................................................ 42
Figure 20 Mass balance for HyVAB ...................................................................................... 43

VII
LIST OF TABLES
Table 1 Average characteristics of selected wastewaters, (Hammer & Hammer 2004) and
(Latif et al. 2011) ............................................................................................................... 3
Table 2 Comparison of aerobic and anaerobic treatment (Chan et al. 2009) ............................ 5
Table 3 Design parameters of pilot scales HyVAB reactors ................................................... 18
Table 4 Characteristics of wastewater NSO (after adding chemicals) .................................... 20
Table 5 Required chemical dosage for HyVAB with a design flow of 100 L/day and influent
COD of 10000 mg/L ........................................................................................................ 21
Table 6 Main parameters monitored in the present study ........................................................ 23
Table 7 Sampling location, frequency and analysis. ................................................................ 23
Table 8 Values for theoretical methane production calculations with Lemos Chechinarro
(2007) method for Pilot reactor Tønsberg ....................................................................... 38
Table 9 Values for theoretical methane production calculations with Lemos Chechinarro
(2007) Pilot reactor Moss................................................................................................. 39
Table 10 Comparison of methane theoretical production ....................................................... 39
Table 11 Measured methane in Pilot reactor Moss .................................................................. 40
Table 12 Comparison of methane theoretical ......................................................................... 40

VIII
LIST OF ACRONYMS AND ABBREVIATIONS
HyVAB Hybrid Vertical Anaerobic Biofilm
CFIC Continuous Flow Intermittent Cleaning
BOD Biochemical Oxygen Demand
CH4 Methane
CO2 Carbon Dioxide
UASB Upflow Anaerobic Sludge Blanket
EU European Union
GHG Greenhouse Gas
CDM Clean Development Mechanism
COD Chemical Oxygen Demand
TSS Total Suspended Solids
VSS Volatile Suspended Solids
TS Total Solids
VS Volatile Solids
TN Total Nitrogen
TP Total Phosphorous
OiW Oil in Water
RBC Rotating Biological Contactors
MBBR Moving Bed Biofilm Reactor
VFA Volatile Fatty Acids
NaHCO3 Sodium bicarbonate
VHL Volumetric Hydraulic Load
HRT Hydraulic Retention Time
OLR Organic loading rate
DO Dissolved Oxygen
NSO Norsk Spesialolje
SP Sampling Point
POME Palm oil mill effluent

IX
APPENDIX: TABLES OF RESULTS
Appendix I: Results from Tønsberg reactor
Appendix II: Results from Moss reactor

1
1 INTRODUCTION
Trends in municipal and industrial wastewater management at the global level have changed
in the last century. The main drivers for these changes are the scarcity and pollution of
natural fresh water supplies due to the continued population growth and industrialization
(Chan et al. 2009). The pollution is produced by the discharge of inadequately treated water
from the municipality (households, hospitals, schools, etc.) and industries. This inadequately
treated water can contain contaminants that can be naturally treated by ecosystems but not if
the amount of discharge is high (over 1000 mg/L). There are some industries that produce
wastewater with high levels of pollutants (oil and food processing, textile or pulp and paper);
hence, these industries’ effluent treatment face special challenges regarding cost
effectiveness.
Combating this threat of pollution and water scarcity is a significant environmental priority
for many governments. For example, the European Union has developed strict pollutant
discharge requirements in their environmental policies, also international organizations have
stringent regulations about luxury ocean cruise and passenger ships where zero discharge is
compulsory (Phattaranawik & TorOve 2010). However, the industries that produce the
contaminants perceive these requirements to be a burden leading to additional costs because
more treatment means more space requirements and energy consumption. Moreover, the
instability in energy prices has encouraged wastewater treatment systems to use sustainable
technology that provides renewable energy, low operation and maintenance costs with small
space requirements but without compromising the quality of the effluent (Phattaranawik &
Leiknes 2011).
To have a successful treatment process it is important to choose the right combination and
sequence of treatment methods. Anaerobic- aerobic treatments have shown great performance
during last decades, but these conventional systems have some operational limitations (big
space requirements, difficulties in biogas collection or long retention times). These
limitations can be addressed with the use of high rate integrated bioreactors, which are
considered a promising sustainable wastewater treatment technology. The main characteristic
of this type of reactor is the combination of wastewater processes in a single bioreactor unit
that are normally done in separate steps (Chan et al. 2009).

2
A single reactor unit with the combination of anaerobic-aerobic treatment can enhance the
overall efficiency of the system plus be cost effective and efficient with small footprint (Chan
et al. 2012). In addition, biogas produced in the digestion can potentially be collected and
used as a renewable source of energy (Tauseef et al. 2013). However, there is a lack of
evaluation of these reactors in large-scale implementation. Further improvements on biogas
collection and the use of suspended media are considered essential (Chan et al. 2009).
The treatment potential for such reactors must be examined and optimized through new
scientific investigations. The objective of this research is to propose a new combined aerobic
–anaerobic reactor configuration that operates as a single treatment unit, called the Hybrid
Vertical Anaerobic Biofilm (HyVAB). The innovation of this reactor is that includes a new
technology called Continuous Flow Intermittent Cleaning (CFIC) in the aerobic stage. In this
thesis, the design, start up and steady state performance treating high organic strength
industrial wastewater are investigated.
1.1 Wastewater treatment for industrial wastewater
Industrial and urban wastewaters have different characteristics not only in the components
but also in the ranges of pollutants (Table 1). Industrial wastewater with pollutant limits
within municipal wastewater can be discharged to the municipal sewer system and be treated
by the municipality. However, industrial wastewater with high levels of contaminants must
be pre-treated before discharge either to the municipality sewage system or directly to the
environment. For example, the organic content of industrial wastewater can be within 5-20
times greater that urban wastewater and if the treatment plant is not designed to treat these
water characteristics it would result in a treatment process failure. The treatment of industrial
wastewater with high levels of certain compounds have specific challenges that must be taken
into account to achieve a successful treatment (Hammer & Hammer 2004).

3
Table 1 Average characteristics of selected wastewaters, (Hammer & Hammer 2004) and
(Latif et al. 2011)
Type of water BOD
(mg/L)
Total solids
(mg/L)
Suspended
solids
(mg/L)
Nitrogen
(mg/L)
Phosphorous
(mg/L)
Urban wastewater 200 800 240 35 7
Milk processing 1000 1600 300 50 12
Meat packing 1400 3300 1000 150 16
Synthetic textile 1500 8000 2000 30 0
Palm oil mill effluent
(POME)
11000-
30000 43635 9000-25000 500-900 -
Dairy wastewater 1940 1560 830 51 22
1.2 Biological treatments for wastewater
Wastewater treatment must be designed for a specific project after defining the treatment
objectives. These treatment objectives have to be established according to the international,
state and local regulations. Afterwards, the treatment degree will be determined by comparing
the influent characteristics with the effluent characteristics. To achieve this treatment degree
a number of different methods can be used depending on the principle involved: physical,
chemical and biological (Metcalf & Eddy, Inc. 1991). This research focuses on biological
treatment processes because they are used to remove biodegradable organic substances.
Biological treatments are derived from processes that occur on nature carried out by
microorganisms. Microorganisms transform the contaminants into gases that are released into
the atmosphere as well biological cell tissue that can be easily removed from wastewater by
settling. By controlling the environment of these microorganisms, the process can be sped up
to obtain greater efficiency in the cleaning process.
The biological processes used for wastewater treatment can be divided in five major groups,
depending on the environment characteristics: aerobic, anoxic, anaerobic, combined and
ponds. They can be subdivided depending on where the microbial activity takes place:
suspended, attached or combined growth systems. Biological treatment systems are usually
applied to the removal of carbonaceous organic matter, nitrification, denitrification,
phosphorous removal and waste stabilization (Metcalf & Eddy, Inc 1991). The most common
biological treatments processes are anaerobic and aerobic. Anaerobic treatment is the

4
degradation of waste into a variety of products in the absence of oxygen, including methane
(CH4) and carbon dioxide (CO2). Conversely, aerobic treatment uses free or dissolved oxygen
by microorganisms, which it converts into biomass and CO2.
1.3 Biogas production
As mentioned previously, aerobic processes have the potential of producing methane gas that
can be collected and used as a renewable source of energy. The goal of the European Union
(EU) is that 20% of the overall energy consumption of the EU has to come from renewable
energy by 2020; however, nowadays this percentage is around 9%. Biogas can help to
achieve this goal because it can be used for energy production. Moreover, biogas production
can also help to achieve another 2020 EU goal: reducing the deposition of biodegradable
municipal wastewater into landfills to 50% by reducing of sludge during aerobic digestion
(Havukainen et al. 2014). Due to this priority, the production and improvement of biogas has
gained importance in the recent years among researchers.
There are different ways of producing biogas: manure, landfills and digestion of wastewater
sludge. Anaerobic digestion of sludge, in addition of the traditional role in the wastewater
treatment, has the possibility of contributing to reduction of greenhouse gas (GHG) emissions
by capturing the methane that otherwise will be released to the atmosphere. Biogas
production can also be used as a secondary source of income by taking advantage of the
Clean Development Mechanism (CDM) under the Kyoto Protocol by shortening the payback
time of investments related with the technology (Chan et al. 2009). Not implementing
technologies to take advantage of biogas production would result in a clear waste of
possibilities towards achieving less costly and more sustainable treatment processes.

5
1.4 Combined aerobic-anaerobic reactors
Each treatment process has strengths and weaknesses (Table 2), such as the energy
requirement or the sludge production or the start-up time.
Table 2 Comparison of aerobic and anaerobic treatment (Chan et al. 2009)
Feature Aerobic Anaerobic
Organic removal efficiency High High
Effluent quality Excellent Moderate to poor
Organic loading rate Moderate High
Sludge production High Low
Nutrient requirement High Low
Alkalinity requirement Low High for certain industrial
water
Energy requirement High Low to moderate
Temperature sensitivity Low High
Start-up time 2-4 weeks 2-4 months
Odour Less opportunity odours Potential odours problems
Bioenergy and nutrient recovering No Yes
Mode of treatment Total (depending on
feedstock characteristics)
Essentially pre-treatment
When anaerobic and aerobic processes alone do not accomplish the treatment efficiency
required, combined treatments can be implemented and they are promising in terms of high
organic matter removal efficiency, smaller sludge production and no pH correction. The
benefits of integrated anaerobic-aerobic processes have been summarized by Chan et al.,
(2009, page 2):
- Great potential of resource recovery: biogas production by anaerobic digestion of the
organic pollutants.
- High overall treatment efficiency: the aerobic treatment after the anaerobic on results
in very high overall treatment efficiencies while smoothes out the fluctuation quality
in the anaerobic treatment.
- Less disposal of sludge: by digesting the excess of aerobic sludge in the anaerobic
tank.

6
- Low energy consumption: anaerobic pre-treatment as an equalization tank of the
influent, which means that the daily quality fluctuations are balanced with the
consequence reduction in oxygen demand and aeration needs in the tank.
In the simplest anaerobic-aerobic treatments, for example stabilizations ponds and natural or
artificial wetlands, aerobic processes take place in the upper part of the reactor and anaerobic
in the bottom. These simple treatment processes need a long retention time, low organic loads
and large treatment areas and they normally achieve low treatment efficiencies. To overcome
these disadvantages, new technologies using high rate anaerobic-aerobic bioreactors have
been developed and nowadays a wide range of these bioreactors are available such as the
upflow anaerobic sludge blanket (UASB), fluidized bed reactor, membrane bioreactor, etc.
These reactors can achieve high quality discharge effluent while being economically viable
and sustainable through resource recovery. A further treatment technology is to combine both
zones in one within single bioreactor with or without physical separation (Chan et al. 2009).
The reactor tested in this investigation was designed using a process technology combining
both zones within a single reactor. Its is called the Hybrid Vertical Anaerobic Biofilm reactor
(HyVAB) and it is under development by Biowater Technology AS. HyVAB removes
organic matter from high strength industrial wastewater to produce effluent suitable for
discharge while also producing methane gas as a source of renewable energy. Less space is
required and it has lower costs than current biological treatments processes.
1.5 Objectives
The objective of this study is to investigate the treatment performance of the novel high rate
integrated anaerobic-aerobic reactor Hybrid Vertical Anaerobic Biofilm Bioreactor (HyVAB)
through a small-scale pilot study. This research investigates the overall performance,
treatment efficiencies and biogas production under different treatment conditions. The
specific objectives of the study are:
- Study the start-up process of the reactor.
- Determine the effect of the influent temperature in the chemical oxygen demand
(COD) removal efficiency.
- Determine the effect of the organic loading in the COD removal efficiency.
- Study the sludge production.
- Study the biogas production.

7
2 LITERATURE REVIEW
Industrial wastewater treatment has specific challenges compared with urban wastewater
treatment. While urban wastewater effluents have stable characteristics, industrial wastewater
processes have to deal with changes in influent properties depending on the process.
Moreover, they can experience flow variations because of operational issues and
consequently, waste streams can be periodic in nature. There are some industries that
discharge wastewater with high levels of pollutants; this wastewater is called high strength
industrial wastewater.
High strength industrial wastewater is difficult to define. It is called such because it contains
large amounts of components like chemical oxygen demand (COD), ammonium or total
suspended solids (TSS) (Mutamim et al. 2012). Some of these industries with high COD, oil
and grease effluents face big challenges to discharge with acceptable levels. Usually,
treatments solutions for this special wastewater require long hydraulic retention times, large
areas to place the treatments and difficulties in methane collection (Chan et al. 2012).
However, meeting the discharge requirements does not necessary lead into additional costs if
the right technology is used as for example biological treatments in integrated aerobic-
anaerobic reactors.
2.1 Biological processes for wastewater treatment
As mentioned before, biological treatments are processes where microorganisms are involved
in the degradation of organic matter. They are natural processes where microorganisms use
organic compounds as a carbon and energy source to produce various gases and cell tissue
(biomass). Afterwards, the cell tissue produced will settle due to greater specific gravity than
water and can be easily removed. There are some basic conditions that should take place to
optimize the process. First, the microorganisms have some nutritional requirements to
reproduce and function, the most important are: carbon, energy source and nutrients (major:
N, S, P, K, Mg, Ca, Fe, Na and Cl and minor: Zn, Mn, Mo, Se, Co. Cu, Ni, V and W).
Secondly, there are also environmental requirements that have an important role in survival
and bacterial growth; the most important are pH and temperature. Every group of
microorganisms has an optimum range of temperature and pH; the most common are 25-40ºC
for temperature and 6 -8 for pH.

8
The biological processes used for wastewater treatment can be divided in five major groups
depending on the environment characteristics: aerobic, anoxic, anaerobic, combined and pond
processes. A further subdivision can be done depending on where the microbial activity takes
place: suspended, attached or combined growth systems (Metcalf & Eddy, Inc 1991). The
HyVAB design is based on anaerobic suspended-growth and aerobic-attached treatment
processes.
2.1.1 Anaerobic suspended- growth treatment processes
The anaerobic digestion involves the decomposition of organic and inorganic matter in the
absence of molecular oxygen in a multistep process. The process consists of the breakdown
of long chain organic compounds into organic acids and some gas by-products of CO2, CH4
and HS-. Afterwards, the organic acids are converted into methane and CO2. This process is
carried out by acid-splitting methane forming bacteria. A good balance of these two steps will
result in a successful digestion process (Hammer & Hammer 2004). Anaerobic treatment
systems present clear advantages compared with other biological process: low construction
costs, small land requirements, low sludge production and easy operation and maintenance
requirements. Anaerobic processes offer the possibility to generate biogas production.
Additionally, anaerobic treatment is stable in terms of COD removal efficiency, pH and
recovery time (Latif et al. 2011).
Many different types of reactors have been developed to operate anaerobic processes. The
Upflow Anaerobic Sludge-Blanket Process (UASB) (Figure 1) is one of them and it has been
successfully investigated in treating different types of wastewater (slaughterhouse, food
processing, olive mill residues, pulp-bleaching, manure or brewery) (Puyol et al. 2011). The
operating procedure of the reactor consists of the influent flowing from the bottom to the top
of the reactor. The cleaning process takes place in a the dense sludge bed formed by the
accumulation of suspended solids and bacteria growth (Latif et al. 2011) and the sludge
blanket is formed by the upflow velocity. Gas collection happens when the gas bubble that is
attached to the substrate flows upwards until it hits the top of the reactor where the collector
is. Here, the gas will be released and the flocks will fall back to the sludge blanket in
suspension.

9
Figure 1: Schematic representation of an UASB reactor (Von Sperling & de Lemos
Chernicharo 2005)
One of the main advantages of the UASB reactors is that in UASB reactors there is no need
of mixing because the flow of the gas produced and with the upflow will reproduce the
mixing effect., Therefore no mixing needs makes the process less energy consuming. Another
advantage of this technology is that the granulation of the sludge that occurs from the process
retains a high concentration of active sludge, which allowing for higher organic loads. Also,
and achieves COD removal efficiencies are around 65-75%. In addition, the UASB reactor is
compact, ; it has low constructions and operation costs, and, with good sludge production that
can be easily dewatered. However, the reactor also presents some disadvantages: it can cause
bad odors, it is does not good perform welling when toxic compounds are load present, it
requires a long start up if there is not seed sludge and in most cases the need of post-treatment
in most of the cases is needed (Von Sperling & de Lemos Chernicharo 2005).
2.1.2 Aerobic attach-growth treatment processes
The processes based on attached biofilm have recently been favoured over activated sludge
processes. The main reason is that they require less space, the process is less influenced by
biomass separation and the attached biomass becomes more specialized (Ødegaard 2006b).
There are many biofilm systems: trickling filters, rotating biological contactors (RBC), fixed
media submerged biofilters, granular media biofilters, fluidized bed reactors, etc. However,
all of them present advantages and disadvantages.

10
The moving bed reactor (MBBR) is one of these treatments. It uses the whole volume of the
tank to operate. Contrary to the activated sludge reactor, it does not need any recycling (Fig.
2). The reason behind this is because the MBBR processes biomass growth on carriers that
move freely all over the reactor and only the surplus biomass has to be separated. The reactor
can be used for both, aerobic and anaerobic processes. The MBBR process has been used for
many different applications (nitrogen removal and organic matter removal). Advanced
technologies like CFIC based on MBBR are being researched to improve the benefits.
Figure 2 Principle of the MBBR and shape of the original biofilm carrier (K1). (a) Aerobic
reactor; (b) Anoxic and anaerobic reactor; (c) The biofilm carrier (K1) (Ødegaard 2006a)
The CFIC process is a new technology developed by Biowater Technology with the help of
external R&D institutions and it is expected to be the next generation of biofilms reactors. It
consists of a two-step process. First, highly packed biofilm carriers (90-99% bulk volumetric
fill) in the reactor prevent biocarriers from free movement. These conditions create high
carbon and nutrient gradients inside the biofilm. If the reactor is aerated, the efficiency of the
oxygen transfer will be increased since the air bubbles have to travel though the compact
biocarriers. This means that there are longer retention times until the bubble reaches the
surface, thus creating a “filter” to reduce solids in the effluent. Secondly, cleaning cycles
where the level of the reactor is elevated slightly provides free movement to the carriers

11
(Fig.3). This condition will wash out the excess of biomass removed from the carriers due to
the turbulences and collisions inside the reactor (Rusten et al. 2011).
a) Normal operation b) Cleaning cycle
Figure 3 The CFIC during a) normal operation, and during b) the cleaning cycle. Rusten et
al, 2011.
Biowater Tecbnology tested the treatment efficiency in parallel with MBBR process and
results showed that the produced influent had lower FCOD and TSS concentrations than
MBBR, even at higher biofilm surface area, loading rates and significantly higher volumetric
loading rates. The cleaning process removed accumulated biomass from the biofilm carriers
by cleaning once a day (Rusten et al. 2011).
2.2 Operational parameters in integrated anaerobic-aerobic reactors.
Anaerobic-aerobic treatments can be a feasible solution when anaerobic or aerobic processes
alone do not accomplish the required treatment efficiencies. In many treatment plants they
have been used to combine economic and operational advantages of both treatment systems.
However, the use of both systems in integrated reactors, in which anaerobic and aerobic
zones share the same treatment unit, is a new way to overcome the disadvantages of
anaerobic and aerobic treatments alone. The design is based on certain operational parameters
that command the performance of the reactor.
2.2.1 Temperature
Temperature is the most important factor affecting biological processes. Microorganisms
cannot control internal temperature so the ambient temperature determines their temperature.
There are three temperature ranges for bacterial growth: psysophylic (4-15ºC), mesophilic
(20-40ºC) and thermophilic (45-70ºC). Each range of temperature has a minimum, optimum
and maximum for bacterial growth.

12
Mesophilic and thermophilic reactors are associated with better anaerobic digestion.
Although, thermophilic reactors use to performance better after start up periods, they are
more unstable and the extra energy consumption needed to reach the necessary temperature
make it a disadvantageous process (Latif et al. 2011). It is important to maintain uniform
temperatures because anaerobic processes are sensitive to changes and it will cause process
failure (Von Sperling & de Lemos Chernicharo 2005).
2.2.2 Alkalinity, pH and volatile acids
Alkalinity, pH and volatile acids are closely related in the operation of anaerobic processes.
Microorganisms have an optimum growth at pH levels between 6 and 8; levels below 4 and
above 9.5 are not tolerated since they inhibit the growth of methanogenic microorganisms
(Latif et al. 2011; Von Sperling & de Lemos Chernicharo 2005). This pH dependence has a
practical implication. The acid-producing bacteria are less sensitive to pH changes than the
methanogenic microorganisms. That implies that low pH in the reactor will produce acids but
not methane. The pH can be affected in an anaerobic reactor by volatile fatty acids (VFA).
Their accumulation will cause a pH drop and consequently a reactor failure by inhibiting the
methanogenesis. For this reason, pH in the influent and VFA should be closely motorized. In
order to control pH, alkalinity can be maintained by the addition of alkalinity supplements
like NaOH or NaHCO3.
VFA are fatty acids with a carbon chain of six or fewer, such as acetic, propionic, i-butyric,
n-butyric, i-valeric and n-valeric. They are intermediate products of the anaerobic digestion.
The measurement of VFA concentration is commonly used as a control test for anaerobic
digestion since a VFA accumulation reflects a kinetic disequilibrium between the acids
producers and the acids consumers (Switzembaum et al., 1990) and is an indicator of process
destabilization.
2.2.3 Nutrients
Biological treatments are based in microorganism activity, so the necessary nutrients should
be supplied to provide an adequate environment for optimum bacterial growth. Depending on
the source of wastewater, it may or may not contain the basic nutrients. Usually, domestic
water contains the main elements but industrial wastewater does not. In this case, they can be
added as supplement in to the wastewater. The main nutrients that microorganism need are:

13
nitrogen, sulphur, phosphorus, iron, cobalt, nickel, molybdenum, selenium, riboflavin and
vitamin B12 (Von Sperling & de Lemos Chernicharo 2005).
2.2.4 Volumetric hydraulic load, hydraulic retention time organic loading rate.
The volumetric hydraulic load is the amount (volume) of wastewater applied daily to the
reactor per unit of volume:
VHL = volumetric hydraulic load (m3/m
3·d)
Q = flow rate (m3/d)
V = total volume of the reactor (m3)
The hydraulic retention time is the reciprocal of the volumetric hydraulic load:
HRT = hydraulic retention time
Q = flow rate (m3/d)
V = total volume of the reactor (m3)
Organic loading rate is the mass of organic matter applied daily to the biofilter, per unit
volume of the packing medium and expressed in mg COD/day.
OLR = organic loading rate
Q = flow rate (m3/d)
V = total volume of the reactor (m3)
COD= Chemical oxygen demand (mg/L)
In CFIC processes, the aeration plays a double role: adequate supply of oxygen for the
microbial oxidation and improving the turbulence in the chamber to fluidized the bacterial
biofilm. The selection of the aeration mode it is important for the efficiency of the treatment

14
systems (Li et al. 2011). The Dissolved Oxygen (DO) in the aerobic reactor should not be
less than 2 mg/L to maintain a good microbial growth and activity.
2.3 Biogas potential production from high strength wastewater
An increasing interest on renewable energy sources such as biogas from waste has resulted in
an increase of research activities in this field. High strength industrial wastewater has a high
organic content, making it suitable for biogas production. For example, the POME industry in
Malaysia has a great potential of producing valuable biogas from adequate treating of their
wastewater with an anaerobic digester instead of ponding systems. (Chin et al. 2013)
reported that if the 57 million of generated POME in 2011 in Malaysia had been treated
anaerobically, more than 50k tones of methane could have been produced. This could have
supported about 700.000 households in Malaysia in 2011.
However, there are special challenges in producing biogas from high industrial wastewater.
The most significant are the setup of adapted microorganisms to specific wastewater
composition and flow alterations due to operational changes.
2.3.1 Process microbiology
Anaerobic digestion consists of three complex biochemical reactions phases (Fig.4). The first
phase is hydrolysis, which is when organic compounds are transformed by enzymes into
compounds suitable for use as a source of energy and cell carbon. Secondly, in acidogenesis,
bacteria convert the products of the hydrolysis into hydrogen, formate, acetate and higher
molecular-weight VFAs. In the third step, methanogesis, intermediate compounds (hydrogen)
are converted into simpler end products (methane and carbon dioxide).

15
Figure 4 Metabolic pathways and microbial groups involved in anaerobic digestion (Lemos
Chernicharo 2007)
In order to maintain and equilibrium between nonmethanogenic and methanogenic bacteria in
the sludge digestion, some characteristics should be present in the anaerobic reactor such as
avoiding dissolved oxygen, heavy metals and sulphides; keeping the pH level between 6.6
and 7.6; and providing enough alkalinity to avoid drops in pH. Methane bacteria do not
function under 6.2 pH levels. In addition, alkalinity levels around 1000 to 5000 mg/L and
VFA levels less than 250 mg/l result in digestion proceeding well. Organic (nitrogen and
phosphorus) and inorganic nutrients should be present to ensure a proper growth of bacteria.
Finally, a optimum temperature should be present in the reactor. For the mesophilic range,
temperature should be between 30-38ºC and between 49-57ºC for the thermophilic range
(Metcalf & Eddy, Inc 1991).
2.3.2 Process challenges
The main challenge is stabilizing the process without sudden changes in organic loading or
rises in temperatures. In either case, an accumulation of organic acids will occur and the
methanogenesis bacteria will not be able to assimilate all the acids produced. This imbalance
will result in a decrease of the biogas production and eventually drop of the pH (Hammer &
Hammer 2004). There are some preemptive strategies that can help avoid failure, like
monitoring levels of the volatile acids concentration before and during the aerobic digestion.
They should be stable at a given loading rate and temperature.

16
2.4 Start–ups strategies for combined reactors
In an anaerobic-aerobic reactor the start-up process must be watched carefully. The start-up
process of the anaerobic stage is particularly important to have a successful performance of
the reactor. The objective of the start-up period in high rate anaerobic reactors is to grow,
build up and retain a sufficient concentration of active and well-balanced biomass (Chan et
al. 2012). The start-up period differs from process to process, but it usually takes long time. It
is a delicate operation procedure depending on many operational parameters, hence it is
crucial to know how these factors affects the process (Cresson et al. 2006). Consequently,
reducing start-up periods will lead to economic competitiveness of the wastewater treatment
process (Escudié et al. 2011).
The start-up process in biological reactor can be divided in to two main steps: the inoculation
and the period until it reaches a steady state. In the inoculation process, the quality and
characteristics of the seed sludge are vital. During the start period of a UASB, the biomass
tends to make aggregate forming granules and the development of these granules is essential
to the success of this operation. It is important for granules to settle against the upflow
influent. This is the reason why it has been a common practice to seed new reactors with pre-
granulated sludge, as results from Goodwin et al. (1992) confirm.
The second step is the progressive increase of the organic loading rate to stimulate the
microbial adaptation and growth. The incremental loading in the organic load is crucial – the
overloading of the system must be avoided because it will result in a failure of the system by
inhibition of methanogenesis. Different strategies can be applied: one is to increase the
loading rate by increasing the influent flow rate while keeping constant the COD
concentration of the influent. Another strategy is to reduce the organic influent by diluting the
influent while keeping constant the influent flow rate. The flow rate or the COD
concentration can be progressively increased when the effluent reaches constant values of
COD removal (80-85%). Chan et al. (2012) and Najafpour et al. (2006) reported rapid start-
up (26 days) by decreasing the influent dilution in UASB treating palm oil. The excellent
performance was because of good contact between the substrate and the sludge.

17
3 MATERIALS AND METHODS
3.1 General description of the reactor
Two different pilot scale HyVABs were used in the experiments. One was placed at NSO
(Moss) and other was placed at Biowater’s laboratory (Tønsberg). The HyVAB (Fig.5)
reactor is a high rate bioreactor with a vertical combination of anaerobic sludge and aerobic
biofilm with no physical separation. The HyVAB consists of two chambers connected
vertically. The upper chamber is working as a CFIC biofilm reactor and the lower
incorporates UASB technology. A baffle is located in between the anaerobic and aerobic
stage to separate the biocarriers from the anaerobic stage. A roof-like shape collector collects
the generated biogas.The pilot situated in Kambo brings the biogas out from the reactor from
two biogas collectors placed in the side of the reactor (Fig 5). The Tønsberg pilot collects the
biogas from a pipe on top on the reactor.
a) Normal operation

18
b) Washing cycle
Figure 5 Systematic diagram for HyVAB reactor
The design parameters (Table 3) of both the reactors are:
Table 3 Design parameters of pilot scales HyVAB reactors
Moss pilot Tønsberg pilot
Parameter Unit Value Value
Design flow L/h 3,72 0,42
Design COD concentration mg/L 10000 10000
Design COD loading g/h 37,2 4,2
Design temperature oC 20 20
Anaerobic stage
Volume L 120 13,6
Water depth m 0,8 0,60
Cross-sectional area m2 0,16 0,023

19
Moss pilot Tønsberg pilot
Parameter Unit Value Value
Upflow velocity cm/h 2,3 1,85
Hydraulic retention time h 32 32
Design volumetric COD
loading kg/h/m
3 0,31
0,30
Design volumetric COD
loading kg/d/m
3 7,44
7,4
Expected COD removal
efficiency % 80
80
CFIC stage
Working volume L 60 6,8
Water depth-normal m 0,36 0,30
Cross-sectional area m2 0,16 0,023
Type of media BWTS BTWS
Filling rate-normal* % 92 95
Design volumetric COD
loading kg/d/m
3
2,98 2,96
Design biofilm COD loading g/d/m2
5,0 5,0
Hydraulic retention time-
aerobic h
16 16
Washing volume L 70,656 8,34
Water depth-washing m 0,44 0,37
Filling rate-washing % 75 75
3.1.1 Wastewater preparation
The wastewater was source from Norsk Spesialolje (NSO) Kambo, Norway. NSO bases its
business model in collection and cleaning of used oil (not lubricants) and oil-contaminated
water. About 70% of the collected oil in Norway is treated in the Moss plant. Up to 50% of
this waste is suitable for refining, around 30-35x106 kg per year. The cleaning process is
based on the use of thermal heating to separate oil from water of the used oil. Then, the water
extracted from this process is treated along with the externally received oil-contaminated
* Filling rate : bulk volumetric filled

20
water (Fig.6). Through this cleaning process NSO reduces the contaminated masses up to
97%, which is pumped into the sea, the other 3% of waste is retained and sent into
destruction.
Figure 6 Processing diagram in NSO
The wastewater used in the study comes from the distillation carried out during the cleaning
process and before any chemical or biological process is conducted. Its characteristics are
presented below (Table 4). Due to the nature of the wastewater, some chemical additions
were required to maintain a neutral pH and fulfill nutrient requirements in the anaerobic
stage. The following chemicals were added to the wastewater before feeding the reactor.
Dosages where calculated for an influent design flow of 100 L/day and influent COD of
10.000 mg/L (Table 5):
- Alkalinity for maintaining neutral pH: NaHCO3.
- Phosphorous as bacteria nutrient: KH2PO4.
- Trace minerals, especially iron, cobalt, nickel and zinc for stimulating
methanogenesis activities: Bloming.
Table 4 Characteristics of wastewater NSO (after adding chemicals)
Parameter Units Average Range Standard
deviation
pH - 7,89 9.5-6 3.261
COD mg/L 12855 59640-3830 8183.8
TSS mg/L 763 3610-130 3271.7
TN mg/L 190 477-72 106.8
TP mg/L 73 148-0.42 35.34
Oil in water mg/L 434 >2000- 3.1
Conductivity µS/cm 520 1880-2.2 847.4

21
Table 5 Required chemical dosage for HyVAB with a design flow of 100 L/day and influent
COD of 10000 mg/L
Chemical Form
Required in feed
water
(mg/L)
Concentration in
feed water
(mg/L)
Dosage per 1000
L feed water
NaHCO3 Powder 2000 mg/L as CaCO3 0 2.6 kg
KH2PO4 Powder 100 mg P/L 0 0.22 kg
Bloming (trace
minerals)*
Liquid - 0 1.455 L
Ferric Sulphate
(PIX-113)**
Liquid 40 mg Fe/L 0 0.242 L
3.1.2 Operating conditions and procedure
The process flow diagram (Figure 7) was equal in both pilots. Wastewater was continuously
fed from the feed tank to the anaerobic compartment using a Cole-Palmer Master Flex L/S
feeding pump delivering an average of 85 L/day in Moss and 9 L/day in Tønsberg. The
wastewater flowed upwards and overflowed into the aerobic compartment for further aerobic
degradation. Air was supplied to the aerobic compartment through a blowing system. Six
sampling ports where (SP1-SP6) were placed in all critical points. SP1 was placed in the EQ,
SP2 after the feeding pump, SP3-SP4-SP5 were placed at suitable distances along the
anaerobic compartment for sampling the sludge and an effluent sampling point was placed as
SP6. Two extra gas-sampling ports were installed to determine the amount and composition
of the biogas production.
The feed tank was filled up once a week with wastewater and chemicals in Moss and twice a
week in Tønsberg. The flow rate of the feed line was manually set up by trial and error. The
obtained volume was measured in a volumetric cylinder after pumping, the rotating rate was
set up in the required flow rate, and the flow rate was checked weekly. The washing mode of
the aerobic stage was operated once a week manually over a 16-hour period. The inlet
temperature was controlled in Moss with an aquarium heater after the pump occurred since
there was no possibility of room temperature control and with room heaters in Tønsberg. The
aeration system was cleaned once a week to prevent clogging with pressured air. The feeding
* Bloming contains P, K, Cu, Fe, Zn, Mo and Mn. But does not contain Co and Ni,
** Active contents 177g Fe/L and 167 g S/L

22
tube was changed when clogging problems were detected. The pilot was operating with
continuous flow for 24 hours.
Figure 7 Process flow diagram of the wastewater treatment using HyVAB pilot plant.
Operation parameters
Main parameters monitored in this study and calculation methods are presented in Table 6,
where Qin is the influent flow rate (L/day), V is the volume of the bioreactor (L), CODout,an is
the COD concentration of anaerobically treated wastewater, CODin is the influent COD
concentration (mg/L), CODout is the treated effluent COD concentration (mg/L), TSSin is the
influent TSS concentration (mg/L), and TSSout is the treated effluent TSS concentration
(mg/L).
CFIC

23
Table 6 Main parameters monitored in the present study
Symbol Unit Description Equation
%COD % COD removal
efficiency
( )
OLRan g COD/day OLR for anaerobic
process
OLRa g COD/day OLR for aerobic
process
3.1.3 Sampling location, frequency and analyses
The volume deducted from the EQ and the flow measurements were used to determine the
average flow to the reactor. Sampling (Table 7) was carried three times a week from sample
ports (SP) 2-3-4-5-6 (Fig 6). For all the measurements, grab samples were withdrawn from
the sampling ports using disposable tubes. For filtered samples a 0.45m surfactant-free
cellulose acetate (SFCA) filters were used with the disposal syringes. If the samples were not
analyzed immediately, they were stored at 4ºC before analysis.
Table 7 Sampling location, frequency and analysis.
Sampling point
Measurements Influent
(SP2)
Bottom of the
anaerobic zone
(SP3)
Middle of the
anaerobic zone
(SP4)
Top of the
anaerobic zone
(SP5)
Effluent
(SP6)
TCOD 3 3 - 3 3
SCOD 3 3 - 3 3
TSS 2 - - 2 2
VSS 2 - - 2 2
TS - 1 - - -
VS - 1 - - -
VFA - 1 1 1 -
Alkalinity 1 1 - - -
Biomass on
carriers - - - - 1
Legend: 1-Once a week, 2- twice a week, 3- three times per week

24
3.1.4 Seed sludge
The anaerobic chamber in Kambo was inoculated with anaerobic sludge taken from an
industrial facility in Sweden where high strength oily wastewater is being treated with an
anaerobic process. In Tønsberg the reactor was inoculated with new granule sludge from pulp
and paper factory in Nederland.
3.1.5 Bioreactor start up
The pilot scale reactor placed in Kambo was started before this research was conducted. On
the contrary, the start-up of Tønsberg’s pilot was closely controlled. The anaerobic reactor
was inoculated with 5 L of seed sludge. In order to acclimatize the sludge the reactor was fed
with diluted wastewater during the start-up until it reached the designated COD concentration
of 10000 mg /L. During the process the aerobic chamber was operated in MBBR mode. COD
reduction, mass balance, pH, temperature, methane production and VFA concentration were
monitored.
3.2 Analytical methods
Analytical determination of TSS, VSS, TS and VS were carried out in concordance with the
Standard Methods for the Examination of Water and Wastewater. For determining TSS,
samples of 5-10 mL were vacuum filtered through 47μm glass microfiber filters (Whatman
Cat No 1822-047), the residue retained on the filter was dried in a 105°C oven for 1 hour
before final weighing. VSS was determined by ashing the dry sample in a 550°C muffled
furnace for 15 minutes. TS were measured by placing the sample in an aluminium disc (tare)
and dried overnight in a 105ºC oven. VS analysis was carried out afterwards by drying the
sample in a 550ªC muffled furnace for 15 minutes. The analysis for COD (LCK 314, LCK
514 & LCK 014), alkalinity (LCK 362) and VFA (LCK 365) were all conducted using testing
kits from Hach. The cuvette samples were digested using the Hach Lange Thermostat
HT200S, and final values were determined using the Hach Lange DR 2800
spectrophotometer. The pH and temperature measurement of grab samples were conducted
using the pH electrode Sentix 41 and DO with Oxical-SL. Two external temperatures Sensor
Type MicroLite II were used to control every 5 minutes the feed water and aerobic chamber
temperatures. Biomass on carriers was measured by placing between 5-10 carriers into a
105ºC oven and drying overnight. After weighing the carriers were cleaned and dried again
and the difference in mass was calculated.

25
4 RESULTS AND DISCUSSION
4.1 Tønsberg Bioreactor start up
4.1.1 Anaerobic process
COD removal efficiency
Different studies carried out on start-up processes of UASB showed differences in time and
COD removal efficiencies. Chan et al (2012) achieved 99% COD removal treating POME
with organic load up to 10.5 kg COD/m3day in a 45-day period start-up. The experiment of
Najafpour et al. (2006) accomplished a 26-day start-up of treating POME with organic load
of OLR of 23.15 kg COD/m3day. The start-up of UASB reactors is a complicated process
with factors including wastewater characteristics, acclimatization of seed sludge, pH,
nutrients, presence of toxic compounds, loading rate, up-flow velocity, hydraulic retention
time, liquid mixing and reactor design affect the growth of sludge (Rizvi et al. 2013).
The performance of the first 60 days of the HyVAB anaerobic reactor operation is shown in
Fig.8. During the first 18 days the reactor was fed an average COD loading of 2.10 Kg
COD/m3day with 2800 mg/L influent COD. During this period, a satisfactory overall COD
removal efficiency process of 85% was achieved due to the good granulation conditions of
the sludge seed. While the COD removal efficiency remained stable, along with low VFA
concentrations of the anaerobic reactor, the COD loading was increased to 14.82 Kg
COD/m3day for two days. As a consequence of this sudden increase of organic loading the
COD removal efficiency dropped to 57.7% with COD effluent levels of 8462 mg/L. This
drop in the COD removal efficiency shows reactor stress as a consequence of the loading
increase. This is because the anaerobic reactor microflora taking time to acclimate to the new
environment (Najafpour et al. 2006). However, three days after the loading, the reactor
showed a rapid stabilization and was capable of achieving 84.2% COD removal efficiency.
This can be attributed to the self-regulation capability inherent to the biological system,
making it possible for the microbial consortium to acclimatize itself to the increased loading
(Chan et al. 2012). Industrial wastewater usually has changes in quality and quantity, making
for a dynamic organic loading rate. As it is observed, the increase of organic loading is the
main factor that affects the stability of anaerobic digestion since anaerobic microorganisms
are sensitive to organic overloads (Chen et al. 2014).
26
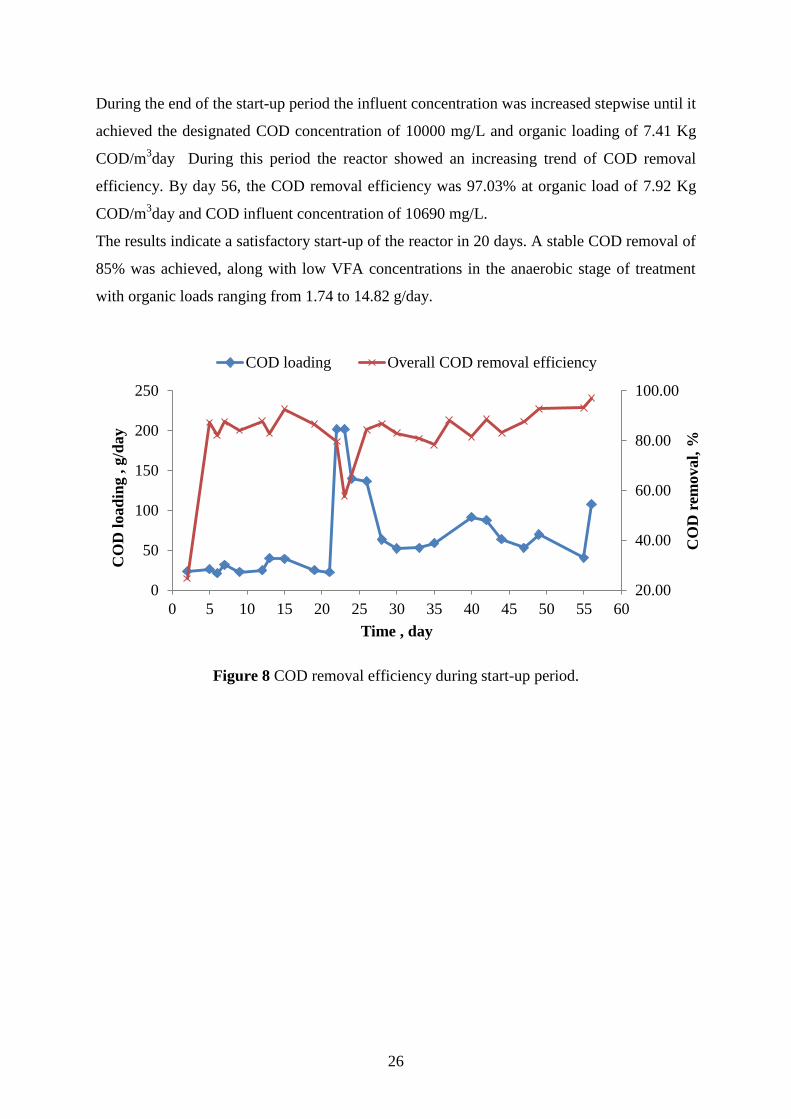
During the end of the start-up period the influent concentration was increased stepwise until it
achieved the designated COD concentration of 10000 mg/L and organic loading of 7.41 Kg
COD/m3day During this period the reactor showed an increasing trend of COD removal
efficiency. By day 56, the COD removal efficiency was 97.03% at organic load of 7.92 Kg
COD/m3day and COD influent concentration of 10690 mg/L.
The results indicate a satisfactory start-up of the reactor in 20 days. A stable COD removal of
85% was achieved, along with low VFA concentrations in the anaerobic stage of treatment
with organic loads ranging from 1.74 to 14.82 g/day.
Figure 8 COD removal efficiency during start-up period.
20.00
40.00
60.00
80.00
100.00
0
50
100
150
200
250
0 5 10 15 20 25 30 35 40 45 50 55 60
CO
D r
emoval,
%
CO
D l
oad
ing , g
/day
Time , day
COD loading Overall COD removal efficiency

27
Figure 9 COD removal efficiencies in the reactor
Fig. 9 shows the contribution of each step of the process to the overall removal efficiency of
the reactor. At the beginning of the start-up, all the removal treatment was completed in the
anaerobic chamber before the sludge blanket was created. In addition, from day 35 the
aerobic stage removal efficiency increased and the efficiency removal in the bottom of the
aerobic was declined. The biofilm grew and established on the new bio carriers in one
month.. Measurements showed that on day 29 the biomass per carrier was 0.77 mg and on
day 37 the biomass per carrier was 9.40 mg, confirming the trend of the graph and the
establishment of biofilm on the carriers.
Variation of sludge pH and VFA concentration along the height of anaerobic
compartment
As mentioned in epigraph 2.2.2 alkalinity was supplied to the feed water to maintain constant
pH levels in the anaerobic compartment through the treatment process. This entails a good
balance in the process of hydrolysis, acidification of the organic matter and methane
formation (Chan et al. 2012).
0
10
20
30
40
50
60
70
80
90
100
0 5 10 15 20 25 30 35 40 45 50 55 60
CO
D r
emoval,
%
Time , day
Anaerobic bottom COD removalAnaerobic top COD removalOverall COD removal efficiency

28
Sludge pH and VFA in the anaerobic reactor were monitored (Fig 9 and 10 respectively)
during the entire period of the study. As illustrated in Fig. 10, the pH shows an increasing
trend throughout the anaerobic compartment from the bottom to the top. The opposite trend is
represented for VFA concentration.
Figure 10 pH concentration along the reactor processes |
Figure 11 VFA concentration along the height of the anaerobic compartment
0 5 10 15 20 25 30 35 40 45 50 55 60
5
6
7
8
9
10
Time , day
pH
pH Influent pH Anaerobic bottom pH Anaerobic top pH Effluent
0 5 10 15 20 25 30 35 40 45 50 55 60
0
200
400
600
800
1000
1200
1400
1600
1800
Time , day
VF
A c
on
cen
trati
on
, m
g/L
VFA Concentration Anaerobic bottom VFA Concentration Anaerobic top

29
The balance in between the pH and VFA concentration through the height of the reactor
explains the biochemistry of the digestion of the anaerobic reactor. A good establishment in
between the entire microorganism involved is crucial for a success treatment processes. The
VFA concentration is normally used to control this equilibrium. If the environmental
conditions inside the treatment are good and there are enough methanogenic microorganism,
then methanogenic microorganisms use the acids as soon as they are produced. This way,
there is no accumulation of acids and the pH remains stable because the alkalinity capacity is
not used to neutralize the accumulated acids (Chan et al. 2012). This is what it is observed in
Fig. 10 and 11. The pH remains stable and the VFA levels remain under 400 mg/L until day
20 when the organic overload was produced. The overload caused unfavorable conditions and
the methanonegic organisms were not capable of using the volatile acids at the same rate as
the acidogenic bacteria producing them. As a result, there is an accumulation of acids in the
system and the accumulated acids cause pH drops. In order to recover pH levels, extra
alkalinity was supplied to the feed after day 20, which is reflected in a recovery of the pH
level in the anaerobic bottom. However, as a consequence, an increase of the pH in the outlet
was observed as well. During days 40-45, pH of anaerobic top experiments increased due to
the recirculation operation.
Variations in sludge pH and VFA concentration in the bottom on the aerobic
compartment
A further analysis of the relation between pH and VFA is shown in Fig. 12, where isolated
data for a sampling port at the bottom of the anaerobic reactor is presented. As previously
mentioned; pH, VFA and alkalinity are closely related. During the first 15 days the pH was
stable in values within 7-7.5 and VFA concentration was less than 500 mg/L. After increasing
the organic loading in day 20, on day 21 the VFA reached their maximum level of 1257 mg/L
and the pH level dropped from 7 to 6.21. This VFA accumulation is produced because
acidogenic bacteria produce more VFA than acetogenic and methanogenic bacteria can use.
The increase of VFA concentration coincided with a decline in the pH, and this is because the
alkalinity was not enough to neutralize the increased concentration of VFA. On day 26, the
pH raised to 6.5 and pH VFA concentration was 1550 mg/L, with an organic loading of 136.7
g/day. Within days 35 and 40, while organic load was increased slightly the pH started to
recover to initial levels close to 7, and the VFA concentration remained under 500 mg/L. A
recirculation in the anaerobic stage was started on day 42, along with an increase of NaHCO3
in the feed water to 5 g/L in order to raise the pH level. This resulted in an increased pH that

30
remained almost constant between 7 and 7.5 until the end of the study. After the recirculation
period the VFA concentration dropped. The decrease of the VFA concentration may be a
result in an increase of methane production and the COD removal efficiency. These results
correspond with results obtained by Buyukkamaci & Filibeli (2004) and Chen et Al (2012),
where high COD concentration has influence on high VFA concentration.
(Buyukkamaci & Filibeli 2004)

31
Figure 12 COD loading, pH and VFA concentration on anaerobic bottom during start-up period
5
5.5
6
6.5
7
7.5
8
0
500
1000
1500
2000
2500
0 5 10 15 20 25 30 35 40 45 50 55 60
pH
CO
D l
oad
ing x
10 , g
/day
VF
A c
on
cen
trati
on
, m
g,l
VFA Concentration Anaerobic bottom COD loading x10 pH Anaerobic bottom

32
4.1.2 Aerobic process
The anaerobic and aerobic compartments were started simultaneously. In order to evaluate
the start-up performance of the aerobic compartment, COD removal efficiency was closely
monitored as well as pH, temperature and DO. Additionally, biofilm carrier mass analyses
were performance. The start-up of the aerobic reactor was run with new BTW S-type biofilm
carriers with dimensions of 14.5 x 18.5 x 7.3 mm and a protected surface area of 650 m2/m
3
(Fig13).
Figure 13 BTW S biofilm carrier
The aerobic reactor was operated at the MBBR mode until day 33 day when it was changed
to the CFIC mode. As described in epigraph 4.1.1, from day 35 the removal efficiency of the
aerobic stage increased, due to the growth and establishment of biofilm in the carriers.
Measurements showed that on day 29 the biomass per carrier was 0.77 mg and on day 37 the
biomass per carrier was 9.40 mg. The DO in the aerobic stage (Figure 14) remained stable
during the 27 first days of the operation, on day 27 a significant dropped was registered. It
can be a result of the COD overload and stress of the reactor. The consequences are reflected
in the aerobic treatment more than 24 hours later, which is the total HRT of the reactor. The
DO during the entire operation time was over 2 mg/L, which is the optimum for maintaining
a good microbial growth and activity.
Figure 14 DO in aerobic compartment
2
4
6
8
10
0 10 20 30 40 50 60
DO
, m
g/L
Time, days
Dissolved oxygen in aerobic
33
4.2 COD removal efficiency in Moss reactor
Figure 15 present results of COD removal efficiency in Moss reactor. During the first 200
days of operation, the influent COD concentration in the wastewater remained stable (11.419
mg COD/day). However, after day 200, the variations in the COD concentration in the
effluent were substantial. The reason is that the influent wastewater for the study comes from
the NSO oil processing and the NSO process depends on the characteristics of the incoming
untreated oil and oily water that can present variations. During this period, the average total
efficiency removal of the reactor was 80%. During this period the temperatures registered
were above 20°C due to the summer season. Therefore, a stable COD loading and
temperatures above 20°C kept the overall performance of the reactor around the design COD
removal efficiency of 80%. From day 200, the influent COD loading suffered a significant
increase that affected the efficiency of the reactor by decreasing the efficiency to 65%.
However, the temperature remains stable during these days. During this period of instability,
the COD loading shows a rapid recovery and the average removal efficiency for the last 100
days remained around 75- 80%.
This results shows that the reactor is able to handle changes in organic load with fast recovery
of good removal efficiencies. This characteristic is important in the treatment of industrial
wastewater where changes in influent characteristics are common.

34
Figure 15 Efficiency removal and COD loading and temperature in Moss reactor.
0
1000
2000
3000
4000
5000
6000
0
20
40
60
80
100
CO
D l
oad
ing, g
/day
CO
D r
emoval,
%
Total efficiency COD removal COD loading
10
12
14
16
18
20
22
24
26
28
30
0
10
20
30
40
50
60
70
80
90
100
0 30 60 90 120 150 180 210 240 270
Tem
per
tau
re, °C
CO
D r
emoval,
%
Time , day
Total efficiency COD removal Aerobic temperature
Design organic load (864 g/day)
Design temperature 20 °C

35
4.3 Sludge production
In biological processes, the amount of solids produced depends on the wastewater
characteristics. The substance that is produced in biological treatment is called biological
sludge and it forms from the growth of biomass from microorganisms. This sludge should be
removed from the reactor when it accumulates. If the reactor is not capable of handling it and
it will flow with the effluent in large quantities. Thus, some sludge wasting is necessary to
avoid this situation. Only occasional withdrawal is need in anaerobic reactors compared to
other types of biological treatment, like activated sludge reactors. The wasted sludge should
be treated and processed adequately for final disposal or reuse (Von Sperling & de Lemos
Chernicharo 2005). The HyVAB reactor is designed to minimize sludge production through
the digestion of the settled solids produced in the anaerobic chamber during the anaerobic
stage.
The solids produced in the aerobic chamber in Tønsberg pilot reactor (Fig 16) shows a clearly
increasing trend from day 0 to the end of the study. That is because most of the COD was
removed aerobically after day 20, showing higher sludge production than in the first 20 days.
This is a result of the establishment and growth of biofilm in the carriers.
Figure 16 Sludge yield in Tønsberg reactor
0
2
4
6
8
10
12
14
16
18
20
0 10 20 30 40 50 60
Soli
ds
pro
du
ced
in
aer
ob
ic p
roce
ss,
g/d
ay
Time, days
Solids produced
MBBR/CFIC

36
Since the production of sludge is directly related with the microbial activity, environmental
conditions also affects the production. Differences in sludge yield in summer and winter were
observed in the Moss reactor (Fig 17). The trend shows a decrease of sludge production
during the winter season. The average observed yield is 0.15 kg TSS/kg COD removed. The
amount of solids yielded for the anaerobic treatment of domestic sewage is between 0.10 to
0.20 kg TSS/Kg COD applied. (Lemos Chernicharo 2007).
.
Figure 17 Differences in yield between summer and winter in Moss reactor
0
0.05
0.1
0.15
0.2
0.25
0.3
0.35
0 30 60 90 120 150 180 210 240 270
gT
SS
/gC
OD
rem
ov
ed
Time, days
Sludge Yield
Linear ( Sludge Yield )
SU
MM
ER
WIN
TE
R

37
4.4 Biogas production
Evaluation of biogas production can be done theoretically based on the degraded COD that
Lemos Chernicharo (2007) (pag19) proposes in his book “Biological Wastewater Treatment
Series”. The equation is as follows:
4
( g ( 4g (44g ( g
One mole of methane requires two moles of oxygen for its complete oxidation to carbon
dioxide and water. Therefore, every 16 grams of CH4 produced and lost to the atmosphere
corresponds to the removal of 64 grams of COD from waste. Under normal temperature and
pressure conditions, this corresponds to 350 mL of CH4 for each gram of degraded COD.
The portion of COD converted into methane gas can be determined as follows:
4 (S S) obs S
where:
COD CH4= COD load converted into methane (kgCODCH4/d)
Q= average influent flow (m3/d)
S0= influent COD concentration (kgCOD/m3)
S= effluent COD concentration (kgCOD/m3)
Yobs= coefficient of solids production in the systems, in terms of COD (0.11 to 0.23 kgCOD
sludge/kgCODappl)
The methane mass (KgCODCH4/d) can be converted into volumetric production (m3
CH4/d) by
using the flowing equations:
4 4
( )
where:
QCH4= volumetric methane production (m3/d)
K(t)= conversion factor for the operational temperature of the reactor (kg COD/m3)

38
( )
( )
where:
P= atmospheric pressure (1 atm)
KCOD= COD corresponding to one mole of CH4 (64 gCOD/mol)
R= gas constant (0.08206 atm.L/mole.K)
T= operational temperature of the reactor (oC)
Theoretical calculations for methane production for Tønsberg and Moss reactors are
presented in Table 8 and 9. The values for the different parameters were extracted from
design values (COD), and averages were taken from the observed data collection for COD
removal efficiency as well as temperature and sludge yield.
Table 8 Values for theoretical methane production calculations with Lemos Chechinarro
(2007) method for Pilot reactor Tønsberg
Parameter Value
COD influent 10 kgCOD/m3
COD effluent 0,73 kgCOD/m3
COD removal efficiency 73%
Yobs 0.11
Operational temperature of the reactor 22 oC
Flow 0,01 m3/day
Result 0,0755 KgCODCH4/d
0,028 m3 CODCH4/d

39
Table 9 Values for theoretical methane production calculations with Lemos Chechinarro
(2007) Pilot reactor Moss
Parameter Value
COD influent 10 kgCOD/m3
COD effluent 0,77 kgCOD/m3
COD removal efficiency 77%
Yobs 0.15
Operational temperature of the reactor 20 oC
Flow 0.089 m3/day
Result
0.69 KgCODCH4/d
0.26 m3 CODCH4/d
In addition, calculations were made to compare with Lemos & hechinarro’s ( 7 method
using the theoretical production of 350 mL CH4 per gram of COD removed (Chan et al.
2012). The same assumptions and data were used.
Table 10 Comparison of methane theoretical production
Theoretical production
Pilot reactor
350mL/gCODremoved Lemos
Chechinarro
2007
m3CH4/day m
3CH4/day
Tønsberg 0.032 0.028
Moss 0.28 0.26
Biogas collection was not possible at the Tønsberg pilot reactor. Some measurements were
carried out at the Moss reactor (Table 11) despite the challenges of biogas collection due to
clogging in the system. For CH4 yield calculations, an assumed amount of 70-80%
production in the biogas during treatment of domestic sewage was used (Lemos Chernicharo
2007). According to the measurements, the average methane produced was 0.036 m3/day in
the Moss reactor.

40
Table 11 Measured methane in Pilot reactor Moss
Day Biogas
production
m3/day
CH4
production
m3/day
Temperature
oC
72 0.033 0.0267 26.4
79 0.053 0.0423 25.4
80 0.048 0.038 24.5
Average 0.046 0.036 25.4
The comparison between theoretical (Table 10) and measured (Table 11) biogas production
for Moss reactor shows a significant difference. It can be attributed to the mentioned clogging
problems in the biogas collectors that did not allow all the biogas production being
successfully collected.
The theoretical values can be used to calculate the calorific value from the biogas produced
(Table 12):
Table 12 Comparison of methane theoretical
Pilot Tønsberg Pilot Moss
Biogas production (m3/day) 0,032 0,28
Energy production* 23 Kwh/m
3treated 19,82 Kwh/m
3treated
The theoretical energy production of biogas for the pilot reactor in Tønsberg will be 23 and in
Moss 19.82 Kwh/m3treated. The differences are attributed to the in different treatment
efficiencies in the anaerobic process.
Influence of temperature in methane yield
Calculations and results regarding methane yield should take into account the effect of
temperature in gas solubility. At lower temperatures, the solubility of gases increases, and so
the temperature of the reactor also has implications on the CH4 yield. In the study by Singh
and Viraraghavan (2003), “Impact of temperature on performance of UASB reactor treating
* Energy content of biogas generated from anaerobic digesters 6.0-6,5 Kwh/m
3 (Tyagi & Lo
2013)
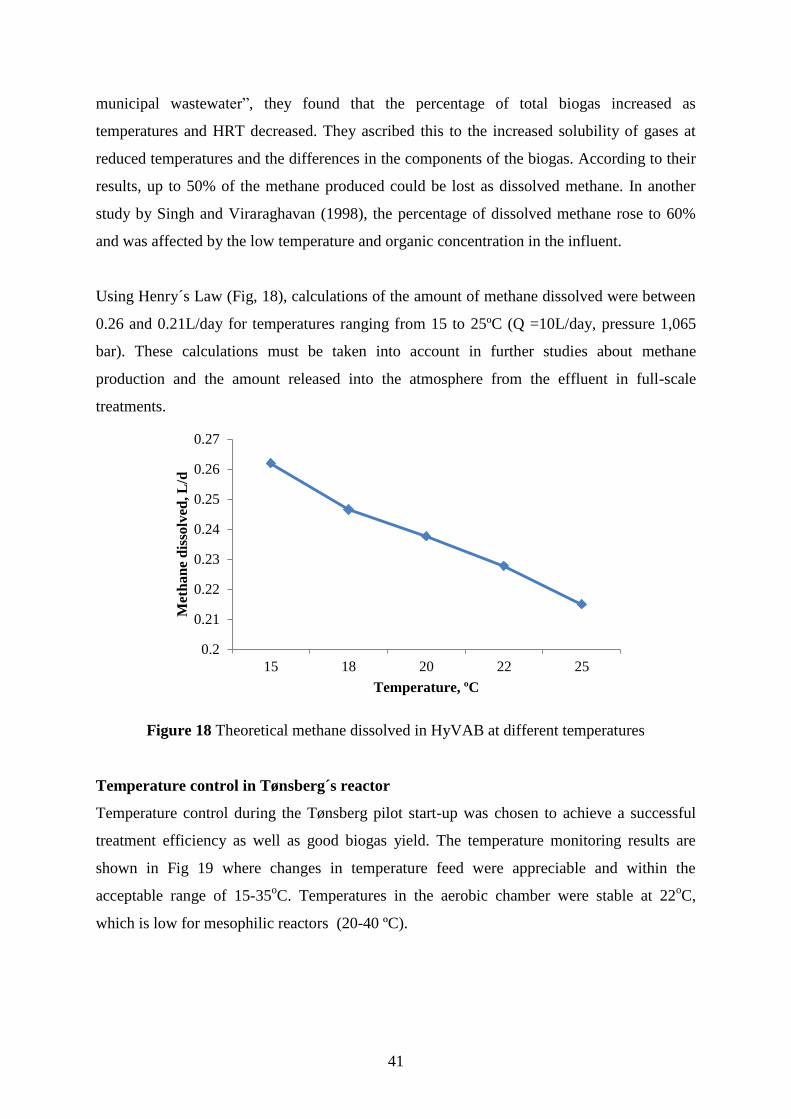
41
municipal wastewater”, they found that the percentage of total biogas increased as
temperatures and HRT decreased. They ascribed this to the increased solubility of gases at
reduced temperatures and the differences in the components of the biogas. According to their
results, up to 50% of the methane produced could be lost as dissolved methane. In another
study by Singh and Viraraghavan (1998), the percentage of dissolved methane rose to 60%
and was affected by the low temperature and organic concentration in the influent.
Using Henry´s Law (Fig, 18), calculations of the amount of methane dissolved were between
0.26 and 0.21L/day for temperatures ranging from 15 to 25ºC (Q =10L/day, pressure 1,065
bar). These calculations must be taken into account in further studies about methane
production and the amount released into the atmosphere from the effluent in full-scale
treatments.
Figure 18 Theoretical methane dissolved in HyVAB at different temperatures
Temperature control in Tønsberg´s reactor
Temperature control during the Tønsberg pilot start-up was chosen to achieve a successful
treatment efficiency as well as good biogas yield. The temperature monitoring results are
shown in Fig 19 where changes in temperature feed were appreciable and within the
acceptable range of 15-35oC. Temperatures in the aerobic chamber were stable at 22
oC,
which is low for mesophilic reactors (20-40 ºC).
0.2
0.21
0.22
0.23
0.24
0.25
0.26
0.27
15 18 20 22 25
Met
han
e d
isso
lved
, L
/d
Temperature, ºC

42
Figure 19 Temperatures monitoring in Tønsberg´s pilot.
4.5 Mass balance
In the HyVAB reactor, an analysis of the mass balance provides an idea of the amount of
materials that are in each step of the wastewater process. The law of conservation states that
organic matters are neither created nor destroyed. Therefore, by accounting for substances
entering and leaving the wastewater process, unknown mass flows can be easily calculated as
inputs and outputs. These can easily be translated as costs and benefits. The wastewater
treatment competiveness depends on the knowledge and control of these inputs and outputs.
Input= outputs + reactions
.
10
15
20
25
30
35
40T
emp
eratu
re,
oC
Feed temperature
10
12
14
16
18
20
22
24
1
288
575
862
1149
1436
1723
2010
2297
2584
2871
3158
3445
3732
4019
4306
4593
4880
5167
5454
5741
6028
6315
6602
6889
7176
7463
7750
8037
Tem
per
atu
re,
oC
Time, minuts
Aerobic chamber temperature

43
Figure 20 Mass balance for HyVAB
Fig. 20 the mass balance for HyVAB reactor. In HyVAB, the inputs of the global process are
the organic load, the chemicals and the energy consumed in the aeration system. During the
treatment process biogas, biomass and CO2 are produced as outputs. Chemicals, energy for
the aeration system and sludge management are the main costs of the system. Biogas
production can be used as a source of income if it is collected and used for energy. However,
a detailed study of biogas production and the costs of the entire wastewater system should be
addressed in future studies.

44
5 CONCLUSION
This study evaluated the performance of a novel high rate integrated anaerobic-aerobic
reactor: Hybrid Vertical Anaerobic Biofilm Bioreactor (HyVAB) through a small-scale pilot
study treating high strength industrial wastewater. Additional goals were to study the start-up,
the effect of COD removal on organic load and temperature, sludge and biogas production.
Successful start-up operation was accomplished in 20 days with an organic loading goal of
7.41 KgCOD m3/day. During the start-up period, HyVAB exhibited successful treatment
efficiencies with an average of 82%. It achieved total efficiency removal of more than 80%
by the third day of operation and more than 95% after three months. Biofilm growth was
observed after one month of operation. Additionally, the acclimatized microorganisms of the
seed sludge helped the anaerobic system to recover fast from COD overloading.
A short start-up of the reactor will lead to an increase of the efficiency and competiveness of
HyVAB. For future successful start-ups of the reactor, the following operation procedures
must be followed.
- Using seed sludge adapted to the strength and type of wastewater will shorten the
start-up period because of the previous acclimatization of the microorganism.
- Increase the organic load in gradual steps during the initial transient period from
diluted wastewater to target organic load of the wastewater treatment. VFA and pH
must be closely monitored to avoid stress on the reactor and to ensure good
methanogenesis.
- Proper control of environmental factors is necessary. The temperature inside the
reactor should be close to the optimum bacteria growth and survival rate (30-35 C),
pH should be maintained within 6.5-7.5, ensure enough nutrients are available and
avoid toxic compounds.
Overall, the COD removal efficiency of the pilot reactor remained stable at 80-95% during
normal operation. It was only reduced when COD over loadings provoked shocks on the
reactor. A slightly reduction of the efficiency of the reactor was observed during the winter
period, and there were also differences in sludge production during this time. Knowing that

45
the reactors are sensitive to their environmental conditions, characteristics of wastewater,
mostly COD concentration and pH, must be closely monitored before feeding the reactor in
further investigations or in full-scale reactors.
The biogas production and collection has to be improved in further studies to complete the
objectives of the reactor. However, theoretical biogas production for Tønsberg´s reactor was
23 Kwh/m3treated. A simple mass balance for both reactors showed the amounts of inputs
and outputs, but they should be translated to economic costs and benefits in future studies.
6 FUTURE RESEARCH NEEDS
To reinforce the good results obtained in this study, the development of HyVAB needs
further research for improvements in design and operation. These studies can be an
opportunity for collaboration in between interdisciplinary research groups in these areas:
- Differences in production of solids in the effluent between CFIC/MMBR modes.
- Effects of COD removal and methane production on recirculation in the anaerobic
chamber.
- Study of differences in biogas composition under different COD loadings and HRT.
- Study of effects of sludge wasting in the anaerobic chamber dealing with COD
removal efficiency and methane production.
- Economic feasibility study for the wastewater treatment through Life Cycle
Assessment.
- Mass balance over multiple week periods.

46
7 REFERENCES
Buyukkamaci, N. & Filibeli, A. (2004). Volatile fatty acid formation in an anaerobic hybrid
reactor. Process Biochemistry, 39 (11): 1491-1494.
Chan, Y. J., Chong, M. F., Law, C. L. & Hassell, D. G. (2009). A review on anaerobic–
aerobic treatment of industrial and municipal wastewater. Chemical Engineering
Journal, 155 (1–2): 1-18.
Chan, Y. J., Chong, M. F. & Law, C. L. (2012). An integrated anaerobic–aerobic bioreactor
(IAAB) for the treatment of palm oil mill effluent (POME): Start-up and steady state
performance. Process Biochemistry, 47 (3): 485-495.
Chen, Z., Wang, Y., Li, K. & Zhou, H. (2014). Effects of increasing organic loading rate on
performance and microbial community shift of an up-flow anaerobic sludge blanket
reactor treating diluted pharmaceutical wastewater. Journal of Bioscience and
Bioengineering (0).
Chin, M. J., Poh, P. E., Tey, B. T., Chan, E. S. & Chin, K. L. (2013). Biogas from palm oil
mill effluent (POME): Opportunities and challenges from Malaysia's perspective.
Renewable and Sustainable Energy Reviews, 26 (0): 717-726.
Cresson, R., Carrère, H., Delgenès, J. P. & Bernet, N. (2006). Biofilm formation during the
start-up period of an anaerobic biofilm reactor—Impact of nutrient complementation.
Biochemical Engineering Journal, 30 (1): 55-62.
Escudié, R., Cresson, R., Delgenès, J.-P. & Bernet, N. (2011). Control of start-up and
operation of anaerobic biofilm reactors: An overview of 15 years of research. Water
Research, 45 (1): 1-10.
Hammer, M. & Hammer, M., Jr. (2004). Water and wastewater technology. 4th ed.
Havukainen, J., Uusitalo, V., Niskanen, A., Kapustina, V. & Horttanainen, M. (2014).
Evaluation of methods for estimating energy performance of biogas production.
Renewable Energy, 66 (0): 232-240.
Latif, M. A., Ghufran, R., Wahid, Z. A. & Ahmad, A. (2011). Integrated application of
upflow anaerobic sludge blanket reactor for the treatment of wastewaters. Water
Research, 45 (16): 4683-4699.
Lemos Chernicharo, C. A. (2007). Biological Watewater Treatment Series, vol. IV. UK:
IWA.

47
Li, S.-r., Cheng, W., Wang, M. & Chen, C. (2011). The flow patterns of bubble plume in an
MBBR. Journal of Hydrodynamics, Ser. B, 23 (4): 510-515.
Metcalf & Eddy, I. (1991). Waste water engineering: Treatment, Disposal and Reuse. 3rd
ed.: MacGraw-Hill.
Metcalf & Eddy, I. (1991). Wastewater Engineering- Trearment, Disposal and Reuse, ISNB
0-07-041690-7: MacGraw-Hill.
Mutamim, N. S. A., Noor, Z. Z., Hassan, M. A. A. & Olsson, G. (2012). Application of
membrane bioreactor technology in treating high strength industrial wastewater: a
performance review. Desalination, 305 (0): 1-11.
Najafpour, G. D., Zinatizadeh, A. A. L., Mohamed, A. R., Hasnain Isa, M. & Nasrollahzadeh,
H. (2006). High-rate anaerobic digestion of palm oil mill effluent in an upflow
anaerobic sludge-fixed film bioreactor. Process Biochemistry, 41 (2): 370-379.
Phattaranawik, J. & TorOve, L. (2010). Study of Hybrid Vertical Anarobic Slugde- Aerobic
Biolflm Membrane Bioreactor for Wastewater Treatment. Water Environment
Research, 82 (3).
Phattaranawik, J. & Leiknes, T. (2011). Feasibility study of moving-fiber biofilm membrane
bioreactor for wastewater treatment: Process control. Water Research, 45 (6): 2227-
2234.
Puyol, D., Monsalvo, V. M., Mohedano, A. F., Sanz, J. L. & Rodriguez, J. J. (2011).
Cosmetic wastewater treatment by upflow anaerobic sludge blanket reactor. Journal
of Hazardous Materials, 185 (2–3): 1059-1065.
Rizvi, H., Ahmad, N., Abbas, F., Bukhari, I. H., Yasar, A., Ali, S., Yasmeen, T. & Riaz, M.
(2013). Start-up of UASB reactors treating municipal wastewater and effect of
temperature/sludge age and hydraulic retention time (HRT) on its performance.
Arabian Journal of Chemistry (0).
Rusten, B., Stang, P., Rogne, E., Siljudalen, J. & Marcolini, L. (2011). Development of a
compact, cost effective, and energy efficient biofilm reactor for wastewater treatment
and effluent use.: Bioawater Technology AS.
Singh, K. S. & Viraraghavan, T. (1998). Start-up and operation of UASB reactors at 20°C for
municipal wastewater treatment. Journal of Fermentation and Bioengineering, 85 (6):
609-614.
Singh, K. S. & Viraraghavan, T. (2003). Impact of temperature on performance,
microbiological, and hydrodynamic aspects of UASB reactors treating municipal
wastewater. Water Science & Technology, 48 (6): 211-7.

48
Tauseef, S. M., Abbasi, T. & Abbasi, S. A. (2013). Energy recovery from wastewaters with
high-rate anaerobic digesters. Renewable and Sustainable Energy Reviews, 19 (0):
704-741.
Tyagi, V. K. & Lo, S.-L. (2013). Sludge: A waste or renewable source for energy and
resources recovery? Renewable and Sustainable Energy Reviews, 25 (0): 708-728.
Von Sperling, M. & de Lemos Chernicharo, C. A. (2005). Biological Wastewater Treatment
in Warm Climate Regions vol. 1: IWA Publishing.
Ødegaard, H. (2006a). An analysis of global water purification trends – Future water
treatment technologies and methods.: CEWIC - Center of Expertise in the Water
Industry Cluster – Eco Forum, Oulu.
Ødegaard, H. (2006b). Innovations in wastewater treatment: the moving
bed biofilm process. Water Science & Technology, 53 (9): 17-33.

Appendix I: Results from Tønsberg reactor

COD loading Influent COD loading OLR Filt. COD TSSDay g/day mg/L kg/d/m3 mg/L mg/L
12 23.63 2344 1.74 2109345 26.08704 2588 1.92 30136 21.02688 2086 1.55 19187 31.69152 3144 2.33 238089 22.8312 2265 1.68 2011 160
101112 24.87744 2468 1.83 2006 33013 40.02768 3971 2.94 32621415 39.35232 3904 2.89 3012 460
17
1819 25.07904 2488 1.84 1688 6102021 22.74048 2256 1.67 1828 23022 201.6 20000 14.82 2000023 201.6 20000 14.82 24140 40242526 136.72512 13564 10.05 135642728 63.504 6300 4.67 5750 8029 15030 52.3152 5190 3.85 5015313233 52.96032 5254 3.89 4935 1703435 59.02848 5856 4.34 72923637 7840 3621 160383940 91.41552 9069 6.72 8279 2204142 87.67584 8698 6.45 71984344 63.67536 6317 4.68454647 52.99056 5257 3.90 51974849 69.63264 6908 5.12 6340505152535455 40.40064 4008 2.97 359256 107.7552 10690 7.92 8178
Influent

Day123456789
101112131415
17
181920212223242526272829303132333435363738394041424344454647484950515253545556
Anaerobic bottom
Filt. COD Total COD Filt. COD TSS Total COD Filt. COD TSSmg/L mg/L mg/L mg/L mg/L mg/L mg/L
2114 1765
1157 1175 330 480528 242 789 376 380649 778 322 844 391 370
881 656 336 330 771 360 310
607 663 286 260 731 302 3601244 1153 1171 1108 680
1843 333 290 288 430
640 816 275 540 834 335 380
420 3003918 4116 4070
9160 1020 8462 1070
3296 1575 2140
1226 838 1000 1424 841 550830
1150 1826 814 1719 884
2304 2000 1150 1040 >2000 1008 970
4530 2000 3178 920 2692 1270 680
3488 2000 3958 2940 2784 926
1020 3700 1680 1860
7099 7571 1330 3144 1000
2332 1069
3998 4464 2000 1075 652
6194 4907 4025 1653 504
3952 3554 2870 1557 2765108 2761 1743 1492 317 360
Anaerobic top Effluent
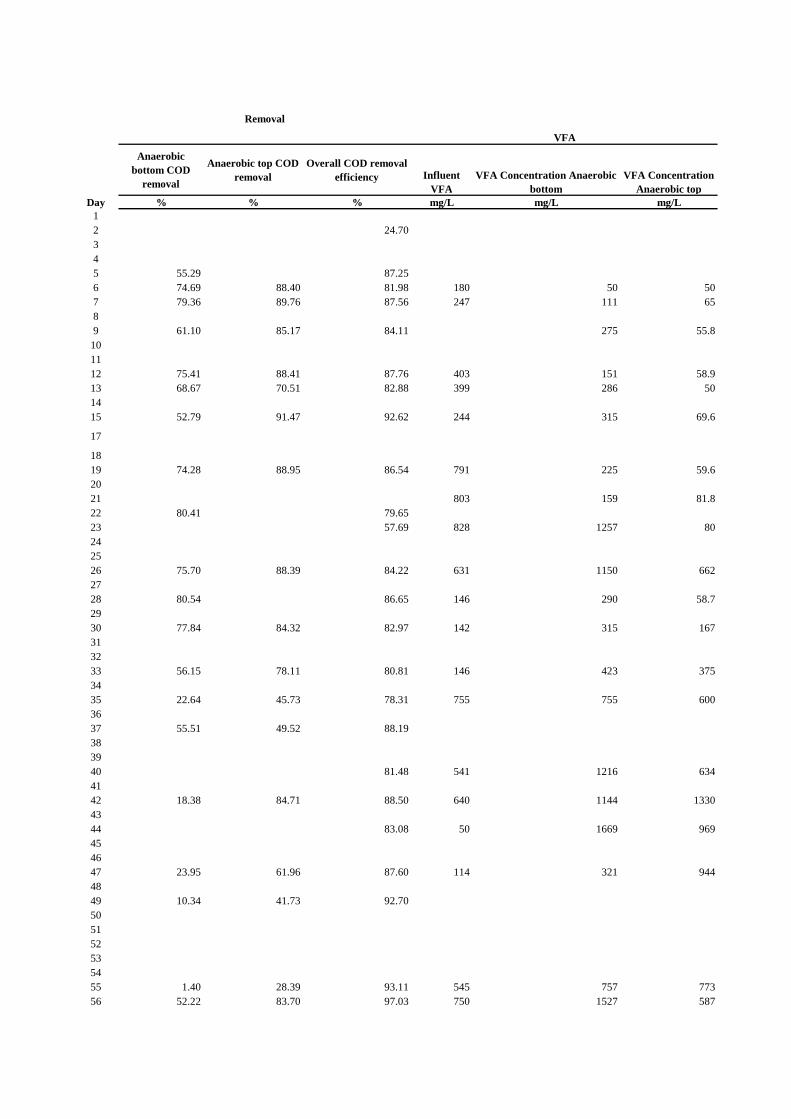
Day123456789
101112131415
17
181920212223242526272829303132333435363738394041424344454647484950515253545556
Anaerobic bottom COD
removal
Anaerobic top COD removal
Overall COD removal efficiency Influent
VFAVFA Concentration Anaerobic
bottomVFA Concentration
Anaerobic top% % % mg/L mg/L mg/L
24.70
55.29 87.2574.69 88.40 81.98 180 50 5079.36 89.76 87.56 247 111 65
61.10 85.17 84.11 275 55.8
75.41 88.41 87.76 403 151 58.968.67 70.51 82.88 399 286 50
52.79 91.47 92.62 244 315 69.6
74.28 88.95 86.54 791 225 59.6
803 159 81.880.41 79.65
57.69 828 1257 80
75.70 88.39 84.22 631 1150 662
80.54 86.65 146 290 58.7
77.84 84.32 82.97 142 315 167
56.15 78.11 80.81 146 423 375
22.64 45.73 78.31 755 755 600
55.51 49.52 88.19
81.48 541 1216 634
18.38 84.71 88.50 640 1144 1330
83.08 50 1669 969
23.95 61.96 87.60 114 321 944
10.34 41.73 92.70
1.40 28.39 93.11 545 757 77352.22 83.70 97.03 750 1527 587
Removal
VFA
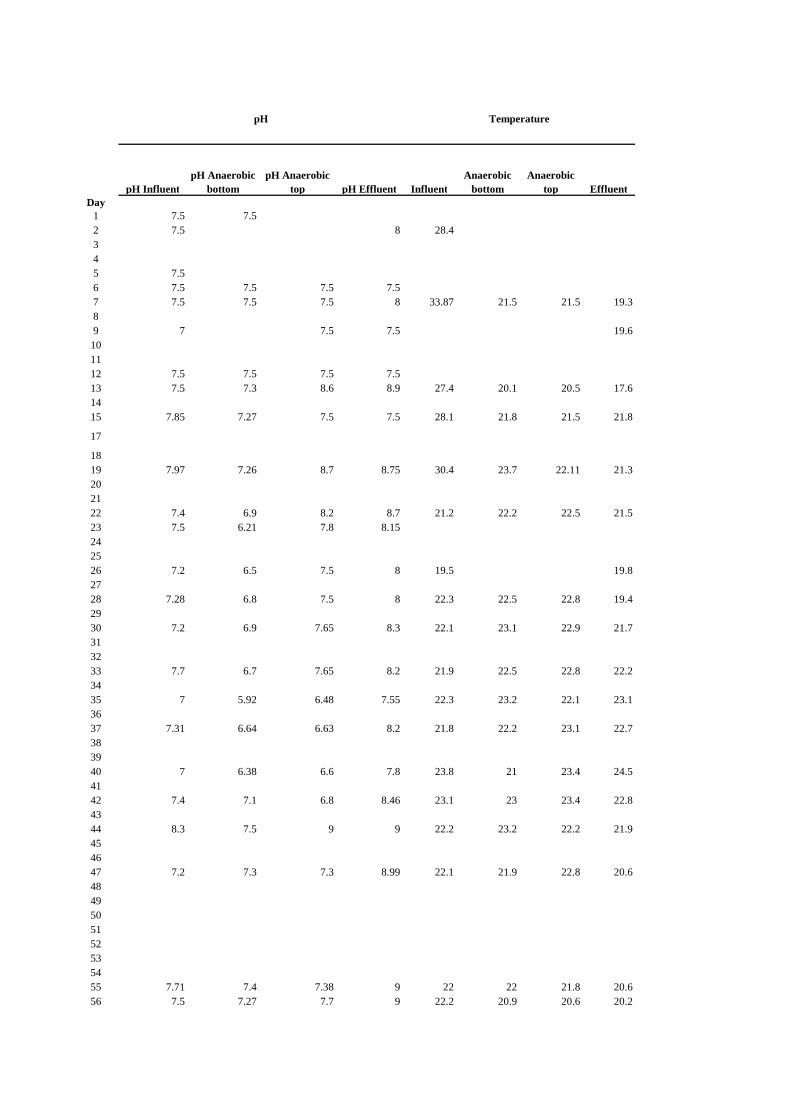
Day123456789
101112131415
17
181920212223242526272829303132333435363738394041424344454647484950515253545556
pH InfluentpH Anaerobic
bottompH Anaerobic
top pH Effluent InfluentAnaerobic
bottomAnaerobic
top Effluent
7.5 7.57.5 8 28.4
7.57.5 7.5 7.5 7.57.5 7.5 7.5 8 33.87 21.5 21.5 19.3
7 7.5 7.5 19.6
7.5 7.5 7.5 7.57.5 7.3 8.6 8.9 27.4 20.1 20.5 17.6
7.85 7.27 7.5 7.5 28.1 21.8 21.5 21.8
7.97 7.26 8.7 8.75 30.4 23.7 22.11 21.3
7.4 6.9 8.2 8.7 21.2 22.2 22.5 21.57.5 6.21 7.8 8.15
7.2 6.5 7.5 8 19.5 19.8
7.28 6.8 7.5 8 22.3 22.5 22.8 19.4
7.2 6.9 7.65 8.3 22.1 23.1 22.9 21.7
7.7 6.7 7.65 8.2 21.9 22.5 22.8 22.2
7 5.92 6.48 7.55 22.3 23.2 22.1 23.1
7.31 6.64 6.63 8.2 21.8 22.2 23.1 22.7
7 6.38 6.6 7.8 23.8 21 23.4 24.5
7.4 7.1 6.8 8.46 23.1 23 23.4 22.8
8.3 7.5 9 9 22.2 23.2 22.2 21.9
7.2 7.3 7.3 8.99 22.1 21.9 22.8 20.6
7.71 7.4 7.38 9 22 22 21.8 20.67.5 7.27 7.7 9 22.2 20.9 20.6 20.2
TemperaturepH

Day123456789
101112131415
17
181920212223242526272829303132333435363738394041424344454647484950515253545556
DO aerobic
mg/Lg/day gTSS/gCODremoved
4.8 0.163.8 0.15
6.48 3.7 0.10
7 3.1 0.11
7.5 3.6 0.138.1
7.4 4.3 0.10
7.2 3.8 0.13
7.5 36.55.7 10.7 0.03
2.5
5.5 0.08
6.85
9.7 0.15
6.8 0.09
5.8
5 18.6 0.17
4.5
6
Solids produced MBBR/CFIC
Yield

Appendix II: Results from Moss reactor

Influent Total COD Influent Soluble
CODInfluent
Temperature pH TSS
Day
mg/L mg/L oC mg/L
1 7778 6640 24 6.80 26723 8695 5960 20.8 7.59 73045678 7190 5750 22.9 7.00 7309
10 9125 8500 24 7.80 3301112131415 7930 7740 24.2 8.57 3401617 8006 6610 8.69 3901819202122 10722 11070 25.3 8.26 810232425 10699 10860 25026272829 10619 1092 23.5 7.9 270303132 10711 9910 7.25 25033343536 25 8.58 135037 25.53839 8074 7530 23.8 7.93 21040414243 9827 7420 20.4 8.75 500444546 9368 10590 19.6 7.90 240474849 8890 8860 24.6 8.01 42050
Influent
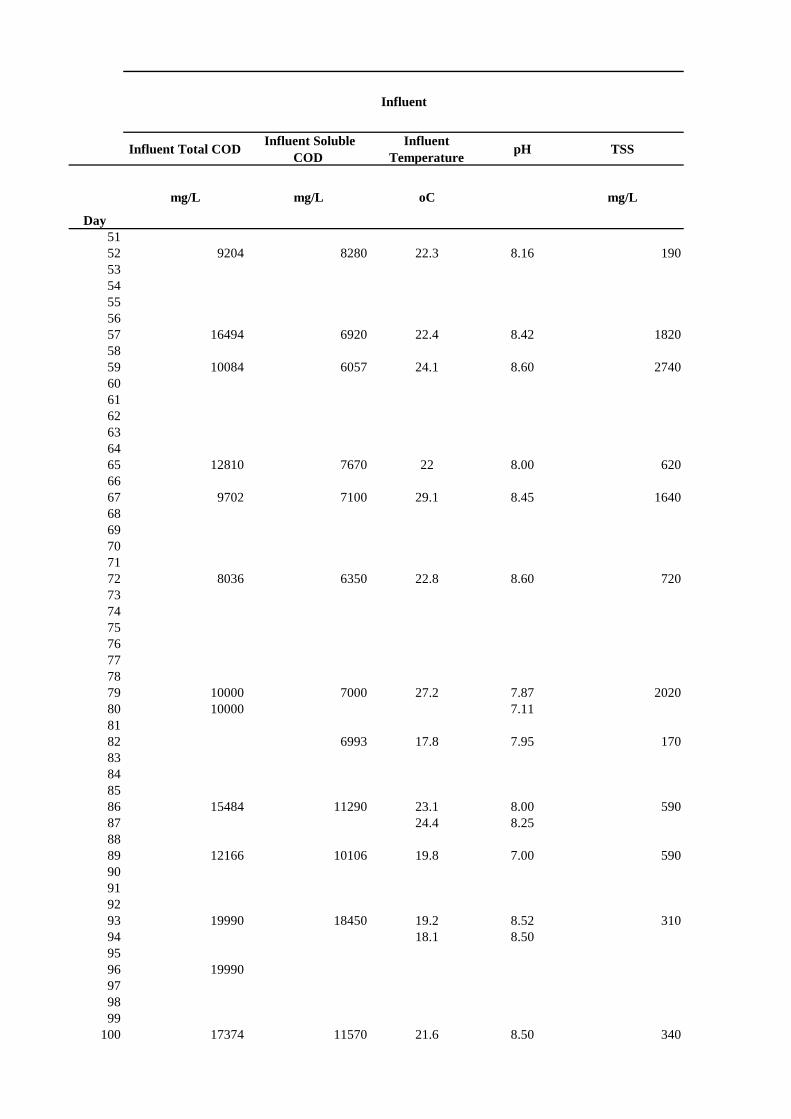
Influent Total COD Influent Soluble
CODInfluent
Temperature pH TSS
Day
mg/L mg/L oC mg/L
Influent
5152 9204 8280 22.3 8.16 1905354555657 16494 6920 22.4 8.42 18205859 10084 6057 24.1 8.60 2740606162636465 12810 7670 22 8.00 6206667 9702 7100 29.1 8.45 16406869707172 8036 6350 22.8 8.60 72073747576777879 10000 7000 27.2 7.87 202080 10000 7.118182 6993 17.8 7.95 17083848586 15484 11290 23.1 8.00 59087 24.4 8.258889 12166 10106 19.8 7.00 59090919293 19990 18450 19.2 8.52 31094 18.1 8.509596 19990979899
100 17374 11570 21.6 8.50 340

Influent Total COD Influent Soluble
CODInfluent
Temperature pH TSS
Day
mg/L mg/L oC mg/L
Influent
101 22.2 8.45102103 14210 9940104105106 13974 6.20107 13746 11060 16.2 6.90 180108109110 12692 11626 17.3 7.32 330111112113114 14752 14380 18.8 8.15 380115 21.3 8.33116117 13680 13380118119120121 13430 10660 25.7 8.40122 22.2 8.96123124 10886 15 9.50125126127128 15760 14380 20.5 8.60 350129130131 10998 9969 14.7 8.52132133134135 11156 10040 22.2 8.85 236136 21.7 8.60137138 10262 9340 17 8.22139140141142 11720 8710 18.3 8.54 2070143144145 13822 7179 15 8.17146147148149 8798 7410 16.5 7.94 475150

Influent Total COD Influent Soluble
CODInfluent
Temperature pH TSS
Day
mg/L mg/L oC mg/L
Influent
151152 9273 6537 22.2 7.80153154155156 15832 7560 28 8.33 20170157 4528 15.6 8.60158159 4900 4200 18.6 8.00160161162163164165166 3830 3740 17 7.65 340167168169 11512 8100 22.8 8.25 880170 30.1 8.30171172 17060 7810 26.6 7.00173174175176177178179180181182183184185186187188189190191 13228 9900 8.22192 13720 9240 21.7 7.55 810193194 11200 17.6 6.75195196197198 11028 9310 21.5 8.30 390199 4572 20.3 7.00200

Influent Total COD Influent Soluble
CODInfluent
Temperature pH TSS
Day
mg/L mg/L oC mg/L
Influent
201 22304 8784 17 6.00202203204 14440 10550 22.5 7.89 450205 14552 9671 22.7 7.89206207208 15616 18.7 7.80209210211 37310 19268 18.2 8.32212 12570 11490 18.7 8.17 410213214215 11042 10646 19.7 7.30216217218 33740 5454 21.5 7.50219 16414 11790 19.8 7.30 420220221222 19252 6718 20.5 7.36 530223224225 59640 4930 21.8 7.81 2310226 19586 5429 22.2 8.84 520227228 12518 10524 19.7 7.30229230231232233234 21.3 7.30235 24 8.15236237238239 5228 4160 22 7.56 900240 9135 8780 750241242243 30000 7898 18.5 7.50 3610244245246 10450 7570 20.7 6.50 970247 12978 7263 1890248249250

Influent Total COD Influent Soluble
CODInfluent
Temperature pH TSS
Day
mg/L mg/L oC mg/L
Influent
251252253 22 8.57254255256257 7.80258259260 19.6 9.10261262 6978 1326 19 9.21 610263264265266267268

Day 123456789
1011121314151617181920212223242526272829303132333435363738394041424344454647484950
pHAnaerobic bottom
temperatureSoluble COD Anaerobic
bottom
oC mg/L
6.8 23.8 5660.00
7.0 20.5 5160.00
7.05 21.70 7120
7.16 22.00 3670
6.94 24.50 4650
5420
6.25 28.40 10500
6.34 27 11040
11210
6.66 9920
6.9 25.225
6.93 22.6 11140
7.04 19.04 5770
6.8 5300
6.7 25.4 4590
Anaerobic bottom

Day 51525354555657585960616263646566676869707172737475767778798081828384858687888990919293949596979899
100
pHAnaerobic bottom
temperatureSoluble COD Anaerobic
bottom
oC mg/L
Anaerobic bottom
6.7 22.3 4550
6.7 23.8 4190
6.2 22.8 5890
6 27.7 5620
6.93 23.4 2500
6.39 25.6 52006.41 24.5
6.46 17.4 4514
5.7 22.7 91005.82 21.5
6.4 19.8 7591
7.28 19.4 97907.25 18
6.56 13.8 20030
6.2 21.9 11570

Day 101102103104105106107108109110111112113114115116117118119120121122123124125126127128129130131132133134135136137138139140141142143144145146147148149150
pHAnaerobic bottom
temperatureSoluble COD Anaerobic
bottom
oC mg/L
Anaerobic bottom
6.26 21.8
11148
6.3 15 11180
6.5 16.7 9950
6.5 17.9 88806.4 19.5
8616
6.37 25.4 8600
7.98 15.5 10420
8.82 20.5 7500
6.69 5253
6.63 19.9 38506.74 17.9
7 18.8 2490
6.7 16.2 57607.15 15.6
1706
7.38 16 17107.43 18.4
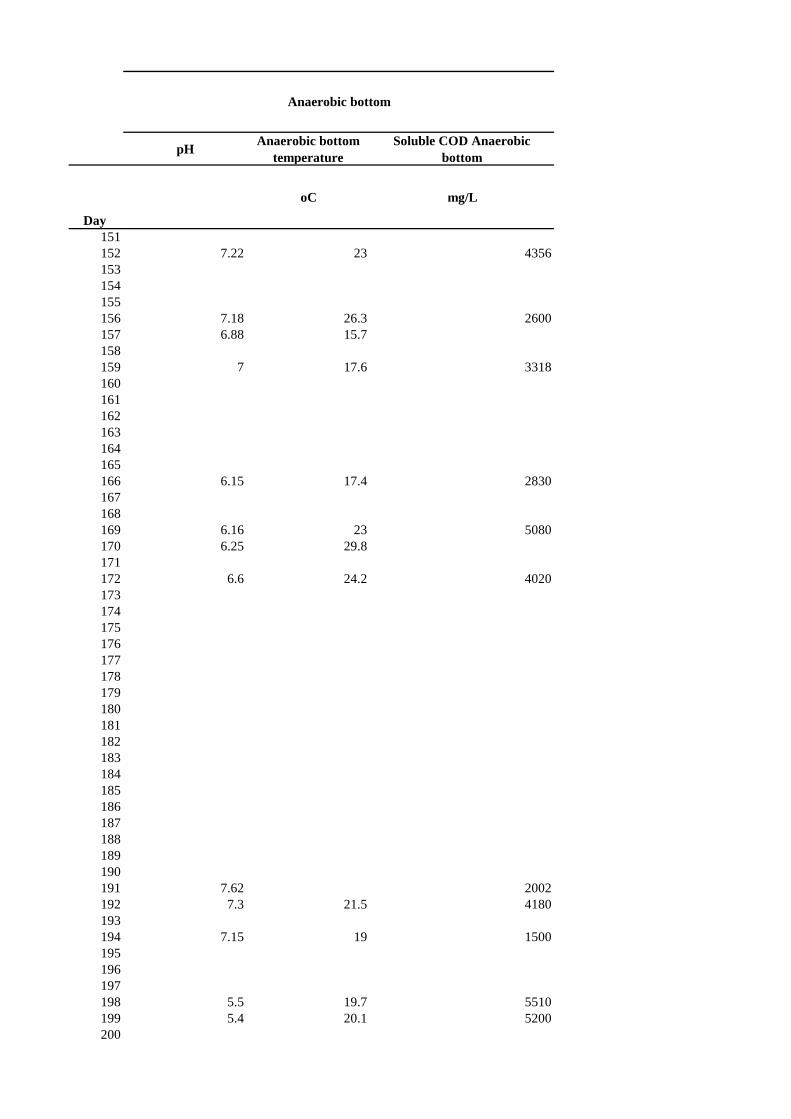
Day 151152153154155156157158159160161162163164165166167168169170171172173174175176177178179180181182183184185186187188189190191192193194195196197198199200
pHAnaerobic bottom
temperatureSoluble COD Anaerobic
bottom
oC mg/L
Anaerobic bottom
7.22 23 4356
7.18 26.3 26006.88 15.7
7 17.6 3318
6.15 17.4 2830
6.16 23 50806.25 29.8
6.6 24.2 4020
7.62 20027.3 21.5 4180
7.15 19 1500
5.5 19.7 55105.4 20.1 5200

Day 201202203204205206207208209210211212213214215216217218219220221222223224225226227228229230231232233234235236237238239240241242243244245246247248249250
pHAnaerobic bottom
temperatureSoluble COD Anaerobic
bottom
oC mg/L
Anaerobic bottom
6.67 16 2720
5.55 21 47605.55 22.5
6.1 17.6 4880
7.32 16.3 15027.34 16.5 1630
5.6 17.6 3756
6.75 18 10076.95 17.7 1450
7.31 17.5 1471
6.9 21.8 20806.95 19.6
6.1 16.9 4191
6.42 19
6.25 19.2 3400
6.3 19.5 70906.6 15.5

Day 251252253254255256257258259260261262263264265266267268
pHAnaerobic bottom
temperatureSoluble COD Anaerobic
bottom
oC mg/L
Anaerobic bottom
6.22 18
7.25 18.1
6.7 19.3 4650
6.6 14.3

Day 123456789
1011121314151617181920212223242526272829303132333435363738394041424344454647484950
pHAnaerobic top Temperature
Total COD Anaerobic top
Soluble COD Anaerobic top
TSS
oC mg/L mg/L mg/L
7.2 24.4 5171 1392 2360
8 21 10423 786 3280
7 22 1946 3940 980
7 21 1050 15360
7.6 24.7 9732 1000 4560
6.88 5647 753 3100
6.75 28 9744 6370 4400
9340 27.2 9340 3190 250
7.66 24.2 7297 2190 270
8.6 2751 6740 250
7.95 26 314027
8.29 22.3 8280 7860 2220
8.33 20.3 6582 1290 3640
8.3 18.7 4266 1030 2160
8.35 25.5 3853 1080 2500
Anaerobic top

Day 51525354555657585960616263646566676869707172737475767778798081828384858687888990919293949596979899
100
pHAnaerobic top Temperature
Total COD Anaerobic top
Soluble COD Anaerobic top
TSS
oC mg/L mg/L mg/L
Anaerobic top
8.3 22.6 4049 1240 2180
8.42 23.5 4117 4170 2180
8.4 22 2862 487 1590
8.2 26.9 2956 1140 1860
8.4 23.7 2929 1310 1780
8.16 25.3 5336 546 27408.34 22
8 18.1 7100 1948 2620
7.8 23.2 7593 3180 26607.75 23.3
7.8 20 6133 1936 2560
7.06 19.5 11432 7270 17406.94 21.7
8.07 17.7 7482 2347 2860
6.75 21.6 7134 3568 1240

Day 101102103104105106107108109110111112113114115116117118119120121122123124125126127128129130131132133134135136137138139140141142143144145146147148149150
pHAnaerobic top Temperature
Total COD Anaerobic top
Soluble COD Anaerobic top
TSS
oC mg/L mg/L mg/L
Anaerobic top
6.94 22.9
5548 3317
6.3 15 3534 1530 1300
7.25 16.2 6020 3464 1230
6.98 18.4 74710 4440 24007.26 19.5
4592 2858
7.37 24.5 7760 84867.68 22.3 4220
10000 6320
8.12 20.6 7320 31420 1850
7.26 17.4 6638 3279
7.6 21 1852 8008.52 18.9
7.55 16.3 12040 2210
8.23 16.5 3160 1250 9108.18 16
8.75 15.5 5184 860
8.24 15.9 6017 2380 16558 19.8

Day 151152153154155156157158159160161162163164165166167168169170171172173174175176177178179180181182183184185186187188189190191192193194195196197198199200
pHAnaerobic top Temperature
Total COD Anaerobic top
Soluble COD Anaerobic top
TSS
oC mg/L mg/L mg/L
Anaerobic top
8.6 20.3 3371 1872
8 26 2910 3190 14307.83 16.3
7.88 18 4000 744
7.15 15.7 5483 781 2310
7.3 22.2 9140 2580 39707.4 29.6
7.78 2890 480
9.36 1378 5209.36 21.6 2555 1310 2580
8.34 18.5 896
7.7 19.8 7260 1050 40308 20.9 6623 558

Day 201202203204205206207208209210211212213214215216217218219220221222223224225226227228229230231232233234235236237238239240241242243244245246247248249250
pHAnaerobic top Temperature
Total COD Anaerobic top
Soluble COD Anaerobic top
TSS
oC mg/L mg/L mg/L
Anaerobic top
8.16 16 11057 590
7.27 19.8 6285 2000 60207.52 21.4
8.39 17.2 9161 720
9.36 17.3 1844 4168.17 18 6558 2310 2200
7.34 19.3 6219 2356
8 18.8 1057 4877.88 18.7 1100 1275
7.8 17.8 7174 1374 1120
7.4 22 9643 27806.93 20.2
6.67 17.6 18464 9246
7.62 20.1
7.88 21.1 6402 1070 2320
7.51 20.2 10938 30008.5 16.2
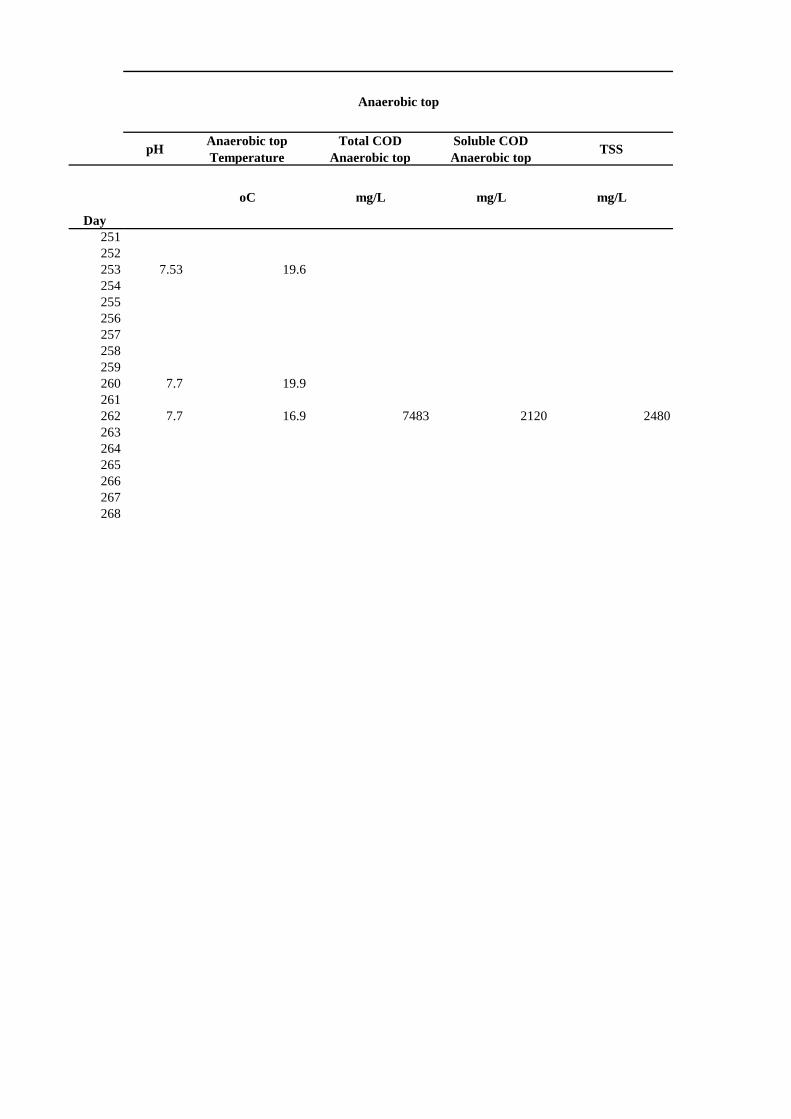
Day 251252253254255256257258259260261262263264265266267268
pHAnaerobic top Temperature
Total COD Anaerobic top
Soluble COD Anaerobic top
TSS
oC mg/L mg/L mg/L
Anaerobic top
7.53 19.6
7.7 19.9
7.7 16.9 7483 2120 2480

Day 123456789
1011121314151617181920212223242526272829303132333435363738394041424344454647484950
DO pHAerobic
temperatureTotal COD
EffluentSoluble COD
Efluent TSS
mg/L oC mg/L mg/L mg/L
0.1 7.4 27.5 1000 2748 14205.5 7.8 25.4 5702.8 8.0 24.5 3403 80 1630
7.3 8.5 23.8 7660 2600 3308.0 8.3 24.2 717 13205.0 8.0 25.1 1282 570
5.50 8.06 26.80 7930 7740 24005.00 7.70 24.10 3566 1000 20806.00 8.00 8006 6610 1630
3.30 6.90 23.90 3781 3810 15402.05 7.13 24.50 7187 3600 3050
3.00 7.50 28.80 6546 3300 2110
4.50 7.85 24.30 5770 2130 24508.80 20.50 3879 1200 10600
2.07 8.70 2416.00 636.00 880
2.50 8.13 27.30 2150.007.50 8.23 27.20 13048.00 11410.00 50.00
23.50 8086.00 5900.00 1710.00
4.87 8.49 21 4222 1010 2150
5.2 8.4 19.5 4193 575 2060
3.5 8.5 27.4 4212 585 2130
Aerobic

Day 51525354555657585960616263646566676869707172737475767778798081828384858687888990919293949596979899
100
DO pHAerobic
temperatureTotal COD
EffluentSoluble COD
Efluent TSS
mg/L oC mg/L mg/L mg/L
Aerobic
5.5 8.5 24.4 3887 676 1830
4.49 8.48 23.4 3997 485 1820
2.03 8.5 26.6 3384 426 1320
5 8.5 23.4 2310 356 1207
2.4 8.5 26.8 2702 474 850
5.11 8.52 22 2388 347 14008.52 26.4
4 8.36 25.4 3593 282 18405.5 8.6 24.5 4402 516 2160
5.5 8.13 18.6 7938 1723 2900
5.9 8.35 23.5 6722 3880 16707.6 8.22 23.7 6284 2188 2410
2.1 8.3 21.3 8345 9269 3900
4.5 7.2 20.9 11072 7180 22408.6 6.95 21.7 10608 2190
8.5 8.4 18.8 2480
3.3 6.8 21.9 6604 2434 1090

Day 101102103104105106107108109110111112113114115116117118119120121122123124125126127128129130131132133134135136137138139140141142143144145146147148149150
DO pHAerobic
temperatureTotal COD
EffluentSoluble COD
Efluent TSS
mg/L oC mg/L mg/L mg/L
Aerobic
6520 4789 950
5614 2152
2894 1200 8908.3 19.4 3604 1263 980
8.2 7.53 16.3 4060 2830 1140
9.5 7.23 18.6 9128 6020 26808.8 7.6 20 4746 1262 1360
4496 2196
4 8.4 25.7 8586 38408.16 8 22.8 5412 2638 1360
6.3 8.5 20 5724 2000 1520
8.42 20.4 6520 3580 1520
4.47 8.35 20.1 5463 2648 13036.33 7.67 19.4 6935 3142
4.56 7.77 20 4247 2780 4948.53 19
2.2 8.28 19.5 4212 1970
5.5 8.9 17.5 2642 993 8205.85 8.52 17.3 2226 1144
1920 880
5.5 8.68 16.1 1913 1600 3858.75 21 2336 1167

Day 151152153154155156157158159160161162163164165166167168169170171172173174175176177178179180181182183184185186187188189190191192193194195196197198199200
DO pHAerobic
temperatureTotal COD
EffluentSoluble COD
Efluent TSS
mg/L oC mg/L mg/L mg/L
Aerobic
8.80 22.2 1148 801
8.72 25.7 2157 1202 121010 8.83 17.9 1385 419
8.5 8.64 17.5 1087 166
5 8.13 15.7 1455 1060 620
3.5 8 23.3 2882 1802 16003 8.3 29.2 5540 872 2830
3 8.85 24.6 2400 336
6.5 9.41 17.2 1584 8004.5 8.74 22.4 1304 679 1340
2.5 8.8 21.4 706
2.8 8.5 18.3 5259 421 28005.5 8.62 20.8 6604 294

Day 201202203204205206207208209210211212213214215216217218219220221222223224225226227228229230231232233234235236237238239240241242243244245246247248249250
DO pHAerobic
temperatureTotal COD
EffluentSoluble COD
Efluent TSS
mg/L oC mg/L mg/L mg/L
Aerobic
5 9.33 17.6 2038 319
4 8.61 21.4 5627 269 26802.5 8.44 22.7 6099 1796
4 9.18 18.2 3174 274
9.61 21.1 1640 4343 9 18.8 6156 4310 1140
3.5 7.84 19.3 3997 2632
1206 6803 8.84 18.9 5809 1030 1160
9.52 17.6 9519 1316 1780
9.32 21.9 8417 8480 18208.61 20.1 14566 1432 2570
7 18.5 8939
8.73 20.38.06 22
8.75 22.6 1843 7302475 1295 550
7.5 18.5 4401 2923
8.1 20.8 4884 36508.2 17.3 4741 3076

Day 251252253254255256257258259260261262263264265266267268
DO pHAerobic
temperatureTotal COD
EffluentSoluble COD
Efluent TSS
mg/L oC mg/L mg/L mg/L
Aerobic
8 19.3 2262 1403 780
8.5 21.5 2000 775 770
8.5 17.4 2368 1700 450

Day 123456789
1011121314151617181920212223242526272829303132333435363738394041424344454647484950
% % % g/d kg/d/m3 g/daygTSS/gCODremo
ved
27.23 82.10 64.67 672.02 5.60 132.9 0.353.4
40.66 90.96 99.08 751.25 6.26 152.6 0.2
0.97 45.20 63.84 621.22 5.18 30.9 0.1
59.78 88.49 788.40 6.57 53.4 #DIV/0!
41.36 87.39 2.40 685.15 5.71 224.6194.7
32.30 90.59 17.44 691.72 5.76 152.6
0.02.07 40.59 64.47 926.38 7.72 144.1 0.2
285.5
-3.19 70.18 69.16 924.39 7.70 197.5 0.3
-5.57 79.38 79.94 917.48 7.65 229.3 0.3992.2
7.38 37.07 94.06 925.43 7.71 82.4 0.1
201.24.7
-37.97 2.65 26.93 697.59 5.81 160.1
41.28 86.87 89.72 849.05 7.08 201.2 0.3
43.42 89.01 93.86 809.40 6.74 192.8 0.3
48.37 87.85 93.42 768.10 6.40 199.4 0.3
Total efficiency
COD removal
Sludge Yield
COD volumetric loading
Solids produced MBBR/CFIC
Anaerobic bottom COD
removal
Anaerobic top COD removal
COD loading

Day 51525354555657585960616263646566676869707172737475767778798081828384858687888990919293949596979899
100
% % % g/d kg/d/m3 g/daygTSS/gCODremo
ved
Total efficiency
COD removal
Sludge Yield
COD volumetric loading
Solids produced MBBR/CFIC
Anaerobic bottom COD
removal
Anaerobic top COD removal
COD loading
50.56 86.53 92.66 795.23 6.63 171.3 0.2
74.60 74.72 97.06 1425.08 11.88 170.4 0.1
100.00 100.00 95.78 871.26 7.26 123.6 0.1
54.02 96.20 97.22 1106.78 9.22 113.0 0.1
42.07 88.25 95.11 838.25 6.99 79.6 0.1
68.89 83.70 95.68 694.31 5.79 131.0 0.2
48.00 94.54 97.18 864.00 7.20 172.2 0.2100.00 100.00 94.84 202.2
271.4
41.23 79.46 74.94 1337.82 11.15 156.3 0.2225.6
37.60 84.09 23.81 1051.14 8.76 365.0
51.03 63.63 64.08 1727.14 14.39 209.7 0.2205.0
-0.20 88.26 232.1
33.41 79.46 85.99 1501.11 12.51 102.0 0.1

Day 101102103104105106107108109110111112113114115116117118119120121122123124125126127128129130131132133134135136137138139140141142143144145146147148149150
% % % g/d kg/d/m3 g/daygTSS/gCODremo
ved
Total efficiency
COD removal
Sludge Yield
COD volumetric loading
Solids produced MBBR/CFIC
Anaerobic bottom COD
removal
Anaerobic top COD removal
COD loading
88.9
21.55 76.66 84.86 1227.74 10.23
1207.35 10.0618.67 88.87 91.27 1187.65 9.90 83.3 0.1
91.7
21.60 72.71 77.70 1096.59 9.14 106.7 0.1
39.80 69.90 59.19 1274.57 10.62 250.8 0.3127.3
37.02 79.11 83.95 1181.95 9.85
35.96 36.81 71.41 1160.35 9.67127.3
4.28 41.94 940.55 7.84 142.3
52.41 -99.37 77.28 1361.66 11.35 142.3 0.1
122.052.24 70.19 71.43 950.23 7.92
65.49 100.00 75.08 963.88 8.03 46.2 0.1
75.74 78.46 80.80 886.64 7.39
50.85 89.33 91.53 1012.61 8.44 76.8 0.1
87.66 93.78 93.63 1194.22 9.95
80.56 72.95 81.81 760.15 6.33 36.0 0.1

Day 151152153154155156157158159160161162163164165166167168169170171172173174175176177178179180181182183184185186187188189190191192193194195196197198199200
% % % g/d kg/d/m3 g/daygTSS/gCODremo
ved
Total efficiency
COD removal
Sludge Yield
COD volumetric loading
Solids produced MBBR/CFIC
Anaerobic bottom COD
removal
Anaerobic top COD removal
COD loading
53.02 79.81 91.36 801.19 6.68
83.58 79.85 92.41 1367.88 11.40 113.3 0.1100.00 100.00 90.75 391.22 3.26
32.29 84.82 96.61 423.36 3.53
26.11 79.61 72.32 330.91 2.76 58.0 0.2
55.87 77.59 84.35 994.64 8.29 149.8 0.2264.9
76.44 97.19 98.03 1473.98 12.28
84.87 96.07 93.95 1238.14 10.32 0.069.53 90.45 95.05 1284.19 10.70 115.8 0.1
50.04 90.48 96.18 1032.22 8.60 241.9 0.2

Day 201202203204205206207208209210211212213214215216217218219220221222223224225226227228229230231232233234235236237238239240241242243244245246247248249250
% % % g/d kg/d/m3 g/daygTSS/gCODremo
ved
Total efficiency
COD removal
Sludge Yield
COD volumetric loading
Solids produced MBBR/CFIC
Anaerobic bottom COD
removal
Anaerobic top COD removal
COD loading
87.80 97.35 98.57 2087.65 17.40
67.04 86.15 98.14 1351.58 11.26 231.6 0.287.66 1362.07 11.35
95.97 98.89 98.84 3492.22 29.1087.03 81.62 65.71 1176.55 9.80 98.5 0.1
65.98 78.66 76.16 1033.53 8.61
97.02 98.56 97.98 3158.06 26.3291.17 93.30 93.72 1536.35 12.80 100.2 0.1
92.36 92.86 93.16 1801.99 15.02 153.8 0.1
96.51 95.34 85.78 5582.30 46.52 157.2100.00 100.00 92.69 1833.25 15.28 222.0 0.1
66.52 26.14 1171.68 9.76
34.97 79.53 489.34 4.08 63.1 #DIV/0!100.00 100.00 85.82 855.04 7.13 47.5 0.1
2808.00 23.40
32.15 71.29 65.07 978.12 8.15100.00 100.00 76.30 1214.74 10.12

Day 251252253254255256257258259260261262263264265266267268
% % % g/d kg/d/m3 g/daygTSS/gCODremo
ved
Total efficiency
COD removal
Sludge Yield
COD volumetric loading
Solids produced MBBR/CFIC
Anaerobic bottom COD
removal
Anaerobic top COD removal
COD loading
67.4
66.5
33.36 69.62 75.64 653.14 5.44 38.9 0.1

Postboks 5003 NO-1432 Ås, Norway+47 67 23 00 00www.nmbu.no