Small hydro in Ukraine: to invest or not to invest? - fni.no · Small hydro in Ukraine: to invest...
35
FNI Report 12/2011 Small hydro in Ukraine: to invest or not to invest? Liv Arntzen Løchen
Transcript of Small hydro in Ukraine: to invest or not to invest? - fni.no · Small hydro in Ukraine: to invest...

FNI Report 12/2011
Small hydro in Ukraine:
to invest or not to invest?
Liv Arntzen Løchen


Small hydro in Ukraine:
to invest or not to invest?
Liv Arntzen Løchen
December 2011

Copyright © Fridtjof Nansen Institute 2011
Title
Small hydro in Ukraine: to invest or not to invest?
Publication Type and Number
FNI Report 12/2011
Pages
28
Author
Liv Arntzen Løchen
ISBN
978-82-7613-635-7 (print version)
978-82-7613-636-4 (online version)
ISSN
1504-9744
Abstract
The vast and unexploited renewable energy potential and the intro-
duction of green tariffs in 2009 have made Ukraine an attractive location
for investors within the renewable energy sector. The Green Tariff
system offers developers and investors the highest feed-in tariffs in
Eastern Europe, and thus far covers alternative energy production from
biomass, biogas, wind power plants and hydropower plants. Ukraine has
a history in both large- and small hydro production. Whereas the
potential of the country’s big rivers is now to a great extent exploited,
this is not the case for the smaller watercourses. Ukraine is well
endowed with small rivers, approximately 60,000 of which can be
classified as ‘very small’. Most of these are located in the western part of
the country, near the Carpathian Mountains. However, despite the
natural potential foreign investors should be aware of the potential risks
and hurdles. The country has a huge problem with corruption, and the
process of obtaining licenses is not straight forward. On the whole, it can
be worth exploring the possibilities of small hydro production in Ukraine
for those who can deal with a high level of risk and uncertainty. If not,
one would be better advised to look for investment locations elsewhere.
Key Words
Ukraine, renewable energy, small-hydro, green tariffs
Orders to:
Fridtjof Nansen Institute
Postboks 326
N-1326 Lysaker, Norway.
Tel: (47) 6711 1900
Fax: (47) 6711 1910
Email: [email protected]
Internet: www.fni.no

i
Contents
Executive summary ii
1 Introduction 1
2 Ukraine’s power sector and its current status 2
3 Potentials 3
3.1 Natural potential 3
3.2 Electrification ratio and access 7
3.3 Demography/economic development/demand growth 7
4 Electricity system 10
4.1 Supply mix 10
4.2 Distribution grids 11
4.3 Energy subsidies: Feed-in tariffs for renewable energy 14
4.4 Tariff structure and payment systems 16
5 Business environment 19
5.1 Investment climate 19
5.2 Financing and banking sector 20
5.3 Property rights, corruption and theft: 20
6 International and national 22
6.1 Investors, owners and operators 22
6.2 Technology suppliers 23
7 Future prospects 24
8 Recommendation for national policies 25
Bibiliography 26
List of figures and tables 28

ii
Executive summary
Ukraine remains highly dependent on nuclear energy. However, the
renewables potential is vast, and recent political incentives have sought to
make Ukraine an attractive place for investors within the renewables
sector. On the other hand, it remains to be seen how stable the conditions
really are, or if they are all too good to be true.
Ukraine has a history of both hydro and small hydro production. Whereas
the potential of the country’s big rivers is now to a great extent exploited,
this is not the case for the smaller watercourses. Ukraine is well endowed
with small rivers, approximately 60,000 of which can be classified as
‘very small’. Most of these are located in the western part of the country,
near the Carpathian Mountains. Although not suitable for traditional
hydro-power plants, such watercourses can effectively be used for small
hydro plants (SHPs). In the 1950s there were 956 SHPs in Ukraine.
However, interest diminished as new traditional large hydro as well as
nuclear power plants were put into operation. In the 1980s fewer than 50
SHPs were still functioning in Ukraine, but interest was rekindled after
the turn of the century. As of 2006 there were about 70 SHPs in service
(Winkler 2009).
In 2009 a new Green Tariffs Law was passed aimed at making Ukraine
more attractive to investors within the renewable energy sector. Thus far,
the renewable energies covered by the Green Tariffs are biomass, wind,
solar and small hydro plants. The country’s natural potential and the
introduction of the Green Tariffs clearly make Ukraine an attractive
location for small- hydro investors. However, foreign investors should be
aware of the potential risks and hurdles. The country has huge problems
with corruption, and the process of obtaining licenses is not straight
forward. On the whole, it can be worth exploring the possibilities of small
hydro production in Ukraine for those who can deal with a high level of
risk and uncertainty. If not, one would be better advised to look for
investment locations elsewhere.

1
1 Introduction
Ukraine’s 2005/2006 gas crisis with Russia clearly showed Ukraine’s
dependency on Russian gas. This was one of the contributing factors that
spurred Ukrainian politicians to come up with policies aimed at changing
this situation. In 2009, the Green Tariff system was introduced, offering
developers and investors the highest feed-in tariffs in Eastern Europe. In
addition, Ukraine has a vast renewable energy potential waiting to be
exploited. These factors combined should make the country attractive to
investors within the renewable energy sector. However, Ukraine is not an
easy country to do business in, and its natural potential and favourable
regulations may not always outweigh the risks associated with
investments in Ukraine.
This report is an empirical study focused on mapping the potential for
foreign investment within small- scale hydro production. Further, it looks
into two central questions: (1) what are the most important indicators that
can explain the growth, or lack of growth, of small- scale hydro
production in Ukraine? (2) what are the future prospects for such
technology in the country?
The report is based on data collected on the power sector in Ukraine in
general, and small hydro in particular. Data derive from official reports
from the national level, scholarly academic articles, reports and surveys,
as well from a series of interviews in Kiev in September 2011. Interviews
were conducted with representatives off the legal branch, consultancy
firms, NGOs, power companies and state representatives. Interviewees
were asked specific questions as well as being allowed to reflect freely on
the issues in focus.

2 Liv Arntzen Løchen
2 Ukraine’s power sector and its current status
To a considerable extent, the energy markets of Ukraine inherited
production technologies and capacities from the Soviet Union. After
independence, however, the Ukrainian energy sector underwent several
substantial changes in ownership structures as well as organizational
aspects (Herasimovich and Tsarenko 2008). In the mid-1990s came a
substantial reform, and Ukraine became the first country of the former
Soviet Bloc to introduce a competitive electricity market. The president
of Ukraine issued in May 1994 a decree requiring liberalization of the
power sector as well as the development of a competitive national whole-
sale electricity market (WEM). The restructuring was carried out in 1995-
96, supported by the extensive technical assistance from bilateral and
multilateral donors (Herasimovich and Tsarenko 2008). The National
Electricity Regulation Commission (NERC) was established in 1995,
tasked with commissioning issues and monitoring licenses for electricity
generation, high-voltage transmission, low-voltage distribution, whole-
sale market operations, and tariff and non-tariff supply. As can be seen
from Figure 1, the Ukrainian power sector is structured in terms of its
major business activities: generation, transmission and distribution of
electricity.
Figure 1: Overview of industry structure
Source: IMEPOWER Consulting (2009: 3)
Electricity demand collapsed after the system changed. It has been re-
covering since, and both production and consumption have been growing
since 2000, thanks to the economic recovery. The drop in demand can
also to some extent explain the overcapacity characteristic of the
Ukrainian system today. Surplus electricity production has further
enabled Ukraine to export to neighbouring countries. Ukraine’s energy
sector is still heavily dominated by thermal and nuclear power, but the
share of renewables is increasing (Herasimovich and Tsarenko 2008).
Due to recent increases in gas prices, there has come a stronger political
focus on increasing the share of alternative/renewable energy sources, in
order to reduce the nation’s dependence on gas from Russia.

Small hydro in Ukraine: to invest or not to invest? 3
3 Potentials
3.1 Natural potential
Compared to other countries poorly endowed with mineral resources,
Ukraine produces renewable energy in negligible amounts (Mosaic
Investments 2009). However, there is a large renewable energy potential,
and in The Energy Strategy of Ukraine for the period until 2030 (Ministry
of Fuel and Energy of Ukraine & National Academy of sciences of
Ukraine, 2006), the development of renewable and alternative sources of
energy is held up as an important factor for enhancing the energy security
of the country. According to INFORSE (IMEPOWER 2010), an
international NGO network for sustainable energy, Ukraine is capable of
generating more than 80 TWh of electricity from renewable sources by
2030, and more than 120 TWh by 2050. Although the Ukrainian govern-
ment operates with more modest calculations, as seen in Table 1 it
nonetheless calls for a renewable share of the electricity production of
more than 30% by 2030 (Ministry of Fuel and Energy of Ukraine &
National Academy of sciences of Ukraine, 2006).
Table 1: Indicators of Alternative and Renewable Energy Sources (ARES)
development by key development areas (Base Case Scenario), million tons of
standard fuel/year
Source: The Energy Strategy of Ukraine for the period until 2030 (Ministry of
Fuel and Energy of Ukraine & National Academy of sciences of Ukraine, 2006:
85).
According to the Energy Strategy of Ukraine for the period until 2030
(Ministry of Fuel and Energy of Ukraine & National Academy of
sciences of Ukraine, 2006) the technically feasible alternative and
renewable energy sources (ARES) potential of the country when
converted to standard fuels represent a total of 79 million tons annually.
The economically feasible potential under the base-case scenario is 57.7

4 Liv Arntzen Løchen
million tons of standard fuel. Of that figure, renewable sources make up
35.5 million tons, and alternative (off-balance) 22.2 million tons.
Hydropower constitutes a promising sector for ARES development in
Ukraine. The country has a history of hydropower production, and large
hydro accounted for 9% of total gross power consumption in 2008.
According to Winkler (2009), there are more than 40 operational
hydropower plants in Ukraine. Most of these are located on the main
rivers: the Dnipro, Dnister, Southern Bug and Tisza. The energy potential
of big rivers has to a great extent already been exploited, whereas the
potential of small rivers has barely been tapped. There are more than
63,000 small rivers with a total length of 135,800 km in Ukraine, and
approximately 60,000 of these fall into the category ‘very small’ (less
than 10 km long). These are not suited for traditional hydropower plants,
but are relevant for small hydro- production, as small plants can
effectively use the river-flow energy of such watercourses (Kovalenko
2007, Winkler 2009).
Several regions in Ukraine are suitable for small hydro- production. The
greatest potential is to be found in the western part of the country, near
the Carpathian Mountains. As regards small-scale hydro the energy
potential of small rivers has been estimated at 3-4 TWh. A recent study
on small hydro in Ukraine1 recommends that in order to realize the
existing small- hydro potential of 3.3TWh, some 1.04 GW of small-
hydro capacity should be installed (Winkler 2009, Kubrushko 2010).
The average annual amount of electric power now being generated by
small- hydro is 300-400 million kWh. According to Mosaic Investments
(2009), the small- hydro potential of Ukraine is equivalent to
approximately 1.9% of current gross power consumption. Today there are
some 50 small hydropower plants in operation, with the largest in the
areas of Tereblya Rika, Gaivoron, Korsun-Shevchenkivsk, Stebliv and
Ladyzhyn. Some of these plants are owned by private investors; the
others belong to oblenergos (regional power distribution companies).
Most of the operative plants require refurbishment. Around 100 small
hydropower 21.5 MW plants are currently decommissioned and in need
of comprehensive modernization. Figure 2 shows the hydropower
potential of small rivers of Ukraine in million kWh per year.
1 Study conducted by the Consortium of Promotion of Small Hydro Power Retrofitting
and Implementation in the Caucasus and Carpathian Region, at the request of the EC.
Referred to by Mosaic Investments (2009).

5
Figure 2: Hydropower potential of small rivers of Ukraine, million kWh per year
Source: IMEPower Consulting (unpublished paper)

6 Liv Arntzen Løchen
When the Soviets started the connection of isolated grids in the 1960s and
70s it was not considered worth bothering about connecting the smallest
hydro- plants and many of these were therefore abandoned. As a result
there are in Ukraine today many old small hydro- plants in need of
refurbishment. Figure 3 lists some of the small plants currently in
operation, whereas Figure 4 lists the location of some of the decom-
missioned small hydropower plants as of 2007. In western Ukraine a rush
to find good locations for small hydro has begun, and many of the best
spots are already taken. However, there are still brownfields and
abandoned sights available for potential investors.
Figure 3: Location of Ukrainian small hydropower plants currently in
operation (2007)
Source: Kovalenko (2007)
Figure 4: Location of decommissioned small hydropower plants (as of 2007)
Source: Kovalenko (2007)
Small hydro in Ukraine: to invest or not to invest? 7
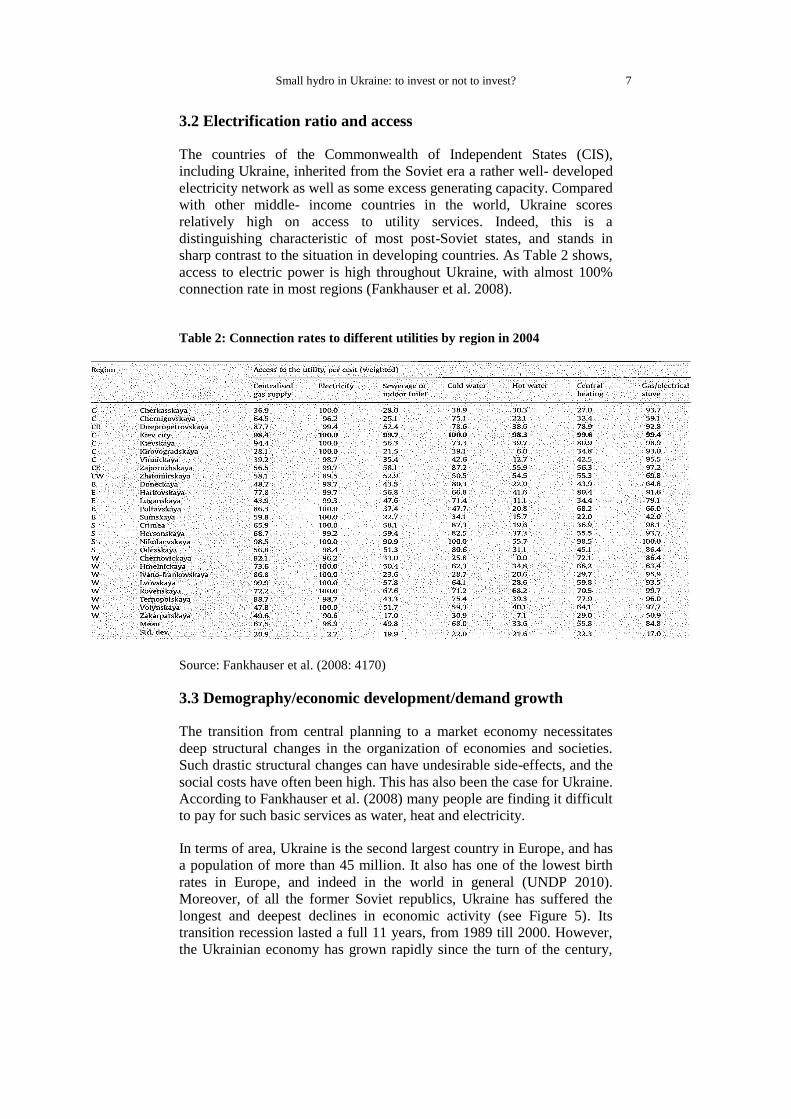
3.2 Electrification ratio and access
The countries of the Commonwealth of Independent States (CIS),
including Ukraine, inherited from the Soviet era a rather well- developed
electricity network as well as some excess generating capacity. Compared
with other middle- income countries in the world, Ukraine scores
relatively high on access to utility services. Indeed, this is a
distinguishing characteristic of most post-Soviet states, and stands in
sharp contrast to the situation in developing countries. As Table 2 shows,
access to electric power is high throughout Ukraine, with almost 100%
connection rate in most regions (Fankhauser et al. 2008).
Table 2: Connection rates to different utilities by region in 2004
Source: Fankhauser et al. (2008: 4170)
3.3 Demography/economic development/demand growth
The transition from central planning to a market economy necessitates
deep structural changes in the organization of economies and societies.
Such drastic structural changes can have undesirable side-effects, and the
social costs have often been high. This has also been the case for Ukraine.
According to Fankhauser et al. (2008) many people are finding it difficult
to pay for such basic services as water, heat and electricity.
In terms of area, Ukraine is the second largest country in Europe, and has
a population of more than 45 million. It also has one of the lowest birth
rates in Europe, and indeed in the world in general (UNDP 2010).
Moreover, of all the former Soviet republics, Ukraine has suffered the
longest and deepest declines in economic activity (see Figure 5). Its
transition recession lasted a full 11 years, from 1989 till 2000. However,
the Ukrainian economy has grown rapidly since the turn of the century,
8 Liv Arntzen Løchen
and from 2000 to 2007 the country enjoyed strong economic growth – 7.3
percent annually (Crane and Larrabee 2007: 9). This favorable trend
experienced a drop with the financial crisis in 2008/2009, but in 2010
promising recovery signs appeared. Figure 6 presents GDP growth rates
as forecast in the 2006 Energy Strategy.
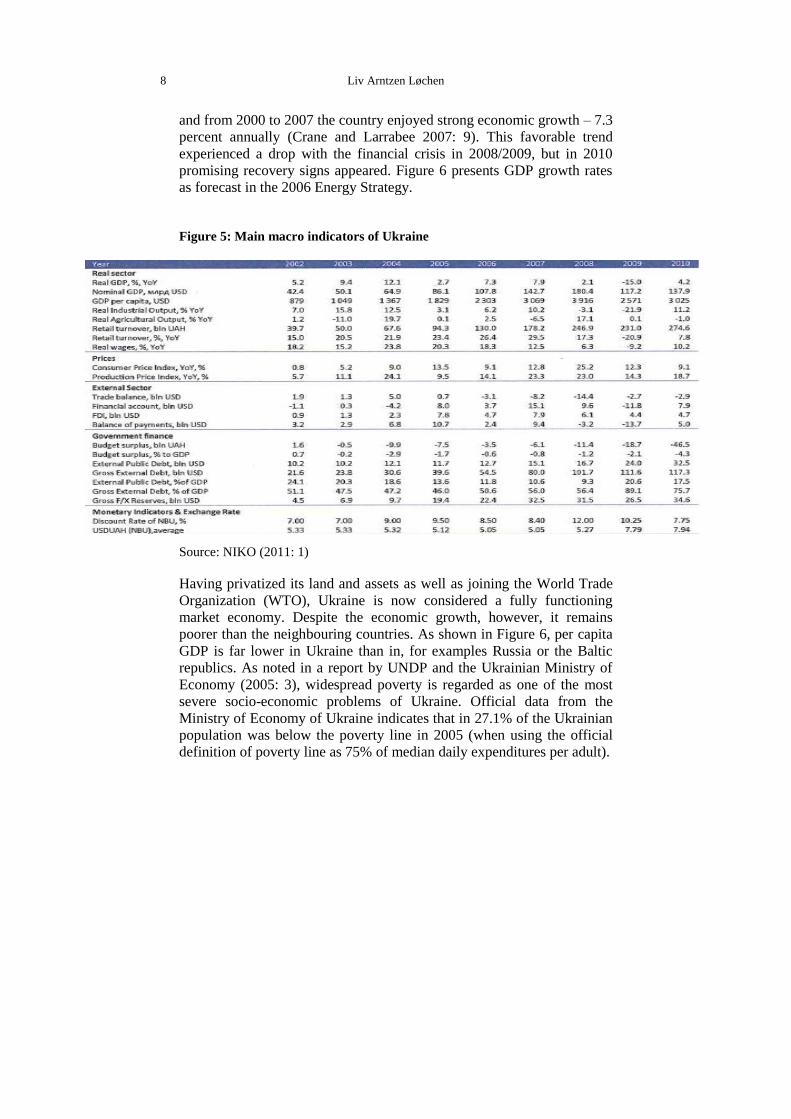
Figure 5: Main macro indicators of Ukraine
Source: NIKO (2011: 1)
Having privatized its land and assets as well as joining the World Trade
Organization (WTO), Ukraine is now considered a fully functioning
market economy. Despite the economic growth, however, it remains
poorer than the neighbouring countries. As shown in Figure 6, per capita
GDP is far lower in Ukraine than in, for examples Russia or the Baltic
republics. As noted in a report by UNDP and the Ukrainian Ministry of
Economy (2005: 3), widespread poverty is regarded as one of the most
severe socio-economic problems of Ukraine. Official data from the
Ministry of Economy of Ukraine indicates that in 27.1% of the Ukrainian
population was below the poverty line in 2005 (when using the official
definition of poverty line as 75% of median daily expenditures per adult).
Small hydro in Ukraine: to invest or not to invest? 9
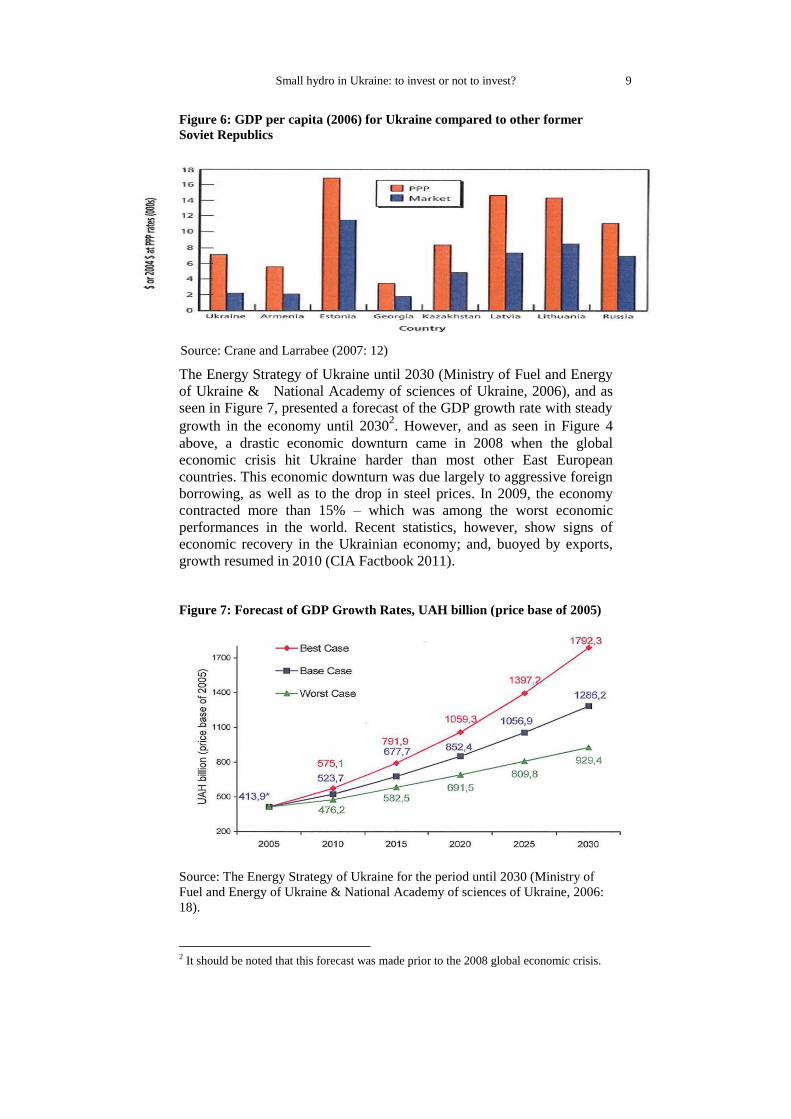
Figure 6: GDP per capita (2006) for Ukraine compared to other former
Soviet Republics
Source: Crane and Larrabee (2007: 12)
The Energy Strategy of Ukraine until 2030 (Ministry of Fuel and Energy
of Ukraine & National Academy of sciences of Ukraine, 2006), and as
seen in Figure 7, presented a forecast of the GDP growth rate with steady
growth in the economy until 20302. However, and as seen in Figure 4
above, a drastic economic downturn came in 2008 when the global
economic crisis hit Ukraine harder than most other East European
countries. This economic downturn was due largely to aggressive foreign
borrowing, as well as to the drop in steel prices. In 2009, the economy
contracted more than 15% – which was among the worst economic
performances in the world. Recent statistics, however, show signs of
economic recovery in the Ukrainian economy; and, buoyed by exports,
growth resumed in 2010 (CIA Factbook 2011).
Figure 7: Forecast of GDP Growth Rates, UAH billion (price base of 2005)
Source: The Energy Strategy of Ukraine for the period until 2030 (Ministry of
Fuel and Energy of Ukraine & National Academy of sciences of Ukraine, 2006:
18).
2 It should be noted that this forecast was made prior to the 2008 global economic crisis.
10 Liv Arntzen Løchen
4 Electricity system
4.1 Supply mix
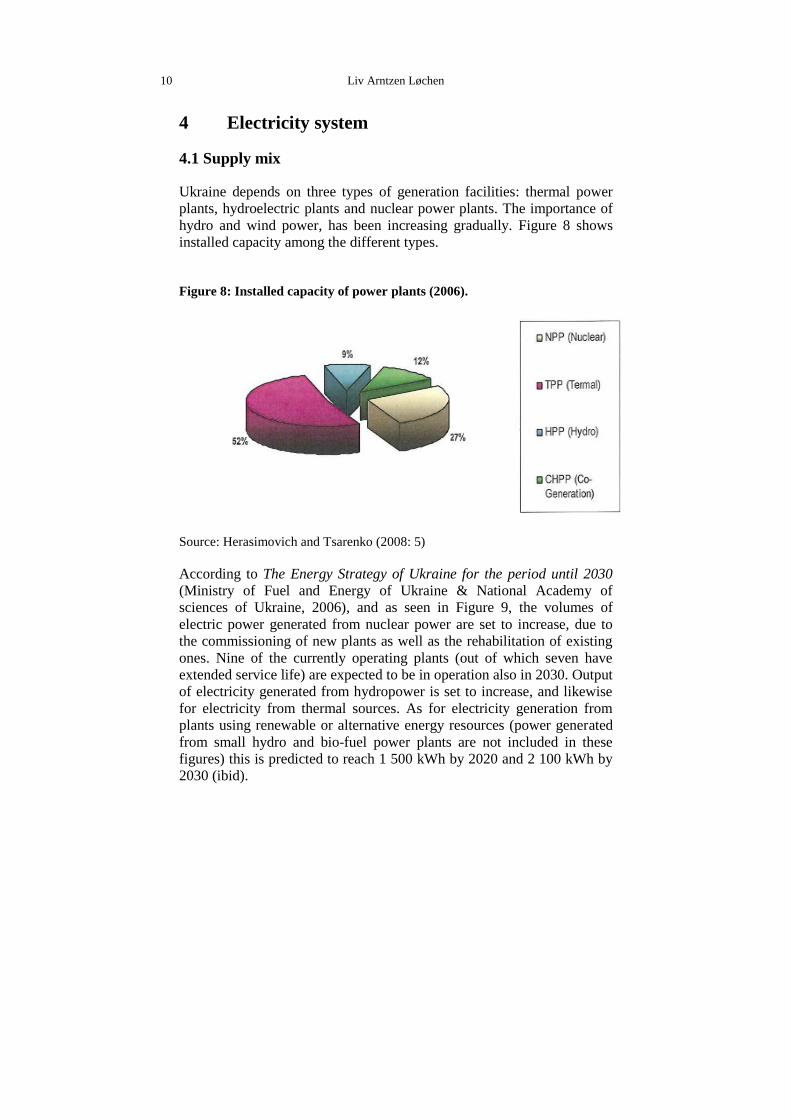
Ukraine depends on three types of generation facilities: thermal power
plants, hydroelectric plants and nuclear power plants. The importance of
hydro and wind power, has been increasing gradually. Figure 8 shows
installed capacity among the different types.
Figure 8: Installed capacity of power plants (2006).
Source: Herasimovich and Tsarenko (2008: 5)
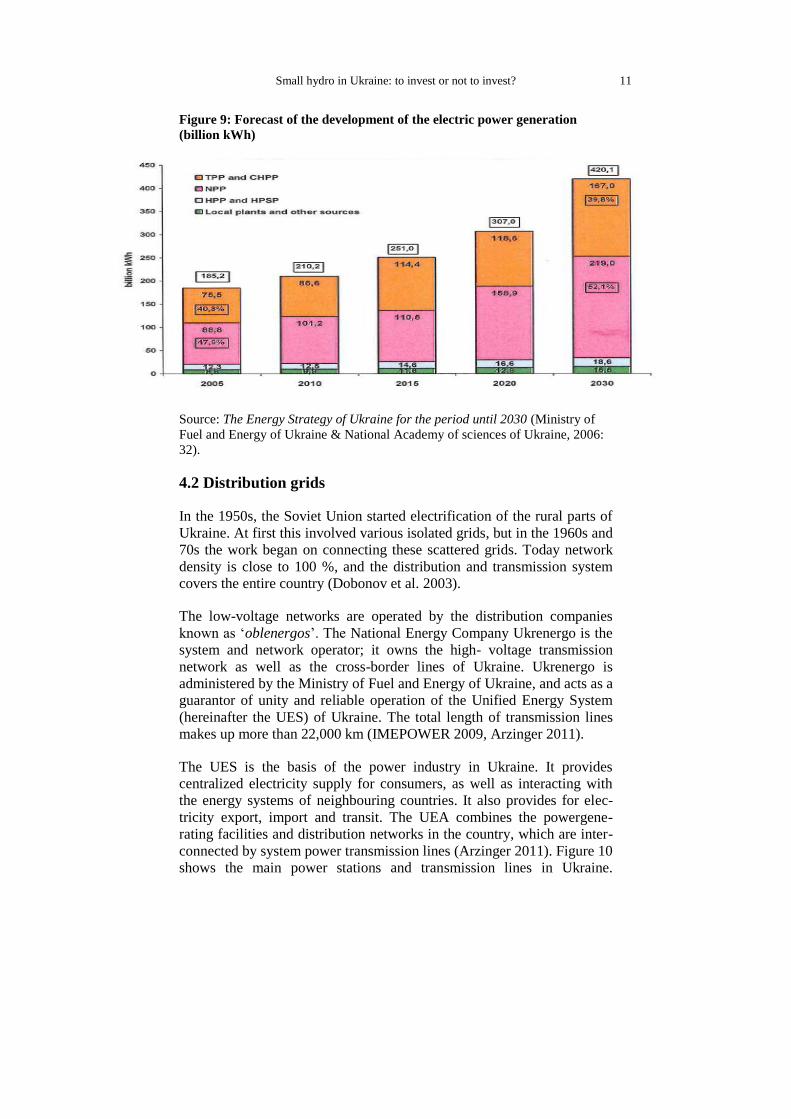
According to The Energy Strategy of Ukraine for the period until 2030
(Ministry of Fuel and Energy of Ukraine & National Academy of
sciences of Ukraine, 2006), and as seen in Figure 9, the volumes of
electric power generated from nuclear power are set to increase, due to
the commissioning of new plants as well as the rehabilitation of existing
ones. Nine of the currently operating plants (out of which seven have
extended service life) are expected to be in operation also in 2030. Output
of electricity generated from hydropower is set to increase, and likewise
for electricity from thermal sources. As for electricity generation from
plants using renewable or alternative energy resources (power generated
from small hydro and bio-fuel power plants are not included in these
figures) this is predicted to reach 1 500 kWh by 2020 and 2 100 kWh by
2030 (ibid).
Small hydro in Ukraine: to invest or not to invest? 11
Figure 9: Forecast of the development of the electric power generation
(billion kWh)
Source: The Energy Strategy of Ukraine for the period until 2030 (Ministry of
Fuel and Energy of Ukraine & National Academy of sciences of Ukraine, 2006:
32).
4.2 Distribution grids
In the 1950s, the Soviet Union started electrification of the rural parts of
Ukraine. At first this involved various isolated grids, but in the 1960s and
70s the work began on connecting these scattered grids. Today network
density is close to 100 %, and the distribution and transmission system
covers the entire country (Dobonov et al. 2003).
The low-voltage networks are operated by the distribution companies
known as ‘oblenergos’. The National Energy Company Ukrenergo is the
system and network operator; it owns the high- voltage transmission
network as well as the cross-border lines of Ukraine. Ukrenergo is
administered by the Ministry of Fuel and Energy of Ukraine, and acts as a
guarantor of unity and reliable operation of the Unified Energy System
(hereinafter the UES) of Ukraine. The total length of transmission lines
makes up more than 22,000 km (IMEPOWER 2009, Arzinger 2011).
The UES is the basis of the power industry in Ukraine. It provides
centralized electricity supply for consumers, as well as interacting with
the energy systems of neighbouring countries. It also provides for elec-
tricity export, import and transit. The UEA combines the powergene-
rating facilities and distribution networks in the country, which are inter-
connected by system power transmission lines (Arzinger 2011). Figure 10
shows the main power stations and transmission lines in Ukraine.

12
Figure 10: Transmissions lines Ukraine
Source: The Energy Strategy of Ukraine for the period until 2030 (Ministry of Fuel and Energy of Ukraine & National Academy of sciences of Ukraine, 2006: 29)

Small hydro in Ukraine: to invest or not to invest? 13
The growing demand for electricity constitutes a challenge for the old
transmission and distribution networks (Herasimovich and Tsarenko
2008). Ukraine has a history of problems with technological losses in its
electricity production. Between 2000 and 2004, average annual power
losses (commercial and technical) for transmission by power transmission
networks amounted to 31.5 billion kW/hour – equivalent to 19.9% of
total power input to the network. As of 2008, the level of technological
losses was ‘down’ to 12.5% of the electricity produced – still 2-2.5 times
higher than in developed countries. Reducing these losses will require
investment and modernization of the transmission and distribution
networks (ibid, Energy Strategy (2006)).
Figure 11: Electric power produced and Losses in its transmission by Power
Networks of Ukraine (billion kW/hour)
Source: The Energy Strategy of Ukraine for the period until 2030 (Ministry of
Fuel and Energy of Ukraine & National Academy of sciences of Ukraine, 2006:
30).
The European Bank for Reconstruction and Development (EBRD) has
since 2005 invested roughly EUR 400 million in high voltage trans-
mission line projects across Ukraine, sponsored by the Ukrainian state
owned company Ukrenergo. Figure 12 shows transmission line projects
already funded or planned to be funded with EU financing(Bankwatch
2011).

14 Liv Arntzen Løchen
Figure 12: Ukrainian transmission line projects already funded or planned
to be funded with EU public finances.
Source: Bankwatch (2011)
When starting up small hydro production, an important element is
connection to the grid. According to Ukrainian regulations the
distribution companies, the Oblenergos, are obliged to pay for the
connection. In practice, the investor usually has to pay for the
construction. This money shall later, according to the law, be reimbursed
by the oblenergos. Here it should be mentioned that there exist serious
doubts as to whether this system works in practice and whether investors
will in fact get their money back (interviews Kiev, September 2011).
4.3 Energy subsidies: Feed-in tariffs for renewable energy
As noted, Ukraine has a huge renewables potential (wind, bio-, solar and
hydro). As yet, the country has produced renewable energy only in
negligible amounts. Moreover, it remains a heavy consumer of gas, with
Russian gas accounting for the majority of total consumption. Ukrainians
(at least household consumers) had long been able to enjoy cheap and
subsidized gas. However, the gas dispute with Russia in 2006 marked the
start of a market relationship without the same favours as before. The
steep increase in the price of gas has therefore made energy generation
from renewable/alternative sources a hot topic in Ukraine today.
One of the incentives set forth by the Ukrainian government to increase
the share of renewable energy was the introduction of green tariffs. The
legislation was debated for years before it was agreed in 2008. Several
drafts went through the first reading (two readings are required), which
means an initial vote in the Ukrainian parliament. The second reading

Small hydro in Ukraine: to invest or not to invest? 15
was postponed for requested amendments, but in 2008 the first Green
Tariff Law passed the second reading and could be signed by the
president. However, during the financial crisis in 2008, the local currency
depreciated against the Euroand USD to level that made the Green Tariff
Law no longer a feasible feed- in tariff. As a result on 22 April 2009 the
president approved a ‘revised’ Green Tariff rate calculation methodology.
This new law offers developers and investors the highest feed-in tariffs in
Eastern Europe. The Green Tariff is pegged to the Euro, which entails a
fixed tariff valid until 1 January 2030 and a guaranteed electricity off-
take by the wholesale electricity market operator. The tariffs apply to new
construction as well as existing renewable energy producing facilities put
in operation prior to 2014. The Green Tariff is revised on a monthly basis
to follow changes in the UAH/EUR currency exchange rate, with a
guaranteed ‘minimum floor’ in Euros. It includes a guarantee against
local devaluation, and has resulted in higher prices for alternative energy
producers (IMEPOWER Consulting 2010).
The Green Tariff is set by NERC, and covers alternative energy
production such as biomass, biogas, wind- power plants and hydropower
plants. So far the only capacity cap on Ukraine’s Green Tariff is on
hydropower plants, where eligible facilities may not exceed 10 MW in
capacity. The tariffs for small hydro are fairly high, but nothing compared
to the solar tariffs, as can be seen in Table 3.
Table 3: Green Tariffs in Ukraine, €/MWh (net of VAT)
Source: IMEPOWER Consulting (20010: 2)

16 Liv Arntzen Løchen
The development and introduction of the Green Tariffs did not come
about solely because of the wish to beless energy-dependent on Russia.
The role of the oligarchs should also be mentioned. During President
Leonid Kuchma’s decade in office, Ukraine’s oligarchs made their
greatest capital accumulation through the re‐sale of Russian energy –
particularly during the 1990s when Russian energy was imported at
below ‘market’ prices. According to Kuzio (2008), corruption from the
energy sector through the newly established Naftohaz Ukrainy and the
role of the Ukrainian oligarchs provided Kuchma with resources crucial
for winning the 1999 elections. In that sense, the oligarchs played the
same role as their Russian counterparts had in ensuring Boris Yeltsin’s
re‐election in 1996. Interviewees (in Kiev, September 2011) have further
confirmed that the oligarchs were active in the development of Ukraine’s
Green Tariff scheme. Such tariffs were. It is argued, seen by certain
individuals as a way to make money. This was certainly the case with the
solar industry, which emerged as the technology with the best Green
Tariff conditions (see Table 2).
4.4 Tariff structure and payment systems
It is the National Electricity Regulation Commission of Ukraine (NERC)
which regulates electricity and gas tariffs. District heating, on the other
hand, is subject to the approval of the local authorities according to the
Law on Heat Supply (Park 2011).
Electricity consumers in Ukraine are categorized as either regulated tariff
consumers or non-regulated tariff consumers. The first group includes
households, settlements (lighting, group consumer) and other consumers.
The non-regulated group includes big companies with special permits
(Park 2011). As mentioned, Ukraine has almost universal access to
electricity. The challenge, however, is to ensure that this remains
affordable to the people.
A problematic factor in the operation of the electricity market is the high
level of cross-subsidization by industrial actors with regard to the cost of
electricity supplied to certain consumer categories at reduced tariffs
(Arzinger 2011). Electricity tariffs generally involve the price of
generation, transmission, distribution and supply. During Soviet times,
tariffs were set by the state. They did not cover the actual costs, as
electricity supply was seen as a public good or even a human right.
Industrial customers paid much higher tariffs in order to subsidize these
low prices for households and other end-customers. Ukraine continued
with the practice of subsidized energy also long after independence from
the Soviet Union in 1991; even today, it has to a large extent retained the
low energy- price policy which originated in the Soviet era (Dodonov et
al. 2003).
Energy prices in Ukraine – especially for electricity, gas and district
heating – are low compared to other OECD countries. As a result, the
revenues from sales do not cover the costs. This in turn has led to a
situation where several Ukrainian energy providers have not even been
able to finance necessary investments for capacity replacement and
maintenance. Energy prices generally cover only actual operating costs,

Small hydro in Ukraine: to invest or not to invest? 17
without taking the long-term costs of energy supply into account.
According to NERC, in 2006 electricity tariffs covered only 60 % of the
total production costs (Tsarenko 2007).
Low prices for households have been possible due to subsidization and
cross-subsidization from industrial consumers to households. The low
household tariffs are still, after years of economic reforms, a sensitive
issue in Ukraine. ‘Although tariffs have been increasing several times in
Ukraine since 1991, they still remain far below cost covering levels, and
cross subsidization of private households and agrarian customers by
industry still takes place’ (Dodonov et al. 2003: 855). Ukraine lags
behind other transition countries in re-balancing electricity tariffs
between households and industry. As can be seen from Table 4, industrial
consumers in Ukraine pay substantially higher energy prices than do
households (Park 2011). The present system of subsidies is not
sustainable; according to Fankhauser et al. (2008: 4168) ‘tariffs will have
to go up substantially to make the underfunded networks financially
viable again and finance the extensive rehabilitation needs’.
Table 4: Electricity tariffs for Industrial and Household consumers
Source: Taken from Park (2011: 16).
Notes: First group (o.4-10 kW); second group (35-110 kW); big companies (92
with special permits).
Also relevant is the history of non-payment in Ukraine. According to
Dodonov et al. (2003) it has been common to manipulate electricity
meters; the same author also claim that official estimates showed that
Ukrainian households were at times paying for only 70 –80% of the
electricity they consumed. Non-payment has traditionally had no
consequences such as disconnection from the energy supply, and no
Ukrainian governments or politicians have been willing to enact laws and
regulations to enforce payment by private households, as by power
disconnection.3 This is slowly beginning to change. With the ricing prices
3 Disconnecting individual users from the energy supply also faces some technical
problems, at least with multi-storey buildings (Dodonov et al. 2003). However, various
ways of solving these technical issues are now being tested out (interviews Kiev,
September 2011).

18 Liv Arntzen Løchen
for gas and electricity it is becoming obvious also for Ukrainian
politicians that such a system cannot remain sustainable much longer.
Non-payment for electricity consumed has led to serious cash shortages
in the sector, in turn resulting in fuel- supply shortages and frequent
interruptions of the electricity supply. Tariff policy has an important role
to play in modernizing the sector as well as in improving the reliability of
electricity supply (Dodonov et al. 2003).
A further element is the debt situation. Table 5 shows the debt dynamics
of the power sector of Ukraine in the period 2000 – 2006. According to
Herasimovich and Tsarenko (2008) the main reason for the accumulation
of debt was the non-payment crisis of the late 1990s. At its worst in 1998,
only 7 – 10% of electricity bills were paid in cash; 77% were settled
through barter arrangements, and the remainder was not paid at all. In
2000, Energorynok was created with the aim of eliminating barter
settlements and clearing up cash flows for electricity. Energorynok is
currently the largest debtor in the electricity market. A system of ‘special
accounts’ has also been introduced to prevent misuse of energy funds. As
can be seen in Table 5, the amount of debt decreased in 2006 after many
years of continuing increase of the accrued amount of non-payment.
Table 5. Debt dynamics in the power sector of Ukraine in the period 2000-
2006
Source: Herasimovich and Tsarenko (2008: 15)

Small hydro in Ukraine: to invest or not to invest? 19
5 Business environment
5.1 Investment climate
Ukraine has since independence in 1991 tried to shift from a centrally-
planned economy to a business environment driven by market forces.
However, despite the country’s natural resources, extensive human
capital as well as industrial potential, there are several challenges and
risks to be considered before starting up business in Ukraine (PWC
2011). For some investors these might even outweigh the natural
potential (see Figure 13 for opportunities and challenges connected to
investment in renewables in particular).
Figure 13: RES Project Development in Ukraine
Source: IMEPOWER Consulting (2011: 5)
A noted by the World Bank and the International Finance Corporation in
‘Doing Business 20114’ Ukraine can be a challenging country to do
business in. Their report ranks it as 145 out of 183 economies (see Figure
14). For example the procedures for securing permits and getting
necessary approvals are complicated, the project development process
both costly and lengthy (Kubrushko 2010). However, reforms have been
implemented which have improved investor protection in the country,
and it is deemed likely that ratings will improve in the future (PWC
2011).
4 “A set of regulations affecting 9 stages of a business’s life are measured: starting a
business, dealing with construction permits, registering property, getting credit, protecting
investors, paying taxes, trading across borders, enforcing contracts and closing a
business” (IFC 2011:1).

20 Liv Arntzen Løchen
Figure 14: Ease of doing business in Ukraine compared to a selection of
other countries.
Source: IFC (2011: 2)
5.2 Financing and banking sector
Ukraine has a two-tier banking system, with the National Bank of
Ukraine (NBU) as the central bank, and the other commercial banks
operating under NBU supervision and authorization. The recent economic
crisis has hit the Ukrainian banking sector hard, triggering a substantial
slowdown in the credit market. Thus, the crisis continues to be a
significant risk for the banking sector (PWC 2011).
Investments in the energy sector often entail the need for hefty loans or
external funding. Especially after the financial crisis, however, loans
from local banks are generally not available for such capital- intensive
projects. Potential investors might be better advised to turn to
international financial institutions like the EBRD and the IFC
(IMEPOWER Consulting 2010).
5.3 Property rights, corruption and theft:
When a site for operation has been acquired, the important question of
property rights arises. Heritage Foundation and The Wall Street Journal
have developed a property rights index as a subcomponent of the Index of
Economic Freedom. According to the Index of Economic Freedom,
Ukraine’s overall economic score is 45.8, which ranks it as only the 164th
freest economy out of the 179 countries listed in 2011. The score is 0.6
points lower than the previous year, due mainly to the decline in
government spending and in freedom from corruption. The same index
also ranks Ukraine last of the 43 countries in the European region.
Protection of property rights is weak in Ukraine. It is further noted that
the judiciary is subject to the executive branch as well as to criminal
pressure. Moreover, contracts are not well enforced, and there is the risk
of expropriation.

Small hydro in Ukraine: to invest or not to invest? 21
According to Crane & Larrabee (2007) the Ukrainian regulatory and legal
hurdles are designed to elicit bribes. They further argue that government
employees in Ukraine, as like in other countries afflicted by corruption,
deliberately design registration and licensing procedures to be so complex
that they may credibly threaten to halt or slow trade or a foreign
investment. All in all the time and expense involved in obtaining the
requisite permits and licenses in order to trade, and set up a business adds
substantially to the costs, as well as reducing both trade and investment.
Corruption in Ukraine is perceived as widespread: indeed, Crane &
Larrabee (2007) see corruption as the greatest barrier to expanding
investment and trade in Ukraine. Complying with the many bureaucratic
demands, which are not always mutually consistent, makes it more time-
consuming and more expensive to start a business in Ukraine. Thus, again
according to Crane and Larrabee (2007), the advantages the country can
offer in terms of low labour and operating costs are often not enough to
compensate for the extra trouble and costs of trying to figure out the
government bureaucracy.
Since the Orange Revolution of 2005, fighting corruption has been high
on the political agenda in Ukraine. However, in Transparency
International’s Corruption Perceptions Index for 2009, the country ranks
as 146th out of 180 countries –a sharp drop for the second year in a row
(Transparency International 2011). Further Transparency International’s
(TI) has recently published a National Integrity System5 assessment
(NIS) which shows that Ukraine has made little progress in halting the
tide of corruption. According to the 2010 Corruption Perception Index,
Ukraine scored 2.4, which indicates widespread perception of corruption.
The NIS of Ukraine indicates that corruption is a systemic problem found
across the board at all levels of public administration; moreover, that both
grand and petty corruption is flourishing. Political parties, the legislature,
public officials, the police and the judiciary are all institutions perceived
by the public to be highly corrupt. Further, according to the NIS,
Ukrainian society to a certain degree can be characterised as having a
high tolerance for corrupt practices (Crane & Larrabee 2007, Trans-
parency International 2011).
5 The National Integrity System (NIS) assessment approach provides a framework which
anti-corruption organizations can use to analyse the extent and causes of corruption in a
spesific country as well as the effectiveness of national anti-corruption efforts
(http://www.transparency.org/policy_research/nis).
22 Liv Arntzen Løchen
6 International and national
6.1 Investors, owners and operators
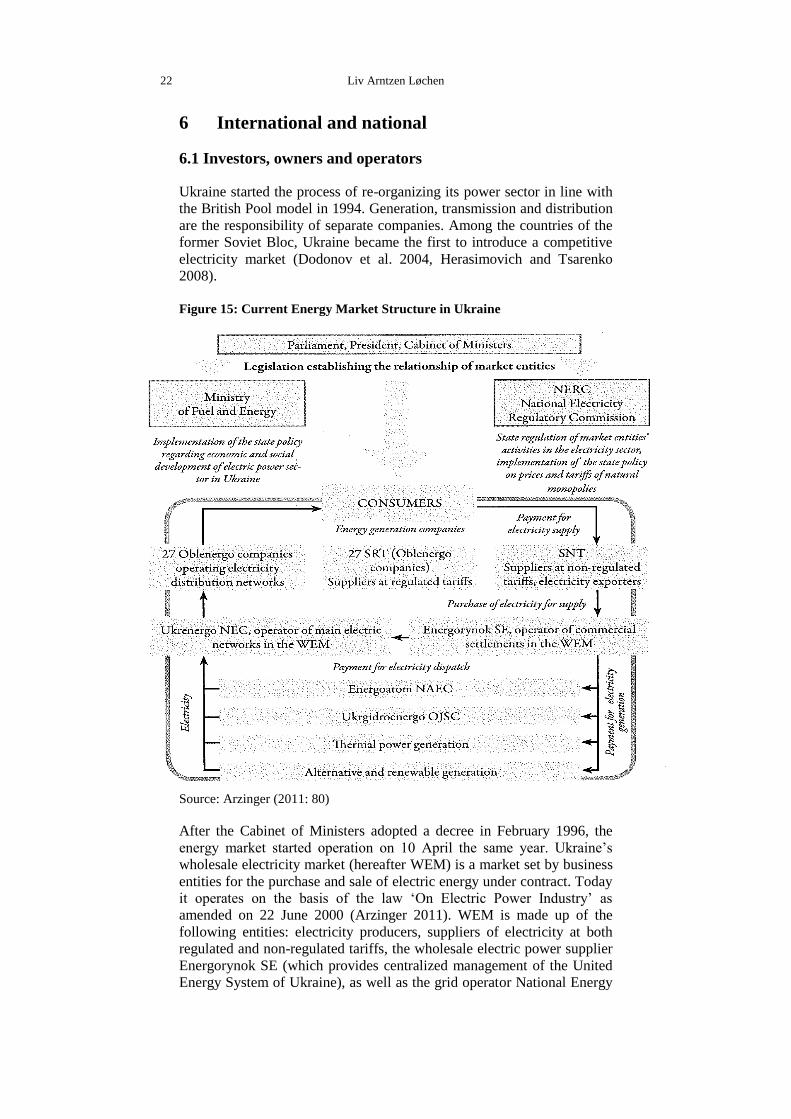
Ukraine started the process of re-organizing its power sector in line with
the British Pool model in 1994. Generation, transmission and distribution
are the responsibility of separate companies. Among the countries of the
former Soviet Bloc, Ukraine became the first to introduce a competitive
electricity market (Dodonov et al. 2004, Herasimovich and Tsarenko
2008).
Figure 15: Current Energy Market Structure in Ukraine
Source: Arzinger (2011: 80)
After the Cabinet of Ministers adopted a decree in February 1996, the
energy market started operation on 10 April the same year. Ukraine’s
wholesale electricity market (hereafter WEM) is a market set by business
entities for the purchase and sale of electric energy under contract. Today
it operates on the basis of the law ‘On Electric Power Industry’ as
amended on 22 June 2000 (Arzinger 2011). WEM is made up of the
following entities: electricity producers, suppliers of electricity at both
regulated and non-regulated tariffs, the wholesale electric power supplier
Energorynok SE (which provides centralized management of the United
Energy System of Ukraine), as well as the grid operator National Energy

Small hydro in Ukraine: to invest or not to invest? 23
Company Ukrenergo. Ukraine’s WEM operates according to the Single
Buyer Model, as shown in Figure 15.
All these entities are to be licensed by National Electricity Regulatory
Commission (NERC) in order to carry out their activities. According to
the law ‘On Electric Power Industry’, the authority for state regulation of
activities in the electricity industry is to be handled by NERC (Arzinger
2011).
The state company Energorynok acts as operator within the WEM. All
electricityproduced is to be sold to Energorynok, which in turn sells the
energy to the 27 distribution companies (oblenergos) and to the
independent suppliers. Energy suppliers are of two kinds: suppliers
operating with regulated (fixed) rates and those operating with at non-
regulated (free) tariffs. Tariffs for electricity supplies with regulated
tariffs are set by NERC, whereas tariffs for electricity supplies operating
with non-regulated tariffs are set in agreement between suppliers and
consumers. The so-called oblenergos are represented in the WEM
according to the number of regions (25 regional and two municipal). The
oblenergos in turn sell the electricity to the end- consumers according to
regulated tariffs (Herasimovich and Tsarenko 2008). As explained by
Arzinger (2011: 81) ‘Physically, the electricity produced by generating
companies gets to the consumer through the main and distribution electric
networks based on agreements on the transfer of electricity between the
relevant WEM entities’.
With the introduction of Green Tariff system, interest in developing
renewable energy projects in Ukraine has increased. More and more
actors – both Ukrainian and foreign investors – are looking around for
good locations.
6.2 Technology suppliers
Ukraine has the experience and technology for large hydro, but not for
small-scale hydro production. An investor starting up with small hydro
production is advised to import the necessary equipment, as it might
prove more expensive to get Ukrainian’s large- hydro technology
suppliers to produce single items for small hydro than to obtain it from
abroad (interviews Kiev, September 2011).
An additional barrier is that it is required that from 2012, 30% of the
specific weight of raw and other materials, key assets, works and services
must be of Ukrainian origin. From 2013 this will increased to 50%.
Precisely because Ukraine lacks experience in producing the equipment
needed for small hydro, the recuirement for such a high percentage of
domestic equipment can become problematic and was by several
interviewees seen as a potential barrier to foreign investment. Others,
however, said that since this included manual labour and services,
reaching these targets should be possible (interviews Kiev, September
2011).

24 Liv Arntzen Løchen
7 Future prospects
Production capacities in the electricity sector in Ukraine are outdated, and
as much as 95 % of existing power plants have reached the end of their
normal life cycle (Herasimovich and Tsarenko 2008). Such a situation
poses a challenge for future electricity supplies, but also clearly shows
the need for new investment. A country with such vast renewables
potential as Ukraine, and where more than 60 % of communal and
housing services receive energy in the form of gas, offers great
opportunities for investors in the field of renewable energy (IMEPOWER
Consulting 2010).
According to Winkler (2009), the renewed interest in small hydro in
Ukraine can be explained by the spreading energy shortage as well as the
ricing prices of energy production and transport. Since power production
from small hydro plants can take place close to settlements or industrial
installations, it may prove more profitable than power production from
larger plants with longer distribution lines. Further, small hydro plants
cost less for construction and maintenance than do large- scale plants.
According to Winkler (2009) investment in a small hydro plant can be
repaid within 5- to 8 years. This type of energy production will not
require extensive prior investigation and can be operable in a short time.
The introduction of the Green Tariffs system made Ukraine overnight a
far more attractive and lucrative place for investors in the renewable
energy sector. However, with regard to this tariff system, the important
question is predictability and stability. Can this policy be expected to
remain stable for 10–15 years –or will new tariffs be discontinued once
influential actors have managed to secure the tariffs for their
investments? On the one hand interviewees argued that it is written in the
law that the system will continue until 2030, so that stability and
predictability was ensured. It was further noted that the Green Tariff
system is not a one man show, but is grounded in a larger consensus
within the Ukrainian political system. Others, however, argued that in the
case of Ukraine anything is possible, and that changes of government can
entail changes in rules and regulations.
Interviewees noted that one way to get around potential problems, or at
least reduce the obstacles, is to get a trusted local partner. Good local
connection can speed up the process as well as handling practical issues
that can be difficult for foreign investors. Moreover, this can mean doing
business with an influential local partner who can sort out corruption-
related problems and speed up the process, but who can also take over the
assets.
Small hydro in Ukraine: to invest or not to invest? 25
8 Recommendation for national policies
With the great incentives and opportunities within the renewable sector in
general, and within small hydro in particular, Ukrainian politicians should
focus on minimizing the challenges and obstacles facing foreign investors
seeking to do business in Ukraine. One way to attract foreign businesses
and foreign direct investment is to improve the country’s reputation and
ratings with regard to the business climate. The Orange Revolution was
by many seen as the beginning of a new transformation in the social,
economic and political life of Ukraine. During such times of major
upheaval and change, corruption and lack of transparency and integrity
can to some extent be tolerated and even nurtured in order to get
necessary things accomplished quickly under such uncertain conditions.
However, this makes it even more important to counteract quickly the
distortions to the social, economic and political fabric of the country to
avert permanent damage and a deceleration of development objectives.
The Yushchenko government announced its willingness to fight
corruption and its pledge to work toward European Union accession.
These are positive signals for potential investors, signals that need to be
translated into policies that can yield visible results (Blue Ribbon
Analytical and Advisory Centre 2009).
President Viktor Yanukovich has confirmed his predecessor Viktor Yush-
chenko’s wish to establish a closer relationship with the EU. However,
with Yanukovich, relations with Russia have again become stronger.
How the Ukrainian president manages this balancing act will be import-
ant with regard to Ukraine’s relationship to the EU (PWC 2011). The ac-
cusations of a politically motivated trial against Julia Tymoshenko and a
corrupt court system have shown that Ukraine still has a long way to go
before it can be perceived as a stable and predictable country to do busi-
ness in, and have added fuel to the fire of Ukraine sceptics within the EU.
As for the current situation with the good economic incentives for
investors within the renewable energy sector, Ukrainian politicians will
need to concentrate on establishing a transparent and well-functioning
business environment. That means getting rid of the widespread
corruption practices and creating a more stable and predictable working
environment for international investors. It is important to show that the
new tariffs are stable and predictable, and not subject to change due to
political fluctuations.
To invest or not in small hydro in Ukraine? Potential investors are
confronted with great opportunities as well as risks and obstacles. The
country’s natural small- hydro potential makes Ukraine undoubtedly
attractive; moreover, there still are several brownfields and unexplored
areas remaining. On the other hand, investors must be aware of the severe
risks and challenges. If an investor can cope with a high level of risk and
can manage to find a good trusted local partner, investing in small hydro
in Ukraine may prove a lucrative proposition worth exploring. If not, it
might be better to considering making the investments elsewhere.

26 Liv Arntzen Løchen
Bibiliography
Arzinger (2009). ‘Public–Private Partnership in Ukraine’. Available at
http://arzinger.ua/file_collection/en/PPP_Book_2nd_edition_ENG.pdf
Arzinger (2011). ‘Energy Law Guide’. 2nd
edition. Available at
http://arzinger.ua/file_collection/de/book_Energy_engl_2011.pdf.
Bankwatch (2011). ‘Ukrainian transmission lines — a vehicle for dirty
electricity to the EU’. Available at
http://bankwatch.org/sites/default/files/briefing_EBRD_UAtransmissi
onlines-May2011.pdf.
Blue Ribbon Analytical and Advisory Centre (2009). ‘Policy
recommendations on economic and institutional reforms 2009’.
Available at http://www.undp.org.ua/files/en_96333PolRec_Eng.pdf.
Blue Ribbon Analytical and Advisory Centre (2010). ‘Demographic and
financial preconditions of the pension reform in Ukraine: forecast –
2050’. Available at: http://www.undp.org.ua/files-
/en_60467Demography_Pension_ENG.pdf
CIA Factbook (2011). ‘The world factbook’. Available at
https://www.cia.gov/library/publications/the-world-
factbook/geos/up.html.
Crane, Keith & F. Stephen Larrabee (2007). Encouraging Trade and
Foreign Direct Investment in Ukraine. Available at
http://www.rand.org/pubs/monographs/2007/RAND_MG673.pdf.
Dodonov, Boris, Petra Opitz and Wolfgang Pfaffenberger (2004). ‘How
much do electricity tariff increases in Ukraine hurt the poor?’, Energy
Policy, Vol. 32, 855–863.
Fankhauser, Samuel, Yulia Rodionova and Elisabetta Falcetti (2008).
‘Utility payments in Ukraine: Affordability, subsidies and arrears’,
Energy Policy, Vol. 36, 4168–4177.
Herasimovich, Viachaslau and Anna Tsarenko (2008). ‘Overview of
electricity market in Ukraine’. CASE updated report available at
http://www.case-ukraine.com.ua/u/publications-
/86c8a11a843e990d76330e55b66b712a.pdf.
Heritage Foundation and Wall Street Journal (2011). ‘2011 index of
economic freedom’. Available at http://www.heritage.org/index/
Imepower Consulting (2009). ‘Power sector overview’. Available at
http://www.imepower.com/index.php?lang_id=3&menu_id=17&pare
ntmenu_id=2.
Imepower Consulting (2010). ‘Ukraine sets out on green path’. Available
at http://www.imepower.com/files/5/article_eiee_oct2010.pdf.
Imepower Consulting (2011). General Overview of Renewable Energy in
Ukraine. Kiev, Ukraine.
Kovalenko , Elena (2007). ‘Overview of Ukrainian SHP’. Unpublished
paper.

Small hydro in Ukraine: to invest or not to invest? 27
Kuzio, Taras (2008). ‘Ukrainian politics, energy and corruption under
Kuchma and Yushchenko’. Available at http://www.taraskuzio.net-
/conferences2_files/Ukrainian_Politics_Energy.pdf.
Ministry of Fuel and Energy of Ukraine & National Academy of Sciences
of Ukraine (2006). The Energy Strategy of Ukraine for the Period till
2030. Kiev.
Mosaic Investment (2009). ‘Renewable energy in Ukraine: a new
legislation is coming’. Available at http://www.mosaic.kiev.ua-
/ru/files/RenewEnergy_legal_issues_210413.pdf.
NIKO (2011). ‘Macroeconomics. Foreign Direct Investment in Ukraine’.
Available at http://www.kua.niko.ua/wp-content/uploads/2010/07-
/Sector_Review_Macro-q-FDI_2011_full-v_ENG.pdf.
Park, Hi-chun (2011). ‘Towards cost-reflective energy pricing in
Ukraine’, International Association for Energy Economics, first
quarter, 15–18.
PWC (2011). ‘Doing business and investing in Ukraine’. Available at
http://www.pwc.com/ua/en/survey/assets/Doing_Business_in_Ukraine
_2011.pdf.
Raslavičius, Laurencas, Anna Grzybek and Valeriy Dubrovin (2011).
‘Bioenergy in Ukraine – Possibilities of rural development and
opportunities for local communities’, Energy Policy, Vol. 39, 3370–
3379.
Transparency International (2011). ‘Corruption perception Index 2009’.
Available at http://www.transparency.org/policy_research-
/surveys_indices/cpi/2009/cpi_2009_table.
Tsarenko, Anna (2007). ‘Overview of electricity market in Ukraine’.
CASE report available at: http://www.case-ukraine.com.ua/u-
/db/f6e3285141e96796656164c1b279de3c.pdf.
UNDP and Ukrainian Ministry of Economy (2005). ‘Ukraine. Poverty
alleviation’. Available at: http://www.undp.org.ua/files-
/en_24267mdgp.pdf.
Winkler, Igor (2009). ‘Small hydropower resources and prospects of
small hydropower electric plants in the near-border regions of
Ukraine’, Energy and Environmental Challenges to Security. NATO
Science for Peace and Security Series C: Environmental Security,
Part 6, 371–378.
World Bank and the International Finance Corporation (2011). Doing
Business 2011. Ukraine. Making a difference for entrepreneurs.
Washington DC: The International Bank for Reconstruction and
Development / The World Bank.

28 Liv Arntzen Løchen
List of figures and tables
Table 1: Indicators of Alternative and Renewable Energy Sources
(ARES) development by key development areas (Base Case Scenario)
Table 2: Connection rates to different utilities by region in 2004
Table 3: Green Tariffs in Ukraine
Table 4: Electricity tariffs for industrial and household consumers
Table 5: Debt dunamics in the power sector of Ukraine in the period
2000-2006
Figure 1: Overview of industry structure
Figure 2: Hydropower potential of small rivers of Ukraine
Figure 3: Location of Ukrainian small hydropower plants currently in
operation
Figure 4: Location of decommissioned small hydropower plants
Figure 5: Main macro indicators of Ukraine
Figure 6: GDP per capita (2006) for Ukraine compared to other former
Soviet Republics
Figure 7: Forecast of GDP Growth Rates, UAH billion (price base of
2005)
Figure 8: Installed capacity of power plants
Figure 9: Forecast of the development of the electric power generation
(billion kWh)
Figure 10: Transmissions lines Ukraine
Figure 11: Electric power produced and losses in its transmission by
Power Networks of Ukraine (billion kW/h)
Figure 12: Ukrainian transmission line projects already funded or planned
funded with EU public finances.
Figure 13: RES project development in Ukraine
Figure 14: Ease of doing business in Ukraine compared to a selection of
other countries
Figure 15: Current Energy Market Structure in Ukraine

The Fridtjof Nansen Institute is a non-profit, independent
research institute focusing on international environmental,
energy, and resource management. The institute has a
multi-disciplinary approach, with main emphasis on politi-
cal science, economics, and international law. It collabor-
ates extensively with other research institutions in Norway
and abroad.
FRIDTJOF NANSENS INSTITUTT
FRIDTJOF NANSEN INSTITUTE
Fridtjof Nansens vei 17, P.O. Box 326, NO-1326 Lysaker, Norway
Phone: (47) 67 11 19 00 – Fax: (47) 67 11 19 10 – E-mail: [email protected]
Website: www.fni.no