Small Cap Growth Fund Annual Report
52
Putnam Small Cap Growth Fund FUND SYMBOL CLASS A PNSAX Annual report 6 | 30 | 21 Growth funds look for stocks of companies that have the potential to grow over time.
Transcript of Small Cap Growth Fund Annual Report
Putnam Small Cap Growth Fund
FUND SYMBOL CLASS A
PNSAX
Annual report 6 | 30 | 21
Growth funds look for stocks of companies that have the potential to grow over time.

Putnam Small Cap Growth FundAnnual report 6 | 30 | 21
Message from the Trustees 1
Interview with your fund’s portfolio manager 3
Your fund’s performance 7
Your fund’s expenses 9
Consider these risks before investing 11
Terms and definitions 12
Other information for shareholders 14
Important notice regarding Putnam’s privacy policy 15
Trustee approval of management contract 16
Audited financial statements 21
Report of Independent Registered Public Accounting Firm 22
Federal tax information 44
About the Trustees 45
Officers 47

August 6, 2021
Dear Fellow Shareholder:
The U.S. economy is much improved from a year ago, or even six months ago. Gross domestic product is growing at a pre-pandemic pace. Stock prices are high and interest rates are low. More and more workers are finding jobs, with millions still open. At the same time, vaccinations in many areas have not yet reached enough people to stop the spread of Covid-19. U.S. and global infection rates have recently risen.
While it is too soon to declare the pandemic over, it is worth taking stock of the economy’s transition. Some changes accelerated by the pandemic could be lasting. Dynamic, well-managed companies have adapted to seize new, more sustainable growth opportunities.
An active investment philosophy is well suited to this time. Putnam’s research teams are analyzing the fundamentals of what has stayed the same and what has changed to uncover valuable investment insights or potential risks.
Thank you for investing with Putnam.
Respectfully yours,
Robert L. ReynoldsPresident and Chief Executive OfficerPutnam Investments
Kenneth R. LeiblerChair, Board of Trustees
Message from the Trustees
Performance history as of 6/30/21
Annualized total return (%) comparison
LIFE OF FUND(since 12/31/97)
10 YEARS 5 YEARS 3 YEARS 1 YEAR
12.558.20 9.98
14.89 13.52 13.65
23.8018.76 20.23
22.88
15.9418.70
44.93
51.36 53.11
The fund — class A sharesbefore sales chargePutnam Small Cap Growth Fund (PNSAX)
Fund’s benchmarkRussell 2000 Growth Index
Fund’s Lipper peer group averageSmall-Cap Growth Funds
Current performance may be lower or higher than the quoted past performance, which cannot guarantee future results. Share price, principal value, and return will fluctuate, and you may have a gain or a loss when you sell your shares. Performance of class A shares assumes reinvestment of distributions and does not account for taxes. Fund returns in the bar chart do not reflect a sales charge of 5.75%; had they, returns would have been lower. See below and pages 7–9 for additional performance information. For a portion of the periods, the fund had expense limitations, without which returns would have been lower. To obtain the most recent month-end performance, visit putnam.com.
Lipper peer group average provided by Lipper, a Refinitiv company.
Recent broad market index and fund performance
51.36%
44.93%
40.79%
0.09%
–0.33%
Fund’s benchmark (Russell 2000 Growth Index)
Putnam Small Cap Growth Fund (class A shares before sales charge)
U.S. stocks (S&P 500 Index)
Cash (ICE BofA U.S. 3-Month Treasury Bill Index)
U.S. bonds (Bloomberg Barclays U.S. Aggregate Bond Index)
This comparison shows your fund’s performance in the context of broad market indexes for the 12 months ended 6/30/21. See above and pages 7–9 for additional fund performance information. Index descriptions can be found on pages 12–13.
All Bloomberg Barclays indices provided by Bloomberg Index Services Limited.
2 Small Cap Growth Fund

Interview with your fund’s portfolio manager
William J. Monroe, CFAPortfolio Manager
Bill has an M.B.A. from the University of Chicago Booth School of Business and a B.S. in Finance from Miami University. He joined Putnam in 2012 and has been in the investment industry since 1996.
Bill, how was the investing environment during the reporting period?Global financial markets ended the period mostly higher. Key equity market indexes advanced, driven by widespread Covid-19 vaccinations, fiscal stimulus, low interest rates, and signs of economic recovery. The Russell 2000 Index, a measure of small-cap stock performance, rose 62.03%. This was consider-ably higher than the still remarkable 40.79% return for the S&P 500 Index, a broad measure of stock performance. The Russell 2000 Value Index and the Russell 2000 Growth Index [the fund’s benchmark] notched gains of 73.28% and 51.36%, respectively.
Still, the equity market continued to exhibit volatility over the last few months, and we saw turbulence within some sectors and industries. This should be expected as the markets are grappling with unfamiliar territory. Investors are weighing the impact of reopening economies after a global shutdown, continued efforts worldwide to combat Covid-19, and a variety of government stimulus measures. Also, we are now seeing some index returns up more than 100% from their 2020 lows, which is a rarity in investment history. On the macroeconomic
Bill Monroe discusses the investing environment and fund performance for the 12-month period ended June 30, 2021, as well as his outlook for small-cap stocks.
Interview with your fund’s portfolio manager
Performance history as of 6/30/21
Annualized total return (%) comparison
LIFE OF FUND(since 12/31/97)
10 YEARS 5 YEARS 3 YEARS 1 YEAR
12.558.20 9.98
14.89 13.52 13.65
23.8018.76 20.23
22.88
15.9418.70
44.93
51.36 53.11
The fund — class A sharesbefore sales chargePutnam Small Cap Growth Fund (PNSAX)
Fund’s benchmarkRussell 2000 Growth Index
Fund’s Lipper peer group averageSmall-Cap Growth Funds
Current performance may be lower or higher than the quoted past performance, which cannot guarantee future results. Share price, principal value, and return will fluctuate, and you may have a gain or a loss when you sell your shares. Performance of class A shares assumes reinvestment of distributions and does not account for taxes. Fund returns in the bar chart do not reflect a sales charge of 5.75%; had they, returns would have been lower. See below and pages 7–9 for additional performance information. For a portion of the periods, the fund had expense limitations, without which returns would have been lower. To obtain the most recent month-end performance, visit putnam.com.
Lipper peer group average provided by Lipper, a Refinitiv company.
Recent broad market index and fund performance
51.36%
44.93%
40.79%
0.09%
–0.33%
Fund’s benchmark (Russell 2000 Growth Index)
Putnam Small Cap Growth Fund (class A shares before sales charge)
U.S. stocks (S&P 500 Index)
Cash (ICE BofA U.S. 3-Month Treasury Bill Index)
U.S. bonds (Bloomberg Barclays U.S. Aggregate Bond Index)
This comparison shows your fund’s performance in the context of broad market indexes for the 12 months ended 6/30/21. See above and pages 7–9 for additional fund performance information. Index descriptions can be found on pages 12–13.
All Bloomberg Barclays indices provided by Bloomberg Index Services Limited.
Small Cap Growth Fund 3

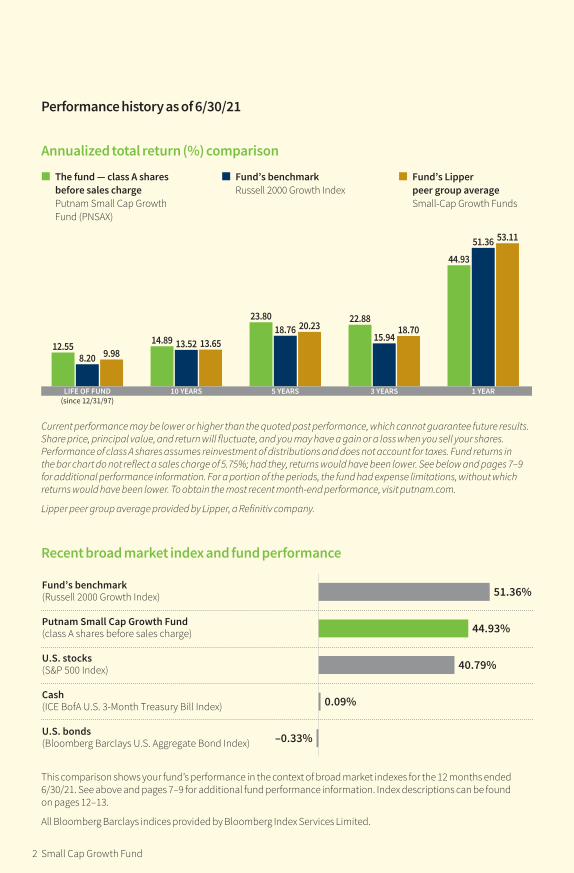
Top 10 holdingsHOLDING (PERCENTAGE OF FUND’S NET ASSETS)
INDUSTRY
OVER/UNDERWEIGHT VS. BENCHMARK
InMode, Ltd. (Israel) (3.4%) Health-care equipment and supplies
TFI International, Inc. (Canada) (2.5%) Road and rail
Boot Barn Holdings, Inc. (2.4%) Specialty retail
Medpace Holdings, Inc. (2.2%) Life sciences tools and servicesNova Measuring Instruments, Ltd. (Israel) (2.0%)
Semiconductors and semiconductor equipment
Hamilton Lane, Inc. (2.0%) Capital markets
Five Below, Inc. (2.0%) Specialty retail
R1 RCM, Inc. (2.0%) Health-care providers and services
Open Lending Corp. (2.0%) Capital marketsColliers International Group, Inc. (Canada) (2.0%)
Real estate management and development 2.0%
3.4%
2.5%
2.2%
1.9%
1.8%
2.0%
1.8%
1.7%
-4.000000 -1.714293 0.571413 2.857120
2.0%
This table shows the fund’s top 10 holdings by percentage of the fund’s net assets as of 6/30/21. Short-term investments and derivatives, if any, are excluded. Holdings may vary over time.
Sector allocations
Health care 27.6%
Information technology 22.1
Industrials 16.2
Consumer discretionary 15.3
Financials 6.7
Communication services 3.9
Materials 2.5
Real estate 2.0
Consumer staples 1.3
Energy 0.7
Cash and net other assets 1.7
Allocations are shown as a percentage of the fund’s net assets as of 6/30/21. Cash and net other assets, if any, represent the market value weights of cash, derivatives, short-term securities, and other unclassified assets in the portfolio. Summary information may differ from the portfolio schedule included in the financial statements due to the inclusion of derivative securities, any interest accruals, the exclusion of as-of trades, if any, the use of different classifications of securities for presentation purposes, and rounding. Holdings and allocations may vary over time.
4 Small Cap Growth Fund

side, we are seeing year-over-year measures of inflation and growth that are skewed and difficult to interpret using historical norms.
How did the fund perform during the 12-month period?The fund returned 44.93% during the 12-month period, underperforming its benchmark, the Russell 2000 Growth Index. The fund underper-formed the average return of 53.11% for funds in its Lipper peer group, Small-Cap Growth Funds.
The underperformance during the trailing 12 months was largely due to stock selection, as sector-weighting decisions largely balanced themselves out at the portfolio level. Relative to the fund’s benchmark, stock selection within the healthcare sector was a strong contrib-utor to performance during the period, but was offset by weaker performance among several names in the industrials and consumer discretionary areas of the portfolio. The indus-trials and consumer discretionary sectors reflected many of the “reopening” trades that dominated the market after vaccines were largely approved.
What were some holdings that contributed to performance during the reporting period?The top two contributors in the period were InMode and Boot Barn Holdings. InMode, an Israel-based maker of medical devices for largely aesthetic procedures, performed strongly during the period as management highlighted very strong sales and margin perfor-mance despite the pandemic’s effects around the globe.
Boot Barn Holdings, a California-based retailer of work boots, western footwear, and apparel, also contributed to fund performance. The company’s mix of both essential items and more discretionary goods that are difficult to purchase online enabled the company to continue to grow through a very difficult year for most retail concepts. President and CEO Jim Conroy said in a June interview on CNBC that the retailer has yet to experience the full
benefits of the U.S. economy reopening from pandemic-era disruptions. He expects events such as rodeos and state fairs to lift Boot Barn’s sales in the coming months.
What were some holdings that detracted from performance during the reporting period?The fund’s top detractor for the period was Quidel, a manufacturer of diagnostic health-care products. The stock had been a long-term holding in the fund due to its research capa-bilities and point-of-care testing for common illnesses like seasonal influenza. During the early days of Covid-19, Quidel performed very strongly, as it was able to pivot from testing for seasonal influenza to Covid-19 testing. As the year went on, competition from other testing companies and the eventual approval of vaccines greatly reduced demand for Quidel’s Covid-testing capabilities and caused the stock to underperform. We eventually sold the fund’s position in Quidel.
Another detractor for the period was Massachusetts-based Everbridge. The software provider of mass notification and location-based services underperformed our expectations during this period, after many years of solid performance. We sold out of this long-time holding due to its valuation and a slower increase in its profitability metrics than we were anticipating.
What is your outlook for the coming months?We remain optimistic about stock performance after the challenging markets of 2020. Central banks, including the Federal Reserve, remain vigilant and largely supportive of the financial markets, in our view. Investor worries and recent volatility have centered around inflation
We remain optimistic about stock performance after the challenging markets of 2020. Bill Monroe
Small Cap Growth Fund 5

and the Fed signaling it may raise interest rates sooner than anticipated due to the rebounding U.S. economy. These worries subsided slightly after Fed Chair Jerome Powell said that recent increases in inflation will prove to be largely transitory. We believe large increases in inflation measures, as those seen in early 2021, are likely to be somewhat temporary and to recede in later 2021 and early 2022. However, we are watching for drivers, such as wage pressure, that may result in higher long-term inflation.
We believe it is important to focus on what drives stock prices over longer time periods, and then apply that to our active, fundamental research of individual companies. In our portfolio, we seek to target companies that we believe can grow profits at high rates for long periods, and we seek to pay a reasonable price for that growth. For the remainder of calendar 2021, we believe that many companies are likely to experience considerably higher earnings growth rates coming out of the pandemic.
However, we believe the market is unlikely to reward earnings growth that is based purely on a post-pandemic rebound. Rather, in our view, companies that offer sustainable growth potential through market cycles continue to offer the greatest long-term potential.
Thank you, Bill, for your time and insights today.
The views expressed in this report are exclusively those of Putnam Management and are subject to change. They are not meant as investment advice.
Please note that the holdings discussed in this report may not have been held by the fund for the entire period. Portfolio composition is subject to review in accordance with the fund’s investment strategy and may vary in the future. Current and future portfolio holdings are subject to risk. Statements in the Q&A concerning the fund’s performance or portfolio composition relative to those of the fund’s Lipper peer group may reference information produced by Lipper Inc. or through a third party.
Comparison of top sector shiftsSECTOR 12/31/20 6/30/21 CHANGE
Health care 35.4% 27.6%
Consumer discretionary 13.3% 15.3%
Information technology 20.5% 22.1%
Materials 1.0% 2.5%
Consumer staples 0.0% 1.3%
-8 -4 0 4 8
bar height 1p1.5
space between bars 0p11.5
max. width of chart: 11p
1.5%
1.3%
1.6%
2.0%
–7.8%
Rule: 30% black. 4 pts above top bar / 4 pts below bottom bar.
This chart shows the fund’s largest allocation shifts, by percentage, over the past six months. Allocations are shown as a percentage of the fund’s net assets. Current period summary information may differ from the portfolio schedule included in the financial statements due to the inclusion of derivative securities, any interest accruals, the exclusion of as-of trades, if any, the use of different classifications of securities for presentation purposes, and rounding. Holdings and allocations may vary over time.
6 Small Cap Growth Fund

Your fund’s performanceThis section shows your fund’s performance, price, and distribution information for periods ended June 30, 2021, the end of its most recent fiscal year. In accordance with regulatory requirements for mutual funds, we also include expense information taken from the fund’s current prospectus. Performance should always be considered in light of a fund’s investment strategy. Data represent past performance. Past performance does not guarantee future results. More recent returns may be less or more than those shown. Investment return and principal value will fluctuate, and you may have a gain or a loss when you sell your shares. Performance information does not reflect any deduction for taxes a shareholder may owe on fund distributions or on the redemption of fund shares. For the most recent month-end performance, please visit the Individual Investors section at putnam.com or call Putnam at 1-800-225-1581. Class R, R6, and Y shares are not available to all investors. See the Terms and definitions section in this report for definitions of the share classes offered by your fund.
Fund performance Total return for periods ended 6/30/21
Annual average
(life of fund) 10 yearsAnnual average 5 years
Annual average 3 years
Annual average 1 year
Class A (12/31/97)
Before sales charge 12.55% 300.80% 14.89% 190.78% 23.80% 85.53% 22.88% 44.93%
After sales charge 12.26 277.75 14.21 174.06 22.34 74.86 20.48 36.60
Class B (3/18/02)
Before CDSC 12.26 278.49 14.24 180.05 22.87 81.42 21.96 43.86
After CDSC 12.26 278.49 14.24 178.05 22.69 78.42 21.29 38.86
Class C (3/18/02)
Before CDSC 12.26 277.35 14.20 180.06 22.87 81.43 21.97 43.84
After CDSC 12.26 277.35 14.20 180.06 22.87 81.43 21.97 42.84
Class R (12/1/03)
Net asset value 12.27 290.82 14.60 187.20 23.49 84.14 22.57 44.56
Class R6 (6/29/15)
Net asset value 12.80 314.68 15.28 196.85 24.31 87.75 23.37 45.49
Class Y (11/3/03)
Net asset value 12.76 310.85 15.18 194.53 24.12 86.96 23.19 45.29
Current performance may be lower or higher than the quoted past performance, which cannot guarantee future results. After-sales-charge returns for class A shares reflect the deduction of the maximum 5.75% sales charge levied at the time of purchase. Class B share returns after contingent deferred sales charge (CDSC) reflect the applicable CDSC, which is 5% in the first year, declining over time to 1% in the sixth year, and is eliminated thereafter. Class C share returns after CDSC reflect a 1% CDSC for the first year that is eliminated thereafter. Class R, R6, and Y shares have no initial sales charge or CDSC. Performance for class B, C, R, and Y shares before their inception is derived from the historical performance of class A shares, adjusted for the applicable sales charge (or CDSC) and the higher operating expenses for such shares, except for class Y shares, for which 12b-1 fees are not applicable. Performance for class R6 shares prior to their inception is derived from the historical performance of class Y shares and has not been adjusted for the lower investor servicing fees applicable to class R6 shares; had it, returns would have been higher.
For a portion of the periods, the fund had expense limitations, without which returns would have been lower.
The fund has had performance fee adjustments that may have had a positive or negative impact on returns.
Class B and C share performance reflects conversion to class A shares after eight years.
Small Cap Growth Fund 7
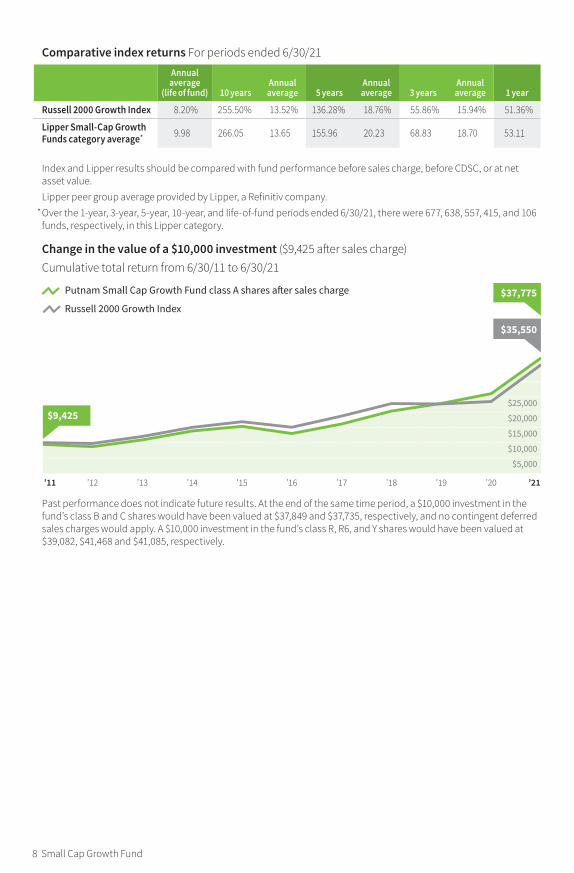
Comparative index returns For periods ended 6/30/21
Annual average
(life of fund) 10 yearsAnnual average 5 years
Annual average 3 years
Annual average 1 year
Russell 2000 Growth Index 8.20% 255.50% 13.52% 136.28% 18.76% 55.86% 15.94% 51.36%
Lipper Small-Cap Growth Funds category average* 9.98 266.05 13.65 155.96 20.23 68.83 18.70 53.11
Index and Lipper results should be compared with fund performance before sales charge, before CDSC, or at net asset value.
Lipper peer group average provided by Lipper, a Refinitiv company. * Over the 1-year, 3-year, 5-year, 10-year, and life-of-fund periods ended 6/30/21, there were 677, 638, 557, 415, and 106
funds, respectively, in this Lipper category.
Change in the value of a $10,000 investment ($9,425 after sales charge)Cumulative total return from 6/30/11 to 6/30/21
Past performance does not indicate future results. At the end of the same time period, a $10,000 investment in the fund’s class B and C shares would have been valued at $37,849 and $37,735, respectively, and no contingent deferred sales charges would apply. A $10,000 investment in the fund’s class R, R6, and Y shares would have been valued at $39,082, $41,468 and $41,085, respectively.
$5,000
$10,000
$15,000
$20,000
$25,000
’11 ’12 ’13 ’14 ’15 ’16 ’17 ’18 ’19 ’20 ’21
Putnam Small Cap Growth Fund class A shares a�er sales charge
Russell 2000 Growth Index
$9,425
$37,775
$35,550
8 Small Cap Growth Fund

Fund price and distribution information For the 12-month period ended 6/30/21
Distributions Class A Class B Class C Class R Class R 6 Class Y
Number 1 1 1 1 1 1
Income — — — — — —
Capital gains
Long-term gains $2.430 $2.430 $2.430 $2.430 $2.430 $2.430
Short-term gains 0.910 0.910 0.910 0.910 0.910 0.910
Total $3.340 $3.340 $3.340 $3.340 $3.340 $3.340
Share value
Before sales
charge
After sales
charge
Net asset value
Net asset value
Net asset value
Net asset value
Net asset value
6/30/20 $53.07 $56.31 $45.85 $45.68 $50.89 $55.62 $55.27
6/30/21 73.13 77.59 62.19 61.94 69.79 77.13 76.51
The classification of distributions, if any, is an estimate. Before-sales-charge share value and current dividend rate for class A shares, if applicable, do not take into account any sales charge levied at the time of purchase. After-sales-charge share value, current dividend rate, and current 30-day SEC yield, if applicable, are calculated assuming that the maximum sales charge (5.75% for class A shares) was levied at the time of purchase. Final distribution information will appear on your year-end tax forms.
Your fund’s expensesAs a mutual fund investor, you pay ongoing expenses, such as management fees, distribution fees (12b-1 fees), and other expenses. Using the following information, you can estimate how these expenses affect your investment and compare them with the expenses of other funds. You may also pay one-time transaction expenses, including sales charges (loads) and redemption fees, which are not shown in this section and would have resulted in higher total expenses. For more information, see your fund’s prospectus or talk to your financial representative.
Expense ratiosClass A Class B Class C Class R Class R6 Class Y
Total annual operating expenses for the fiscal year ended 6/30/20 1.24% 1.99% 1.99% 1.49% 0.84% 0.99%
Annualized expense ratio for the six-month period ended 6/30/21*† 1.19% 1.94% 1.94% 1.44% 0.82% 0.94%
Fiscal year expense information in this table is taken from the most recent prospectus, is subject to change, and may differ from that shown for the annualized expense ratio and in the financial highlights of this report.
Expenses are shown as a percentage of average net assets. * Expense ratios for each class are for the fund’s most recent fiscal half year. As a result of this, ratios may differ from
expense ratios based on one-year data in the financial highlights. † Includes an increase of 0.11% from annualizing the performance fee adjustment for the six months ended 6/30/21.
Small Cap Growth Fund 9
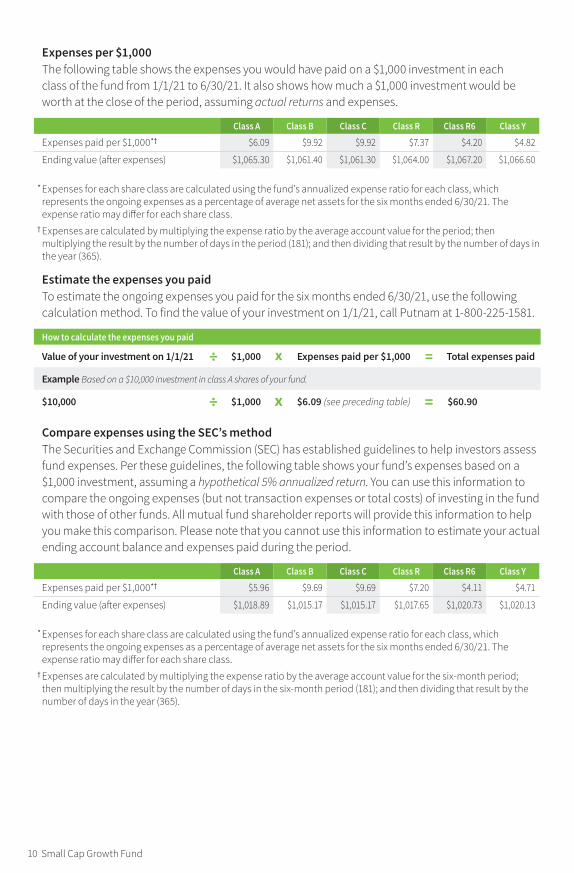
Expenses per $1,000The following table shows the expenses you would have paid on a $1,000 investment in each class of the fund from 1/1/21 to 6/30/21. It also shows how much a $1,000 investment would be worth at the close of the period, assuming actual returns and expenses.
Class A Class B Class C Class R Class R6 Class Y
Expenses paid per $1,000*† $6.09 $9.92 $9.92 $7.37 $4.20 $4.82
Ending value (after expenses) $1,065.30 $1,061.40 $1,061.30 $1,064.00 $1,067.20 $1,066.60
* Expenses for each share class are calculated using the fund’s annualized expense ratio for each class, which represents the ongoing expenses as a percentage of average net assets for the six months ended 6/30/21. The expense ratio may differ for each share class.
† Expenses are calculated by multiplying the expense ratio by the average account value for the period; then multiplying the result by the number of days in the period (181); and then dividing that result by the number of days in the year (365).
Estimate the expenses you paidTo estimate the ongoing expenses you paid for the six months ended 6/30/21, use the following calculation method. To find the value of your investment on 1/1/21, call Putnam at 1-800-225-1581.
How to calculate the expenses you paid
Value of your investment on 1/1/21 ÷ $1,000 x Expenses paid per $1,000 = Total expenses paid
Example Based on a $10,000 investment in class A shares of your fund.
$10,000 ÷ $1,000 x $6.09 (see preceding table) = $60.90
Compare expenses using the SEC’s methodThe Securities and Exchange Commission (SEC) has established guidelines to help investors assess fund expenses. Per these guidelines, the following table shows your fund’s expenses based on a $1,000 investment, assuming a hypothetical 5% annualized return. You can use this information to compare the ongoing expenses (but not transaction expenses or total costs) of investing in the fund with those of other funds. All mutual fund shareholder reports will provide this information to help you make this comparison. Please note that you cannot use this information to estimate your actual ending account balance and expenses paid during the period.
Class A Class B Class C Class R Class R6 Class Y
Expenses paid per $1,000*† $5.96 $9.69 $9.69 $7.20 $4.11 $4.71
Ending value (after expenses) $1,018.89 $1,015.17 $1,015.17 $1,017.65 $1,020.73 $1,020.13
* Expenses for each share class are calculated using the fund’s annualized expense ratio for each class, which represents the ongoing expenses as a percentage of average net assets for the six months ended 6/30/21. The expense ratio may differ for each share class.
† Expenses are calculated by multiplying the expense ratio by the average account value for the six-month period; then multiplying the result by the number of days in the six-month period (181); and then dividing that result by the number of days in the year (365).
10 Small Cap Growth Fund
Consider these risks before investingInvestments in small and/or midsize companies increase the risk of greater price fluctuations. Growth stocks may be more susceptible to earnings disappointments, and the market may not favor growth-style investing. The value of investments in the fund’s portfolio may fall or fail to rise over extended periods of time for a variety of reasons, including general economic, political, or financial market conditions; investor sentiment and market perceptions; government actions; geopolitical events or changes; and factors related to a specific issuer, geography, industry, or sector. These and other factors may lead to increased volatility and reduced liquidity in the fund’s portfolio holdings. These risks are generally greater for small and midsize companies. From time to time, the fund may invest a significant portion of its assets in companies in one or more related industries or sectors, which would make the fund more vulnerable to adverse developments affecting those industries or sectors. Our investment techniques, analyses, and judgments may not produce the outcome we intend. The investments we select for the fund may not perform as well as other securities that we do not select for the fund. We, or the fund’s other service providers, may experience disruptions or operating errors that could have a negative effect on the fund. You can lose money by investing in the fund.
Small Cap Growth Fund 11

Terms and definitions
Important termsTotal return shows how the value of the fund’s shares changed over time, assuming you held the shares through the entire period and reinvested all distributions in the fund.
Before sales charge, or net asset value, is the price, or value, of one share of a mutual fund, without a sales charge. Before-sales-charge figures fluctuate with market conditions, and are calculated by dividing the net assets of each class of shares by the number of outstanding shares in the class.
After sales charge is the price of a mutual fund share plus the maximum sales charge levied at the time of purchase. After-sales-charge perfor-mance figures shown here assume the 5.75% maximum sales charge for class A shares.
Contingent deferred sales charge (CDSC) is generally a charge applied at the time of the redemption of class B or C shares and assumes redemption at the end of the period. Your fund’s class B CDSC declines over time from a 5% maximum during the first year to 1% during the sixth year. After the sixth year, the CDSC no longer applies. The CDSC for class C shares is 1% for one year after purchase.
Share classesClass A shares are generally subject to an initial sales charge and no CDSC (except on certain redemptions of shares bought without an initial sales charge).
Class B shares are closed to new investments and are only available by exchange from another Putnam fund or through dividend and/or capital gains reinvestment. They are not subject to an initial sales charge and may be subject to a CDSC.
Class C shares are not subject to an initial sales charge and are subject to a CDSC only if the shares are redeemed during the first year.
Class R shares are not subject to an initial sales charge or CDSC and are only available to employer-sponsored retirement plans.
Class R6 shares are not subject to an initial sales charge or CDSC and carry no 12b-1 fee. They are generally only available to employer-sponsored retirement plans, corporate and institutional clients, and clients in other approved programs.
Class Y shares are not subject to an initial sales charge or CDSC and carry no 12b-1 fee. They are generally only available to corporate and institutional clients and clients in other approved programs.
Comparative indexesBloomberg Barclays U.S. Aggregate Bond Index is an unmanaged index of U.S. investment-grade fixed-income securities.
ICE BofA (Intercontinental Exchange Bank of America) U.S. 3-Month Treasury Bill Index is an unmanaged index that seeks to measure the performance of U.S. Treasury bills available in the marketplace.
Russell 2000 Index is an unmanaged index comprised of approximately 2,000 of the smallest companies in the Russell 3000 Index as measured by their market capitalization.
Russell 2000 Growth Index is an unmanaged index of those companies in the small-cap Russell 2000 Index chosen for their growth orientation.
Russell 2000 Value Index is an unmanaged index of those companies in the small-cap Russell 2000 Index chosen for their value orientation.
S&P 500 Index is an unmanaged index of common stock performance.Indexes assume reinvestment of all distributions and do not account for fees. Securities and performance of a fund and an index will differ. You cannot invest directly in an index.
12 Small Cap Growth Fund

BLOOMBERG® is a trademark and service mark of Bloomberg Finance L.P. and its affiliates (collectively “Bloomberg”). BARCLAYS® is a trademark and service mark of Barclays Bank Plc (collectively with its affili-ates, “Barclays”), used under license. Bloomberg or Bloomberg’s licensors, including Barclays, own all proprietary rights in the Bloomberg Barclays Indices. Neither Bloomberg nor Barclays approves or endorses this material, or guarantees the accuracy or complete-ness of any information herein, or makes any warranty, express or limited, as to the results to be obtained therefrom, and to the maximum extent allowed by law, neither shall have any liability or responsibility for injury or damages arising in connection therewith.
ICE Data Indices, LLC (“ICE BofA”), used with permission. ICE BofA permits use of the ICE BofA indices and related data on an “as is” basis; makes no warranties regarding same; does not guarantee the suitability, quality, accu-racy, timeliness, and/or completeness of the ICE BofA indices or any data included in, related to, or derived therefrom; assumes no liability in connection with the
use of the foregoing; and does not sponsor, endorse, or recommend Putnam Investments, or any of its products or services.
Frank Russell Company is the source and owner of the trademarks, service marks, and copyrights related to the Russell Indexes. Russell® is a trademark of Frank Russell Company.
Lipper, a Refinitiv company, is a third-party industry-ranking entity that ranks mutual funds. Its rankings do not reflect sales charges. Lipper rankings are based on total return at net asset value relative to other funds that have similar current investment styles or objectives as determined by Lipper. Lipper may change a fund’s category assignment at its discretion. Lipper category averages reflect performance trends for funds within a category.
Small Cap Growth Fund 13

Other information for shareholders
Proxy votingPutnam is committed to managing our mutual funds in the best interests of our shareholders. The Putnam funds’ proxy voting guidelines and procedures, as well as information regarding how your fund voted proxies relating to portfolio securities during the 12-month period ended June 30, 2020, are available in the Individual Investors section of putnam.com and on the Securities and Exchange Commis-sion (SEC) website, www.sec.gov. If you have questions about finding forms on the SEC’s website, you may call the SEC at 1-800-SEC-0330. You may also obtain the Putnam funds’ proxy voting guidelines and procedures at no charge by calling Putnam’s Shareholder Services at 1-800-225-1581.
Fund portfolio holdingsThe fund will file a complete schedule of its portfolio holdings with the SEC for the first and third quarters of each fiscal year on Form N-PORT within 60 days of the end of such fiscal quarter. Shareholders may obtain the fund’s Form N-PORT on the SEC’s website at www.sec.gov.
Prior to its use of Form N-PORT, the fund filed its complete schedule of its portfolio holdings with the SEC on Form N-Q, which is available online at www.sec.gov.
Trustee and employee fund ownershipPutnam employees and members of the Board of Trustees place their faith, confidence, and, most importantly, investment dollars in Putnam mutual funds. As of June 30, 2021,
Putnam employees had approximately $582,000,000 and the Trustees had approxi-mately $83,000,000 invested in Putnam mutual funds. These amounts include investments by the Trustees’ and employees’ immediate family members as well as investments through retirement and deferred compensation plans.
Liquidity risk management programPutnam, as the administrator of the fund’s liquidity risk management program (appointed by the Board of Trustees), presented the most recent annual report on the program to the Trustees in April 2021. The report covered the structure of the program, including the program documents and related policies and procedures adopted to comply with Rule 22e-4 under the Investment Company Act of 1940, and reviewed the operation of the program from January 2020 through December 2020. The report included a description of the annual liquidity assessment of the fund that Putnam performed in November 2020. The report noted that there were no material compliance exceptions identified under Rule 22e-4 during the period. The report included a review of the governance of the program and the methodology for classification of the fund’s investments. The report also included a discussion of liquidity monitoring during the period, including during the market liquidity challenges caused by the Covid-19 pandemic, and the impact those challenges had on the liquidity of the fund’s investments. Putnam concluded that the program has been operating effectively and adequately to ensure compliance with Rule 22e-4.
14 Small Cap Growth Fund

Important notice regarding Putnam’s privacy policy
In order to conduct business with our shareholders, we must obtain certain personal information such as account holders’ names, addresses, Social Security numbers, and dates of birth. Using this information, we are able to maintain accurate records of accounts and transactions.
It is our policy to protect the confidentiality of our shareholder information, whether or not a shareholder currently owns shares of our funds. In particular, it is our policy not to sell information about you or your accounts to outside marketing firms. We have safeguards in place designed to prevent unauthorized access
to our computer systems and procedures to protect personal information from unauthorized use.
Under certain circumstances, we must share account information with outside vendors who provide services to us, such as mailings and proxy solicitations. In these cases, the service providers enter into confidentiality agreements with us, and we provide only the information necessary to process transactions and perform other services related to your account. Finally, it is our policy to share account information with your financial representative, if you’ve listed one on your Putnam account.
Small Cap Growth Fund 15

Trustee approval of management contract
Trustee approval of management contract
General conclusionsThe Board of Trustees of The Putnam Funds oversees the management of each fund and, as required by law, determines annually whether to approve the continuance of your fund’s management contract with Putnam Investment Management, LLC (“Putnam Management”) and the sub-management contract with respect to your fund between Putnam Management and its affiliate, Putnam Investments Limited (“PIL”). The Board, with the assistance of its Contract Commit-tee, requests and evaluates all information it deems reasonably necessary under the circum-stances in connection with its annual contract review. The Contract Committee consists solely of Trustees who are not “interested persons” (as this term is defined in the Investment Company Act of 1940, as amended (the “1940 Act”)) of The Putnam Funds (“Independent Trustees”).
At the outset of the review process, members of the Board’s independent staff and independent legal counsel considered any possible changes to the annual contract review materials furnished to the Contract Committee during the course of the previous year’s review and, as applicable, identified those changes to Putnam Management. Following these discussions and in consultation with the Contract Committee, the Independent Trustees’ independent legal counsel requested that Putnam Management and its affiliates furnish specified information, together with any additional information that Putnam Management considered relevant, to the Contract Commit-tee. Over the course of several months ending in June 2021, the Contract Committee met on a number of occasions with representatives of Putnam Management, and separately in executive session, to consider the information that Putnam Management provided. Throughout this process, the Contract Committee was assisted by the members of the Board’s independent staff and by independent legal counsel for The Putnam Funds and the Independent Trustees.
In May 2021, the Contract Committee met in executive session to discuss and consider its recommendations with respect to the contin-uance of the contracts. At the Trustees’ June 2021 meeting, the Contract Committee met in executive session with the other Independent Trustees to review a summary of the key financial, performance and other data that the Contract
Committee considered in the course of its review. The Contract Committee then presented its written report, which summarized the key factors that the Committee had considered and set forth its recommendations. The Contract Committee recommended, and the Independent Trustees approved, the continuance of your fund’s manage-ment and sub-management contracts, effective July 1, 2021. (Because PIL is an affiliate of Putnam Management and Putnam Management remains fully responsible for all services provided by PIL, the Trustees have not attempted to evaluate PIL as a separate entity, and all subsequent refer-ences to Putnam Management below should be deemed to include reference to PIL as necessary or appropriate in the context.)
The Independent Trustees’ approval was based on the following conclusions:
• That the fee schedule in effect for your fund repre-sented reasonable compensation in light of the nature and quality of the services being provided to the fund, the fees paid by competitive funds, the costs incurred by Putnam Management in providing services to the fund, and the appli-cation of certain reductions and waivers noted below; and
• That the fee schedule in effect for your fund represented an appropriate sharing between fund shareholders and Putnam Management of any economies of scale as may exist in the management of the fund at current asset levels.
These conclusions were based on a comprehen-sive consideration of all information provided to the Trustees and were not the result of any single factor. Some of the factors that figured particularly in the Trustees’ deliberations and how the Trust-ees considered these factors are described below, although individual Trustees may have evaluated the information presented differently, giving differ-ent weights to various factors. It is also important to recognize that the management arrangements for your fund and the other Putnam funds are the result of many years of review and discussion between the Independent Trustees and Putnam Management, that some aspects of the arrange-ments may receive greater scrutiny in some years than others, and that the Trustees’ conclusions may be based, in part, on their consideration of fee arrangements in previous years. For example, with certain exceptions primarily involving newly
16 Small Cap Growth Fund
launched or repositioned funds, the current fee arrangements under the vast majority of the funds’ management contracts were first implemented at the beginning of 2010 following extensive review by the Contract Committee and discussions with representatives of Putnam Management, as well as approval by shareholders.
Management fee schedules and total expensesThe Trustees reviewed the management fee schedules in effect for all Putnam funds, including fee levels and breakpoints. Under its manage-ment contract, your fund has the benefit of breakpoints in its management fee schedule that provide shareholders with reduced fee levels as assets under management in the Putnam family of funds increase. The Trustees also reviewed the total expenses of each Putnam fund, recognizing that in most cases management fees repre-sented the major, but not the sole, determinant of total costs to fund shareholders. (Two funds have implemented so-called “all-in” manage-ment fees covering substantially all routine fund operating costs.)
In reviewing fees and expenses, the Trustees generally focus their attention on material changes in circumstances — for example, changes in assets under management, changes in a fund’s investment strategy, changes in Putnam Management’s operating costs or profitability, or changes in competitive practices in the mutual fund industry — that suggest that consideration of fee changes might be warranted. The Trustees concluded that the circumstances did not indicate that changes to the management fee schedule for your fund would be appropriate at this time.
In addition, your fund’s management contract provides that its management fees will be adjusted up or down depending upon whether your fund’s performance is better or worse than the performance of an appropriate index of securi-ties prices specified in the management contract. In the course of reviewing investment perfor-mance, the Trustees examined the operation of your fund’s performance fees and concluded that these fees were operating effectively to align further Putnam Management’s economic interests with those of the fund’s shareholders.
As in the past, the Trustees also focused on the competitiveness of each fund’s total expense ratio. In order to support the effort to have fund expenses meet competitive standards,
the Trustees and Putnam Management and the funds’ investor servicing agent, Putnam Investor Services, Inc. (“PSERV”), have imple-mented expense limitations that were in effect during your fund’s fiscal year ending in 2020. These expense limitations were: (i) a contrac-tual expense limitation applicable to specified open-end funds, including your fund, of 25 basis points on investor servicing fees and expenses and (ii) a contractual expense limitation appli-cable to specified open-end funds, including your fund, of 20 basis points on so-called “other expenses” (i.e., all expenses exclusive of manage-ment fees, distribution fees, investor servicing fees, investment-related expenses, interest, taxes, brokerage commissions, acquired fund fees and expenses and extraordinary expenses). These expense limitations attempt to maintain compet-itive expense levels for the funds. Most funds, including your fund, had sufficiently low expenses that these expense limitations were not operative during their fiscal years ending in 2020. Putnam Management and PSERV have agreed to maintain these expense limitations until at least October 30, 2022. The support of Putnam Management and PSERV for these expense limitation arrangements was an important factor in the Trustees’ decision to approve the continuance of your fund’s management and sub-management contracts.
The Trustees reviewed comparative fee and expense information for a custom group of competitive funds selected by Broadridge Financial Solutions, Inc. (“Broadridge”). This comparative information included your fund’s percentile ranking for effective management fees and total expenses (excluding any applicable 12b-1 fees), which provides a general indication of your fund’s relative standing. In the custom peer group, your fund ranked in the first quintile in effective management fees (determined for your fund and the other funds in the custom peer group based on fund asset size and the applicable contractual management fee schedule) and in the second quintile in total expenses (excluding any applicable 12b-1 fees) as of December 31, 2020. The first quintile represents the least expensive funds and the fifth quintile the most expensive funds. The fee and expense data reported by Broadridge as of December 31, 2020 reflected the most recent fiscal year-end data available in Broadridge’s database at that time.
In connection with their review of fund manage-ment fees and total expenses, the Trustees also reviewed the costs of the services provided and
Small Cap Growth Fund 17
the profits realized by Putnam Management and its affiliates from their contractual relationships with the funds. This information included trends in revenues, expenses and profitability of Putnam Management and its affiliates relating to the investment management, investor servicing and distribution services provided to the funds. In this regard, the Trustees also reviewed an analy-sis of the revenues, expenses and profitability of Putnam Management and its affiliates, allocated on a fund-by-fund basis, with respect to the funds’ management, distribution, and investor servicing contracts. For each fund, the analysis presented information about revenues, expenses and profit-ability for each of the agreements separately and for the agreements taken together on a combined basis. The Trustees concluded that, at current asset levels, the fee schedules in place for the Putnam funds, including the fee schedule for your fund, represented reasonable compensation for the services being provided and represented an appropriate sharing between fund sharehold-ers and Putnam Management of any economies of scale as may exist in the management of the Putnam funds at that time.
The information examined by the Trustees in connection with their annual contract review for the Putnam funds included information regarding services provided and fees charged by Putnam Management and its affiliates to other clients, including defined benefit pension and profit-sharing plans, sub-advised mutual funds, private funds sponsored by affiliates of Putnam Management, model-only separately managed accounts and Putnam Management’s newly launched exchange-traded funds. This information included, in cases where a product’s investment strategy corresponds with a fund’s strategy, comparisons of those fees with fees charged to the Putnam funds, as well as an assess-ment of the differences in the services provided to these clients as compared to the services provided to the Putnam funds. The Trustees observed that the differences in fee rates between these clients and the Putnam funds are by no means uniform when examined by individual asset sectors, suggesting that differences in the pricing of investment management services to these types of clients may reflect, among other things, historical competitive forces operating in separate marketplaces. The Trustees consid-ered the fact that in many cases fee rates across different asset classes are higher on average for mutual funds than for other clients, and the
Trustees also considered the differences between the services that Putnam Management provides to the Putnam funds and those that it provides to its other clients. The Trustees did not rely on these comparisons to any significant extent in conclud-ing that the management fees paid by your fund are reasonable.
Investment performanceThe quality of the investment process provided by Putnam Management represented a major factor in the Trustees’ evaluation of the quality of services provided by Putnam Management under your fund’s management contract. The Trustees were assisted in their review of Putnam Manage-ment’s investment process and performance by the work of the investment oversight committees of the Trustees and the full Board of Trustees, which meet on a regular basis with individual portfolio managers and with senior management of Putnam Management’s Investment Division throughout the year. The Trustees concluded that Putnam Management generally provides a high-quality investment process — based on the experience and skills of the individuals assigned to the management of fund portfolios, the resources made available to them, and in general Putnam Management’s ability to attract and retain high-quality personnel — but also recognized that this does not guarantee favorable investment results for every fund in every time period.
The Trustees considered that, in the aggregate, The Putnam Funds generally performed well in 2020, which Putnam Management characterized as a challenging year with significant volatility and varied market dynamics. On an asset-weighted basis, the Putnam funds ranked in the second quartile of their peers as determined by Lipper Inc. (“Lipper”) for the year ended December 31, 2020 and, on an asset-weighted-basis, delivered a gross return that was 2.3% ahead of their benchmarks in 2020. In addition to the performance of the individual Putnam funds, the Trustees considered, as they had in prior years, the performance of The Putnam Fund complex versus competitor fund complexes. In this regard, the Trustees observed that The Putnam Funds’ relative performance, as reported in the Barron’s/Lipper Fund Families survey, continued to be exceptionally strong over the long term, with The Putnam Funds ranking as the 3rd best performing mutual fund complex out of 44 complexes for the ten-year period, with 2020 marking the fourth consecutive year that The Putnam Funds have ranked in the top ten fund
18 Small Cap Growth Fund

complexes for the ten-year period. The Trustees noted that The Putnam Funds’ performance was solid over the one- and five-year periods, with The Putnam Funds ranking 22nd out of 53 complexes and 14th out of 50 complexes, respectively. In addition to the Barron’s/Lipper Fund Families Survey, the Trustees also considered the funds’ ratings assigned by Morningstar Inc., noting that 26 of the funds were four- or five-star rated at the end of 2020 (representing an increase of four funds year-over-year) and that this included seven funds that had achieved a five-star rating (representing an increase of two funds year-over-year). They also noted, however, the disappointing investment performance of some funds for periods ended December 31, 2020 and considered information provided by Putnam Management regarding the factors contributing to the underperformance and actions being taken to improve the performance of these particular funds. The Trustees indicated their intention to continue to monitor closely the performance of those funds and evaluate whether additional actions to address areas of underperformance may be warranted.
For purposes of the Trustees’ evaluation of the Putnam funds’ investment performance, the Trustees generally focus on a competitive indus-try ranking of each fund’s total net return over a one-year, three-year and five-year period. For a number of Putnam funds with relatively unique investment mandates for which Putnam Manage-ment informed the Trustees that meaningful competitive performance rankings are not considered to be available, the Trustees evalu-ated performance based on their total gross and net returns and comparisons of those returns to the returns of selected investment bench-marks. In the case of your fund, the Trustees considered that its class A share cumulative total return performance at net asset value was in the following quartiles of its Lipper peer group (Lipper Small-Cap Growth Funds) for the one-year, three-year and five-year periods ended December 31, 2020 (the first quartile representing the best-performing funds and the fourth quartile the worst-performing funds):
One-year period 2ndThree-year period 1stFive-year period 1st
Over the one-year, three-year and five-year periods ended December 31, 2020, there were 670, 627 and 539 funds, respectively, in your fund’s Lipper peer group. (When considering
performance information, shareholders should be mindful that past performance is not a guarantee of future results.)
The Trustees considered Putnam Management’s continued efforts to support fund performance through certain initiatives, including structuring compensation for portfolio managers to enhance accountability for fund performance, emphasiz-ing accountability in the portfolio management process, and affirming its commitment to a fundamental-driven approach to investing. The Trustees noted further that Putnam Management had made selective hires and internal promotions in 2020 to strengthen its investment team.
Brokerage and soft-dollar allocations; investor servicingThe Trustees considered various potential benefits that Putnam Management may receive in connection with the services it provides under the management contract with your fund. These include benefits related to brokerage allocation and the use of soft dollars, whereby a portion of the commissions paid by a fund for brokerage may be used to acquire research services that are expected to be useful to Putnam Management in managing the assets of the fund and of other clients. Subject to policies established by the Trustees, soft dollars generated by these means are used predominantly to acquire brokerage and research services (including third-party research and market data) that enhance Putnam Manage-ment’s investment capabilities and supplement Putnam Management’s internal research efforts. The Trustees indicated their continued intent to monitor regulatory and industry developments in this area with the assistance of their Broker-age Committee. In addition, with the assistance of their Brokerage Committee, the Trustees indicated their continued intent to monitor the allocation of the Putnam funds’ brokerage in order to ensure that the principle of seeking best price and execution remains paramount in the portfolio trading process.
Putnam Management may also receive benefits from payments that the funds make to Putnam Management’s affiliates for investor or distribution services. In conjunction with the annual review of your fund’s management and sub-management contracts, the Trustees reviewed your fund’s investor servicing agreement with PSERV and its distributor’s contract and distribution plans with Putnam Retail Management Limited Partnership (“PRM”), both of which are affiliates of Putnam
Small Cap Growth Fund 19

Management. The Trustees concluded that the fees payable by the funds to PSERV and PRM, as applicable, for such services are fair and reason-able in relation to the nature and quality of such services, the fees paid by competitive funds, and the costs incurred by PSERV and PRM, as
applicable, in providing such services. Further-more, the Trustees were of the view that the investor services provided by PSERV were required for the operation of the funds, and that they were of a quality at least equal to those provided by other providers.
20 Small Cap Growth Fund

Audited financial statements
Small Cap Growth Fund 21
Audited financial statements
These sections of the report, as well as the accompanying Notes, preceded by the Report of Independent Registered Public Accounting Firm, constitute the fund’s audited financial statements.
The fund’s portfolio lists all the fund’s invest-ments and their values as of the last day of the reporting period. Holdings are organized by asset type and industry sector, country, or state to show areas of concentration and diversification.
Statement of assets and liabilities shows how the fund’s net assets and share price are determined. All investment and non-investment assets are added together. Any unpaid expenses and other liabilities are subtracted from this total. The result is divided by the number of shares to determine the net asset value per share, which is calculated separately for each class of shares. (For funds with preferred shares, the amount subtracted from total assets includes the liquidation preference of preferred shares.)
Statement of operations shows the fund’s net investment gain or loss. This is done by first adding up all the fund’s earnings — from dividends and interest income — and subtracting its operating expenses to determine net investment income (or
loss). Then, any net gain or loss the fund realized on the sales of its holdings — as well as any unreal-ized gains or losses over the period — is added to or subtracted from the net investment result to determine the fund’s net gain or loss for the fiscal period.
Statement of changes in net assets shows how the fund’s net assets were affected by the fund’s net investment gain or loss, by distributions to shareholders, and by changes in the number of the fund’s shares. It lists distributions and their sources (net investment income or realized capital gains) over the current reporting period and the most recent fiscal year-end. The distributions listed here may not match the sources listed in the Statement of operations because the distributions are deter-mined on a tax basis and may be paid in a different period from the one in which they were earned.
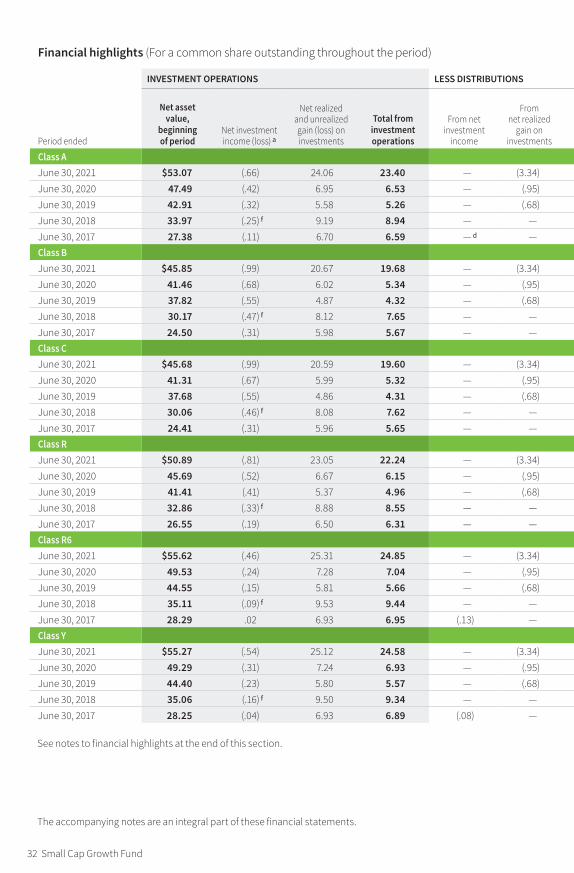
Financial highlights provide an overview of the fund’s investment results, per-share distributions, expense ratios, net investment income ratios, and portfolio turnover in one summary table, reflecting the five most recent reporting periods. In a semiannual report, the highlights table also includes the current reporting period.

Report of Independent Registered Public Accounting Firm
To the Board of Trustees of Putnam Funds Trust and Shareholders of Putnam Small Cap Growth Fund:
Opinion on the Financial Statements
We have audited the accompanying statement of assets and liabilities, including the fund’s portfolio, of Putnam Small Cap Growth Fund (one of the funds constituting Putnam Funds Trust, referred to hereafter as the “Fund”) as of June 30, 2021, the related statement of operations for the year ended June 30, 2021, the statement of changes in net assets for each of the two years in the period ended June 30, 2021, including the related notes, and the financial highlights for each of the five years in the period ended June 30, 2021 (collectively referred to as the “financial statements”). In our opinion, the financial statements present fairly, in all material respects, the financial position of the Fund as of June 30, 2021, the results of its operations for the year then ended, the changes in its net assets for each of the two years in the period ended June 30, 2021 and the financial highlights for each of the five years in the period ended June 30, 2021 in conformity with accounting principles generally accepted in the United States of America.
Basis for Opinion
These financial statements are the responsibility of the Fund’s management. Our responsibility is to express an opinion on the Fund’s financial statements based on our audits. We are a public accounting firm registered with the Public Company Accounting Oversight Board (United States) (“PCAOB”) and are required to be independent with respect to the Fund in accordance with the U.S. federal securities laws and the applicable rules and regulations of the Securities and Exchange Commission and the PCAOB.
We conducted our audits of these financial statements in accordance with the standards of the PCAOB. Those standards require that we plan and perform the audit to obtain reasonable assurance about whether the financial statements are free of material misstatement, whether due to error or fraud.
Our audits included performing procedures to assess the risks of material misstatement of the financial statements, whether due to error or fraud, and performing procedures that respond to those risks. Such procedures included examining, on a test basis, evidence regarding the amounts and disclosures in the financial statements. Our audits also included evaluating the accounting principles used and significant estimates made by management, as well as evaluating the overall presentation of the financial statements. Our procedures included confirmation of securities owned as of June 30, 2021 by correspondence with the custodian, transfer agent and brokers; when replies were not received from brokers, we performed other auditing procedures. We believe that our audits provide a reasonable basis for our opinion.
PricewaterhouseCoopers LLP Boston, Massachusetts August 6, 2021
We have served as the auditor of one or more investment companies in the Putnam Investments family of mutual funds since at least 1957. We have not been able to determine the specific year we began serving as auditor.
22 Small Cap Growth Fund

Small Cap Growth Fund 23
COMMON STOCKS (98.3%)* Shares ValueAuto components (1.0%)Patrick Industries, Inc. 109,600 $8,000,800
8,000,800Banks (0.6%)ServisFirst Bancshares, Inc. 74,200 5,044,116
5,044,116Biotechnology (8.7%)Acceleron Pharma, Inc. † 78,118 9,803,028Ascendis Pharma A/S ADR (Denmark) † S 43,800 5,761,890Biohaven Pharmaceutical Holding Co., Ltd. † S 77,900 7,562,532Denali Therapeutics, Inc. † 67,400 5,286,856Halozyme Therapeutics, Inc. † S 268,900 12,210,749Insmed, Inc. † S 188,500 5,364,710Intellia Therapeutics, Inc. † 33,200 5,375,412Natera, Inc. † 80,300 9,116,459TG Therapeutics, Inc. † 116,400 4,515,156Turning Point Therapeutics, Inc. † 52,400 4,088,248Veracyte, Inc. † S 93,949 3,756,081
72,841,121Building products (1.7%)AZEK Co., Inc. (The) † 341,936 14,518,603
14,518,603Capital markets (4.5%)Hamilton Lane, Inc. Class A 185,885 16,937,841Open Lending Corp. Class A † S 380,200 16,382,818StepStone Group, Inc. Class A 120,100 4,131,440
37,452,099Chemicals (1.7%)Ingevity Corp. † 109,700 8,925,192Orion Engineered Carbons SA (Luxembourg) † 302,100 5,736,879
14,662,071Commercial services and supplies (3.1%)Brink’s Co. (The) 169,800 13,047,432Montrose Environmental Group, Inc. † 241,252 12,945,582
25,993,014Construction and engineering (1.2%)WillScot Mobile Mini Holdings Corp. † 363,836 10,140,109
10,140,109Containers and packaging (0.8%)Ranpak Holdings Corp. † 263,476 6,594,804
6,594,804Diversified financial services (0.3%)EverArc Holdings, Ltd. (British Virgin Islands) † 194,901 2,436,263
2,436,263Electronic equipment, instruments, and components (3.7%)II-VI, Inc. † S 101,000 7,331,590Littelfuse, Inc. 23,700 6,038,523Novanta, Inc. † 104,705 14,110,046Rogers Corp. † 16,500 3,313,200
30,793,359
The fund’s portfolio 6/30/21

24 Small Cap Growth Fund
COMMON STOCKS (98.3%)* cont. Shares ValueEnergy equipment and services (0.7%)ChampionX Corp. † 229,700 $5,891,805
5,891,805Entertainment (0.5%)Madison Square Garden Sports Corp. † 23,200 4,003,624
4,003,624Food and staples retail (1.3%)Performance Food Group Co. † 223,600 10,842,364
10,842,364Health-care equipment and supplies (7.7%)AtriCure, Inc. † 53,500 4,244,155Axonics, Inc. † S 141,700 8,985,197CONMED Corp. 116,780 16,049,075InMode, Ltd. (Israel) † 302,833 28,672,228Lantheus Holdings, Inc. † 167,700 4,635,228STAAR Surgical Co. † 11,100 1,692,750
64,278,633Health-care providers and services (5.7%)AdaptHealth Corp. † 192,539 5,277,494ATI Physical Therapy, Inc. † S 396,572 3,783,297Castle Biosciences, Inc. † 67,195 4,927,409HealthEquity, Inc. † 59,700 4,804,656LHC Group, Inc. † 62,200 12,456,172R1 RCM, Inc. † 750,653 16,694,523
47,943,551Health-care technology (1.6%)Health Catalyst, Inc. † S 80,900 4,490,759Phreesia, Inc. † 146,675 8,991,178
13,481,937Hotels, restaurants, and leisure (5.0%)Accel Entertainment, Inc. † 339,800 4,033,426Churchill Downs, Inc. 66,100 13,104,986Chuy’s Holdings, Inc. † 108,300 4,035,258Everi Holdings, Inc. † 291,100 7,260,034Planet Fitness, Inc. Class A † 83,000 6,245,750Wingstop, Inc. S 44,452 7,006,969
41,686,423Household durables (0.9%)Installed Building Products, Inc. 61,100 7,476,196
7,476,196Insurance (1.3%)Kinsale Capital Group, Inc. 65,754 10,834,287
10,834,287Internet and direct marketing retail (0.9%)Revolve Group, Inc. † S 106,900 7,365,410
7,365,410IT Services (1.8%)Shift4 Payments, Inc. Class A † S 91,601 8,584,846WNS Holdings, Ltd. ADR (India) † 80,800 6,453,496
15,038,342

Small Cap Growth Fund 25
COMMON STOCKS (98.3%)* cont. Shares ValueLife sciences tools and services (3.6%)Medpace Holdings, Inc. † 102,900 $18,175,227Pacific Biosciences of California, Inc. † 123,300 4,311,801Repligen Corp. † 40,169 8,018,536
30,505,564Machinery (3.5%)Albany International Corp. Class A 45,500 4,061,330Altra Industrial Motion Corp. 182,900 11,892,158John Bean Technologies Corp. 35,900 5,120,058RBC Bearings, Inc. † 39,537 7,884,469
28,958,015Media (3.4%)Cable One, Inc. 6,669 12,756,530TechTarget, Inc. † 201,229 15,593,235
28,349,765Pharmaceuticals (0.3%)Antares Pharma, Inc. † S 669,700 2,919,892
2,919,892Professional services (1.0%)Korn Ferry 113,400 8,227,170
8,227,170Real estate management and development (1.9%)Colliers International Group, Inc. (Canada) 146,280 16,381,566
16,381,566Road and rail (3.9%)Saia, Inc. † 56,161 11,765,168TFI International, Inc. (Canada) 230,100 21,007,113
32,772,281Semiconductors and semiconductor equipment (4.8%)Brooks Automation, Inc. 109,276 10,411,817Nova Measuring Instruments, Ltd. (Israel) † S 164,797 16,955,963Onto Innovation, Inc. † 81,900 5,981,976Ultra Clean Holdings, Inc. † 133,730 7,183,976
40,533,732Software (11.8%)Digital Turbine, Inc. † 83,300 6,333,299j2 Global, Inc. † S 95,700 13,163,535Lightspeed POS, Inc. (Canada) † 45,600 3,812,616Manhattan Associates, Inc. † 112,000 16,222,080Paylocity Holding Corp. † 72,363 13,806,860Rapid7, Inc. † 75,100 7,106,713Sprout Social, Inc. Class A † 70,500 6,304,110SPS Commerce, Inc. † 100,100 9,994,985Upland Software, Inc. † 183,000 7,534,110Verra Mobility Corp. † 980,362 15,068,164
99,346,472Specialty retail (6.8%)Boot Barn Holdings, Inc. † 236,028 19,838,153Five Below, Inc. † 86,793 16,774,483

26 Small Cap Growth Fund
COMMON STOCKS (98.3%)* cont. Shares ValueSpecialty retail cont.Lithia Motors, Inc. Class A 34,100 $11,718,124RH † S 12,200 8,283,800
56,614,560Textiles, apparel, and luxury goods (0.8%)Deckers Outdoor Corp. † 18,500 7,105,295
7,105,295Trading companies and distributors (1.8%)Applied Industrial Technologies, Inc. 75,350 6,861,371SiteOne Landscape Supply, Inc. † S 48,794 8,258,872
15,120,243Total common stocks (cost $575,174,420) $824,153,486
SHORT-TERM INVESTMENTS (13.9%)* Shares ValuePutnam Cash Collateral Pool, LLC 0.09% d 102,743,164 $102,743,164Putnam Short Term Investment Fund Class P 0.09% L 13,768,127 13,768,127Total short-term investments (cost $116,511,291) $116,511,291
TOTAL INVESTMENTSTotal investments (cost $691,685,711) $940,664,777
Key to holding’s abbreviations
ADR American Depository Receipts: represents ownership of foreign securities on deposit with a custodian bank
Notes to the fund’s portfolio
Unless noted otherwise, the notes to the fund’s portfolio are for the close of the fund’s reporting period, which ran from July 1, 2020 through June 30, 2021 (the reporting period). Within the following notes to the portfolio, references to “Putnam Management” represent Putnam Investment Management, LLC, the fund’s manager, an indirect wholly-owned subsidiary of Putnam Investments, LLC and references to “ASC 820” represent Accounting Standards Codification 820 Fair Value Measurements and Disclosures.
* Percentages indicated are based on net assets of $838,089,827.
† This security is non-income-producing.
d Affiliated company. See Notes 1 and 5 to the financial statements regarding securities lending. The rate quoted in the security description is the annualized 7-day yield of the fund at the close of the reporting period.
L Affiliated company (Note 5). The rate quoted in the security description is the annualized 7-day yield of the fund at the close of the reporting period.
S Security on loan, in part or in entirety, at the close of the reporting period (Note 1).

Small Cap Growth Fund 27
The accompanying notes are an integral part of these financial statements.
ASC 820 establishes a three-level hierarchy for disclosure of fair value measurements. The valuation hierarchy is based upon the transparency of inputs to the valuation of the fund’s investments. The three levels are defined as follows:
Level 1: Valuations based on quoted prices for identical securities in active markets.Level 2: Valuations based on quoted prices in markets that are not active or for which all significant inputs are observable, either directly or indirectly.Level 3: Valuations based on inputs that are unobservable and significant to the fair value measurement.
The following is a summary of the inputs used to value the fund’s net assets as of the close of the reporting period:
Valuation inputsInvestments in securities: Level 1 Level 2 Level 3Common stocks*:
Communication services $32,353,389 $— $—
Consumer discretionary 128,248,684 — —
Consumer staples 10,842,364 — —
Energy 5,891,805 — —
Financials 55,766,765 — —
Health care 231,970,698 — —
Industrials 135,729,435 — —
Information technology 185,711,905 — —
Materials 21,256,875 — —
Real estate 16,381,566 — — Total common stocks 824,153,486 — —
Short-term investments — 116,511,291 — Totals by level $824,153,486 $116,511,291 $—
* Common stock classifications are presented at the sector level, which may differ from the fund’s portfolio presentation.

The accompanying notes are an integral part of these financial statements.
Statement of assets and liabilities 6/30/21
ASSETSInvestment in securities, at value, including $100,108,565 of securities on loan (Note 1):
Unaffiliated issuers (identified cost $575,174,420) $824,153,486 Affiliated issuers (identified cost $116,511,291) (Notes 1 and 5) 116,511,291
Dividends, interest and other receivables 289,551 Receivable for shares of the fund sold 1,811,584 Receivable for investments sold 1,702,748 Prepaid assets 51,122 Total assets 944,519,782
LIABILITIESPayable for investments purchased 1,530,682 Payable for shares of the fund repurchased 706,596 Payable for compensation of Manager (Note 2) 493,268 Payable for custodian fees (Note 2) 17,924 Payable for investor servicing fees (Note 2) 224,506 Payable for Trustee compensation and expenses (Note 2) 190,301 Payable for administrative services (Note 2) 2,522 Payable for distribution fees (Note 2) 386,850 Collateral on securities loaned, at value (Note 1) 102,743,164 Other accrued expenses 134,142 Total liabilities 106,429,955
Net assets $838,089,827
REPRESENTED BYPaid-in capital (Unlimited shares authorized) (Notes 1 and 4) $469,677,483 Total distributable earnings (Note 1) 368,412,344 Total — Representing net assets applicable to capital shares outstanding $838,089,827
COMPUTATION OF NET ASSET VALUE AND OFFERING PRICENet asset value and redemption price per class A share ($549,841,780 divided by 7,519,079 shares) $73.13 Offering price per class A share (100/94.25 of $73.13)* $77.59 Net asset value and offering price per class B share ($5,955,568 divided by 95,771 shares)** $62.19 Net asset value and offering price per class C share ($17,119,746 divided by 276,414 shares)** $61.94 Net asset value, offering price and redemption price per class R share ($23,570,748 divided by 337,742 shares) $69.79 Net asset value, offering price and redemption price per class R6 share ($59,839,904 divided by 775,877 shares) $77.13 Net asset value, offering price and redemption price per class Y share ($181,762,081 divided by 2,375,760 shares) $76.51
*On single retail sales of less than $50,000. On sales of $50,000 or more the offering price is reduced.**Redemption price per share is equal to net asset value less any applicable contingent deferred sales charge.
28 Small Cap Growth Fund

The accompanying notes are an integral part of these financial statements.
Statement of operations Year ended 6/30/21
INVESTMENT INCOMEDividends (net of foreign tax of $32,388) $1,358,745 Interest (including interest income of $21,356 from investments in affiliated issuers) (Note 5) 22,184 Securities lending (net of expenses) (Notes 1 and 5) 134,557 Total investment income 1,515,486
EXPENSESCompensation of Manager (Note 2) 5,335,640 Investor servicing fees (Note 2) 1,267,604 Custodian fees (Note 2) 35,926 Trustee compensation and expenses (Note 2) 32,085 Distribution fees (Note 2) 1,599,485 Administrative services (Note 2) 19,739 Other 317,164 Total expenses 8,607,643
Expense reduction (Note 2) (1,486)Net expenses 8,606,157
Net investment loss (7,090,671)
REALIZED AND UNREALIZED GAIN (LOSS)Net realized gain (loss) on:
Securities from unaffiliated issuers (Notes 1 and 3) 141,109,488 Foreign currency transactions (Note 1) 862
Total net realized gain 141,110,350 Change in net unrealized appreciation (depreciation) on:
Securities from unaffiliated issuers 118,387,930 Assets and liabilities in foreign currencies (201)
Total change in net unrealized appreciation 118,387,729
Net gain on investments 259,498,079
Net increase in net assets resulting from operations $252,407,408
Small Cap Growth Fund 29

The accompanying notes are an integral part of these financial statements.
Statement of changes in net assets
INCREASE IN NET ASSETS Year ended 6/30/21 Year ended 6/30/20OperationsNet investment loss $(7,090,671) $(4,305,799)Net realized gain on investments and foreign currency transactions 141,110,350 37,839,353 Change in net unrealized appreciation of investments and assets and liabilities in foreign currencies 118,387,729 33,323,067 Net increase in net assets resulting from operations 252,407,408 66,856,621 Distributions to shareholders (Note 1):
From ordinary incomeNet realized short-term gain on investments
Class A (6,690,592) — Class B (101,235) — Class C (271,029) — Class R (300,809) — Class R6 (524,395) — Class Y (1,787,247) —
From net realized long-term gain on investmentsClass A (17,866,087) (7,533,169)Class B (270,332) (136,762)Class C (723,738) (315,008)Class R (803,258) (247,251)Class R6 (1,400,308) (378,380)Class Y (4,772,537) (1,133,374)
Increase from capital share transactions (Note 4) 64,638,514 1,418,666 Total increase in net assets 281,534,355 58,531,343
NET ASSETSBeginning of year 556,555,472 498,024,129
End of year $838,089,827 $556,555,472
30 Small Cap Growth Fund

Small Cap Growth Fund 31
This page left blank intentionally.
Fund _FundCode, — NumbCols Columns — This section modified: 7/21/21 10:45:22 AM Fund _FundCode, — NumbCols Columns — This section modified: 7/21/21 10:45:22 AM
32 Small Cap Growth Fund
The accompanying notes are an integral part of these financial statements.
See notes to financial highlights at the end of this section.
Financial highlights (For a common share outstanding throughout the period)
INVESTMENT OPERATIONS LESS DISTRIBUTIONS RATIOS AND SUPPLEMENTAL DATA
Period ended
Net asset value,
beginning of period
Net investment income (loss ) a
Net realized and unrealized gain (loss) on investments
Total from investment operations
From net investment
income
From net realized
gain on investments
From return of capital
Total dis tri bu tions
Net asset value, end of period
Total return at net asset value (% ) b
Net assets, end of period
(in thousands )
Ratio of expenses
to average net assets
(% ) c
Ratio of net investment
income (loss) to average
net assets (% )
Portfolio turnover
(% )
Class AJune 30, 2021 $53.07 (.66 ) 24.06 23.40 — (3.34 ) — (3.34 ) $73.13 44.93 $549,842 1.21 (1.00 ) 70 June 30, 2020 47.49 (.42 ) 6.95 6.53 — (.95 ) — (.95 ) 53.07 13.99 415,702 1.24 (.88 ) 56 June 30, 2019 42.91 (.32 ) 5.58 5.26 — (.68 ) — d (.68 ) 47.49 12.35 384,781 1.21 e (.75 ) 37 June 30, 2018 33.97 (.25 ) f 9.19 8.94 — — — — 42.91 26.32 141,801 1.25 e,g (.66 ) f,g 68 June 30, 2017 27.38 (.11 ) 6.70 6.59 — d — — — d 33.97 24.07 112,740 1.21 (.37 ) 127 Class BJune 30, 2021 $45.85 (.99 ) 20.67 19.68 — (3.34 ) — (3.34 ) $62.19 43.86 $5,956 1.96 (1.74 ) 70 June 30, 2020 41.46 (.68 ) 6.02 5.34 — (.95 ) — (.95 ) 45.85 13.15 5,835 1.99 (1.63 ) 56 June 30, 2019 37.82 (.55 ) 4.87 4.32 — (.68 ) — d (.68 ) 41.46 11.51 6,461 1.96 e (1.47 ) 37 June 30, 2018 30.17 (.47 ) f 8.12 7.65 — — — — 37.82 25.36 2,732 2.00 e,g (1.41 ) f,g 68 June 30, 2017 24.50 (.31 ) 5.98 5.67 — — — — 30.17 23.14 2,568 1.96 (1.12 ) 127 Class CJune 30, 2021 $45.68 (.99 ) 20.59 19.60 — (3.34 ) — (3.34 ) $61.94 43.84 $17,120 1.96 (1.74 ) 70 June 30, 2020 41.31 (.67 ) 5.99 5.32 — (.95 ) — (.95 ) 45.68 13.15 13,869 1.99 (1.63 ) 56 June 30, 2019 37.68 (.55 ) 4.86 4.31 — (.68 ) — d (.68 ) 41.31 11.53 13,862 1.96 e (1.47 ) 37 June 30, 2018 30.06 (.46 ) f 8.08 7.62 — — — — 37.68 25.35 6,612 2.00 e,g (1.41 ) f,g 68 June 30, 2017 24.41 (.31 ) 5.96 5.65 — — — — 30.06 23.15 9,900 1.96 (1.12 ) 127 Class RJune 30, 2021 $50.89 (.81 ) 23.05 22.24 — (3.34 ) — (3.34 ) $69.79 44.56 $23,571 1.46 (1.26 ) 70 June 30, 2020 45.69 (.52 ) 6.67 6.15 — (.95 ) — (.95 ) 50.89 13.71 12,669 1.49 (1.13 ) 56 June 30, 2019 41.41 (.41 ) 5.37 4.96 — (.68 ) — d (.68 ) 45.69 12.07 13,020 1.46 e (.99 ) 37 June 30, 2018 32.86 (.33 ) f 8.88 8.55 — — — — 41.41 26.02 9,034 1.50 e,g (.91 ) f,g 68 June 30, 2017 26.55 (.19 ) 6.50 6.31 — — — — 32.86 23.77 7,920 1.46 (.62 ) 127 Class R6June 30, 2021 $55.62 (.46 ) 25.31 24.85 — (3.34 ) — (3.34 ) $77.13 45.49 $59,840 .83 (.64 ) 70 June 30, 2020 49.53 (.24 ) 7.28 7.04 — (.95 ) — (.95 ) 55.62 14.45 24,596 .84 (.48 ) 56 June 30, 2019 44.55 (.15 ) 5.81 5.66 — (.68 ) — d (.68 ) 49.53 12.80 20,695 .80 e (.35 ) 37 June 30, 2018 35.11 (.09 ) f 9.53 9.44 — — — — 44.55 26.89 11,041 .82 e,g (.22 ) f,g 68 June 30, 2017 28.29 .02 6.93 6.95 (.13 ) — — (.13 ) 35.11 24.61 8,719 .77 .07 127 Class YJune 30, 2021 $55.27 (.54 ) 25.12 24.58 — (3.34 ) — (3.34 ) $76.51 45.29 $181,762 .96 (.77 ) 70 June 30, 2020 49.29 (.31 ) 7.24 6.93 — (.95 ) — (.95 ) 55.27 14.30 83,884 .99 (.63 ) 56 June 30, 2019 44.40 (.23 ) 5.80 5.57 — (.68 ) — d (.68 ) 49.29 12.64 54,084 .96 e (.52 ) 37 June 30, 2018 35.06 (.16 ) f 9.50 9.34 — — — — 44.40 26.64 18,560 1.00 e,g (.39 ) f,g 68 June 30, 2017 28.25 (.04 ) 6.93 6.89 (.08 ) — — (.08 ) 35.06 24.39 10,144 .96 (.12 ) 127
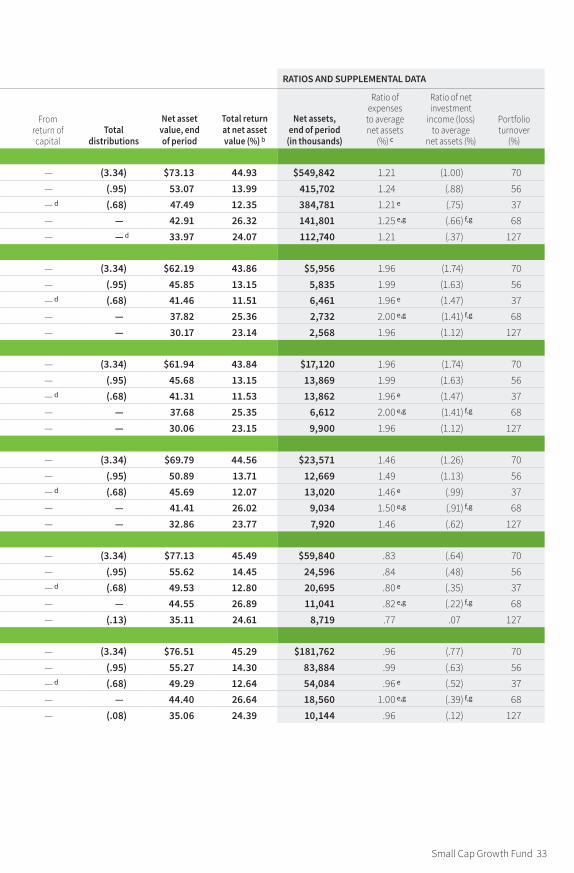
Fund _FundCode, — NumbCols Columns — This section modified: 7/21/21 10:45:22 AM Fund _FundCode, — NumbCols Columns — This section modified: 7/21/21 10:45:22 AM
Small Cap Growth Fund 33
Financial highlights (For a common share outstanding throughout the period)
INVESTMENT OPERATIONS LESS DISTRIBUTIONS RATIOS AND SUPPLEMENTAL DATA
Period ended
Net asset value,
beginning of period
Net investment income (loss ) a
Net realized and unrealized gain (loss) on investments
Total from investment operations
From net investment
income
From net realized
gain on investments
From return of capital
Total dis tri bu tions
Net asset value, end of period
Total return at net asset value (% ) b
Net assets, end of period
(in thousands )
Ratio of expenses
to average net assets
(% ) c
Ratio of net investment
income (loss) to average
net assets (% )
Portfolio turnover
(% )
Class AJune 30, 2021 $53.07 (.66 ) 24.06 23.40 — (3.34 ) — (3.34 ) $73.13 44.93 $549,842 1.21 (1.00 ) 70 June 30, 2020 47.49 (.42 ) 6.95 6.53 — (.95 ) — (.95 ) 53.07 13.99 415,702 1.24 (.88 ) 56 June 30, 2019 42.91 (.32 ) 5.58 5.26 — (.68 ) — d (.68 ) 47.49 12.35 384,781 1.21 e (.75 ) 37 June 30, 2018 33.97 (.25 ) f 9.19 8.94 — — — — 42.91 26.32 141,801 1.25 e,g (.66 ) f,g 68 June 30, 2017 27.38 (.11 ) 6.70 6.59 — d — — — d 33.97 24.07 112,740 1.21 (.37 ) 127 Class BJune 30, 2021 $45.85 (.99 ) 20.67 19.68 — (3.34 ) — (3.34 ) $62.19 43.86 $5,956 1.96 (1.74 ) 70 June 30, 2020 41.46 (.68 ) 6.02 5.34 — (.95 ) — (.95 ) 45.85 13.15 5,835 1.99 (1.63 ) 56 June 30, 2019 37.82 (.55 ) 4.87 4.32 — (.68 ) — d (.68 ) 41.46 11.51 6,461 1.96 e (1.47 ) 37 June 30, 2018 30.17 (.47 ) f 8.12 7.65 — — — — 37.82 25.36 2,732 2.00 e,g (1.41 ) f,g 68 June 30, 2017 24.50 (.31 ) 5.98 5.67 — — — — 30.17 23.14 2,568 1.96 (1.12 ) 127 Class CJune 30, 2021 $45.68 (.99 ) 20.59 19.60 — (3.34 ) — (3.34 ) $61.94 43.84 $17,120 1.96 (1.74 ) 70 June 30, 2020 41.31 (.67 ) 5.99 5.32 — (.95 ) — (.95 ) 45.68 13.15 13,869 1.99 (1.63 ) 56 June 30, 2019 37.68 (.55 ) 4.86 4.31 — (.68 ) — d (.68 ) 41.31 11.53 13,862 1.96 e (1.47 ) 37 June 30, 2018 30.06 (.46 ) f 8.08 7.62 — — — — 37.68 25.35 6,612 2.00 e,g (1.41 ) f,g 68 June 30, 2017 24.41 (.31 ) 5.96 5.65 — — — — 30.06 23.15 9,900 1.96 (1.12 ) 127 Class RJune 30, 2021 $50.89 (.81 ) 23.05 22.24 — (3.34 ) — (3.34 ) $69.79 44.56 $23,571 1.46 (1.26 ) 70 June 30, 2020 45.69 (.52 ) 6.67 6.15 — (.95 ) — (.95 ) 50.89 13.71 12,669 1.49 (1.13 ) 56 June 30, 2019 41.41 (.41 ) 5.37 4.96 — (.68 ) — d (.68 ) 45.69 12.07 13,020 1.46 e (.99 ) 37 June 30, 2018 32.86 (.33 ) f 8.88 8.55 — — — — 41.41 26.02 9,034 1.50 e,g (.91 ) f,g 68 June 30, 2017 26.55 (.19 ) 6.50 6.31 — — — — 32.86 23.77 7,920 1.46 (.62 ) 127 Class R6June 30, 2021 $55.62 (.46 ) 25.31 24.85 — (3.34 ) — (3.34 ) $77.13 45.49 $59,840 .83 (.64 ) 70 June 30, 2020 49.53 (.24 ) 7.28 7.04 — (.95 ) — (.95 ) 55.62 14.45 24,596 .84 (.48 ) 56 June 30, 2019 44.55 (.15 ) 5.81 5.66 — (.68 ) — d (.68 ) 49.53 12.80 20,695 .80 e (.35 ) 37 June 30, 2018 35.11 (.09 ) f 9.53 9.44 — — — — 44.55 26.89 11,041 .82 e,g (.22 ) f,g 68 June 30, 2017 28.29 .02 6.93 6.95 (.13 ) — — (.13 ) 35.11 24.61 8,719 .77 .07 127 Class YJune 30, 2021 $55.27 (.54 ) 25.12 24.58 — (3.34 ) — (3.34 ) $76.51 45.29 $181,762 .96 (.77 ) 70 June 30, 2020 49.29 (.31 ) 7.24 6.93 — (.95 ) — (.95 ) 55.27 14.30 83,884 .99 (.63 ) 56 June 30, 2019 44.40 (.23 ) 5.80 5.57 — (.68 ) — d (.68 ) 49.29 12.64 54,084 .96 e (.52 ) 37 June 30, 2018 35.06 (.16 ) f 9.50 9.34 — — — — 44.40 26.64 18,560 1.00 e,g (.39 ) f,g 68 June 30, 2017 28.25 (.04 ) 6.93 6.89 (.08 ) — — (.08 ) 35.06 24.39 10,144 .96 (.12 ) 127

Fund _FundCode, — NumbCols Columns — This section modified: 7/21/21 10:45:22 AM Fund _FundCode, — NumbCols Columns — This section modified: 7/21/21 10:45:22 AM
34 Small Cap Growth Fund
Financial highlights cont.
The accompanying notes are an integral part of these financial statements.
a Per share net investment income (loss) has been determined on the basis of the weighted average number of shares outstanding during the period.
b Total return assumes dividend reinvestment and does not reflect the effect of sales charges. c Includes amounts paid through expense offset and/or brokerage/service arrangements, if any (Note 2). Also excludes
acquired fund fees and expenses, if any. d Amount represents less than $0.01 per share. e Includes one-time merger costs which amounted to the following amounts as a percentage of average net assets:
Percentage of average net assets6/30/19 0.01%6/30/18 0.05
f Reflects a dividend received by the fund from a single issuer which amounted to the following amounts:
Per share Percentage of average net assetsClass A $0.06 0.16%Class B 0.05 0.16Class C 0.05 0.16Class R 0.06 0.16Class R6 0.07 0.17Class Y 0.07 0.17
g Reflects an involuntary contractual expense limitation in effect during the period. As a result of such limitation, the expenses of each class reflect a reduction of 0.05% as a percentage of average net assets (Note 2).

Small Cap Growth Fund 35
Notes to financial statements 6/30/21
Within the following Notes to financial statements, references to “State Street” represent State Street Bank and Trust Company, references to “the SEC” represent the Securities and Exchange Commission, references to “Putnam Management” represent Putnam Investment Management, LLC, the fund’s manager, an indirect wholly-owned subsidiary of Putnam Investments, LLC and references to “OTC”, if any, represent over-the-counter. Unless otherwise noted, the “reporting period” represents the period from July 1, 2020 through June 30, 2021.
Putnam Small Cap Growth Fund (the fund) is a diversified series of Putnam Funds Trust (the Trust), a Massachusetts business trust registered under the Investment Company Act of 1940, as amended, as an open-end management investment company. The goal of the fund is to seek capital appreciation. The fund invests mainly in common stocks of small U.S. companies, with a focus on growth stocks. Growth stocks are stocks of companies whose earnings are expected to grow faster than those of similar firms, and whose business growth and other characteristics may lead to an increase in stock price. Under normal circumstances, Putnam Management invests at least 80% of the fund’s net assets in companies of a size similar to those in the Russell 2000 Growth Index. This policy may be changed only after 60 days’ notice to shareholders. As of August 31, 2020, the index was composed of companies having market capitalizations of between approximately $54.1 million and $7.4 billion. Putnam Management may consider, among other factors, a company’s valuation, financial strength, growth potential, competitive position in its industry, projected future earnings, cash flows and dividends when deciding whether to buy or sell investments.
The fund offers class A, class B, class C, class R, class R6 and class Y shares. Purchases of class B shares are closed to new and existing investors except by exchange from class B shares of another Putnam fund or through dividend and/or capital gains reinvestment. Class A shares are sold with a maximum front-end sales charge of 5.75%. Class A shares generally are not subject to a contingent deferred sales charge, and class R, class R6 and class Y shares are not subject to a contingent deferred sales charge. Class B shares, which convert to class A shares after approximately eight years, are not subject to a front-end sales charge and are subject to a contingent deferred sales charge if those shares are redeemed within six years of purchase. Class C shares are subject to a one-year 1.00% contingent deferred sales charge and generally convert to class A shares after approximately eight years. Prior to March 1, 2021, class C shares generally converted to class A shares after approximately ten years. Class R shares, which are not available to all investors, are sold at net asset value. The expenses for class A, class B, class C and class R shares may differ based on the distribution fee of each class, which is identified in Note 2. Class R6 and class Y shares, which are sold at net asset value, are generally subject to the same expenses as class A, class B, class C and class R shares, but do not bear a distribution fee, and in the case of class R6 shares, bear a lower investor servicing fee, which is identified in Note 2. Class R6 and class Y shares are not available to all investors.
In the normal course of business, the fund enters into contracts that may include agreements to indemnify another party under given circumstances. The fund’s maximum exposure under these arrangements is unknown as this would involve future claims that may be, but have not yet been, made against the fund. However, the fund’s management team expects the risk of material loss to be remote.
The fund has entered into contractual arrangements with an investment adviser, administrator, distributor, share-holder servicing agent and custodian, who each provide services to the fund. Unless expressly stated otherwise, shareholders are not parties to, or intended beneficiaries of these contractual arrangements, and these contrac-tual arrangements are not intended to create any shareholder right to enforce them against the service providers or to seek any remedy under them against the service providers, either directly or on behalf of the fund.
Under the fund’s Amended and Restated Agreement and Declaration of Trust, any claims asserted against or on behalf of the Putnam Funds, including claims against Trustees and Officers, must be brought in state and federal courts located within the Commonwealth of Massachusetts.
Note 1: Significant accounting policiesThe following is a summary of significant accounting policies consistently followed by the fund in the preparation of its financial statements. The preparation of financial statements is in conformity with accounting principles generally accepted in the United States of America and requires management to make estimates and assump-tions that affect the reported amounts of assets and liabilities in the financial statements and the reported amounts of increases and decreases in net assets from operations. Actual results could differ from those esti-mates. Subsequent events after the Statement of assets and liabilities date through the date that the financial statements were issued have been evaluated in the preparation of the financial statements.

36 Small Cap Growth Fund
Investment income, realized and unrealized gains and losses and expenses of the fund are borne pro-rata based on the relative net assets of each class to the total net assets of the fund, except that each class bears expenses unique to that class (including the distribution fees applicable to such classes). Each class votes as a class only with respect to its own distribution plan or other matters on which a class vote is required by law or determined by the Trustees. If the fund were liquidated, shares of each class would receive their pro-rata share of the net assets of the fund. In addition, the Trustees declare separate dividends on each class of shares.
Security valuation Portfolio securities and other investments are valued using policies and procedures adopted by the Board of Trustees. The Trustees have formed a Pricing Committee to oversee the implementation of these procedures and have delegated responsibility for valuing the fund’s assets in accordance with these procedures to Putnam Management. Putnam Management has established an internal Valuation Committee that is respon-sible for making fair value determinations, evaluating the effectiveness of the pricing policies of the fund and reporting to the Pricing Committee.
Investments for which market quotations are readily available are valued at the last reported sales price on their principal exchange, or official closing price for certain markets, and are classified as Level 1 securities under Accounting Standards Codification 820 Fair Value Measurements and Disclosures (ASC 820). If no sales are reported, as in the case of some securities that are traded OTC, a security is valued at its last reported bid price and is generally categorized as a Level 2 security.
Investments in open-end investment companies (excluding exchange-traded funds), if any, which can be classi-fied as Level 1 or Level 2 securities, are valued based on their net asset value. The net asset value of such invest-ment companies equals the total value of their assets less their liabilities and divided by the number of their outstanding shares.
Many securities markets and exchanges outside the U.S. close prior to the scheduled close of the New York Stock Exchange and therefore the closing prices for securities in such markets or on such exchanges may not fully reflect events that occur after such close but before the scheduled close of the New York Stock Exchange. Accord-ingly, on certain days, the fund will fair value certain foreign equity securities taking into account multiple factors including movements in the U.S. securities markets, currency valuations and comparisons to the valuation of American Depository Receipts, exchange-traded funds and futures contracts. The foreign equity securities, which would generally be classified as Level 1 securities, will be transferred to Level 2 of the fair value hierarchy when they are valued at fair value. The number of days on which fair value prices will be used will depend on market activity and it is possible that fair value prices will be used by the fund to a significant extent. Securities quoted in foreign currencies, if any, are translated into U.S. dollars at the current exchange rate. Short-term securities with remaining maturities of 60 days or less are valued using an independent pricing service approved by the Trustees, and are classified as Level 2 securities.
To the extent a pricing service or dealer is unable to value a security or provides a valuation that Putnam Manage-ment does not believe accurately reflects the security’s fair value, the security will be valued at fair value by Putnam Management in accordance with policies and procedures approved by the Trustees. Certain invest-ments, including certain restricted and illiquid securities and derivatives, are also valued at fair value following procedures approved by the Trustees. These valuations consider such factors as significant market or specific security events such as interest rate or credit quality changes, various relationships with other securities, discount rates, U.S. Treasury, U.S. swap and credit yields, index levels, convexity exposures, recovery rates, sales and other multiples and resale restrictions. These securities are classified as Level 2 or as Level 3 depending on the priority of the significant inputs.
To assess the continuing appropriateness of fair valuations, the Valuation Committee reviews and affirms the reasonableness of such valuations on a regular basis after considering all relevant information that is reasonably available. Such valuations and procedures are reviewed periodically by the Trustees. The fair value of securities is generally determined as the amount that the fund could reasonably expect to realize from an orderly disposi-tion of such securities over a reasonable period of time. By its nature, a fair value price is a good faith estimate of the value of a security in a current sale and does not reflect an actual market price, which may be different by a material amount.
Security transactions and related investment income Security transactions are recorded on the trade date (the date the order to buy or sell is executed). Gains or losses on securities sold are determined on the identified cost basis.
Interest income, net of any applicable withholding taxes, if any, is recorded on the accrual basis. Dividend income, net of any applicable withholding taxes, is recognized on the ex-dividend date except that certain dividends from
Small Cap Growth Fund 37
foreign securities, if any, are recognized as soon as the fund is informed of the ex-dividend date. Non-cash divi-dends, if any, are recorded at the fair value of the securities received. Dividends representing a return of capital or capital gains, if any, are reflected as a reduction of cost and/or as a realized gain.
Foreign currency translation The accounting records of the fund are maintained in U.S. dollars. The fair value of foreign securities, currency holdings, and other assets and liabilities is recorded in the books and records of the fund after translation to U.S. dollars based on the exchange rates on that day. The cost of each security is deter-mined using historical exchange rates. Income and withholding taxes are translated at prevailing exchange rates when earned or incurred. The fund does not isolate that portion of realized or unrealized gains or losses resulting from changes in the foreign exchange rate on investments from fluctuations arising from changes in the market prices of the securities. Such gains and losses are included with the net realized and unrealized gain or loss on investments. Net realized gains and losses on foreign currency transactions represent net realized exchange gains or losses on disposition of foreign currencies, currency gains and losses realized between the trade and settlement dates on securities transactions and the difference between the amount of investment income and foreign withholding taxes recorded on the fund’s books and the U.S. dollar equivalent amounts actually received or paid. Net unrealized appreciation and depreciation of assets and liabilities in foreign currencies arise from changes in the value of assets and liabilities other than investments at the period end, resulting from changes in the exchange rate.
Securities lending The fund may lend securities, through its agent, to qualified borrowers in order to earn addi-tional income. The loans are collateralized by cash in an amount at least equal to the fair value of the securities loaned. The fair value of securities loaned is determined daily and any additional required collateral is allocated to the fund on the next business day. The remaining maturities of the securities lending transactions are consid-ered overnight and continuous. The risk of borrower default will be borne by the fund’s agent; the fund will bear the risk of loss with respect to the investment of the cash collateral. Income from securities lending, net of expenses, is included in investment income on the Statement of operations. Cash collateral is invested in Putnam Cash Collateral Pool, LLC, a limited liability company managed by an affiliate of Putnam Management. Invest-ments in Putnam Cash Collateral Pool, LLC are valued at its closing net asset value each business day. There are no management fees charged to Putnam Cash Collateral Pool, LLC. At the close of the reporting period, the fund received cash collateral of $102,743,164 and the value of securities loaned amounted to $100,108,565.
Interfund lending The fund, along with other Putnam funds, may participate in an interfund lending program pursuant to an exemptive order issued by the SEC. This program allows the fund to borrow from or lend to other Putnam funds that permit such transactions. Interfund lending transactions are subject to each fund’s investment policies and borrowing and lending limits. Interest earned or paid on the interfund lending transac-tion will be based on the average of certain current market rates. During the reporting period, the fund did not utilize the program.
Lines of credit The fund participates, along with other Putnam funds, in a $317.5 million unsecured committed line of credit and a $235.5 million unsecured uncommitted line of credit, both provided by State Street. Borrow-ings may be made for temporary or emergency purposes, including the funding of shareholder redemption requests and trade settlements. Interest is charged to the fund based on the fund’s borrowing at a rate equal to 1.25% plus the higher of (1) the Federal Funds rate and (2) the Overnight Bank Funding Rate for the committed line of credit and 1.30% plus the higher of (1) the Federal Funds rate and (2) the Overnight Bank Funding Rate for the uncommitted line of credit. A closing fee equal to 0.04% of the committed line of credit and 0.04% of the uncommitted line of credit has been paid by the participating funds. In addition, a commitment fee of 0.21% per annum on any unutilized portion of the committed line of credit is allocated to the participating funds based on their relative net assets and paid quarterly. During the reporting period, the fund had no borrowings against these arrangements.
Federal taxes It is the policy of the fund to distribute all of its taxable income within the prescribed time period and otherwise comply with the provisions of the Internal Revenue Code of 1986, as amended (the Code), appli-cable to regulated investment companies. It is also the intention of the fund to distribute an amount sufficient to avoid imposition of any excise tax under Section 4982 of the Code.
The fund is subject to the provisions of Accounting Standards Codification 740 Income Taxes (ASC 740). ASC 740 sets forth a minimum threshold for financial statement recognition of the benefit of a tax position taken or expected to be taken in a tax return. The fund did not have a liability to record for any unrecognized tax benefits in the accompanying financial statements. No provision has been made for federal taxes on income, capital gains or unrealized appreciation on securities held nor for excise tax on income and capital gains. Each of the fund’s federal tax returns for the prior three fiscal years remains subject to examination by the Internal Revenue Service.
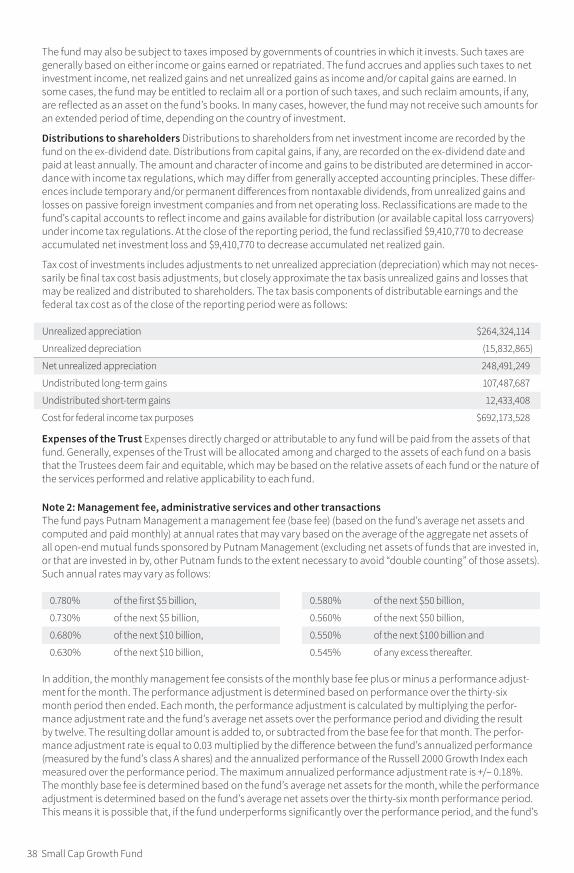
38 Small Cap Growth Fund
The fund may also be subject to taxes imposed by governments of countries in which it invests. Such taxes are generally based on either income or gains earned or repatriated. The fund accrues and applies such taxes to net investment income, net realized gains and net unrealized gains as income and/or capital gains are earned. In some cases, the fund may be entitled to reclaim all or a portion of such taxes, and such reclaim amounts, if any, are reflected as an asset on the fund’s books. In many cases, however, the fund may not receive such amounts for an extended period of time, depending on the country of investment.
Distributions to shareholders Distributions to shareholders from net investment income are recorded by the fund on the ex-dividend date. Distributions from capital gains, if any, are recorded on the ex-dividend date and paid at least annually. The amount and character of income and gains to be distributed are determined in accor-dance with income tax regulations, which may differ from generally accepted accounting principles. These differ-ences include temporary and/or permanent differences from nontaxable dividends, from unrealized gains and losses on passive foreign investment companies and from net operating loss. Reclassifications are made to the fund’s capital accounts to reflect income and gains available for distribution (or available capital loss carryovers) under income tax regulations. At the close of the reporting period, the fund reclassified $9,410,770 to decrease accumulated net investment loss and $9,410,770 to decrease accumulated net realized gain.
Tax cost of investments includes adjustments to net unrealized appreciation (depreciation) which may not neces-sarily be final tax cost basis adjustments, but closely approximate the tax basis unrealized gains and losses that may be realized and distributed to shareholders. The tax basis components of distributable earnings and the federal tax cost as of the close of the reporting period were as follows:
Unrealized appreciation $264,324,114
Unrealized depreciation (15,832,865 )
Net unrealized appreciation 248,491,249
Undistributed long-term gains 107,487,687
Undistributed short-term gains 12,433,408
Cost for federal income tax purposes $692,173,528
Expenses of the Trust Expenses directly charged or attributable to any fund will be paid from the assets of that fund. Generally, expenses of the Trust will be allocated among and charged to the assets of each fund on a basis that the Trustees deem fair and equitable, which may be based on the relative assets of each fund or the nature of the services performed and relative applicability to each fund.
Note 2: Management fee, administrative services and other transactionsThe fund pays Putnam Management a management fee (base fee) (based on the fund’s average net assets and computed and paid monthly) at annual rates that may vary based on the average of the aggregate net assets of all open-end mutual funds sponsored by Putnam Management (excluding net assets of funds that are invested in, or that are invested in by, other Putnam funds to the extent necessary to avoid “double counting” of those assets). Such annual rates may vary as follows:
0.780 % of the first $5 billion,
0.730 % of the next $5 billion,
0.680 % of the next $10 billion,
0.630 % of the next $10 billion,
0.580 % of the next $50 billion,
0.560 % of the next $50 billion,
0.550 % of the next $100 billion and
0.545 % of any excess thereafter.
In addition, the monthly management fee consists of the monthly base fee plus or minus a performance adjust-ment for the month. The performance adjustment is determined based on performance over the thirty-six month period then ended. Each month, the performance adjustment is calculated by multiplying the perfor-mance adjustment rate and the fund’s average net assets over the performance period and dividing the result by twelve. The resulting dollar amount is added to, or subtracted from the base fee for that month. The perfor-mance adjustment rate is equal to 0.03 multiplied by the difference between the fund’s annualized performance (measured by the fund’s class A shares) and the annualized performance of the Russell 2000 Growth Index each measured over the performance period. The maximum annualized performance adjustment rate is +/– 0.18%. The monthly base fee is determined based on the fund’s average net assets for the month, while the performance adjustment is determined based on the fund’s average net assets over the thirty-six month performance period. This means it is possible that, if the fund underperforms significantly over the performance period, and the fund’s

Small Cap Growth Fund 39
assets have declined significantly over that period, the negative performance adjustment may exceed the base fee. In this event, Putnam Management would make a payment to the fund.
Because the performance adjustment is based on the fund’s performance relative to its applicable benchmark index, and not its absolute performance, the performance adjustment could increase Putnam Management’s fee even if the fund’s shares lose value during the performance period provided that the fund outperformed its benchmark index, and could decrease Putnam Management’s fee even if the fund’s shares increase in value during the performance period provided that the fund underperformed its benchmark index.
For the reporting period, the management fee represented an effective rate (excluding the impact of any expense waiver in effect) of 0.725% of the fund’s average net assets, which included an effective base fee of 0.614% and an increase of 0.111% ($817,855) based on performance.
Putnam Management has contractually agreed, through October 30, 2022, to waive fees and/or reimburse the fund’s expenses to the extent necessary to limit the cumulative expenses of the fund, exclusive of brokerage, interest, taxes, investment-related expenses, extraordinary expenses, acquired fund fees and expenses and payments under the fund’s investor servicing contract, investment management contract and distribution plans, on a fiscal year-to-date basis to an annual rate of 0.20% of the fund’s average net assets over such fiscal year-to-date period. During the reporting period, the fund’s expenses were not reduced as a result of this limit.
Putnam Investments Limited (PIL), an affiliate of Putnam Management, is authorized by the Trustees to manage a separate portion of the assets of the fund as determined by Putnam Management from time to time. PIL did not manage any portion of the assets of the fund during the reporting period. If Putnam Management were to engage the services of PIL, Putnam Management would pay a quarterly sub-management fee to PIL for its services at an annual rate of 0.35% of the average net assets of the portion of the fund managed by PIL.
The fund reimburses Putnam Management an allocated amount for the compensation and related expenses of certain officers of the fund and their staff who provide administrative services to the fund. The aggregate amount of all such reimbursements is determined annually by the Trustees.
Custodial functions for the fund’s assets are provided by State Street. Custody fees are based on the fund’s asset level, the number of its security holdings and transaction volumes.
Putnam Investor Services, Inc., an affiliate of Putnam Management, provides investor servicing agent functions to the fund. Putnam Investor Services, Inc. received fees for investor servicing for class A, class B, class C, class R and class Y shares that included (1) a per account fee for each direct and underlying non-defined contribution account (retail account) of the fund; (2) a specified rate of the fund’s assets attributable to defined contribu-tion plan accounts; and (3) a specified rate based on the average net assets in retail accounts. Putnam Investor Services, Inc. has agreed that the aggregate investor servicing fees for each fund’s retail and defined contribution accounts for these share classes will not exceed an annual rate of 0.25% of the fund’s average assets attributable to such accounts.
Class R6 shares paid a monthly fee based on the average net assets of class R6 shares at an annual rate of 0.05%.
During the reporting period, the expenses for each class of shares related to investor servicing fees were as follows:
Class A $915,538
Class B 11,352
Class C 30,302
Class R 35,859
Class R6 21,834
Class Y 252,719
Total $1,267,604
The fund has entered into expense offset arrangements with Putnam Investor Services, Inc. and State Street whereby Putnam Investor Services, Inc.’s and State Street’s fees are reduced by credits allowed on cash balances. For the reporting period, the fund’s expenses were reduced by $1,486 under the expense offset arrangements.
Each Independent Trustee of the fund receives an annual Trustee fee, of which $549, as a quarterly retainer, has been allocated to the fund, and an additional fee for each Trustees meeting attended. Trustees also are reimbursed for expenses they incur relating to their services as Trustees.
The fund has adopted a Trustee Fee Deferral Plan (the Deferral Plan) which allows the Trustees to defer the receipt of all or a portion of Trustees fees payable on or after July 1, 1995. The deferred fees remain invested in certain Putnam funds until distribution in accordance with the Deferral Plan.
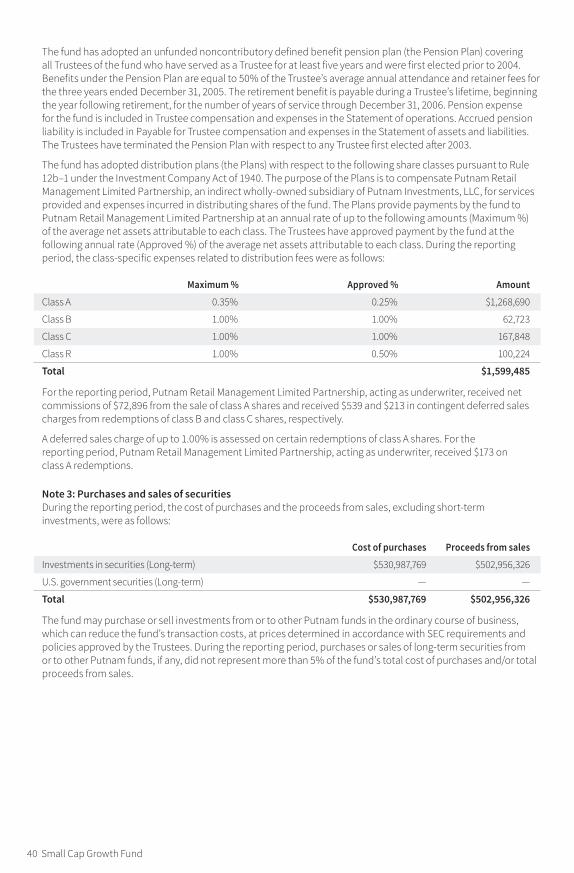
40 Small Cap Growth Fund
The fund has adopted an unfunded noncontributory defined benefit pension plan (the Pension Plan) covering all Trustees of the fund who have served as a Trustee for at least five years and were first elected prior to 2004. Benefits under the Pension Plan are equal to 50% of the Trustee’s average annual attendance and retainer fees for the three years ended December 31, 2005. The retirement benefit is payable during a Trustee’s lifetime, beginning the year following retirement, for the number of years of service through December 31, 2006. Pension expense for the fund is included in Trustee compensation and expenses in the Statement of operations. Accrued pension liability is included in Payable for Trustee compensation and expenses in the Statement of assets and liabilities. The Trustees have terminated the Pension Plan with respect to any Trustee first elected after 2003.
The fund has adopted distribution plans (the Plans) with respect to the following share classes pursuant to Rule 12b–1 under the Investment Company Act of 1940. The purpose of the Plans is to compensate Putnam Retail Management Limited Partnership, an indirect wholly-owned subsidiary of Putnam Investments, LLC, for services provided and expenses incurred in distributing shares of the fund. The Plans provide payments by the fund to Putnam Retail Management Limited Partnership at an annual rate of up to the following amounts (Maximum %) of the average net assets attributable to each class. The Trustees have approved payment by the fund at the following annual rate (Approved %) of the average net assets attributable to each class. During the reporting period, the class-specific expenses related to distribution fees were as follows:
Maximum % Approved % Amount
Class A 0.35 % 0.25 % $1,268,690
Class B 1.00 % 1.00 % 62,723
Class C 1.00 % 1.00 % 167,848
Class R 1.00 % 0.50 % 100,224
Total $1,599,485
For the reporting period, Putnam Retail Management Limited Partnership, acting as underwriter, received net commissions of $72,896 from the sale of class A shares and received $539 and $213 in contingent deferred sales charges from redemptions of class B and class C shares, respectively.
A deferred sales charge of up to 1.00% is assessed on certain redemptions of class A shares. For the reporting period, Putnam Retail Management Limited Partnership, acting as underwriter, received $173 on class A redemptions.
Note 3: Purchases and sales of securitiesDuring the reporting period, the cost of purchases and the proceeds from sales, excluding short-term investments, were as follows:
Cost of purchases Proceeds from sales
Investments in securities (Long-term ) $530,987,769 $502,956,326
U.S. government securities (Long-term ) — —
Total $530,987,769 $502,956,326
The fund may purchase or sell investments from or to other Putnam funds in the ordinary course of business, which can reduce the fund’s transaction costs, at prices determined in accordance with SEC requirements and policies approved by the Trustees. During the reporting period, purchases or sales of long-term securities from or to other Putnam funds, if any, did not represent more than 5% of the fund’s total cost of purchases and/or total proceeds from sales.
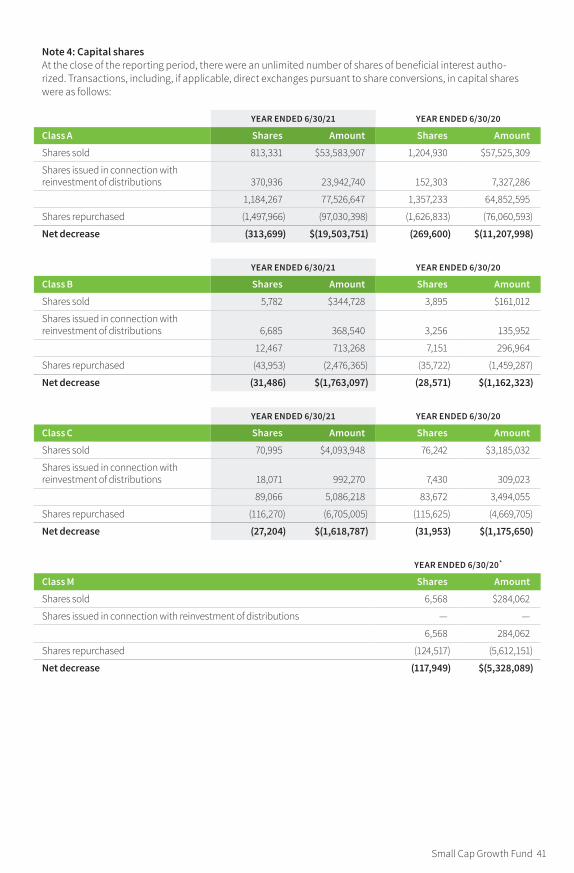
Small Cap Growth Fund 41
Note 4: Capital sharesAt the close of the reporting period, there were an unlimited number of shares of beneficial interest autho-rized. Transactions, including, if applicable, direct exchanges pursuant to share conversions, in capital shares were as follows:
YEAR ENDED 6/30/21 YEAR ENDED 6/30/20
Class A Shares Amount Shares Amount
Shares sold 813,331 $53,583,907 1,204,930 $57,525,309
Shares issued in connection with reinvestment of distributions 370,936 23,942,740 152,303 7,327,286
1,184,267 77,526,647 1,357,233 64,852,595
Shares repurchased (1,497,966 ) (97,030,398 ) (1,626,833 ) (76,060,593 )
Net decrease (313,699 ) $(19,503,751 ) (269,600 ) $(11,207,998 )
YEAR ENDED 6/30/21 YEAR ENDED 6/30/20
Class B Shares Amount Shares Amount
Shares sold 5,782 $344,728 3,895 $161,012
Shares issued in connection with reinvestment of distributions 6,685 368,540 3,256 135,952
12,467 713,268 7,151 296,964
Shares repurchased (43,953 ) (2,476,365 ) (35,722 ) (1,459,287 )
Net decrease (31,486 ) $(1,763,097 ) (28,571 ) $(1,162,323 )
YEAR ENDED 6/30/21 YEAR ENDED 6/30/20
Class C Shares Amount Shares Amount
Shares sold 70,995 $4,093,948 76,242 $3,185,032
Shares issued in connection with reinvestment of distributions 18,071 992,270 7,430 309,023
89,066 5,086,218 83,672 3,494,055
Shares repurchased (116,270 ) (6,705,005 ) (115,625 ) (4,669,705 )
Net decrease (27,204 ) $(1,618,787 ) (31,953 ) $(1,175,650 )
YEAR ENDED 6/30/20 *
Class M Shares Amount
Shares sold 6,568 $284,062
Shares issued in connection with reinvestment of distributions — —
6,568 284,062
Shares repurchased (124,517 ) (5,612,151 )
Net decrease (117,949 ) $(5,328,089 )

42 Small Cap Growth Fund
YEAR ENDED 6/30/21 YEAR ENDED 6/30/20
Class R Shares Amount Shares Amount
Shares sold 201,839 $12,618,524 80,709 $3,688,661
Shares issued in connection with reinvestment of distributions 17,780 1,097,027 5,074 234,430
219,619 13,715,551 85,783 3,923,091
Shares repurchased (130,812 ) (8,361,028 ) (121,785 ) (5,581,946 )
Net increase (decrease ) 88,807 $5,354,523 (36,002 ) $(1,658,855 )
YEAR ENDED 6/30/21 YEAR ENDED 6/30/20
Class R6 Shares Amount Shares Amount
Shares sold 478,929 $34,193,980 190,975 $9,515,508
Shares issued in connection with reinvestment of distributions 28,320 1,924,031 7,517 378,180
507,249 36,118,011 198,492 9,893,688
Shares repurchased (173,549 ) (12,459,083 ) (174,110 ) (8,550,149 )
Net increase 333,700 $23,658,928 24,382 $1,343,539
YEAR ENDED 6/30/21 YEAR ENDED 6/30/20
Class Y Shares Amount Shares Amount
Shares sold 1,826,103 $126,772,160 1,099,148 $53,559,476
Shares issued in connection with reinvestment of distributions 93,341 6,294,944 22,025 1,101,890
1,919,444 133,067,104 1,121,173 54,661,366
Shares repurchased (1,061,396 ) (74,556,406 ) (700,732 ) (34,053,324 )
Net increase 858,048 $58,510,698 420,441 $20,608,042
* Effective November 25, 2019, the fund converted all of its class M shares to class A shares and class M shares were no longer able to be purchased.

Small Cap Growth Fund 43
Note 5: Affiliated transactionsTransactions during the reporting period with any company which is under common ownership or control were as follows:
Name of affiliateFair value as
of 6/30/20Purchase
costSale
proceedsInvestment
income
Shares outstanding
and fair value as
of 6/30/21
Short-term investments
Putnam Cash Collateral Pool, LLC * $88,379,676 $544,889,185 $530,525,697 $147,109 $102,743,164
Putnam Short Term Investment Fund * * 8,152,813 211,618,279 206,002,965 21,356 13,768,127
Total Short-term investments $96,532,489 $756,507,464 $736,528,662 $168,465 $116,511,291
* No management fees are charged to Putnam Cash Collateral Pool, LLC (Note 1). Investment income shown is included in securities lending income on the Statement of operations. There were no realized or unrealized gains or losses during the period.
** Management fees charged to Putnam Short Term Investment Fund have been waived by Putnam Management. There were no realized or unrealized gains or losses during the period.
Note 6: Market, credit and other risksIn the normal course of business, the fund trades financial instruments and enters into financial transactions where risk of potential loss exists due to changes in the market (market risk) or failure of the contracting party to the transaction to perform (credit risk). The fund may be exposed to additional credit risk that an institution or other entity with which the fund has unsettled or open transactions will default. Investments in foreign securities involve certain risks, including those related to economic instability, unfavorable political developments, and currency fluctuations.
Beginning in January 2020, global financial markets have experienced, and may continue to experience, signifi-cant volatility resulting from the spread of a virus known as Covid–19. The outbreak of Covid–19 has resulted in travel and border restrictions, quarantines, supply chain disruptions, lower consumer demand, and general market uncertainty. The effects of Covid–19 have adversely affected, and may continue to adversely affect, the global economy, the economies of certain nations, and individual issuers, all of which may negatively impact the fund’s performance.

44 Small Cap Growth Fund
Federal tax information (Unaudited)
Pursuant to §852 of the Internal Revenue Code, as amended, the fund hereby designates $120,414,344 as a capital gain dividend with respect to the taxable year ended June 30, 2021, or, if subsequently determined to be different, the net capital gain of such year.
The fund designated 3.38% of ordinary income distributions as qualifying for the dividends received deduction for corporations.
For the reporting period, the fund hereby designates 4.35%, or the maximum amount allowable, of its taxable ordinary income distributions as qualified dividends taxed at the individual net capital gain rates.
The Form 1099 that will be mailed to you in January 2022 will show the tax status of all distributions paid to your account in calendar 2021.

About the TrusteesINDEPENDENT TRUSTEES
Liaquat Ahamed Born 1952, Trustee since 2012Principal occupations during past five years: Author; won Pulitzer Prize for Lords of Finance: The Bankers Who Broke
the World.
Other directorships: Chairman of the Sun Valley Writers Conference, a literary not-for-profit organization, and a Trustee of the Journal of Philosophy.
Ravi AkhouryBorn 1947, Trustee since 2009Principal occupations during past five years: Private investor
Other directorships: Director of English Helper, Inc., a private software company; Trustee of the Rubin Museum, serving on the Investment Committee; and previously a Director of RAGE Frameworks, Inc.
Barbara M. Baumann Born 1955, Trustee since 2010Principal occupations during past five years: President of Cross Creek Energy Corporation, a strategic
consultant to domestic energy firms and direct investor in energy projects.
Other directorships: Director of Devon Energy Corporation, a publicly traded independent natural gas and oil exploration and production company; Director of National Fuel Gas Company, a publicly traded energy company that engages in the production, gathering, transportation, distribution, and marketing of natural gas; Senior Advisor to the energy private equity firm First Reserve; Director of Ascent Resources, LLC, a private independent exploration and production company; Director of Texas American Resources Company II, a private, independent oil and gas exploration and production company; member of the Finance Committee of the Children’s Hospital of Colorado; member of the Investment Committee of the Board of The Denver Foundation; and previously a Director of publicly traded companies Buckeye Partners LP, UNS Energy Corporation, CVR Energy Company, and SM Energy Corporation.
Katinka DomotorffyBorn 1975, Trustee since 2012Principal occupations during past five years: Voting member of the Investment Committees of the Anne Ray Foundation
and Margaret A. Cargill Foundation, part of the Margaret A. Cargill Philanthropies.
Other directorships: Director of the Great Lakes Science Center and of College Now Greater Cleveland.
Catharine Bond HillBorn 1954, Trustee since 2017Principal occupations during past five years: Managing Director of Ithaka S+R, a not-for-profit service that
helps the academic community navigate economic and technological change. From 2006 to 2016, the 10th president of Vassar College.
Other directorships: Director of Yale-NUS College and Trustee of Yale University.
Paul L. JoskowBorn 1947, Trustee since 1997Principal occupations during past five years: The Elizabeth and James Killian Professor of Economics, Emeritus at the
Massachusetts Institute of Technology (MIT). From 2008 to 2017, the President of the Alfred P. Sloan Foundation, a philanthropic institution focused primarily on research and education on issues related to science, technology, and economic performance.
Other directorships: Vice Chair of the Board of Directors of the Whitehead Institute for Biomedical Research, a non-profit biomedical research institute; a Director of Exelon Corporation, an energy company focused on power services; and a member Emeritus of the Board of Advisors of the Boston Symphony Orchestra.
Kenneth R. LeiblerBorn 1949, Trustee since 2006 Vice Chair from 2016 to 2018, and Chair since 2018Principal occupations during past
five years: Vice Chairman Emeritus of the Board of Trustees of Beth Israel Deaconess Hospital in Boston. Member of the Investment Committee of the Boston Arts Academy Foundation.
Other directorships: Director of Eversource Corporation, which operates New England’s largest energy delivery system; previously the Chairman of the Boston Options Exchange, an electronic market place for the trading of listed derivatives securities; previously the Chairman and Chief Executive Officer of the Boston Stock Exchange; and previously the President and Chief Operating Officer of the American Stock Exchange.
Small Cap Growth Fund 45

George Putnam, IIIBorn 1951, Trustee since 1984Principal occupations during past five years: Chairman of New Generation Research, Inc., a publisher of financial
advisory and other research services, and President of New Generation Advisors, LLC, a registered investment adviser to private funds.
Other directorships: Director of The Boston Family Office, LLC, a registered investment advisor; a Trustee of the Gloucester Marine Genomics Institute; previously a Trustee of the Marine Biological Laboratory; and previously a Trustee of Epiphany School.
Manoj P. SinghBorn 1952, Trustee since 2017Principal occupations during past five years: Until 2015, Chief Operating Officer and Global Managing Director at
Deloitte Touche Tohmatsu, Ltd., a global professional services organization, serving on the Deloitte U.S. Board of Directors and the boards of Deloitte member firms in China, Mexico, and Southeast Asia.
Other directorships: Director of Abt Associates, a global research firm working in the fields of health, social and environmental policy, and international development; Trustee of Carnegie Mellon University; Director of Pratham USA, an organization dedicated to children’s education in India; member of the advisory board of Altimetrik, a business transformation and technology solutions firm; and Director of DXC Technology, a global IT services and consulting company.
Mona K. SutphenBorn 1967, Trustee since 2020Principal occupations during past five years: Senior Advisor at The Vistria Group, a private investment firm focused
on middle-market companies in the healthcare, education, and financial services industries. From 2014 to 2018, Partner at Macro Advisory Partners, a global consulting firm.
Other directorships: Director of Unitek Learning, a private nursing and medical services education provider in the United States; Director of Pattern Energy Group LP, a private renewable energy company; previous Director of Pattern Energy, a publicly traded renewable energy company; Board Member, International Rescue Committee; Co-Chair of the Board of Human Rights First; Trustee of Mount Holyoke College; and member of the Advisory Board for the Center on Global Energy Policy at Columbia University’s School of International and Public Affairs.
INTERESTED TRUSTEE
Robert L. Reynolds*
Trustee since 2008 and President and Chief Executive Officer of Putnam Investments since 2008
Principal occupations during past five years: President and Chief Executive Officer of Putnam Investments; President and Chief Executive Officer of Great-West Financial, a financial services company that provides retirement savings plans, life insurance, and annuity and executive benefits products; President and Chief Executive Officer of Great-West Lifeco U.S. Inc., a holding company that owns Putnam Investments and Great-West Financial; and member of Putnam Investments’ and Great-West Financial’s Board of Directors.
Other directorships: Director of West Virginia University Foundation; director of the Concord Museum; director of Dana-Farber Cancer Institute; Chairman of Massachusetts Competitive Partnership; director of Boston Chamber of Commerce; member of the Chief Executives Club of Boston; member of the National Innovation Initiative; member of the Massachusetts General Hospital President’s Council; member of the Council on Competitiveness; and previously the President of the Commercial Club of Boston.
* Mr. Reynolds is an “interested person” (as defined in the Investment Company Act of 1940) of the fund and Putnam Investments. He is President and Chief Executive Officer of Putnam Investments, as well as the President of your fund and each of the other Putnam funds.
The address of each Trustee is 100 Federal Street, Boston, MA 02110.
As of June 30, 2021, there were 100 Putnam funds. All Trustees serve as Trustees of all Putnam funds.
Each Trustee serves for an indefinite term, until his or her resignation, retirement at age 75, removal, or death.
46 Small Cap Growth Fund

The principal occupations of the officers for the past five years have been with the employers as shown above, although in some cases they have held different positions with such employers. The address of each officer is 100 Federal Street, Boston, MA 02110.
OfficersIn addition to Robert L. Reynolds, the other officers of the fund are shown below:
James F. Clark (Born 1974)Vice President and Chief Compliance OfficerSince 2016Chief Compliance Officer and Chief Risk Officer, Putnam Investments and Chief Compliance Officer, Putnam Management
Nancy E. Florek (Born 1957)Vice President, Director of Proxy Voting and Corporate Governance, Assistant Clerk, and Assistant TreasurerSince 2000
Michael J. Higgins (Born 1976)Vice President, Treasurer, and ClerkSince 2010
Jonathan S. Horwitz (Born 1955)Executive Vice President, Principal Executive Officer, and Compliance LiaisonSince 2004
Richard T. Kircher (Born 1962)Vice President and BSA Compliance OfficerSince 2019Assistant Director, Operational Compliance, Putnam Investments and Putnam Retail Management
Susan G. Malloy (Born 1957)Vice President and Assistant TreasurerSince 2007Head of Accounting and Middle Office Services, Putnam Investments and Putnam Management
Denere P. Poulack (Born 1968)Assistant Vice President, Assistant Clerk, and Assistant TreasurerSince 2004
Janet C. Smith (Born 1965)Vice President, Principal Financial Officer, Principal Accounting Officer, and Assistant TreasurerSince 2007Head of Fund Administration Services, Putnam Investments and Putnam Management
Stephen J. Tate (Born 1974)Vice President and Chief Legal OfficerSince 2021General Counsel, Putnam Investments, Putnam Management, and Putnam Retail Management
Mark C. Trenchard (Born 1962)Vice PresidentSince 2002Director of Operational Compliance, Putnam Investments and Putnam Retail Management
Small Cap Growth Fund 47
48 Small Cap Growth Fund
Services for shareholders
Investor services
Systematic investment plan Tell us how much you wish to invest regularly — weekly, semimonthly, or monthly — and the amount you choose will be transferred automatically from your checking or savings account. There’s no additional fee for this service, and you can suspend it at any time. This plan may be a great way to save for college expenses or to plan for your retirement.
Please note that regular investing does not guarantee a profit or protect against loss in a declining market. Before arranging a system-atic investment plan, consider your financial ability to continue making purchases in periods when prices are low.
Systematic exchange You can make regular transfers from one Putnam fund to another Putnam fund. There are no additional fees for this service, and you can cancel or change your options at any time.
Dividends PLUS You can choose to have the dividend distributions from one of your Putnam funds automatically reinvested in another Putnam fund at no additional charge.
Free exchange privilege You can exchange money between Putnam funds free of charge, as long as they are the same class of shares. A signature guarantee is required if you are exchanging more than $500,000. The fund reserves the right to revise or terminate the exchange privilege.
Reinstatement privilege If you’ve sold Putnam shares or received a check for a divi-dend or capital gain, you may reinvest the proceeds with Putnam within 90 days of the
transaction and they will be reinvested at the fund’s current net asset value — with no sales charge. However, reinstatement of class B shares may have special tax consequences. Ask your financial or tax representative for details.
Check-writing service You have ready access to many Putnam accounts. It’s as simple as writing a check, and there are no special fees or service charges. For more information about the check-writing service, call Putnam or visit our website.
Dollar cost averaging When you’re investing for long-term goals, it’s time, not timing, that counts. Investing on a systematic basis is a better strategy than trying to figure out when the markets will go up or down. This means investing the same amount of money regularly over a long period. This method of investing is called dollar cost averaging. When a fund’s share price declines, your investment dollars buy more shares at lower prices. When it increases, they buy fewer shares. Over time, you will pay a lower average price per share.
For more information
Visit the Individual Investors section at putnam.com A secure section of our website contains complete information on your account, including balances and transac-tions, updated daily. You may also conduct transactions, such as exchanges, additional investments, and address changes. Log on today to get your password.
Call us toll free at 1-800-225-1581 Ask a helpful Putnam representative or your financial advisor for details about any of these or other services, or see your prospectus.
Fund informationFounded over 80 years ago, Putnam Investments was built around the concept that a balance between risk and reward is the hallmark of a well-rounded financial program. We manage funds across income, value, blend, growth, sustainable, asset allocation, absolute return, and global sector categories.
Investment ManagerPutnam Investment Management, LLC 100 Federal Street Boston, MA 02110
Investment Sub-AdvisorPutnam Investments Limited 16 St James’s Street London, England SW1A 1ER
Marketing ServicesPutnam Retail Management 100 Federal Street Boston, MA 02110
CustodianState Street Bank and Trust Company
Legal CounselRopes & Gray LLP
Independent Registered Public Accounting FirmPricewaterhouseCoopers LLP
TrusteesKenneth R. Leibler, Chair Liaquat Ahamed Ravi Akhoury Barbara M. Baumann Katinka Domotorffy Catharine Bond Hill Paul L. Joskow George Putnam, III Robert L. Reynolds Manoj P. Singh Mona K. Sutphen
OfficersRobert L. Reynolds President
James F. Clark Vice President, Chief Compliance Officer, and Chief Risk Officer
Nancy E. Florek Vice President, Director of Proxy Voting and Corporate Governance, Assistant Clerk, and Assistant Treasurer
Michael J. Higgins Vice President, Treasurer, and Clerk
Jonathan S. Horwitz Executive Vice President, Principal Executive Officer, and Compliance Liaison
Richard T. Kircher Vice President and BSA Compliance Officer
Susan G. Malloy Vice President and Assistant Treasurer
Denere P. Poulack Assistant Vice President, Assistant Clerk, and Assistant Treasurer
Janet C. Smith Vice President, Principal Financial Officer, Principal Accounting Officer, and Assistant Treasurer
Stephen J. Tate Vice President and Chief Legal Officer
Mark C. Trenchard Vice President
This report is for the information of shareholders of Putnam Small Cap Growth Fund. It may also be used as sales literature when preceded or accompanied by the current prospectus, the most recent copy of Putnam’s Quarterly Performance Summary, and Putnam’s Quarterly Ranking Summary. For more recent performance, please visit putnam.com. Investors should carefully consider the investment objectives, risks, charges, and expenses of a fund, which are described in its prospectus. For this and other information or to request a prospectus or summary prospectus, call 1-800-225-1581 toll free. Please read the prospectus carefully before investing. The fund’s Statement of Additional Information contains additional information about the fund’s Trustees and is available without charge upon request by calling 1-800-225-1581.

AN07
6 32
6403
8/
21