SMALL BUSINESS DEVELOPMENT - National Treasury budget/2015... · Overview contains this narrative...
26
VOTE 31 ESTIMATES OF NATIONAL EXPENDITURE Photos provided by GCIS. SMALL BUSINESS DEVELOPMENT
Transcript of SMALL BUSINESS DEVELOPMENT - National Treasury budget/2015... · Overview contains this narrative...
VOTE 31ESTIMATES OF NATIONAL EXPENDITURE
Photos provided by GCIS.
SMALL BUSINESS DEVELOPMENT


Estimates of
National Expenditure
2015
National Treasury
Republic of South Africa
25 February 2015

ISBN: 978-0-621-43285-5 RP: 08/2015 The 2015 Estimates of National Expenditure e-publications are compiled with the latest available information from departmental and other sources. Some of this information is unaudited or subject to revision. The Estimates of National Expenditure e-publications for individual votes are available on www.treasury.gov.za. Compared to the abridged version of the 2015 ENE, the 2015 ENE e-publications provide more detailed information, including on goods and services, transfers and subsidies, as well as on programme specific personnel expenditure. The abridged version of the ENE contains one additional table at the end of a chapter that shows expenditure on infrastructure, whereas the vote ENE e-publications’ additional tables also contain summaries of expenditure on conditional allocations to provinces and municipalities; departmental public private partnerships; and donor funding. Budget information is also provided for the public entities that are not shown in detail in the abridged publication. In some e-publications more detailed information at the level of site service delivery is included.

Foreword
Some of the tough economic conditions occasioned by the 2008 to 2009 global financial crisis continue to plague most parts of the world: Economic growth remains sluggish, unemployment and inequality levels are elevated, while financial markets tend to reposition themselves substantially at the slightest sign of unsettling news. As an open economy, South Africa is highly susceptible to global economic developments, often disproportionately so. In the face of all of this, the 2015 Medium Term Expenditure Framework (MTEF) response provides for positive real growth in expenditure averaging 2.1 per cent per year. The annual budget reaches R1.6 trillion by 2017/18.
True to the commitment government made in the Medium Term Budget Policy Statement (MTBPS) in October 2014, the budget framework sets out departmental programmes and plans that fit within the broad expenditure envelope published last year. To keep our fiscal accounts firmly on a sustainable path, the MTBPS proposed a fiscal policy package that has trimmed overall spending by R25 billion, which is the combined amount for 2015/16 and 2016/17. Government spending does continue to surpass inflation after these adjustments in both years, but growth is marginally slower. In addition, for 2017/18, R45 billion is placed in an unallocated reserve to cushion our plans against unforeseeable eventualities. Further, to achieve our fiscal objectives, government has had to institute carefully selected tax measures too. These are implemented within the framework of a progressive tax system and have been informed by the work of the Davies Tax Committee. The tax proposals are set out in detail in chapter 4 of the Budget Review.
The process of realigning expenditure in response to the closing of the fiscal space is being actively managed, in the context of government’s 2014-2019 medium term strategic framework. Some of our aspirations might take longer to realise. Within government’s institutions, more urgent and essential existing programmes are being prioritised above other programmes that are reduced. The implementation of some newly proposed programmes will either be phased in over a longer period or, in some cases, possibly even delayed. Social sector spending and key infrastructure spending, as well as other key areas of spending, continue to grow in real terms.
In addition to the reprioritisation of government programmes, the policy frameworks and implementation methodology of programmes are being re-evaluated, with a focus on service delivery of programmes. In line with the 2013/14 National Treasury instruction on cost containment measures, financing programmes must entail a greater share of goods and services budgets being devoted towards core areas of service delivery. The focus of government programmes is being sharpened, both in terms of spatial distribution, and in terms of their nature and emphasis. Effectiveness and efficiency of expenditure is our guiding mantra.
The spending plans contained in the 2015 Budget do respond to our short term needs for economic growth. However, to achieve our ambition of faster growth, which we unquestionably need for pushing back the frontiers of unemployment, poverty and inequality, we must continue to strive towards shifting the composition of expenditure more towards investment, away from consumption. Institutional spending, as always, is being closely monitored, and the ongoing process of realignment continues. The details of the spending of national government departments and its entities are encompassed in the chapters of this publication.
All the expenditure and service delivery information contained in the chapters of this publication result from a wide ranging intergovernmental consultative process, leading to executive approval of reprioritised and realigned spending allocations. Many people have contributed to making this publication possible, particularly my colleagues in national departments and agencies. Their collaboration and understanding during the budget allocation and document drafting processes has been invaluable. Appreciation is also due to the dedicated team at National Treasury for the publication of this highly valuable resource.
Lungisa Fuzile Director-General: National Treasury


Introduction
The Estimates of National Expenditure publications
The Estimates of national Expenditure (ENE) publications provide comprehensive information on how budget resources are generated, how institutions have spent their budgets in previous years, and how institutions plan to spend the resources allocated to them over the MTEF period. Key performance indicators are included for each national government vote and entity showing what the institutions aim to achieve by spending their budget allocations in a particular manner. This information provides Parliament and the public with the necessary tools to hold government accountable against the 14 outcomes set out in the 2014-2019 medium term strategic framework.
The 2015 ENE publications largely retain the scope of information presented in previous years’ publications. For ease of comprehension, however, in the 2015 publications information is presented in a more succinct and concise manner in data tables and their accompanying explanatory narratives. The reader can thus more readily understand what each institution is planning to spend its budget on and what it aims to achieve. Each chapter in the abridged 2015 ENE publication relates to a specific budget vote. A separate, more detailed, e-publication is also available for each vote.
Compared to the abridged version of the 2015 ENE, the 2015 ENE e-publications provide more detailed information, including on goods and services, transfers and subsidies, as well as on programme specific personnel expenditure. The abridged version of the ENE contains one additional table at the end of a chapter that shows expenditure on infrastructure, whereas the vote ENE e-publications’ additional tables also contain summaries of expenditure on conditional allocations to provinces and municipalities; departmental public private partnerships; and donor funding. Budget information is also provided for the public entities that are not shown in detail in the abridged publication. In some e-publications more detailed information at the level of site service delivery is included.
A separate 2015 ENE Overview e-publication is also available, which contains a description at the main budget non-interest spending level, summarising the ENE publication information across votes. The 2015 ENE Overview contains this narrative explanation and summary tables; a description of the budgeting approach; and also has a write-up on how to interpret the information that is contained in each section of the publications.


Small Business Development
National Treasury
Republic of South Africa

Contents
Budget summary ................................................................................................................................ 1
Vote purpose ....................................................................................................................................... 1
Mandate ............................................................................................................................................... 1
Selected performance indicators ...................................................................................................... 1
Expenditure analysis .......................................................................................................................... 2
Expenditure trends ............................................................................................................................. 3
Expenditure estimates ....................................................................................................................... 4
Personnel information ....................................................................................................................... 5
Programme 1: Administration ........................................................................................................... 5
Programme 2: Cooperatives Support and Development ................................................................ 6
Programme 3: Enterprise Development and Entrepreneurship ..................................................... 8
Public entities and other agencies .................................................................................................. 10
1
Vote 31 Small Business Development Budget summary
2015/16 2016/17 2017/18
R million Total Current
payments Transfers and
subsidies Payments for capital assets Total Total
MTEF allocation Administration 64.0 63.5 – 0.6 66.6 69.1Cooperatives Support and Development
15.2 15.0 – 0.2 16.1 16.7
Enterprise Development and Entrepreneurship
1 024.0 87.7 935.8 0.4 1 042.5 1 171.5
Total expenditure estimates 1 103.2 166.2 935.8 1.1 1 125.2 1 257.4Executive authority Minister of Small Business Development Accounting officer Director General of Small Business Development Website address – The Estimates of National Expenditure e-publications for individual votes are available on www.treasury.gov.za. These publications provide more comprehensive coverage of vote specific information, particularly about goods and services, transfers and subsidies, personnel, public entities, donor funding, public private partnerships, conditional allocations to provinces and municipalities and expenditure information at the level of service delivery, where appropriate.
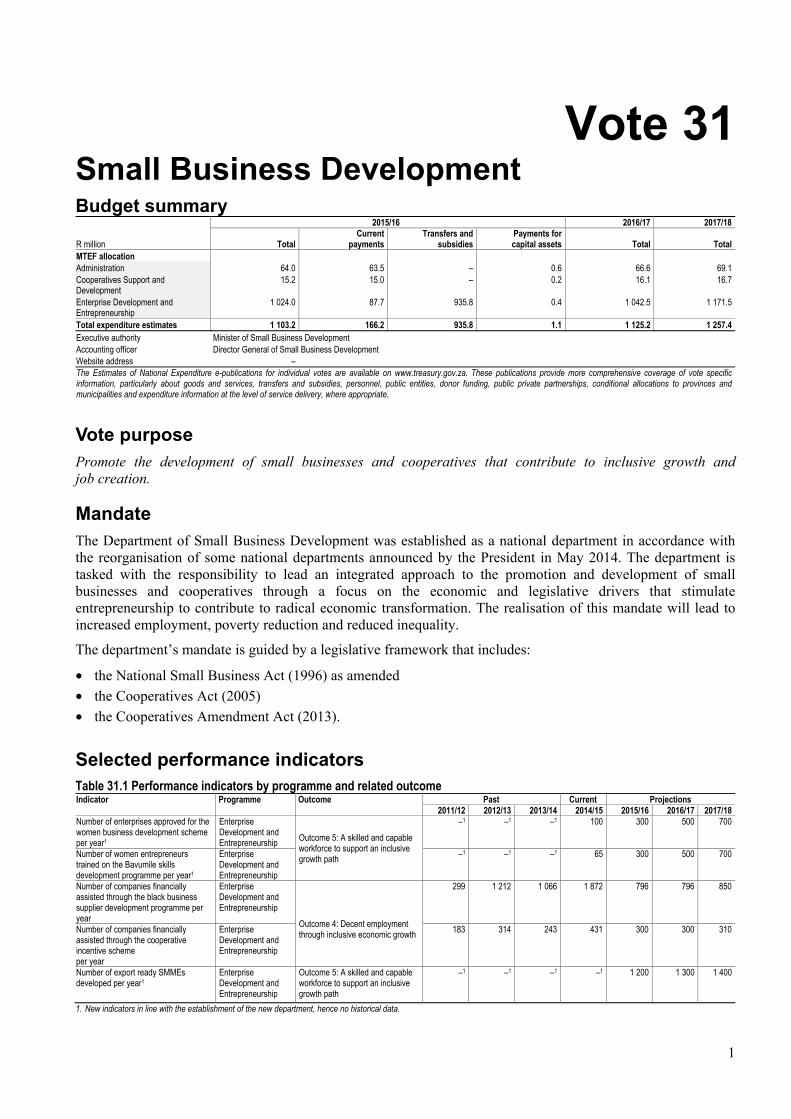
Vote purpose Promote the development of small businesses and cooperatives that contribute to inclusive growth and job creation.
Mandate The Department of Small Business Development was established as a national department in accordance with the reorganisation of some national departments announced by the President in May 2014. The department is tasked with the responsibility to lead an integrated approach to the promotion and development of small businesses and cooperatives through a focus on the economic and legislative drivers that stimulate entrepreneurship to contribute to radical economic transformation. The realisation of this mandate will lead to increased employment, poverty reduction and reduced inequality.
The department’s mandate is guided by a legislative framework that includes:
• the National Small Business Act (1996) as amended
• the Cooperatives Act (2005)
• the Cooperatives Amendment Act (2013).
Selected performance indicators Table 31.1 Performance indicators by programme and related outcome Indicator Programme Outcome Past Current Projections 2011/12 2012/13 2013/14 2014/15 2015/16 2016/17 2017/18 Number of enterprises approved for the women business development scheme per year1
Enterprise Development and Entrepreneurship Outcome 5: A skilled and capable
workforce to support an inclusive growth path
–1 –1 –1 100 300 500 700
Number of women entrepreneurs trained on the Bavumile skills development programme per year1
Enterprise Development and Entrepreneurship
–1 –1 –1 65 300 500 700
Number of companies financially assisted through the black business supplier development programme per year
Enterprise Development and Entrepreneurship
Outcome 4: Decent employment through inclusive economic growth
299 1 212 1 066 1 872 796 796 850
Number of companies financially assisted through the cooperative incentive scheme per year
Enterprise Development and Entrepreneurship
183 314 243 431 300 300 310
Number of export ready SMMEs developed per year1
Enterprise Development and Entrepreneurship
Outcome 5: A skilled and capable workforce to support an inclusive growth path
–1 –1 –1 –1 1 200 1 300 1 400
1. New indicators in line with the establishment of the new department, hence no historical data.

2015 Estimates of National Expenditure
2
Expenditure analysis The national development plan articulates the important role of small businesses and cooperatives in achieving inclusive economic growth, and that these small enterprises are key to achieving the plan’s job creation target for 2030. The plan further identifies that regulatory compliance costs need to be reduced in order to transform the economy, for small businesses in particular. Against this background, a designated department to advance the interests and role of small businesses and cooperatives was established in 2014. The department’s work will contribute to outcome 4 of government’s medium term strategic framework: decent employment through inclusive economic growth, particularly sub-outcome 3, which deals with the elimination of unnecessary regulatory burdens and lower price increases for key inputs and wage goods.
The department will advocate for a conducive regulatory environment for small businesses and cooperatives to access finance, investment and markets, in an equitable and sustainable manner. The department provides various customised intervention programmes, designed to increase the sustainability of cooperatives so that they can contribute to the economy, particularly in the manufacturing, agro-processing, mining and services sector. By encouraging government procurement with small businesses and cooperatives, the department will facilitate their development and growth. It will facilitate partnerships with all spheres of government as well as the private sector to ensure mutual cooperation that will benefit small businesses and cooperatives.
The department’s total budget is R3.5 billion over the MTEF period, including a Cabinet approved additional allocation of R139.3 million to support the establishment of the department. Expenditure on compensation of employees is expected to grow by 13.3 per cent over the medium term as the department expands its personnel to 171 in 2017/18. 64.3 per cent of personnel will be in the Enterprise Development and Entrepreneurship programme to provide customised interventions to support small businesses and cooperatives. This is also where the bulk of the department’s spending over the medium term is, at R3.2 billion over the period. The Cooperative Support and Development programme funds the implementation of a new support model for cooperatives, including implementing the Cooperatives Amendment Act (2013). The programme’s budget over the medium term is R48 million.
Regulatory and institutional support for cooperatives Over the medium term, the department will finalise regulations for cooperatives to ensure that the Cooperatives Amendment Act (2013) will be properly implemented. The act aims to improve the failure rate of cooperatives and address past problems in cooperative governance, structures, compliance and sustainability. It will also improve coordination between national, provincial and local government to strengthen their support for cooperatives. The department will conclude transversal agreements with other government departments to enhance the implementation of the act in support of the growth of cooperatives. These activities are funded in the Cooperatives Support and Development programme.
Non-financial and financial support for small businesses and cooperatives
Transfers and subsidies account for 85.5 per cent of the department’s expenditure over the medium term. R2 billion, the bulk of this funding, is earmarked for the Small Enterprise Development Agency, which provides non-financial support services to small businesses and cooperatives, including business and technology incubation services in specific sectors, focusing on start-ups and enterprises that need rehabilitation. The department will also provide R686 million in incentives to small enterprises in the mining, manufacturing, agro-processing and services sectors through transfers to the black business supplier development programme, as well as R229 million to cooperatives through transfers to the cooperatives incentive scheme. Both these incentive initiatives are also funded in the Enterprise Development and Entrepreneurship programme. Over 3 000 small businesses and cooperatives are expected to be supported over the medium term by these incentives.
Women, youth and people with disabilities
The department supports the South African Women Entrepreneurs Network and the Isivande Women’s Fund through transfers in the Enterprise Development and Entrepreneurship programme. Over the medium term, these transfers total R83.6 million. The department’s Bavumile skills enhancement programme aims to enhance women’s existing skills to produce quality, commercially viable products for major local and international markets. Over the medium term, the programme prioritises the creative industries and women in rural areas and townships, and aims to train 1 500 women entrepreneurs, a significant increase from the 65 women that were trained in 2014/15. Women with craft skills such as sewing and beading are provided with specialist skills

Vote 31: Small Business Development
3
training and assistance in establishing their own enterprises and cooperatives. Funding is in the Enterprise Development and Entrepreneurship programme’s Gender, Youth and People with Disabilities Economic Empowerment subprogramme, which is allocated R154.9 million over the medium term. The department will facilitate the implementation of the Youth Black Business Supplier Development Programme which is intended to benefit 1 100 youth enterprises by 2017/18.
Expenditure trends Table 31.2 Vote expenditure trends by programme and economic classification Programmes 1. Administration 2. Cooperatives Support and Development 3. Enterprise Development and Entrepreneurship Programme
Ann
ual b
udge
t
Adj
uste
d
appr
opria
tion
Aud
ited
ou
tcom
e
Ann
ual b
udge
t
Adj
uste
d
appr
opria
tion
Aud
ited
ou
tcom
e
Ann
ual b
udge
t
Adj
uste
d
appr
opria
tion
Aud
ited
ou
tcom
e
Ann
ual b
udge
t
Adj
uste
d
appr
opria
tion
Rev
ised
es
timat
e
Out
com
e/A
nnua
l bu
dget
Ave
rage
(%
)
Out
com
e/A
djus
ted
ap
prop
riatio
n
Ave
rage
(%
)
R million 2011/12 2012/13 2013/14 2014/15 2011/12 - 2014/15 Programme 1 – – 10.7 – – 9.5 – 10.8 13.5 11.3 45.0 45.0 694.7% 140.9%Programme 2 – – 12.4 – – 10.4 – 14.1 13.5 11.8 12.2 12.2 409.7% 184.7%Programme 3 – – 712.4 – – 821.6 – 1 017.7 1 012.6 1 125.0 1 027.4 1 027.4 317.7% 174.8%Total – – 735.5 – – 841.6 – 1 042.6 1 039.5 1 148.1 1 084.6 1 084.6 322.4% 174.0%Change to 2014 Budget estimate
(63.6)
Economic classification Current payments – – 70.2 – – 75.9 – 89.1 87.1 95.5 130.7 130.7 381.1% 165.5%Compensation of employees
– – 40.3 – – 47.1 – 57.0 55.3 68.9 84.0 84.0 329.0% 160.8%
Goods and services – – 29.9 – – 28.9 – 32.1 31.8 26.6 46.8 46.8 516.3% 174.0%of which: Administrative fees – – 0.1 – – 0.2 – 0.3 0.2 0.2 0.2 0.2 360.3% 156.9%Advertising – – 0.1 – – 0.1 – 0.9 0.7 0.0 0.7 0.7 33360.0% 100.4%Assets less than the capitalisation threshold
– – 0.0 – – 0.0 – 0.0 0.0 0.0 0.0 0.0 940.0% 106.8%
Audit costs: External – – – – – – – – – – 1.0 1.0 – 100.0%Catering: Departmental activities
– – 0.2 – – 0.2 – 1.0 0.9 0.5 0.7 0.7 403.7% 119.3%
Communication – – 0.6 – – 0.6 – 0.8 0.7 0.8 0.9 0.9 352.0% 167.9%Consultants and professional services: Business and advisory services
– – 6.8 – – 3.2 – 2.6 1.5 2.6 4.5 4.5 603.5% 226.2%
Contractors – – 0.3 – – 0.6 – 2.5 2.2 0.9 4.1 4.1 765.1% 109.7%Agency and support / outsourced services
– – 0.3 – – – – 0.1 0.1 0.0 1.0 1.0 27480.0% 122.2%
Entertainment – – 0.0 – – 0.0 – 0.0 0.0 0.0 0.3 0.3 1500.0% 100.0%Fleet services (including government motor transport)
– – 0.1 – – 0.1 – 0.1 0.1 0.1 0.2 0.2 404.3% 140.8%
Consumable supplies – – 0.0 – – 0.0 – 0.0 0.0 0.0 0.1 0.1 1118.2% 153.8%Consumables: Stationery, printing and office supplies
– – 0.5 – – 0.4 – 0.5 0.4 1.0 2.2 2.2 363.8% 130.9%
Operating leases – – 0.6 – – 1.0 – 0.9 0.9 0.5 0.7 0.7 692.2% 201.9%Transport provided: Departmental activity
– – – – – – – – – 0.0 0.1 0.1 2000.0% 100.0%
Travel and subsistence – – 16.8 – – 17.9 – 18.9 20.6 14.7 19.2 19.2 506.0% 195.6%Training and development – – 0.2 – – 0.8 – 1.3 1.3 – 4.8 4.8 115.7%Operating payments – – 1.3 – – 0.2 – 1.2 0.7 2.0 4.0 4.0 320.8% 121.6%Venues and facilities – – 2.0 – – 3.4 – 1.0 1.4 3.2 2.7 2.7 293.5% 253.8%Transfers and subsidies – – 664.1 – – 765.2 – 952.3 951.4 1 052.2 949.2 949.2 316.5% 175.1%Departmental agencies and accounts
– – 561.5 – – 594.6 – 648.7 648.7 624.7 624.7 624.7 388.9% 190.8%
Public corporations and private enterprises
– – 99.3 – – 162.1 – 295.1 294.1 411.2 308.2 308.2 210.0% 143.1%
Non-profit institutions – – 3.1 – – 7.9 – 8.3 8.3 16.3 16.3 16.3 218.6% 144.7%Households – – 0.2 – – 0.6 – 0.1 0.3 – 0.0 0.0 813.3%Payments for capital assets
– – 1.2 – – 0.5 – 1.2 1.0 0.5 4.7 4.7 1442.7% 125.5%
Machinery and equipment – – 1.2 – – 0.5 – 1.2 1.0 0.5 4.7 4.7 1442.7% 125.5%Total – – 735.5 – – 841.6 – 1 042.6 1 039.5 1 148.1 1 084.6 1 084.6 322.4% 174.0%

2015 Estimates of National Expenditure
4
Expenditure estimates
Table 31.3 Vote expenditure estimates by programme and economic classification Programmes 1. Administration 2. Cooperatives Support and Development
3. Enterprise Development and Entrepreneurship
Programme
Revised estimate
Average growth
rate (%)
Expenditure/total:
Average(%) Medium-term expenditure estimate
Average growth
rate (%)
Expenditure/total:
Average(%)
R million 2014/15 2011/12 - 2014/15 2015/16 2016/17 2017/18 2014/15 - 2017/18 Programme 1 45.0 – 2.1% 64.0 66.6 69.1 15.4% 5.4%Programme 2 12.2 – 1.3% 15.2 16.1 16.7 11.2% 1.3%Programme 3 1 027.4 – 96.6% 1 024.0 1 042.5 1 171.5 4.5% 93.3%Total 1 084.6 – 100.0% 1 103.2 1 125.2 1 257.4 5.1% 100.0%
Change to 2014 Budget estimate
(5.3) (27.5) 48.8
Economic classification Current payments 130.7 – 9.8% 166.2 173.9 182.0 11.7% 14.3%Compensation of employees 84.0 – 6.1% 109.7 114.8 122.2 13.3% 9.4%Goods and services 46.8 – 3.7% 56.5 59.1 59.8 8.5% 4.9%of which: Administrative fees 0.2 – 0.0% 0.4 0.4 0.4 42.9% 0.0%Advertising 0.7 – 0.0% – 0.0 0.0 -88.9% 0.0%Assets less than the capitalisation threshold
0.0 – 0.0% 0.1 0.1 0.1 36.9% 0.0%
Audit costs: External 1.0 – 0.0% 0.3 0.3 0.4 -25.0% 0.0%Catering: Departmental activities 0.7 – 0.1% 1.0 1.0 1.0 14.6% 0.1%Communication 0.9 – 0.1% 1.3 1.4 1.5 17.6% 0.1%Consultants and professional services: Business and advisory services
4.5 – 0.4% 2.9 3.4 2.7 -15.7% 0.3%
Consultants and professional services: Legal costs
(0.3) – 0.0% – 0.0 0.0 -114.7% 0.0%
Contractors 4.1 – 0.2% 3.0 3.3 3.4 -5.8% 0.3%Agency and support / outsourced services
1.0 – 0.0% – 0.1 0.1 -47.2% 0.0%
Entertainment 0.3 – 0.0% 0.1 0.1 0.1 -40.4% 0.0%Fleet services (including government motor transport)
0.2 – 0.0% 0.1 0.1 0.1 -13.1% 0.0%
Consumable supplies 0.1 – 0.0% 0.2 0.2 0.2 42.0% 0.0%Consumables: Stationery, printing and office supplies
2.2 – 0.1% 1.3 1.4 1.5 -11.7% 0.1%
Operating leases 0.7 – 0.1% 1.9 2.2 2.5 54.6% 0.2%Transport provided: Departmental activity
0.1 – 0.0% – 0.0 0.0 -78.5% 0.0%
Travel and subsistence 19.2 – 2.0% 25.9 27.1 27.6 12.9% 2.2%Training and development 4.8 – 0.2% 2.7 3.0 3.2 -12.4% 0.3%Operating payments 4.0 – 0.2% 12.3 12.4 12.4 46.1% 0.9%Venues and facilities 2.7 – 0.3% 3.0 2.8 2.6 -1.6% 0.2%Transfers and subsidies 949.2 – 90.0% 935.8 949.0 1 074.1 4.2% 85.5%Departmental agencies and accounts
624.7 – 65.6% 610.4 620.7 729.3 5.3% 56.6%
Public corporations and private enterprises
308.2 – 23.3% 308.8 309.2 324.7 1.8% 27.4%
Non-profit institutions 16.3 – 1.0% 16.7 19.1 20.1 7.2% 1.6%Payments for capital assets 4.7 – 0.2% 1.1 2.2 1.3 -35.0% 0.2%Machinery and equipment 4.7 – 0.2% 1.1 2.2 1.3 -35.0% 0.2%Total 1 084.6 – 100.0% 1 103.2 1 125.2 1 257.4 5.1% 100.0%

Vote 31: Small Business Development
5
Personnel information Table 31.4 Vote personnel numbers and cost by salary level and programme1 Programmes 1. Administration 2. Cooperatives Support and Development 3. Enterprise Development and Entrepreneurship
Number of posts estimated for 31 March 2015 Number and cost2 of personnel posts filled / planned for on funded establishment Number
Number of
funded posts
Number of posts
additional to the
establishment Actual Revised estimate Medium-term expenditure estimate
Averagegrowth
rate(%)
Salary level/total:
Average(%)
2013/14 2014/15 2015/16 2016/17 2017/18 2014/15 - 2017/18
Small Business Development
Number Cost Unit Cost
Number Cost
Unit Cost
Number Cost
Unit Cost
Number Cost
Unit Cost
Number Cost
Unit Cost
Salary level 157 – 116 55.3 0.5 168 84.0 0.5 171 109.7 0.6 170 114.8 0.7 171 122.2 0.7 0.6% 100.0%1 – 6 15 – 8 1.2 0.2 16 2.7 0.2 16 2.9 0.2 16 3.1 0.2 16 3.2 0.2 – 9.4%7 – 10 69 – 63 21.6 0.3 76 25.5 0.3 76 31.7 0.4 76 33.6 0.4 76 33.8 0.4 – 44.7%11 – 12 31 – 25 14.7 0.6 35 20.9 0.6 36 27.0 0.8 36 27.3 0.8 36 30.7 0.9 0.9% 21.0%13 – 16 42 – 20 17.9 0.9 41 34.9 0.9 43 48.0 1.1 42 50.8 1.2 43 54.5 1.3 1.6% 24.9%Programme 157 – 116 55.3 0.5 168 84.0 0.5 171 109.7 0.6 170 114.8 0.7 171 122.2 0.7 0.6% 100.0%Programme 1 36 – 4 3.8 1.0 45 21.1 0.5 45 31.5 0.7 45 33.0 0.7 45 35.7 0.8 – 26.5%Programme 2 15 – 13 7.8 0.6 16 10.3 0.6 16 12.8 0.8 15 13.1 0.9 16 13.8 0.9 – 9.3%Programme 3 106 – 99 43.7 0.4 107 52.6 0.5 110 65.4 0.6 110 68.7 0.6 110 72.8 0.7 0.9% 64.3%1. Data has been provided by the department and may not necessarily reconcile with official government personnel data. 2. Rand million.
Programme 1: Administration
Programme purpose
Provide strategic leadership, management and support services to the department.
Table 31.5 Administration expenditure trends and estimates by subprogramme and economic classification Subprogramme
Audited outcome Adjusted
appropriation
Averagegrowth
rate(%)
Expen-diture/Total:
Average(%)
Medium-term expenditure estimate
Averagegrowth
rate(%)
Expen-diture/Total:
Average(%)
R thousand 2011/12 2012/13 2013/14 2014/15 2011/12 - 2014/15 2015/16 2016/17 2017/18 2014/15 - 2017/18 Ministry 10 704 9 526 13 452 45 030 61.4% 100.0% 20 935 22 311 21 846 -21.4% 45.0%Departmental Management – – – – – – 14 869 15 159 17 314 – 19.3%Corporate Services – – – – – – 28 221 29 117 29 983 – 35.7%Total 10 704 9 526 13 452 45 030 61.4% 100.0% 64 025 66 587 69 143 15.4% 100.0%
Change to 2014 Budget estimate
33 700 30 079 32 051 33 936
Economic classification
Current payments 10 044 9 436 12 539 40 998 59.8% 92.8% 63 465 64 984 68 493 18.7% 97.2%Compensation of employees 3 259 3 058 3 837 21 141 86.5% 39.8% 31 541 32 991 35 678 19.1% 49.6%Goods and services 6 785 6 378 8 702 19 857 43.0% 53.0% 31 924 31 993 32 815 18.2% 47.6%of which: Administrative fees – – – – – – 200 187 199 – 0.2%Advertising – – – 685 – 0.9% – – – -100.0% 0.3%Assets less than the capitalisation threshold – – – – – – 52 53 54 – 0.1%Audit costs: External – – – 950 – 1.2% 266 250 400 -25.0% 0.8%Catering: Departmental activities 12 14 15 114 111.8% 0.2% 278 291 298 37.8% 0.4%Communication 345 322 360 476 11.3% 1.9% 894 902 926 24.8% 1.3%Consultants and professional services: Business and advisory services
– – – 1 512 – 1.9% 892 892 1 292 -5.1% 1.9%
Consultants and professional services: Legal costs
– – – 150 – 0.2% – – – -100.0% 0.1%
Contractors 6 – 4 1 558 538.0% 2.0% 580 380 380 -37.5% 1.2%Agency and support / outsourced services – – – 1 000 – 1.3% – – – -100.0% 0.4%Entertainment – – 1 250 – 0.3% 45 45 45 -43.5% 0.2%Fleet services (including government motor transport)
29 2 11 47 17.5% 0.1% 36 36 36 -8.5% 0.1%

2015 Estimates of National Expenditure
6
Table 31.5 Administration expenditure trends and estimates by subprogramme and economic classification Economic classification
Audited outcome Adjusted
appropriation
Averagegrowth
rate(%)
Expen-diture/Total:
Average(%)
Medium-term expenditure estimate
Averagegrowth
rate(%)
Expen-diture/Total:
Average(%)
R thousand 2011/12 2012/13 2013/14 2014/15 2011/12 - 2014/15 2015/16 2016/17 2017/18 2014/15 - 2017/18 Consumable supplies 12 – 4 18 14.5% – 83 83 83 66.4% 0.1%Consumables: Stationery, printing and office supplies
50 44 42 1 198 188.3% 1.7% 586 602 635 -19.1% 1.2%
Operating leases 374 557 458 158 -25.0% 2.0% 1 288 1 508 1 808 125.3% 1.9%Property payments 1 14 1 – -100.0% – – – – – – Transport provided: Departmental activity – – – 100 – 0.1% – – – -100.0% – Travel and subsistence 5 907 5 403 7 804 8 499 12.9% 35.1% 13 125 13 354 13 348 16.2% 19.7%Training and development – – – 1 500 – 1.9% – – – -100.0% 0.6%Operating payments 31 15 2 1 125 231.1% 1.5% 12 041 11 867 11 970 119.9% 15.1%Venues and facilities 18 7 – 517 206.2% 0.7% 1 558 1 543 1 341 37.4% 2.0%Transfers and subsidies – 39 – – – – – – – – – Households – 39 – – – – – – – – – Payments for capital assets 660 51 913 4 032 82.8% 7.2% 560 1 603 650 -45.6% 2.8%Machinery and equipment 660 51 913 4 032 82.8% 7.2% 560 1 603 650 -45.6% 2.8%Total 10 704 9 526 13 452 45 030 61.4% 100.0% 64 025 66 587 69 143 15.4% 100.0%
Proportion of total programme expenditure to vote expenditure
1.5% 1.1% 1.3% 4.2% – – 5.8% 5.9% 5.5% – –
Details of transfers and subsidies
Households
Social benefits
Current – 39 – – – – – – – – –
Employee social benefits – 39 – – – – – – – – –
Personnel information
Table 31.6 Administration personnel numbers and cost by salary level¹
Number of posts estimated for 31 March 2015 Number and cost2 of personnel posts filled / planned for on funded establishment Number
Number of
funded posts
Number of posts
additional to the
establishment Actual Revised estimate Medium-term expenditure estimate
Averagegrowth
rate(%)
Salary level/total:
Average(%)
2013/14 2014/15 2015/16 2016/17 2017/18 2014/15 - 2017/18
Administration
Number Cost Unit Cost
Number Cost
Unit Cost
Number Cost
Unit Cost
Number Cost
Unit Cost
Number Cost
Unit Cost
Salary level 36 – 4 3.8 1.0 45 21.1 0.5 45 31.5 0.7 45 33.0 0.7 45 35.7 0.8 – 100.0%1 – 6 7 – – – – 7 1.2 0.2 7 1.3 0.2 7 1.4 0.2 7 1.5 0.2 – 15.6%7 – 10 7 – 1 0.4 0.4 11 2.0 0.2 11 2.5 0.2 11 2.7 0.2 11 2.8 0.3 – 24.4%11 – 12 6 – 1 0.6 0.6 11 5.7 0.5 11 9.0 0.8 11 9.5 0.9 11 9.9 0.9 – 24.4%13 – 16 16 – 2 2.8 1.4 16 12.3 0.8 16 18.7 1.2 16 19.5 1.2 16 21.5 1.3 – 35.6%
1. Data has been provided by the department and may not necessarily reconcile with official government personnel data. 2. Rand million.
Programme 2: Cooperatives Support and Development
Programme purpose
Implement a new support model for cooperatives, including the implementation of the Cooperatives Amendment Act (2013).
Objectives
• Increase the number of cooperatives accessing the various customised intervention programmes to ensure their sustainability and economic contribution by implementing sector catalytic projects through: – growing and facilitating the entry of cooperative enterprises in the mining, manufacturing, agro-
processing and services sectors, over the medium term – providing supplier development programmes for cooperatives through the Cooperatives Development
Agency, over the medium term.

Vote 31: Small Business Development
7
Subprogrammes
• Cooperatives Development promotes the development of cooperatives and the participation of youth in the economy, contributing towards increased employment, economic growth and poverty reduction.
Expenditure trends and estimates
Table 31.7 Cooperatives Support and Development expenditure trends and estimates by subprogramme and economic classification Subprogramme
Audited outcome Adjusted
appropriation
Averagegrowth
rate(%)
Expen-diture/Total:
Average(%)
Medium-term expenditure estimate
Averagegrowth
rate(%)
Expen-diture/Total:
Average(%)
R thousand 2011/12 2012/13 2013/14 2014/15 2011/12 - 2014/15 2015/16 2016/17 2017/18 2014/15 - 2017/18 Cooperatives Development 12 373 10 445 13 527 12 158 -0.6% 100.0% 15 188 16 066 16 714 11.2% 100.0%Total 12 373 10 445 13 527 12 158 -0.6% 100.0% 15 188 16 066 16 714 11.2% 100.0%
Change to 2014 Budget estimate
319 4 652 4 802 4 948
Economic classification Current payments 12 330 10 231 13 437 12 110 -0.6% 99.2% 15 032 15 907 16 552 11.0% 99.1%Compensation of employees 7 166 6 569 7 801 10 253 12.7% 65.5% 12 754 13 109 13 758 10.3% 82.9%Goods and services 5 164 3 662 5 636 1 857 -28.9% 33.6% 2 278 2 798 2 794 14.6% 16.2%of which: Administrative fees – – – 32 – 0.1% 21 50 20 -14.5% 0.2%Advertising 115 – 470 – -100.0% 1.2% – – – – – Assets less than the capitalisation threshold – 4 – – – – – – – – – Catering: Departmental activities – 34 101 22 – 0.3% 91 116 123 77.5% 0.6%Communication 42 42 41 91 29.4% 0.4% 81 95 88 -1.1% 0.6%Consultants and professional services: Business and advisory services
799 1 439 563 – -100.0% 5.8% – – – – –
Contractors 17 14 1 218 10 -16.2% 2.6% 70 70 70 91.3% 0.4%Agency and support / outsourced services – – 125 – – 0.3% – – – – – Entertainment – – 2 – – – – – – – – Fleet services (including government motor transport)
5 1 5 2 -26.3% – – – – -100.0% –
Consumable supplies – – – – – – 25 25 25 – 0.1%Consumables: Stationery, printing and office supplies
65 118 97 450 90.6% 1.5% 120 158 163 -28.7% 1.5%
Operating leases 51 36 37 59 5.0% 0.4% 54 104 44 -9.3% 0.4%Travel and subsistence 3 082 1 920 2 656 1 171 -27.6% 18.2% 1 640 1 958 2 044 20.4% 11.3%Operating payments 910 16 196 20 -72.0% 2.4% 41 67 69 51.1% 0.3%Venues and facilities 78 38 125 – -100.0% 0.5% 135 155 148 – 0.7%Transfers and subsidies 1 103 55 3 44.2% 0.3% – – – -100.0% – Households 1 103 55 3 44.2% 0.3% – – – -100.0% – Payments for capital assets 42 111 35 45 2.3% 0.5% 156 159 162 53.3% 0.9%Machinery and equipment 42 111 35 45 2.3% 0.5% 156 159 162 53.3% 0.9%Total 12 373 10 445 13 527 12 158 -0.6% 100.0% 15 188 16 066 16 714 11.2% 100.0%
Proportion of total programme expenditure to vote expenditure
1.7% 1.2% 1.3% 1.1% – – 1.4% 1.4% 1.3% – –
Details of transfers and subsidies
Households
Social benefits
Current 1 3 55 3 44.2% 0.1% – – – -100.0% –
Employee social benefits 1 3 55 3 44.2% 0.1% – – – -100.0% –
Households
Other transfers to households
Current – 100 – – – 0.2% – – – – –
Gifts and donations – 100 – – – 0.2% – – – – –
2015 Estimates of National Expenditure
8
Personnel information
Table 31.8 Cooperatives Support and Development personnel numbers and cost by salary level¹
Number of posts estimated for 31 March 2015 Number and cost2 of personnel posts filled / planned for on funded establishment Number
Number of
funded posts
Number of posts
additional to the
establishment Actual Revised estimate Medium-term expenditure estimate
Averagegrowth
rate(%)
Salary level/total:
Average(%)
2013/14 2014/15 2015/16 2016/17 2017/18 2014/15 - 2017/18 Cooperatives Support and Development
Number Cost
Unit Cost
Number Cost
Unit Cost
Number Cost
Unit Cost
Number Cost
Unit Cost
Number Cost
Unit Cost
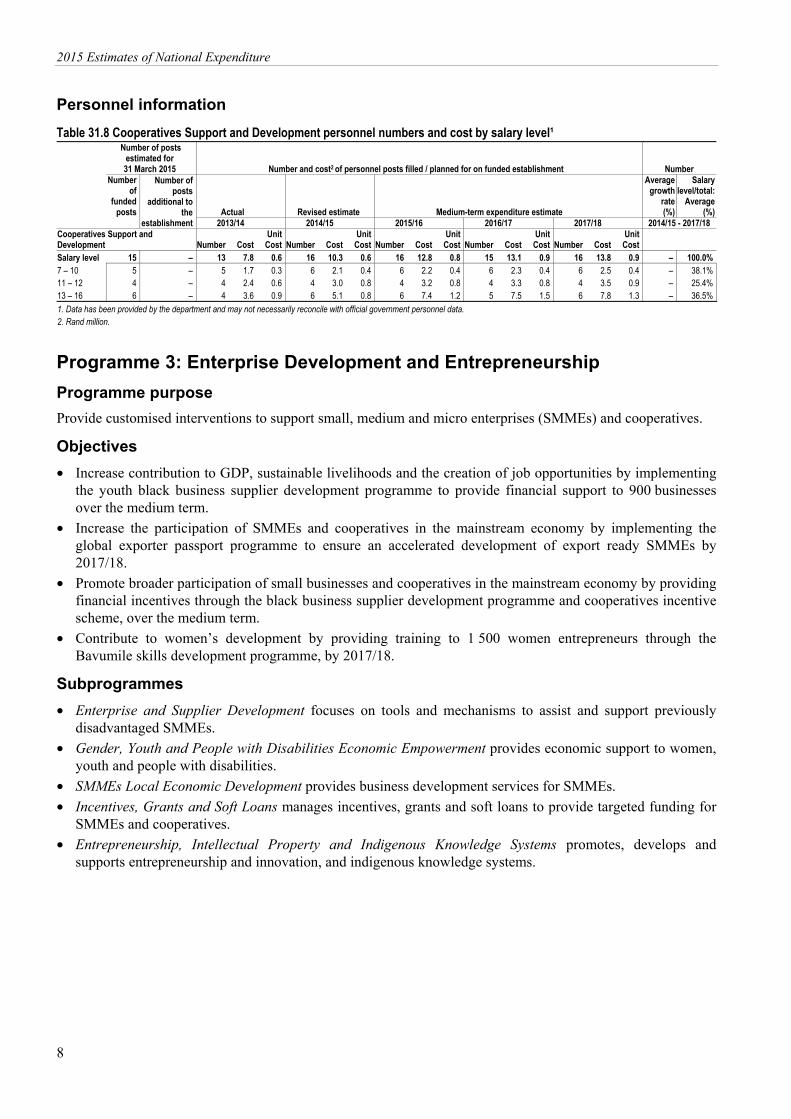
Salary level 15 – 13 7.8 0.6 16 10.3 0.6 16 12.8 0.8 15 13.1 0.9 16 13.8 0.9 – 100.0%7 – 10 5 – 5 1.7 0.3 6 2.1 0.4 6 2.2 0.4 6 2.3 0.4 6 2.5 0.4 – 38.1%11 – 12 4 – 4 2.4 0.6 4 3.0 0.8 4 3.2 0.8 4 3.3 0.8 4 3.5 0.9 – 25.4%13 – 16 6 – 4 3.6 0.9 6 5.1 0.8 6 7.4 1.2 5 7.5 1.5 6 7.8 1.3 – 36.5%
1. Data has been provided by the department and may not necessarily reconcile with official government personnel data. 2. Rand million.
Programme 3: Enterprise Development and Entrepreneurship
Programme purpose
Provide customised interventions to support small, medium and micro enterprises (SMMEs) and cooperatives.
Objectives
• Increase contribution to GDP, sustainable livelihoods and the creation of job opportunities by implementing the youth black business supplier development programme to provide financial support to 900 businesses over the medium term.
• Increase the participation of SMMEs and cooperatives in the mainstream economy by implementing the global exporter passport programme to ensure an accelerated development of export ready SMMEs by 2017/18.
• Promote broader participation of small businesses and cooperatives in the mainstream economy by providing financial incentives through the black business supplier development programme and cooperatives incentive scheme, over the medium term.
• Contribute to women’s development by providing training to 1 500 women entrepreneurs through the Bavumile skills development programme, by 2017/18.
Subprogrammes
• Enterprise and Supplier Development focuses on tools and mechanisms to assist and support previously disadvantaged SMMEs.
• Gender, Youth and People with Disabilities Economic Empowerment provides economic support to women, youth and people with disabilities.
• SMMEs Local Economic Development provides business development services for SMMEs.
• Incentives, Grants and Soft Loans manages incentives, grants and soft loans to provide targeted funding for SMMEs and cooperatives.
• Entrepreneurship, Intellectual Property and Indigenous Knowledge Systems promotes, develops and supports entrepreneurship and innovation, and indigenous knowledge systems.
Vote 31: Small Business Development
9
Expenditure trends and estimates
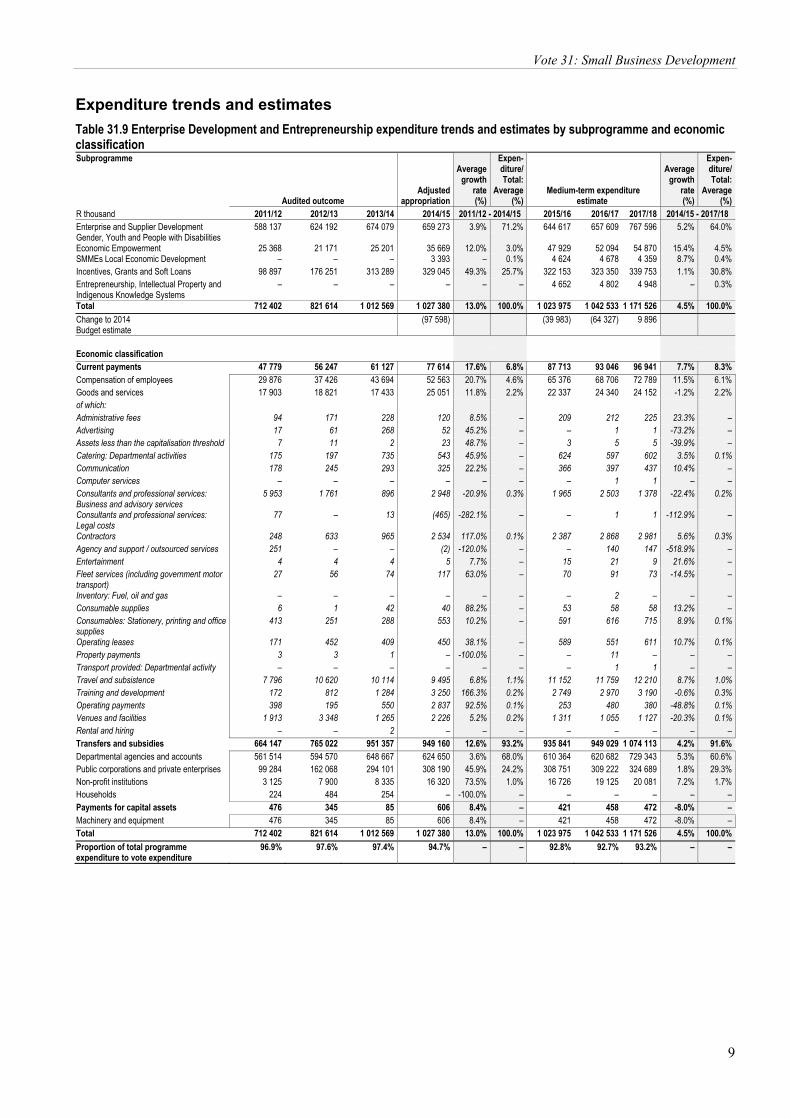
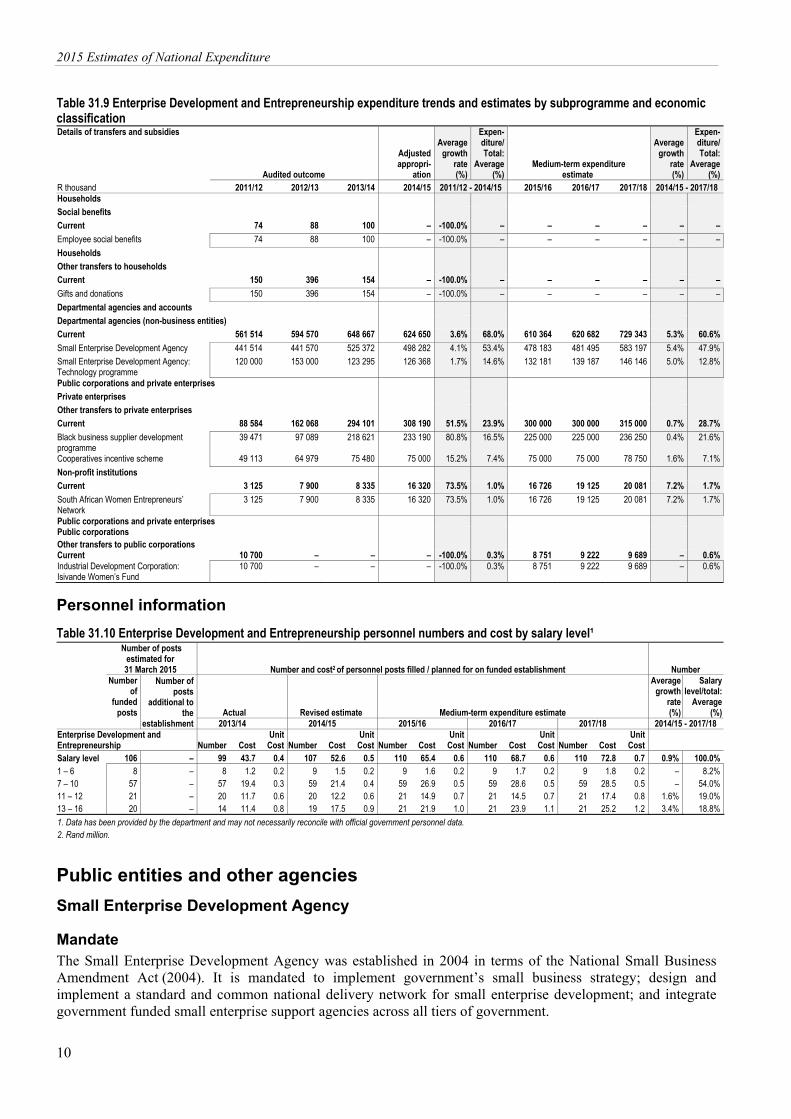
Table 31.9 Enterprise Development and Entrepreneurship expenditure trends and estimates by subprogramme and economic classification Subprogramme
Audited outcome Adjusted
appropriation
Averagegrowth
rate(%)
Expen-diture/Total:
Average(%)
Medium-term expenditure estimate
Averagegrowth
rate(%)
Expen-diture/Total:
Average(%)
R thousand 2011/12 2012/13 2013/14 2014/15 2011/12 - 2014/15 2015/16 2016/17 2017/18 2014/15 - 2017/18 Enterprise and Supplier Development 588 137 624 192 674 079 659 273 3.9% 71.2% 644 617 657 609 767 596 5.2% 64.0%Gender, Youth and People with Disabilities Economic Empowerment 25 368 21 171 25 201 35 669 12.0% 3.0% 47 929 52 094 54 870 15.4% 4.5%SMMEs Local Economic Development – – – 3 393 – 0.1% 4 624 4 678 4 359 8.7% 0.4%Incentives, Grants and Soft Loans 98 897 176 251 313 289 329 045 49.3% 25.7% 322 153 323 350 339 753 1.1% 30.8%Entrepreneurship, Intellectual Property and Indigenous Knowledge Systems
– – – – – – 4 652 4 802 4 948 – 0.3%
Total 712 402 821 614 1 012 569 1 027 380 13.0% 100.0% 1 023 975 1 042 533 1 171 526 4.5% 100.0%
Change to 2014 Budget estimate
(97 598) (39 983) (64 327) 9 896
Economic classification Current payments 47 779 56 247 61 127 77 614 17.6% 6.8% 87 713 93 046 96 941 7.7% 8.3%Compensation of employees 29 876 37 426 43 694 52 563 20.7% 4.6% 65 376 68 706 72 789 11.5% 6.1%Goods and services 17 903 18 821 17 433 25 051 11.8% 2.2% 22 337 24 340 24 152 -1.2% 2.2%of which: Administrative fees 94 171 228 120 8.5% – 209 212 225 23.3% – Advertising 17 61 268 52 45.2% – – 1 1 -73.2% – Assets less than the capitalisation threshold 7 11 2 23 48.7% – 3 5 5 -39.9% – Catering: Departmental activities 175 197 735 543 45.9% – 624 597 602 3.5% 0.1%Communication 178 245 293 325 22.2% – 366 397 437 10.4% – Computer services – – – – – – – 1 1 – – Consultants and professional services: Business and advisory services
5 953 1 761 896 2 948 -20.9% 0.3% 1 965 2 503 1 378 -22.4% 0.2%
Consultants and professional services: Legal costs
77 – 13 (465) -282.1% – – 1 1 -112.9% –
Contractors 248 633 965 2 534 117.0% 0.1% 2 387 2 868 2 981 5.6% 0.3%Agency and support / outsourced services 251 – – (2) -120.0% – – 140 147 -518.9% – Entertainment 4 4 4 5 7.7% – 15 21 9 21.6% – Fleet services (including government motor transport)
27 56 74 117 63.0% – 70 91 73 -14.5% –
Inventory: Fuel, oil and gas – – – – – – – 2 – – – Consumable supplies 6 1 42 40 88.2% – 53 58 58 13.2% – Consumables: Stationery, printing and office supplies
413 251 288 553 10.2% – 591 616 715 8.9% 0.1%
Operating leases 171 452 409 450 38.1% – 589 551 611 10.7% 0.1%Property payments 3 3 1 – -100.0% – – 11 – – – Transport provided: Departmental activity – – – – – – – 1 1 – – Travel and subsistence 7 796 10 620 10 114 9 495 6.8% 1.1% 11 152 11 759 12 210 8.7% 1.0%Training and development 172 812 1 284 3 250 166.3% 0.2% 2 749 2 970 3 190 -0.6% 0.3%Operating payments 398 195 550 2 837 92.5% 0.1% 253 480 380 -48.8% 0.1%Venues and facilities 1 913 3 348 1 265 2 226 5.2% 0.2% 1 311 1 055 1 127 -20.3% 0.1%Rental and hiring – – 2 – – – – – – – – Transfers and subsidies 664 147 765 022 951 357 949 160 12.6% 93.2% 935 841 949 029 1 074 113 4.2% 91.6%Departmental agencies and accounts 561 514 594 570 648 667 624 650 3.6% 68.0% 610 364 620 682 729 343 5.3% 60.6%Public corporations and private enterprises 99 284 162 068 294 101 308 190 45.9% 24.2% 308 751 309 222 324 689 1.8% 29.3%Non-profit institutions 3 125 7 900 8 335 16 320 73.5% 1.0% 16 726 19 125 20 081 7.2% 1.7%Households 224 484 254 – -100.0% – – – – – – Payments for capital assets 476 345 85 606 8.4% – 421 458 472 -8.0% – Machinery and equipment 476 345 85 606 8.4% – 421 458 472 -8.0% – Total 712 402 821 614 1 012 569 1 027 380 13.0% 100.0% 1 023 975 1 042 533 1 171 526 4.5% 100.0%
Proportion of total programme expenditure to vote expenditure
96.9% 97.6% 97.4% 94.7% – – 92.8% 92.7% 93.2% – –
2015 Estimates of National Expenditure
10
Table 31.9 Enterprise Development and Entrepreneurship expenditure trends and estimates by subprogramme and economic classification Details of transfers and subsidies
Audited outcome
Adjusted appropri-
ation
Averagegrowth
rate(%)
Expen-diture/Total:
Average(%)
Medium-term expenditure estimate
Averagegrowth
rate(%)
Expen-diture/Total:
Average(%)
R thousand 2011/12 2012/13 2013/14 2014/15 2011/12 - 2014/15 2015/16 2016/17 2017/18 2014/15 - 2017/18 Households
Social benefits
Current 74 88 100 – -100.0% – – – – – –
Employee social benefits 74 88 100 – -100.0% – – – – – –
Households
Other transfers to households
Current 150 396 154 – -100.0% – – – – – –
Gifts and donations 150 396 154 – -100.0% – – – – – –
Departmental agencies and accounts
Departmental agencies (non-business entities)
Current 561 514 594 570 648 667 624 650 3.6% 68.0% 610 364 620 682 729 343 5.3% 60.6%
Small Enterprise Development Agency 441 514 441 570 525 372 498 282 4.1% 53.4% 478 183 481 495 583 197 5.4% 47.9%
Small Enterprise Development Agency: Technology programme
120 000 153 000 123 295 126 368 1.7% 14.6% 132 181 139 187 146 146 5.0% 12.8%
Public corporations and private enterprises
Private enterprises
Other transfers to private enterprises
Current 88 584 162 068 294 101 308 190 51.5% 23.9% 300 000 300 000 315 000 0.7% 28.7%
Black business supplier development programme
39 471 97 089 218 621 233 190 80.8% 16.5% 225 000 225 000 236 250 0.4% 21.6%
Cooperatives incentive scheme 49 113 64 979 75 480 75 000 15.2% 7.4% 75 000 75 000 78 750 1.6% 7.1%
Non-profit institutions
Current 3 125 7 900 8 335 16 320 73.5% 1.0% 16 726 19 125 20 081 7.2% 1.7%
South African Women Entrepreneurs’ Network
3 125 7 900 8 335 16 320 73.5% 1.0% 16 726 19 125 20 081 7.2% 1.7%
Public corporations and private enterprises Public corporations Other transfers to public corporations Current 10 700 – – – -100.0% 0.3% 8 751 9 222 9 689 – 0.6%Industrial Development Corporation: Isivande Women’s Fund
10 700 – – – -100.0% 0.3% 8 751 9 222 9 689 – 0.6%
Personnel information
Table 31.10 Enterprise Development and Entrepreneurship personnel numbers and cost by salary level¹
Number of posts estimated for 31 March 2015 Number and cost2 of personnel posts filled / planned for on funded establishment Number
Number of
funded posts
Number of posts
additional to the
establishment Actual Revised estimate Medium-term expenditure estimate
Averagegrowth
rate(%)
Salary level/total:
Average(%)
2013/14 2014/15 2015/16 2016/17 2017/18 2014/15 - 2017/18 Enterprise Development and Entrepreneurship
Number Cost
Unit Cost
Number Cost
Unit Cost
Number Cost
Unit Cost
Number Cost
Unit Cost
Number Cost
Unit Cost
Salary level 106 – 99 43.7 0.4 107 52.6 0.5 110 65.4 0.6 110 68.7 0.6 110 72.8 0.7 0.9% 100.0%1 – 6 8 – 8 1.2 0.2 9 1.5 0.2 9 1.6 0.2 9 1.7 0.2 9 1.8 0.2 – 8.2%7 – 10 57 – 57 19.4 0.3 59 21.4 0.4 59 26.9 0.5 59 28.6 0.5 59 28.5 0.5 – 54.0%11 – 12 21 – 20 11.7 0.6 20 12.2 0.6 21 14.9 0.7 21 14.5 0.7 21 17.4 0.8 1.6% 19.0%13 – 16 20 – 14 11.4 0.8 19 17.5 0.9 21 21.9 1.0 21 23.9 1.1 21 25.2 1.2 3.4% 18.8%
1. Data has been provided by the department and may not necessarily reconcile with official government personnel data. 2. Rand million.
Public entities and other agencies
Small Enterprise Development Agency
Mandate The Small Enterprise Development Agency was established in 2004 in terms of the National Small Business Amendment Act (2004). It is mandated to implement government’s small business strategy; design and implement a standard and common national delivery network for small enterprise development; and integrate government funded small enterprise support agencies across all tiers of government.

Vote 31: Small Business Development
11
Selected performance indicators
Table 34.11 Small Enterprise Development Agency performance indicators by programme/objective/activity and related outcome Indicator Programme/Objective/Activity Outcome Past Current Projections 2011/12 2012/13 2013/14 2014/15 2015/16 2016/17 2017/18Percentage of clients satisfied with the organisation’s services per year
Enhance competitiveness and capabilities of small enterprises through coordinated services, programmes and products
Outcome 4: Decent employment through inclusive economic growth
80% 98% 97% 93% 94% 95% 96%
Percentage of existing SMME clients whose turnover increased per year
Enhance competitiveness and capabilities of small enterprises through coordinated services, programmes and products
35% 63% 67% 52% 54% 56% 58%
Percentage of existing SMME clients whose number of employees increased per year
Enhance competitiveness and capabilities of small enterprises through coordinated services, programmes and products
25% 35% 40% 33% 35% 37% 39%
Number of clients working with the agency per year
Ensure equitable access to business support services
15 931 10 208 10 619 12 000 11 400 10 830 10 290
Number of supported secondary cooperatives per year
Ensure equitable access to business support services
23 28 28 27 36 45 54
Value of service provision costs covered by provincial and local government partners per year
Ensure equitable access to business support services
R7.6 million R9.6 million R5.7 million R10 million R10.3 million R10.6 million R10.9 million
Number of partnerships operational per year
Ensure equitable access to business support services
30 44 41 68 70 72 74
Number of jobs created through the incubation programme per year1
Assist SMMEs with technology through the organisation’s technology programme
–1 2 301 2 900 1 650 1 730 1 820 1 910
Number of clients supported through the incubation programme per year1
Assist SMMEs with technology through the organisation’s technology programme
–1 2 282 1 587 1 710 1 795 1 885 1 980
Number of clients assisted with technology transfer incentives per year1
Assist SMMEs with technology through the organisation’s technology programme
–1 99 44 63 66 69 72
Number of clients supported with conformity assessment and product testing per year1
Assist SMMEs with technology through the organisation’s technology programme
–1 159 173 137 144 151 157
Number of clients trained on national and international standards per year1
Assist SMMEs with technology through the organisation’s technology programme
–1 571 825 510 536 563 590
Number of clients supported with systems implementation per year1
Assist SMMEs with technology through the organisation’s technology programme
–1 35 43 32 34 36 38
Number of incubators supported per year1
Assist SMMEs with technology through the organisation’s technology programme
–1 –1 –1 48 51 54 57
1. No historical data is available, as these are new indicators in line with the annual performance plan.
Expenditure analysis The national development plan and outcome 4 of government’s 2014-19 medium term strategic framework (decent employment through inclusive economic growth) identify small businesses as a key element in achieving the nation’s job creation targets by 2030. In support of these objectives, the Small Enterprise Development Agency strives to ensure that the small enterprise sector grows and increases its contribution to sustainable and equitable social and economic development, employment and wealth creation. The agency does this through providing business advice, consultancy, training and mentoring, and by assisting SMMEs with technology through the technology programme. It also provides for the incubation of businesses through technology demonstration centres, technology incubators, and hybrid centres as part of the technology programme, as well as for the development of rural enterprises and cooperatives through the cooperatives and community private partnerships programme.
In line with the medium term strategic framework’s objectives, the agency’s focus over the medium term will be on continuing to develop, support and promote small enterprises to ensure their growth and sustainability by providing them with non-financial services. Thus, goods and services will remain a key cost driver, accounting for 55.8 per cent of the agency’s total expenditure over the medium term. The agency intends to increase its support of clients through the incubation programme from 1 710 in 2014/15 to 1 980 in 2017/18, and increase its assistance of clients through technology transfer incentives from 63 in 2014/15 to 72 in 2017/18.
2015 Estimates of National Expenditure
12
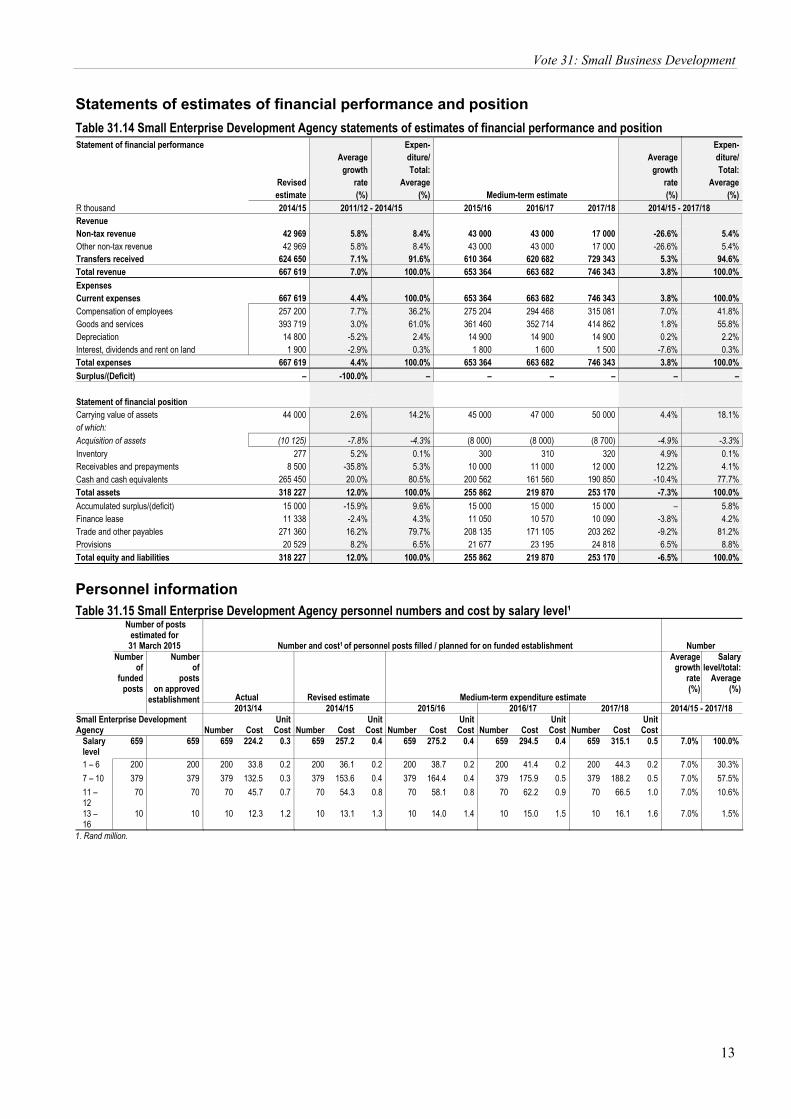
Expenditure on compensation of employees will continue to drive the expenditure in the agency, accounting for an estimated 41.8 per cent of total expenditure over the medium term. This expenditure is expected to increase to R315.1 million by 2017/18 to account for inflationary increases due to the delivery network being national. The agency’s network comprises 1 national office, 9 provincial offices and 46 branches nationwide, with a projected 32 520 clients over the medium term.
An average of 94.6 per cent of the agency’s revenue is expected to be derived from transfers from the Department of Small Business Development over the medium term. Other sources of revenue include funding from provincial and local governments, and specific projects from signed memorandums of agreement. Revenue is expected to decrease by R123.2 million over the medium term as a result of Cabinet approved budget reductions of R49.3 million in 2015/16 and R73.9 million in 2016/17 being effected on the agency’s allocation due to its accumulated level of reserves.
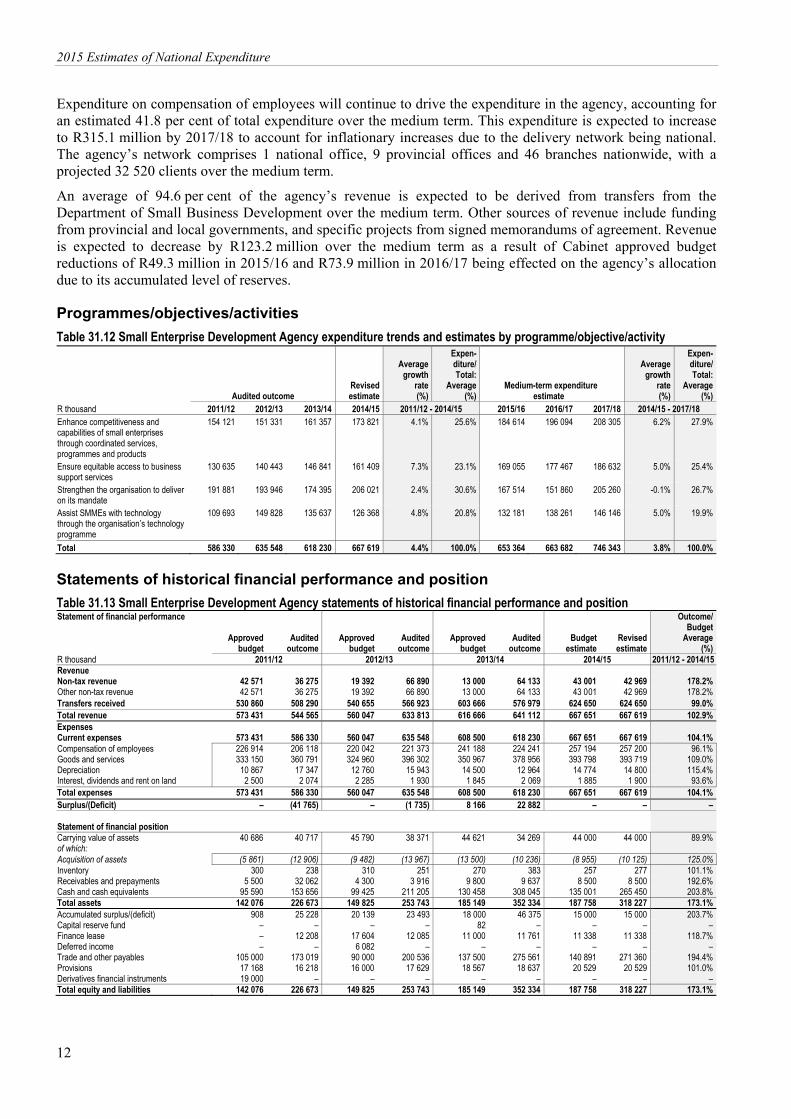
Programmes/objectives/activities
Table 31.12 Small Enterprise Development Agency expenditure trends and estimates by programme/objective/activity
Audited outcome Revisedestimate
Averagegrowth
rate(%)
Expen-diture/Total:
Average(%)
Medium-term expenditure estimate
Averagegrowth
rate(%)
Expen-diture/Total:
Average(%)
R thousand 2011/12 2012/13 2013/14 2014/15 2011/12 - 2014/15 2015/16 2016/17 2017/18 2014/15 - 2017/18 Enhance competitiveness and capabilities of small enterprises through coordinated services, programmes and products
154 121 151 331 161 357 173 821 4.1% 25.6% 184 614 196 094 208 305 6.2% 27.9%
Ensure equitable access to business support services
130 635 140 443 146 841 161 409 7.3% 23.1% 169 055 177 467 186 632 5.0% 25.4%
Strengthen the organisation to deliver on its mandate
191 881 193 946 174 395 206 021 2.4% 30.6% 167 514 151 860 205 260 -0.1% 26.7%
Assist SMMEs with technology through the organisation’s technology programme
109 693 149 828 135 637 126 368 4.8% 20.8% 132 181 138 261 146 146 5.0% 19.9%
Total 586 330 635 548 618 230 667 619 4.4% 100.0% 653 364 663 682 746 343 3.8% 100.0%
Statements of historical financial performance and position
Table 31.13 Small Enterprise Development Agency statements of historical financial performance and position Statement of financial performance
Approved budget
Audited outcome
Approved budget
Audited outcome
Approved budget
Audited outcome
Budget estimate
Revised estimate
Outcome/ Budget
Average(%)
R thousand 2011/12 2012/13 2013/14 2014/15 2011/12 - 2014/15 Revenue Non-tax revenue 42 571 36 275 19 392 66 890 13 000 64 133 43 001 42 969 178.2%Other non-tax revenue 42 571 36 275 19 392 66 890 13 000 64 133 43 001 42 969 178.2%Transfers received 530 860 508 290 540 655 566 923 603 666 576 979 624 650 624 650 99.0%Total revenue 573 431 544 565 560 047 633 813 616 666 641 112 667 651 667 619 102.9%Expenses Current expenses 573 431 586 330 560 047 635 548 608 500 618 230 667 651 667 619 104.1%Compensation of employees 226 914 206 118 220 042 221 373 241 188 224 241 257 194 257 200 96.1%Goods and services 333 150 360 791 324 960 396 302 350 967 378 956 393 798 393 719 109.0%Depreciation 10 867 17 347 12 760 15 943 14 500 12 964 14 774 14 800 115.4%Interest, dividends and rent on land 2 500 2 074 2 285 1 930 1 845 2 069 1 885 1 900 93.6%Total expenses 573 431 586 330 560 047 635 548 608 500 618 230 667 651 667 619 104.1%Surplus/(Deficit) – (41 765) – (1 735) 8 166 22 882 – – – Statement of financial position Carrying value of assets 40 686 40 717 45 790 38 371 44 621 34 269 44 000 44 000 89.9%of which: Acquisition of assets (5 861) (12 906) (9 482) (13 967) (13 500) (10 236) (8 955) (10 125) 125.0%Inventory 300 238 310 251 270 383 257 277 101.1%Receivables and prepayments 5 500 32 062 4 300 3 916 9 800 9 637 8 500 8 500 192.6%Cash and cash equivalents 95 590 153 656 99 425 211 205 130 458 308 045 135 001 265 450 203.8%Total assets 142 076 226 673 149 825 253 743 185 149 352 334 187 758 318 227 173.1%Accumulated surplus/(deficit) 908 25 228 20 139 23 493 18 000 46 375 15 000 15 000 203.7%Capital reserve fund – – – – 82 – – – – Finance lease – 12 208 17 604 12 085 11 000 11 761 11 338 11 338 118.7%Deferred income – – 6 082 – – – – – – Trade and other payables 105 000 173 019 90 000 200 536 137 500 275 561 140 891 271 360 194.4%Provisions 17 168 16 218 16 000 17 629 18 567 18 637 20 529 20 529 101.0%Derivatives financial instruments 19 000 – – – – – – – – Total equity and liabilities 142 076 226 673 149 825 253 743 185 149 352 334 187 758 318 227 173.1%
Vote 31: Small Business Development
13
Statements of estimates of financial performance and position
Table 31.14 Small Enterprise Development Agency statements of estimates of financial performance and position Statement of financial performance
Revised estimate
Averagegrowth
rate(%)
Expen-diture/Total:
Average(%) Medium-term estimate
Averagegrowth
rate(%)
Expen-diture/Total:
Average(%)
R thousand 2014/15 2011/12 - 2014/15 2015/16 2016/17 2017/18 2014/15 - 2017/18 Revenue Non-tax revenue 42 969 5.8% 8.4% 43 000 43 000 17 000 -26.6% 5.4%Other non-tax revenue 42 969 5.8% 8.4% 43 000 43 000 17 000 -26.6% 5.4%Transfers received 624 650 7.1% 91.6% 610 364 620 682 729 343 5.3% 94.6%Total revenue 667 619 7.0% 100.0% 653 364 663 682 746 343 3.8% 100.0%
Expenses Current expenses 667 619 4.4% 100.0% 653 364 663 682 746 343 3.8% 100.0% Compensation of employees 257 200 7.7% 36.2% 275 204 294 468 315 081 7.0% 41.8%Goods and services 393 719 3.0% 61.0% 361 460 352 714 414 862 1.8% 55.8%Depreciation 14 800 -5.2% 2.4% 14 900 14 900 14 900 0.2% 2.2%Interest, dividends and rent on land 1 900 -2.9% 0.3% 1 800 1 600 1 500 -7.6% 0.3%Total expenses 667 619 4.4% 100.0% 653 364 663 682 746 343 3.8% 100.0%
Surplus/(Deficit) – -100.0% – – – – – – Statement of financial position Carrying value of assets 44 000 2.6% 14.2% 45 000 47 000 50 000 4.4% 18.1%of which: Acquisition of assets (10 125) -7.8% -4.3% (8 000) (8 000) (8 700) -4.9% -3.3%Inventory 277 5.2% 0.1% 300 310 320 4.9% 0.1%Receivables and prepayments 8 500 -35.8% 5.3% 10 000 11 000 12 000 12.2% 4.1%Cash and cash equivalents 265 450 20.0% 80.5% 200 562 161 560 190 850 -10.4% 77.7%Total assets 318 227 12.0% 100.0% 255 862 219 870 253 170 -7.3% 100.0%
Accumulated surplus/(deficit) 15 000 -15.9% 9.6% 15 000 15 000 15 000 – 5.8%Finance lease 11 338 -2.4% 4.3% 11 050 10 570 10 090 -3.8% 4.2%Trade and other payables 271 360 16.2% 79.7% 208 135 171 105 203 262 -9.2% 81.2%Provisions 20 529 8.2% 6.5% 21 677 23 195 24 818 6.5% 8.8%Total equity and liabilities 318 227 12.0% 100.0% 255 862 219 870 253 170 -6.5% 100.0%
Personnel information Table 31.15 Small Enterprise Development Agency personnel numbers and cost by salary level¹
Number of posts estimated for
31 March 2015 Number and cost1 of personnel posts filled / planned for on funded establishment Number
Number of
funded posts
Number of
posts on approved
establishment Actual Revised estimate
Medium-term expenditure estimate
Averagegrowth
rate(%)
Salarylevel/total:
Average(%)
2013/14 2014/15 2015/16 2016/17 2017/18 2014/15 - 2017/18 Small Enterprise Development Agency
Number Cost
Unit Cost
Number Cost
Unit Cost
Number Cost
Unit Cost
Number Cost
Unit Cost
Number Cost
Unit Cost
Salary level
659 659 659 224.2 0.3 659 257.2 0.4 659 275.2 0.4 659 294.5 0.4 659 315.1 0.5 7.0% 100.0%
1 – 6 200 200 200 33.8 0.2 200 36.1 0.2 200 38.7 0.2 200 41.4 0.2 200 44.3 0.2 7.0% 30.3%
7 – 10 379 379 379 132.5 0.3 379 153.6 0.4 379 164.4 0.4 379 175.9 0.5 379 188.2 0.5 7.0% 57.5%
11 – 12
70 70 70 45.7 0.7 70 54.3 0.8 70 58.1 0.8 70 62.2 0.9 70 66.5 1.0 7.0% 10.6%
13 – 16
10 10 10 12.3 1.2 10 13.1 1.3 10 14.0 1.4 10 15.0 1.5 10 16.1 1.6 7.0% 1.5%
1. Rand million.

2015 Estimates of National Expenditure
14


Private Bag X115 Pretoria 0001 | 40 Church square Pretoria 0002 | Tel +27 12 395 6697 | Fax +27 12 406 9055
Photos provided by GCIS.