
Small Business Conditions and Finance
266
Small Business Conditions Finance and
Transcript of Small Business Conditions and Finance

2 5 9CON F E R E NC E VOLU M E | 2 015
Small BusinessConditions Financeand

Proceedings of a Conference
Held in Sydney on 19–20 March 2015
Editors: Angus Moore
John Simon
Small Business Conditions Financeand

The publication of these Conference papers is aimed at making results of research undertaken in the Bank, and elsewhere, available to a wider audience. The views expressed are those of the authors and discussants and not necessarily those of the Reserve Bank of Australia. References to the results and views presented should clearly attribute them to the authors, not to the Bank. Responsibility for any errors rests with the authors.
The content of this publication shall not be reproduced, sold or distributed without the prior consent of the Reserve Bank of Australia.
Website: www.rba.gov.au
Cover Design Reserve Bank of Australia
Printed in Australia by Reserve Bank of Australia 65 Martin Place Sydney NSW 2000 Tel: +61 2 9551 8111 Fax: +61 2 9551 8000
ISBN 978-0-9942093-2-0 (Print) ISBN 978-0-9942093-3-7 (Online) Sydney, August 2015
Table of Contents
IntroductionJohn Simon 1
The Economic Trends, Challenges and Behaviour of Small Businesses in AustraliaSam Nicholls and David Orsmond 5Discussant Bill Allen 31
Opening Aladdin’s Cave: Unpacking the Factors Impacting on Small BusinessesScott Holmes and Dhruba Gupta 37Discussant Geoff Francis 57
SME Access to Intermediated Credit: What Do We Know and What Don’t We Know?Gregory F Udell 61Discussants Warren Mundy and Mark Bryant 110
Housing Prices and Entrepreneurship: Evidence for the Housing Collateral Channel in AustraliaEllis Connolly, Gianni La Cava and Matthew Read 115Discussant David Hargreaves 145
The Dynamics of Trade Credit and Bank Debt in SME Finance: International EvidenceLars Norden and Stefan van Kampen 149Discussant Annalisa Ferrando 174
Does Innovation Make (SME) Firms More Productive?Alfons Palangkaraya, Thomas Spurling and Elizabeth Webster 181Discussant Roy Green 200
Firm Dynamics and Public Policy: Evidence from OECD CountriesDan Andrews, Chiara Criscuolo, Peter Gal and Carlo Menon 205Discussant Mark Cully 229
Panel Discussion: What is the Future for Small Business?Michael Henderson 235Bruce Jeffreys 237Kate Carnell 238

Biographies of Contributors 245
List of Conference Participants 255
Other Volumes in this Series 257
Copyright and Disclaimer Notices 259

1CON F E R E NC E VOLU M E | 2 015
IntroductionJohn Simon
Small business, it is often said, is the engine of the economy. In Australia, there are more than two million small to medium-sized enterprises (SME) and one is born every two minutes. They employ more than seven million people and account for more than half of total income for non-financial businesses. But despite, or perhaps because of, their sheer numbers, remarkably little is known about small businesses in Australia. As soon as you look more closely at the sector, you realise that there is a great deal of diversity hiding behind the descriptor ‘small business’. Some are hoping to be the next Google or Apple, ready to take over the world and change everything. Others are the outgrowth of their owner’s hobby. They have no aspirations to change the world, they are just happy that someone is willing to pay them to do something they love.
Consequently, the firms that make up the sector may have very different needs for funding, may react very differently to the policy environment and, thus, may behave very differently over the economic cycle. For example, while we often hear that small businesses are reliant on banks for business finance, how true is this? Is being on a first name basis with the branch manager, as theories about ‘relationship lending’ suggest, important? Are other sources of finance, such as trade credit, personal credit cards and mortgages just as useful? Do research and development incentives and tax concessions help to stimulate small business activity? And, most critically, how does the answer depend on whether you want to be the next Google or just have a comfortable life?
The answers to these questions are not of mere academic interest. In the current economic environment, with weak growth and relatively high unemployment, the behaviour of small business could have a large effect on the future path of the economy. There are concerns that the current slow productivity growth, if it continues, will not support the improvements in living standards that we have grown used to. So a surge of hiring, investing and innovating from small business would certainly be welcome. But wishing it will not make it so. Rather, a good understanding of what drives and affects the sector is needed if policies are to be well targeted.
It is to this task of better informing the policy debate that the Bank’s annual conference was directed this year. The papers presented at the Conference covered three broad areas: understanding the diversity that exists within the small business sector; examining the different ways that small business finances itself; and looking at innovation in the small business sector and its contribution to overall productivity growth.
The Conference began with an overview of the small business sector in Australia provided through papers by Sam Nicholls and David Orsmond, and Scott Holmes and Dhruba Gupta. Mr Nicholls and Dr Orsmond present information from the Reserve Bank’s business liaison program. In addition to providing general information about the sector, they examine the drivers of business decisions to see if there are any differences between small and larger businesses. They find that there is
2 R E SE RV E BA N K OF AUST R A L I A
JOH N S I MON
generally no statistical difference in pricing, employment and investment decisions between small and larger businesses. However, there is some evidence that smaller businesses are less forward looking in their decision-making.
Professor Holmes and Mr Gupta report results from a new survey methodology that they have developed. By asking small businesses to rank the relative importance of different forces affecting their business, the authors categorise businesses into five segments. They hope that this approach can inform more effective policy by recognising the differences between these segments, rather than relying on one-size-fits-all approaches.
A key insight from both these papers is the diversity of the small business sector. There are differences between the self-employed and firms with employees; there are firms that want to grow and others that are quite content doing what they have always done; and there are firms that will succeed, but many that will fail.
The Conference then turned to examining the various forms of finance available to small businesses and how financing conditions affect these firms. Three papers separately addressed intermediated credit, housing equity and trade credit as sources of funding for small business.
Gregory Udell provides a comprehensive overview of what we know and what we don’t know about intermediated credit for SMEs. Professor Udell emphasises that, although bank loans are the predominant form of external finance for small business virtually everywhere in the world, they are just one of a number of lending technologies used to finance SMEs. Similarly, many important non-bank financing channels exist. Indeed, Professor Udell argues that the literature may have gone too far in emphasising relationship lending to the detriment of other lending technologies, such as equipment financing and factoring. Professor Udell also provides his view on the ‘top 10’ areas for further research.
Other than bank credit, the most common form of finance used by small businesses is housing equity. Ellis Connolly, Gianni La Cava and Matthew Read present an examination of the use of housing equity in small business finance in Australia. They also look for evidence of whether higher house prices affect entrepreneurship through a collateral channel. They do this from three perspectives: the lender, the borrower and a combined perspective. The lender’s perspective is based on interviews with lending institutions conducted as part of the RBA’s business liaison program. They report that, by and large, while housing collateral is not necessary for lenders to grant a loan, in practice, housing collateral is used in the majority of loans. This prevalence reflects a combination of lenders’ preference for some security and borrowers’ preference for the lower interest rates that are associated with collateralised loans. The borrower’s perspective is provided through analysis of household-level data. Using these detailed data the authors find some evidence of a link between higher housing equity and business formation. The last part of the paper, the combined perspective, looks at postcode-level data on house prices and new business registrations. Once again, there is evidence that an increase in house prices is associated with an increase in the company entry rate. In short, housing equity appears to be an important channel of funding used by small businesses in Australia.
The final paper in this set, by Lars Norden and Stefan van Kampen, examines the relationship between trade credit and bank debt. In particular, they find that the relationship varies over the cycle. While trade credit and bank debt appear to substitute for each other during normal times,
3CON F E R E NC E VOLU M E | 2 015
I N T RODUC T ION
during the global financial crisis both contracted together. Thus, they conclude, trade credit has little scope to replace bank debt during credit crunches. Moreover, the authors show that firms with lower credit quality are least able to replace bank debt with trade credit.
The Conference then turned to an investigation of productivity and innovation in small businesses. Alfons Palangkaraya, Thomas Spurling and Elizabeth Webster investigate the effects of innovation on productivity in a sample of 7 000 Australian SMEs. They find that firms that introduce an innovation raise their productivity level by 5 percentage points relative to the industry average over the following four years. Firms that innovate in collaboration with others (e.g. with a university) raise their productivity even further. Given the obvious gains from innovation, the authors wonder why every firm does not innovate. Their answer is that innovation is hard work and, depending on the niche a firm is in, may not be necessary for the firm to meet its objectives. This answer links back to the findings from the papers by Mr Nicholls and Dr Orsmond and Professor Holmes and Mr Gupta and reflects the diversity in the small business sector, both in the level of competition and the objectives of the owners.
The final paper, by Dan Andrews, Chiara Criscuolo, Peter Gal and Carlo Menon, looks at a large cross-country dataset on firm-level labour productivity compiled by the Organisation for Economic Co-operation and Development. They start with the observation that, within countries, productivity is not clustered around the mean but is instead characterised by many below-average performers and a smaller number of star performers. Furthermore, there are large differences across countries. In seeking to explain this observation the authors focus on the efficiency of resource reallocation within a country. Broadly, if underperforming firms limp on rather than close and free up the resources they use for more productive uses, aggregate productivity may be lower. The authors present evidence that indeed shows a correlation between firm entry and exit and aggregate productivity. This fact suggests that the age of a firm is a better indicator of dynamism than size. A corollary is that regulatory policies that focus on the size of an enterprise may be less efficient than policies that focus on age.
The Conference concluded with a panel discussion about the future of small business in Australia led by Michael Schaper. Michael Henderson, Bruce Jeffreys and Kate Carnell offered their insights based on their experiences in the sector. While each participant’s experience was different, there were a number of consistent themes. In particular, each highlighted the way the internet has allowed small businesses to both outsource work and reach customers in ways that were previously very difficult. A consequence is that defining businesses by their number of employees – when outsourcing allows small businesses to behave like much larger businesses – may be an increasingly misleading way of categorising businesses.
Overall, the papers presented and the discussion at the Conference made it clear that small business is not well served by clichéd generalisations. Some small businesses hope to be the next Google, but most do not. Some small businesses will grow to become very large businesses, but many will not. Some small businesses rely on bank loans, but many do not. Some policies will help small businesses, but they may not stimulate innovation, entrepreneurship and growth. Thus, it may be best to dispense with the metaphor of small business as the engine of growth, with all parts moving in unison to a single purpose, and start focusing on the nuts and bolts. The papers in this volume make a good contribution to that endeavour.

4 R E SE RV E BA N K OF AUST R A L I A
5CON F E R E NC E VOLU M E | 2 015
The Economic Trends, Challenges and Behaviour of Small Businesses in AustraliaSam Nicholls and David Orsmond*
1. IntroductionSmall businesses make an important contribution to the Australian economy. They account for the vast majority of the active private businesses in the country and represent a large share of employment and value added. Small businesses, however, face many operational challenges and, as a consequence, typically have higher failure rates than larger businesses. While these features have been noted in previous literature, there has been little work examining how these challenges affect the business decisions of small businesses relative to those of larger businesses.
To address this question, this paper uses official and private sector data, as well as information gathered through the Reserve Bank of Australia’s business liaison program. Section 2 first provides a summary of the characteristics of the Australian small business sector followed by the contribution small businesses make to the Australian economy, and Section 3 outlines the recent economic conditions faced by the sector. Section 4 then outlines the nature of the operational challenges the sector faces, drawing in particular on the Bank’s discussions with small businesses. Finally, Section 5 uses panel data compiled by the Bank to examine econometrically whether, and if so how, small businesses’ economic decisions and behaviour differ from those of larger firms. The results suggest that the drivers of smaller firms’ current price, employment and investment decisions are generally not statistically different from larger firms, though this may in part reflect the large degree of heterogeneity in the small business sector. There is some evidence, however, that smaller businesses are less forward looking in making their economic decisions. Section 6 concludes.
2. Small Businesses’ Contribution to the EconomyThere are numerous definitions of small businesses. Definitions that have been used include characteristics like legal structure, number of employees, revenue, size of balance sheet and other financial and economic characteristics. While previous Bank research (Connolly, Norman and West 2012) found that different definitions can identify rather distinct groups of firms, in this paper we adopt the Australian Bureau of Statistics (ABS) definition. The ABS defines small businesses as all entities that are independent and privately owned, are managed by an individual or a small number of persons, and have less than 20 employees. This choice mainly reflects the greater availability of data that can be analysed using this definition.
* The authors are respectively from the Economic Analysis and Financial Stability Departments of the Reserve Bank of Australia.
6 R E SE RV E BA N K OF AUST R A L I A
SA M N IC HOL L S A N D DAV I D OR SMON D
Private firms with fewer than 20 employees are quite heterogeneous, although they can be loosely grouped into three broad categories. One part of the sector provides a range of professional services to other businesses and households. This sector includes, among others, tradespeople (e.g. electricians and plumbers), skilled professionals (e.g. lawyers and accountants), doctors and other health practitioners, real estate and insurance agents, and tourism-related businesses. Another segment includes various types of retail outlets (e.g. grocers, hairdressers, bars and restaurants). Finally, there are a number of firms that produce a range of niche and other goods in the manufacturing, construction and agricultural industries. Given this diverse set of activities, the motivations and consequent economic behaviour are likely to be quite different between the different firms within the small business sector.
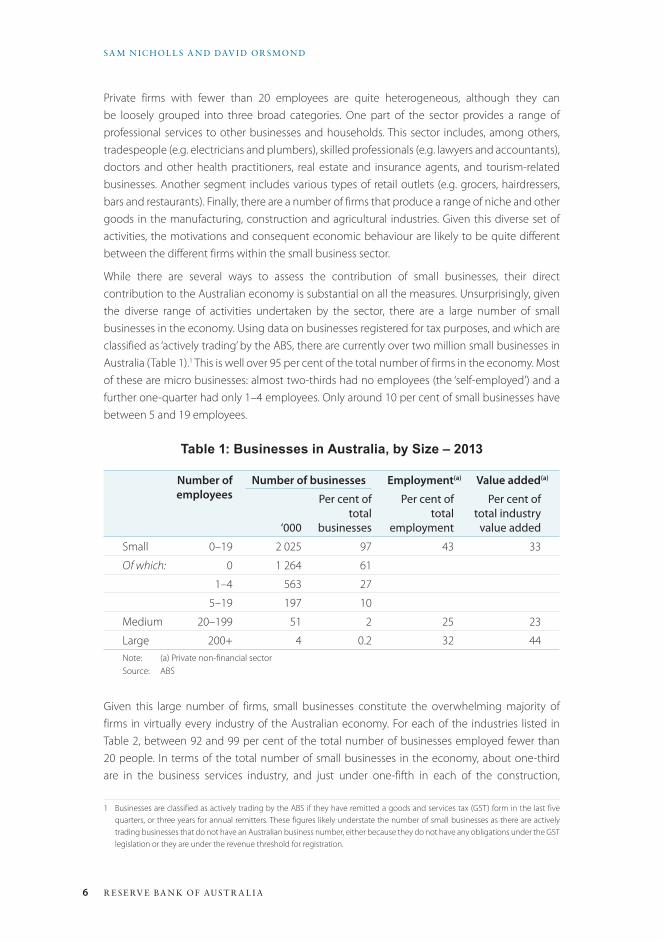
While there are several ways to assess the contribution of small businesses, their direct contribution to the Australian economy is substantial on all the measures. Unsurprisingly, given the diverse range of activities undertaken by the sector, there are a large number of small businesses in the economy. Using data on businesses registered for tax purposes, and which are classified as ‘actively trading’ by the ABS, there are currently over two million small businesses in Australia (Table 1).1 This is well over 95 per cent of the total number of firms in the economy. Most of these are micro businesses: almost two-thirds had no employees (the ‘self-employed’) and a further one-quarter had only 1–4 employees. Only around 10 per cent of small businesses have between 5 and 19 employees.
Table 1: Businesses in Australia, by Size – 2013
Number of employees
Number of businesses Employment(a) Value added(a)
‘000
Per cent of total
businesses
Per cent of total
employment
Per cent of total industry
value added
Small 0–19 2 025 97 43 33
Of which: 0 1 264 61
1–4 563 27
5–19 197 10
Medium 20–199 51 2 25 23
Large 200+ 4 0.2 32 44Note: (a) Private non-financial sectorSource: ABS
Given this large number of firms, small businesses constitute the overwhelming majority of firms in virtually every industry of the Australian economy. For each of the industries listed in Table 2, between 92 and 99 per cent of the total number of businesses employed fewer than 20 people. In terms of the total number of small businesses in the economy, about one-third are in the business services industry, and just under one-fifth in each of the construction,
1 Businesses are classified as actively trading by the ABS if they have remitted a goods and services tax (GST) form in the last five quarters, or three years for annual remitters. These figures likely understate the number of small businesses as there are actively trading businesses that do not have an Australian business number, either because they do not have any obligations under the GST legislation or they are under the revenue threshold for registration.

7CON F E R E NC E VOLU M E | 2 015
T H E ECONOM IC T R E N DS , C H A L L E NGE S A N D BE H AV IOU R OF SM A L L BUSI N E S SE S I N AUST R A L I A
distribution services and household services industries. In contrast, very few small businesses are in the manufacturing and mining industries – just 4 and 0.4 per cent of all small businesses, respectively. The largest shares of non-employing firms are in the agricultural, business services and construction industries (primarily family-owned farms and self-employed professionals and tradespeople). However, almost half of the firms in the manufacturing and household services sectors are also small firms that do not employ any staff.
Table 2: Small Businesses in Australia, by Industry – 2013
Number of small businesses
Non- employing
Employing Total Per cent of total
‘000 ‘000 ‘000
Agriculture, forestry and fishing 130 53 183 10
Mining 4 3 7 0.4
Manufacturing 35 42 77 4
Construction 196 128 324 18
Distribution services 173 145 319 18
Business services 372 174 545 31
Household services 146 167 314 18
Per cent of industry
Number of small businesses
Employment Value added
Including non-
employing firms
Excluding non-
employing firms
Agriculture, forestry and fishing 99 29 83 82
Mining 92 39 13 8
Manufacturing 92 50 29 20
Construction 99 39 60 46
Distribution services 96 44 36 28
Business services 98 31 45 43
Household services 96 51 40 35Note: Private non-financial sectorSource: ABS
8 R E SE RV E BA N K OF AUST R A L I A
SA M N IC HOL L S A N D DAV I D OR SMON D
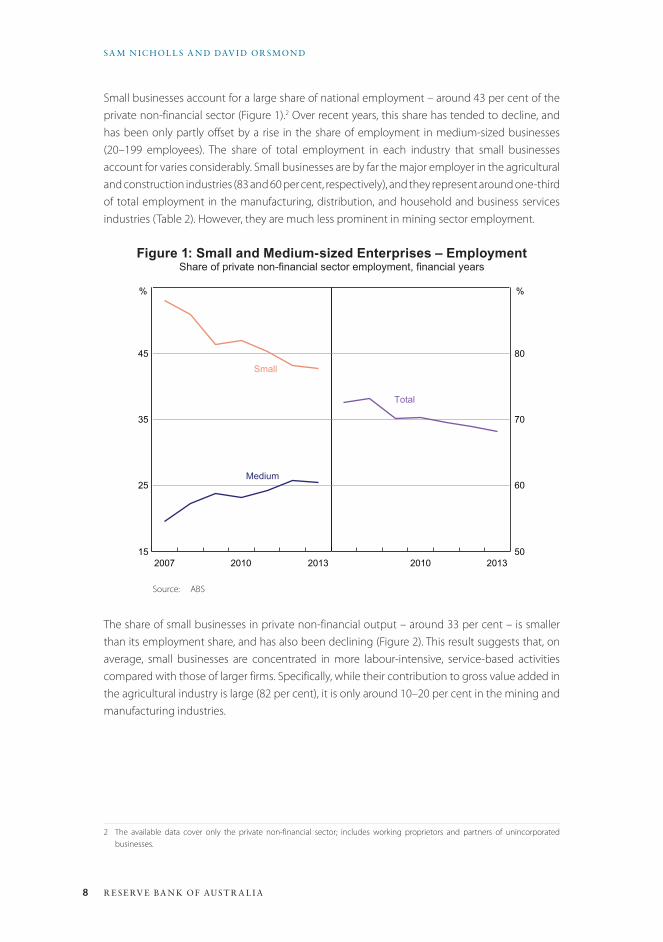
Small businesses account for a large share of national employment – around 43 per cent of the private non-financial sector (Figure 1).2 Over recent years, this share has tended to decline, and has been only partly offset by a rise in the share of employment in medium-sized businesses (20–199 employees). The share of total employment in each industry that small businesses account for varies considerably. Small businesses are by far the major employer in the agricultural and construction industries (83 and 60 per cent, respectively), and they represent around one-third of total employment in the manufacturing, distribution, and household and business services industries (Table 2). However, they are much less prominent in mining sector employment.
Figure 1: Small and Medium-sized Enterprises – EmploymentShare of private non-financial sector employment, financial years
2007 2010 201315
25
35
45
%
Total
2010 201350
60
70
80
Medium
Small
%
Source: ABS
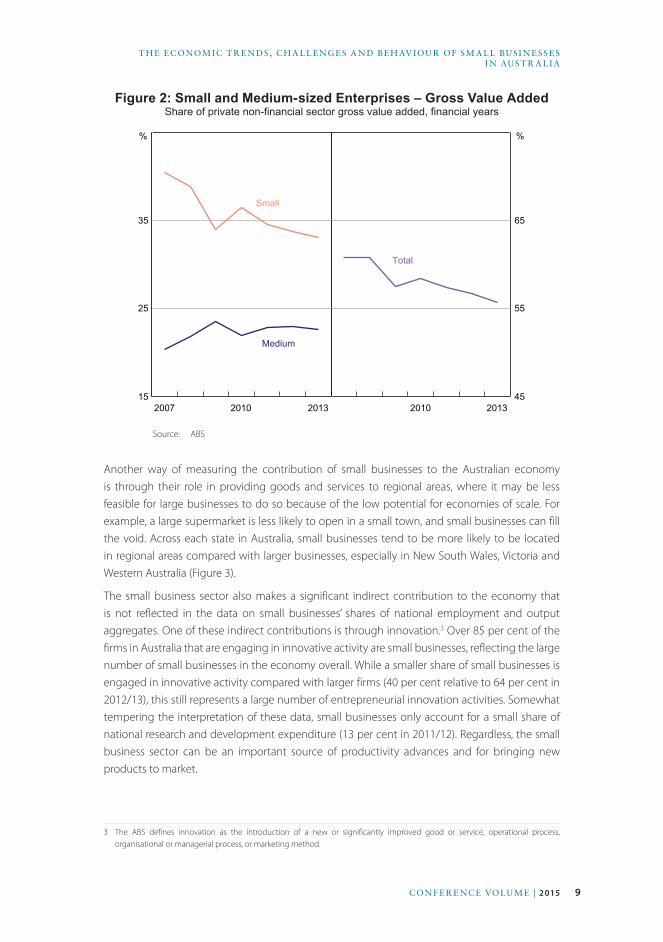
The share of small businesses in private non-financial output – around 33 per cent – is smaller than its employment share, and has also been declining (Figure 2). This result suggests that, on average, small businesses are concentrated in more labour-intensive, service-based activities compared with those of larger firms. Specifically, while their contribution to gross value added in the agricultural industry is large (82 per cent), it is only around 10–20 per cent in the mining and manufacturing industries.
2 The available data cover only the private non-financial sector; includes working proprietors and partners of unincorporated businesses.
9CON F E R E NC E VOLU M E | 2 015
T H E ECONOM IC T R E N DS , C H A L L E NGE S A N D BE H AV IOU R OF SM A L L BUSI N E S SE S I N AUST R A L I A
Figure 2: Small and Medium-sized Enterprises – Gross Value AddedShare of private non-financial sector gross value added, financial years
2007 2010 201315
25
35
%
Total
2010 201345
55
65
Medium
Small
%
Source: ABS
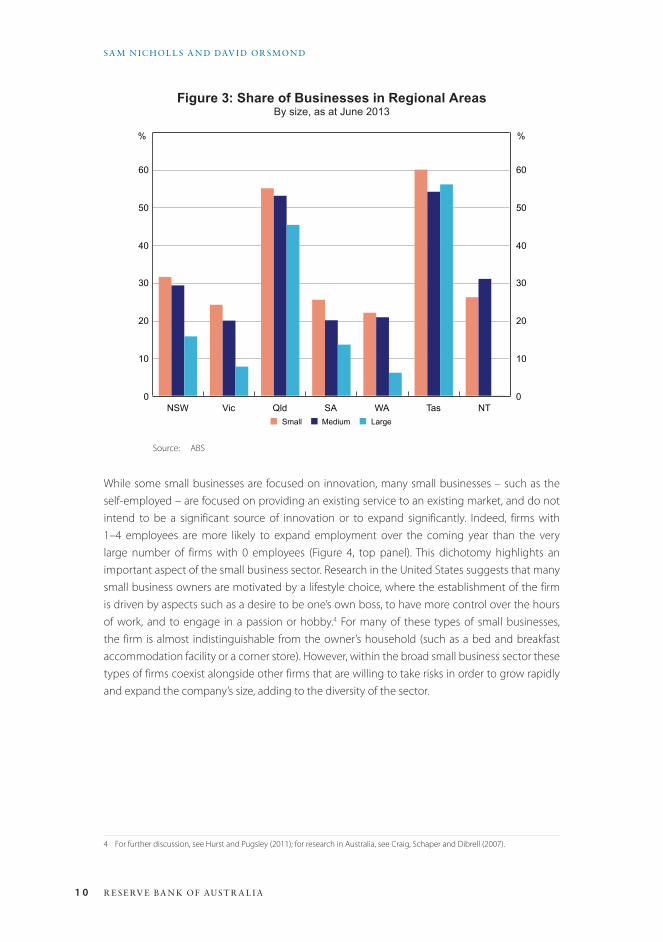
Another way of measuring the contribution of small businesses to the Australian economy is through their role in providing goods and services to regional areas, where it may be less feasible for large businesses to do so because of the low potential for economies of scale. For example, a large supermarket is less likely to open in a small town, and small businesses can fill the void. Across each state in Australia, small businesses tend to be more likely to be located in regional areas compared with larger businesses, especially in New South Wales, Victoria and Western Australia (Figure 3).
The small business sector also makes a significant indirect contribution to the economy that is not reflected in the data on small businesses’ shares of national employment and output aggregates. One of these indirect contributions is through innovation.3 Over 85 per cent of the firms in Australia that are engaging in innovative activity are small businesses, reflecting the large number of small businesses in the economy overall. While a smaller share of small businesses is engaged in innovative activity compared with larger firms (40 per cent relative to 64 per cent in 2012/13), this still represents a large number of entrepreneurial innovation activities. Somewhat tempering the interpretation of these data, small businesses only account for a small share of national research and development expenditure (13 per cent in 2011/12). Regardless, the small business sector can be an important source of productivity advances and for bringing new products to market.
3 The ABS defines innovation as the introduction of a new or significantly improved good or service, operational process, organisational or managerial process, or marketing method.
1 0 R E SE RV E BA N K OF AUST R A L I A
SA M N IC HOL L S A N D DAV I D OR SMON D
Figure 3: Share of Businesses in Regional AreasBy size, as at June 2013
NSW Vic Qld SA WA Tas NT0
10
20
30
40
50
60
0
10
20
30
40
50
60
%
■ Small ■ Medium ■ Large
%
Source: ABS
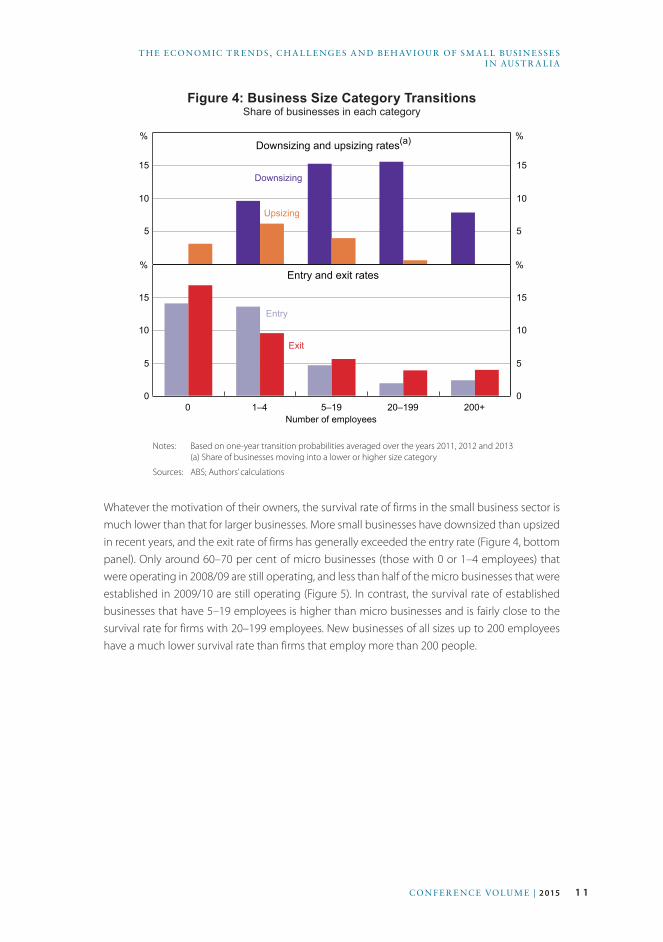
While some small businesses are focused on innovation, many small businesses – such as the self-employed – are focused on providing an existing service to an existing market, and do not intend to be a significant source of innovation or to expand significantly. Indeed, firms with 1–4 employees are more likely to expand employment over the coming year than the very large number of firms with 0 employees (Figure 4, top panel). This dichotomy highlights an important aspect of the small business sector. Research in the United States suggests that many small business owners are motivated by a lifestyle choice, where the establishment of the firm is driven by aspects such as a desire to be one’s own boss, to have more control over the hours of work, and to engage in a passion or hobby.4 For many of these types of small businesses, the firm is almost indistinguishable from the owner’s household (such as a bed and breakfast accommodation facility or a corner store). However, within the broad small business sector these types of firms coexist alongside other firms that are willing to take risks in order to grow rapidly and expand the company’s size, adding to the diversity of the sector.
4 For further discussion, see Hurst and Pugsley (2011); for research in Australia, see Craig, Schaper and Dibrell (2007).
1 1CON F E R E NC E VOLU M E | 2 015
T H E ECONOM IC T R E N DS , C H A L L E NGE S A N D BE H AV IOU R OF SM A L L BUSI N E S SE S I N AUST R A L I A
Figure 4: Business Size Category TransitionsShare of businesses in each category
5
10
15
5
10
15
%
Upsizing
Downsizing and upsizing rates(a)
0 1–4 5–19 20–199 200+0
5
10
15
0
5
10
15
Number of employees
Entry and exit rates%
%
%
Entry
Exit
Downsizing
Notes: Based on one-year transition probabilities averaged over the years 2011, 2012 and 2013 (a) Share of businesses moving into a lower or higher size category
Sources: ABS; Authors’ calculations
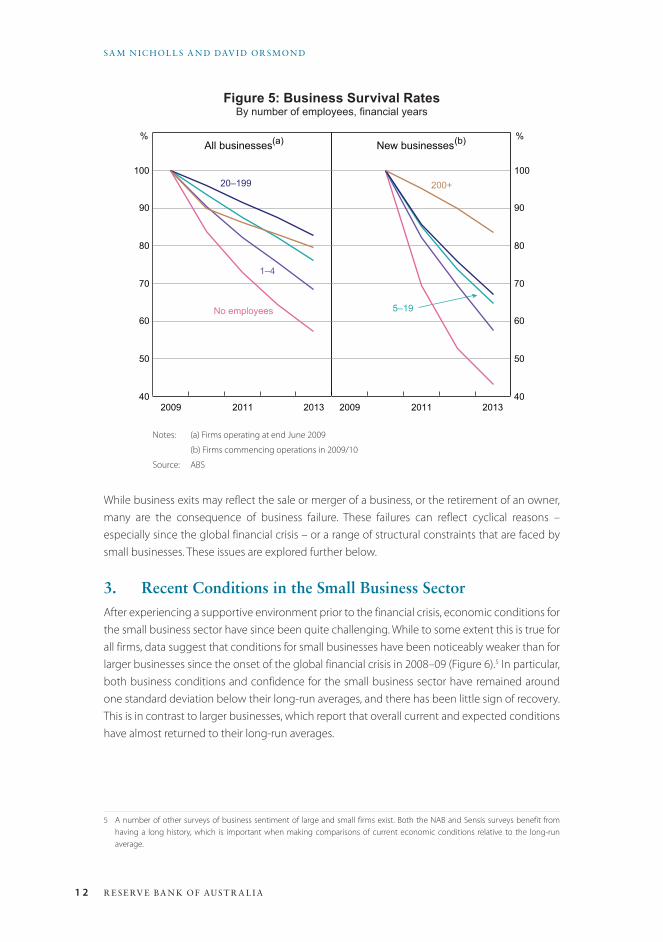
Whatever the motivation of their owners, the survival rate of firms in the small business sector is much lower than that for larger businesses. More small businesses have downsized than upsized in recent years, and the exit rate of firms has generally exceeded the entry rate (Figure 4, bottom panel). Only around 60–70 per cent of micro businesses (those with 0 or 1–4 employees) that were operating in 2008/09 are still operating, and less than half of the micro businesses that were established in 2009/10 are still operating (Figure 5). In contrast, the survival rate of established businesses that have 5–19 employees is higher than micro businesses and is fairly close to the survival rate for firms with 20–199 employees. New businesses of all sizes up to 200 employees have a much lower survival rate than firms that employ more than 200 people.
1 2 R E SE RV E BA N K OF AUST R A L I A
SA M N IC HOL L S A N D DAV I D OR SMON D
Figure 5: Business Survival RatesBy number of employees, financial years
40
50
60
70
80
90
100
%
20–199
All businesses(a)
40
50
60
70
80
90
100
2011
%New businesses(b)
201320092011 20132009
No employees
1–4
5–19
200+
Notes: (a) Firms operating at end June 2009
(b) Firms commencing operations in 2009/10
Source: ABS
While business exits may reflect the sale or merger of a business, or the retirement of an owner, many are the consequence of business failure. These failures can reflect cyclical reasons – especially since the global financial crisis – or a range of structural constraints that are faced by small businesses. These issues are explored further below.
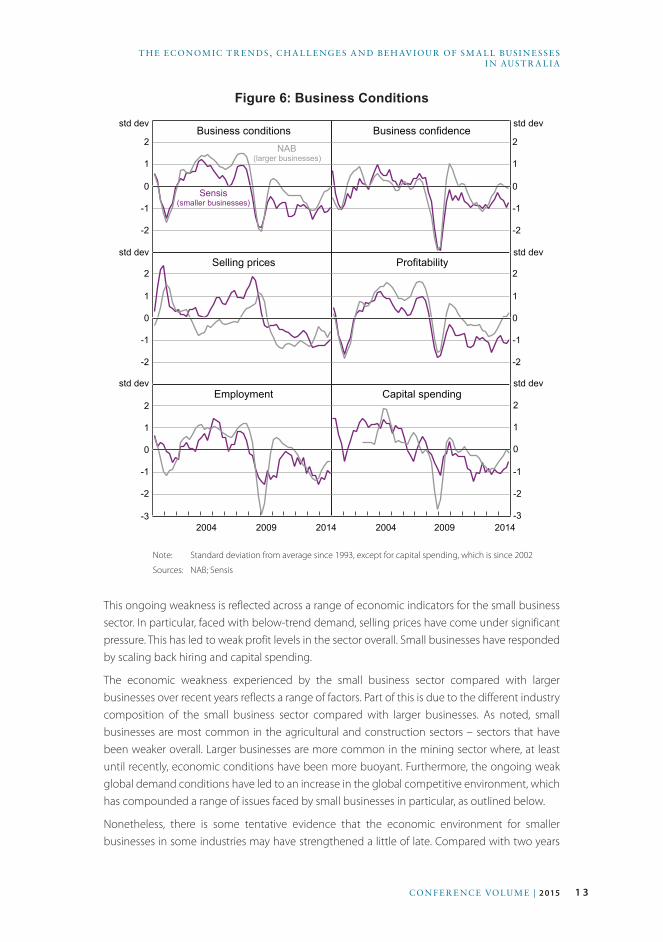
3. Recent Conditions in the Small Business SectorAfter experiencing a supportive environment prior to the financial crisis, economic conditions for the small business sector have since been quite challenging. While to some extent this is true for all firms, data suggest that conditions for small businesses have been noticeably weaker than for larger businesses since the onset of the global financial crisis in 2008–09 (Figure 6).5 In particular, both business conditions and confidence for the small business sector have remained around one standard deviation below their long-run averages, and there has been little sign of recovery. This is in contrast to larger businesses, which report that overall current and expected conditions have almost returned to their long-run averages.
5 A number of other surveys of business sentiment of large and small firms exist. Both the NAB and Sensis surveys benefit from having a long history, which is important when making comparisons of current economic conditions relative to the long-run average.
1 3CON F E R E NC E VOLU M E | 2 015
T H E ECONOM IC T R E N DS , C H A L L E NGE S A N D BE H AV IOU R OF SM A L L BUSI N E S SE S I N AUST R A L I A
Figure 6: Business Conditions
-2
-1
0
1
2
std dev
Sensis(smaller businesses)
Business conditions
-2
-1
0
1
2
-2
-1
0
1
2
-2
-1
0
1
2
Business confidence
Selling prices Profitability
Employment Capital spending
NAB(larger businesses)
std dev
std dev
2014
std dev
std dev
std dev
-3
-2
-1
0
1
2
-3
-2
-1
0
1
2
20092004201420092004
Note: Standard deviation from average since 1993, except for capital spending, which is since 2002
Sources: NAB; Sensis
This ongoing weakness is reflected across a range of economic indicators for the small business sector. In particular, faced with below-trend demand, selling prices have come under significant pressure. This has led to weak profit levels in the sector overall. Small businesses have responded by scaling back hiring and capital spending.
The economic weakness experienced by the small business sector compared with larger businesses over recent years reflects a range of factors. Part of this is due to the different industry composition of the small business sector compared with larger businesses. As noted, small businesses are most common in the agricultural and construction sectors – sectors that have been weaker overall. Larger businesses are more common in the mining sector where, at least until recently, economic conditions have been more buoyant. Furthermore, the ongoing weak global demand conditions have led to an increase in the global competitive environment, which has compounded a range of issues faced by small businesses in particular, as outlined below.
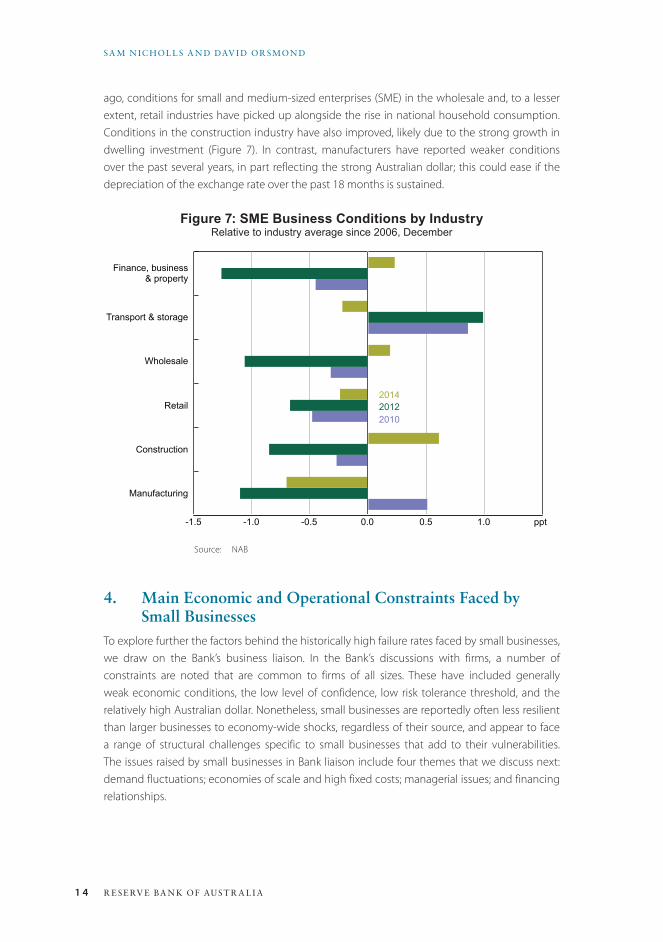
Nonetheless, there is some tentative evidence that the economic environment for smaller businesses in some industries may have strengthened a little of late. Compared with two years
1 4 R E SE RV E BA N K OF AUST R A L I A
SA M N IC HOL L S A N D DAV I D OR SMON D
ago, conditions for small and medium-sized enterprises (SME) in the wholesale and, to a lesser extent, retail industries have picked up alongside the rise in national household consumption. Conditions in the construction industry have also improved, likely due to the strong growth in dwelling investment (Figure 7). In contrast, manufacturers have reported weaker conditions over the past several years, in part reflecting the strong Australian dollar; this could ease if the depreciation of the exchange rate over the past 18 months is sustained.
Figure 7: SME Business Conditions by IndustryRelative to industry average since 2006, December
Manufacturing
Construction
Retail
Wholesale
Transport & storage
Finance, business & property
-1.5 -1.0 -0.5 0.0 0.5 1.0
201420122010
ppt
Source: NAB
4. Main Economic and Operational Constraints Faced by Small Businesses
To explore further the factors behind the historically high failure rates faced by small businesses, we draw on the Bank’s business liaison. In the Bank’s discussions with firms, a number of constraints are noted that are common to firms of all sizes. These have included generally weak economic conditions, the low level of confidence, low risk tolerance threshold, and the relatively high Australian dollar. Nonetheless, small businesses are reportedly often less resilient than larger businesses to economy-wide shocks, regardless of their source, and appear to face a range of structural challenges specific to small businesses that add to their vulnerabilities. The issues raised by small businesses in Bank liaison include four themes that we discuss next: demand fluctuations; economies of scale and high fixed costs; managerial issues; and financing relationships.
1 5CON F E R E NC E VOLU M E | 2 015
T H E ECONOM IC T R E N DS , C H A L L E NGE S A N D BE H AV IOU R OF SM A L L BUSI N E S SE S I N AUST R A L I A
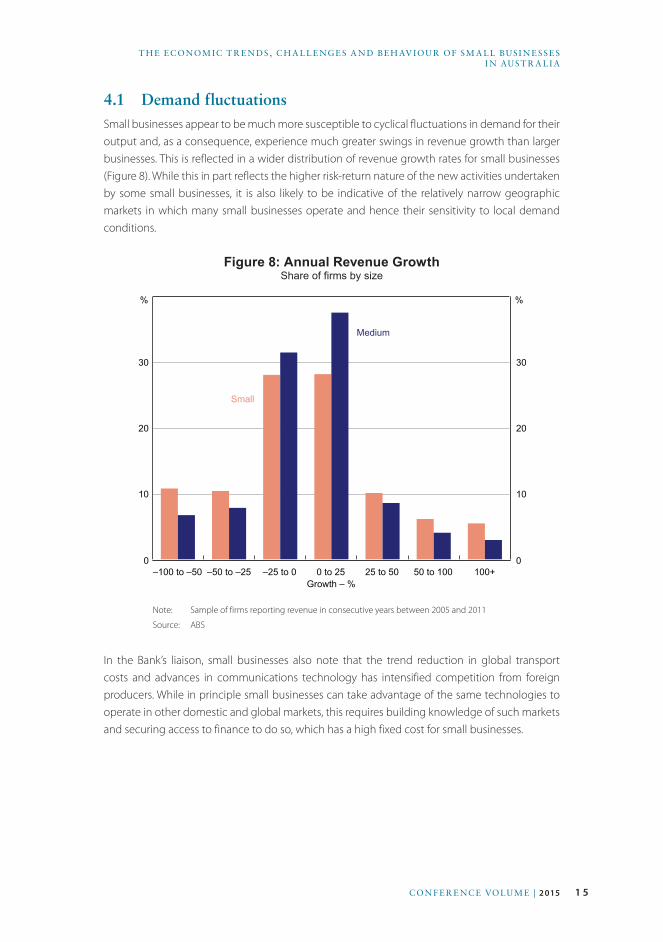
4.1 Demand fluctuationsSmall businesses appear to be much more susceptible to cyclical fluctuations in demand for their output and, as a consequence, experience much greater swings in revenue growth than larger businesses. This is reflected in a wider distribution of revenue growth rates for small businesses (Figure 8). While this in part reflects the higher risk-return nature of the new activities undertaken by some small businesses, it is also likely to be indicative of the relatively narrow geographic markets in which many small businesses operate and hence their sensitivity to local demand conditions.
Figure 8: Annual Revenue GrowthShare of firms by size
–100 to –50 –50 to –25 –25 to 0 0 to 25 25 to 50 50 to 100 100+0
10
20
30
0
10
20
30
Growth – %
%
Small
%
Medium
Note: Sample of firms reporting revenue in consecutive years between 2005 and 2011
Source: ABS
In the Bank’s liaison, small businesses also note that the trend reduction in global transport costs and advances in communications technology has intensified competition from foreign producers. While in principle small businesses can take advantage of the same technologies to operate in other domestic and global markets, this requires building knowledge of such markets and securing access to finance to do so, which has a high fixed cost for small businesses.
1 6 R E SE RV E BA N K OF AUST R A L I A
SA M N IC HOL L S A N D DAV I D OR SMON D
4.2 Economies of scale and high fixed costsMany small businesses find it challenging to compete against larger businesses since they generally cannot take advantage of economies of scale to lower their average costs. These include the costs associated with understanding and complying with changing labour, tax and other regulations and reporting requirements. These can imply a significant time commitment for small businesses. It also includes the search and training costs associated with new labour, especially for key personnel.
Related to this, small businesses generally constitute a small share of the broader market in which they operate. As such, they can be subject to less favourable pricing arrangements from suppliers, which in turn inhibits their ability to compete with larger rivals. While in some cases, small businesses can maintain profit margins by offering a product or experience that is differentiated in some way, other small businesses offer products that are broadly similar to those available from their larger competitors and hence normally operate on thinner margins.
4.3 Managerial issuesAs small businesses grow, their owner-managers often try to stretch their skills over several new areas, and can struggle to deal with the expanding complexity of operating a growing firm. Many owners are not experienced in complying with regulations, managing cash flow or evaluating capital investments rigorously. For instance, some small business owners do not have or use a well-developed business plan (and only write such plans when they need a loan), and seek to win contracts for new business to expand revenue even if the price they bid implies a very thin margin or a loss. Consultants in the small business sector report that owner-managers can be reluctant to improve their firm’s performance by hiring a professional manager to free up the owner’s time to return to their original trade or expertise. Indeed, of the small businesses that fall into corporate administration, managerial issues are the most commonly cited cause by the external administrators. Weak economic conditions, inadequate cash flow and low capital are also common causes of failure (Figure 9).6 Such limitations leave firms vulnerable when demand softens and financing conditions tighten.
6 A limitation of the corporate administrations data is that they do not capture small businesses that fail but are not incorporated.

1 7CON F E R E NC E VOLU M E | 2 015
T H E ECONOM IC T R E N DS , C H A L L E NGE S A N D BE H AV IOU R OF SM A L L BUSI N E S SE S I N AUST R A L I A
Figure 9: Corporate AdministrationsBy cause, share of total, financial years
2006 2010 20140
10
20
30
40
%
Companymanagement issues
2006 2010 20140
5
10
15
20
%
Inadequate cash flow
Economicconditions
Trading losses
Other causes
Inadequatecapital
Sources: Australian Securities and Investments Commission; Authors’ calculations
4.4 Financing relationships7
The impediments faced by small businesses also include cash constraints and the cost and access to finance, both for working capital and for investment. Payment delays by customers therefore add disproportionately to financial pressures. Other financial issues raised by small businesses in the Bank’s liaison include the continuity of personnel at banks to develop an understanding of the firm and its products, and the common requirement that loans be secured by the owner’s property. However, the vulnerabilities of small business operations outlined above also imply a comparatively higher degree of lending risk.
5. An Econometric Analysis of the Drivers of Small Businesses’ Behaviour
The previous analysis documented that small businesses face challenges handling changing demand and operational conditions, and consequently have a high failure rate. Accordingly, it might be expected that the drivers of economic and strategic decisions of small business behaviour would vary from those of larger businesses. For instance, in determining current and future pricing, employment and investment decisions, small businesses may be more sensitive to the strength of current demand conditions than larger businesses because they are less resilient to shocks. To explore whether these differences between small and large businesses exist, we use data collected by the Bank in the context of its business liaison program.
7 The financial challenges of small businesses are outlined in other papers of this Conference and, hence, are only briefly touched on here.
1 8 R E SE RV E BA N K OF AUST R A L I A
SA M N IC HOL L S A N D DAV I D OR SMON D
5.1 The dataThe Bank’s business liaison program is primarily focused on obtaining qualitative information from contacts, although attempts are also made to quantify some of the information received.8 These data cover a range of variables that have been recorded at the firm level. The variables reflect either the growth or the level of certain variables relative to the firm’s historical average, at both their current level and what the firm expects to occur over the next year. For instance, the variables where growth rates are assessed include demand, employment, wages and other costs; the variables where levels are assessed include capacity utilisation, investment spending and margins.
The verbal descriptions of current and expected conditions provided by firms are assigned a ‘likert score’ by an officer of the Bank. These scores take a value between –5 and +5, with higher values corresponding to stronger growth or a higher level of a particular variable relative to the firm’s own historical average. To provide a common standard, for scales that measure growth in variables, a score of 2 is interpreted as an average rate of growth for the firm and 0 for no growth; for scales that measure levels, a score of 0 is interpreted as the firm’s average level.
The data contain information on developments over the past year and firms’ expectations for the coming year. In practice, the information incorporated may not be based on a precise one-year period. Firms may provide information based on their most recent reporting cycle, such as the financial or calendar year. The forward-looking data may also be affected by biases related to reporting periods or myopia. Overall, however, we do not believe that our results outlined below are substantially affected by these factors.
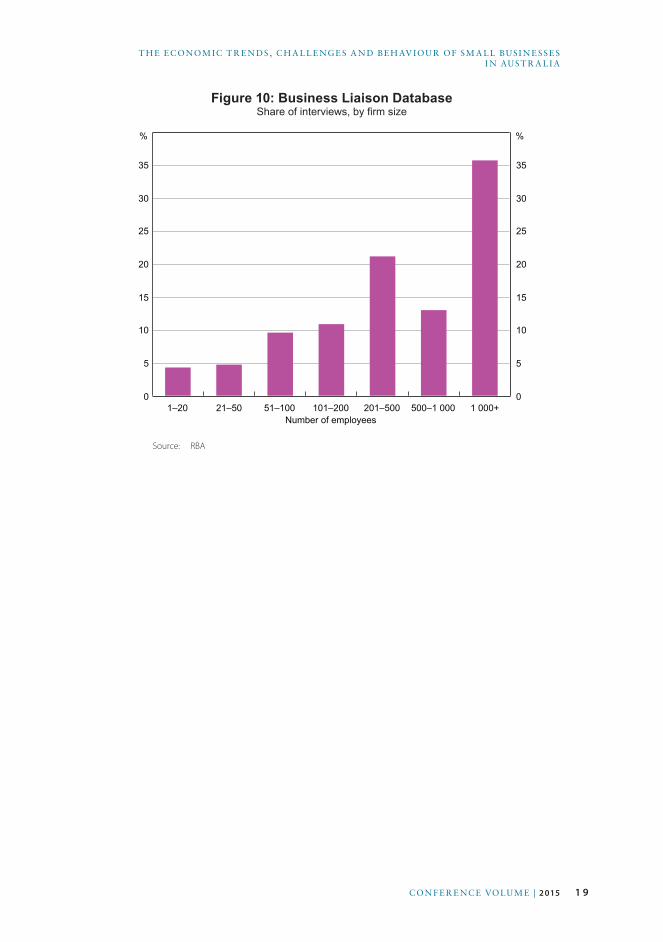
The composition of the likert database reflects the frequency with which firms in different industries are contacted by the Bank. In general, the focus of the Bank’s discussions with firms is on the more cyclically sensitive areas of the economy, and a greater share of the discussions is with larger businesses where conditions are likely to reflect broader economic trends, rather than idiosyncratic factors. Furthermore, firms are normally contacted once they have a noticeable presence in their market, and hence the sample contains very few start-up businesses. There are also virtually no self-employed persons in the sample; most firms have at least 10 employees. Nevertheless, about 5 per cent of the full sample consists of firms with up to 20 employees, corresponding to around 300 observations over the full sample period since 2001 (Figure 10). Of the small businesses in our sample, over half have more than 10 employees and there are virtually no firms with 5 or fewer employees.9 Our sample of small businesses is therefore probably more homogenous than the overall population of small businesses, though it is still more heterogeneous than our sample of larger businesses. The industry composition of these firms is concentrated within the manufacturing, business services and construction industries (Figure 11).
8 For more information on the Bank’s business liaison program, see RBA (2014).
9 Within the class of businesses with 20 or fewer employees in the business liaison database, the average number of employees is 11. The results are therefore most representative of behaviour for firms in the upper end of the 1–20 employees category.
1 9CON F E R E NC E VOLU M E | 2 015
T H E ECONOM IC T R E N DS , C H A L L E NGE S A N D BE H AV IOU R OF SM A L L BUSI N E S SE S I N AUST R A L I A
Figure 10: Business Liaison DatabaseShare of interviews, by firm size
1–20 21–50 51–100 101–200 201–500 500–1 000 1 000+0
5
10
15
20
25
30
35
0
5
10
15
20
25
30
35
Number of employees
%%
Source: RBA

2 0 R E SE RV E BA N K OF AUST R A L I A
SA M N IC HOL L S A N D DAV I D OR SMON D
Figure 11: Industry CompositionShare of interviews, by industry and firm size
Who
lesa
le &
reta
il tra
de
Man
ufac
turin
g
Bus
ines
s se
rvic
es
Con
stru
ctio
n
Hou
seho
ldse
rvic
es
Tran
spor
t&
sto
rage
Min
ing
Agr
icul
ture
Util
ities
Tour
ism
0
5
10
15
20
0
5
10
15
20
%■ 200+ employees■ 21–200 employees■ 1–20 employees
%
Source: RBA
5.2 The methodologyUsing these data, we can compare the behaviour of firms of various sizes by modelling certain variables with a standard fixed-effects regression model. Specifically, the dependent variables (Y) examined are:
• price growth
• employment growth
• investment spending.
Each of these variables can be directly influenced by firms and therefore analysing their determinants enables us to draw inferences about the economic behaviour of firms in different size groups. We first aim to identify differences in the drivers of firms’ current behaviour across different size groups; later we examine how firms form expectations for their future behaviour.
Our models are of the form:
Yit =βXit+αSiZit+εit
where X is a set of control variables and Si is a set of indicator variables for firm size, as of the most recent liaison meeting (i.e. Si does not vary over time; information on firm size is updated regularly after each meeting with firms, but a time series is not maintained). In each regression,
2 1CON F E R E NC E VOLU M E | 2 015
T H E ECONOM IC T R E N DS , C H A L L E NGE S A N D BE H AV IOU R OF SM A L L BUSI N E S SE S I N AUST R A L I A
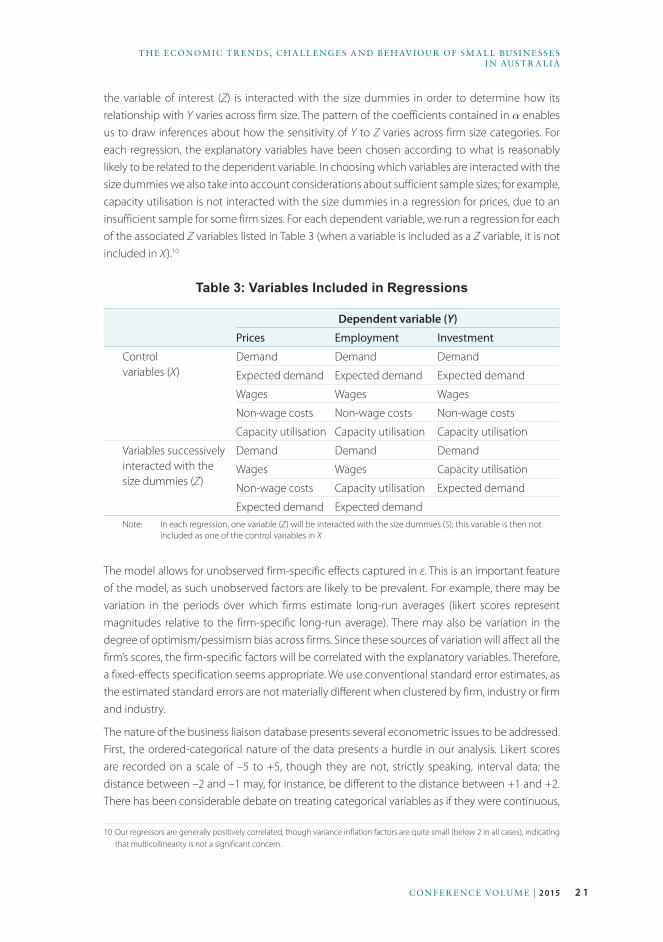
the variable of interest (Z) is interacted with the size dummies in order to determine how its relationship with Y varies across firm size. The pattern of the coefficients contained in α enables us to draw inferences about how the sensitivity of Y to Z varies across firm size categories. For each regression, the explanatory variables have been chosen according to what is reasonably likely to be related to the dependent variable. In choosing which variables are interacted with the size dummies we also take into account considerations about sufficient sample sizes; for example, capacity utilisation is not interacted with the size dummies in a regression for prices, due to an insufficient sample for some firm sizes. For each dependent variable, we run a regression for each of the associated Z variables listed in Table 3 (when a variable is included as a Z variable, it is not included in X ).10
Table 3: Variables Included in Regressions
Dependent variable (Y)
Prices Employment Investment
Control variables (X )
Demand Demand Demand
Expected demand Expected demand Expected demand
Wages Wages Wages
Non-wage costs Non-wage costs Non-wage costs
Capacity utilisation Capacity utilisation Capacity utilisation
Variables successively interacted with the size dummies (Z )
Demand Demand Demand
Wages Wages Capacity utilisation
Non-wage costs Capacity utilisation Expected demand
Expected demand Expected demandNote: In each regression, one variable (Z ) will be interacted with the size dummies (S); this variable is then not
included as one of the control variables in X
The model allows for unobserved firm-specific effects captured in ε. This is an important feature of the model, as such unobserved factors are likely to be prevalent. For example, there may be variation in the periods over which firms estimate long-run averages (likert scores represent magnitudes relative to the firm-specific long-run average). There may also be variation in the degree of optimism/pessimism bias across firms. Since these sources of variation will affect all the firm’s scores, the firm-specific factors will be correlated with the explanatory variables. Therefore, a fixed-effects specification seems appropriate. We use conventional standard error estimates, as the estimated standard errors are not materially different when clustered by firm, industry or firm and industry.
The nature of the business liaison database presents several econometric issues to be addressed. First, the ordered-categorical nature of the data presents a hurdle in our analysis. Likert scores are recorded on a scale of –5 to +5, though they are not, strictly speaking, interval data; the distance between –2 and –1 may, for instance, be different to the distance between +1 and +2. There has been considerable debate on treating categorical variables as if they were continuous,
10 Our regressors are generally positively correlated, though variance inflation factors are quite small (below 2 in all cases), indicating that multicollinearity is not a significant concern.
2 2 R E SE RV E BA N K OF AUST R A L I A
SA M N IC HOL L S A N D DAV I D OR SMON D
particularly in the field of health sciences. Nunnally and Bernstein (1994) state that, typically, little information is lost when categorical variables with 11 or more categories are treated as continuous. Similarly, Streiner and Norman (2008) note that while debate is ongoing, one can analyse data from rating scales as if they were equally spaced without introducing severe bias, as long as the distribution is not severely skewed.
In contrast, Townsend and Ashby (1984) argue that the ordered-categorical data must be demonstrated to have a linear relationship with the underlying latent variable of interest before they can be treated as continuous. Fortunately, there are certain series available that allow an examination of the relationship that two of the likert scales have with the underlying variables that they aim to measure: sales growth figures for several contacts that were collected in the course of one of the Bank’s internal projects; and the pace of wage growth, which is collected alongside wage growth likert scores. The figures for actual sales and wage growth were compared with the likert scores for demand growth and wage growth. For both sales growth and wage growth, the actual growth rates appear to exhibit a linear relationship with the likert data. These findings, combined with generally supportive recommendations from the literature, make us comfortable in imposing linearity on the data, especially given the broader array of econometric methods that are available when analysing standard continuous data.
A second methodological issue concerns the potential for an omitted variable bias in the model. There are undoubtedly sources of shocks to the dependent variables in the models that are not captured by any of the explanatory variables in the model. Such shocks may also be specific to firms in certain size categories. For example, liaison over the financial crisis period indicated that smaller businesses were affected by credit constraints to a greater degree than larger businesses were. This would have materially affected smaller businesses’ investment decisions over the 2008–09 period and possibly other aspects of their behaviour. To capture size and time-period specific shocks such as the financial crisis we include a series of indicator variables for each combination of year and size category.
Third, as noted above, the Bank meets with the majority of liaison contacts on an annual basis. However, for some contacts, scores are recorded as often as quarterly. Quarterly observations for a firm may introduce some bias into our estimates as the scores relate to growth over the past year or expectations for growth over the coming year. This type of ‘overlapping data’ problem has been explored in detail in the context of time series analysis (Dhrymes 1971; Harri and Brorsen 2009; Britten-Jones, Neuberger and Nolte 2011), and has been shown to induce correlation between the error terms and the explanatory variables. To avoid this problem, we drop from the sample any observations from a single firm that are less than one year apart.
2 3CON F E R E NC E VOLU M E | 2 015
T H E ECONOM IC T R E N DS , C H A L L E NGE S A N D BE H AV IOU R OF SM A L L BUSI N E S SE S I N AUST R A L I A
5.3 Results for current behaviourThe elements of α are interpreted as the typical change in the relevant dependent variable associated with a unit change in the explanatory variable. Plotting the elements of α across size categories provides a simple visual summary of how these sensitivities vary across size groups. This provides an indication of whether, and by how much, the behaviour of small businesses varies compared with that of larger businesses, on average.
5.3.1 Price-setting behaviour
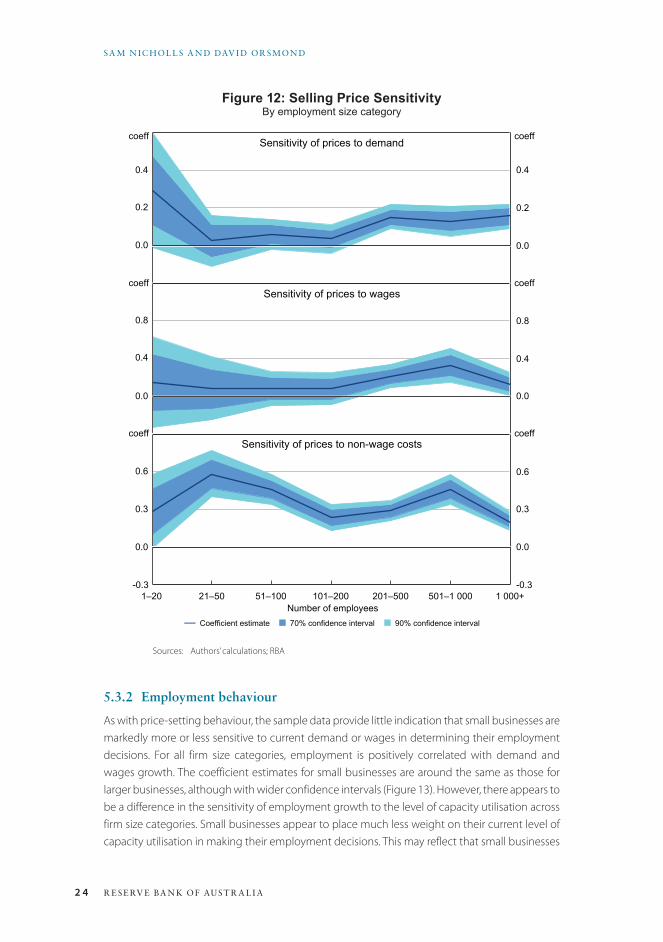
We start by examining the pricing behaviour of small businesses.11 The coefficient estimates suggest that the price-setting behaviour of small businesses (here taken as those with 20 or fewer employees) with respect to changes in demand is different from that of larger businesses. Small businesses are, on average, much more responsive in setting their prices. However, the confidence bands around the coefficient estimates are very wide, which likely reflects the significant heterogeneity within the small business sector as well as the smaller sample sizes for these types of firms in the Bank’s liaison. As such, we cannot reject that the pricing strategies of smaller businesses are the same as those employed by larger businesses (Figure 12).12
The same broad conclusions can be drawn with respect to the importance of wage and non-wage cost pressures; specifically, the confidence intervals around the estimates of the sensitivity of current pricing decisions to changes in wages and other costs are again quite wide, and overall the pricing behaviour of small businesses taken as a group is not statistically different from that for larger businesses.
11 Economic theory and empirical evidence suggests that in setting the prices of their output, firms take into account current demand conditions or follow a simple mark-up over costs. The evidence presented here indicates that both current demand conditions and mark-up strategies affect the pricing decisions of firms in Australia, regardless of size.
12 While the differences between the coefficients contained in α are not statistically significant in several of the regression results presented here, some caution is needed in concluding from this that the economic behaviour of small businesses is therefore similar to that for larger businesses. In particular, the sample sizes used here are more limited for small businesses, which results in wider confidence intervals. Additionally, the heterogeneous nature of small businesses along many dimensions tends to further widen our confidence intervals.
2 4 R E SE RV E BA N K OF AUST R A L I A
SA M N IC HOL L S A N D DAV I D OR SMON D
Figure 12: Selling Price SensitivityBy employment size category
0.0
0.2
0.4
coeffSensitivity of prices to demand
⎯ Coefficient estimate ■ 70% confidence interval ■ 90% confidence interval
0.0
0.4
0.8
1–20 21–50 51–100 101–200 201–500 501–1 000 1 000+-0.3
0.0
0.3
0.6
Number of employees
Sensitivity of prices to wages
Sensitivity of prices to non-wage costs
coeff
coeff
coeff
coeff
coeff
0.4
0.2
0.0
0.8
0.4
0.0
0.6
0.0
0.3
-0.3
Sources: Authors’ calculations; RBA
5.3.2 Employment behaviour
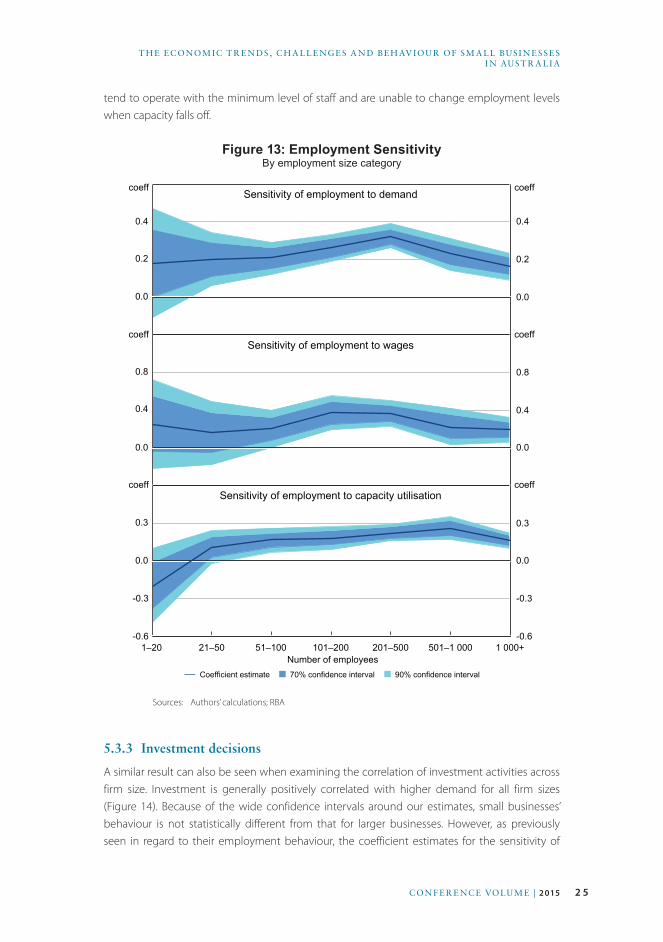
As with price-setting behaviour, the sample data provide little indication that small businesses are markedly more or less sensitive to current demand or wages in determining their employment decisions. For all firm size categories, employment is positively correlated with demand and wages growth. The coefficient estimates for small businesses are around the same as those for larger businesses, although with wider confidence intervals (Figure 13). However, there appears to be a difference in the sensitivity of employment growth to the level of capacity utilisation across firm size categories. Small businesses appear to place much less weight on their current level of capacity utilisation in making their employment decisions. This may reflect that small businesses
2 5CON F E R E NC E VOLU M E | 2 015
T H E ECONOM IC T R E N DS , C H A L L E NGE S A N D BE H AV IOU R OF SM A L L BUSI N E S SE S I N AUST R A L I A
tend to operate with the minimum level of staff and are unable to change employment levels when capacity falls off.
Figure 13: Employment SensitivityBy employment size category
0.0
0.2
0.4
coeffSensitivity of employment to demand
⎯ Coefficient estimate ■ 70% confidence interval ■ 90% confidence interval
0.0
0.4
0.8
1–20 21–50 51–100 101–200 201–500 501–1 000 1 000+-0.6
-0.3
0.0
0.3
Number of employees
Sensitivity of employment to wages
Sensitivity of employment to capacity utilisation
coeff
coeff
coeff
coeff
coeff
0.4
0.2
0.0
0.8
0.4
0.0
0.3
-0.3
0.0
-0.6
Sources: Authors’ calculations; RBA
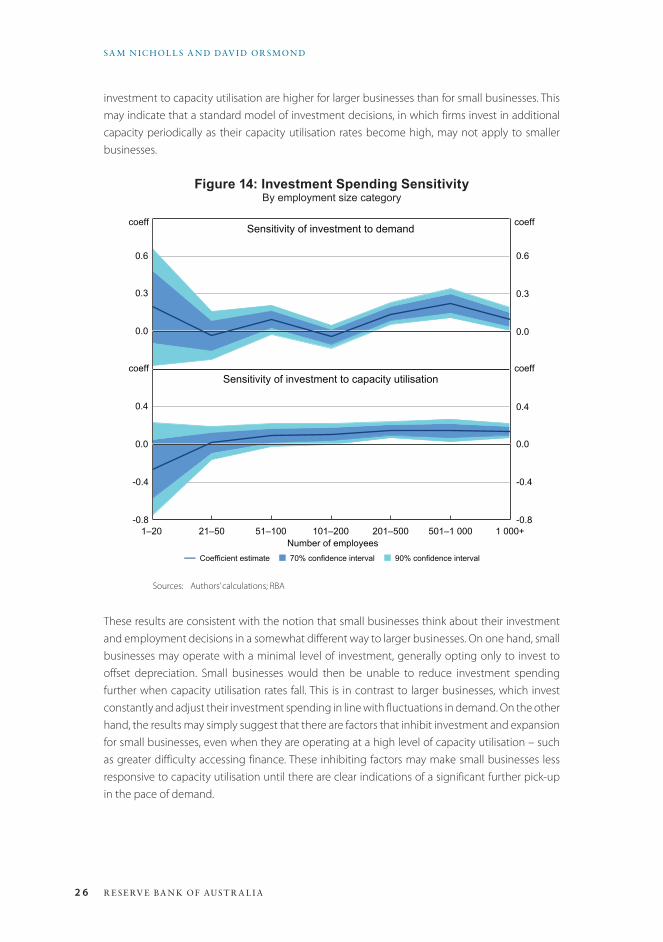
5.3.3 Investment decisions
A similar result can also be seen when examining the correlation of investment activities across firm size. Investment is generally positively correlated with higher demand for all firm sizes (Figure 14). Because of the wide confidence intervals around our estimates, small businesses’ behaviour is not statistically different from that for larger businesses. However, as previously seen in regard to their employment behaviour, the coefficient estimates for the sensitivity of
2 6 R E SE RV E BA N K OF AUST R A L I A
SA M N IC HOL L S A N D DAV I D OR SMON D
investment to capacity utilisation are higher for larger businesses than for small businesses. This may indicate that a standard model of investment decisions, in which firms invest in additional capacity periodically as their capacity utilisation rates become high, may not apply to smaller businesses.
Figure 14: Investment Spending SensitivityBy employment size category
0.0
0.3
0.6
coeffSensitivity of investment to demand
⎯ Coefficient estimate ■ 70% confidence interval ■ 90% confidence interval
1–20 21–50 51–100 101–200 201–500 501–1 000 1 000+-0.8
-0.4
0.0
0.4
Number of employees
Sensitivity of investment to capacity utilisationcoeff
coeff
coeff
0.6
0.3
0.0
0.4
-0.4
0.0
-0.8
Sources: Authors’ calculations; RBA
These results are consistent with the notion that small businesses think about their investment and employment decisions in a somewhat different way to larger businesses. On one hand, small businesses may operate with a minimal level of investment, generally opting only to invest to offset depreciation. Small businesses would then be unable to reduce investment spending further when capacity utilisation rates fall. This is in contrast to larger businesses, which invest constantly and adjust their investment spending in line with fluctuations in demand. On the other hand, the results may simply suggest that there are factors that inhibit investment and expansion for small businesses, even when they are operating at a high level of capacity utilisation – such as greater difficulty accessing finance. These inhibiting factors may make small businesses less responsive to capacity utilisation until there are clear indications of a significant further pick-up in the pace of demand.
2 7CON F E R E NC E VOLU M E | 2 015
T H E ECONOM IC T R E N DS , C H A L L E NGE S A N D BE H AV IOU R OF SM A L L BUSI N E S SE S I N AUST R A L I A
5.3.4 Results for future behaviour
Another way of exploring the motivations behind small businesses’ behaviour is to examine how their plans for future price, wage and employment growth are determined. In particular, we examine the relative importance of both current and expected demand in influencing firms’ expected price, employment and investment growth. Firms that place a greater weight on expected demand relative to current demand are deemed to be more ‘forward looking’ in their behaviour.
Several factors may affect the degree to which small businesses are more or less forward looking than larger businesses. On the one hand, small businesses that tend to be highly strategic in their efforts to tap new markets are likely to make pricing, hiring and investment decisions pre-emptively, based on their expectations of future demand for their products. For such firms, expected demand should be a significant variable in driving their behaviour. On the other hand, firms where the owner is motivated by lifestyle choices or firms that are more vulnerable to unexpected developments may not be particularly strategic in their expected behaviour. Additionally, small businesses can face constraints on their ability to act on their expectations, such as difficulty accessing finance and generally longer search periods in order to find quality staff.
We investigate whether small businesses tend to be more or less forward looking in their behaviour than larger businesses by using a simple variation of the fixed-effects model described above. Firms’ expected prices, employment and investment outcomes are modelled using the same explanatory variables outlined above. However, now we also allow for variation in the coefficients on both current demand and expected demand across size categories:
Yite =βXit+α1SiDit
e+α2SiDit+εit
where Ye is the firm’s expectation for prices, employment or investment over the coming year, X is a set of control variables as listed in Table 3 (excluding current and expected demand), D represents the likert score for current demand and D e represents the likert score for expected demand. We estimate the model for each of the three dependent variables listed in Table 3. We are particularly interested in the statistical significance of the coefficient on expected demand relative to the coefficient on current demand. A straightforward measure of the relative significance of the two variables is provided by the t-statistic from a test that the difference between coefficients on D and D e for a given size category is statistically different from zero. Specifically, for each size category i our test statistic is:
ti =
α1i−α2i
SE α1i−α2i( ).
A positive t-statistic indicates that firms place more weight on their expectations for future demand than on the level of demand they have experienced over the past year. A negative t-statistic could indicate that firms do not tend to act on their expectations for future demand, possibly because they are prevented from doing so, or because they simply do not have confidence in their projections.
2 8 R E SE RV E BA N K OF AUST R A L I A
SA M N IC HOL L S A N D DAV I D OR SMON D
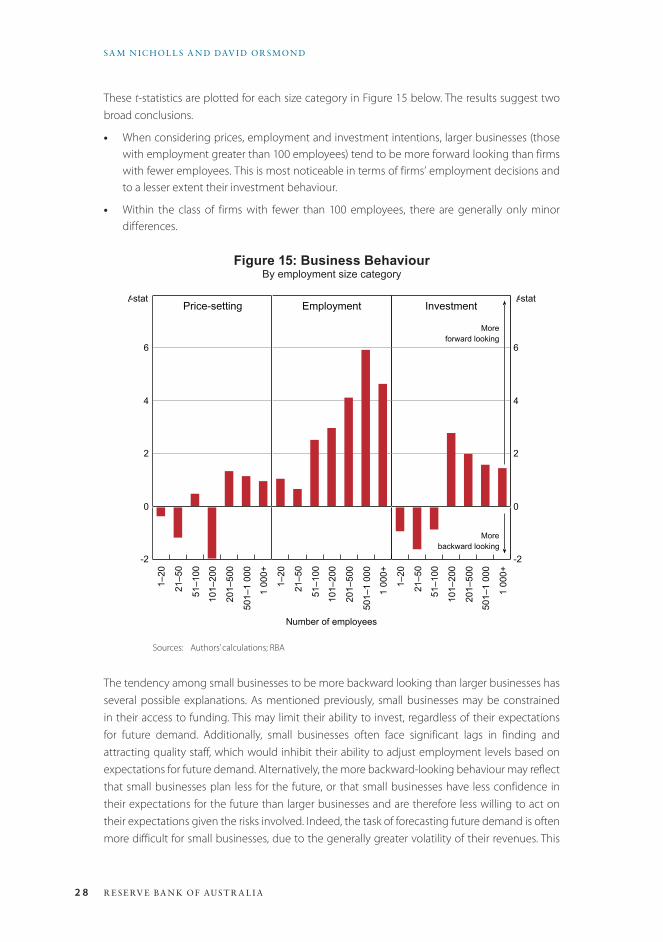
These t-statistics are plotted for each size category in Figure 15 below. The results suggest two broad conclusions.
• When considering prices, employment and investment intentions, larger businesses (those with employment greater than 100 employees) tend to be more forward looking than firms with fewer employees. This is most noticeable in terms of firms’ employment decisions and to a lesser extent their investment behaviour.
• Within the class of firms with fewer than 100 employees, there are generally only minor differences.
Figure 15: Business BehaviourBy employment size category
1–20
21–5
0
51–1
00
101–
200
201–
500
501–
1 00
0
1 00
0+
-2
0
2
4
6
t-stat
Moreforward looking
Employment
1–20
21–5
0
51–1
00
101–
200
201–
500
501–
1 00
0
1 00
0+
Number of employees
1–20
21–5
0
51–1
00
101–
200
201–
500
501–
1 00
0
1 00
0+
-2
0
2
4
6
Price-setting Investmentt-stat
Morebackward looking
Sources: Authors’ calculations; RBA
The tendency among small businesses to be more backward looking than larger businesses has several possible explanations. As mentioned previously, small businesses may be constrained in their access to funding. This may limit their ability to invest, regardless of their expectations for future demand. Additionally, small businesses often face significant lags in finding and attracting quality staff, which would inhibit their ability to adjust employment levels based on expectations for future demand. Alternatively, the more backward-looking behaviour may reflect that small businesses plan less for the future, or that small businesses have less confidence in their expectations for the future than larger businesses and are therefore less willing to act on their expectations given the risks involved. Indeed, the task of forecasting future demand is often more difficult for small businesses, due to the generally greater volatility of their revenues. This
2 9CON F E R E NC E VOLU M E | 2 015
T H E ECONOM IC T R E N DS , C H A L L E NGE S A N D BE H AV IOU R OF SM A L L BUSI N E S SE S I N AUST R A L I A
may result in small businesses having less confidence in their expectations for the future. A final possibility is that small businesses can rely on having greater flexibility in their operations that allows them to respond to current developments, and therefore have less need to be forward looking.
6. ConclusionsWhile small businesses play an important role in the Australian economy, they face a number of challenges in dealing with fluctuations in demand, the costs of doing business, managerial skills and financial issues. Nonetheless, despite these challenges, there is no strong evidence that the economic behaviour of the small business sector is different to that of larger businesses. While the significant heterogeneity in the small business sector and relatively small sample sizes make it difficult to draw statistically significant conclusions, the results indicate two possible exceptions to this general conclusion: small businesses appear to respond much less to capacity utilisation than larger businesses; and they appear to be less forward looking in forming their pricing, employment and investment plans.

3 0 R E SE RV E BA N K OF AUST R A L I A
SA M N IC HOL L S A N D DAV I D OR SMON D
ReferencesBritten-Jones M, A Neuberger and I Nolte (2011), ‘Improved Inference in Regression with Overlapping
Observations’, Journal of Business Finance & Accounting, 38(5-6), pp 657–683.
Connolly E, D Norman and T West (2012), ‘Small Business: An Economic Overview’, Small Business Finance
Roundtable, Reserve Bank of Australia, Sydney, pp 1–13.
Craig JB, M Schaper and C Dibrell (2007), ‘Being the Boss and Working for a Boss: Upsides and Downsides’,
Paper presented at the 21st Australian & New Zealand Academy of Management Conference ‘Managing Our
Intellectual and Social Capital’, Sydney, 4–7 December.
Dhrymes PJ (1971), Distributed Lags: Problems of Estimation and Formulation, Mathematical Economics Texts,
8, Holden-Day, Inc, San Franscisco.
Harri A and BW Brorsen (2009), ‘The Overlapping Data Problem’, Quantitative and Qualitative Analysis in
Social Sciences, 3(3), pp 78–115.
Hurst E and BW Pugsley (2011), ‘What Do Small Businesses Do?’, Brookings Papers on Economic Activity, Fall,
pp 73–118.
Nunnally JC and IH Bernstein (1994), Psychometric Theory, 3rd edn, McGraw-Hill Series in Psychology,
McGraw-Hill, New York.
RBA (Reserve Bank of Australia) (2014), ‘The RBA’s Business Liaison Program’, RBA Bulletin, September,
pp 1–5.
Streiner DL and GR Norman (2008), Health Measurement Scales: A Practical Guide to their Development
and Use, 4th edn, Oxford University Press, Oxford.
Townsend JT and FG Ashby (1984), ‘Measurement Scales and Statistics: The Misconception Misconceived’,
Psychological Bulletin, 96(2), pp 394–401.
3 1CON F E R E NC E VOLU M E | 2 015
Discussion
1. Bill AllenThis paper targets a worthy area for investigation in seeking to add to the story behind why some small businesses fail and others do not. In acknowledging that small businesses ‘face many operational challenges’, this paper goes one step further and asks whether these challenges ‘affect the business decisions of small businesses relative to those of larger businesses’.
The paper is successful in this regard, shedding some light on differences in economic decisions regarding selling price, employment and investment spending sensitivity. I also applaud the creative presentation of these results (such as in Figures 14 and 15). It can be difficult to convey results in a way that helps to tell the story, and these figures do it well.
In reading the paper, I encourage readers to consider not only the question examined in this paper – do economic decisions differ between small and larger businesses? – but also the ‘follow-up questions’: why might they differ? does it matter that they differ? and how can these results be used to create an environment that supports small business? This paper is part of a much longer journey in trying to better understand the reasons behind the success and failure of small businesses.
In my comments, I will focus primarily on the modelling undertaken using data from the Reserve Bank of Australia’s (RBA) business liaison program. However, before I do, I want to briefly address the Australian Bureau of Statistics (ABS) data used to look at the share of businesses by size in regional areas (see Figure 3). I suggest caution in interpreting these numbers for medium and large businesses. In particular, for businesses with multiple locations, the ABS only records a single location – usually that of the head office.1 This fact affects the interpretation of these numbers.
It is also important to consider the nature of business exits in the ABS data. Many people’s immediate reaction to a business exit is that the business has failed. However, business exits cover a range of outcomes: businesses that cease to operate; ‘dormant’ businesses – that is, businesses that have not remitted goods and services tax (GST) for at least five quarters and are, therefore, not included in the ABS data; and even successful businesses, where the business is purchased by and incorporated into a larger business. Dormant businesses can be particularly misleading. These can include new businesses that register for an Australian business number to claim GST credits for set-up costs and then fall into dormancy until business operations commence. Once again, these facts make the interpretation of these data difficult.
Coming back to the RBA’s business liaison program, the analysis in the paper can only make inferences about the types of firms covered by the liaison program and, in this respect, there are a number of caveats to bear in mind. This is not a criticism of the RBA liaison program – it has been
1 The Australian Business Register now stores information on multiple locations – at least for larger businesses – and the ABS hopes to incorporate this information into its statistics in the future.
3 2 R E SE RV E BA N K OF AUST R A L I A
DISC US SION
developed to focus on the much broader needs of the RBA, rather than explicitly on the issues surrounding small businesses. However, the analysis can nonetheless provide valuable insights into the business population that it does represent. However, it is not the same as the population of Australian businesses.
First, the industry distribution of firms covered by the RBA’s liaison program differs from that found in the business population, consistent with the broader purpose of the program. For example, in the RBA’s liaison program there are more manufacturing firms and fewer firms in the construction or agriculture industries. However, I have been reassured by the authors that variables to look for industry effects were considered in the modelling and found to be insignificant.
Still, the most significant difference between the distribution of the RBA’s liaison program and ABS data is that there are virtually no firms with five or fewer employees in the RBA’s survey. This needs to be considered in the context of the fact that it is these firms that are most in danger of not surviving.
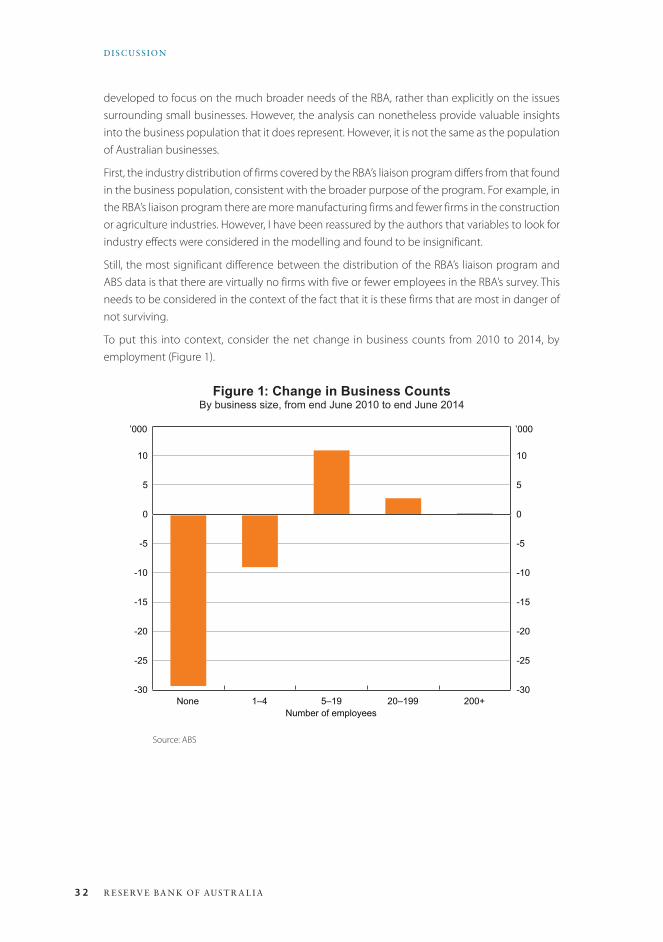
To put this into context, consider the net change in business counts from 2010 to 2014, by employment (Figure 1).
Figure 1: Change in Business CountsBy business size, from end June 2010 to end June 2014
None 1–4 5–19 20–199 200+-30
-25
-20
-15
-10
-5
0
5
10
-30
-25
-20
-15
-10
-5
0
5
10
Number of employees
’000’000
Source: ABS
3 3CON F E R E NC E VOLU M E | 2 015
DISC US SION
From June 2010 to June 2014, there was a net loss of 38 272 businesses with fewer than five employees (including non-employers). These businesses are not considered in the paper’s analysis. Further, there was a net increase of 13 784 businesses with five or more employees; this increase must have ultimately come from those businesses with fewer or no employees.
To summarise, it is this sub-population that is not covered by the RBA liaison program which is both of greatest danger of business failure and a feeder group to small and medium-sized enterprises. The RBA liaison program is not structured to address questions about this sub-population; another data source would be required to extend the analysis in the paper to this group.
This raises further questions on the possible differences in economic decisions between small and larger businesses. That is, how do the economic decisions differ between thriving small businesses (which might include growing businesses or ‘successful’ exits), stable small businesses and struggling or failing small businesses. Further, is the current status of these small businesses deliberate (such as a lifestyle choice), or has it been forced upon them through various circumstances? If it has been forced upon them, is there anything that should be done to advise those small businesses to better equip them to respond to challenges?
The size and nature of the RBA liaison program will not support this type of analysis, so the question is: what data are available to assist with these follow-up questions? Administrative datasets are attractive options because such datasets cover all – or at least more – of these small businesses. For example, taxation data – such as business income tax or business activity statements – can provide longitudinal data on employment, turnover and other attributes. The ABS Business Longitudinal Database also considers factors such as innovation and the use of information technology, as collected in the Business Characteristics Survey. However, these datasets lack the broader qualitative information on economic decisions that are available from the RBA liaison program.
Nonetheless, this paper provides some useful insights on the economic decisions of small business. These are interesting questions and deserve further investigation.
2. General DiscussionDiscussion generally focused on the quality of the data and its interpretation. Initial discussion from several participants highlighted potential measurement issues associated with ABS data on business entry and exit rates. One participant noted that some businesses maintain multiple Australian business numbers (ABN) for the same business. An example is when one ABN corresponds to the legal entity that owns the business’ assets, while a different ABN corresponds to the entity that employs the business’ workers. This implies that some businesses will be mistakenly classified as sole traders. Another example is when a larger business buys a smaller business but keeps the two businesses under separate ABNs for taxation reasons. Related to this, a participant queried how firm ‘successions’ – where an older firm owner chooses to sell or transfer their firm – are reflected in the business exit data. Another participant noted that not all exits should be interpreted as business failures; for instance, an exit can be a success where a company is bought out by and merged into another company.
3 4 R E SE RV E BA N K OF AUST R A L I A
DISC US SION
In response, a few participants noted that the quality of data related to business exits has improved over the last decade. The ABS has been correcting problems related to multiple ABNs for the same business by linking ABNs for the same economic entity and another participant noted that the ABS data exclude businesses that have not remitted GST in the last five quarters for quarterly remitters, or in the last three years for annual remitters. Underlining the improved quality, one participant noted that exit rates observed in the ABS data are consistent with high-quality data from other economies. The participant went on to argue that the seemingly high exit rates are not a cause for concern, as the vast majority of exits relate to micro businesses (i.e. those with fewer than five employees). The participant argued that many of these exits reflect ‘experiments’ where an individual has tried running their own firm and has failed, but very few of these failures result in bankruptcy or losses for other entities; that is, the entrepreneur is unlikely to have lost their house or generated losses for customers, suppliers or creditors. Additionally, many of these ‘failed’ entrepreneurs return to gainful employment.
On the topic of business exits, one participant suggested that there might be a difference between Australia and the United States when it comes to attitudes towards small business failure. The participant argued that business failure is viewed negatively in Australia; by contrast, in the United States there seems to be a sense that the potential for business failure is a natural consequence of innovation and risk-taking. The participant suggested that the relatively low cost of business failure in the United States allowed failed entrepreneurs to attempt other entrepreneurial endeavours, and that perhaps this was due to differences in bankruptcy proceedings. Finally, the participant proposed that improving Australia’s bankruptcy laws might encourage entrepreneurial risk-taking.
On the topic of bankruptcy, another participant noted that in the event of a business failing in Australia there is no penalty on the director of the company as long as they have not broken the law. However, there are penalties for entering personal bankruptcy – namely, a three-year restriction on being the director of a company or being involved in its management. The participant also suggested that there are cultural stigmas around bankruptcy, possibly harking back to the notion of debtors’ prison from the Victorian era. Additionally, the participant went on to describe the nature of business insolvency proceedings in Australia, noting that about 40 per cent of firms that enter insolvency have no assets, and another 20–30 per cent have less than $250 000 in assets. This implies that there is no scope to restructure most firms that enter insolvency. The participant argued that the fact that the directors of a small business are typically also the owners often means that small businesses trade until they fail. By contrast, independent company directors (who have more separation from ownership) seem to seek restructuring earlier and more readily. However, the participant noted that many administrations commence solely as a more comfortable method of liquidation, rather than as an attempt to restructure to save the company. One participant noted that many cases of business failure are due to relationship breakdown. The participant suggested that this reflects two issues: owner-managers facing relationship difficulties are more likely to put less effort into running their small business; and financially resolving a relationship breakdown often means that a small business needs to be dissolved because the finances of the small business are usually intertwined with the finances of the household.
3 5CON F E R E NC E VOLU M E | 2 015
DISC US SION
One participant observed that reductions in business entry rates were puzzling given changes in, among other things, start-up costs, barriers to global trade and access to information. In response, another participant argued that improved availability of information about the costs and challenges of starting and running a business may have discouraged potential entrepreneurs. David Orsmond explained that the RBA’s liaison suggests that, despite improved access to information, it is still very difficult for small businesses to understand new markets. Another participant also posited that the state of the labour market was likely to have an effect on start-up rates, as some individuals would start a business to avoid periods of unemployment. Related to this, another participant noted that some individuals start businesses because of the declining economic performance of the larger businesses they are working in. As an example, the participant described how some individuals in the automotive industry have responded to redundancies by starting a business (particularly given a mismatch between their skills and existing job opportunities).
Underscoring the difficulty of interpreting the data, one participant noted that the problems faced by small start-ups are very different to the problems faced by older small businesses. The participant went on to question whether the paper’s results around the behaviour of firms would differ with business age, and whether this might not make interpretation of some results easier. Another participant emphasised that it is important to recognise that a small business is not just a ‘big business shrunk down’ – that is, small businesses do not necessarily behave in the same way as large businesses. The participant suggested that this is particularly the case for micro businesses, whose behaviour is typically driven by the owner’s lifestyle decisions. Dr Orsmond suggested that this is contrary to the findings presented in the paper, although some participants noted that the sample of firms used in the paper under-samples micro businesses and so is unlikely to adequately reflect their behaviour. In response, Dr Orsmond acknowledged that the RBA’s business liaison program is skewed towards larger businesses and firms in cyclically sensitive industries, and so does not capture a large number of start-ups or micro businesses.

3 6 R E SE RV E BA N K OF AUST R A L I A
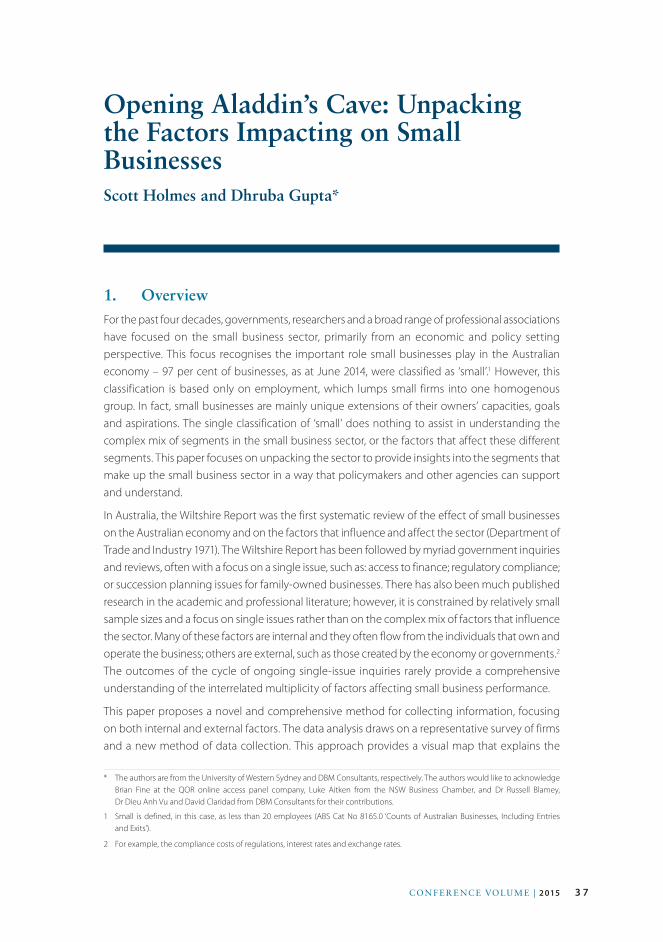
3 7CON F E R E NC E VOLU M E | 2 015
* The authors are from the University of Western Sydney and DBM Consultants, respectively. The authors would like to acknowledge Brian Fine at the QOR online access panel company, Luke Aitken from the NSW Business Chamber, and Dr Russell Blamey, Dr Dieu Anh Vu and David Claridad from DBM Consultants for their contributions.
Opening Aladdin’s Cave: Unpacking the Factors Impacting on Small BusinessesScott Holmes and Dhruba Gupta*
1. OverviewFor the past four decades, governments, researchers and a broad range of professional associations have focused on the small business sector, primarily from an economic and policy setting perspective. This focus recognises the important role small businesses play in the Australian economy – 97 per cent of businesses, as at June 2014, were classified as ‘small’.1 However, this classification is based only on employment, which lumps small firms into one homogenous group. In fact, small businesses are mainly unique extensions of their owners’ capacities, goals and aspirations. The single classification of ‘small’ does nothing to assist in understanding the complex mix of segments in the small business sector, or the factors that affect these different segments. This paper focuses on unpacking the sector to provide insights into the segments that make up the small business sector in a way that policymakers and other agencies can support and understand.
In Australia, the Wiltshire Report was the first systematic review of the effect of small businesses on the Australian economy and on the factors that influence and affect the sector (Department of Trade and Industry 1971). The Wiltshire Report has been followed by myriad government inquiries and reviews, often with a focus on a single issue, such as: access to finance; regulatory compliance; or succession planning issues for family-owned businesses. There has also been much published research in the academic and professional literature; however, it is constrained by relatively small sample sizes and a focus on single issues rather than on the complex mix of factors that influence the sector. Many of these factors are internal and they often flow from the individuals that own and operate the business; others are external, such as those created by the economy or governments.2 The outcomes of the cycle of ongoing single-issue inquiries rarely provide a comprehensive understanding of the interrelated multiplicity of factors affecting small business performance.
This paper proposes a novel and comprehensive method for collecting information, focusing on both internal and external factors. The data analysis draws on a representative survey of firms and a new method of data collection. This approach provides a visual map that explains the
1 Small is defined, in this case, as less than 20 employees (ABS Cat No 8165.0 ‘Counts of Australian Businesses, Including Entries and Exits’).
2 For example, the compliance costs of regulations, interest rates and exchange rates.

3 8 R E SE RV E BA N K OF AUST R A L I A
SCOT T HOL M E S A N D DH RU BA GU P TA
combination of factors that matter most to business owners, rather than focusing on the elements of a single issue.
The paper identifies five key segments within the small business sector. These segments vary significantly in terms of the factors affecting them and how these factors relate to the aspirations, goals and performance of firms. This information is an important start in moving to a constructive information-based discussion concerning policies directed at removing the impediments identified for each segment of the small business sector.
Importantly, the paper sets out to address not what the small business sector looks like – these data are readily available – but why it is configured in such a way at both the individual firm and macro levels. This information can foster a constructive information-based discussion. This is a uniquely different approach compared with the prevailing single-issue, and often anecdotal, approaches that have occurred to date and provides a platform for an effective alternative policy framework.
The paper proceeds as follows: Section 2 outlines the differences between small businesses and other firms, and explains the importance of adopting the approach taken in this paper for understanding small businesses. Section 3 outlines the survey methodology and data used in the paper. Section 4 outlines the factors that the survey identifies as affecting the small business sector as a whole. Section 5 details the five segments of the small business sector identified by the survey analysis. Section 6 offers concluding remarks.
2. BackgroundAlthough almost all modern economies are underpinned by the small business sector, there continues to be very limited information (and therefore limited understanding) of what actually drives and shapes the structure, behaviour and objectives of small to medium-sized enterprises (SMEs). This is because there is a lack of research that acknowledges the differences between large and small businesses. Further, studies of SMEs to date have often focused on single issues – such as SMEs’ access to finance. This single-issue approach fails to consider the complex interplay of factors that affect SMEs.
2.1 Small businesses are uniqueSmall businesses are not ‘scaled-down’ versions of large corporations. While a small business is one whose staff size, financial resources and assets are comparatively limited in scale (Blackburn and Schaper 2012), a crucial qualitative element is that it is independently owned and operated; it is closely controlled by the owners-managers who also contribute most, if not all, of the operating capital; and the principal decision-making functions rest with the owner-managers (ABS 2002, p 1).
In practice, there is normally very little separation of ownership and management in a small business. This fact means that traditional agency relationships do not exist because the owners are almost always the managers. There is often also very limited differentiation between the owner’s personal assets and liabilities, and those of the business.
In spite of this difference, there is still a significant gap in the knowledge available to policymakers and regulatory agencies that deal with small businesses. Theoretical explanations of behaviours
3 9CON F E R E NC E VOLU M E | 2 015
OPEN I NG A L A DDI N’S CAV E: U N PAC K I NG T H E FAC TORS I M PAC T I NG ON SM A LL BUSI N E SSE S
and subsequent attempts to empirically test such theories tend to be drawn from the mainstream business literature. These theories are often framed by inappropriate assumptions: that small businesses behave in the same way as large ones; that all financing and managerial decisions are made using the same profit-maximising logic as in large businesses; that owner-managers seek to maximise their wealth; and that small businesses predominantly engage in ‘rational optimising’ practices and decision processes. In practice, these assumptions do not hold. Numerous researchers have shown that personal objectives, family considerations, lifestyle factors and personal attributes are often major determinants of small businesses’ behaviour (e.g. Holmes et al 2003).
Yet how and why these decisions are made is not well understood by policymakers. For example, despite growing interest in SMEs, there is still no comprehensive understanding of the factors that drive the financial structures of these firms. This lack of understanding is made more difficult by the fact that – unlike large publicly listed firms – performance and related business data are not usually readily available for small businesses.
2.2 Access to finance: one example of being sidetracked by the single-issue approach
Access to finance for the small business sector has been a recurrent theme in the literature and is commonly referred to as having two key components: ‘Knowledge Gap’ and ‘Supply Gap’.3 It is a regular subject of government review, for example by: the Senate Economics References Committee (Senate Economics References Committee 2010); and the Parliamentary Joint Committee on Corporations and Financial Services (PJCCFS 2013).
The knowledge gap relates to the demand side of SME financing, and refers to the constraints placed on small businesses by the limited knowledge of the owners and operators about funding options. The supply gap relates to the supply side of SME financing and issues that arise in relation to financial institutions and other funders of SMEs, particularly in assessing risk and the overriding preference for asset-based security. Often discussion around the supply side has been in the context of information asymmetries – small business owners know much more about the firm than any other party and public information about a small business’ operations is virtually non-existent.
However, it appears that sources of finance are not the major concern for Australian small businesses (Gupta 2013; Institute of Public Accountants 2014).
Rather, many elements influence SMEs’ equity and debt funding mix. These include: the owner’s objectives; business size; business age; industry sector; levels of business information and security available; and growth stage of the firm. In addition, an owner’s personal objectives may override business growth, development and key decisions – particularly in relation to the types of contracts and agreements they enter, including funding arrangements.
The reality is small businesses’ behaviour is complex and cannot be summarised by a single issue. Accordingly, there needs to be a fundamental shift away from the narrow focus on single issues. There are many factors that affect a firm’s structure – including its financial structure –
3 A detailed summary of these issues can be found at Holmes et al (2003).
4 0 R E SE RV E BA N K OF AUST R A L I A
SCOT T HOL M E S A N D DH RU BA GU P TA
that interact. Some factors are under the direct control of owners; many are not. The research approach adopted in this paper indicates how a shift away from the single-issue approach and towards a deeper understanding of the factors at play at any point in time for small businesses might be addressed.
3. MethodIn order to better understand the interaction and relative importance of the range of factors small business owners confront, a survey of a representative sample of small businesses was undertaken using a new questionnaire format.
3.1 Introducing factor analysis impact maps (FAIM)
3.1.1 Factor maps
The factor analysis impact maps (FAIM) approach is based on the concept that things that matter most should be at the core or centre. Things that matter less are further from the centre.Accordingly, FAIM uses a computerised ‘dartboard’ with a centre or core that is surrounded by 10 concentric circles as part of an online survey questionnaire. Each circle is assigned a number that indicates the distance from the centre.
FAIM begins by displaying a set of potential factors at the outer region of the dartboard that could be affecting a business decision-maker. Each factor is represented by a sphere. The centre of the dartboard represents what is of core concern to the business. Figure 1 shows the FAIM dartboard.
The survey respondent then moves each sphere closer to the centre, depending on how much impact that factor has on their business. As the respondent moves the spheres – either with a cursor or on a touch screen – the distance from the core is shown as a number. Once the sphere is placed in the final position, the number showing the distance to the centre is assigned to the factor. This number is then used for analysis.
Any factors that are perceived to be irrelevant to the business can be placed in a ‘trash bin’ or can be left at zero. Factors left at zero or dropped in the bin are assigned a value of zero for the purposes of analysis.
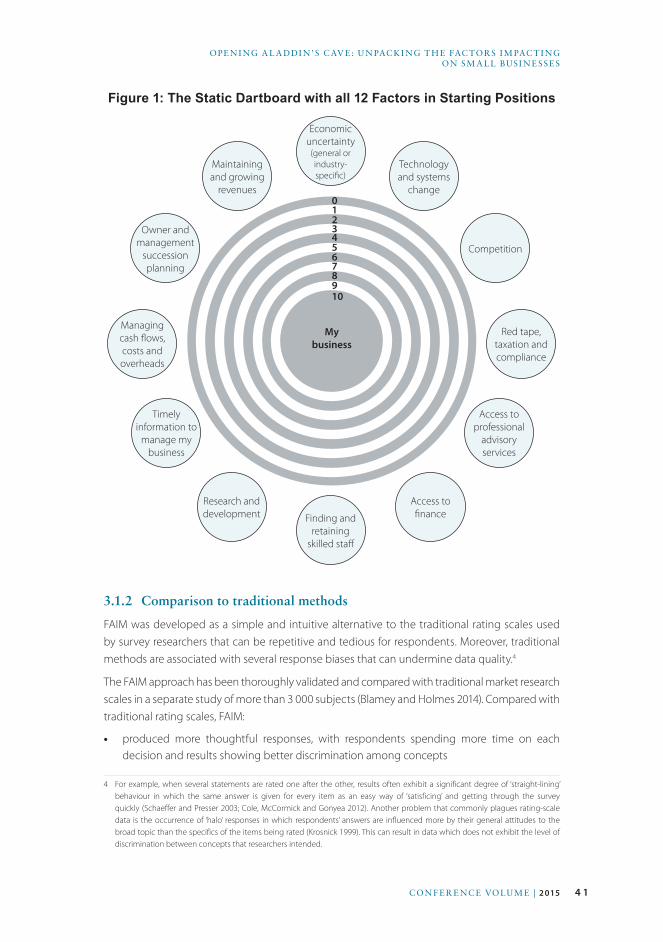
4 1CON F E R E NC E VOLU M E | 2 015
OPEN I NG A L A DDI N’S CAV E: U N PAC K I NG T H E FAC TORS I M PAC T I NG ON SM A LL BUSI N E SSE S
Figure 1: The Static Dartboard with all 12 Factors in Starting Positions
My business
Managing cash flows, costs and overheads
Economic uncertainty
(general or industry- specific)
Maintaining and growing
revenues
Owner and management
succession planning
Access to financeFinding and
retaining skilled staff
Research and development
Timely information to
manage my business
Access to professional
advisory services
Red tape, taxation and compliance
Technology and systems
change
Competition
109876543210
3.1.2 Comparison to traditional methods
FAIM was developed as a simple and intuitive alternative to the traditional rating scales used by survey researchers that can be repetitive and tedious for respondents. Moreover, traditional methods are associated with several response biases that can undermine data quality.4
The FAIM approach has been thoroughly validated and compared with traditional market research scales in a separate study of more than 3 000 subjects (Blamey and Holmes 2014). Compared with traditional rating scales, FAIM:
• produced more thoughtful responses, with respondents spending more time on each decision and results showing better discrimination among concepts
4 For example, when several statements are rated one after the other, results often exhibit a significant degree of ‘straight-lining’ behaviour in which the same answer is given for every item as an easy way of ‘satisficing’ and getting through the survey quickly (Schaeffer and Presser 2003; Cole, McCormick and Gonyea 2012). Another problem that commonly plagues rating-scale data is the occurrence of ‘halo’ responses in which respondents’ answers are influenced more by their general attitudes to the broad topic than the specifics of the items being rated (Krosnick 1999). This can result in data which does not exhibit the level of discrimination between concepts that researchers intended.
4 2 R E SE RV E BA N K OF AUST R A L I A
SCOT T HOL M E S A N D DH RU BA GU P TA
• produced a much lower proportion of respondents giving the same answer to every item in a set – a phenomenon known as ‘straight-lining’
• was the preferred questionnaire format among respondents
• elicited a richer variety of information.
FAIM provides a more meaningful, enjoyable and engaging format for respondents, thereby increasing motivation to respond carefully. It also makes it more difficult for respondents to provide careless answers.
3.1.3 Application of FAIM in this study
The FAIM approach was applied in this study to help understand:
• the extent to which small business decision-makers were affected by a single factor or a multitude of factors
• which factor or factors were having the greatest effect on the small business sector overall
• whether different factors affected different members of the small business sector in different ways.
The survey focused on the effect of 12 different factors among small businesses. These factors were identified by an online search of the factors associated with the small business sector, an internal analysis of small business reporting in the mainstream media, and feedback from the NSW Business Chamber. The 12 factors that were chosen are presented in Figure 1.
3.2 Survey methodologyTo determine the factors that affect small businesses, a total of 1 001 online interviews were conducted nationally in February 2015.5 Firms were sourced through the QOR online access panel.6
A stratified sample was drawn with the target distribution of responses aligned to the Australian Bureau of Statistics (ABS) business sample profile on variables including state/territory and number of employees.7 Respondents were typically the most senior decision-makers within the firms, usually business owners, chief executive officers or managing directors. Weighting by states and number of employees was undertaken to ensure that the survey data represent the business population as defined by the ABS.
The survey questionnaire included a range of background questions concerning the characteristics and performance of the firm. Respondents were also asked about their firm’s objectives for the coming year, with a focus on business growth. Following those qualitative questions, the FAIM methodology was used to measure how business decision-makers assessed the relative effect of the 12 factors. Respondents were asked to indicate the effect each of the 12 factors had had on their firms over the last twelve months on the FAIM scale from 0 to 10 – where 0 means ‘No influence/impact at all’ and 10 means ‘Extremely high influence/impact’.
5 The survey questionnaire is available online at <http://fivetribes.dbmweb.com.au>.
6 Quality Online Research (QOR) is one of Australia’s leading online panel providers for business samples. The small business panel includes a cross-section of more than 10 000 firms, with firms recruited primarily from offline sources to avoid online bias. QOR is accredited with ISO 26362 and QSOAP Gold, reflecting the high quality standards used.
7 ABS Cat No 8165.0 ‘Counts of Australian Businesses, Including Entries and Exits, June 2010 to June 2014’.

4 3CON F E R E NC E VOLU M E | 2 015
OPEN I NG A L A DDI N’S CAV E: U N PAC K I NG T H E FAC TORS I M PAC T I NG ON SM A LL BUSI N E SSE S
Additional questions were also asked for several factors to assess the relative effect of the sub-elements that make up that factor.
4. Results – Unpacking the Factors
4.1 Small business overallFigure 2 clearly shows that no single issue affects all firms. However, five out of the twelve issues have more of an effect than the others, namely:
• maintaining and growing revenues
• economic uncertainty
• managing cash flows, costs and overheads
• competition
• red tape, taxation and compliance.
The top five issues represent a mix of internal and external factors, but they appear to be predominantly beyond the direct control of owner-managers, perhaps with the exception of cash flow, cost and overhead management.
There is further evidence that it isn’t a single issue that is perceived by owners to be affecting their business: 71 per cent of businesses reported effects of 6 or higher on at least two factors, and 56 per cent on at least three factors. This has direct implications for support, information, training and policy aimed at the small business sector.
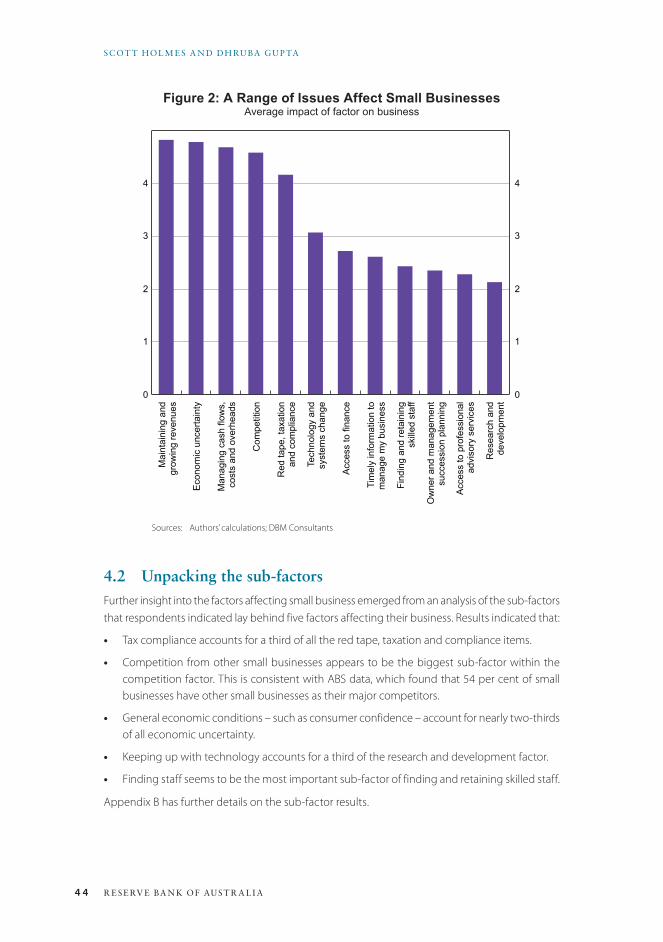
4 4 R E SE RV E BA N K OF AUST R A L I A
SCOT T HOL M E S A N D DH RU BA GU P TA
Figure 2: A Range of Issues Affect Small BusinessesAverage impact of factor on business
Mai
ntai
ning
and
gr
owin
g re
venu
es
Eco
nom
ic u
ncer
tain
ty
Man
agin
g ca
sh fl
ows,
co
sts
and
over
head
s
Com
petit
ion
Red
tape
, tax
atio
n an
d co
mpl
ianc
e
Tech
nolo
gy a
nd
syst
ems
chan
ge
Acc
ess
to fi
nanc
e
Tim
ely
info
rmat
ion
to
man
age
my
busi
ness
Find
ing
and
reta
inin
g sk
illed
sta
ff
Ow
ner a
nd m
anag
emen
t su
cces
sion
pla
nnin
g
Acc
ess
to p
rofe
ssio
nal
advi
sory
ser
vice
s
Res
earc
h an
d de
velo
pmen
t
0
1
2
3
4
0
1
2
3
4
Sources: Authors’ calculations; DBM Consultants
4.2 Unpacking the sub-factorsFurther insight into the factors affecting small business emerged from an analysis of the sub-factors that respondents indicated lay behind five factors affecting their business. Results indicated that:
• Tax compliance accounts for a third of all the red tape, taxation and compliance items.
• Competition from other small businesses appears to be the biggest sub-factor within the competition factor. This is consistent with ABS data, which found that 54 per cent of small businesses have other small businesses as their major competitors.
• General economic conditions – such as consumer confidence – account for nearly two-thirds of all economic uncertainty.
• Keeping up with technology accounts for a third of the research and development factor.
• Finding staff seems to be the most important sub-factor of finding and retaining skilled staff.
Appendix B has further details on the sub-factor results.
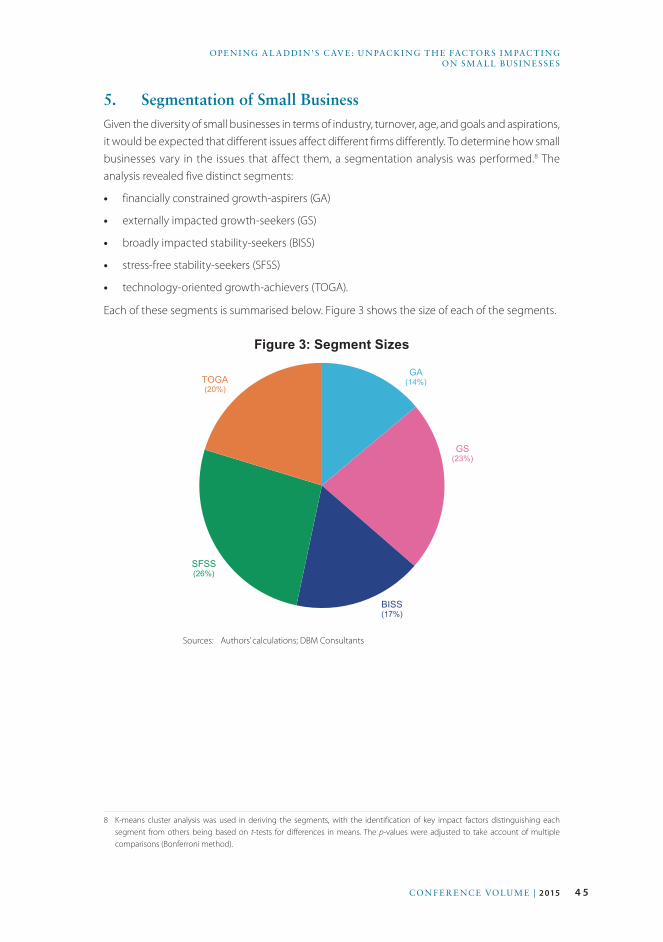
4 5CON F E R E NC E VOLU M E | 2 015
OPEN I NG A L A DDI N’S CAV E: U N PAC K I NG T H E FAC TORS I M PAC T I NG ON SM A LL BUSI N E SSE S
5. Segmentation of Small BusinessGiven the diversity of small businesses in terms of industry, turnover, age, and goals and aspirations, it would be expected that different issues affect different firms differently. To determine how small businesses vary in the issues that affect them, a segmentation analysis was performed.8 The analysis revealed five distinct segments:
• financially constrained growth-aspirers (GA)
• externally impacted growth-seekers (GS)
• broadly impacted stability-seekers (BISS)
• stress-free stability-seekers (SFSS)
• technology-oriented growth-achievers (TOGA).
Each of these segments is summarised below. Figure 3 shows the size of each of the segments.
Figure 3: Segment Sizes
GA(14%)
GS(23%)
BISS(17%)
TOGA(20%)
SFSS(26%)
Sources: Authors’ calculations; DBM Consultants
8 K-means cluster analysis was used in deriving the segments, with the identification of key impact factors distinguishing each segment from others being based on t-tests for differences in means. The p-values were adjusted to take account of multiple comparisons (Bonferroni method).

4 6 R E SE RV E BA N K OF AUST R A L I A
SCOT T HOL M E S A N D DH RU BA GU P TA
5.1 Financially constrained growth-aspirers (GA)Businesses in the GA segment are younger businesses mostly seeking growth but struggling to achieve it. Two-thirds had not performed to expectations over the past 12 months and less than half were satisfied with their performance.
The main factors impeding growth are presented in Figure 4. The primary distinguishing factors for this segment are: access to finance; managing cash flows, costs and overheads; and maintaining and growing revenues.
Figure 4: Factors Affecting Financially Constrained Growth-aspirers
■ Average — Financially constrained growth-aspirers
Economic uncertainty
Technology and systems change
Competition
Red tape, taxation and compliance
Access to professional advisory services
Access to finance
Finding and retaining skilled staff
Research and development
Timely information to manage my business
Managing cash flows, costs and overheads
Owner and management succession planning
Maintaining and growing revenues
●
●
●
●
●●
●
●
●
●
●
●
0
2
4
6
8
10
Sources: Authors’ calculations; DBM Consultants

4 7CON F E R E NC E VOLU M E | 2 015
OPEN I NG A L A DDI N’S CAV E: U N PAC K I NG T H E FAC TORS I M PAC T I NG ON SM A LL BUSI N E SSE S
5.2 Externally impacted growth-seekers (GS)The GS segment comprises mature businesses mostly seeking growth and, like the GA segment, struggling to achieve it. Within the GS segment, 65 per cent of firms surveyed performed worse than expected over the past 12 months, and less than half were satisfied with their firm’s performance.
These firms believe they are being held back by largely external factors such as general economic uncertainty and strong competition from other small and larger businesses, including online and offshore (Figure 5). In contrast to the GA segment, access to finance is not seen as a major constraint on growth; however, taxation compliance is.
Figure 5: Factors Affecting Externally Impacted Growth-seekers
■ Average — Externally impacted growth-seekers
Economic uncertainty
Technology and systems change
Competition
Red tape, taxation and compliance
Access to professional advisory services
Access to finance
Finding and retaining skilled staff
Research and development
Timely information to manage my business
Managing cash flows, costs and overheads
Owner and management succession planning
Maintaining and growing revenues
●
●
●
●
●
●
●
●
●
●
● ●
0
2
4
6
8
10
Sources: Authors’ calculations; DBM Consultants
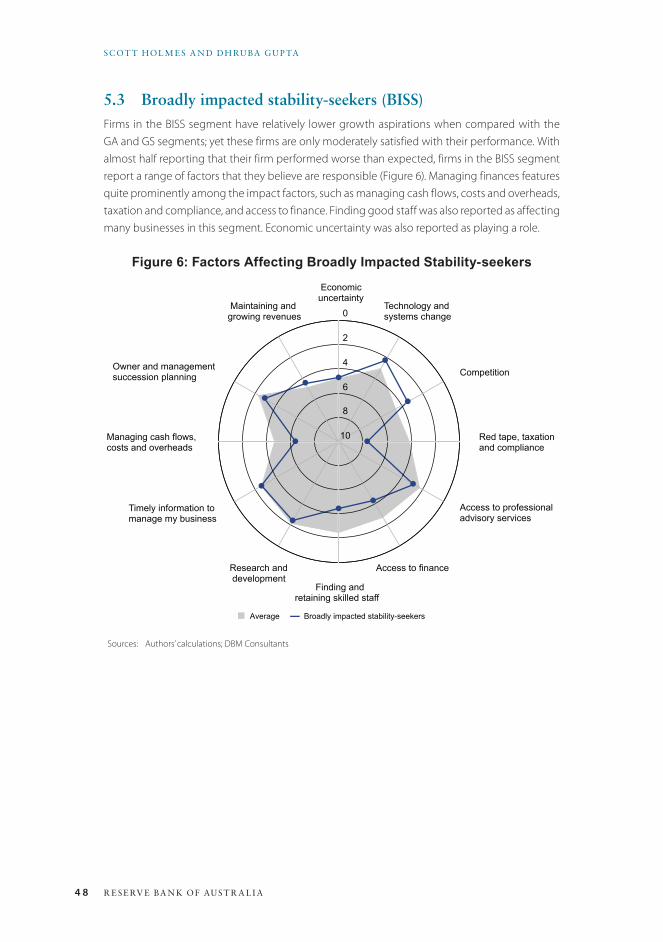
4 8 R E SE RV E BA N K OF AUST R A L I A
SCOT T HOL M E S A N D DH RU BA GU P TA
5.3 Broadly impacted stability-seekers (BISS)Firms in the BISS segment have relatively lower growth aspirations when compared with the GA and GS segments; yet these firms are only moderately satisfied with their performance. With almost half reporting that their firm performed worse than expected, firms in the BISS segment report a range of factors that they believe are responsible (Figure 6). Managing finances features quite prominently among the impact factors, such as managing cash flows, costs and overheads, taxation and compliance, and access to finance. Finding good staff was also reported as affecting many businesses in this segment. Economic uncertainty was also reported as playing a role.
Figure 6: Factors Affecting Broadly Impacted Stability-seekers
■ Average — Broadly impacted stability-seekers
Economic uncertainty
Technology and systems change
Competition
Red tape, taxation and compliance
Access to professional advisory services
Access to finance
Finding and retaining skilled staff
Research and development
Timely information to manage my business
Managing cash flows, costs and overheads
Owner and management succession planning
Maintaining and growing revenues
●
●
●
●
●
●●
●
●
●
●
●
0
2
4
6
8
10
Sources: Authors’ calculations; DBM Consultants
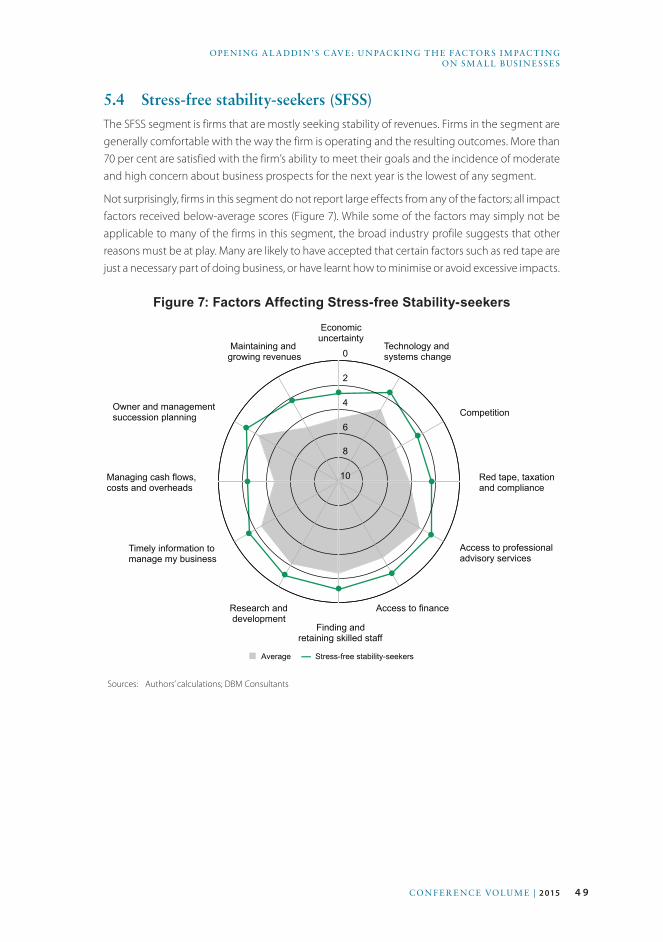
4 9CON F E R E NC E VOLU M E | 2 015
OPEN I NG A L A DDI N’S CAV E: U N PAC K I NG T H E FAC TORS I M PAC T I NG ON SM A LL BUSI N E SSE S
5.4 Stress-free stability-seekers (SFSS)The SFSS segment is firms that are mostly seeking stability of revenues. Firms in the segment are generally comfortable with the way the firm is operating and the resulting outcomes. More than 70 per cent are satisfied with the firm’s ability to meet their goals and the incidence of moderate and high concern about business prospects for the next year is the lowest of any segment.
Not surprisingly, firms in this segment do not report large effects from any of the factors; all impact factors received below-average scores (Figure 7). While some of the factors may simply not be applicable to many of the firms in this segment, the broad industry profile suggests that other reasons must be at play. Many are likely to have accepted that certain factors such as red tape are just a necessary part of doing business, or have learnt how to minimise or avoid excessive impacts.
Figure 7: Factors Affecting Stress-free Stability-seekers
■ Average — Stress-free stability-seekers
Economic uncertainty
Technology and systems change
Competition
Red tape, taxation and compliance
Access to professional advisory services
Access to finance
Finding and retaining skilled staff
Research and development
Timely information to manage my business
Managing cash flows, costs and overheads
Owner and management succession planning
Maintaining and growing revenues
● ●
●
●
●
●
●
●
●
●
●
●
0
2
4
6
8
10
Sources: Authors’ calculations; DBM Consultants
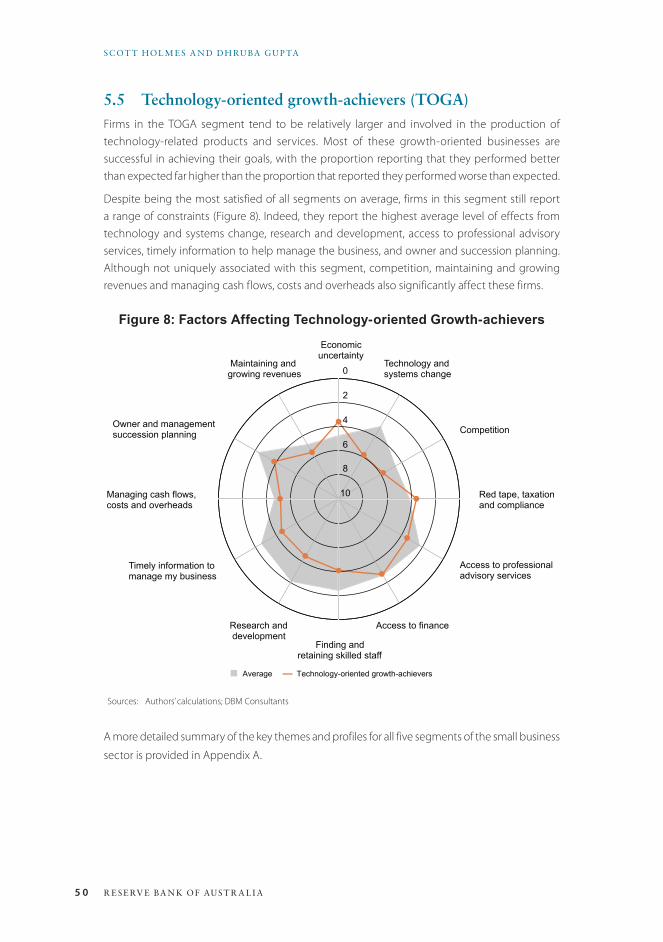
5 0 R E SE RV E BA N K OF AUST R A L I A
SCOT T HOL M E S A N D DH RU BA GU P TA
5.5 Technology-oriented growth-achievers (TOGA)Firms in the TOGA segment tend to be relatively larger and involved in the production of technology-related products and services. Most of these growth-oriented businesses are successful in achieving their goals, with the proportion reporting that they performed better than expected far higher than the proportion that reported they performed worse than expected.
Despite being the most satisfied of all segments on average, firms in this segment still report a range of constraints (Figure 8). Indeed, they report the highest average level of effects from technology and systems change, research and development, access to professional advisory services, timely information to help manage the business, and owner and succession planning. Although not uniquely associated with this segment, competition, maintaining and growing revenues and managing cash flows, costs and overheads also significantly affect these firms.
Figure 8: Factors Affecting Technology-oriented Growth-achievers
■ Average — Technology-oriented growth-achievers
Economic uncertainty
Technology and systems change
Competition
Red tape, taxation and compliance
Access to professional advisory services
Access to finance
Finding and retaining skilled staff
Research and development
Timely information to manage my business
Managing cash flows, costs and overheads
Owner and management succession planning
Maintaining and growing revenues
●
●
●
●
●
●●
●
●
●
●●
0
2
4
6
8
10
Sources: Authors’ calculations; DBM Consultants
A more detailed summary of the key themes and profiles for all five segments of the small business
sector is provided in Appendix A.
5 1CON F E R E NC E VOLU M E | 2 015
OPEN I NG A L A DDI N’S CAV E: U N PAC K I NG T H E FAC TORS I M PAC T I NG ON SM A LL BUSI N E SSE S
6. Conclusions and Next StepsThis paper had a very clear objective: to understand the mix of factors that affect small businesses and to move away from the assumption that small businesses are simply those with fewer than 20 employees.
It is obvious that the small business sector includes a diverse set of firms. Each of the five segments identified will naturally include sub-segments and this will be the focus of future analysis and research. These segments are intrinsically linked to the aspirations and subsequent performance of the firms. This performance is, in turn, linked to the factors that owner-managers in each segment perceive as affecting the achievement of their aspirations. It is interesting how different the segments are with respect to the underlying business objectives and performance, and also the difference in impact factors.
In terms of methodology, the FAIM approach allows for a comparatively more robust and representative set of responses concerning the range of factors perceived to be affecting small businesses. The diversity among small businesses revealed by this research suggests that the homogenous approach adopted by much of the literature may overlook key factors. For instance, surveying all manufacturing firms with fewer than 20 employees would tell us little about the diversity of motivations in such a sample.
The FAIM approach provides a platform from which we can finally understand the qualitative story of a sector with almost 2 million business entities. It will also allow for a more developed dialogue with business owners at many levels – from advisory services to policy development. It can inform areas such as supporting growth objectives and addressing the impediments to growth, rather than seeking to pare issues down to single factors, such as access to finance.9 Policies and programs designed to support or inform business owners need to be informed by the differences among small businesses. Accordingly, any initiatives or policies to address particular issues need to be clearly linked to the target group. Hopefully, future inquiries and reviews will take on board the complex and integrated nature of the issues that affect small businesses, rather than over-simplifying issues to allow for the conduct of an inquiry or review.
One additional and important aspect of the method adopted here is that it allows for a comprehensive longitudinal study of these issues at both the individual business and segment level. Future study can address questions like: what happens when external factors change? what are the effects of policies that are targeted at particular segments? and how do aspirations shift over time? Using the methodology in this paper, a revealing story about this complex and almost enigmatic foundation of the Australian economy can finally be told.
9 Which, interestingly, didn’t make the top five impact factors in the full sample.
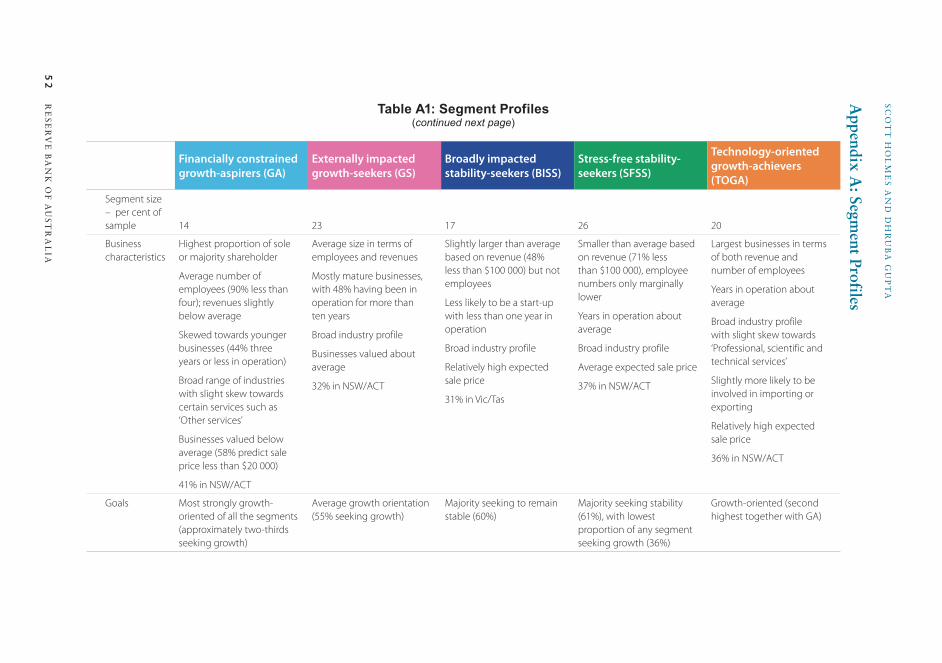
52
RE
SE
RV
E B
AN
K O
F A
US
TR
AL
IA
SC
OT
T H
OL
ME
S A
ND
DH
RU
BA
GU
PT
A
Table A1: Segment Profiles(continued next page)
Financially constrained growth-aspirers (GA)
Externally impacted growth-seekers (GS)
Broadly impacted stability-seekers (BISS)
Stress-free stability-seekers (SFSS)
Technology-oriented growth-achievers (TOGA)
Segment size – per cent of sample 14 23 17 26 20
Business characteristics
Highest proportion of sole or majority shareholder
Average number of employees (90% less than four); revenues slightly below average
Skewed towards younger businesses (44% three years or less in operation)
Broad range of industries with slight skew towards certain services such as ‘Other services’
Businesses valued below average (58% predict sale price less than $20 000)
41% in NSW/ACT
Average size in terms of employees and revenues
Mostly mature businesses, with 48% having been in operation for more than ten years
Broad industry profile
Businesses valued about average
32% in NSW/ACT
Slightly larger than average based on revenue (48% less than $100 000) but not employees
Less likely to be a start-up with less than one year in operation
Broad industry profile
Relatively high expected sale price
31% in Vic/Tas
Smaller than average based on revenue (71% less than $100 000), employee numbers only marginally lower
Years in operation about average
Broad industry profile
Average expected sale price
37% in NSW/ACT
Largest businesses in terms of both revenue and number of employees
Years in operation about average
Broad industry profile with slight skew towards ‘Professional, scientific and technical services’
Slightly more likely to be involved in importing or exporting
Relatively high expected sale price
36% in NSW/ACT
Goals Most strongly growth-oriented of all the segments (approximately two-thirds seeking growth)
Average growth orientation (55% seeking growth)
Majority seeking to remain stable (60%)
Majority seeking stability (61%), with lowest proportion of any segment seeking growth (36%)
Growth-oriented (second highest together with GA)
Appendix A
: Segment Profiles
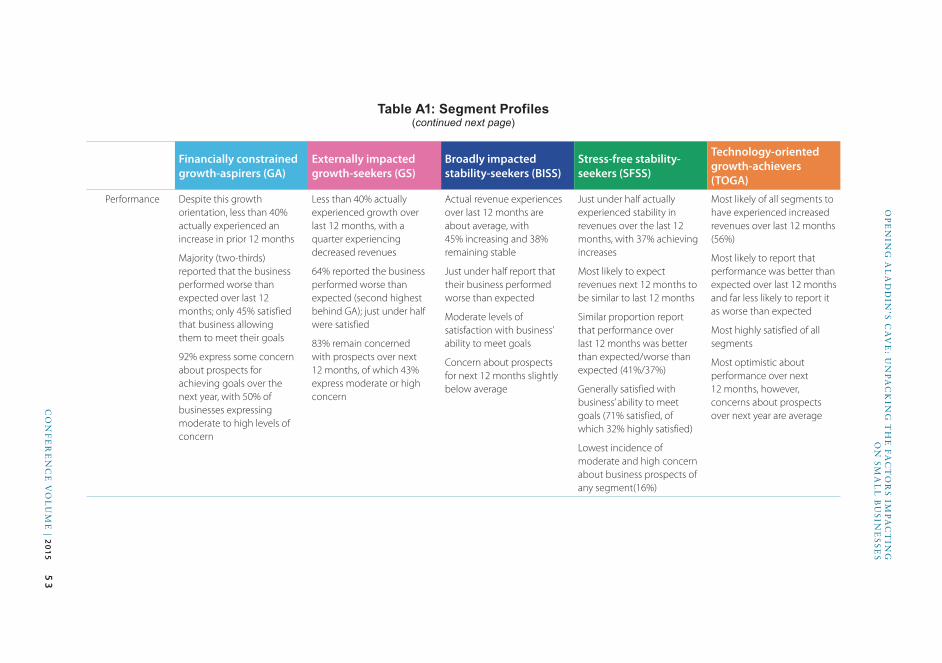
53
CO
NF
ER
EN
CE
VO
LU
ME
| 20
15
OP
EN
ING
AL
AD
DIN
’S C
AV
E: U
NP
AC
KIN
G T
HE
FA
CT
OR
S IM
PA
CT
ING
O
N S
MA
LL
BU
SIN
ES
SE
S
Table A1: Segment Profiles(continued next page)
Financially constrained growth-aspirers (GA)
Externally impacted growth-seekers (GS)
Broadly impacted stability-seekers (BISS)
Stress-free stability-seekers (SFSS)
Technology-oriented growth-achievers (TOGA)
Performance Despite this growth orientation, less than 40% actually experienced an increase in prior 12 months
Majority (two-thirds) reported that the business performed worse than expected over last 12 months; only 45% satisfied that business allowing them to meet their goals
92% express some concern about prospects for achieving goals over the next year, with 50% of businesses expressing moderate to high levels of concern
Less than 40% actually experienced growth over last 12 months, with a quarter experiencing decreased revenues
64% reported the business performed worse than expected (second highest behind GA); just under half were satisfied
83% remain concerned with prospects over next 12 months, of which 43% express moderate or high concern
Actual revenue experiences over last 12 months are about average, with 45% increasing and 38% remaining stable
Just under half report that their business performed worse than expected
Moderate levels of satisfaction with business’ ability to meet goals
Concern about prospects for next 12 months slightly below average
Just under half actually experienced stability in revenues over the last 12 months, with 37% achieving increases
Most likely to expect revenues next 12 months to be similar to last 12 months
Similar proportion report that performance over last 12 months was better than expected/worse than expected (41%/37%)
Generally satisfied with business’ ability to meet goals (71% satisfied, of which 32% highly satisfied)
Lowest incidence of moderate and high concern about business prospects of any segment(16%)
Most likely of all segments to have experienced increased revenues over last 12 months (56%)
Most likely to report that performance was better than expected over last 12 months and far less likely to report it as worse than expected
Most highly satisfied of all segments
Most optimistic about performance over next 12 months, however, concerns about prospects over next year are average
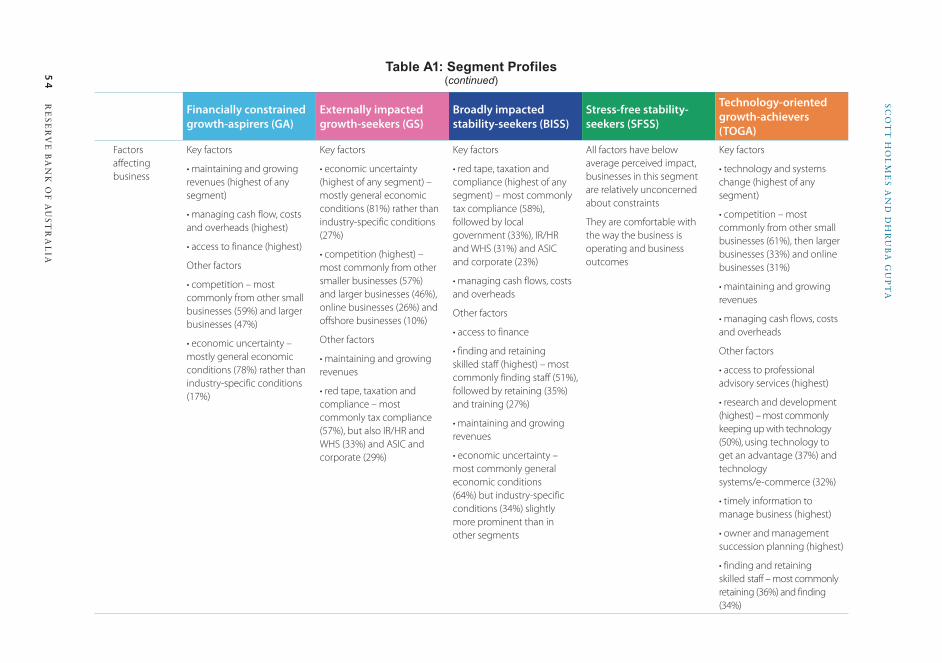
54
RE
SE
RV
E B
AN
K O
F A
US
TR
AL
IA
SC
OT
T H
OL
ME
S A
ND
DH
RU
BA
GU
PT
A
Financially constrained growth-aspirers (GA)
Externally impacted growth-seekers (GS)
Broadly impacted stability-seekers (BISS)
Stress-free stability-seekers (SFSS)
Technology-oriented growth-achievers (TOGA)
Factors affecting business
Key factors
• maintaining and growing revenues (highest of any segment)
• managing cash flow, costs and overheads (highest)
• access to finance (highest)
Other factors
• competition – most commonly from other small businesses (59%) and larger businesses (47%)
• economic uncertainty – mostly general economic conditions (78%) rather than industry-specific conditions (17%)
Key factors
• economic uncertainty (highest of any segment) – mostly general economic conditions (81%) rather than industry-specific conditions (27%)
• competition (highest) – most commonly from other smaller businesses (57%) and larger businesses (46%), online businesses (26%) and offshore businesses (10%)
Other factors
• maintaining and growing revenues
• red tape, taxation and compliance – most commonly tax compliance (57%), but also IR/HR and WHS (33%) and ASIC and corporate (29%)
Key factors
• red tape, taxation and compliance (highest of any segment) – most commonly tax compliance (58%), followed by local government (33%), IR/HR and WHS (31%) and ASIC and corporate (23%)
• managing cash flows, costs and overheads
Other factors
• access to finance
• finding and retaining skilled staff (highest) – most commonly finding staff (51%), followed by retaining (35%) and training (27%)
• maintaining and growing revenues
• economic uncertainty – most commonly general economic conditions (64%) but industry-specific conditions (34%) slightly more prominent than in other segments
All factors have below average perceived impact, businesses in this segment are relatively unconcerned about constraints
They are comfortable with the way the business is operating and business outcomes
Key factors
• technology and systems change (highest of any segment)
• competition – most commonly from other small businesses (61%), then larger businesses (33%) and online businesses (31%)
• maintaining and growing revenues
• managing cash flows, costs and overheads
Other factors
• access to professional advisory services (highest)
• research and development (highest) – most commonly keeping up with technology (50%), using technology to get an advantage (37%) and technology systems/e-commerce (32%)
• timely information to manage business (highest)
• owner and management succession planning (highest)
• finding and retaining skilled staff – most commonly retaining (36%) and finding (34%)
Table A1: Segment Profiles(continued)
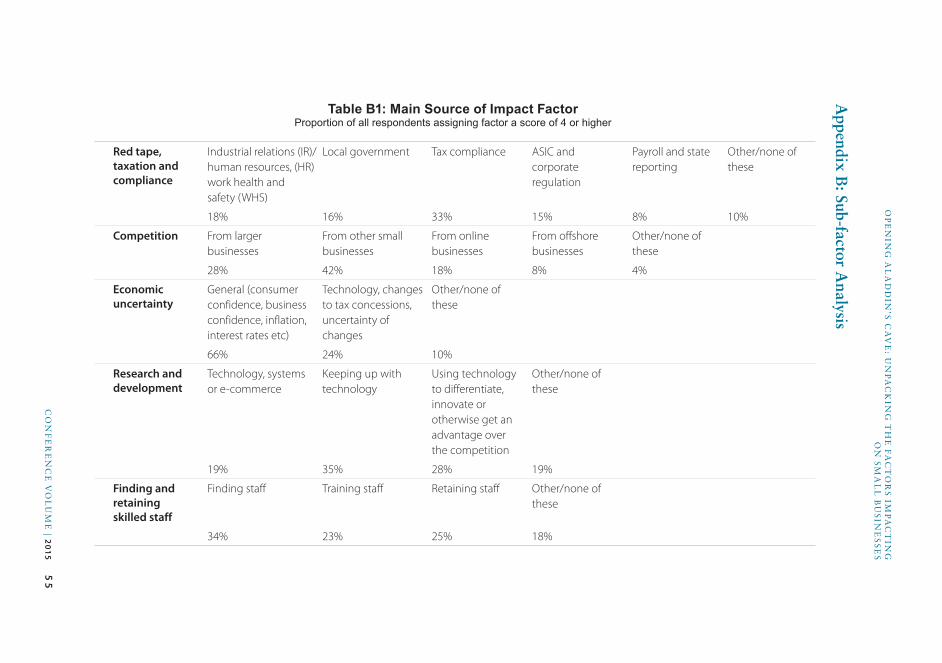
55
CO
NF
ER
EN
CE
VO
LU
ME
| 20
15
OP
EN
ING
AL
AD
DIN
’S C
AV
E: U
NP
AC
KIN
G T
HE
FA
CT
OR
S IM
PA
CT
ING
O
N S
MA
LL
BU
SIN
ES
SE
S
Table B1: Main Source of Impact FactorProportion of all respondents assigning factor a score of 4 or higher
Red tape, taxation and compliance
Industrial relations (IR)/human resources, (HR) work health and safety (WHS)
Local government Tax compliance ASIC and corporate regulation
Payroll and state reporting
Other/none of these
18% 16% 33% 15% 8% 10%
Competition From larger businesses
From other small businesses
From online businesses
From offshore businesses
Other/none of these
28% 42% 18% 8% 4%
Economic uncertainty
General (consumer confidence, business confidence, inflation, interest rates etc)
Technology, changes to tax concessions, uncertainty of changes
Other/none of these
66% 24% 10%
Research and development
Technology, systems or e-commerce
Keeping up with technology
Using technology to differentiate, innovate or otherwise get an advantage over the competition
Other/none of these
19% 35% 28% 19%
Finding and retaining skilled staff
Finding staff Training staff Retaining staff Other/none of these
34% 23% 25% 18%
Appendix B
: Sub-factor Analysis
5 6 R E SE RV E BA N K OF AUST R A L I A
SCOT T HOL M E S A N D DH RU BA GU P TA
ReferencesABS (Australian Bureau of Statistics) (2002), ‘Small Business in Australia, 2001’, ABS Cat No 1321.0.
Blackburn RA and MT Schaper (eds) (2012), Government, SMEs and Entrepreneurship Development: Policy,
Practice and Challenges, Gower, Farnham.
Blamey R and S Holmes (2014), ‘Putting Yourself at the Centre: Testing a New Online Task Format’, Presented
at the Australian Market & Social Research Society Conference, Melbourne, 4–5 September.
Cole JS, AC McCormick and RM Gonyea (2012), ‘Respondent Use of Straight-Lining as a Response
Strategy in Education Survey Research: Prevalence and Implications’, Roundtable presentation at the Annual
Meeting of the American Educational Research Association ‘Non Satis Scire: To Know Is Not Enough’, Vancouver,
13–17 April.
Department of Trade and Industry (Department of Trade and Industry and Advisory Committee on Small Business) (1971), Report of the Committee on Small Business, (FM Wiltshire, Chair), Department of Trade
and Industry, Canberra.
Gupta D (2013), ‘Australian Small Business: Facts and Figures’, Paper presented at the NAB National Small
Business Summit hosted by the Council of Small Business of Australia (COSBOA), Canberra, 24–25 July.
Holmes S, P Hutchinson, D Forsaith, B Gibson and R McMahon (2003), Small Enterprise Finance, John
Wiley & Sons Inc, Milton.
Institute of Public Accountants (2014), ‘Australian Small Business White Paper Summit’. Available at
<http://www.publicaccountants.org.au/resources/small-business-white-paper>.
Krosnick JA (1999), ‘Survey Research’, Annual Review of Psychology, 50, pp 537–567.
PJCCFS (Parliamentary Joint Committee on Corporations and Financial Services) (2013), Family
Businesses in Australia – Different and Significant: Why they Shouldn’t be Overlooked, (D O’Neill, Chair),
Commonwealth of Australia, Canberra.
Schaeffer NC and S Presser (2003), ‘The Science of Asking Questions’, Annual Review of Sociology, 29,
pp 65–88.
Senate Economics References Committee (2010), Access of Small Businesses to Finance, (A Eggleston,
Chair), Commonwealth of Australia, Canberra.
5 7CON F E R E NC E VOLU M E | 2 015
Discussion
1. Geoff FrancisThe paper starts with an insightful overview of the features that make small businesses unique. The authors highlight that small businesses are generally:
• resource constrained – small businesses often lack the human and financial capital to understand and keep up with changes to regulations
• owner managed – small businesses’ owners are typically also the primary decision-makers
• funded by their own capital – small businesses are usually funded by their owner’s assets and the owner is therefore exposed to a higher degree of personal financial risk than larger businesses with many shareholders.
The authors make an important point when they note that ‘[s]mall businesses are not “scaled-down” versions of large corporations’ and that we shouldn’t treat small businesses as one homogenous group. This is something well understood by those who deal closely with small business. But it is not always well understood by others, who instead may think of small business in more homogenous terms and may advocate ‘silver bullets’ to address market failures that affect small businesses. So this paper is valuable in drawing the attention of a wider audience to this feature.
This paper is also extremely beneficial because it draws out the intricacies of small businesses. In particular, turning to the results of the paper, the following issues are identified as the ones that concern small businesses the most:
• economic uncertainty
• maintaining and growing revenues
• managing cash flows, costs and overheads
• competition
• red tape, taxation and compliance.
However, this list is just the start. These issues affect all businesses and only some are matters for government policy or small business policy. For example, economic uncertainty is an issue that affects all businesses, not just small businesses. The frameworks in place to provide for macroeconomic stability seem best placed to deal with this, rather than specific small business policies. Maintaining and growing revenues, managing cash flows, and competition are also not specific to small business. Nonetheless, the presence of these items on the list confirms that small businesses are focusing on the right issues. I would hope that these remain a priority for small business well into the future if we are to continue to have a dynamic and growing economy.
Perhaps most relevantly, however, the issues of red tape, taxation and compliance have been a continual source of annoyance for small businesses. It is here that I think the survey techniques deployed in this research could be put to greater use – for they are novel and more useful than
5 8 R E SE RV E BA N K OF AUST R A L I A
DISC US SION
some other small business surveys I have seen. By refining these techniques and applying them to more specific policy issues, they could be highly beneficial and informative for policymakers. For example, more detail on what aspects of these areas cause concern for particular types of small businesses would be useful from a policy perspective. In that vein, it would be beneficial if future surveys could identify:
• which regulations are the most burdensome?
• what are the most time-consuming elements of regulatory compliance?
Thus, I see a lot of potential in the techniques used in this paper and I hope this is the beginning of a sequence of research projects that help policymakers identify policies and instruments to unlock the potential of small business.
2. General DiscussionThe discussion began by noting the new and novel dataset collected for the paper. Several participants commented that the segmentation of the small business sector provided in the paper was useful and intuitive, although one participant observed that small businesses in the divestment phase were not a segment identified by the cluster analysis. The participant suggested that including a question about the age of the owner-operator of the business might help identify these businesses. Scott Holmes noted that while a question on succession planning was included in the survey, this factor did not seem to drive large differences among businesses. Professor Holmes suggested that this might be because succession planning affects most businesses similarly.
A participant raised potential issues with self-reported data. While some of the challenges reported in the paper are likely to be factors that materially influence businesses’ behaviour, other factors may simply be common complaints. Relatedly, a participant noted that the factors that businesses reported as being challenges are quite different to the causes of failure for small businesses identified in other papers at the Conference. The participant suggested that this difference may indicate either: that businesses misconceive the difficulties that they face; or that the challenges small businesses face in achieving growth are different from the issues that lead to business failure.
Participants also noted that online surveys can attract respondents that have different characteristics compared with the broader population. Professor Holmes acknowledged that there is a degree of bias stemming from the online nature of the survey, but this is mitigated by the fact that the sample is matched against the ABS profile in terms of industry, size and longevity. A participant also noted that the major issues the paper identifies and the paper’s finding that small businesses’ main competitors are mostly other small businesses – not large businesses – is consistent with other studies.
Turning to further uses for the data, a participant suggested some avenues that could be pursued if a time series of the dataset used in the paper were collected. These data could address questions such as the distribution of firms across the segments during booms and recessions, and transitions between the segments. Another participant suggested that the dataset might be able to shed light on the question of whether small businesses are a special group of businesses that need targeted assistance and whether governments should provide such assistance. For example,
5 9CON F E R E NC E VOLU M E | 2 015
DISC US SION
the data may be useful in answering whether policies such as lower payroll tax thresholds and accelerated depreciation allowances for small businesses are beneficial.
One participant suggested that uncertainty represents both an opportunity and a threat for small businesses. As such, it would be useful if further work gathered more information on the nature of uncertainty that small businesses face and how small businesses were responding to uncertainty. Professor Holmes noted that some additional questions on the nature of uncertainty had been included in the survey, but he agreed that more information would be desirable. He explained that the additional questions indicated that general consumer and business confidence were the main uncertainty-related issues for about two-thirds of businesses surveyed. Another issue raised in the survey was changes in tax concessions. The participant followed up by commenting that information on what firms are doing to position themselves to manage uncertainty would be relevant for how industry associations structure their education and seminar programs.
Finally, a participant observed that government agencies typically define small business in a way that is convenient for their purposes, which leads to conflicting regulatory definitions. However, the participant noted that the conduct of regulators is often more important to small businesses than the volume of regulation. The participant opined that several federal regulators had improved the way that they conduct their regulatory duties. It was also noted that many of the regulatory difficulties faced by small businesses are from smaller regulators, particularly local councils.

6 0 R E SE RV E BA N K OF AUST R A L I A
6 1CON F E R E NC E VOLU M E | 2 015
SME Access to Intermediated Credit: What Do We Know and What Don’t We Know?Gregory F Udell
1. IntroductionOver the past several decades, there has been a growing interest in small to medium-sized enterprise (SME) finance among academics. In great part, scholarly interest in SME finance was a natural outgrowth of the early information-based theories of banking (Diamond 1984; Ramakrishnan and Thakor 1984; Boyd and Prescott 1986). This ‘modern theory of banking’ argues that banks are uniquely suited to produce information about opaque borrowers, of which SMEs are a prime example. This theory, therefore, helped fuel academic interest in SME finance because it implicitly pointed out that the best place to look for the effect of asymmetric information on financial contracting is likely to be in the SME sector.
The interest in SME finance has, however, not just been from academics studying banking but also from corporate finance academics. The literature on corporate finance focuses on how firms access external finance (Jensen and Meckling 1976; Townsend 1979; Myers 1984; Myers and Majluf 1984) – and in the SME sector this usually means bank loans.1 So while the banking literature focuses on SME external finance from the lender’s perspective, the academic literature on corporate finance focuses on SME external finance from the firm’s perspective. Thus, in the SME space at least, these are quite clearly two sides of the same coin.
I, among others, have written a number of overview papers on SME finance – both on the broad topic of SME finance (Berger and Udell 1998) and on special issues within the general topic of SME finance (Berger and Udell 2002, 2006; Taketa and Udell 2007; Udell 2009, 2011). Since the time of these reviews, however, there have been a number of important developments.
• There is heightened public policy interest in the topic. Policymakers are naturally concerned about SMEs because they are such a large component of the global economy. Even in countries such as the United States – which is viewed as a decidedly market-oriented economy – the SME sector is huge. About half of the labour force in the United States is employed by firms with fewer than 500 employees (Stangler and Litan 2009). However, policymakers’ interest in SME access to finance has been driven by more than just the size of the SME sector. It has also been driven by factors such as: the vulnerability of SMEs because of their opacity; the potential effect of financial reforms on SME access to finance (e.g. the potential effect of risk-based capital); significant structural changes in the banking industry
1 There are, nevertheless, other important sources of external finance, the most important of which is trade credit (Berger and Udell 1998).
6 2 R E SE RV E BA N K OF AUST R A L I A
GR EG ORY F U DE L L
(e.g. consolidation and deregulation); and the impact of macroeconomic shocks. Probably more so than ever, policymakers are turning to the academic community for answers to questions about SME finance.
• The literature has reached a point where we can start drawing much stronger conclusions about what we know about SME finance. In particular, new datasets have driven a surge of empirical investigation of theoretical models of SME access to finance. These include firm-level survey data in Japan collected by the Research Institute of Economy, Trade and Industry (Uchida, Udell and Yamori 2012) and loan-level data collected by the Central Bank of Ireland as part of the Financial Measures Programme 2011 (McCann and McIndoe-Calder 2012). It also includes new cross-country survey data such as the European Bank for Reconstruction and Development (EBRD) and World Bank’s Business Environment and Enterprise Performance Survey (Popov and Udell 2012) and the European Central Bank (ECB) and European Commission’s firm-level Survey on the Access to Finance of Enterprises (SAFE) (Ferrando and Mulier 2013). As a result, academic work on SME access to finance has progressed significantly since the last comprehensive assessment in 1998 (Berger and Udell 1998). A striking example of the seasoned nature of this research is the new meta-analysis by Kysucky and Norden (2014) on relationship lending.
The global financial crisis – arguably the biggest macro shock in nearly a century – has fuelled enormous interest in SME finance and has generated a large increase in research on the topic. Thus, it seems prime time to review how the literature has evolved and conduct an assessment of what we know and don’t know about SME finance. This paper – as the title suggests – attempts to do this. Clearly in an overview piece such as this it will be impossible to discuss in detail all of the relevant papers. My goal is to enumerate the key issues within the broad topic of SME access to finance and identify where the frontier of knowledge lies on each of these topics.
To structure this investigation, I will use the prism of two paradigms that I helped to develop in earlier papers: the concept of lending technologies; and the concept of SME lending channels. These facilitate a discussion of what the extant literature tells us about SME access to finance and help identify the biggest holes in the literature. In the interest of time, I will only consider the debt side of SME finance.2
In Section 2, I present the concept of lending technologies and use it as a vehicle to discuss the literature on SME debt finance. In Section 3, I present the concept of SME lending channels and use it to discuss several of the remaining topics that fall under SME finance, specifically organisational issues associated with providing SME loans and how SME finance can be affected by macro shocks. Prominent examples of the latter are the early 1990s banking crisis in Japan and the financial crisis in the United States and Europe. Everyone seems to like a ‘top 10’ list. In that spirit, Section 4 offers what I see as the 10 biggest gaps – and best research opportunities – in the SME finance literature. Section 5 concludes.
2 Berger and Udell (1998) covers the private equity markets as well as the private debt markets that provide external financing to SMEs. The private equity markets prominently include angel finance, formal venture capital finance and equity crowdfunding. Because this paper only covers the private debt market, it does not cover some of the interesting new literature on developments in these private equity markets.

6 3CON F E R E NC E VOLU M E | 2 015
SM E ACCE SS TO I N T ER M EDI AT ED CR EDI T: W H AT DO W E K NOW A N D W H AT DON’T W E K NOW?
2. Lending Technologies
2.1 An introduction to the lending technologies frameworkA lending technology is a ‘unique combination of the primary source of information, screening and underwriting policies/procedures, structure of the loan contracts, and monitoring strategies and mechanisms’ (Berger and Udell 2006, p 2948). The concept of ‘lending technologies’ was first introduced to the academic literature in Berger and Udell (2002). Its introduction was motivated by a desire to more closely connect scholarly work on SME finance to commercial lending as practised in the real world.
The early academic research on banking and commercial lending was generally quite abstract. In that literature, distinctions were made between arms-length finance and informed lenders – that is, corporate bonds versus commercial loans (Rajan 1992). Similarly, the empirical literature focused on the fact that banks are unique in their role as a delegated monitor (James 1987). While granular examination of how banks actually underwrote commercial loans can best be traced to the early papers on relationship lending (Petersen and Rajan 1994, 1995; Berger and Udell 1995), at the risk of some oversimplification, the academic literature became too focused on relationship lending. The dichotomy between arms-length bond investors and informed bank lenders became redefined to mean that the world of debt was divided into just two parts: bond investors and relationship lenders. This came with the implication in much of the academic literature that the only way banks extended credit – particularly in the SME market – was through relationship lending. The principal contribution of Berger and Udell (2002) was, therefore, to highlight the reality that both large and small banks lend to SMEs in many ways that deviate from pure relationship lending.
Berger and Udell (2002) and subsequent refinements emphasised that banks lend to SMEs using a variety of different lending technologies (Berger and Udell 2006; Berger 2015). These lending technologies are not necessarily available in all countries; availability depends on a country’s financial institutional structure and its lending infrastructure (Berger and Udell 2006). Big distinctions likely exist between developed and developing economies, and even among developed economies.
2.1.1 The lending technologies
Table 1 lists the 10 lending technologies that exist in at least some countries today.3 Column 2 lists whether the lending technology is relationship based or transactions based. Column 3 notes whether the technology is primarily designed for relatively opaque SMEs, relatively transparent SMEs, or both. Finally, column 4 maps the type of lending but emphasises the primary source information on which the technology is based – whether it is ‘soft’ information or ‘hard’ information. Soft information is information that is not quantifiable and not easily transmitted within the hierarchy of a financial institution (Stein 2002). Hard information is quantifiable and can be transmitted – such as audited financial statements.
3 A more extensive definition and discussion of most of these lending technologies can be found in Berger and Udell (2006) and Berger (2015).
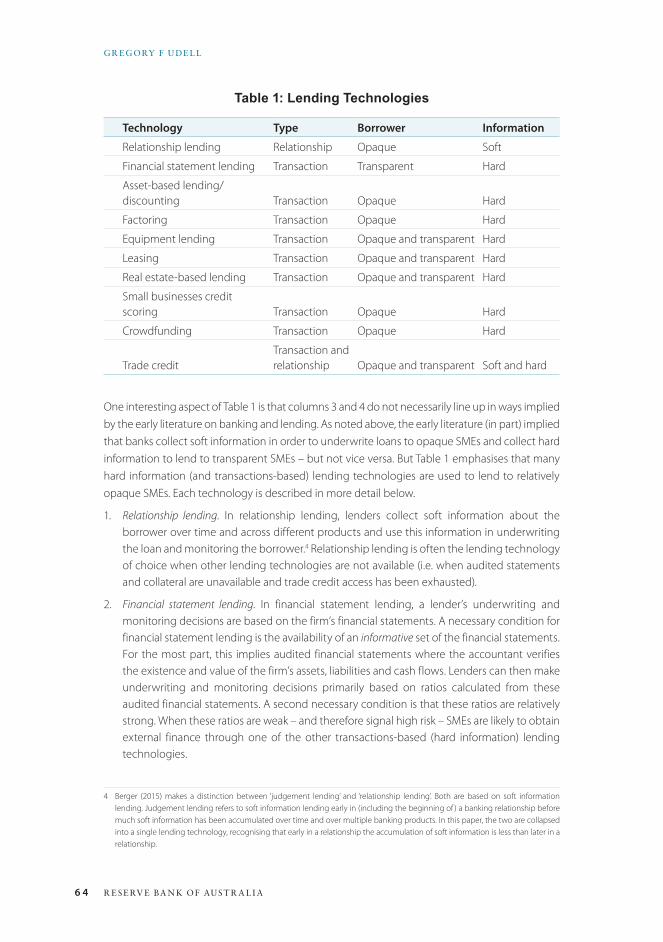
6 4 R E SE RV E BA N K OF AUST R A L I A
GR EG ORY F U DE L L
Table 1: Lending Technologies
Technology Type Borrower Information
Relationship lending Relationship Opaque Soft
Financial statement lending Transaction Transparent Hard
Asset-based lending/discounting Transaction Opaque Hard
Factoring Transaction Opaque Hard
Equipment lending Transaction Opaque and transparent Hard
Leasing Transaction Opaque and transparent Hard
Real estate-based lending Transaction Opaque and transparent Hard
Small businesses credit scoring Transaction Opaque Hard
Crowdfunding Transaction Opaque Hard
Trade creditTransaction and relationship Opaque and transparent Soft and hard
One interesting aspect of Table 1 is that columns 3 and 4 do not necessarily line up in ways implied by the early literature on banking and lending. As noted above, the early literature (in part) implied that banks collect soft information in order to underwrite loans to opaque SMEs and collect hard information to lend to transparent SMEs – but not vice versa. But Table 1 emphasises that many hard information (and transactions-based) lending technologies are used to lend to relatively opaque SMEs. Each technology is described in more detail below.
1. Relationship lending. In relationship lending, lenders collect soft information about the borrower over time and across different products and use this information in underwriting the loan and monitoring the borrower.4 Relationship lending is often the lending technology of choice when other lending technologies are not available (i.e. when audited statements and collateral are unavailable and trade credit access has been exhausted).
2. Financial statement lending. In financial statement lending, a lender’s underwriting and monitoring decisions are based on the firm’s financial statements. A necessary condition for financial statement lending is the availability of an informative set of the financial statements. For the most part, this implies audited financial statements where the accountant verifies the existence and value of the firm’s assets, liabilities and cash flows. Lenders can then make underwriting and monitoring decisions primarily based on ratios calculated from these audited financial statements. A second necessary condition is that these ratios are relatively strong. When these ratios are weak – and therefore signal high risk – SMEs are likely to obtain external finance through one of the other transactions-based (hard information) lending technologies.
4 Berger (2015) makes a distinction between ‘judgement lending’ and ‘relationship lending’. Both are based on soft information lending. Judgement lending refers to soft information lending early in (including the beginning of ) a banking relationship before much soft information has been accumulated over time and over multiple banking products. In this paper, the two are collapsed into a single lending technology, recognising that early in a relationship the accumulation of soft information is less than later in a relationship.

6 5CON F E R E NC E VOLU M E | 2 015
SM E ACCE SS TO I N T ER M EDI AT ED CR EDI T: W H AT DO W E K NOW A N D W H AT DON’T W E K NOW?
3. Asset-based lending. Asset-based lending – also known as discounting in some countries – is a lending technology designed for SMEs whose financial statements (either audited or unaudited) reflect a weak borrower (typically highly leveraged), and a borrower that has accounts receivables and inventory that can be pledged as collateral. This lending technology is typically used for working capital purposes. The amount of the loan is determined by a loan-to-valuation (LTV) ratio applied to accounts receivable and inventory, which is calculated on a daily basis. The LTV ratio is calculated based on quantitative formulas that relate to the quality and nature of the accounts receivable and the inventory. Another distinguishing feature of asset-based lending is periodic external audits (typically quarterly) of the borrowing firm and the firm’s collateral conducted by the lender known as ‘field exams’. Asset-based lending is frequently extended in conjunction with equipment lending (Udell 2004).
4. Factoring. In factoring, the lender – known as the ‘factor’ – purchases accounts receivable from the borrower. The amount advanced (the analogue of the LTV ratio) to the borrower against accounts receivable is typically calculated using the same basic quantitative metrics as in asset-based lending. However, unlike asset-based lending the ownership of the accounts receivable passes from the borrower to the factor (Udell 2004).
5. Equipment lending. Equipment lending is lending secured by equipment. If the purpose of the loan is to purchase the equipment, the LTV ratio is applied to the purchase price of the equipment and the amortisation of the loan is typically based on the life span of the equipment. If the purpose of the loan is other than to purchase the equipment itself, the LTV ratio is applied to the appraised value of the equipment and the amortisation is set based on the remaining life span of the equipment. For many loans, particularly in developed economies, professional appraisers are hired to evaluate the equipment (Udell 2004).5
6. Leasing. Leasing is similar to equipment lending except that the ‘lender’ (the lessor) owns the equipment rather than the ‘borrower’ (the lessee).
7. Real estate-based lending. This involves lending to an SME using real estate as collateral. This can involve lending funds to an SME to buy real estate (e.g. a building), or lending for other purposes but underwriting the loan based on the value of the real estate. The real estate can be either commercial property owned by the SME or entrepreneur, or residential property owned by the entrepreneur. Real estate lending is typically based on an independent appraisal of the real estate.
8. Small business credit scoring. This is a relatively new lending technology in which the loan is primarily or exclusively assessed based on a multivariate statistical model. This technology was first introduced by Wells Fargo Bank in 1995 and spread relatively quickly to other large banks in Europe and Japan. Now it is often underwritten exclusively through an internet platform with minimal or no human interaction. Banks use this technology for smaller loans typically under $250 000, or in many cases under $100 000.
9. Crowdfunding. Often referred to as peer-to-peer (P2P) lending, this technology involves borrowing from other individuals through a P2P platform. The amounts are typically quite small and usually the loan is made directly to the SME or entrepreneur on an unsecured basis.
5 Many large appraisers also provide collateral liquidation services. There may be a valuable synergy in combining these two activities. That is, the data these companies collect in their liquidation business may provide valuable pricing information that is useful in their appraisal business (Udell 2004).
6 6 R E SE RV E BA N K OF AUST R A L I A
GR EG ORY F U DE L L
10. Trade credit. This is credit extended by vendors to purchase raw materials. It appears as accounts payable on the borrower’s balance sheet and as accounts receivable on the lender’s balance sheet. The terms of credit often specify a maximum maturity and a shorter discount period, during which the borrower can pay off the obligation at a discounted price. The ‘price’ of trade credit may be jointly determined with the price of the underlying goods.
A discussion of these lending technologies serves two purposes: it provides a conceptual framework for thinking about SME finance on many dimensions; and it provides a convenient way to discuss the frontier of academic literature on SME finance. Section 2.2.1 looks at the literature on each separate lending technology. Before turning to a discussion of the academic literature related to the individual lending technologies, several additional aspects of SME loan underwriting are worth mentioning.
First, the purpose of an SME loan typically falls into one of three categories: working capital financing; fixed asset financing; and acquisition financing – loans used for the purpose of buying another company. Some lending technologies are typically associated with specific purposes. Others are not. Asset-based lending, factoring and trade credit financing are typically associated with working capital financing – they are used to finance accounts receivable and inventory. All three of these lending technologies are often associated with lines of credit, which allow funding levels to vary according to the ebb and flow of current assets. Leasing is typically associated with fixed asset financing.6 However, all of the other lending technologies could be used for working capital purposes or fixed asset purchases. For example, lending against existing equipment can provide funds for working capital purposes. And many of these lending technologies can be used for acquisition financing (e.g. asset-based loans).
Second, different lending technologies can be used for different loans to the same firm. For example, it is quite common for financial statement lending to be combined with equipment lending. A bank might extend a line of credit for working capital purposes to a firm based on financial statement lending and extend an equipment loan to the same firm for the purpose of purchasing a piece of equipment. Further, equipment may be pledged as a secondary source of collateral for an existing asset-based loan.
Third, these lending technologies are not mutually exclusive, even at the loan level. Some aspects of one lending technology may be used as a secondary underwriting tool in conjunction with the primary lending technology. For example, there may be a relationship aspect to a financial statement loan; banks often give some weight to the strength of the banking relationship (i.e. incorporate some soft information) in underwriting a financial statement loan. We would, nevertheless, classify this loan as a financial statement loan if this was the primary technology used in underwriting and monitoring the loan, even though some weight was given to the strength of the bank-borrower relationship. In other words, a lending technology relates to how a loan is primarily underwritten and monitored.
Fourth, lending technologies can interact with ‘credit multipliers’. Two credit multipliers have received considerable policy attention recently. First, many countries have government guarantee programs where government guarantees partially indemnify loans made in the private sector.
6 In a sale leaseback, leasing could be associated with something other than the financing of the fixed asset being leased because the proceeds from sale leaseback are fungible.
6 7CON F E R E NC E VOLU M E | 2 015
SM E ACCE SS TO I N T ER M EDI AT ED CR EDI T: W H AT DO W E K NOW A N D W H AT DON’T W E K NOW?
Second, in many developed economies some SME loans have been securitised. These credit multipliers have been introduced based on the assumption of a temporary or permanent funding gap in the SME sector (see also Section 3.3).
2.2 Lending technologies and the academic literatureIn discussing the literature on SME lending through the prism of lending technologies, it will be helpful to decompose the discussion into two parts: the individual lending technologies (Section 2.2.1); and the lending environment (i.e. policies and infrastructure) that affects the existence and importance of each of the lending technologies across the globe (Section 2.2.2). Section 2.2.3 concludes the discussion of lending technologies with some broad thoughts on the usefulness of the lending technologies paradigm.
2.2.1 The literature on individual lending technologies
For expositional purposes it will be helpful to break the discussion of the literature on individual lending technologies into two categories: non-collateral-based technologies and collateral-based technologies. This may seem odd at first blush because it implies a powerful common link among the collateral-based lending technologies. Although all of the collateral-based lending technologies involve lending against the value of a tangible asset, that is in great part where the similarity ends.
Grouping the collateral-based lending technologies together is, instead, driven by the fact that academics have often grouped these together. Indeed, there is a sub-literature that can best be described as the ‘literature on collateral’. As I will argue below, the implicit grouping of these collateral-based lending technologies has fostered some confusion and misconceptions about how similar they are. I will elaborate on this confusion and highlight why these collateral-based lending technologies can be viewed as quite distinct.
Non-collateral-based lending technologies
Relationship lending. It is probably safe to assert that more has been written about relationship lending than all of the other lending technologies combined. This seemingly suggests that proportionately more space in this paper should be devoted to relationship lending because there is so much written about it. But, as it turns out, it is the only lending technology on which the advantage of a meta-analysis – specifically, the cross-country meta-analysis on relationship lending by Kysucky and Norden (2014) – is available. The large literature on relationship lending makes such a study feasible. By exploiting this analysis of 101 separate studies, relationship lending can most efficiently be covered by simply summarising the key findings. I will also offer a few additional comments on relationship lending.
As noted above, in deploying this technology, lenders collect soft information about the borrower/entrepreneur over time and use this information in underwriting the loan and monitoring the borrower. Probably the most critical issue is whether relationship lending indeed reduces information asymmetries through the production of soft information. In other words: does relationship lending work? Does it produce benefits to the borrower?
6 8 R E SE RV E BA N K OF AUST R A L I A
GR EG ORY F U DE L L
By definition, soft information is not quantifiable and easily transmitted within the hierarchy of lending organisations. This makes it unobservable to the empiricist. Thus, from the beginning of the literature on relationship lending, researchers have sought proxies for the production of soft information, most of which are related to the strength of the relationship (Petersen and Rajan 1994, 1995; Berger and Udell 1995). These proxies include relationship length, bank-borrower distance, exclusivity and cross-product information synergies.7
The Kysucky and Norden analysis indicates that strong relationships tend to benefit SMEs in terms of lending outcomes:
Long-lasting, exclusive and synergy-creating bank relationships are associated with higher credit volume and lower loan rates. These benefits are more likely in the US and in countries where bank competition is high. They are not related to the importance of SMEs in an economy, suggesting that a higher prevalence of relationship lending does not necessarily come along with higher benefits for borrowers. (Kysucky and Norden 2014, p 1)
Importantly, however, Kysucky and Norden note that ‘lending outcomes differ across the relationships’ dimensions’ (Kysucky and Norden 2014, p 1).
Kysucky and Norden’s finding on competition is interesting because theoretical models of relationship lending suggest that in order to induce a bank to invest in a relationship, the bank needs some market power to ensure that its investment has a positive net present value (Petersen and Rajan 1995). This implies a ‘hold-up problem’, where relationship-dependent SMEs become captured by their relationship lenders. Thus, there is a tension between the benefits of competition (more competition diminishes the hold-up problem and improves pricing to the SME) and the benefits of market power (encouraging more relationship lending). Kysucky and Norden’s finding implies that competition wins this horse race. However, this finding might be sensitive to how competition is measured – for example, whether it is measured using the Lerner Index or by concentration measures such as the Herfindahl-Hirschman Index (Carbó-Valverde, Rodríguez-Fernández and Udell 2009).
The existence of a hold-up problem also suggests that a firm’s life-cycle effect – where a firm grows from being a small and acutely opaque firm to a larger informationally transparent firm – matters for its access to finance (Berger and Udell 1998). As firms evolve, we should see a tipping point where growing SMEs break the shackles of their relationship loan – that is, break the hold-up problem. At this point, firms would switch from a relationship bank to a transactions-based bank that deploys one of the other lending technologies – specifically, the financial statement lending technology that is common in large firm lending. One challenge in testing this proposition is that we do not have datasets that span the life cycle. We have a number of datasets on small business finance and we have extensive data on large firm finance, but none span small, medium and large firms. Nonetheless, one study finds evidence of this tipping point in the firm life cycle using US data on firms that range from (smaller) mid-sized firms to very large firms (Gopalan, Udell and Yerramilli 2011). That is, firms outgrow their relationship bank and switch to a transactions-based bank. Once they transfer they obtain more funding and enjoy an improved growth trajectory.8
7 In addition to the Kysucky and Norden (2014) meta-analysis, there have been several papers exclusively devoted to a review and assessment of the literature on relationship lending (see, for example, Boot (2000) and Elyasiani and Goldberg (2004)) and other papers that included a comprehensive discussion of this literature (Berger and Udell 1998, 2002, 2006).
8 Other papers on why firms switch banks include Farinha and Santos (2002) who use Portuguese data and Ioannidou and Ongena (2010) who use Bolivian data. The latter paper also finds that, while firms switch in order to obtain lower rates, they also tend to get informationally locked in with their new bank.
6 9CON F E R E NC E VOLU M E | 2 015
SM E ACCE SS TO I N T ER M EDI AT ED CR EDI T: W H AT DO W E K NOW A N D W H AT DON’T W E K NOW?
Kysucky and Norden (2014) may understate the benefits from relationship lending, as defined in this paper. In most of the studies surveyed by Kysucky and Norden, the data likely include both relationship borrowers and transactions-based borrowers (i.e. borrowers whose banks fund them using one of the other lending technologies). For these latter borrowers the relationship is less important than the hard information used in the primary lending technology. This suggests a bias against finding relationship benefits. Thus, Kysucky and Norden’s finding of relationship benefits is a particularly powerful result.
Financial statement lending. Relatively little has been written about this transactions-based lending technology for SMEs. The reason is simple: financial statement lending isn’t unique to SMEs. Indeed, financial statement lending is the primary way in which lending is underwritten in commercial lending to medium-sized and large firms.
As defined here (and in Berger and Udell (2006)), financial statement lending is based on audited financial statements – that is, financial statements that are informative because the existence of the firm’s assets, liabilities and cash flows have been verified by a third party. Another way to think about financial statement lending to SMEs is that it is precisely when commercial loan underwriting looks the same in the SME sector as it does in the large firm sector. Thus, what we know about financial statement lending in large firm lending applies to SME lending.
In this sense we know a lot about SME financial statement lending. For example, a key characteristic of financial statement lending is the use of covenants and the importance of the renegotiation option associated with covenant tightness. Covenants are, for the most part, not feasible in the absence of audited financial statements. The power and usefulness of covenants based on financial ratios (or other financial events) depends on the accuracy of the financial numbers. Covenants written on company-prepared statements or unaudited statements are far less powerful because the information used to enforce them is less reliable. Thus, to understand SME financial statement lending we can turn to an extensive literature on covenants, including early theoretical literature (Berlin and Loeys 1988; Berlin and Mester 1992). Moreover, we can rely on more recent empirical work on covenants even though the data used in this work is mostly on large firms (Chava and Roberts 2008; Drucker and Puri 2009; Gârleanu and Zwiebel 2009; Billett et al forthcoming).
The Securities and Exchange Commission (SEC) requires companies that list their securities publicly to periodically submit audited financial statements.9 These requirements are for large firms or larger mid-sized firms. But for most SMEs, the decision to obtain an audit is a choice. That choice depends on the trade-off between the costs and benefits from getting an audit. The benefits stem from the lower cost for the lender of underwriting the loan using the financial statement lending technology and the potentially better precision in assessing risk. This could, in turn, lead to greater access to credit and a lower price of credit.10
This observation raises an interesting question: which SMEs choose to obtain an audit by an accounting firm or certified public accountant? A relatively recent paper by Allee and Yohn 2009) addresses this question. Allee and Yohn examined the decision by SMEs to choose among four
9 For more detail on the SEC’s requirements, see <http://www.sec.gov/investor/pubs/aboutauditors.htm>.
10 An alternative way to think about the auditor choice is to view it as a trade-off between the benefits and costs of becoming more transparent.
7 0 R E SE RV E BA N K OF AUST R A L I A
GR EG ORY F U DE L L
levels of auditor association: an audit; a review; a compilation; and company-prepared statements.11 They did so using data on financial statement types from the 2003 Survey of Small Business Finances conducted by the Federal Reserve Board and an ordered probit framework. Among other things, the paper finds that the demand for ‘sophisticated’ financial statements is positively related to firm size and firm growth. They also find that getting an audit improves an SME’s access to credit, in terms of reducing the probability of loan denial. However, they did not find a statistically significant effect on loan rates.12
Small business credit scoring. Small business credit scoring was adopted in the mid 1990s by Wells Fargo Bank. It quickly spread among large banks in the United States and then to regional US banks and other countries. There has been a considerable amount of interest in the adoption of this transactions-based innovation and on how banks have deployed it. In particular, the literature has focused on its positive effect on: out-of-market lending; longer-distance lending; and overall access to credit (Frame, Srinivasan and Woolsey 2001; Frame, Padhi and Woosley 2004; Cowan and Cowan 2006; DeYoung et al 2008; DeYoung et al 2011). Somewhat unclear in the literature is the extent to which the benefit from lower underwriting costs is offset by the reduced accuracy of the credit decision (DeYoung et al 2008).
Another interesting issue is the nature of the innovation itself. The introduction of small business credit scoring is often described in terms of technological progress and banks taking advantage of ‘improvements in information processing, telecommunications, and financial technologies’ (Berger 2015, p 303). However, the technology underlying small business credit scoring had existed for many years in consumer loans. I discuss this further in Section 4.5.
Crowdfunding. This is a relatively new transactions-based technology (about 10 years old) that has generated a lot of interest in the financial and popular press. Some crowdfunding is on the debt side and some is on the equity side. On the debt side, these are ‘microloans’ (less than $25 000) extended on an unsecured basis by individuals to individuals (i.e. P2P lending with the entrepreneur as the obligor). Prospective borrowers post their loan requests online in a form equivalent to a term sheet that includes the loan amount, the maximum loan rate and an optional description. Information from a consumer credit bureau appears to also be provided to potential lenders. Funding can be obtained either through a closed auction – at the requested amount and rate – or an open auction where bidding remains open for a specified period and the rate can be bid down.13
There is a small but growing body of literature on this technology that includes:
• investigations of lending biases (Ravina 2008; Pope and Sydnor 2011)
• the role of friendships in mitigating adverse selection and information asymmetry (Lin et al 2013)
11 To qualify under the definition of financial statements used in this paper, the statements must be either audited or reviewed. In constructing audited financial statements all of the balance sheet and income statement numbers must be verified; in a review at least some of them are (and these are specified in the review).
12 Allee and Yohn (2009) did find evidence of a statistically significant effect on interest rates for SMEs organised as unlimited liability firms (e.g. sole proprietorships and partnerships). However, they cannot specifically analyse the trade-off between audit costs and benefits because the Survey of Small Business Finances does not have data on audit cost (see Allee and Yohn (2009, p 15, footnote 11)).
13 Lin, Prabhala and Viswanathan (2013) provide details on Prosper.com’s procedures (Propser.com is the largest peer-to-peer lending market).

7 1CON F E R E NC E VOLU M E | 2 015
SM E ACCE SS TO I N T ER M EDI AT ED CR EDI T: W H AT DO W E K NOW A N D W H AT DON’T W E K NOW?
• the presence of default information in excess of the hard information associated with the listing (Iyer et al 2013).
It is difficult to assess how prevalent this lending technology is. It certainly exists in developed economies like Australia and the United States. However, reliable data on the volume of funding that flows through P2P lending portals are rare. A recent academic paper that used data on ‘[t]he biggest market, Prosper.com’ states that ‘Prosper.com has logged over 200,000 listings seeking $1 billion in funding since its inception’. Moreover, it had, ‘[b]y the end of 2008 … over $178 million in funded loans’ (Lin et al 2013).
Trade credit. Trade credit is the second most important source of external SME debt finance (Demirgüç-Kunt and Maksimovic 2001). Berger and Udell (1998) show that in the United States, trade credit provides 31 per cent of debt financing to SMEs, nearly as much as commercial banks (37 per cent). It is also globally ubiquitous. For example, trade credit provides about 33 per cent of SME debt finance in Spain and about 24 per cent in Japan. Because of its importance it is not surprising that there is a large body of literature on trade credit – too large for a detailed discussion here.14
A variety of theories have been offered to explain trade credit, including: advantages in assessing customer quality; enforcing unsecured debt; signalling product quality; and relationship-based theories. It is difficult to classify trade credit as either distinctly relationship-based or transactions-based because the literature is unsettled on how important the relationship element is.
There is also an extensive literature on whether trade credit is a substitute or a complement to bank loans.15
Let me offer two further comments on trade credit. First, given the extensive body of academic literature on trade credit and the unsettled issues associated with its use, the timing may be right to conduct a meta-analysis of the trade credit literature in the spirit of Kysucky and Norden’s (2014) meta-analysis of relationship lending.
Second, it is my sense that there is some confusion in the literature about the cost of trade credit. This issue stems from the fact that there is a widespread assumption in the academic literature that trade credit is considerably more expensive than bank loans. This matters because it may tell us something about the nature of trade credit and because researchers can exploit this cost difference to identify credit-constrained firms.
The assertion that trade credit is extremely expensive appears early in the trade credit literature. Smith (1987) notes that sellers’ payment terms can include a discount for early payment. Smith cites the example of ‘2/10 net 30’ contract terms – where buyers have 30 days to pay the invoice and receive a 2 per cent discount if they pay within 10 days. Smith notes that this implies that the interest rate is effectively 44 per cent per annum (Smith 1987, p 865). Smith offers no citation for this description of the payment terms nor any information on how these terms might vary. Petersen and Rajan (1994) also noted the 44 per cent per annum example in order to motivate their identification strategy, and cite Smith (1987) as the source. While Petersen and Rajan (1994)
14 For recent discussions of the literature on trade credit, including the theories that potentially explain the importance and advantage of trade credit, see Giannetti, Burkart and Ellingsen (2011), Uchida, Udell and Watanabe (2013) and Carbó-Valverde, Rodríguez-Fernández and Udell (forthcoming).
15 See, for example, Giannetti et al (2011), Uchida et al (2013) and Carbó-Valverde et al (forthcoming).
7 2 R E SE RV E BA N K OF AUST R A L I A
GR EG ORY F U DE L L
qualify their assumption by noting that the rate is clearly lower if borrowers are allowed to stretch their payments, they also note that ‘discount terms are not specific to a firm, but common practice throughout an industry … [and] discounts and penalties are substantial’ (p 23).
The problem here is reconciling the assertion that trade credit is extraordinarily expensive with the observed fact that trade credit is nearly as important as bank lending virtually everywhere in the world. If trade credit were, in fact, 5–10 times more expensive than bank credit, it seems implausible that SMEs would depend so heavily on trade credit – in particular SMEs with access to bank credit.
How do we reconcile this inconsistency? First, ‘2/10 net 30’ is not, by any means, the uniform financial terms of trade credit (Giannetti et al 2011). Second, as acknowledged by Petersen and Rajan (1994), the stated terms are not necessarily the enforced terms. Third, the ‘all-in’ price – that which matters – must incorporate both the price of the product as well as the financial terms of trade credit. It is highly unlikely that there are any available data that would allow us to calculate this all-in price.16
If trade credit is much less expensive than implied in the literature, how damaging is this to the extant academic literature? My view is that it depends. The empirical literature, which examines differences in trade credit and bank credit across firms or in response to external shocks, depends on an assumption about the marginal cost of trade credit, not the average cost. In this regard, the assumption that at some ‘level’ of trade credit usage, trade credit begins to get more expensive than bank loans under normal conditions is probably reasonable. Most of the literature on trade credit and funding constraints, including Petersen and Rajan (1994) and recent papers that have looked at trade credit as a safety valve during the financial crisis, are likely on safe ground (Garcia-Appendini and Montoriol-Garriga 2013; Carbó-Valverde et al forthcoming).
More problematic is interpreting the costs associated with trade credit and what those costs tell us about the uniqueness of trade credit as a lending technology. If the cost of trade credit is indeed 44 per cent, then either trade credit is an exorbitantly expensive lending technology to deliver, or vendors are enjoying extraordinarily high rents; neither seems particularly plausible.
Collateral-based lending technologies
The remaining lending technologies are based on quantitative hard information about tangible assets. Most of the technologies specifically involve a security interest in the underlying assets (factoring and leasing being the two exceptions). Because hard information about the underlying tangible asset is common to all of these lending technologies, grouping them together makes some sense. In addition, all of these lending technologies are transactions-based.
There are two types of collateral: outside collateral and inside collateral. Outside collateral refers to assets that are not owned by the SME (i.e. ‘outside’ the firm). This is quite common in SME lending and occurs most often when an entrepreneur pledges personal real estate as collateral. Inside collateral refers to business assets such as accounts receivable, inventory, and plant and equipment owned by the firm. There is considerable confusion in both the theoretical and empirical literature about these two types of collateral. I’ll defer discussion of that confusion until Section 4.4.
16 For a more detailed treatment of this trade credit pricing puzzle, see Miwa and Ramseyer (2008).
7 3CON F E R E NC E VOLU M E | 2 015
SM E ACCE SS TO I N T ER M EDI AT ED CR EDI T: W H AT DO W E K NOW A N D W H AT DON’T W E K NOW?
Asset-based lending. Asset-based lending strictly involves inside collateral (i.e. accounts receivable and inventory). It is targeted to relatively high-risk, high-leverage SMEs that have accounts receivable and inventory to pledge as collateral. The LTV ratio is applied to the collateral on a daily basis, based on changes in the levels of the accounts receivable and inventory. The LTV ratio is calculated based on quantitative formulas that rely on the quality and nature of the collateral (as applicable).
In addition, asset-based lenders rely on their own audit teams rather than external accounting firms. These teams typically conduct field exams four times a year to verify the books and records of the firm, and the value – and existence – of the collateral. As such, this is a relatively expensive lending technology. It is often used in conjunction with SME leveraged buyouts and for distressed firms with a high probability of restructuring. In the United States, it is typical that an asset-based lender will convert to the debtor-in-possession lender who provides the firm with working capital if it goes into Chapter 11 bankruptcy.17
Despite the prevalence of asset-based lending in common law countries (e.g. Australia, Canada, New Zealand, the United Kingdom and the United States) there has been relatively little research on this lending technology. Interesting exceptions are Carey, Post and Sharpe (1998) and Klapper (2001), who both provide evidence confirming that asset-based loans are riskier. Mester, Nakamura and Renault (2007) find that the asset-based lending technology improves monitoring and reduces diversion of funds.
Equipment lending. Equipment lending is similar to asset-based lending, except that the collateral is equipment owned by the firm. This is, in the vast majority of cases, inside collateral. The loan is either used to purchase the equipment that is used as collateral or it is used for some other purpose. In the latter case the equipment provides additional collateral to bolster a line of credit or loan secured by other assets (e.g. accounts receivable and inventory or other equipment). The theoretical literature mentioned earlier on inside collateral applies directly to equipment lending. However, it is unusual in SME research to find data that is sufficiently granular to distinguish among different types of collateral in empirical studies. Exceptions to this include the Federal Reserve Board’s Survey of Small Business Finances (Berger and Black 2011).
Real estate-based lending. Real estate-based lending can involve both inside and outside collateral. In the context of inside collateral, real estate-based lending is often associated with financing the SME’s headquarters or factory. Perhaps even more important is where real estate-based lending involves outside collateral. This occurs when the entrepreneur pledges their house (or other personally owned real estate) as collateral (typically a second mortgage) that secures a loan to the business.18
Recent research suggests that personal real estate can be a significant and important component of SME financing (Ono et al 2015). The recent boom and bust in the US housing market has also heightened interest in this type of financing and its link to small business activity. During the boom period – when housing prices increased significantly – this type of lending accounted for
17 See Udell (2004) for more details on how asset-based loans are structured.
18 Alternatively, the entrepreneur could privately obtain a second (private) mortgage or draw down on a home equity line of credit and lend the proceeds to their firm.
7 4 R E SE RV E BA N K OF AUST R A L I A
GR EG ORY F U DE L L
as much as 10–25 per cent of the increase in pre-crisis employment in the United States and led to a significant increase in the number of start-ups (Adelino, Schoar and Severino 2013).
The subsequent crisis had equally powerful effects in the opposite direction. One study found that, in the United Kingdom, the average small business extracted 20 cents out of every dollar of increase in the value of real estate during the boom. As a result, the decline in real estate-based small business lending during the financial crisis was responsible for a 10 per cent of the drop in national employment (Kleiner 2015b). Evidence from the United States indicates that one-quarter of large start-ups (defined as $100 000 in initial financing) relied on home equity as a source of capital, and that house price growth tends to shift financing from formal business loans to home equity financing (Kleiner 2015a). Evidence from Australia also supports the existence of a housing collateral channel affecting entrepreneurial activity, although the effect is relatively small (Connolly, La Cava and Read this volume).
Factoring. Factoring shares many similarities with asset-based lending that uses accounts receivable as collateral. The key distinguishing feature is that the lender (called the ‘factor’ in this context) purchases the receivables instead of lending against the receivables as collateral. Factoring can either be conducted on a recourse or non-recourse basis. The former is more common in developing economies and the latter more common in developed economies (Bakker, Klapper and Udell 2004). Factoring is often provided in a bundled product, suggesting synergies between the financing component (i.e. extension and assessment of credit), risk assumption and collection activities (Bakker et al 2004). Theoretical work suggests the possibility that factors may have a superior monitoring technology compared with that of suppliers (Sopranzetti 1998). Factors may have an advantage in assessing risk at the underwriting stage because of the economies of scale that arise from constructing large databases on payment performance. Research indicates that, because the ownership of factored receivables is shifted to the factor (and therefore not part of the estate of a bankrupt firm), factoring may allow high-risk suppliers to shift risk to higher-quality buyers (i.e. the factor). This may be particularly attractive in countries that have weak commercial laws and enforcement, where it is difficult to lend against accounts receivable as collateral (Klapper 2006).19
Leasing. Leasing is similar to equipment lending except that the ‘lender’ (the lessor) owns the equipment rather than the ‘borrower’ (the lessee). Like factoring, the underlying asset is owned by the ‘lender’. The academic literature on leasing has shown that it can mitigate the adverse selection problems associated with the sale of used and new equipment (Chemmanur and Yan 2000; Hendel and Lizzeri 2002; Gilligan 2004). Leasing may also be motivated by tax benefits (Graham, Lemmon and Shallheim 1998).
2.2.2 Lending technologies and the lending infrastructure
Berger and Udell (2006) argue that a country’s lending infrastructure determines the feasibility and importance of these lending technologies. A country’s lending infrastructure includes:
• the information environment (e.g. accounting rules and credit information sharing)
• the legal, judicial and bankruptcy environments
19 For a more detailed discussion of the mechanics of factoring, the nature of factoring contracts and the academic research on factoring, see Bakker et al (2004), Udell (2004) and Klapper, Laeven and Rajan (2012).
7 5CON F E R E NC E VOLU M E | 2 015
SM E ACCE SS TO I N T ER M EDI AT ED CR EDI T: W H AT DO W E K NOW A N D W H AT DON’T W E K NOW?
• the social environment (e.g. social capital)
• the tax and regulatory environment.20
Because of substantial cross-country differences in lending infrastructure, the full list of lending technologies may exist in only a few countries. For example, asset-based lending in its purest form may be limited to a handful of common law countries: Australia, Canada, New Zealand, the United Kingdom and the United States. This is because several necessary conditions in the lending infrastructure need to exist before pure asset-based lending can work.
• There has to be a set of modern laws on security interests in moveable assets that specifically allows for bulk assignment of accounts receivable and inventory.21
• There needs to be a modern collateral registration system that ‘time stamps’ the filing of security interests and provides immediate notification to all other creditors (and potential creditors). Ideally this should be a nationwide system.
• There needs to be sufficiently strong judicial and bankruptcy systems in place that do not deviate from absolute priority and that will quickly convey property rights in the secured moveable assets in the event of a default or a bankruptcy filing. In countries where a corporate bankruptcy filing immediately triggers an automatic stay, the bankruptcy system must allow for the simultaneous waiver of that stay with respect to accounts receivable and inventory upon petition by the asset-based lender.
• There needs to be an information sharing mechanism that allows asset-based lenders to efficiently evaluate the quality of accounts receivable.22
Factoring provides another interesting example of how the importance of a lending technology varies across countries. For example, in 2002 the ratio of factoring volume to GDP was 11.9 per cent in Italy but only 0.9 per cent in Switzerland (Bakker et al 2004). This could be attributable to the relatively poor bankruptcy system in Italy that encourages financial institutions to ‘take’ the receivables out of the firm through factoring (and thus out of the estate should the company go bankrupt).
Importantly, a country’s lending infrastructure is not fixed. While only a few countries currently have lending infrastructure that supports asset-based lending, the list may be growing. For example, in the last 10 years at least three countries have adopted a modern set of commercial laws on security interests designed to facilitate asset-based lending – China, Japan and Vietnam.23 Both China and Japan appear to have significantly increased lending secured by accounts receivable (and by inventory in Japan). However, it is not clear that this is equivalent to the way asset-based lending is practiced in the common law countries mentioned above. Rather, it may be more akin to ‘borrowing base lending’, because – although the collateralisation is the same – it lacks the continuous monitoring of asset-based lending (where loan levels are calibrated on the level of accounts receivable and inventory on a continuous basis). In my view, borrowing base
20 For more detail, see Berger and Udell (2006).
21 This is sometimes referred to as a ‘floating charge’ or ‘floating lien’.
22 The necessity for efficient information sharing also applies to factoring.
23 The author’s textbook, Udell (2004), has been published in Japanese and key excerpts have been translated into Chinese and Vietnamese in conjunction with workshops on asset-based lending presented by the author in China and Vietnam. For more information on the Chinese case, see, for example, IFC (2012).
7 6 R E SE RV E BA N K OF AUST R A L I A
GR EG ORY F U DE L L
lending should more properly be viewed as a variant of financial statement lending because the monitoring mechanism that is idiosyncratic to asset-based lending is absent.24
Similarly, many countries have relatively recently introduced laws allowing factoring, such as those in central and eastern Europe (Bakker et al 2004), and more recently Vietnam. Often the impetus for the introduction of factoring is to facilitate export financing – for example, ANZ was given permission to factor receivables in Vietnam through its affiliate, ANZ Bank Vietnam, in 2011.25
2.2.3 Some thoughts on the lending technologies paradigm
The concept of lending technologies was first introduced to the academic literature in Berger and Udell (2002) and later refined in Berger and Udell (2006). But how powerful is the paradigm?
In part, its power derives from the distinctiveness of each of the lending technologies. For example, the transactions-based technologies are intuitively and uniquely classified by the nature of the hard information associated with each of them. The hard information on which an equipment loan is based is the quantitative information contained in the equipment appraisal – most importantly, the appraised value of the equipment. The hard information in a small business credit scoring loan is the credit score generated by the scoring model used by the lender. These are clearly quite distinct forms of hard information.
The lending technologies framework recognises that lending markets include a number of alternatives to relationship lending. This is important because the early academic literature on opacity and bank lending tended to oversimplify the lending landscape. It tended to view all bank lending as being soft information driven. In this view, smaller opaque firms got relationship loans from banks and large firms got arms-length debt financing from the corporate bond market.
Empirical work has supported the lending technologies paradigm, and implicitly rejected the earlier, oversimplified view of the lending landscape. Recent empirical academic literature on SME financing has found that transactions-based lending technologies – like leasing, equipment lending and factoring – play a vital role in providing credit to SMEs (Bakker et al 2004; de la Torre, Martínez Pería and Schmukler 2010).
The inherent differences in the nature of the information used in these technologies may also be associated with significantly different costs. For example, relationship lending is highly labour intensive and thus costly; the underwriting costs associated with small business credit scoring are quite low. Definitive evidence of this cost difference is difficult to find because banks’ financial statements do not distinguish between relationship-based loans and transactions-based loans. However, this cost difference is formalised in the strategic framework presented in DeYoung, Hunter and Udell (2004). In this strategic model, technological innovation has driven large banks towards delivering standardised transactions-based products (including transactions-based loans) where they can enjoy economies of scale; small banks have moved towards specialising in personalised products – including relationship loans – which lack economies of scale and are costly to deliver.
24 Cerqueiro, Ongena and Roszbach (forthcoming) analyse the impact on credit associated with a change in Swedish commercial law that diluted the strength of bulk assignment (i.e. the ‘floating lien’) of accounts receivable and inventory.
25 There has been a considerable amount of research recently (i.e. since the SME finance literature overviews in Berger and Udell (1998, 2006) on lending infrastructure issues, particularly in the area of judicial and bankruptcy infrastructure (e.g. Djankov et al 2008; Haselmann, Pistor and Vig 2010; von Lilienfeld-Toal, Mookherjee and Visaria 2012; Gennaioli and Rossi 2013; Vig 2013; Rodano, Serrano-Velarde and Tarantino 2015).
7 7CON F E R E NC E VOLU M E | 2 015
SM E ACCE SS TO I N T ER M EDI AT ED CR EDI T: W H AT DO W E K NOW A N D W H AT DON’T W E K NOW?
DeYoung et al (2004) find evidence broadly consistent with their hypothesis. Specifically, they find a higher net interest margin for smaller banks, which is consistent with compensation for the higher cost of delivering relationship lending and other personalised products.26
Also, if these technologies are sufficiently distinct, then there may be scale efficiencies associated with delivering them in organisationally distinct units within lending institutions. Anecdotally this appears to be the case – at least for some of these technologies. For example, banking organisations typically offer asset-based lending through separate units or divisions within the bank. JPMorgan Chase offers asset-based lending in its Chase Business Credit division of Chase Commercial Banking. I would suspect that banks that offer factoring typically provide factoring through a separate unit because of the unique nature of factoring.
The possibility of organisational diseconomies of scale suggests that we might see these technologies delivered by different types of lending institutions. This also appears to be the case. Much of the empirical and theoretical literature argues that relationship lending may be best delivered through small banks rather than through the hierarchical structures of large, complex banks (Stein 2002).
We turn in the next section to a discussion of SME lending channels. This concept exploits the observed differences in the type of organisations that deliver these lending technologies and provides a potentially powerful lens through which we can frame how lending technologies are delivered. It also offers a useful paradigm to analyse how shocks to the financial system might affect the flow of funding through different lending technologies provided by different lending institutions, because some lending institutions may be affected more than others.
3. SME Lending Channels
3.1 The SME lending channels paradigmAn SME lending channel is a two-dimensional concept that pairs a lending technology with a type of financial institution. This paradigm builds on the lending technology paradigm by adding another dimension. It was introduced by Taketa and Udell (2007) as a useful paradigm to analyse the impact of the Japanese banking crisis on SME credit.
Table 2 shows the SME lending channels that existed in Japan in 1990 just before the beginning of the ‘lost decade’. The blue cells indicate an operative SME lending channel. Not all lending technologies are offered by all types of lenders. The white cells indicate that a particular lending technology is not offered by a particular type of lender. For example, relationship lending is not offered by the largest banks in Japan – the city banks – and trade credit is only offered by corporations. In 1990, there appears to have been eight lending technologies available to SMEs in Japan across six broad classes of institution.
26 Carter, McNulty and Verbrugge (2004) find that the risk-adjusted yield on small business lending is higher at smaller banks than large banks, which would also be consistent with large banks delivering lower cost transactions-based loans.
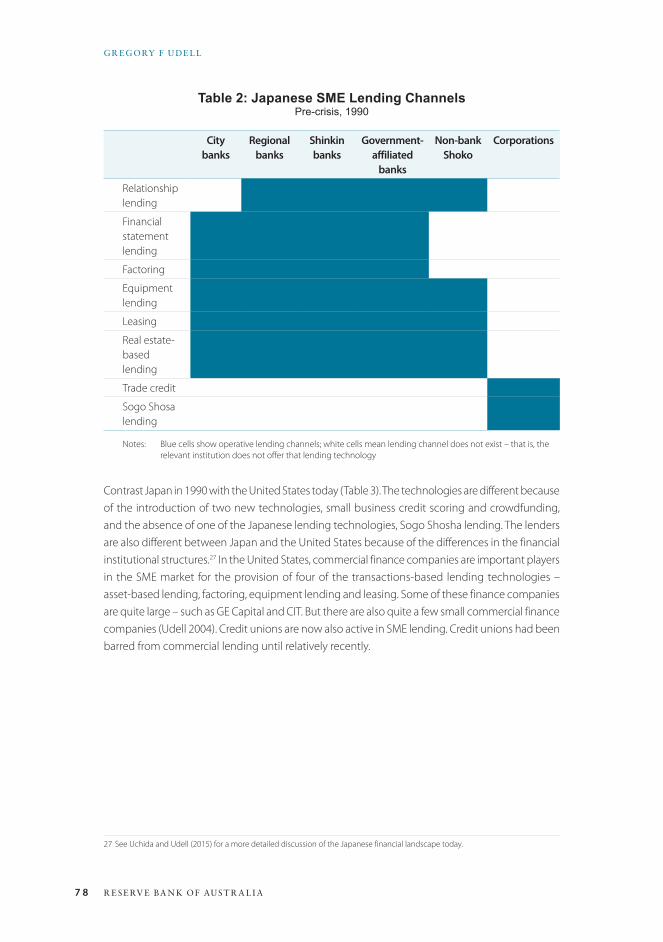
7 8 R E SE RV E BA N K OF AUST R A L I A
GR EG ORY F U DE L L
Table 2: Japanese SME Lending ChannelsPre-crisis, 1990
City banks
Regional banks
Shinkin banks
Government-affiliated
banks
Non-bank Shoko
Corporations
Relationship lending
Financial statement lending
Factoring
Equipment lending
Leasing
Real estate-based lending
Trade credit
Sogo Shosa lending
Notes: Blue cells show operative lending channels; white cells mean lending channel does not exist – that is, the relevant institution does not offer that lending technology
Contrast Japan in 1990 with the United States today (Table 3). The technologies are different because of the introduction of two new technologies, small business credit scoring and crowdfunding, and the absence of one of the Japanese lending technologies, Sogo Shosha lending. The lenders are also different between Japan and the United States because of the differences in the financial institutional structures.27 In the United States, commercial finance companies are important players in the SME market for the provision of four of the transactions-based lending technologies – asset-based lending, factoring, equipment lending and leasing. Some of these finance companies are quite large – such as GE Capital and CIT. But there are also quite a few small commercial finance companies (Udell 2004). Credit unions are now also active in SME lending. Credit unions had been barred from commercial lending until relatively recently.
27 See Uchida and Udell (2015) for a more detailed discussion of the Japanese financial landscape today.
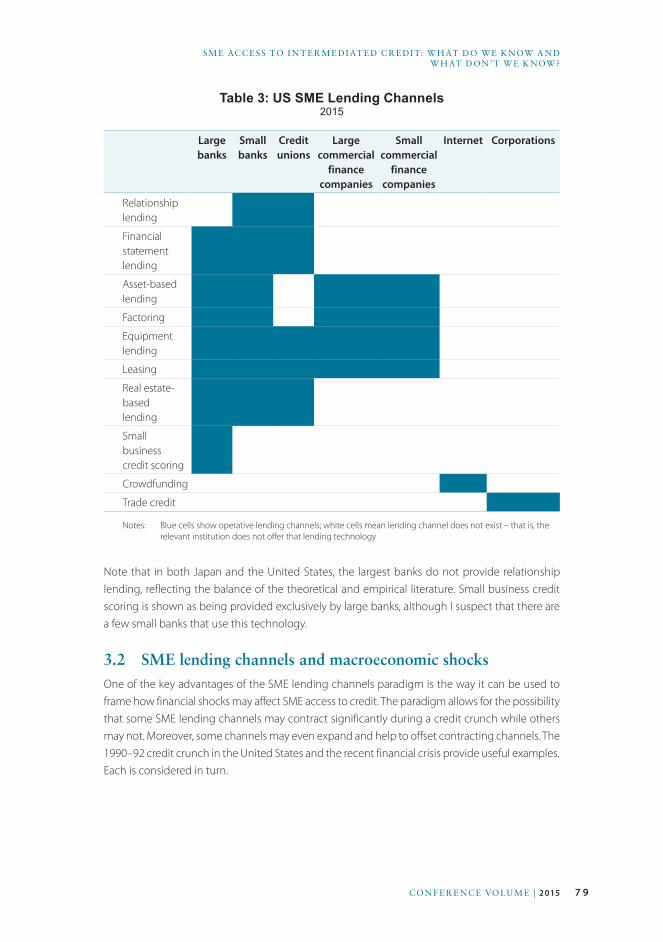
7 9CON F E R E NC E VOLU M E | 2 015
SM E ACCE SS TO I N T ER M EDI AT ED CR EDI T: W H AT DO W E K NOW A N D W H AT DON’T W E K NOW?
Table 3: US SME Lending Channels2015
Large banks
Small banks
Credit unions
Large commercial
finance companies
Small commercial
finance companies
Internet Corporations
Relationship lending
Financial statement lending
Asset-based lending
Factoring
Equipment lending
Leasing
Real estate-based lending
Small business credit scoring
Crowdfunding
Trade credit
Notes: Blue cells show operative lending channels; white cells mean lending channel does not exist – that is, the relevant institution does not offer that lending technology
Note that in both Japan and the United States, the largest banks do not provide relationship lending, reflecting the balance of the theoretical and empirical literature. Small business credit scoring is shown as being provided exclusively by large banks, although I suspect that there are a few small banks that use this technology.
3.2 SME lending channels and macroeconomic shocksOne of the key advantages of the SME lending channels paradigm is the way it can be used to frame how financial shocks may affect SME access to credit. The paradigm allows for the possibility that some SME lending channels may contract significantly during a credit crunch while others may not. Moreover, some channels may even expand and help to offset contracting channels. The 1990–92 credit crunch in the United States and the recent financial crisis provide useful examples. Each is considered in turn.
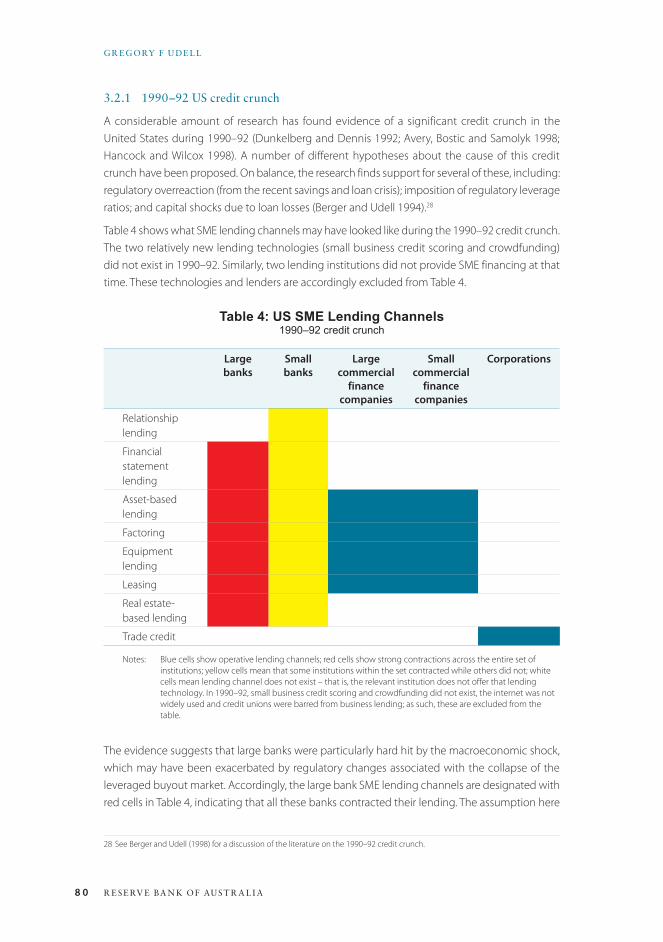
8 0 R E SE RV E BA N K OF AUST R A L I A
GR EG ORY F U DE L L
3.2.1 1990–92 US credit crunch
A considerable amount of research has found evidence of a significant credit crunch in the United States during 1990–92 (Dunkelberg and Dennis 1992; Avery, Bostic and Samolyk 1998; Hancock and Wilcox 1998). A number of different hypotheses about the cause of this credit crunch have been proposed. On balance, the research finds support for several of these, including: regulatory overreaction (from the recent savings and loan crisis); imposition of regulatory leverage ratios; and capital shocks due to loan losses (Berger and Udell 1994).28
Table 4 shows what SME lending channels may have looked like during the 1990–92 credit crunch. The two relatively new lending technologies (small business credit scoring and crowdfunding) did not exist in 1990–92. Similarly, two lending institutions did not provide SME financing at that time. These technologies and lenders are accordingly excluded from Table 4.
Table 4: US SME Lending Channels1990–92 credit crunch
Large banks
Small banks
Large commercial
finance companies
Small commercial
finance companies
Corporations
Relationship lending
Financial statement lending
Asset-based lending
Factoring
Equipment lending
Leasing
Real estate- based lending
Trade credit
Notes: Blue cells show operative lending channels; red cells show strong contractions across the entire set of institutions; yellow cells mean that some institutions within the set contracted while others did not; white cells mean lending channel does not exist – that is, the relevant institution does not offer that lending technology. In 1990–92, small business credit scoring and crowdfunding did not exist, the internet was not widely used and credit unions were barred from business lending; as such, these are excluded from the table.
The evidence suggests that large banks were particularly hard hit by the macroeconomic shock, which may have been exacerbated by regulatory changes associated with the collapse of the leveraged buyout market. Accordingly, the large bank SME lending channels are designated with red cells in Table 4, indicating that all these banks contracted their lending. The assumption here
28 See Berger and Udell (1998) for a discussion of the literature on the 1990–92 credit crunch.

8 1CON F E R E NC E VOLU M E | 2 015
SM E ACCE SS TO I N T ER M EDI AT ED CR EDI T: W H AT DO W E K NOW A N D W H AT DON’T W E K NOW?
is that the shock affected all of the SME lending channels offered by large banks and that all of these channels contracted equally.29
Many small banks were also severely affected and one study found more sensitivity to capital shocks in small banks than in large banks (Hancock and Wilcox 1998). However, the small banks’ cells are yellow in Table 4, reflecting the likely differences in capital shocks across the small bank component of the banking system – that is, many small banks remained healthy and continued lending.
Perhaps the most interesting aspect of Table 4 is the commercial finance company cells – both large and small. It appears that commercial finance companies may have lent more money as SMEs got crunched out of the banking market. This may have actually increased the quality of their loan portfolios, which historically reflected a riskier class of SMEs.30 Unfortunately there are not sufficiently good data on commercial finance company portfolios to test this proposition, but discussions with senior managers of these firms are consistent with this hypothesis (Udell 2004).
I am not aware of any studies on trade credit during the 1990–92 credit crunch. However, based on subsequent research on how the trade credit channel behaved during the most recent crisis, this SME lending channel is shown as open in Table 4, based on the conjecture that – like the commercial finance company channels – trade credit may have actually expanded.
3.2.2 Recent financial crisis
Now let’s consider what happened to SME lending during the global financial crisis.
As in all crises, separating demand effects from supply effects is a key challenge. Occasionally, natural experiments present themselves that opportunistically create powerful identification strategies (Peek and Rosengren 1997; Khwaja and Mian 2008; Chava and Purnanandam 2011; Lin and Paravisini 2013). This crisis hasn’t offered experimental laboratories such as these. The best opportunities for the empiricist to investigate the nature and severity of this crisis have been in Europe, not the United States, because of data availability. Many countries in Europe have credit registries that contain panel data about firms, their loans, and even in some cases information about their loan applications. The best data in the United States had been, until the crisis, the Survey of Small Business Finances. Although the Survey does not contain panel data, it does contain rich information about firms and their loans. However, the Federal Reserve discontinued the survey just before the crisis started. Thus, while the United States was decreasing its investment in data, Europe was increasing its investment in data after the crisis began (e.g. the ECB/European Commission’s SAFE dataset).
Researchers have exploited these European data sources to either: identify supply effects using disequilibrium models to identify credit constrained borrowers (Kremp and Sevestre 2013; Carbó-Valverde et al forthcoming); or control for demand effects by looking at access to credit by
29 While this assumption seems reasonable, we should emphasise that data on most of these lending technologies are not available. Bank financial statements do not break out the commercial loan portfolio into sub-categories. Moreover, even in datasets that provide more information about bank loans, the distinctions are not granular enough to break out the lending technologies used. For example, some datasets such as the Federal Reserve’s Survey of the Terms of Business Lending indicate whether a loan is secured, but do not indicate the type of collateral (which would identify the lending technology).
30 For evidence on the average differential risk between the commercial bank loan portfolios at banks versus commercial finance companies, see Carey et al (1998).
8 2 R E SE RV E BA N K OF AUST R A L I A
GR EG ORY F U DE L L
firms with multiple lenders (Albertazzi and Marchetti 2010; Jiménez et al 2012; Iyer et al 2014). Yet another approach is to use survey data that provides information that reveals credit rationing.31 Some of these have been single-country studies (Pigini, Presbitero and Zazzaro 2014; Presbitero, Udell and Zazzaro 2014) and some have been cross-country analyses (Popov and Udell 2012; Beck et al 2014; Ferrando, Popov and Udell 2015). Overall, these studies have found evidence of a significant credit crunch, and one which had bigger effects for banks under more stress and in countries under more stress.
Based on what we know from the literature about the effects of the crisis on SMEs in Europe and what we know about banks in the United States, we can conjecture what happened in the United States.
Table 5 reflects the fact that both large and small banks were significantly affected by the crisis. Large banks suffered a massive shock related to the subprime residential mortgage market, which began hitting bank capital in mid to late 2007. About 18 months later, small banks took losses in their commercial real estate and construction loan portfolios. Thus, I conjecture that both the large and small bank SME lending channels contracted. Although direct evidence to support this conjecture is not possible in the United States, it is generally consistent with available ‘indirect’ evidence of a significant supply effect that included small banks (Duygan-Bump, Levkov and Montoriol-Garriga 2011; DeYoung et al 2014).32
Table 5 shows a contraction by large commercial finance companies. Direct evidence on this is probably not possible, but anecdotal evidence points in this direction. At least one large independent commercial finance company went bankrupt – CIT. GE Capital suffered significant losses during the crisis and ‘since 2008 … has reduced the size of its balance sheet’.33 The contraction was further exacerbated by the fact that many independent commercial finance companies were acquired by commercial banking organisations after the crisis, thereby losing their independence. A prominent example is Congress Financial Capital; it is an important example because it was acquired by Wachovia, which subsequently failed. It seems likely that commercial finance companies could not have served in the role of safety valve as they did in the 1990–92 credit crunch, and that these SME lending channels contracted (Udell 2009). I have seen no evidence on the condition of small commercial finance companies and have left these channels open. Further investigation of this channel would certainly be valuable – but extremely difficult to conduct.
31 The best firm-level surveys ask whether firms sought credit (and whether they were discouraged from applying) and whether they received what they asked for.
32 There is strong evidence of a contraction of supply for larger businesses in a study that looked at the substitution between bank loans and corporate bonds (Duygan-Bump et al 2011). Given that SMEs have fewer choices (because they lack access to the capital markets) and are more opaque, it is quite likely that if large businesses in the United States suffered a contraction in credit supply the situation was even worse for SMEs.
33 See quote from a GE Capital spokeswoman Susan Bishop in The Wall Street Journal (Mann and McGrane 2014).
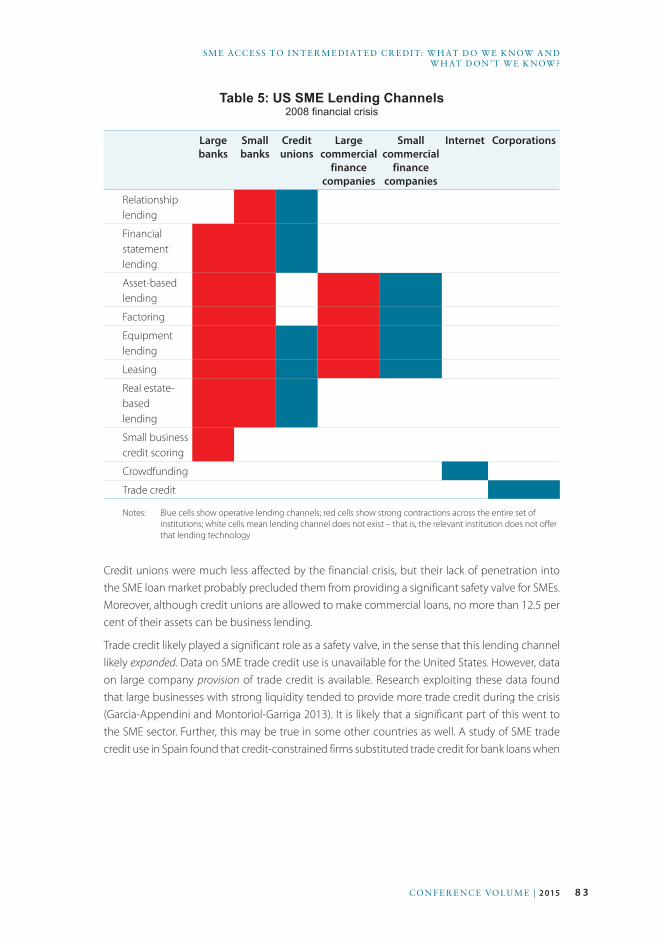
8 3CON F E R E NC E VOLU M E | 2 015
SM E ACCE SS TO I N T ER M EDI AT ED CR EDI T: W H AT DO W E K NOW A N D W H AT DON’T W E K NOW?
Table 5: US SME Lending Channels2008 financial crisis
Large banks
Small banks
Credit unions
Large commercial
finance companies
Small commercial
finance companies
Internet Corporations
Relationship lending
Financial statement lending
Asset-based lending
Factoring
Equipment lending
Leasing
Real estate-based lending
Small business credit scoring
Crowdfunding
Trade credit
Notes: Blue cells show operative lending channels; red cells show strong contractions across the entire set of institutions; white cells mean lending channel does not exist – that is, the relevant institution does not offer that lending technology
Credit unions were much less affected by the financial crisis, but their lack of penetration into the SME loan market probably precluded them from providing a significant safety valve for SMEs. Moreover, although credit unions are allowed to make commercial loans, no more than 12.5 per cent of their assets can be business lending.
Trade credit likely played a significant role as a safety valve, in the sense that this lending channel likely expanded. Data on SME trade credit use is unavailable for the United States. However, data on large company provision of trade credit is available. Research exploiting these data found that large businesses with strong liquidity tended to provide more trade credit during the crisis (Garcia-Appendini and Montoriol-Garriga 2013). It is likely that a significant part of this went to the SME sector. Further, this may be true in some other countries as well. A study of SME trade credit use in Spain found that credit-constrained firms substituted trade credit for bank loans when

8 4 R E SE RV E BA N K OF AUST R A L I A
GR EG ORY F U DE L L
bank lending contracted (Carbó-Valverde et al forthcoming). Cross-country studies of trade credit during the crisis in Europe, however, yield mixed results.34
The SME lending channels paradigm can also illustrate how the financial crisis may have propagated from the United States and western Europe to central and eastern Europe. Table 6 shows how SME lending channels in one such country, Croatia, may have looked during the crisis.
Table 6: Croatian SME Lending Channels2008 financial crisis
Small banks
Foreign banks
Commercial finance
companies
Corporations
Relationship lending
Factoring
Leasing
Real estate-based lending
Trade credit
Notes: Blue cells show operative lending channels; red cells show strong contractions across the entire set of institutions; white cells mean lending channel does not exist – that is, the relevant institution does not offer that lending technology
Recent research shows that, in central and eastern Europe, the foreign subsidiaries of multinational banks tended to reduce SME lending more than domestic banks that suffered comparable negative shocks to their balance sheets. The foreign bank effect was disproportionately disruptive because the banking systems in these central and eastern European countries were disproportionately foreign owned (Figure 1).
34 One study of the 5 largest European countries found that trade credit did not provide a substitute for bank loans during the crisis (Illueca Muñoz, Norden and van Kampen 2015). However, another study of 11 euro area countries found that firms in stressed countries used more trade credit (though not statistically significant) during the sovereign debt crisis and this substitution of bank loans with trade credit reversed itself after the European Central Bank announced its Outright Monetary Transactions program in August 2012 (Ferrando et al 2015).
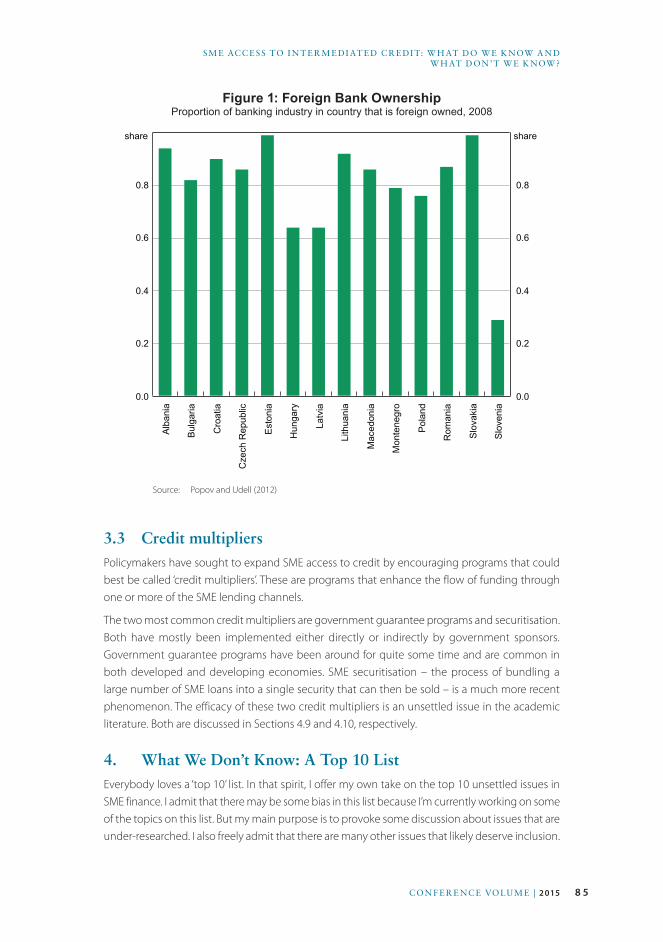
8 5CON F E R E NC E VOLU M E | 2 015
SM E ACCE SS TO I N T ER M EDI AT ED CR EDI T: W H AT DO W E K NOW A N D W H AT DON’T W E K NOW?
Figure 1: Foreign Bank OwnershipProportion of banking industry in country that is foreign owned, 2008
Alb
ania
Bul
garia
Cro
atia
Cze
ch R
epub
lic
Est
onia
Hun
gary
Latv
ia
Lith
uani
a
Mac
edon
ia
Mon
tene
gro
Pol
and
Rom
ania
Slo
vaki
a
Slo
veni
a
0.0
0.2
0.4
0.6
0.8
0.0
0.2
0.4
0.6
0.8
shareshare
Source: Popov and Udell (2012)
3.3 Credit multipliersPolicymakers have sought to expand SME access to credit by encouraging programs that could best be called ‘credit multipliers’. These are programs that enhance the flow of funding through one or more of the SME lending channels.
The two most common credit multipliers are government guarantee programs and securitisation. Both have mostly been implemented either directly or indirectly by government sponsors. Government guarantee programs have been around for quite some time and are common in both developed and developing economies. SME securitisation – the process of bundling a large number of SME loans into a single security that can then be sold – is a much more recent phenomenon. The efficacy of these two credit multipliers is an unsettled issue in the academic literature. Both are discussed in Sections 4.9 and 4.10, respectively.
4. What We Don’t Know: A Top 10 ListEverybody loves a ‘top 10’ list. In that spirit, I offer my own take on the top 10 unsettled issues in SME finance. I admit that there may be some bias in this list because I’m currently working on some of the topics on this list. But my main purpose is to provoke some discussion about issues that are under-researched. I also freely admit that there are many other issues that likely deserve inclusion.
8 6 R E SE RV E BA N K OF AUST R A L I A
GR EG ORY F U DE L L
4.1 Testing the lending technologies and SME lending channels paradigms
Most of the empirical literature on SME finance has focused on specific contract features such as collateral, personal guarantees, covenants and commitments.35 While we have learned a lot from this literature, we may be missing the broader point.
The SME lending channels paradigm hypothesises that lenders underwrite and monitor loans using distinct lending technologies – that is, combinations of specific contract features – and that these technologies may be delivered by distinct types of institutions. By focusing on contract features, empiricists may have been focusing on the wrong unit of observation.
There is an emerging literature that examines SME access to finance using the lending technologies and SME lending channels paradigms. However, these approaches face significant data limitations: firm-level survey data and bank financial statements generally do not categorise SME lending in ways that allow empiricists to distinguish among the channels.
4.1.1 Lending technologies paradigm
Some of the literature that speaks to the lending technologies paradigm has focused on specific lending technologies. For example, data availability on trade credit has facilitated a considerable amount of research on factoring. This literature has explored the essence of this technology (Giannetti et al 2011) and cross-country differences in its importance (Bakker et al 2004; Klapper 2006).
Similarly, data in the United States has allowed researchers to analyse the asset-based lending technology, at least in the context of commercial finance companies (Carey et al 1998).
More recently there has been research that has more holistically examined the SME lending technologies paradigm. This includes papers that focus on the distinctiveness of the different technologies (Uchida, Udell and Yamori 2008; Berger and Black 2011) and papers that have examined the importance of large banks and foreign banks that deliver a portfolio of transactions-based lending technologies (de la Torre et al 2010; Beck, Ioannidou and Schäfer 2012).
However, the paucity of within-country data and cross-country data has severely limited the ability of empiricists to analyse key implications of the lending technologies paradigm. In particular, we do not understand the trade-offs among the technologies offered within a country and why the provision of lending technologies differs across countries. The cross-country dimension is particularly interesting because policymakers need to understand how best to develop lending infrastructure.
Multinational organisations, such as the International Finance Corporation, have assumed an important role in introducing lending technologies into developing economies. However, it is my sense that the data do not yet exist to adequately measure the adoption of lending technologies such as asset-based lending. As discussed in Section 2.2.2, China has introduced a modern set of laws on security interests in moveable assets. But without better data it is difficult to assess whether loans are now being delivered using the asset-based loan technology or as financial statement loans supported by a floating charge on accounts receivable.
35 See Berger and Udell (1998) for a review of the literature on contracting.
8 7CON F E R E NC E VOLU M E | 2 015
SM E ACCE SS TO I N T ER M EDI AT ED CR EDI T: W H AT DO W E K NOW A N D W H AT DON’T W E K NOW?
4.1.2 SME lending channels paradigm
Similarly, analysis of the SME lending channels paradigm is constrained by a lack of data. Here there are at least two big issues:
• Which lending technologies are confined to which types of financial institutions?
• How do these channels behave during a shock like the recent financial crisis?
Both of these topics were touched on earlier in the paper. Creative use of existing data sources has allowed researchers to make some progress on each of these. But a lot more is needed.
With respect to the first issue, probably the most progress has been made on the issue of whether small banks have an advantage over large banks in delivering relationship lending (as predicted in the theoretical literature) and, conversely, that large banks lend to SMEs via transactions-based lending technologies (Berger et al 2005; Berger, Rosen and Udell 2007; de la Torre et al 2010; Beck, Demirgüç-Kunt and Martínez Pería 2011; Kano et al 2011). However, there is at least one paper that suggests that large banks do not necessarily have a comparative advantage in delivering transactions-based lending technologies due to economies of scale (Uchida, Udell and Watanabe 2008). This finding is inconsistent with the theoretical literature.
It is with regard to the second issue that the paucity of research is most acute. As noted above, there are no data with which to analyse whether key channels – such as the commercial finance company asset-based lending channel – expanded during the 1990–92 US credit crunch, even though industry participants assert that this happened to a very large degree.36 Likewise, there are no data to assess the extent to which large commercial finance companies contracted their asset-based lending (and other SME lending channels) during the recent finance crisis. All we know is that several large commercial finance companies experienced significant financial distress (e.g. CIT and GE Capital). We know virtually nothing about small commercial finance companies. We do not even know whether they were in distress, much less whether they expanded or contracted their lending.37
As a consequence, it is very difficult to assess the extent, nature and effect the recent financial crisis had on US SMEs. The study that probably comes closest uses bank-level data in the context of a structural model of bank portfolio lending. It finds evidence that smaller ‘community’ banks contracted their supply of credit (DeYoung et al 2014). However, because small banks are also likely to offer transactions-based lending technologies, this finding does not specifically isolate the small bank relationship lending channel. However, evidence outside of the United States suggests that
36 An argument could be made that another channel should be added to Table 4: private placements provided by life insurance companies. Historically, insurance companies in the United States had provided long-term fixed rate financing to larger mid-sized businesses in the form of private placements. During the 1990–92 credit crunch, the Board of Governors of the Federal Reserve System commissioned a two-year project to study private placements, about which little was known to researchers and policymakers. The study was commissioned to conduct a broad analysis of the private placement market (which had not been done in 20 years) and to assess assertions that there was a significant credit crunch in this market. The project confirmed the existence of a severe credit crunch (Carey et al 1993a, 1993b). For the most part, private placements were targeted to firms that were, on average, larger than the typical definition of SMEs, so this channel was not included in Table 4. However, to the extent that some larger SMEs were affected by the contraction of supply in the private placement market this channel should probably be included.
37 One exception, noted in Section 2.2.1, is the analysis of the trade credit lending channel in Garcia-Appendini and Montoriol-Garriga (2013). Even here, however, the authors don’t specifically look at SME trade credit because they cannot disentangle overall trade credit extension from the smaller subset of trade credit extended to the SME sector.
8 8 R E SE RV E BA N K OF AUST R A L I A
GR EG ORY F U DE L L
smaller banks may have contracted this channel less than they contracted transactions-based lending. In particular, one study found that German savings banks contracted relationship loans less than transactions-based loans (Puri, Rocholl and Steffen 2011).
Firm- and loan-level data in Europe have allowed a much more granular analysis of the credit crunch in the SME sector than in the United States (Jiménez et al 2012; Iyer et al 2013; Ongena, Peydró and van Horen 2013; Ferrando et al 2015). Firm-level data on accounts payable have allowed analysis of the trade credit channel in Spain. These data were used to examine the substitutability of trade credit for bank loans before and during the crisis (Carbó-Valverde et al forthcoming).
Firm- and loan-level data in Germany facilitated the analysis of the small bank relationship lending channel noted above (Puri et al 2011).38 A recent study exploited a new dataset that distinguishes between banks that offer relationship lending and those that do not (Beck et al 2014). This study used the Banking Environment and Performance Survey undertaken by the EBRD, in which 400 bank CEOs in central and eastern Europe were surveyed about the importance of different loan underwriting techniques, including relationship lending and financial statement lending. By combining this dataset with firm-level survey data, this study found that relationship lending alleviated credit constraints during the crisis.
Although this literature is informative, relatively little is known about western Europe or the other SME lending channels in central and eastern Europe.
4.2 Identification strategiesThe biggest challenge in studying the effects of macroeconomic shocks on SME access to finance is separating demand effects and supply effects. During a credit crunch it is likely that an aggregate economic slowdown will decrease SME demand for credit. This means identification is critical.
The four most popular methods for identifying supply effects are:
• natural experiments (Peek and Rosengren 1997; Khwaja and Mian 2008)
• firm fixed effects in multi-bank settings (Albertazzi and Marchetti 2010; Jiménez et al 2012; Iyer et al 2014)
• loan application data (Puri et al 2011; Popov and Udell 2012; Ongena et al 2013; Presbitero et al 2014)
• disequilibrium modelling (Carbó-Valverde et al forthcoming).
At first blush, this looks like a long and rich list of options for the empiricist. However, on closer inspection this list is not long enough – each of these approaches has limitations.
• Natural experiments do not happen very often – and have not presented themselves in the most recent financial crisis.
• The firm fixed effects approach involves looking at the same firm when it borrows from two (or more) different banks and when one bank is ‘shocked’ and the other is not. This has the enormous virtue of controlling for demand effects by holding the firm constant. But it has two big drawbacks. First, it is not applicable in countries where single-bank SME relationships dominate, such as the United States. Second, it is not clear that we can extrapolate from
38 See Bolton et al (2013) for a theoretical model of the role of relationship lending during financial crises.
8 9CON F E R E NC E VOLU M E | 2 015
SM E ACCE SS TO I N T ER M EDI AT ED CR EDI T: W H AT DO W E K NOW A N D W H AT DON’T W E K NOW?
multibank financial systems – such as Italy, Portugal and Spain – to financial systems like that of the United States; the nature of the financial system architecture may be fundamentally different. For example, the structure of these multibank financial systems may be driven by the fragility of the banking system (Detragiache, Garella and Guiso 2000).
• Identification through loan applications, particularly from firm-level survey data, is often hindered by a lack of sufficient firm-level control variables and a lack of data directly linking the borrower and the bank.
• Disequilibrium models are challenging to calibrate.
The empirical innovations in the area of identification to date – both in terms of data and modelling – have been impressive. But the importance of this area means we require more work expanding the identification ‘toolkit’ and assessing the relative power of the existing tools.
4.3 Hardening soft informationTheory argues that organisational form affects internal communication within banks. This in turn affects the lending products that banks can offer. Communicating soft information in large, hierarchical and complex banking institutions is problematic, which makes it difficult for these large institutions to deliver relationship lending (Stein 2002). Consistent with this theory, empirical research generally (but not always) finds that smaller banks are better at relationship lending than larger banks. Moreover, research using more granular data finds that:
• borrower proximity facilitates soft information production (Agarwal and Hauswald 2010)
• soft information gets diluted as it is communicated through more hierarchical layers (Liberti and Mian 2009)
• soft information gets diluted by a longer distance between the originating bank branch and the bank’s headquarters (Allesandrini, Presbitero and Zazzaro 2009).39
All these findings are consistent with theory.
Two important and unsettled issues in the SME finance literature are: what are the boundaries of soft information communication? and has technological innovation changed these boundaries?
These issues are closely related to loan officer discretion: greater loan officer discretion allows loan officers to incorporate more soft information in decisions. There is a growing body of literature that shows that discretion may vary according to loan and borrower characteristics (Cerqueiro, Degryse and Ongena 2011), and that discretion can induce manipulation by the loan officer (Brown et al 2014; Mosk 2014).
It is widely asserted that technology has significantly altered not only the way banks operate, but also the way they lend to SMEs (Berger 2015). This is sometimes referred to as ‘the “hardening” of small business lending information over time’ (Berger 2015, p 303). This assertion is typically supported by two arguments in the literature: the growing mean distance between borrowers and lenders (Petersen and Rajan 2002; Wolken and Rohde 2002); and the introduction of small business credit scoring (Berger 2015).
39 The distance between the branch and the headquarters has been referred to as the ‘functional distance’ (Allessendrini et al 2009). Functional distance has also been shown to have been of importance during the financial crisis where a bank’s contraction of the supply of credit was positively related to the functional distance (Presbitero et al 2014).
9 0 R E SE RV E BA N K OF AUST R A L I A
GR EG ORY F U DE L L
The distance argument holds that technological innovation has increased the ability to use hard information. This has enabled banks to lend when borrowers are farther away from the loan officer or bank branch (‘operational distance’) and when branches are located further from the headquarters where the final lending decision is made (‘functional distance’). Although this argument could be true, the evidence in the literature is not particularly convincing. The observed changes in median distance have not been particularly large (Wolken and Rohde 2002; Brevoort and Wolken 2009).40 Moreover, these changes in distances may have been associated with only one or two lending technologies (small business credit scoring and crowdfunding).
There are two unsettled issues with respect to small business credit scoring and the hardening of information.
• Have hard information technologies – like small business credit scoring – replaced soft information technologies – like relationship lending for micro business lending (i.e. loans below $100 000)? In other words, is it the case that small business credit scoring has simply replaced other lending technologies, rather than transformed a particular type of information from soft to hard. In this context, the ‘hardening’ label is a bit misleading.
• Can technological innovation convert some soft information into hard information that can be transmitted within a large complex bank? Many banks quantitatively incorporate loan officer qualitative evaluations of management and strategic assessments into the loan score (e.g. the loan officer may be asked to rate a manager’s skills on a scale of 1 to 5). Of course, at a more fundamental level, if loan officers incorporate soft information into the pricing of a loan through their discretion, then soft information has been effectively ‘quantified’. Then the empiricist can reverse engineer this quantified soft information component of the loan (Agarwal and Hauswald 2010; Cerquerio et al 2011). However, I would assert that this process is not the same thing as ‘hardening soft information’ in a way that can be transmitted through the hierarchical layers (and functional distance) of a bank. That is, in the spirit of Stein (2002) soft information is only ‘hardened’ to the extent that its value is not diluted as it is transmitted through the banking organisation. It has not been established in the academic literature whether technological innovation has facilitated this type of ‘lossless’ hardening.
4.4 Confusion over collateralDespite a long literature on collateral, there still persists a misunderstanding of collateral in the context of SME lending. And, consequently, we still need more research on this important contracting tool. Many of the transactions-based technologies are defined by the specific types of assets that can be pledged as collateral.
The biggest confusion is the distinction between ‘inside’ and ‘outside’ collateral (Berger and Udell 1998).
Inside collateral refers to assets pledged as collateral that are owned by the business (i.e. an asset inside the business). Outside collateral refers to assets pledged as collateral that are owned by someone outside of the firm in order to secure the loan to the entrepreneur’s business. This
40 Berger (2015) notes that the change in median distance between SMEs and their bank in Wolken and Rohde (2002) between 1993 and 1998 was only one mile.
9 1CON F E R E NC E VOLU M E | 2 015
SM E ACCE SS TO I N T ER M EDI AT ED CR EDI T: W H AT DO W E K NOW A N D W H AT DON’T W E K NOW?
‘someone’ is almost always the entrepreneur or sometimes friends or family. Outside collateral is very common in SME lending throughout the world and typically involves residential real estate.41
The two types of collateral have very different effects on loan payouts. In the case of inside collateral, filing a security interest (i.e. taking collateral) in a business asset changes priorities in liquidation: the secured creditor benefits at the expense of the unsecured creditors. In a Modigliani-Miller world, the benefit to the secured creditor would be exactly offset by the increased exposure incurred by the unsecured creditors – the interest rate would fall on the secured loan and the interest rate would rise on the unsecured loan(s), leaving the average cost of capital unaffected.
Outside collateral pierces the veil of limited liability by increasing the exposure of the entrepreneur. The secured creditor benefits, but not at the expense of the other creditors. Outside collateral is like a synthetic injection of equity into the firm. Indeed, in a Modigliani-Miller world the entrepreneur could sell their personal assets (that would otherwise be pledged as collateral) and simply inject the proceeds into their firm as equity. Frictions in the real world make this costly.
Both the theoretical literature and the empirical literature conflate the two types of collateral. There is a considerable amount of theory on outside collateral and we understand a great deal about why it exists. In contrast, there is very little theory about inside collateral and, in my opinion, we know very little about why it exists or why it is ubiquitous. Much of the confusion arises because many theory papers on outside collateral imply that their models apply to all collateral. Confusing the two types of collateral is problematic because inside and outside collateral have very different incentive and signalling effects.
Another source of confusion in the theoretical literature relates specifically to inside collateral. Inside collateral is irrelevant if there is only one lender because the only effect of filing a security interest is to rearrange priorities in liquidation – and the concept of priority requires at least two lenders. Nonetheless, I regularly see papers that claim to say something about inside collateral using a model with one lender.
My sense is that this can be traced back to the macroeconomics literature – specifically, Kiyotaki and Moore (1995) and Bernanke, Gertler and Gilchrist (1996). Both papers use single-lender models that refer to the single lender’s claim on a fixed factor of production as ‘collateral’. The papers are not incorrect, but the power of collateral in these models is quite limited. All it does is prevent the entrepreneur from absconding with the assets that are pledged as collateral (it has nothing to do with rearranging priorities in bankruptcy). This control feature of collateral is real and exists in developed economies. For example, in the United States firms cannot sell equipment (and pay the entrepreneur/owner a dividend) if a security interest has been filed under the Uniform Commercial Code uniquely identifying the pledged equipment with a serial number. However, this control feature does not apply to moveable assets such as accounts receivable and inventory because they are fungible. Thus, this control feature cannot explain why banks routinely take accounts receivable and inventory as collateral. Moreover, the empirical literature has not demonstrated whether the control feature is economically important with respect to fixed assets.
Turning to the empirical literature, confusion arises because many papers attempt to test specific theories of inside and outside collateral without being able to distinguish between these two types
41 Outside collateral is essentially irrelevant in lending to large firms because they are owned by a large number of shareholders, all of whom typically own just a small proportion of the firm.
9 2 R E SE RV E BA N K OF AUST R A L I A
GR EG ORY F U DE L L
in the data. Many datasets just have a zero-one variable for collateral (e.g. the Federal Reserve’s Survey of Terms of Business Lending). This is quite problematic for testing many of the signalling theories of outside collateral, which comprise the bulk of the theoretical work on collateral. These theories predict a negative relationship between borrower risk and pledging collateral; however, the bulk of the empirical literature finds a positive relationship between pledging collateral and borrower risk. Because most of the datasets used in the empirical literature do not distinguish between inside and outside collateral, the findings cannot be viewed as a rejection of the theoretical models on outside collateral.42
4.5 Technological innovation and SME lendingThe assertion that technological innovation has significantly altered the way financial institutions lend to SMEs is widespread in the literature. But relatively little evidence has been offered to support this contention. In my opinion, much more research is needed to identify exactly how technological innovation has changed SME lending and the extent to which this has been economically significant. This research should be focused on how technological innovation has affected the mix of lending technologies (presumably through changing their relative costs) and how it has changed the relative size of the SME lending channels.
Small business credit scoring is often used as an example of technological innovation and there is considerable evidence that it has become an economically important lending technology. But, there is not much evidence that small business credit scoring had much – if anything – to do with technological innovation. The technology already existed – and had existed back to about 1970 when banks started routinely credit scoring consumer loans (Jessup 1980). The innovation was to meld some firm-level variables onto an existing consumer credit scoring model.43 Thus, it makes better sense to classify small business credit scoring as a financial innovation, not a technological innovation.
More generally, the academic literature seems to assume that banks have been adopting information technology systems in their commercial lending at the same rapid rate as they have been in their overall operations (asset-liability management, internet banking, compliance activities, information security risk assessment, core processing, etc). However, the academic research has provided little evidence of significant advances in technology related to the production of information in SME lending. For example, it is not obvious that financial statement lending has significantly changed in the last four decades. Although it is true that we can now spread financial statements using Excel, four decades ago it only took a good junior credit analyst about one hour with a manual adding machine. It is incumbent on researchers who claim that technology is fundamentally changing SME loan underwriting to provide more evidence on the nature of this technological innovation and its economic importance.
42 A few recent empirical papers have started making a distinction between these two types of collateral. For example, Calomiris et al (2015) analyse the difference between security interests in moveable assets (which are always inside collateral) and immovable assets (which can be either inside or outside collateral).
43 While these loan models are proprietary (and, thus, invisible to the empiricist) the most important business component is likely to be a business credit bureau rating such as the D&B PAYDEX Score. These ratings existed for decades prior to the introduction of small business credit scoring. For detail on the PAYDEX Score, see Kallberg and Udell (2003).
9 3CON F E R E NC E VOLU M E | 2 015
SM E ACCE SS TO I N T ER M EDI AT ED CR EDI T: W H AT DO W E K NOW A N D W H AT DON’T W E K NOW?
4.6 Audited financial statementsThe SME lending channels paradigm gives considerable weight to the importance of audited financial statements. In great part, the defining line between relationship lending and financial statement lending is the audit. And informative financial statements can play an important secondary role in the other lending technologies.
The academic literature has recognised the importance of accounting and the accounting infrastructure (La Porta et al 1998) as a key piece in shaping the way SMEs are financed and what a country’s SME lending channels look like (Berger and Udell 2006). Empirical research on SME access to finance often includes a control variable for audited financial statements (data permitting). This has been done in papers on Europe, North America and Asia (Berger et al 2005: Popov and Udell 2012; Uchida et al 2012; Ferrando et al 2015).
However, a thorough analysis of the audit itself and the decision to obtain an audit is missing in the academic literature (Carey, Knechel and Tanewski 2013). The decision to obtain an audit can be viewed as the decision to invest in becoming substantially more transparent. But, this decision comes at a cost because audits are expensive. This lack of research is particularly troubling because the audit decision matters most in the SME sector. This decision may lie squarely on the cusp between a ‘small’ business and a ‘medium-sized’ business – that is, right in the middle of the SME space.
To the best of my knowledge there is only one paper that has examined the audit decision in the SME sector: Allee and Yohn (2009).44 This paper exploited the 2003 Survey of Small Business Finances, which was particularly rich in information on the type of financial statements obtained by firms and variables that might drive the choice. These data also had information that enabled the authors to examine the benefits from an audit in terms of the cost and access to credit. The paper finds that firm size is an important determinant and that the choice of financial statements matters in terms of access to finance. While this paper has received a reasonable amount of interest in the accounting literature, it appears to be virtually unknown in the finance and SME literature.45
While Allee and Yohn (2009) sheds considerable light on how the audit decision is made, data limitations did not allow the authors to look at the cost side of the cost-benefit trade-off. It is also not clear how applicable the results are outside of the United States. Given the considerable differences in accounting standards and accounting infrastructure across the globe, there is much that we don’t know about the costs and benefits of getting an audit.
I think this is one of the most under-researched areas in SME access to finance and more research is definitely called for.
44 A point also made by Carey et al (2013).
45 By my latest count of the 109 Google citations garnered by Allee and Yohn (2009), only 1 has been in an article published in a finance journal where I was not a co-author.

9 4 R E SE RV E BA N K OF AUST R A L I A
GR EG ORY F U DE L L
4.7 CooperativesIn my view, cooperative banks are the sector that is least understood in the global banking system.46 Despite the fact that these institutions are ubiquitous and span the developing and developed world, there is surprisingly little research on them.
Even in the United States, cooperatives have played a major role in financial intermediation. Historically, the most important cooperatives in the United States were the mutual savings and loan associations (S&L). However, with the demise of the S&L industry beginning in the 1980s, credit unions are now the largest type of cooperative. Today S&Ls, mutual savings banks and credit unions hold 13.1 per cent of US banking assets. Credit unions alone have 10 per cent of household deposits. And, like credit unions and cooperatives in many other countries, credit unions in the United States make SME loans.
Are cooperatives interesting from an academic perspective? My view is that they are because of their unique governance and because they are economically significant.
The essential difference between cooperatives and private banks is their governance. Governance in private banks is relatively straightforward in the sense that stockholders ‘own’ the bank and wealth maximisation is the objective function (although, of course, agency problems drive a wedge between ownership and bank behaviour). There is a considerable body of research on the links between governance, regulation and private bank behaviour, most prominently Laeven and Levine (2009).
In contrast, cooperatives have:
• ownership and control that is not as straightforward
• governance that is more complicated
• an objective function that is not obvious – which may have consequences for SME access to finance.
Moreover, there is little research in any of these areas.
Let’s start with the objective function. There is a burgeoning academic literature where principals and agents are driven by a ‘higher purpose’, as well as wealth maximisation (Handy and Katz 1998; Glazer 2004; Delfgaauw and Dur 2007; Hesse and Čihák 2007; Brekke and Nyborg 2010; Thakor and Quinn 2013). While this literature has not focused on cooperatives, it seems applicable to the issue of whether cooperatives behave more altruistically and ethically than banks.
Part of the missing research on cooperatives is research on how governance actually works in these institutions and the links among governance, regulation and behaviour in the cooperative segment of the banking industry, as in the Laeven and Levine (2009) paper on the private segment.47
46 Cooperatives can be considered part of the non-traditional component of the global banking system that also includes government-owned banks. Non-traditional banks represent about 40 per cent of the global banking industry (LaPorta, Lopez-de-Silanes and Shleifer 2002).
47 There certainly has been some interesting research on cooperatives that includes research on the efficiency of cooperatives (Mester 1993; Altunbas, Evans and Molyneux 2001; Carbo, Gardener and Williams 2002; Wheelock and Wilson 2012).
9 5CON F E R E NC E VOLU M E | 2 015
SM E ACCE SS TO I N T ER M EDI AT ED CR EDI T: W H AT DO W E K NOW A N D W H AT DON’T W E K NOW?
There are reasons to believe that cooperatives do, in fact, behave differently. For example, there is evidence that credit unions:
• discipline banks in small local markets (Feinberg 2001)
• appear to be more scale efficient (Wheelock and Wilson 2009)
• lend to SMEs at more attractive rates than small banks (Angelini, Di Salvo and Ferri 1998)
• have different determinants of failure than banks (Wilcox 2007)
• lend more (Becchetti, Ciciretti and Paolotonio 2014).
An interesting example from the United States related to whether cooperatives behave more ethically involves the change in overdraft policies that most big banks adopted in 2001 and 2002. These banks – allegedly without proper public notice – changed the order in which they processed cheques from low to high (low meaning small cheque amounts) to high to low. This triggered many more cheques being classified as ‘not sufficient funds’. Because the penalty fees were assessed per cheque (typically about $35 per cheque) this change dramatically increased fee revenue. Virtually all of the banks were sued in class action lawsuits and have settled for hundreds of millions of dollars. Evidence suggests that credit unions in the United States were less likely to change their policies to exploit this strategy (Levitin 2010).
However, the news is not all good with respect to cooperatives’ behaviour. For example, there is evidence of expense preference behaviour among cooperatives (Mester 1989) and evidence that credit unions in the United States have become less efficient recently (Wheelock and Wilson 2009). Perhaps more interesting is the failure of the cajas in Spain during the financial crisis; pre-crisis these institutions accounted for half of the banking industry in Spain. Recent research indicates that when these cooperative banks were spatially deregulated in the decade before the crisis they extended loans to riskier SMEs when they expanded outside their historical market. This strategy was related to political capture (Illueca Muñoz, Norden and Udell 2014).
In summary, more research is needed on:
• the optimal size of the cooperative banking sector
• whether cooperatives are better at some types of lending technologies
• how the cooperative SME lending channels behave during a financial crisis.
4.8 Countercyclical macroprudential policy toolsThe recent financial crisis has focused policymakers on countercyclical macroprudential policy tools (CMPPTs), which are designed to limit the build-up of systemic risk in the banking system during a bubble period and dampen price increases.48 At first blush this interest would seem to have little to do with SME access to finance because most of the attention on CMPPTs has focused on the residential mortgage market.49 This is misleading for two reasons.
1. The residential mortgage market matters for SME access to finance.
2. CMPPTs are not limited to the residential mortgage market.
48 For a recent review of the literature on CMPPTs, see Ono et al (2015).
49 See Borio and Shim (2007) and Crowe et al (2011).
9 6 R E SE RV E BA N K OF AUST R A L I A
GR EG ORY F U DE L L
There are a number of different CMPPTs that have received attention: LTV caps; debt-to-income (DTI) ratio caps; countercyclical capital buffers; and dynamic loan loss provisioning (IMF 2011).
The idea behind an LTV cap is simple: a cap on the LTV ratio for mortgage lending prevents lenders from loosening their standards during a boom and diminishes procyclicality in lending.50 The same logic holds for DTI caps.
LTV caps – the most common CMPPT instrument – are relatively widespread across the globe (IMF 2011). Moreover, since the financial crisis a number of countries have introduced them, including Canada, South Korea and (most recently) Sweden. However, it has been difficult to empirically assess the effect of LTV caps due to data limitations (IMF 2011).
LTV and DTI caps matter for SME access to finance for two reasons.
1. Entrepreneurs often pledge their personal real estate as collateral. A direct effect could come if the LTV cap includes both the residential mortgage and the business loan. Of course, it could have the opposite effect if the constraint limits mortgage finance but frees up collateral value for a business loan.
2. LTV and DTI caps could be imposed on commercial property, which often secures SME loans. A few countries have done this already, such as Singapore. Moreover, LTV caps could feasibly be imposed on any of the collateral-based lending technologies – for example, LTV caps on inventory lending or equipment lending.
One recent study on Japan addressed the efficacy of an LTV cap on the real estate-based SME lending channels had it been imposed (Ono et al 2015). Policymakers and the financial press widely believed that a loosening of credit standards (i.e. an increase in LTV ratios at loan origination in business lending) during the bubble period before the Japanese financial crisis was the root cause of the lost decade. However, this study found that a counterfactual unconditional LTV cap would not have prevented the bubble because the LTV ratio was already countercyclical, not procyclical.
Countercyclical capital buffers – such as those in Basel III – could discourage lending in general, and SME lending in particular, as banks adjust their balance sheets. However, it is not obvious whether this effect would be economically significant.
With respect to the dynamic loan loss provisioning, we have the benefit of a natural experiment in Spain, which implemented dynamic loan loss provisioning in the decade prior to the financial crisis. At least two studies have been conducted on Spain’s experience. One study found evidence that dynamic provisioning dampened the contraction in the supply of credit and its impact on the real economy once the crisis started (Jimenez et al 2013); the other study found that prior to the crisis the implementation of dynamic provision caused some banks to increase their appetite for lending to riskier SMEs (Illueca Muñoz et al 2014).
Because interest in CMPPTs is so recent, there is very little research on the potential effect of these tools on SME access to finance. Future research will be important in this area as policymakers consider which CMPPTs to implement and how to tailor them.
50 The academic literature finds evidence of procyclicality in commercial lending (Berger and Udell 2004; Crowe et al 2011).
9 7CON F E R E NC E VOLU M E | 2 015
SM E ACCE SS TO I N T ER M EDI AT ED CR EDI T: W H AT DO W E K NOW A N D W H AT DON’T W E K NOW?
4.9 Government guaranteesGovernment guarantees of SME loans are one of the two credit multipliers mentioned in Section 3.3. They are on my top 10 list because there is a significant shortage of literature, despite the widespread adoption of these programs and the policy attention they attract.
Not surprisingly, countries around the world have injected considerable funding into these schemes (Cressy 2000, 2002). There is general consensus on the motivation for such programs:
• market imperfections lead to a funding gap in the SME market that loan guarantees can fill
• public sector involvement can spur innovation where it matters most – the SME sector (Hancock, Peek and Wilcox 2007).
The unsettled issue is whether these programs are, on balance, welfare improving. The biggest downside to government guarantees are the adverse selection and moral hazard problems they may create. Some researchers have cautioned that government guarantees reduce social welfare, and suggest that credit decisions may best be left to the private sector (de Meza 2002). However, my sense is that research has suggested positive net benefits from these guarantees, including:
• increasing real economic activity (Craig, Jackson and Thomson 2005; Hancock et al 2007)
• decreasing the procyclicality of SME lending (Hancock et al 2007)
• mitigating the effects of macroeconomic shocks (Uesugi, Sakai and Yamashiro 2006; Wilcox and Yasuda 2010).
More research is needed on several key dimensions such as:
• Which type of government guarantee programs work best and in what types of environments?
• How well do government guarantee programs work in acute financial crises, particularly the most recent financial crisis?
• Is there a better methodology for assessing the efficiency gains or losses from government guarantee schemes – for example, are short-term benefits in terms of real activity the correct measure?51
4.10 SME loan securitisationSecuritisation is the second credit multiplier mentioned in Section 3.3. Securitisation was born in the United States in 1968 when the Government National Mortgage Association (GNMA) offered the first mortgage-backed security – the GNMA pass-through. The securitisation of the residential mortgage market rapidly expanded from its initial focus on government-guaranteed and conventional mortgages to ‘non-conforming’ loans, including prominently subprime mortgages.
Securitisation also expanded into other markets, including commercial real estate, vehicle loans, accounts receivable and music industry royalties. Beginning in the 1980s, there was considerable practitioner and policymaker interest in securitising commercial loans, particularly SME loans. And there now appears to be a resurgence of policy interest in SME loan securitisation, particularly in Europe. No doubt some of this resurgence is driven by the recent credit crunch in the SME sector.
51 For a brief discussion of the some limitations associated with research on the US Small Business Administration loan guarantee program, see the conclusion in Craig et al (2005).

9 8 R E SE RV E BA N K OF AUST R A L I A
GR EG ORY F U DE L L
Policymakers argue that there are a number of benefits to a well-functioning SME securitisation market, including:
• as a bank funding tool
• as an alternative to bank funding
• bank portfolio diversification
• liquidity
• macroprudential benefits from transferring risk away from the banking sector (BoE-ECB 2014).
Policymakers in Europe have actively promoted expanding the SME securitisation market. Most notably, the ECB introduced an Asset-backed Securities Purchase Programme in November 2014 (ECB 2014).
SME securitisation in Europe today represents about 10 per cent of total outstanding debt in the European securitisation market. This is quite large relative to the United States (Altomonte and Bussoli 2014). However, there is a large variation across European countries. The volume of SME asset-backed security issuance has significantly declined since the crisis and the secondary market is moribund.
More interestingly, 90 per cent of outstanding SME asset-backed securities are retained on the balance sheets of the issuing bank – that is, it does not trade – but are eligible as collateral at the central bank (Altomonte and Bussoli 2014). This raises a question: did the European SME asset-backed security market endogenously emerge as a private market or was it fuelled by government support programs in big issuers like Spain?
In the United States, there was much speculation in the late 1980s and early 1990s about rapid growth in securitisation in the SME market. Some pundits claimed that securitisation would become the primary source of SME funding. The reality has been quite different. Securitisation of SME loans in the United States is virtually entirely limited to the federal government’s Small Business Administration loans (Berger and Frame 2005). Small Business Administration loans appear to be attractive instruments substantially (if not solely) because of the government guarantee associated with the underlying loans and the standardisation of these loans by Small Business Administration policy (Wilcox 2011).
However, ‘indirect’ securitisation may be far more important. Indirect securitisation occurs when an entrepreneur uses proceeds from a personal mortgage, vehicle loan or credit card loan to finance their business and that loan is securitised. It is very difficult to estimate the economic importance of this type of indirect securitisation; one estimate indicates that it could be as high as 20 per cent of SME debt in the United States (Wilcox 2011).52
Taken together, the European and US experience suggests that there may be significant limitations to securitisation as a credit multiplier and a solution to the SME funding gap. Because SME loans are tailored financial contracts that require renegotiation flexibility, securitisation may be of limited value in increasing SME access to finance.53 It may be feasible in small generic amortising loans,
52 ‘SME debt’ in this context includes the entrepreneur’s personal debt used to finance the firm.
53 Renegotiation clearly became an immense problem in the United States with respect to securitised subprime mortgages. Not only was the probability of default on subprime mortgage-backed securities underestimated, but this likely also blinded practitioners and policymakers to the importance of establishing infrastructure to permit renegotiation in the event of a real estate downturn.
9 9CON F E R E NC E VOLU M E | 2 015
SM E ACCE SS TO I N T ER M EDI AT ED CR EDI T: W H AT DO W E K NOW A N D W H AT DON’T W E K NOW?
but not feasible in more complex large loans used for working capital purposes (i.e. lines of credit and overdraft facilities). More research is certainly called for in this regard, particularly given the resurgence of interest in promoting SME loan securitisation.
5. ConclusionThis paper assesses the status of the current academic literature on SME access to finance. The last comprehensive assessment was Berger and Udell (1998). Much has happened in the intervening years. If anything, the topic has become more interesting to academics because it has become a more important policy issue. Heightened policy interest has in great part been driven by the acute credit crunch associated with the recent financial crisis.
The intent of this paper is to assess what we have learned about SME finance, and to identify fruitful areas for future research. This exercise is conducted through the window of two paradigms: the lending technologies paradigm suggested in Berger and Udell (2006); and the SME lending channels paradigm suggested in Taketa and Udell (2007). Of course, this literature has grown so rapidly that it is not possible to include all of the papers that have contributed to this field, much less discuss each one individually. Rather, the goal of this paper is more modest: to provide a sense of where the frontier of research lies today and where it might best go in the future.
The discussion of lending technologies in Section 2 emphasises that the academic literature has moved beyond a focus on individual loan contract features – such as collateral or covenants – and beyond an emphasis on relationship lending as the primary form of SME lending. Instead, the academic literature is moving toward a more realistic and comprehensive analysis where lenders deploy relatively distinct lending technologies under different circumstances. Beyond relationship lending, these lending technologies include financial statement lending, asset-based lending, trade credit and factoring, among others. Section 2.2.1 briefly summarises the current literature on each of these lending technologies. Not surprisingly, the academic literature on some of these lending technologies – such as relationship lending and trade credit – is quite extensive. But there has also been keen research interest in many of the others – such as factoring and small business credit scoring.
Section 3 shows how lending technologies can be paired with specific lending institutions, for example relationship lending and small banks or asset-based lending and commercial finance companies. Each pairing forms a lending channel. This lending channels paradigm provides a useful framework to assess what happens during a financial crisis or other macro shocks, where some channels may contract while others remain fully open – and some may even expand. Section 3.2 uses the lending channels paradigm as a way of framing the growing body of research on how the recent financial crisis affected SME access to finance in Europe and the United States.
Finally, I assess ‘what we don’t know’ by offering a list of the top 10 unsettled issues in SME finance. This assessment of the research frontier builds on the earlier discussions of lending technologies and lending channels. For example, the unsettled issue of whether soft information can be hardened is important in assessing how the mix of SME lending technologies might change over time and across countries. Likewise, the unsettled issue of how to best identify supply effects

1 0 0 R E SE RV E BA N K OF AUST R A L I A
GR EG ORY F U DE L L
from demand effects is important in assessing how lending channels behave during a financial crisis. Some of the top 10 unsettled issues in SME finance are directly related to key policy issues:
• How important is the cooperative component of the global financial system to SMEs?
• How will countercyclical macroprudential policy tools affect SME finance?
• Do government guarantee programs work?
• How viable are SME loan securitisation programs?
I think it is safe to say that while we have made enormous progress in our understanding of SME finance, further research is much needed.
1 0 1CON F E R E NC E VOLU M E | 2 015
SM E ACCE SS TO I N T ER M EDI AT ED CR EDI T: W H AT DO W E K NOW A N D W H AT DON’T W E K NOW?
ReferencesAdelino M, A Schoar and F Severino (2013), ‘House Prices, Collateral and Self-Employment’, NBER Working
Paper No 18868.
Agarwal S and R Hauswald (2010), ‘Distance and Private Information in Lending’, The Review of Financial
Studies, 23(7), pp 2757–2788.
Albertazzi U and DJ Marchetti (2010), ‘Credit Supply, Flight to Quality and Evergreening: An Analysis of
Bank-Firm Relationships after Lehman’, Banca d’Italia Temi di Discussione No 756.
Alessandrini P, AF Presbitero and A Zazzaro (2009), ‘Banks, Distances and Firms’ Financing Constraints’,
Review of Finance, 13(2), pp 261–307.
Allee KD and TL Yohn (2009), ‘The Demand for Financial Statements in an Unregulated Environment:
An Examination of the Production and Use of Financial Statements by Privately Held Small Businesses’,
The Accounting Review, 84(1), pp 1–25.
Altomonte C and P Bussoli (2014), ‘Asset-Backed Securities: The Key to Unlocking Europe’s Credit Markets?’,
Bruegel Policy Contribution, 2014/07.
Altunbas Y, L Evans and P Molyneux (2001), ‘Bank Ownership and Efficiency’, Journal of Money, Credit and
Banking, 33(4), pp 926–954.
Angelini P, R Di Salvo and G Ferri (1998), ‘Availability and Cost of Credit for Small Businesses: Customer
Relationships and Credit Cooperatives’, Journal of Banking & Finance, 22(6–8), pp 925–954.
Avery RB, RW Bostic and KA Samolyk (1998), ‘The Role of Personal Wealth in Small Business Finance’,
Journal of Banking & Finance, 22(6–8), pp 1019–1061.
Bakker MHR, L Klapper and GF Udell (2004), Financing Small and Medium-Size Enterprises with Factoring:
Global Growth and its Potential in Eastern Europe, The World Bank, Warsaw.
Becchetti L, R Ciciretti and A Paolotonio (2014), ‘Is There a Cooperative Bank Difference?’, CEIS Tor Vergata
Research Paper Series No 313.
Beck T, H Degryse, R de Haas and N van Horen (2014), ‘When Arm’s Length is too Far. Relationship Banking
over the Business Cycle’, De Nederlandsche Bank Working Paper No 431.
Beck T, A Demirgüç-Kunt and MS Martínez Pería (2011), ‘Banking Financing for SMEs: Evidence Across
Countries and Bank Ownership Types’, Journal of Financial Services Research, 39(1-2), pp 35–54.
Beck T, V Ioannidou and L Schäfer (2012), ‘Foreigners vs. Natives: Bank Lending Technologies and Loan
Pricing’, Tilburg University, CentER Discussion Paper No 2012-055.
Berger AN (2015), ‘Small Business Lending by Banks: Lending Technologies and the Effects of Banking
Industry Consolidation and Technological Change’, in AN Berger, P Molyneux and JOS Wilson (eds), The Oxford
Handbook of Banking, 2nd edn, Oxford Handbooks in Finance, Oxford University Press, Oxford, pp 292–311.
Berger AN and LK Black (2011), ‘Bank Size, Lending Technologies, and Small Business Finance’, Journal of
Banking & Finance, 35(3), pp 724–735.
Berger AN and WS Frame (2005), ‘Small Business Credit Scoring and Credit Availability’, Federal Reserve
Bank of Atlanta Working Paper 2005-10.
Berger AN, NH Miller, MA Petersen, RG Rajan and JC Stein (2005), ‘Does Function Follow Organizational
Form? Evidence from the Lending Practices of Large and Small Banks’, Journal of Financial Economics, 76(2),
pp 237–269.
1 0 2 R E SE RV E BA N K OF AUST R A L I A
GR EG ORY F U DE L L
Berger AN, RJ Rosen and GF Udell (2007), ‘Does Market Size Structure Affect Competition? The Case of
Small Business Lending’, Journal of Banking & Finance, 31(1), pp 11–33.
Berger AN and GF Udell (1994), ‘Did Risk-Based Capital Allocate Bank Credit and Cause a “Credit Crunch” in
the United States?’, Journal of Money, Credit and Banking, 26(3, Part 2), pp 585–628.
Berger AN and GF Udell (1995), ‘Relationship Lending and Lines of Credit in Small Firm Finance’, The Journal
of Business, 68(3), pp 351–381.
Berger AN and GF Udell (1998), ‘The Economics of Small Business Finance: The Roles of Private Equity and
Debt Markets in the Financial Growth Cycle’, Journal of Banking & Finance, 22(6–8), pp 613–673.
Berger AN and GF Udell (2002), ‘Small Business Credit Availability and Relationship Lending: The Importance
of Bank Organisational Structure’, The Economic Journal, 112(477), pp F32–F53.
Berger AN and GF Udell (2004), ‘The Institutional Memory Hypothesis and the Procyclicality of Bank
Lending Behavior’, Journal of Financial Intermediation 13(4), pp 458–495.
Berger AN and GF Udell (2006), ‘A More Complete Conceptual Framework for SME Finance’, Journal of
Banking & Finance, 30(11), pp 2945–2966.
Berlin M and J Loeys (1988), ‘Bond Covenants and Delegated Monitoring’, The Journal of Finance, 43(2),
pp 397–412.
Berlin M and LJ Mester (1992), ‘Debt Covenants and Renegotiation’, Journal of Financial Intermediation, 2(2),
pp 95–133.
Bernanke B, M Gertler and S Gilchrist (1996), ‘The Financial Accelerator and the Flight to Quality’, The
Review of Economics and Statistics, 78(1), pp 1–15.
Billett MT, R Elkamhi, L Popov and RS Pungaliya (forthcoming), ‘Bank Skin in the Game and Loan Contract
Design: Evidence from Covenant-Lite Loans’, Journal of Financial and Quantitative Analysis.
BoE-ECB (Bank of England and European Central Bank) (2014), ‘The Case for a Better Functioning
Securitisation Market in the European Union’, Discussion paper, May.
Bolton P, X Freixas, L Gambacorta and PE Mistrulli (2013), ‘Relationship and Transaction Lending in a
Crisis’, Banca D’Italia Temi di Discussione No 917.
Boot AWA (2000), ‘Relationship Banking: What Do We Know?’, Journal of Financial Intermediation 9(1),
pp 7–25.
Borio CEV and I Shim (2007), ‘What Can (Macro-)Prudential Policy Do to Support Monetary Policy?’,
BIS Working Papers No 242.
Boyd JH and EC Prescott (1986), ‘Financial Intermediary-Coalitions’, Journal of Economic Theory, 38(2),
pp 211–232.
Brekke KA and K Nyborg (2010), ‘Selfish Bakers, Caring Nurses? A Model of Work Motivation’, Journal of
Economic Behavior & Organization, 75(3), pp 377–394.
Brevoort KP and JD Wolken (2009), ‘Does Distance Matter in Banking?’, in P Alessandrini, M Fratianni and
A Zazzaro (eds), The Changing Geography of Banking and Finance, Springer US, New York, pp 27–56.
Brown M, M Schaller, S Westerfeld and M Heusler (2014), ‘The Hidden Costs of Control – Evidence from
Small Business Lending’, Paper presented at the European Financial Management Association’s 23rd Annual
Conference, Rome, 25–28 June.
Calomiris CW, M Larrain, J Liberti and J Sturgess (2015), ‘How Collateral Laws Shape Lending and Sectoral
Activity’, Columbia University Working Paper, May.
1 0 3CON F E R E NC E VOLU M E | 2 015
SM E ACCE SS TO I N T ER M EDI AT ED CR EDI T: W H AT DO W E K NOW A N D W H AT DON’T W E K NOW?
Carbo S, EPM Gardener and J Williams (2002), ‘Efficiency in Banking: Empirical Evidence from the Savings
Banks Sector’, The Manchester School, 70(2), pp 204–228.
Carbó-Valverde S, F Rodríguez-Fernández and GF Udell (2009), ‘Bank Market Power and SME Financing
Constraints’, Review of Finance, 13(2), pp 309–340.
Carbó-Valverde S, F Rodríguez-Fernández and GF Udell (forthcoming), ‘Trade Credit, the Financial Crisis,
and SME Access to Finance’, Journal of Money, Credit and Banking.
Carey M, M Post and SA Sharpe (1998), ‘Does Corporate Lending by Banks and Finance Companies Differ?
Evidence on Specialization in Private Debt Contracting’, The Journal of Finance, 53(3), pp 845–878.
Carey M, S Prowse, J Rea and GF Udell (1993a), ‘The Economics of Private Placements: A New Look’,
Financial Markets. Institutions & Instruments, 2(3).
Carey M, S Prowse, J Rea and GF Udell (1993b), ‘Recent Developments in the Market for Privately Placed
Debt’, Federal Reserve Bulletin, 79(2), pp 77–92.
Carey P, WR Knechel and G Tanewski (2013), ‘Costs and Benefits of Mandatory Auditing of For-Profit Private
and Not-for-Profit Companies in Australia’, Australian Accounting Review, 23(1), pp 43–53.
Carter DA, JE McNulty and JA Verbrugge (2004), ‘Do Small Banks have an Advantage in Lending? An
Examination of Risk-Adjusted Yields on Business Loans at Large and Small Banks’, Journal of Financial Services
Research, 25(2-3), pp 233–252.
Cerqueiro G, H Degryse and S Ongena (2011), ‘Rules Versus Discretion in Loan Rate Setting’, Journal of
Financial Intermediation, 20(4), pp 503–529.
Cerqueiro G, S Ongena and K Roszbach (forthcoming), ‘Collateralization, Bank Loan Rates, and Monitoring’,
The Journal of Finance.
Chava S and A Purnanandam (2011), ‘The Effect of Banking Crisis on Bank-Dependent Borrowers’, Journal
of Financial Economics, 99(1), pp 116–135.
Chava S and MR Roberts (2008), ‘How Does Financing Impact Investment? The Role of Debt Covenants’, The
Journal of Finance, 63(5), pp 2085–2121.
Chemmanur T and A Yan (2000), ‘Equilibrium Leasing Contracts under Double-Sided Asymmetric
Information’, Unpublished manuscript, Boston College, March.
Cowan CD and AM Cowan (2006), ‘A Survey-Based Assessment of Financial Institution Use of Credit Scoring
for Small Business Lending’, US Small Business Administration, Office of Advocacy, Small Business Research
Summary No 283.
Craig BR, WE Jackson, III, and JB Thomson (2005), ‘SBA-Loan Guarantees and Local Economic Growth’,
Federal Reserve Bank of Cleveland Working Paper 05-03.
Cressy R (2000), ‘Government Guarantee Schemes in Europe: Who has Them, Who Pays? Who Gains?’, in
B Green, R Cressy, F Delmar, T Eisenberg, B Howcroft, M Lewis, D Schoenmaker, J Shanteau and R Vivian (eds),
Risk Behaviour and Risk Management in Business Life, Kluwer Academic Publishers, Dordrecht, pp 247–255.
Cressy R (2002), ‘Funding Gaps: A Symposium’, The Economic Journal, 112(477), pp F1–F16.
Crowe C, G Dell’Ariccia, D Igan and P Rabanal (2011), ‘Policies for Macrofinancial Stability: Options to Deal
with Real Estate Booms’, IMF Staff Discussion Note SDN/11/02.
de la Torre A, MS Martínez Pería and SL Schmukler (2010), ‘Bank Involvement with SMEs: Beyond
Relationship Lending’, Journal of Banking & Finance, 34(9), pp 2280–2293.
de Meza D (2002), ‘Overlending?’, The Economic Journal, 112(477), pp F17–F31.
1 0 4 R E SE RV E BA N K OF AUST R A L I A
GR EG ORY F U DE L L
Delfgaauw J and R Dur (2007), ‘Signaling and Screening of Workers’ Motivation’, Journal of Economic
Behavior & Organization, 62(4), pp 605–624.
Demirgüç-Kunt A and V Maksimovic (2001), ‘Firms as Financial Intermediaries: Evidence from Trade Credit
Data’, World Bank Policy Research Working Paper WPS2696.
Detragiache E, P Garella and L Guiso (2000), ‘Multiple Versus Single Banking Relationships: Theory and
Evidence’, The Journal of Finance, 55(3), pp 1133–1161.
DeYoung R, WS Frame, D Glennon, DP McMillen and P Nigro (2008), ‘Commercial Lending Distance and
Historically Underserved Areas’, Journal of Economics & Business, 60(1–2), pp 149–164.
DeYoung R, WS Frame, D Glennon and P Nigro (2011), ‘The Information Revolution and Small Business
Lending: The Missing Evidence’, Journal of Financial Services Research, 39(1-2), pp 19–33.
DeYoung R, A Gron, G Torna and A Winton (2014), ‘Risk Overhang and Loan Portfolio Decisions: Small
Business Loan Supply before and during the Financial Crisis’, Unpublished manuscript, NERA Economic
Consulting.
DeYoung R, WC Hunter and GF Udell (2004), ‘The Past, Present, and Probable Future for Community Banks’,
Journal of Financial Services Research, 25(2-3), pp 85–133.
Diamond DW (1984), ‘Financial Intermediation and Delegated Monitoring’, The Review of Economic Studies,
51(3), pp 393–414.
Djankov S, O Hart, C McLiesh and A Shleifer (2008), ‘Debt Enforcement around the World’, Journal of
Political Economy, 116(6), pp 1105–1149.
Drucker S and M Puri (2009), ‘On Loan Sales, Loan Contracting, and Lending Relationships’, The Review of
Financial Studies, 22(7), pp 2835–2872.
Dunkelberg WC and WJ Dennis (1992), The Small Business “Credit Crunch”, NFIB Foundation, Washington DC.
Duygan-Bump B, A Levkov and J Montoriol-Garriga (2011), ‘Financing Constraints and Unemployment:
Evidence from the Great Recession’, Federal Reserve Bank of Boston Quantitative Analysis Unit Working
Paper No QAU10-6, rev.
ECB (European Central Bank) (2014), ‘Decision of the European Central Bank of 19 November 2014 on the
Implementation of the Asset-Backed Securities Purchase Programme’, Decision ECB/2014/45.
Elyasiani E and LG Goldberg (2004), ‘Relationship Lending: A Survey of the Literature’, Journal of Economics
& Business, 56(4), pp 315–330.
Farinha LA and JAC Santos (2002), ‘Switching from Single to Multiple Bank Lending Relationships:
Determinants and Implications’, Journal of Financial Intermediation, 11(2), pp 124–151.
Feinberg RM (2001), ‘The Competitive Role of Credit Unions in Small Local Financial Services Markets’,
The Review of Economics and Statistics, 83(3), pp 560–563.
Ferrando A and K Mulier (2013), ‘Firms’ Financing Constraints: Do Perceptions Match the Actual Situation?’,
ECB Working Paper No 1577.
Ferrando A, A Popov and GF Udell (2015), ‘Sovereign Stress, Unconventional Monetary Policy, and SME
Access to Finance’, ECB Working Paper No 1820.
Frame WS, M Padhi and L Woosley (2004), ‘Credit Scoring and the Availability of Small Business Credit in
Low- and Moderate-Income Areas’, The Financial Review, 39(1), pp 35–54.
Frame WS, A Srinivasan and L Woosley (2001), ‘The Effect of Credit Scoring on Small-Business Lending’,
Journal of Money, Credit and Banking, 34(3), pp 813–825.
1 0 5CON F E R E NC E VOLU M E | 2 015
SM E ACCE SS TO I N T ER M EDI AT ED CR EDI T: W H AT DO W E K NOW A N D W H AT DON’T W E K NOW?
Garcia-Appendini E and J Montoriol-Garriga (2013), ‘Firms as Liquidity Providers: Evidence from the
2007–2008 Financial Crisis’, Journal of Financial Economics, 109(1), pp 272–291.
Gârleanu N and J Zwiebel (2009), ‘Design and Renegotiation of Debt Covenants’, The Review of Financial
Studies, 22(2), pp 749–781.
Gennaioli N and S Rossi (2013), ‘Contractual Resolutions of Financial Distress’, The Review of Financial Studies,
26(3), pp 602–634.
Giannetti M, M Burkart and T Ellingsen (2011), ‘What You Sell Is What You Lend? Explaining Trade Credit
Contracts’, The Review of Financial Studies, 24(4), pp 1261–1298.
Gilligan TW (2004), ‘Lemons and Leases in the Used Business Aircraft Market’, Journal of Political Economy,
112(5), pp 1157–1180.
Glazer A (2004), ‘Motivating Devoted Workers’, International Journal of Industrial Organization, 22(3),
pp 427–440.
Gopalan R, GF Udell and V Yerramilli (2011), ‘Why Do Firms Form New Banking Relationships?’, Journal of
Financial and Quantitative Analysis, 46(5), pp 1335–1365.
Graham JR, ML Lemmon and JS Shallheim (1998), ‘Debt, Leases, Taxes, and the Endogeneity of Corporate
Tax Status’, The Journal of Finance, 53(1), pp 131–162.
Hancock D, J Peek and JA Wilcox (2007), ‘The Repercussions on Small Banks and Small Businesses of Bank
Capital and Loan Guarantees’, Wharton Financial Institutions Center Working Paper No 07-22.
Hancock D and JA Wilcox (1998), ‘The “Credit Crunch” and the Availability of Credit to Small Business’,
Journal of Banking & Finance, 22(6–8), pp 983–1014.
Handy F and E Katz (1998), ‘The Wage Differential between Nonprofit Institutions and Corporations: Getting
More by Paying Less?’, Journal of Comparative Economics, 26(2), pp 246–261.
Haselmann R, K Pistor and V Vig (2010), ‘How Law Affects Lending’, The Review of Financial Studies, 23(2),
pp 549–580.
Hendel I and A Lizzeri (2002), ‘The Role of Leasing under Adverse Selection’, Journal of Political Economy,
110(1), pp 113–143.
Hesse H and M Čihák (2007), ‘Cooperative Banks and Financial Stability’, IMF Working Paper No WP/07/2.
IFC (International Finance Corporation) (2012), ‘IFC Secured Transactions Advisory Project in China’,
Summary report, April.
Illueca Muñoz M, L Norden and GF Udell (2014), ‘Conditional Accounting Conservatism and Bank
Risk Taking’, Paper presented at the 13th International Conference on Credit Risk Evaluation Designed for
Institutional Targeting in Finance ‘The New Financial Regulatory System: Challenges and Consequences for
the Financial Sector’, Venice, 25–26 September.
Illueca Muñoz M, L Norden and S van Kampen (2015), ‘SME Finance: Is Trade Credit the Answer?’,
Unpublished manuscript, Erasmus University, Rotterdam School of Management, March.
IMF (International Monetary Fund) (2011), ‘Macroprudential Policy: An Organizing Framework’,
Policy Paper, March.
Ioannidou V and S Ongena (2010), ‘ “Time for a Change”: Loan Conditions and Bank Behavior when Firms
Switch Banks’, The Journal of Finance, 65(5), pp 1847–1877.
Iyer R, AI Khwaja, EFP Luttmer and K Shue (2013), ‘Screening Peers Softly: Inferring the Quality of Small
Borrowers’, NBER Working Paper No 15242, rev.

1 0 6 R E SE RV E BA N K OF AUST R A L I A
GR EG ORY F U DE L L
Iyer R, J-L Peydró, S da-Rocha-Lopes and A Schoar (2014), ‘Interbank Liquidity Crunch and the Firm Credit
Crunch: Evidence from the 2007–2009 Crisis’, The Review of Financial Studies, 27(1), pp 347–372.
James C (1987), ‘Some Evidence on the Uniqueness of Bank Loans’, Journal of Financial Economics, 19(2),
pp 217–235.
Jensen MC and WH Meckling (1976), ‘Theory of the Firm: Managerial Behavior, Agency Costs and
Ownership Structure’, Journal of Financial Economics, 3(4), pp 305–360.
Jessup PF (1980), Modern Bank Management, West Publishing Co, St Paul.
Jiménez G, S Ongena, J-L Peydró and J Saurina (2012), ‘Credit Supply and Monetary Policy: Identifying the
Bank Balance-Sheet Channel with Loan Applications’, The American Economic Review, 102(5), pp 2301–2326.
Jiménez G, S Ongena, J-L Peydró and J Saurina (2013), ‘Macroprudential Policy, Countercyclical Bank
Capital Buffers and Credit Supply: Evidence from the Spanish Dynamic Provisioning Experiments’, Universitat
Pompeu Fabra, Department of Economics and Business Working Paper No 1315, rev.
Kallberg JG and GF Udell (2003), ‘The Value of Private Sector Business Credit Information Sharing:
The US Case’, Journal of Banking & Finance, 27(3), pp 449–469.
Kano M, H Uchida, GF Udell and W Watanabe (2011), ‘Information Verifiability, Bank Organization, Bank
Competition and Bank–Borrower Relationships’, Journal of Banking & Finance, 35(4), pp 935–954.
Khwaja AI and A Mian (2008), ‘Tracing the Impact of Bank Liquidity Shocks: Evidence from an Emerging
Market’, The American Economic Review, 98(4), pp 1413–1442.
Kiyotaki N and J Moore (1995), ‘Credit Cycles’, NBER Working Paper No 5083.
Klapper L (2001), ‘The Uniqueness of Short-Term Collateralization’, World Bank Policy Research Working
Paper No 2544.
Klapper L (2006), ‘The Role of Factoring for Financing Small and Medium Enterprises’, Journal of Banking &
Finance, 30(11), pp 3111–3130.
Klapper L, L Laeven and R Rajan (2012), ‘Trade Credit Contracts’, The Review of Financial Studies, 25(3),
pp 838–867.
Kleiner K (2015a), ‘House Prices and New Firm Capital Structure’, Unpublished manuscript, Indiana University,
Kelley School of Business.
Kleiner K (2015b), ‘When Financial Crises become Economic Recessions: Evidence from Collateral
Constraints’, Unpublished manuscript, Indiana University, Kelley School of Business, May.
Kremp E and P Sevestre (2013), ‘Did the Crisis Induce Credit Rationing for French SMEs?’, Journal of Banking
& Finance, 37(10), pp 3757–3772.
Kysucky V and L Norden (2014), ‘The Benefits of Relationship Lending in a Cross-Country Context:
A Meta-Analysis’, Unpublished manuscript, Erasmus University, Rotterdam School of Management, July.
Laeven L and R Levine (2009), ‘Bank Governance, Regulation and Risk Taking’, Journal of Financial Economics,
93(2), pp 259–275.
La Porta R, F Lopez-de-Silanes and A Shleifer (2002), ‘Government Ownership of Banks’, The Journal of
Finance, 57(1), pp 265–301.
La Porta R, F Lopez-de-Silanes, A Shleifer and RW Vishny (1998), ‘Law and Finance’, Journal of Political
Economy, 106(6), pp 1113–1155.
Levitin AJ (2010), Overdraft Regulation: A Silver Lining to the Clouds?, Research Brief, Filene Research Institute,
Madison.
1 0 7CON F E R E NC E VOLU M E | 2 015
SM E ACCE SS TO I N T ER M EDI AT ED CR EDI T: W H AT DO W E K NOW A N D W H AT DON’T W E K NOW?
Liberti JM and A Mian (2009), ‘Estimating the Effect of Hierarchies on Information Use’, The Review of
Financial Studies, 22(10), pp 4057–4090.
Lin H and D Paravisini (2013), ‘The Effect of Financing Constraints on Risk’, Review of Finance, 17(1),
pp 229–259.
Lin M, NR Prabhala and S Viswanathan (2013), ‘Judging Borrowers by the Company They Keep: Friendship
Networks and Information Asymmetry in Online Peer-to-Peer Lending’, Management Science, 59(1), pp 17–35.
Mann T and V McGrane (2014), ‘Federal Reserve Proposes New Regulations for GE Capital: Top Panel
of U.S. Regulators Designated the Firm “Systemically Important”’, The Wall Street Journal, 25 November,
online. Available at <http://www.wsj.com/articles/federal-reserve-proposes-new-regulations-for-ge-
capital-1416947431>.
McCann F and T McIndoe-Calder (2012), ‘Determinants of SME Loan Default: The Importance of Borrower-
Level Heterogeneity’, Central Bank of Ireland Research Technical Paper 06/RT/12.
Mester LJ (1989), ‘Testing for Expense Preference Behavior: Mutual Versus Stock Savings and Loans’,
The RAND Journal of Economics, 20(4), pp 483–498.
Mester LJ (1993), ‘Efficiency in the Savings and Loan Industry’, Journal of Banking & Finance, 17(2–3),
pp 267–286.
Mester LJ, LI Nakamura and M Renault (2007), ‘Transactions Accounts and Loan Monitoring’, The Review of
Financial Studies, 20(3), pp 529–556.
Miwa Y and JM Ramseyer (2008), ‘The Implications of Trade Credit for Bank Monitoring: Suggestive
Evidence from Japan’, Journal of Economics & Management Strategy, 17(2), pp 317–343.
Mosk T (2014), ‘Delegation of Authority and Information Manipulation: Evidence from Bank Lending
Decisions’, in ‘Essays on Banking’, PhD thesis, CentER, Tilburg University, pp 5–36.
Myers SC (1984), ‘The Capital Structure Puzzle’, The Journal of Finance, 39(3), pp 574–592.
Myers SC and NS Majluf (1984), ‘Corporate Financing and Investment Decisions When Firms Have
Information That Investors Do Not Have’, Journal of Financial Economics, 13(2), pp 187–221.
Ongena S, J-L Peydró and N van Horen (2013), ‘Shocks Abroad, Pain at Home? Bank-Firm Level Evidence
on the International Transmission of Financial Shocks’, De Nederlandsche Bank Working Paper No 385.
Ono A, H Uchida, GF Udell and I Uesugi (2015), ‘Lending Pro-Cyclicality and Macro-Prudential Policy:
Evidence from Japanese LTV Ratios’, Paper presented at the American Economic Association 2015 Annual
Meeting, Boston, 3–5 January.
Peek J and ES Rosengren (1997), ‘The International Transmission of Financial Shocks: The Case of Japan’,
The American Economic Review, 87(4), pp 495–505.
Petersen MA and RG Rajan (1994), ‘The Benefits of Lending Relationships: Evidence from Small Business
Data’, The Journal of Finance, 49(1), pp 3–37.
Petersen MA and RG Rajan (1995), ‘The Effect of Credit Market Competition on Lending Relationships’,
The Quarterly Journal of Economics, 110(2), pp 407–443.
Petersen MA and RG Rajan (2002), ‘Does Distance Still Matter? The Information Revolution in Small Business
Lending’, The Journal of Finance, 57(6), pp 2533–2570.
Pigini C, AF Presbitero and A Zazzaro (2014), ‘State Dependence in Access to Credit’, Money & Finance
Research Group Working Paper No 102.

1 0 8 R E SE RV E BA N K OF AUST R A L I A
GR EG ORY F U DE L L
Pope DG and JR Sydnor (2011), ‘What’s in a Picture? Evidence of Discrimination from Prosper.com’,
The Journal of Human Resources, 46(1), pp 53–92.
Popov A and GF Udell (2012), ‘Cross-Border Banking, Credit Access, and the Financial Crisis’, Journal of
International Economics, 87(1), pp 147–161.
Presbitero AF, GF Udell and A Zazzaro (2014), ‘The Home Bias and the Credit Crunch: A Regional
Perspective’, Journal of Money, Credit and Banking, 46(s1), pp 53–85.
Puri M, J Rocholl and S Steffen (2011), ‘Global Retail Lending in the Aftermath of the US Financial Crisis:
Distinguishing between Supply and Demand Effects’, Journal of Financial Economics, 100(3), pp 556–578.
Rajan RG (1992), ‘Insiders and Outsiders: The Choice between Informed and Arm’s-Length Debt’, The Journal
of Finance, 47(4), pp 1367–1400.
Ramakrishnan RTS and AV Thakor (1984), ‘Information Reliability and a Theory of Financial Intermediation’,
The Review of Economic Studies, 51(3), pp 415–432.
Ravina E (2008), ‘Love & Loans: The Effect of Beauty and Personal Characteristics in Credit Markets’, Paper
presented at Law, Economics & Organization Workshop, Yale Law School, New Haven, 11 September.
Rodano G, N Serrano-Velarde and E Tarantino (2015), ‘Bankruptcy Law and Bank Financing’, Banca d’Italia
Temi di Discussione No 1013.
Smith JK (1987), ‘Trade Credit and Informational Asymmetry’, The Journal of Finance, 42(4), pp 863–872.
Sopranzetti BJ (1998), ‘The Economics of Factoring Accounts Receivable’, Journal of Economics & Business,
50(4), pp 339–359.
Stangler D and RE Litan (2009), ‘Where Will the Jobs Come from?’, Kauffman Foundation Research Series:
Firm Formation and Economic Growth Report, November.
Stein JC (2002), ‘Information Production and Capital Allocation: Decentralized Versus Hierarchical Firms’,
The Journal of Finance, 57(5), pp 1891–1921.
Taketa K and GF Udell (2007), ‘Lending Channels and Financial Shocks: The Case of Small and Medium-
Sized Enterprise Trade Credit and the Japanese Banking Crisis’, Monetary and Economic Studies, 25(2), pp 1–44.
Thakor AV and RE Quinn (2013), ‘The Economics of Higher Purpose’, European Corporate Governance
Institute, ECGI Working Paper Series in Finance No 395/2013.
Townsend RM (1979), ‘Optimal Contracts and Competitive Markets with Costly State Verification’, Journal of
Economic Theory, 21(2), pp 265–293.
Uchida H and GF Udell (2015), ‘Banking in Japan’, in AN Berger, P Molyneux and JOS Wilson (eds), The Oxford
Handbook of Banking, 2nd edn, Oxford Handbooks in Finance, Oxford University Press, Oxford, pp 873–912.
Uchida H, GF Udell and W Watanabe (2008), ‘Bank Size and Lending Relationships in Japan’, Journal of the
Japanese and International Economies, 22(2), pp 242–267.
Uchida H, GF Udell and W Watanabe (2013), ‘Are Trade Creditors Relationship Lenders?’, Japan and the
World Economy, 25–26, pp 24–38.
Uchida H, GF Udell and N Yamori (2008), ‘How do Japanese Banks Discipline Small- and Medium-Sized
Borrowers? An Investigation of the Deployment of Lending Technologies’, in JJ Choi and S Dow (eds),
Institutional Approach to Global Corporate Finance: Business Systems and Beyond, International Finance Review,
Vol 9, Emerald Group Publishing Limited, Bingley, pp 57–80.
Uchida H, GF Udell and N Yamori (2012), ‘Loan Officers and Relationship Lending to SMEs’, Journal of
Financial Intermediation, 21(1), pp 97–122.
1 0 9CON F E R E NC E VOLU M E | 2 015
SM E ACCE SS TO I N T ER M EDI AT ED CR EDI T: W H AT DO W E K NOW A N D W H AT DON’T W E K NOW?
Udell GF (2004), Asset-Based Finance: Proven Disciplines for Prudent Lending, Commercial Finance Association,
New York.
Udell GF (2009), ‘How Will a Credit Crunch Affect Small Business Finance?’, FRBSF Economic Letter No 2009-09.
Udell GF (2011), ‘SME Financing and the Financial Crisis: A Framework and Some Issues’, in G Calcagnini and
I Faveretto (eds), The Economics of Small Businesses: An International Perspective, Contributions to Economics,
Physica-Verlag, Heidelberg, pp 103–113.
Uesugi I, K Sakai and GM Yamashiro (2006), ‘Effectiveness of Credit Guarantees in the Japanese Loan
Market’, Research Institute of Economy, Trade and Industry, RIETI Discussion Paper Series 06-E-004.
Vig V (2013), ‘Access to Collateral and Corporate Debt Structure: Evidence from a Natural Experiment’,
The Journal of Finance, 68(3), pp 881–928.
von Lilienfeld-Toal U, D Mookherjee and S Visaria (2012), ‘The Distributive Impact of Reforms in Credit
Enforcement: Evidence from Indian Debt Recovery Tribunals’, Econometrica, 80(2), pp 497–558.
Wheelock DC and PW Wilson (2009), ‘The Evolution of Cost-Productivity and Efficiency among U.S. Credit
Unions’, Federal Reserve Bank of St. Louis Working Paper 2009-008D.
Wheelock DC and PW Wilson (2012), ‘The Evolution of Cost-Productivity and Efficiency among U.S. Credit
Unions’, Federal Reserve Bank of St. Louis Working Paper 2009-008D, rev.
Wilcox JA (2007), Determinants of Credit Union and of Commercial Bank Failures: Similarities and Differences,
1981–2005, Filene Research Institute, Madison.
Wilcox JA (2011), ‘Securitization and Small Business’, FRBSF Economic Letter No 2011-22.
Wilcox JA and Y Yasuda (2010), ‘Do Government Loan Guarantees Lower, or Raise, Banks’ Nonguaranteed
Lending?’, Paper presented at Federal Reserve Bank of Chicago’s 45th Annual Conference on Bank Structure
and Competition ‘Reforming Financial Regulation’, Chicago, 6–8 May.
Wolken JD and D Rohde (2002), ‘Changes in the Location of Small Businesses’ Financial Service Suppliers
between 1993 and 1998’, Federal Reserve Board Internal Memorandum.
1 1 0 R E SE RV E BA N K OF AUST R A L I A
Discussion
1. Warren Mundy and Mark BryantThis paper by Professor Gregory Udell provides an assessment of the existing academic literature on the issue of small to medium-sized enterprise (SME) access to finance. It focuses on the lending technologies that are prevalent in SME lending and the channels through which small business lending is conducted.
The paper begins by noting the renewed interest in the topic of access to finance for SMEs, particularly by policymakers. This is a phenomenon that we have witnessed in Australia with, for example, two parliamentary inquiries into small business finance over the previous five years (Senate Economics References Committee 2010; PJCCFS 2011). Access to finance for businesses has also been an important issue across a range of recent Productivity Commission projects (including Productivity Commission (2012, 2014, 2015)).
The author argues that the unprecedented effects of the financial crisis, developments in empirical techniques and increased access to country-level datasets means that there is once again value in taking stock of the extant literature on SME finance. He then cycles through the most common forms of lending approaches and technologies – many of which are commonplace in Australia. For each lending technology, the author cites key papers to deliver an up-to-date snapshot of academic research in these areas.
By drawing on the existing stock of empirical research, the paper makes a number of interesting points. First, it challenges the notion that all bank lending to SMEs is done so on the basis of ‘soft information’ and relationships. Rather, the paper argues that other lending technologies, such as equipment lending and leasing, are critically important for small businesses. Second, the author explores the cost differentials among lending channels. He argues that the personalised nature of relationship banking means it is costly relative to transactions-based lending, which is often governed by standardised decision rules. The author argues that these cost differentials can influence the structure of lending markets – because of economies of scale, larger banks are better placed to deliver transactions-based lending products, while smaller banks are suited to offering less standardised relationship lending.
In examining lending channels, the author acknowledges that not all lending technologies are offered by all lenders. Through examples, the author illustrates that these channels are dynamic – external shocks such as credit crunches can change what products lending channels offer, with potentially large implications for where and how small businesses access credit. The paper acknowledges the ongoing debate about the effectiveness or otherwise of credit multipliers such as government guarantee schemes and SME loan securitisation.
One key feature of this paper is to highlight gaps in our knowledge about SME lending. To present these gaps, the paper delivers a ‘top 10’ list of what we do not know. The author rightly caveats
1 1 1CON F E R E NC E VOLU M E | 2 015
DISC US SION
that such a list is largely subjective and will undoubtedly evoke debate about the merits of what is and is not included in the list. Nevertheless, the list provides a useful road map that can guide researchers to areas where they can add value within the SME lending literature.
Several of the topics identified are relevant to Australia, including:
• Technological innovation and SME lending. There is often a lack of evidence around the extent to which technology has influenced how banks provide credit to SMEs. However, even if bank lending methods have been largely undisturbed by technology, the Australian credit market as a whole is experiencing a number of upheavals that can potentially change the way SMEs receive funding. One is the growing prominence of crowdfunding. Another is the emergence of purely online lending platforms, with one example of this being PayPal Working Capital (PayPal 2014). The introduction of comprehensive credit reporting represents another innovation that has the potential to change the lending landscape in Australia.
• Cooperatives. The author hypothesises that the different governance structures that cooperative institutions employ – compared with private banks – may influence their efficiency and behaviour when it comes to business lending. In Australia, building societies and credit unions constitute only 0.2 per cent of business lending. Research into why this proportion is so low is likely to be valuable.
• Government guarantees. Unlike most Organisation of Economic Co-operation and Development economies, Australia does not have a national credit guarantee scheme. Rather, financial assistance to small businesses is provided through a number of other means, such as concessional loans and grants. The costs, benefits and long-term outcomes of this assistance are often not assessed by those implementing these programs. To the extent that data are available, an assessment of these programs would be of great interest to researchers and policymakers.
One lending technology that receives relatively little attention in the paper is crowdfunding. The author notes the lack of reliable data on the amount of crowdfunding either being sought or being provided; this is a challenge shared by researchers and policymakers, including by the Productivity Commission. As an emerging finance technology, crowdfunding has the potential to fill possible funding gaps in the small and new business lending market. However, the challenge for policymakers is to find a balance between ensuring investor protection and making it easy for firms to raise funding through such means.
Although the scope of the paper is deliberately restricted to SME access to debt finance, it is important to remember that equity finance is also important for small businesses. Indeed, for new businesses, equity – rather than debt – might represent the most appropriate or accessible source of funding.
In conclusion, this paper makes a useful contribution to our understanding of SME finance by assessing and summarising the ever-growing body of academic research in this area. The author is frank about what we do and do not know and provides an overview of areas where we would benefit from further research. The issues raised in this paper are very relevant to policymakers, and particularly for the Productivity Commission’s work in the area of business set-ups, transfers and closures (Productivity Commission 2015).
1 1 2 R E SE RV E BA N K OF AUST R A L I A
DISC US SION
ReferencesPayPal (2014), ‘PayPal Launches Working Capital, Providing Loans to Help Australian SMBs Grow their
Businesses’, Press Release, 22 October.
PJCCFS (Parliamentary Joint Committee on Corporations and Financial Services) (2011), Access for
Small and Medium Business to Finance, (B Ripoli, Chair), Commonwealth of Australia, Canberra.
Productivity Commission (2012), Australia’s Export Credit Arrangements, Report No 58, Final Inquiry Report,
Productivity Commission, Canberra.
Productivity Commission (2014), Public Infrastructure, Inquiry Report No 71, 2 vols, Productivity Commission,
Canberra.
Productivity Commission (2015), Business Set-up, Transfer and Closure, Draft Report, Productivity
Commission, Canberra.
Senate Economics References Committee (2010), Access of Small Business to Finance, (A Eggelston, Chair),
Commonwealth of Australia, Canberra.
2. General DiscussionDiscussion centred on whether or not there is a ‘funding gap’ for SMEs – that is, whether there are significant numbers of SMEs that could productively use financing but are unable to obtain it. Some participants expressed scepticism that such a gap exists because it implied that banks do not pursue a large number of profitable lending opportunities. Moreover, it is extremely difficult to find objective measures of projects that would be profitable if financed but are unable to get finance. Several participants noted that, when surveyed, only a small share of businesses state that they desire external finance, or that obtaining external finance is their main problem. Gregory Udell pointed out that, if the asymmetric information paradigm of SME lending is correct, it implies that banks should decline some positive net present value lending opportunities, because these will be indistinguishable from certain negative net present value opportunities. He also agreed that proving the existence of, or measuring, an SME funding gap is difficult. An easier approach is to examine whether the funding gap widens during financial crises, and one way to do this is by examining the different responses of SME lending channels during crises. This approach has been used to highlight significant credit crunches for SMEs in the United States and Europe during the recent financial crisis. Another participant noted that answers to the funding gap question require better data, including data on SMEs whose applications for finance are rejected, as well as those discouraged from applying.
The discussion turned to the lending technologies used in Australia, particularly the use of outside collateral in the form of an entrepreneur’s residential property. As with the funding gap, there were conflicting perspectives on the importance of residential collateral in obtaining small business finance in Australia. Some participants argued that an entrepreneur who is unable to offer residential collateral has little or no chance of obtaining debt finance in Australia, while others countered that debt serviceability and managerial quality are more important criteria in bank lending decisions. Several participants posited that regulatory capital rules affect the profitability of bank lending to different sectors, and thus lending decisions. One participant noted that the

1 1 3CON F E R E NC E VOLU M E | 2 015
DISC US SION
current system of risk weights likely encourages banks to ensure there is residential collateral backing some smaller business loans. The recent introduction of positive credit reporting in Australia was highlighted as a change that may encourage the growth of non-collateral-based lending technologies.
A participant noted that firms had moved towards relying more on intangible assets, such as technology and human capital. This move had resulted in a decrease in firms’ assets that could be mortgaged, and the participant noted that this could be a potential constraint on business finance going forward. Professor Udell commented that, if relationship lending is declining relative to other lending technologies, a lack of collateral-eligible assets may become a problem for SME access to finance. Another participant commented that relationship lending – and other lending technologies based on information – should theoretically be more productivity enhancing than collateral-based lending.
The discussion concluded with a participant asking Professor Udell for his opinion on the most effective SME finance-related policy intervention. He responded that the ongoing introduction of modern bankruptcy systems and property security laws in developing countries – although not usually seen as a policy directed at SME finance – was likely to lead to the largest welfare gains.

1 1 4 R E SE RV E BA N K OF AUST R A L I A

1 1 5CON F E R E NC E VOLU M E | 2 015
Housing Prices and Entrepreneurship: Evidence for the Housing Collateral Channel in AustraliaEllis Connolly, Gianni La Cava and Matthew Read*
1. IntroductionChanges in housing prices can affect the Australian economy through several channels. One channel that has not been previously documented is how changes in housing prices could affect entrepreneurial activity in Australia. Small businesses make a significant contribution to the Australian economy, accounting for 43 per cent of employment in the private non-financial sector and a third of production in 2012/13. Under the ‘housing collateral channel’ of entrepreneurship, rising housing prices increase the housing equity of residential property owners. This increases the potential borrowing capacity of credit-constrained entrepreneurs, allowing them to finance more entrepreneurial activity by using their housing equity.1
This paper is motivated by at least two factors. First, studying the housing collateral channel may help us to better understand how monetary policy affects the real economy. For instance, lower real interest rates typically lead to higher housing prices; if the housing collateral channel is operating, then expansionary monetary policy may lead to more entrepreneurial activity, such as the formation of new businesses. Furthermore, it is generally believed that new businesses contribute disproportionately to employment and output growth, implying that this channel of monetary policy transmission could be quite strong.2 Second, if there is a housing collateral channel, then it implies that some entrepreneurs are credit constrained, which has implications for the design of policies aimed at improving entrepreneurs’ access to finance.
The existing literature implies that there is a single housing collateral channel but, in fact, there are at least three channels through which housing prices can affect entrepreneurship.
1. Business loans. Higher housing prices increase the value of housing collateral against which entrepreneurs can directly secure business loans.
2. Personal lending products. Higher housing prices increase the value of housing equity available for entrepreneurs to draw down on by using housing-related lending products (e.g. home equity loans and cash-out refinancing).
1 A similar mechanism underlies some macroeconomic models with financial frictions (for example, see Bernanke and Gertler (1989) and Kiyotaki and Moore (1997)).
2 To the best of our knowledge, there are no Australian studies that quantify the contribution of either small or young businesses to job creation and output growth. For evidence for the United States, see Haltiwanger, Jarmin and Miranda (2013).
* The authors are from the Reserve Bank of Australia. The authors would like to thank Jon Cheshire and Ani Yadav for their outstanding contribution to the liaison with lenders undertaken for this paper. The authors would also like to thank David Hargreaves, Angus Moore and John Simon for useful feedback.
1 1 6 R E SE RV E BA N K OF AUST R A L I A
E L L IS CON NOL LY, G I A N N I L A C AVA A N D M AT T H EW R E A D
3. Personal guarantees. Higher housing prices increase the value of personal guarantees, as this is a function of the value of the guarantor’s assets (such as residential property).
The existence of a housing collateral channel has been a significant area of empirical research recently. Several papers find a positive relationship between changes in housing prices (or housing equity) and entrepreneurship, which they interpret as evidence of a housing collateral channel (Adelino, Schoar and Severino 2013; Corradin and Popov 2013; Fort et al 2013; Schmalz, Sraer and Thesmar 2013). However, these papers may have confounded a housing collateral channel with broader wealth effects that can also increase entrepreneurial activity. In particular, a rise in housing prices increases the net wealth of home owners, which may encourage them to take more risk (including starting a business) independently of any change in their borrowing capacity. To address this identification problem, Jensen, Leth-Petersen and Nanda (2014) exploit a natural experiment in which an exogenous mortgage reform in Denmark provided entrepreneurs with greater access to home equity lines of credit, thereby unlocking a home equity source of finance to start a business. They find evidence of a housing collateral channel, although the economic effect of the channel is relatively small. Similarly, Kerr, Kerr and Nanda (2014) find that housing collateral plays a role in business formation, but that wealth effects appear to be more important.
We explore the housing collateral channel in Australia using three approaches. First, we explore the issue from the ‘lender’s perspective’ by drawing on liaison with lenders (carried out by the Reserve Bank of Australia), and examine the role of housing collateral in lenders’ credit assessment frameworks (Section 2). Second, we take a ‘borrower’s perspective’ and explore the evidence for the existence of a housing collateral channel using household survey data (Section 3). Third, we adopt a ‘combined perspective’ and examine the evidence for the channel using postcode-level information (Section 4). Finally, we draw together all our results and discuss the implications (Section 5).
2. Evidence from Liaison with LendersTo deepen our understanding of the role of housing collateral in small business lending, we conducted a series of interviews with small business finance experts at a range of lending institutions. These institutions account for around 95 per cent of the lending to small and medium-sized enterprises in Australia. In this section of the paper, we outline the key themes that emerged from the interviews, focusing on the role of housing collateral in the decision to lend to small businesses and the conditions of that lending. We also consider whether collateral is important in the provision of finance to start-up businesses, either through business loans or personal lending products such as home loans. Where relevant, we supplement the liaison with evidence from aggregate statistics and survey-based information.
2.1 The role of housing collateral in small business lendingThe interviews highlighted that the provision of housing collateral by small business borrowers has some influence on the lending decision, and has a significant effect on the terms of the lending.

1 1 7CON F E R E NC E VOLU M E | 2 015
HOUSI NG PR IC E S A N D E N T R E PR E N EU R SH I P: EV I DE NC E FOR T H E HOUSI NG COL L AT E R A L C H A N N E L I N AUST R A L I A
2.1.1 How lenders make small business lending decisions
Most of the small business finance experts identified housing collateral as being relevant to the framework they use when making lending decisions, although few considered it to be the most important element. To place the role of collateral in context, the lenders described the key factors that they take into account when assessing small business loan applications. The factors highlighted were similar across the lenders, and were typically drawn from the traditional ‘5Cs’ model, which involves evaluating the borrower’s character, capacity, collateral, capital and the broader conditions surrounding the loan. The lenders noted that they drew on a wide range of qualitative and quantitative information in making this assessment, and that no single factor was sufficient of itself to justify approving a loan application. The lenders noted that this approach was motivated by their internal risk controls, along with prudential regulatory requirements and their legal obligation to lend responsibly.
The character of a small business borrower is a primary focus of most institutions when they make lending decisions because it is a key determinant of the borrower’s probability of defaulting on the loan. When lenders assess the borrower’s character or reputation, they are looking for evidence of management or business experience, a well-developed business plan, a strong advisory team and a commitment to repay the loan. Gathering this evidence typically involves face-to-face interviews with the potential borrower, analysing the borrower’s credit default history and drawing on the local knowledge of the lending institution’s managers.
The capacity of the borrower – whether the borrower has sufficient income to service their debts on an ongoing basis – is critical to the lending decision. To determine this, lenders analyse the financial records of the business, the business’ actual and projected cash flow, along with the potential borrower’s personal financial history. Several of the small business finance experts noted that it is often difficult to extract evidence of the profitability of the business from the financial statements prepared by accountants, since the statements are dated and some may have been prepared with the objective of minimising tax. Instead, most of the lenders stated that they prefer to have access to a history of the borrower’s transactions to assess their capacity, which is most easily obtained if the small business is already a customer. As a result, lenders have a natural preference to lend to existing customers with a well-established transactions history. Lenders typically analyse several years of data to abstract from the effect of temporary shocks on the small business.
In contrast to the first two factors, which the lenders uniformly agreed were crucial in lending decisions, there was some divergence regarding the importance of the collateral provided by the borrower, particularly in the form of residential housing. Some lenders downplayed the importance of collateral, arguing that it was just a ‘backstop’ that could reduce the loss for the lender in the event of default, without affecting the probability of a default occurring. In addition, some emphasised how costly and ‘undesirable’ it was to take possession of a business owner’s home upon default. These lenders viewed taking possession of the home as a third and final line of defence, after the borrower’s capacity to repay has been exhausted, and after any other collateral, such as commercial property or equipment, has been sold to recover the value of the debt.
In contrast, some of the lenders viewed housing collateral as essential, particularly for larger loans. These lenders highlighted that the provision of housing collateral was an indicator of the
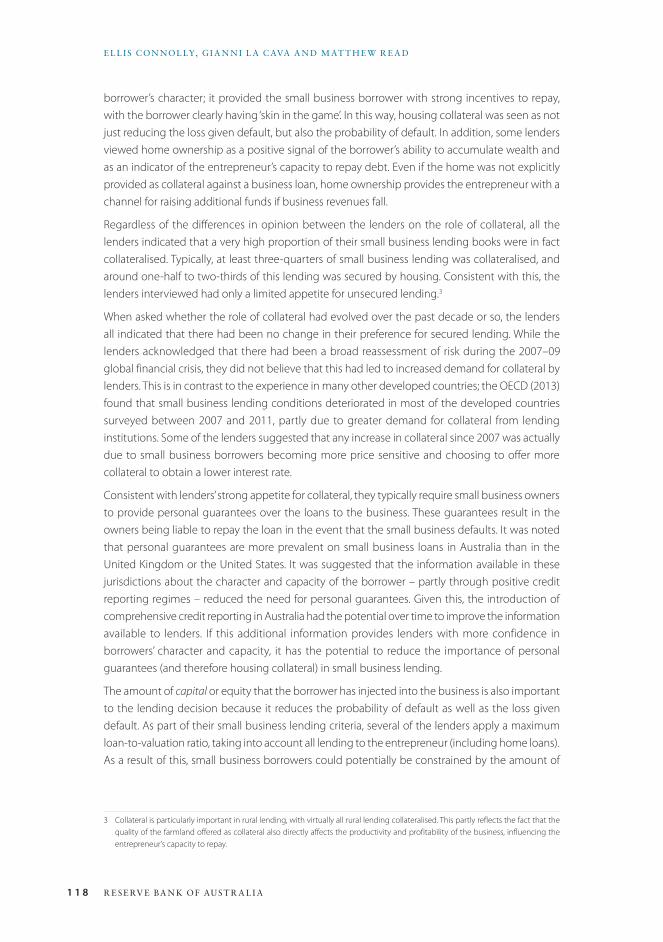
1 1 8 R E SE RV E BA N K OF AUST R A L I A
E L L IS CON NOL LY, G I A N N I L A C AVA A N D M AT T H EW R E A D
borrower’s character; it provided the small business borrower with strong incentives to repay, with the borrower clearly having ‘skin in the game’. In this way, housing collateral was seen as not just reducing the loss given default, but also the probability of default. In addition, some lenders viewed home ownership as a positive signal of the borrower’s ability to accumulate wealth and as an indicator of the entrepreneur’s capacity to repay debt. Even if the home was not explicitly provided as collateral against a business loan, home ownership provides the entrepreneur with a channel for raising additional funds if business revenues fall.
Regardless of the differences in opinion between the lenders on the role of collateral, all the lenders indicated that a very high proportion of their small business lending books were in fact collateralised. Typically, at least three-quarters of small business lending was collateralised, and around one-half to two-thirds of this lending was secured by housing. Consistent with this, the lenders interviewed had only a limited appetite for unsecured lending.3
When asked whether the role of collateral had evolved over the past decade or so, the lenders all indicated that there had been no change in their preference for secured lending. While the lenders acknowledged that there had been a broad reassessment of risk during the 2007–09 global financial crisis, they did not believe that this had led to increased demand for collateral by lenders. This is in contrast to the experience in many other developed countries; the OECD (2013) found that small business lending conditions deteriorated in most of the developed countries surveyed between 2007 and 2011, partly due to greater demand for collateral from lending institutions. Some of the lenders suggested that any increase in collateral since 2007 was actually due to small business borrowers becoming more price sensitive and choosing to offer more collateral to obtain a lower interest rate.
Consistent with lenders’ strong appetite for collateral, they typically require small business owners to provide personal guarantees over the loans to the business. These guarantees result in the owners being liable to repay the loan in the event that the small business defaults. It was noted that personal guarantees are more prevalent on small business loans in Australia than in the United Kingdom or the United States. It was suggested that the information available in these jurisdictions about the character and capacity of the borrower – partly through positive credit reporting regimes – reduced the need for personal guarantees. Given this, the introduction of comprehensive credit reporting in Australia had the potential over time to improve the information available to lenders. If this additional information provides lenders with more confidence in borrowers’ character and capacity, it has the potential to reduce the importance of personal guarantees (and therefore housing collateral) in small business lending.
The amount of capital or equity that the borrower has injected into the business is also important to the lending decision because it reduces the probability of default as well as the loss given default. As part of their small business lending criteria, several of the lenders apply a maximum loan-to-valuation ratio, taking into account all lending to the entrepreneur (including home loans). As a result of this, small business borrowers could potentially be constrained by the amount of
3 Collateral is particularly important in rural lending, with virtually all rural lending collateralised. This partly reflects the fact that the quality of the farmland offered as collateral also directly affects the productivity and profitability of the business, influencing the entrepreneur’s capacity to repay.
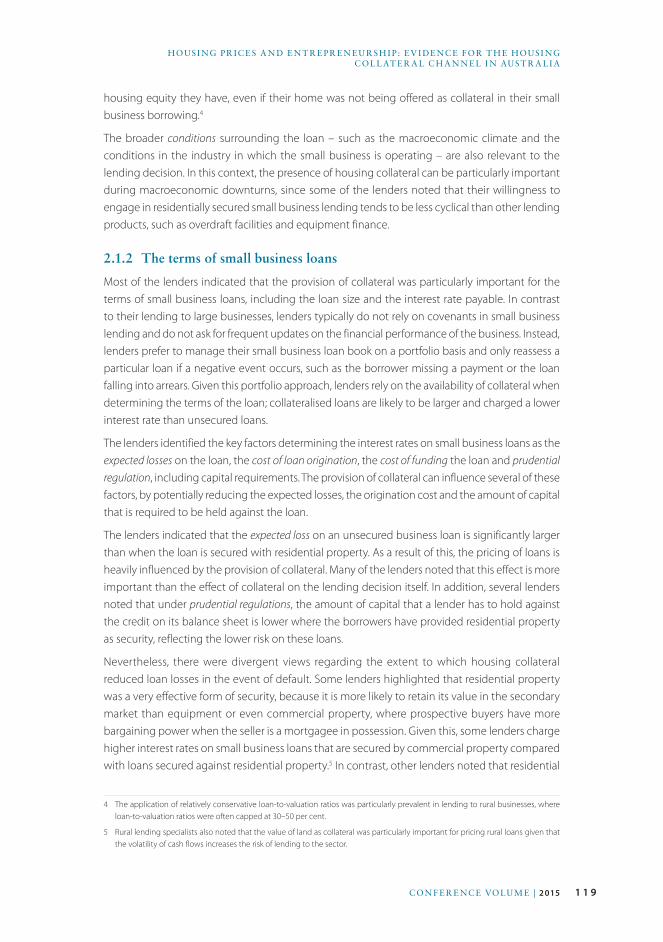
1 1 9CON F E R E NC E VOLU M E | 2 015
HOUSI NG PR IC E S A N D E N T R E PR E N EU R SH I P: EV I DE NC E FOR T H E HOUSI NG COL L AT E R A L C H A N N E L I N AUST R A L I A
housing equity they have, even if their home was not being offered as collateral in their small business borrowing.4
The broader conditions surrounding the loan – such as the macroeconomic climate and the conditions in the industry in which the small business is operating – are also relevant to the lending decision. In this context, the presence of housing collateral can be particularly important during macroeconomic downturns, since some of the lenders noted that their willingness to engage in residentially secured small business lending tends to be less cyclical than other lending products, such as overdraft facilities and equipment finance.
2.1.2 The terms of small business loans
Most of the lenders indicated that the provision of collateral was particularly important for the terms of small business loans, including the loan size and the interest rate payable. In contrast to their lending to large businesses, lenders typically do not rely on covenants in small business lending and do not ask for frequent updates on the financial performance of the business. Instead, lenders prefer to manage their small business loan book on a portfolio basis and only reassess a particular loan if a negative event occurs, such as the borrower missing a payment or the loan falling into arrears. Given this portfolio approach, lenders rely on the availability of collateral when determining the terms of the loan; collateralised loans are likely to be larger and charged a lower interest rate than unsecured loans.
The lenders identified the key factors determining the interest rates on small business loans as the expected losses on the loan, the cost of loan origination, the cost of funding the loan and prudential regulation, including capital requirements. The provision of collateral can influence several of these factors, by potentially reducing the expected losses, the origination cost and the amount of capital that is required to be held against the loan.
The lenders indicated that the expected loss on an unsecured business loan is significantly larger than when the loan is secured with residential property. As a result of this, the pricing of loans is heavily influenced by the provision of collateral. Many of the lenders noted that this effect is more important than the effect of collateral on the lending decision itself. In addition, several lenders noted that under prudential regulations, the amount of capital that a lender has to hold against the credit on its balance sheet is lower where the borrowers have provided residential property as security, reflecting the lower risk on these loans.
Nevertheless, there were divergent views regarding the extent to which housing collateral reduced loan losses in the event of default. Some lenders highlighted that residential property was a very effective form of security, because it is more likely to retain its value in the secondary market than equipment or even commercial property, where prospective buyers have more bargaining power when the seller is a mortgagee in possession. Given this, some lenders charge higher interest rates on small business loans that are secured by commercial property compared with loans secured against residential property.5 In contrast, other lenders noted that residential
4 The application of relatively conservative loan-to-valuation ratios was particularly prevalent in lending to rural businesses, where loan-to-valuation ratios were often capped at 30–50 per cent.
5 Rural lending specialists also noted that the value of land as collateral was particularly important for pricing rural loans given that the volatility of cash flows increases the risk of lending to the sector.
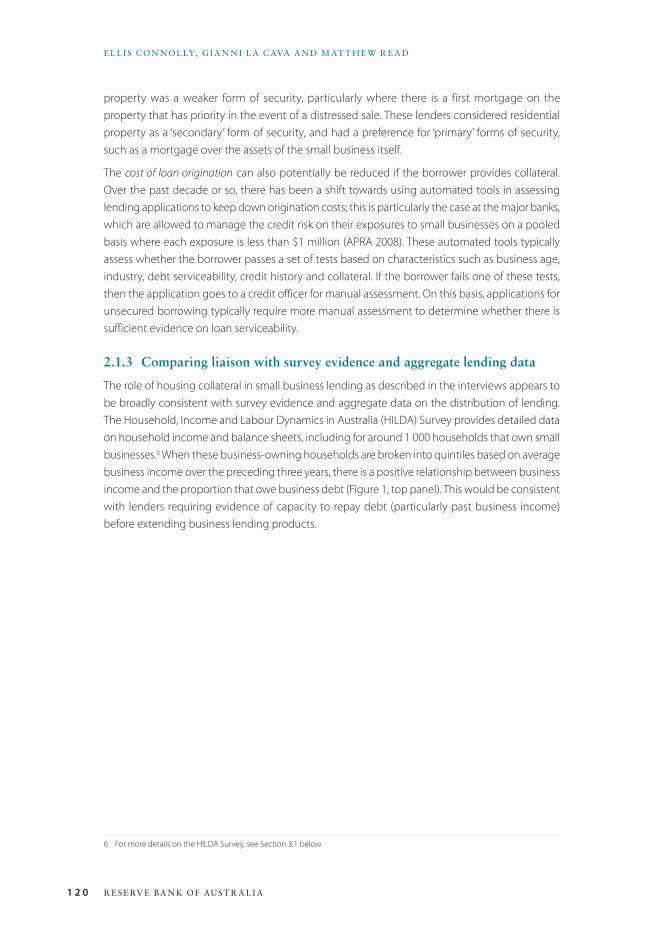
1 2 0 R E SE RV E BA N K OF AUST R A L I A
E L L IS CON NOL LY, G I A N N I L A C AVA A N D M AT T H EW R E A D
property was a weaker form of security, particularly where there is a first mortgage on the property that has priority in the event of a distressed sale. These lenders considered residential property as a ‘secondary’ form of security, and had a preference for ‘primary’ forms of security, such as a mortgage over the assets of the small business itself.
The cost of loan origination can also potentially be reduced if the borrower provides collateral. Over the past decade or so, there has been a shift towards using automated tools in assessing lending applications to keep down origination costs; this is particularly the case at the major banks, which are allowed to manage the credit risk on their exposures to small businesses on a pooled basis where each exposure is less than $1 million (APRA 2008). These automated tools typically assess whether the borrower passes a set of tests based on characteristics such as business age, industry, debt serviceability, credit history and collateral. If the borrower fails one of these tests, then the application goes to a credit officer for manual assessment. On this basis, applications for unsecured borrowing typically require more manual assessment to determine whether there is sufficient evidence on loan serviceability.
2.1.3 Comparing liaison with survey evidence and aggregate lending data
The role of housing collateral in small business lending as described in the interviews appears to be broadly consistent with survey evidence and aggregate data on the distribution of lending. The Household, Income and Labour Dynamics in Australia (HILDA) Survey provides detailed data on household income and balance sheets, including for around 1 000 households that own small businesses.6 When these business-owning households are broken into quintiles based on average business income over the preceding three years, there is a positive relationship between business income and the proportion that owe business debt (Figure 1, top panel). This would be consistent with lenders requiring evidence of capacity to repay debt (particularly past business income) before extending business lending products.
6 For more details on the HILDA Survey, see Section 3.1 below.
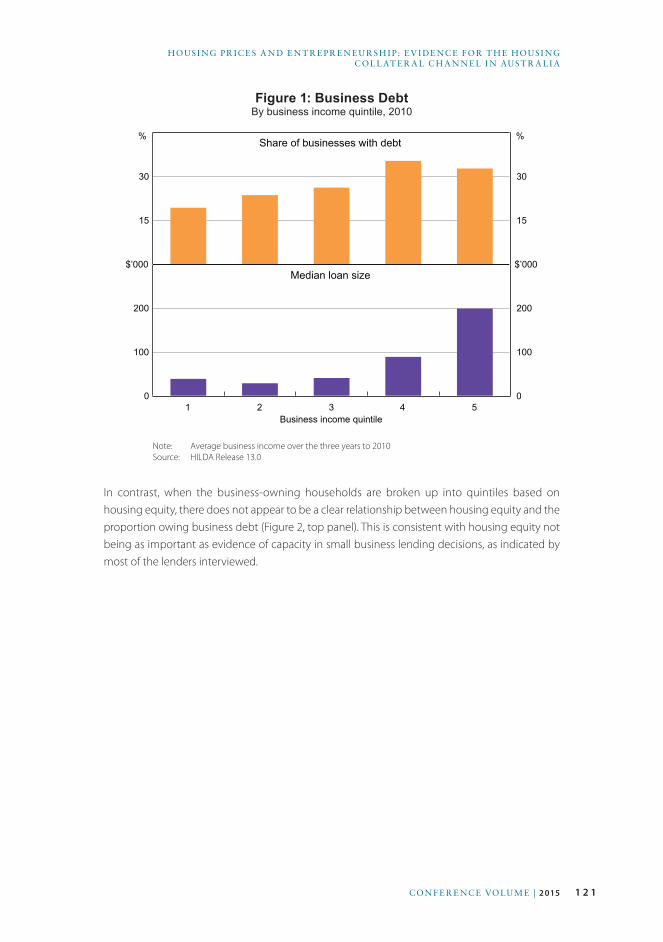
1 2 1CON F E R E NC E VOLU M E | 2 015
HOUSI NG PR IC E S A N D E N T R E PR E N EU R SH I P: EV I DE NC E FOR T H E HOUSI NG COL L AT E R A L C H A N N E L I N AUST R A L I A
Figure 1: Business DebtBy business income quintile, 2010
15
30
15
30
%Share of businesses with debt
1 2 3 4 50
100
200
0
100
200
Business income quintile
$’000
%
$’000Median loan size
Note: Average business income over the three years to 2010 Source: HILDA Release 13.0
In contrast, when the business-owning households are broken up into quintiles based on housing equity, there does not appear to be a clear relationship between housing equity and the proportion owing business debt (Figure 2, top panel). This is consistent with housing equity not being as important as evidence of capacity in small business lending decisions, as indicated by most of the lenders interviewed.
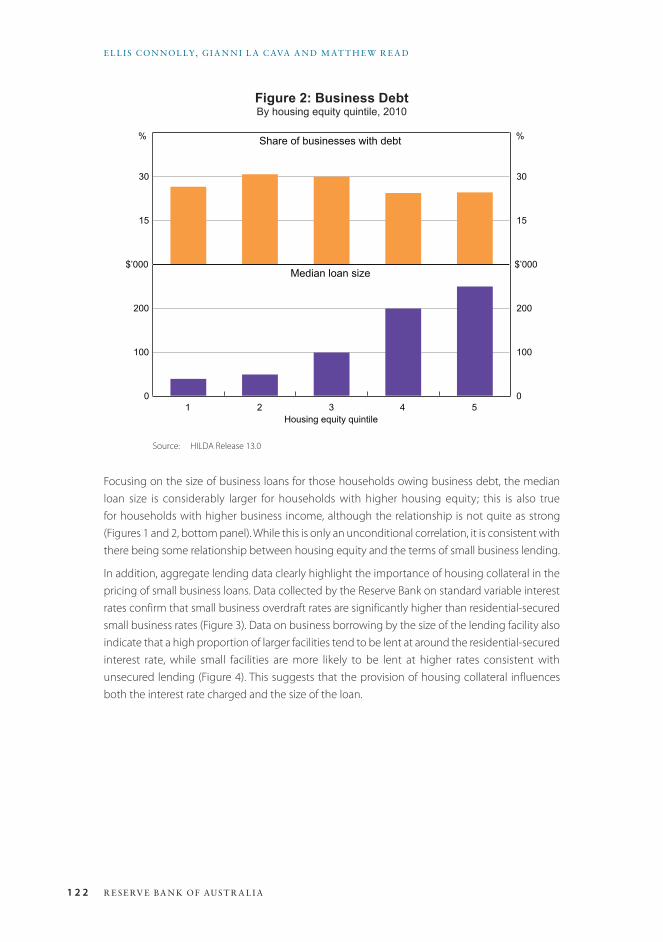
1 2 2 R E SE RV E BA N K OF AUST R A L I A
E L L IS CON NOL LY, G I A N N I L A C AVA A N D M AT T H EW R E A D
Figure 2: Business DebtBy housing equity quintile, 2010
15
30
15
30
%Share of businesses with debt
1 2 3 4 50
100
200
0
100
200
Housing equity quintile
$’000
%
$’000Median loan size
Source: HILDA Release 13.0
Focusing on the size of business loans for those households owing business debt, the median loan size is considerably larger for households with higher housing equity; this is also true for households with higher business income, although the relationship is not quite as strong (Figures 1 and 2, bottom panel). While this is only an unconditional correlation, it is consistent with there being some relationship between housing equity and the terms of small business lending.
In addition, aggregate lending data clearly highlight the importance of housing collateral in the pricing of small business loans. Data collected by the Reserve Bank on standard variable interest rates confirm that small business overdraft rates are significantly higher than residential-secured small business rates (Figure 3). Data on business borrowing by the size of the lending facility also indicate that a high proportion of larger facilities tend to be lent at around the residential-secured interest rate, while small facilities are more likely to be lent at higher rates consistent with unsecured lending (Figure 4). This suggests that the provision of housing collateral influences both the interest rate charged and the size of the loan.
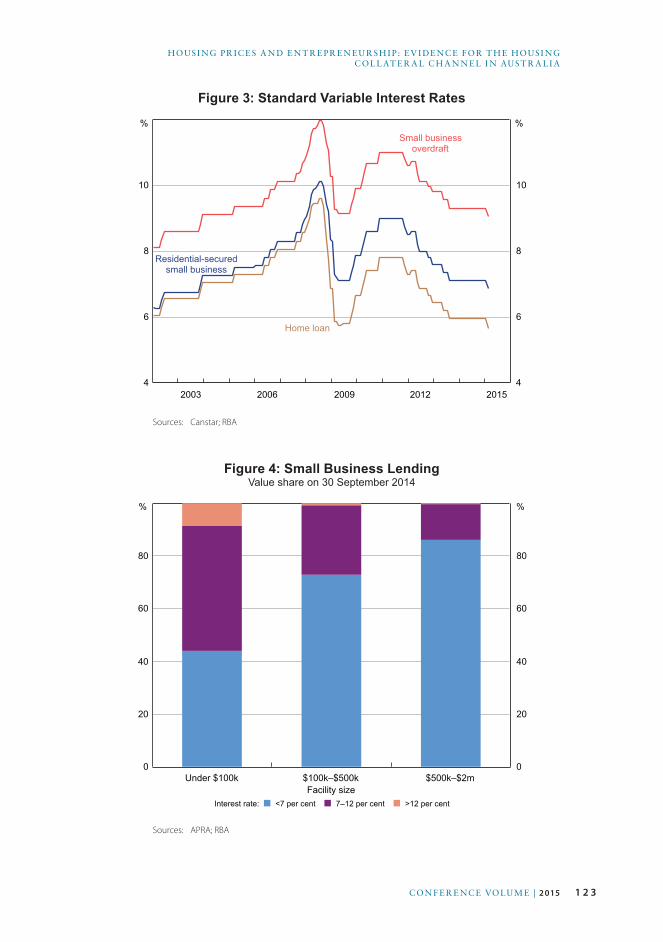
1 2 3CON F E R E NC E VOLU M E | 2 015
HOUSI NG PR IC E S A N D E N T R E PR E N EU R SH I P: EV I DE NC E FOR T H E HOUSI NG COL L AT E R A L C H A N N E L I N AUST R A L I A
Figure 3: Standard Variable Interest Rates
4
6
8
10
4
6
8
10
%Small business
overdraft
2015
%
Residential-securedsmall business
Home loan
2012200920062003
Sources: Canstar; RBA
Figure 4: Small Business LendingValue share on 30 September 2014
Under $100k $100k–$500k $500k–$2m0
20
40
60
80
0
20
40
60
80
Facility size
%
Interest rate: ■ <7 per cent ■ 7–12 per cent ■ >12 per cent
%
Sources: APRA; RBA
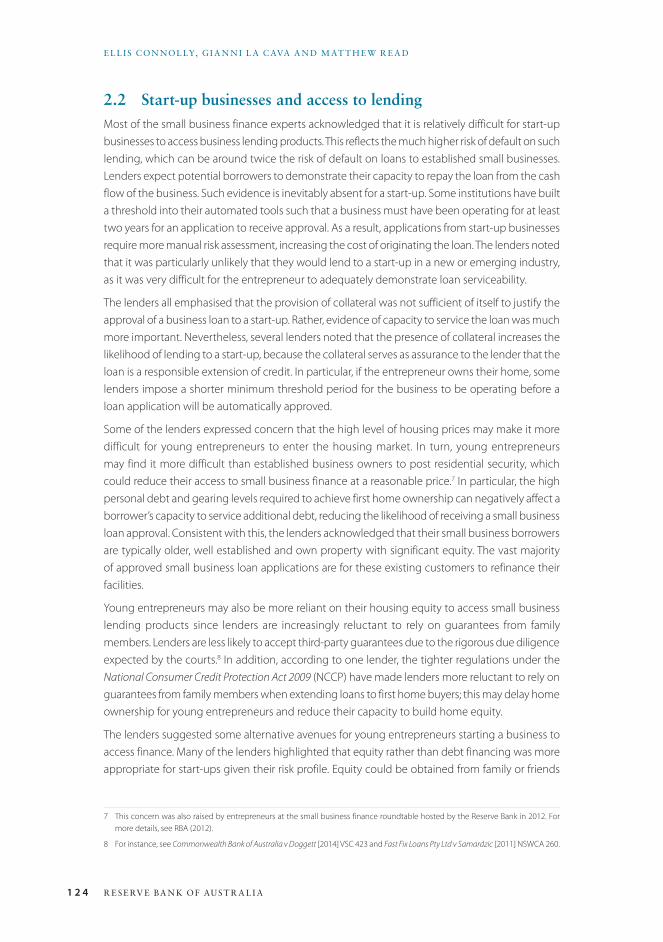
1 2 4 R E SE RV E BA N K OF AUST R A L I A
E L L IS CON NOL LY, G I A N N I L A C AVA A N D M AT T H EW R E A D
2.2 Start-up businesses and access to lendingMost of the small business finance experts acknowledged that it is relatively difficult for start-up businesses to access business lending products. This reflects the much higher risk of default on such lending, which can be around twice the risk of default on loans to established small businesses. Lenders expect potential borrowers to demonstrate their capacity to repay the loan from the cash flow of the business. Such evidence is inevitably absent for a start-up. Some institutions have built a threshold into their automated tools such that a business must have been operating for at least two years for an application to receive approval. As a result, applications from start-up businesses require more manual risk assessment, increasing the cost of originating the loan. The lenders noted that it was particularly unlikely that they would lend to a start-up in a new or emerging industry, as it was very difficult for the entrepreneur to adequately demonstrate loan serviceability.
The lenders all emphasised that the provision of collateral was not sufficient of itself to justify the approval of a business loan to a start-up. Rather, evidence of capacity to service the loan was much more important. Nevertheless, several lenders noted that the presence of collateral increases the likelihood of lending to a start-up, because the collateral serves as assurance to the lender that the loan is a responsible extension of credit. In particular, if the entrepreneur owns their home, some lenders impose a shorter minimum threshold period for the business to be operating before a loan application will be automatically approved.
Some of the lenders expressed concern that the high level of housing prices may make it more difficult for young entrepreneurs to enter the housing market. In turn, young entrepreneurs may find it more difficult than established business owners to post residential security, which could reduce their access to small business finance at a reasonable price.7 In particular, the high personal debt and gearing levels required to achieve first home ownership can negatively affect a borrower’s capacity to service additional debt, reducing the likelihood of receiving a small business loan approval. Consistent with this, the lenders acknowledged that their small business borrowers are typically older, well established and own property with significant equity. The vast majority of approved small business loan applications are for these existing customers to refinance their facilities.
Young entrepreneurs may also be more reliant on their housing equity to access small business lending products since lenders are increasingly reluctant to rely on guarantees from family members. Lenders are less likely to accept third-party guarantees due to the rigorous due diligence expected by the courts.8 In addition, according to one lender, the tighter regulations under the National Consumer Credit Protection Act 2009 (NCCP) have made lenders more reluctant to rely on guarantees from family members when extending loans to first home buyers; this may delay home ownership for young entrepreneurs and reduce their capacity to build home equity.
The lenders suggested some alternative avenues for young entrepreneurs starting a business to access finance. Many of the lenders highlighted that equity rather than debt financing was more appropriate for start-ups given their risk profile. Equity could be obtained from family or friends
7 This concern was also raised by entrepreneurs at the small business finance roundtable hosted by the Reserve Bank in 2012. For more details, see RBA (2012).
8 For instance, see Commonwealth Bank of Australia v Doggett [2014] VSC 423 and Fast Fix Loans Pty Ltd v Samardzic [2011] NSWCA 260.
1 2 5CON F E R E NC E VOLU M E | 2 015
HOUSI NG PR IC E S A N D E N T R E PR E N EU R SH I P: EV I DE NC E FOR T H E HOUSI NG COL L AT E R A L C H A N N E L I N AUST R A L I A
through equity partnerships (as an alternative to debt guarantees), or through emerging channels such as small-scale venture capital or crowdfunding.
Where young entrepreneurs are seeking small business lending, lenders suggested that they start by opening a transaction account with the lending institution. This can be used to build up a transaction history as evidence of their capacity to service debt. Over time, the entrepreneur could migrate to more attractively priced lending products, such as equipment leasing and eventually term loans.
2.3 The use of home loans for business purposesThe use of home loan funds for business purposes is a separate channel through which housing collateral could influence entrepreneurship. The lenders widely acknowledged the intertwined nature of the entrepreneur’s business and personal finances, particularly for sole traders and family businesses. In response to this, the lenders actively seek to analyse the finances of their small business customers on a consolidated basis, including their personal finances. Some lenders speculated that a share of their home loans to self-employed borrowers, and home equity loans for ‘investment purposes’, could be used in part to finance small businesses.
The distinction between borrowing for business purposes and personal purposes has been made clearer since the introduction of the NCCP. Financial institutions are effectively required to separately identify lending for personal as opposed to small business purposes, given the additional consumer protections that apply to personal lending. The lenders implement this by asking customers the purpose of the loan when they make a loan application or seek a redraw on a home loan. However, once a borrower has indicated that a loan is for a non-business purpose and the funds have been lent, it is not feasible for lenders to determine the extent to which the funds are used for business purposes. This is particularly the case for products such as home loans with offset accounts, because borrowers can draw funds by running down the offset account balance without being required to indicate the purpose.
The HILDA Survey highlights the widespread use of personal lending products by households that own small businesses, particularly start-ups (Table 1). These households were more likely than employee households in 2010 to owe residential-secured debt, particularly in the form of second mortgages, or property investor debt. Focusing on households owning young businesses (those owned in 2010 but not in 2006), these households were somewhat less likely than other business-owning households to owe business debt, and just as likely to owe home debt or credit card debt. This could be consistent with these households finding it harder to raise business debt and instead relying on personal lending products to fund their young business.

1 2 6 R E SE RV E BA N K OF AUST R A L I A
E L L IS CON NOL LY, G I A N N I L A C AVA A N D M AT T H EW R E A D
Table 1: Household DebtPer cent of households with a particular form of debt obligation in 2010
Employee households
Business- owning
households
Householdsowning a young
business(a)
Business debt 0 27 21
Home debt 44 51 53
Of which: second mortgages 6 11 8
Property investor debt 12 18 17
Credit card debt 33 36 38
Any debt 82 85 87
Note: (a) Households owning a business in 2010 that did not own a business in 2006 Sources: Authors’ calculations; HILDA Release 13.0
Many of the lenders suggested that the widespread use of personal lending products by entrepreneurs may be due to a lack of awareness of small business lending products and the tax benefits they can provide. One of the key financial benefits of small business lending products relative to personal loans is the capacity to deduct the interest paid from the small business’ tax liability. However, the benefit of interest deductibility is only relevant for small businesses that actually have a tax liability. Data from the Australian Taxation Office (ATO) indicate that in 2011/12, only 44 per cent of micro businesses and 69 per cent of small businesses paid tax. Start-up businesses in particular may take some time to become profitable, largely negating the benefit of interest deductibility.
A final reason why entrepreneurs may prefer to draw on their home loan is that the interest rate tends to be lower than for residential-secured business loans. Data collected by the Reserve Bank on standard variable interest rates suggest that residential-secured small business rates are typically around 1 percentage point higher than home loan rates (Figure 3). The lenders indicated that residential-secured small business loan portfolios have historically experienced higher losses than home loan portfolios. Given this, lenders are required to hold more capital against residential-secured small business loans than home loans, and accordingly charge higher interest rates. Lenders also noted that the home loans of small business borrowers tend to be riskier than for other borrowers; small business borrowers pay their home loans at a slower rate, maintaining a high rate of gearing for a longer period, with the funds potentially being used to finance the business.9
9 Lenders noted that there is an element of cross-subsidisation inherent in the home loan portfolio that actually favours small business borrowers, given that there is little differentiation between the interest rates charged on home loans to small business entrepreneurs compared with other households.
1 2 7CON F E R E NC E VOLU M E | 2 015
HOUSI NG PR IC E S A N D E N T R E PR E N EU R SH I P: EV I DE NC E FOR T H E HOUSI NG COL L AT E R A L C H A N N E L I N AUST R A L I A
3. Evidence from Household Survey DataWe now examine the evidence for a housing collateral channel from the ‘borrower’s perspective’. We investigate the relationships between housing equity and several facets of entrepreneurial activity using household survey data. More specifically, we explore the effect of housing equity on: (1) business formation; (2) the use of business debt by new entrepreneurs; and (3) employment by new entrepreneurs.
Previous studies have typically examined the relationship between changes in housing prices and business formation rates (or other facets of entrepreneurial activity), and have interpreted a positive correlation as indirect evidence of a housing collateral channel (see, for example, Adelino et al (2013) and Schmalz et al (2013)). However, these studies have lacked data on entrepreneurs’ balance sheets, and so have been unable to provide direct evidence for the existence of such a channel. Instead, the correlation between housing price growth and business formation could reflect wealth effects, where the probability of starting a business is a function of wealth for reasons other than housing wealth facilitating access to finance. Furthermore, the existence of a housing collateral channel implies that entrepreneurs actually use their housing collateral to access business finance, but previous studies have been unable to demonstrate this. In contrast, the HILDA Survey provides data on both sides of household balance sheets. These data allow us to directly examine the relationship between housing equity and entrepreneurial activity, including new entrepreneurs’ use of business loans. Importantly, we are also able to provide evidence that business formation responds to changes in housing wealth but not changes in other types of wealth, which suggests that we are identifying a housing collateral channel rather than wealth effects. Finally, the HILDA Survey data provide a rich set of control variables that are likely to be correlated with housing equity and entrepreneurial activity, such as age, education and income.
3.1 DataUsing person-level data from the HILDA Survey – an annual household-based longitudinal study – we identify entrepreneurs in each year from 2001 to 2013. An individual is classified as being an entrepreneur if they reported working in their own business in the week before the survey. On average over the sample period, around 10 per cent of individuals over the age of 15 years owned a business.10 Of these entrepreneurs, over 90 per cent operated a ‘small’ business (i.e. with fewer than 20 employees) and around 60 per cent were sole traders (Figure 5).
10 For comparison, ABS data indicate that around 6 per cent of individuals aged over 15 years owned their own business in 2013.

1 2 8 R E SE RV E BA N K OF AUST R A L I A
E L L IS CON NOL LY, G I A N N I L A C AVA A N D M AT T H EW R E A D
Figure 5: Number of Workers EmployedShare of entrepreneurs
2001 2004 2007 2010 20130
20
40
60
80
0
20
40
60
80
%
■ Sole trader ■ 2–19 ■ 20+
%
Sources: Authors’ calculations; HILDA Release 13.0
3.2 Econometric analysis
3.2.1 Business formation
A positive relationship between housing equity and business formation could provide evidence of a housing collateral channel. We identify an individual as starting a business if they transitioned into entrepreneurship between two consecutive surveys and were not identified as previously owning a business. The purpose of excluding previous business owners is to avoid a potential source of measurement error, which could be correlated with housing equity: some business owners appear to repeatedly transition into and out of self-employment.11 On average over the sample period, around 1½ per cent of respondents started a business in the following year.
We employ probit models to quantify the effect of housing equity on the probability of business formation. The models are specified as follows:
Pr yigt =1HEi ,t−1, x i ,t−1( )=Φ β1HEi ,t−1+γx i ,t−1+δg+ωt( ) (1)
where yigt is an indicator variable that is equal to one if individual i living in region g started a business between surveys t – 1 and t, and Φ(.) is the standard normal cumulative distribution function. xi,t – 1 is a vector of control variables measured at the time of the previous survey, including whether
11 These individuals possibly work multiple jobs and alternate between reporting their own business and another (employee) job as their primary job. Including previous business owners results in housing equity having a larger estimated marginal effect on the probability of business formation.
1 2 9CON F E R E NC E VOLU M E | 2 015
HOUSI NG PR IC E S A N D E N T R E PR E N EU R SH I P: EV I DE NC E FOR T H E HOUSI NG COL L AT E R A L C H A N N E L I N AUST R A L I A
the individual owned property, educational attainment, labour force status, sex and self-assessed financial risk appetite.12 Quadratic polynomials in the individual’s age and disposable income are also included. The models include region fixed effects (δg), which control for the possibility that some regions tend to have higher business formation rates for reasons unrelated to the housing collateral channel, but which may be associated with housing equity; for example, persistent local demand shocks may increase business formation and also drive up housing prices.13 The models also include time fixed effects (ωt), which control for factors such as the aggregate business cycle. The models are estimated using maximum likelihood, with standard errors clustered by individual.
Because the coefficients have limited economic relevance, we present average marginal effects of a change in the explanatory variables on the probability of business formation.14
We use two measures of the individual’s housing equity at the time of the previous survey (HEi,t – 1) – the key variable of interest in the models. In Model 1, home equity is the difference between the individual’s self-assessed home value and the value of outstanding loans secured against the property, including mortgages taken out to purchase the home and second mortgages, such as home equity loans. In Model 2, total housing equity is the same as home equity but also includes equity in other residential property, such as investment property and holiday homes. Data on home equity are available each year; data on the broader measure of total housing equity are available only every four years in the survey’s ‘wealth modules’.
The results from Model 1 indicate that the probability of starting a business is significantly positively correlated with the dollar value of home equity, which is consistent with the existence of a housing collateral channel. A $100 000 increase in the value of home equity is associated with the probability of starting a business increasing by about 0.07 percentage points (Table 2). An increase in home equity from the 25th percentile of the 2013 distribution of home equity ($0) to the 75th percentile ($450 000) is associated with the probability of starting a business increasing by about 0.3 percentage points. While this effect may seem relatively small, it is nontrivial relative to the unconditional probability of starting a business (about 1½ per cent).
12 The financial risk appetite variable is not available in 2005, 2007 and 2009. For these years, financial risk appetite is imputed using responses (where available) from the neighbouring surveys.
13 The region fixed effects are at the Statistical Division (SD) level. The SD is an Australian Standard Geographical Classification area, of which there are around 60. The results are similar when using a linear probability model and region-time fixed effects, which should be better able to control for transitory local demand shocks. We were not able to estimate a probit version of this model because of issues relating to numerical estimation caused by the very large number of dummy variables representing the fixed effects.
14 Average marginal effects use the observed values of the covariates in the sample to calculate marginal effects for each individual. These are averaged over the sample to yield average marginal effects. For discussions of this approach to calculating marginal effects, see Wooldridge (2010) and Greene (2012).
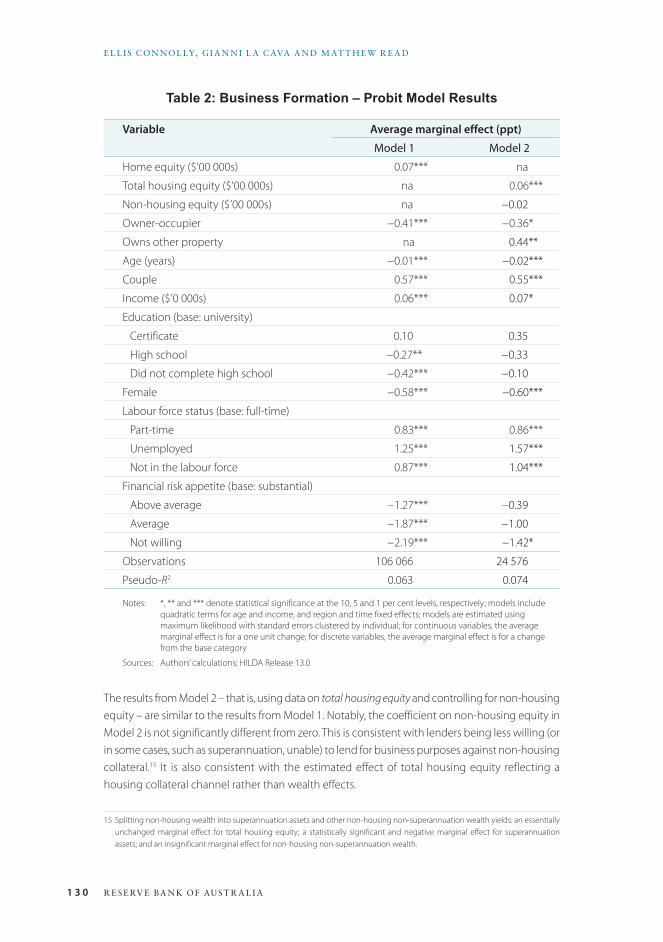
1 3 0 R E SE RV E BA N K OF AUST R A L I A
E L L IS CON NOL LY, G I A N N I L A C AVA A N D M AT T H EW R E A D
Table 2: Business Formation – Probit Model Results
Variable Average marginal effect (ppt)
Model 1 Model 2
Home equity ($’00 000s) 0.07*** na
Total housing equity ($’00 000s) na 0.06***
Non-housing equity ($’00 000s) na −0.02
Owner-occupier −0.41*** −0.36*
Owns other property na 0.44**
Age (years) −0.01*** −0.02***
Couple 0.57*** 0.55***
Income ($’0 000s) 0.06*** 0.07*
Education (base: university)
Certificate 0.10 0.35
High school −0.27** −0.33
Did not complete high school −0.42*** −0.10
Female −0.58*** −0.60***
Labour force status (base: full-time)
Part-time 0.83*** 0.86***
Unemployed 1.25*** 1.57***
Not in the labour force 0.87*** 1.04***
Financial risk appetite (base: substantial)
Above average −1.27*** −0.39
Average −1.87*** −1.00
Not willing −2.19*** −1.42*
Observations 106 066 24 576
Pseudo-R2 0.063 0.074
Notes: *, ** and *** denote statistical significance at the 10, 5 and 1 per cent levels, respectively; models include quadratic terms for age and income, and region and time fixed effects; models are estimated using maximum likelihood with standard errors clustered by individual; for continuous variables, the average marginal effect is for a one unit change; for discrete variables, the average marginal effect is for a change from the base category
Sources: Authors’ calculations; HILDA Release 13.0
The results from Model 2 – that is, using data on total housing equity and controlling for non-housing equity – are similar to the results from Model 1. Notably, the coefficient on non-housing equity in Model 2 is not significantly different from zero. This is consistent with lenders being less willing (or in some cases, such as superannuation, unable) to lend for business purposes against non-housing collateral.15 It is also consistent with the estimated effect of total housing equity reflecting a housing collateral channel rather than wealth effects.
15 Splitting non-housing wealth into superannuation assets and other non-housing non-superannuation wealth yields: an essentially unchanged marginal effect for total housing equity; a statistically significant and negative marginal effect for superannuation assets; and an insignificant marginal effect for non-housing non-superannuation wealth.

1 3 1CON F E R E NC E VOLU M E | 2 015
HOUSI NG PR IC E S A N D E N T R E PR E N EU R SH I P: EV I DE NC E FOR T H E HOUSI NG COL L AT E R A L C H A N N E L I N AUST R A L I A
Nevertheless, the estimated correlation between housing equity and the probability of starting a business could, to some extent, reflect factors other than a housing collateral channel. For example, Hurst and Lusardi (2004) argue that business ownership is a luxury good, which implies that households with more housing equity are more likely to start a business because they are wealthier.16 However, if this is the case, it is unclear why non-housing equity is an insignificant predictor of business formation. One possible explanation is that individuals have better information about the value of their housing wealth relative to other types of wealth, such as superannuation. More generally, there could be common unobserved factors that drive both housing equity and the probability of starting a business. For instance, less entrepreneurial individuals may prefer to pay their mortgage down rather than use savings to finance their own business; this would tend to attenuate the correlation between housing equity and entrepreneurship even if a housing collateral channel does, in fact, exist.
A number of the control variables are statistically significant in both models. For example, the probability of starting a business is: lower for owner-occupiers than for renters; lower for females than for males; higher for couples than for other individuals; and lower for full-time workers than for other individuals. Additionally, individuals that are less willing to take financial risk are less likely to start a business.
3.2.2 Business debt
The preceding analysis found a positive correlation between housing equity and the probability of starting a business. However, the existence of a housing collateral channel implies that new entrepreneurs actually make use of their housing equity to access finance. To explore this, we investigate how the use of business debt by new entrepreneurs – that is, individuals identified as having started a business – varies with home equity.
Using the sample of new entrepreneurs, we estimate a Tobit model where the dependent variable is business debt (dit ) in thousands of dollars.17 We use a Tobit model because around 80 per cent of new entrepreneurs reported having no business debt (i.e. there is a point mass at zero). Under the Tobit framework, a latent variable dit
∗ determines whether individual i has business debt and the value of business debt conditional on having debt:
dit∗=β1HEi ,t−1+γx i ,t−1+ϕz it+εit ,εit ~N 0,σ2( ),
dit =dit∗ if dit
∗>0
0 if dit∗ ≤0
⎧⎨⎪⎪
⎩⎪⎪.
(2)
Independent variables in the model include: home equity (HEi,t – 1); controls measured at the time of the previous survey (xi,t – 1); and characteristics of the business measured contemporaneously with business debt (zit ), such as industry and incorporation status.
16 To test whether the effect of housing equity on business formation differs across the wealth distribution, we estimated a version of Model 2 where housing equity is interacted with a set of dummy variables representing the quintiles of total household wealth. There were no significant differences between the coefficients on the interaction terms, suggesting that the response of business formation to housing equity does not vary over the wealth distribution.
17 The sample is restricted to new entrepreneurs in 2002, 2006 and 2010 because data on business debt are only collected in the wealth modules. Note that inferences based on models estimated using the sample of new entrepreneurs are conditional on selection into that sample. Future work could potentially consider the effect of sample selection on the results.

1 3 2 R E SE RV E BA N K OF AUST R A L I A
E L L IS CON NOL LY, G I A N N I L A C AVA A N D M AT T H EW R E A D
The coefficients in the model give the effects of a unit change in the explanatory variables on the latent variable dit
∗. The latent variable has limited economic relevance. Therefore, we also present the average marginal effect of a change in the explanatory variables on dit conditional on business debt being positive (i.e. the effect on E(dit|dit > 0)).
Estimates from the Tobit model show a statistically significant positive relationship between home equity in the year before starting a business and the value of business debt at formation (Table 3). The estimated average marginal effect indicates that a $100 000 increase in home equity is associated with business debt being about $5 000 higher. This is consistent with housing collateral facilitating access to business finance, although the effect does not appear large. The relatively small effect could be because it is difficult to obtain a small business loan in the first year after formation, regardless of the value of housing collateral. Indeed, liaison with lenders (discussed in Section 2) suggests that they are unwilling to lend to start-ups.18
A number of control variables also have significant correlations with the use of business debt. Notably, of new entrepreneurs with business debt, unincorporated businesses have, on average, around $25 000 less business debt than incorporated businesses.19 The use of business debt also tends to be higher for individuals that are willing to take more risk. Additionally, new entrepreneurs in the construction, business services or household services industries tend to have lower levels of business debt relative to new entrepreneurs in the agriculture industry.
18 Rather than taking out a business loan, new entrepreneurs may finance their business by directly drawing down on housing equity using housing-related lending products, such as home equity loans. A linear regression of the change in housing debt between consecutive surveys on a dummy variable for whether the individual started a business (and other controls) suggests that the change in housing debt is, on average, about $5 000 larger for new entrepreneurs than for other individuals, although the difference is not significant.
19 This may be a measurement issue, since an unincorporated business is intrinsically more intertwined with the personal finances of the entrepreneur than an incorporated business.

1 3 3CON F E R E NC E VOLU M E | 2 015
HOUSI NG PR IC E S A N D E N T R E PR E N EU R SH I P: EV I DE NC E FOR T H E HOUSI NG COL L AT E R A L C H A N N E L I N AUST R A L I A
Table 3: Use of Business Debt by New Entrepreneurs – Tobit Model Results
Variable Coefficient Average marginal effect on
E(dit|dit > 0)$’000s
Home equity ($’00 000s) 0.24*** 0.05***
Owns home −71.05 −14.48
Age (years) 11.85 0.22
Age squared −0.13
Income ($’000s) −3.25*** −0.49***
Income squared 7.80 × 10⁻³**
Unincorporated −119.60*** −24.81**
Labour force status (base: full-time)
Part-time −42.66 −8.90
Unemployed −104.84 −18.99
Not in the labour force −151.19*** −24.64***
Financial risk appetite (base: substantial)
Above average −204.38** −60.34**
Average −212.74*** −61.86**
Not willing −231.63*** −65.07**
Industry (base: agriculture)
Business services −191.91** −56.83*
Construction −211.92** −60.44**
Distribution −127.07 −42.42
Household services −304.45*** −72.98*
Manufacturing −125.22 −41.94
Constant 136.29
Observations 418
Of which: left-censored (i.e. zero) 335
Pseudo-R2 0.05
Notes: *, ** and *** denote statistical significance at the 10, 5 and 1 per cent levels, respectively; model estimated using maximum likelihood; for continuous variables, the average marginal effect is for a one unit change; for discrete variables, the average marginal effect is for a change from the base category
Sources: Authors’ calculations; HILDA Release 13.0
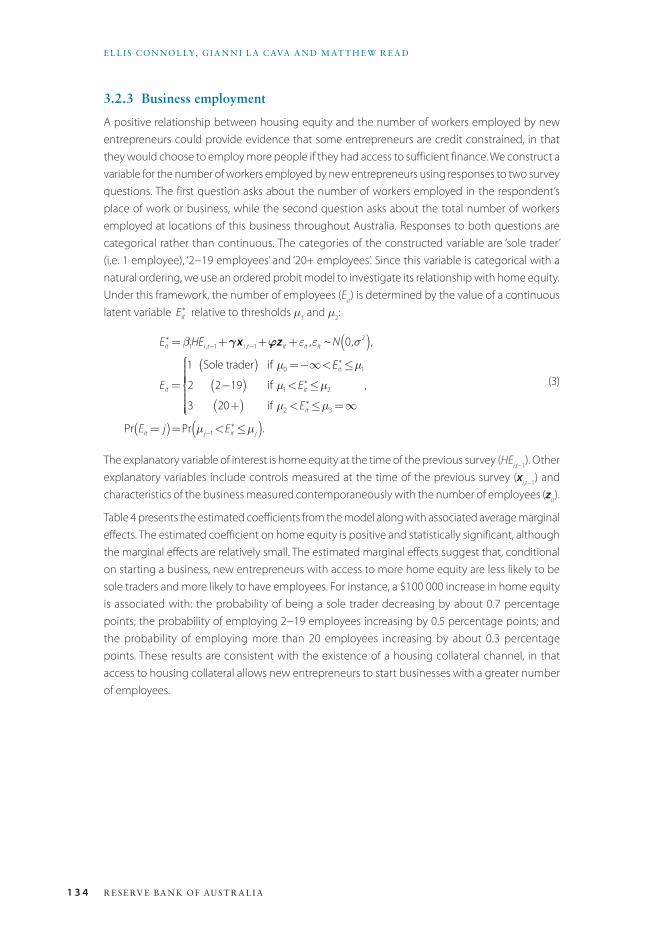
1 3 4 R E SE RV E BA N K OF AUST R A L I A
E L L IS CON NOL LY, G I A N N I L A C AVA A N D M AT T H EW R E A D
3.2.3 Business employment
A positive relationship between housing equity and the number of workers employed by new entrepreneurs could provide evidence that some entrepreneurs are credit constrained, in that they would choose to employ more people if they had access to sufficient finance. We construct a variable for the number of workers employed by new entrepreneurs using responses to two survey questions. The first question asks about the number of workers employed in the respondent’s place of work or business, while the second question asks about the total number of workers employed at locations of this business throughout Australia. Responses to both questions are categorical rather than continuous. The categories of the constructed variable are ‘sole trader’ (i.e. 1 employee), ‘2−19 employees’ and ‘20+ employees’. Since this variable is categorical with a natural ordering, we use an ordered probit model to investigate its relationship with home equity. Under this framework, the number of employees (Eit ) is determined by the value of a continuous latent variable Eit
∗ relative to thresholds μ1 and μ2:
Eit∗=β1HEi ,t−1+γx i ,t−1+ϕz it+εit ,εit ~N 0,σ2( ),
Eit =
1 Sole trader( ) if µ0=−∞<Eit∗ ≤µ1
2 2−19( ) if µ1<Eit∗ ≤µ2
3 20+( ) if µ2<Eit∗ ≤µ3=∞
⎧
⎨
⎪⎪⎪⎪⎪
⎩⎪⎪⎪⎪⎪
,
Pr Eit = j( )=Pr µ j−1<Eit∗ ≤µ j( ).
(3)
The explanatory variable of interest is home equity at the time of the previous survey (HEi,t – 1). Other explanatory variables include controls measured at the time of the previous survey (xi,t – 1) and characteristics of the business measured contemporaneously with the number of employees (zit ).
Table 4 presents the estimated coefficients from the model along with associated average marginal effects. The estimated coefficient on home equity is positive and statistically significant, although the marginal effects are relatively small. The estimated marginal effects suggest that, conditional on starting a business, new entrepreneurs with access to more home equity are less likely to be sole traders and more likely to have employees. For instance, a $100 000 increase in home equity is associated with: the probability of being a sole trader decreasing by about 0.7 percentage points; the probability of employing 2−19 employees increasing by 0.5 percentage points; and the probability of employing more than 20 employees increasing by about 0.3 percentage points. These results are consistent with the existence of a housing collateral channel, in that access to housing collateral allows new entrepreneurs to start businesses with a greater number of employees.
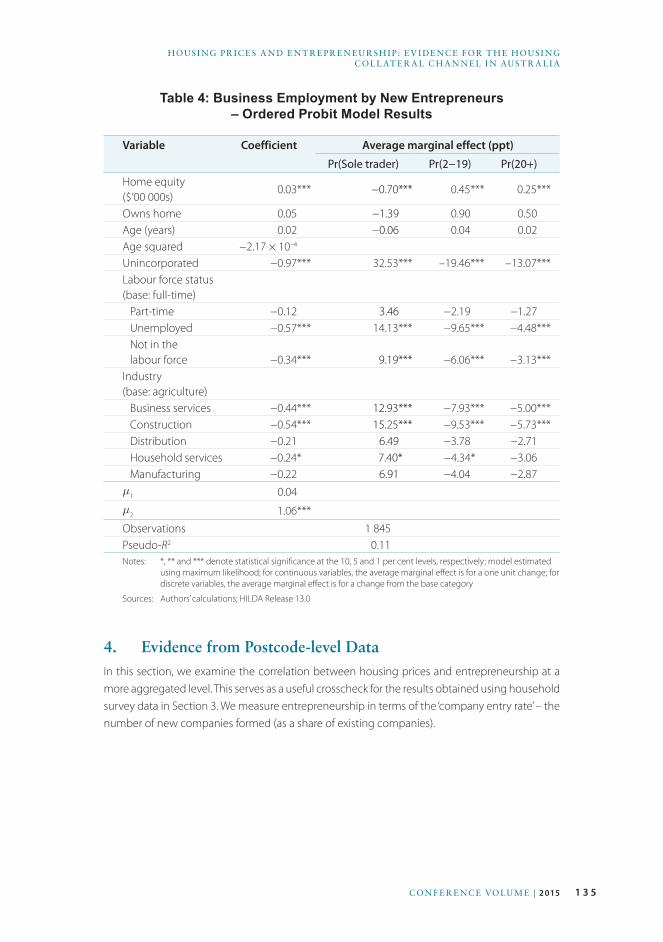
1 3 5CON F E R E NC E VOLU M E | 2 015
HOUSI NG PR IC E S A N D E N T R E PR E N EU R SH I P: EV I DE NC E FOR T H E HOUSI NG COL L AT E R A L C H A N N E L I N AUST R A L I A
Table 4: Business Employment by New Entrepreneurs – Ordered Probit Model Results
Variable Coefficient Average marginal effect (ppt)
Pr(Sole trader) Pr(2−19) Pr(20+)Home equity ($’00 000s)
0.03*** −0.70*** 0.45*** 0.25***
Owns home 0.05 −1.39 0.90 0.50Age (years) 0.02 −0.06 0.04 0.02Age squared −2.17 × 10⁻⁴
Unincorporated −0.97*** 32.53*** –19.46*** –13.07***Labour force status (base: full-time)
Part-time −0.12 3.46 −2.19 −1.27Unemployed −0.57*** 14.13*** −9.65*** −4.48***Not in the labour force −0.34*** 9.19*** −6.06*** −3.13***
Industry (base: agriculture)
Business services −0.44*** 12.93*** −7.93*** −5.00***Construction −0.54*** 15.25*** −9.53*** −5.73***Distribution −0.21 6.49 −3.78 −2.71Household services −0.24* 7.40* −4.34* −3.06Manufacturing −0.22 6.91 −4.04 −2.87μ1 0.04μ2 1.06***Observations 1 845Pseudo-R2 0.11Notes: *, ** and *** denote statistical significance at the 10, 5 and 1 per cent levels, respectively; model estimated
using maximum likelihood; for continuous variables, the average marginal effect is for a one unit change; for discrete variables, the average marginal effect is for a change from the base category
Sources: Authors’ calculations; HILDA Release 13.0
4. Evidence from Postcode-level DataIn this section, we examine the correlation between housing prices and entrepreneurship at a more aggregated level. This serves as a useful crosscheck for the results obtained using household survey data in Section 3. We measure entrepreneurship in terms of the ‘company entry rate’ – the number of new companies formed (as a share of existing companies).

1 3 6 R E SE RV E BA N K OF AUST R A L I A
E L L IS CON NOL LY, G I A N N I L A C AVA A N D M AT T H EW R E A D
As a first pass, there is a reasonably strong positive correlation between housing price growth and the company entry rate across states and time (Figure 6).20
Figure 6: New Companies and Housing Prices by State
●
●
●●
●
●
●
●
●
●
●
●
●
●
●
●●
●
●
●
●
●
●
●
●
●●●
●
●●
●
●
●
●
●
●
●
●●●●●
●
●
●●●●●
●
●
●●
●
●
●
●
●
●●
●
●
●
●
●●
●●
●
●
●●
●
●●●
●
●●
●
●
●
●●
●
●
●
●●
●
●●
●
●
●
●●
●
●
●
●
●
●
●
●
-2
-1
0
1
2
-15 -10 -5 0 5 10 15
Com
pany
ent
ry ra
te (r
elat
ive
to m
ean)
– %
Housing price growth – %
Entry rate = 0.06 * housing price growthR 2 = 0.26
Note: Conditional estimates from a regression that includes state-level GDP growth, as well as state and year fixed effects
Sources: Australian Property Monitors; Australian Securities and Investments Commission; Authors’ calculations
In the remainder of this section, we take this idea further and examine the correlation at the postcode level using a newly constructed dataset that links housing prices and company entry rates. The highly disaggregated nature of the dataset allows us to control for a wide range of factors in examining the link between housing prices and entrepreneurship.
4.1 DataWe construct our postcode-level dataset using monthly information from the Australian Securities and Investments Commission (ASIC) company registry (obtained via Dun and Bradstreet). The registry provides information for each individual company registered in Australia including:
• the name of the company
• the registration date
20 The scatterplot shows the conditional correlation between the entry rate and housing price growth. This is based on a regression of the company entry rate on growth in housing prices and growth in GDP by state and time. The regression also includes state and year fixed effects to control for factors such as state-level business regulations and monetary policy. To draw the figure, we use the Frisch-Waugh theorem and estimate two separate regressions – one of the entry rate on GDP growth, state and year fixed effects and then another of housing price growth on the same control variables. We take the residuals from these two regressions and draw them against each other in the scatterplot.
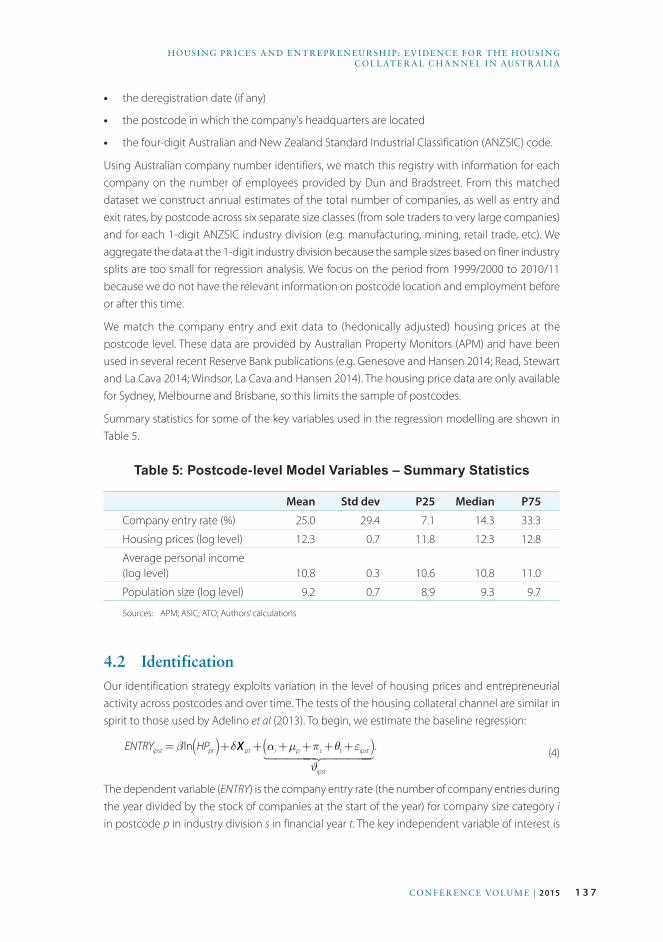
1 3 7CON F E R E NC E VOLU M E | 2 015
HOUSI NG PR IC E S A N D E N T R E PR E N EU R SH I P: EV I DE NC E FOR T H E HOUSI NG COL L AT E R A L C H A N N E L I N AUST R A L I A
• the deregistration date (if any)
• the postcode in which the company’s headquarters are located
• the four-digit Australian and New Zealand Standard Industrial Classification (ANZSIC) code.
Using Australian company number identifiers, we match this registry with information for each company on the number of employees provided by Dun and Bradstreet. From this matched dataset we construct annual estimates of the total number of companies, as well as entry and exit rates, by postcode across six separate size classes (from sole traders to very large companies) and for each 1-digit ANZSIC industry division (e.g. manufacturing, mining, retail trade, etc). We aggregate the data at the 1-digit industry division because the sample sizes based on finer industry splits are too small for regression analysis. We focus on the period from 1999/2000 to 2010/11 because we do not have the relevant information on postcode location and employment before or after this time.
We match the company entry and exit data to (hedonically adjusted) housing prices at the postcode level. These data are provided by Australian Property Monitors (APM) and have been used in several recent Reserve Bank publications (e.g. Genesove and Hansen 2014; Read, Stewart and La Cava 2014; Windsor, La Cava and Hansen 2014). The housing price data are only available for Sydney, Melbourne and Brisbane, so this limits the sample of postcodes.
Summary statistics for some of the key variables used in the regression modelling are shown in Table 5.
Table 5: Postcode-level Model Variables – Summary Statistics
Mean Std dev P25 Median P75
Company entry rate (%) 25.0 29.4 7.1 14.3 33.3
Housing prices (log level) 12.3 0.7 11.8 12.3 12.8
Average personal income (log level) 10.8 0.3 10.6 10.8 11.0
Population size (log level) 9.2 0.7 8.9 9.3 9.7
Sources: APM; ASIC; ATO; Authors’ calculations
4.2 IdentificationOur identification strategy exploits variation in the level of housing prices and entrepreneurial activity across postcodes and over time. The tests of the housing collateral channel are similar in spirit to those used by Adelino et al (2013). To begin, we estimate the baseline regression:
ENTRYipst =β ln HPpt( )+δX pt+ αi+µp+πs+θt+εipst( )ϑipst
! "#### $####.
(4)
The dependent variable (ENTRY) is the company entry rate (the number of company entries during the year divided by the stock of companies at the start of the year) for company size category i in postcode p in industry division s in financial year t. The key independent variable of interest is
1 3 8 R E SE RV E BA N K OF AUST R A L I A
E L L IS CON NOL LY, G I A N N I L A C AVA A N D M AT T H EW R E A D
the log level of housing prices (ln(HP)) for each postcode and year.21 The specification includes a set of control variables (Xpt ) for each postcode and year, such as the average level of personal income and population size. These data are obtained from the ATO. The model also includes several fixed effects:
• Size fixed effects (α) control for time-invariant factors that drive entry decisions for different company size categories (e.g. the fixed costs of starting a company).
• Postcode fixed effects (μ) control for time-invariant factors that might explain company entry rates across different postcodes (e.g. distance from CBD, zoning regulations).
• Industry fixed effects (π) control for time-invariant factors that determine entry rates across different industries (e.g. capital intensity).
• Time fixed effects (θ) control for national cycles in business, housing and financial conditions.
If a housing collateral channel is in force, we expect a positive coefficient on housing prices (β > 0). However, it is not enough to demonstrate a positive correlation between the level of housing prices and the company entry rate to establish a causal link between housing prices and entrepreneurship. Moreover, even if we could establish a causal relationship, higher local housing prices could affect entrepreneurship through mechanisms other than an increase in potential borrowing capacity. First, and as noted in Section 3.2.1, an increase in housing prices will increase the wealth of local home owners, which could encourage them to engage in more risk-taking activities, such as starting a business (‘the wealth channel’). This could be because wealthier individuals are more willing to take risk or because entrepreneurship is a ‘luxury good’ (Hurst and Lusardi 2004).22 Second, the increase in housing wealth could encourage home owners to spend more and the increase in local demand could, in turn, encourage local residents to start businesses (‘the local demand channel’).
To partly address these challenges, we tweak the model to allow housing prices to have differential effects on the entry rates of small and large companies:
ENTRYipst =β ln HPpt( )+γSMALLi ∗ln HPpt( )+δX pt+ϑipst . (5)
Specifically, in addition to the control variables and fixed effects included previously, this model includes a dummy variable (SMALL) that equals one if the company size category is small (less than 20 employees) and zero otherwise.23 More importantly, it also includes an interaction between the dummy variable for small companies and the level of housing prices (SMALL*ln(HP)). If a collateral channel is in force and small companies are more credit constrained than large companies, the coefficient on the interaction term should be positive and significant (γ > 0).
21 We also experimented with the growth rate of housing prices as the key independent variable. None of the key results were affected by this change in model specification.
22 Wealthier individuals can afford to ‘purchase’ the non-pecuniary benefits associated with business ownership, such as decision-making power and flexible time schedules.
23 This dummy variable drops out of the specification because it is perfectly collinear with the size fixed effects, leaving just the interaction dummy variable.
1 3 9CON F E R E NC E VOLU M E | 2 015
HOUSI NG PR IC E S A N D E N T R E PR E N EU R SH I P: EV I DE NC E FOR T H E HOUSI NG COL L AT E R A L C H A N N E L I N AUST R A L I A
Furthermore, if the housing collateral channel exists, the correlation between housing prices and entry rates should be particularly strong for small companies in industries that are typically dependent on housing collateral. To test this, we add further interaction terms to the specification:
ENTRYipst =β ln HPpt( )+γSMALLi ∗ln HPpt( )+ωDEPENDs ∗ln HPpt( )
+ϕDEPENDs ∗SMALLi ∗ln HPpt( )+δX pt+ϑipst . (6)
The model now includes a dummy variable (DEPEND) that equals one if the industry typically relies on housing collateral for start-up capital and zero otherwise. It also includes the interaction with the level of house prices (DEPEND*ln(HP)), as well as the small company indicator dummy and level of house prices (DEPEND*SMALL*ln(HP)).
We define ‘collateral-dependent’ industries as those that have a relatively high share of small businesses dependent on home equity loans for start-up capital. This information comes from publicly available unit-record data in a US Census Bureau survey of small business owners.24 In the survey, small business owners are asked how they originally financed their business (e.g. bank debt, personal guarantee, etc). A loan collateralised by home equity is one of the options for respondents. Respondents are also asked about the industry in which they operate. For each industry, we calculate the share of small business owners that report using a home equity loan for start-up capital. The classification of industries according to the reliance on housing collateral is shown in Figure 7.25 We denote the top five industries as ‘collateral dependent’. These are: accommodation and food services; manufacturing; wholesale trade; retail trade; and rental, hiring and real estate services.26 Admittedly, the choice of industries is ad hoc. Moreover, it is not clear if the industry pattern for the United States necessarily corresponds to the industry pattern for Australia. Nevertheless, we have experimented with different classifications and get very similar results.27
24 Kleiner (2015) uses these data to examine the effect of house price growth on entrepreneurial finance in the United States.
25 Conveniently, the classification of NAICS 1-digit industry divisions is essentially equivalent to the ANZSIC 1-digit industry divisions, which makes it easy to map directly to the Australian data.
26 We also used the US unit-record data to estimate a linear probability model for whether the owner initially financed their business with home equity or not. The regression model included many owner characteristics that might drive this decision (e.g. age, gender, race, geographic location) and, most importantly, industry dummies. The coefficients on these dummies provide estimates of how dependent each industry is on home equity, conditional on other factors. This conditional industry classification was very similar to the unconditional industry classification.
27 Two Australian banks – CBA and Westpac – provide information on the industry portfolio of their small business lending (and whether it is collateralised by residential property or not). This information is available in their Pillar 3 reports. Broadly speaking, the Australian data supports the chosen industry classification based on the US data.
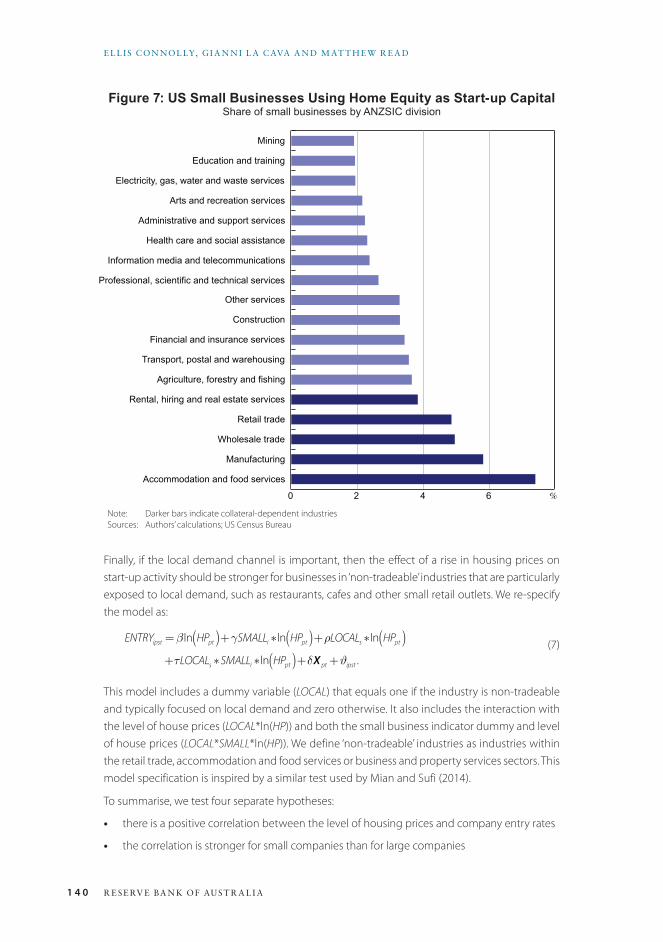
1 4 0 R E SE RV E BA N K OF AUST R A L I A
E L L IS CON NOL LY, G I A N N I L A C AVA A N D M AT T H EW R E A D
Figure 7: US Small Businesses Using Home Equity as Start-up CapitalShare of small businesses by ANZSIC division
Accommodation and food services
Manufacturing
Wholesale trade
Retail trade
Rental, hiring and real estate services
Agriculture, forestry and fishing
Transport, postal and warehousing
Financial and insurance services
Construction
Other services
Professional, scientific and technical services
Information media and telecommunications
Health care and social assistance
Administrative and support services
Arts and recreation services
Electricity, gas, water and waste services
Education and training
Mining
0 2 4 6 %
Note: Darker bars indicate collateral-dependent industriesSources: Authors’ calculations; US Census Bureau
Finally, if the local demand channel is important, then the effect of a rise in housing prices on start-up activity should be stronger for businesses in ‘non-tradeable’ industries that are particularly exposed to local demand, such as restaurants, cafes and other small retail outlets. We re-specify the model as:
ENTRYipst =β ln HPpt( )+γSMALLi ∗ln HPpt( )+ρLOCALs ∗ln HPpt( )+τLOCALs ∗SMALLi ∗ln HPpt( )+δX pt+ϑipst .
(7)
This model includes a dummy variable (LOCAL) that equals one if the industry is non-tradeable and typically focused on local demand and zero otherwise. It also includes the interaction with the level of house prices (LOCAL*ln(HP)) and both the small business indicator dummy and level of house prices (LOCAL*SMALL*ln(HP)). We define ‘non-tradeable’ industries as industries within the retail trade, accommodation and food services or business and property services sectors. This model specification is inspired by a similar test used by Mian and Sufi (2014).
To summarise, we test four separate hypotheses:
• there is a positive correlation between the level of housing prices and company entry rates
• the correlation is stronger for small companies than for large companies
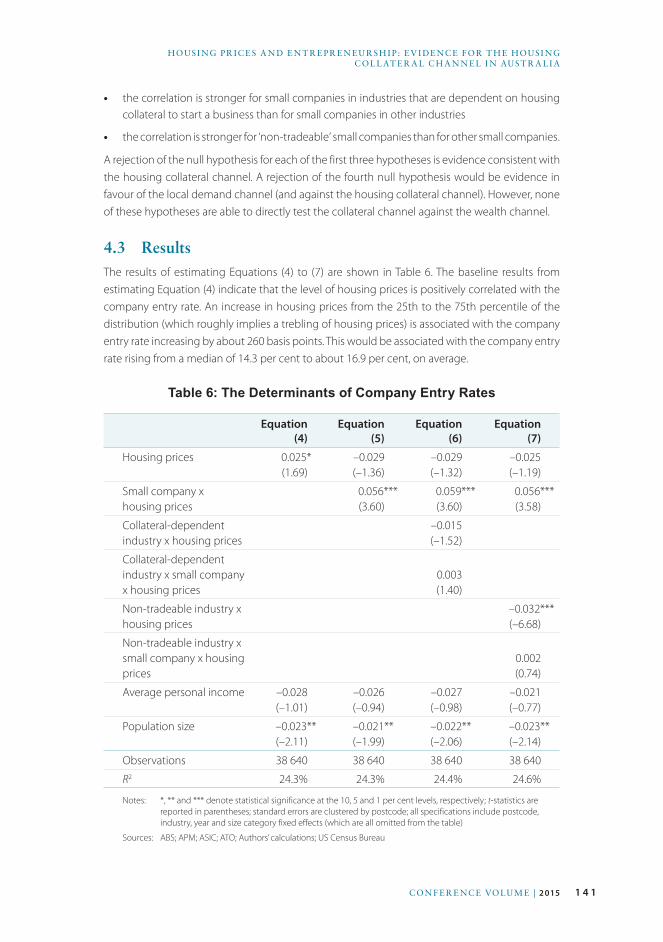
1 4 1CON F E R E NC E VOLU M E | 2 015
HOUSI NG PR IC E S A N D E N T R E PR E N EU R SH I P: EV I DE NC E FOR T H E HOUSI NG COL L AT E R A L C H A N N E L I N AUST R A L I A
• the correlation is stronger for small companies in industries that are dependent on housing collateral to start a business than for small companies in other industries
• the correlation is stronger for ‘non-tradeable’ small companies than for other small companies.
A rejection of the null hypothesis for each of the first three hypotheses is evidence consistent with the housing collateral channel. A rejection of the fourth null hypothesis would be evidence in favour of the local demand channel (and against the housing collateral channel). However, none of these hypotheses are able to directly test the collateral channel against the wealth channel.
4.3 ResultsThe results of estimating Equations (4) to (7) are shown in Table 6. The baseline results from estimating Equation (4) indicate that the level of housing prices is positively correlated with the company entry rate. An increase in housing prices from the 25th to the 75th percentile of the distribution (which roughly implies a trebling of housing prices) is associated with the company entry rate increasing by about 260 basis points. This would be associated with the company entry rate rising from a median of 14.3 per cent to about 16.9 per cent, on average.
Table 6: The Determinants of Company Entry Rates
Equation(4)
Equation(5)
Equation(6)
Equation(7)
Housing prices 0.025*(1.69)
–0.029(–1.36)
–0.029(–1.32)
–0.025(–1.19)
Small company x housing prices
0.056***(3.60)
0.059***(3.60)
0.056***(3.58)
Collateral-dependent industry x housing prices
–0.015(–1.52)
Collateral-dependent industry x small company x housing prices
0.003(1.40)
Non-tradeable industry x housing prices
–0.032***(–6.68)
Non-tradeable industry x small company x housing prices
0.002(0.74)
Average personal income –0.028(–1.01)
–0.026(–0.94)
–0.027(–0.98)
–0.021(–0.77)
Population size –0.023**(–2.11)
–0.021**(–1.99)
–0.022**(–2.06)
–0.023**(–2.14)
Observations 38 640 38 640 38 640 38 640
R2 24.3% 24.3% 24.4% 24.6%
Notes: *, ** and *** denote statistical significance at the 10, 5 and 1 per cent levels, respectively; t-statistics are reported in parentheses; standard errors are clustered by postcode; all specifications include postcode, industry, year and size category fixed effects (which are all omitted from the table)
Sources: ABS; APM; ASIC; ATO; Authors’ calculations; US Census Bureau

1 4 2 R E SE RV E BA N K OF AUST R A L I A
E L L IS CON NOL LY, G I A N N I L A C AVA A N D M AT T H EW R E A D
The results of estimating Equation (5) imply that the positive correlation between entry rates and housing prices is solely due to small companies. This is shown by the positive interaction effect and the insignificant (negative) main effect. Together, these results are consistent with a housing collateral effect if small companies are more likely to be credit constrained.28 The positive association between the level of housing prices and the small company entry rate is more than twice as large as for all companies. Moreover, the economic effect seems quite large compared with the results obtained from the household survey model. This may reflect the fact that we are not directly controlling for wealth shocks that may vary across postcodes and over time. In other words, the postcode-level estimates could be affected by omitted variables bias.
The results of estimating Equation (6) indicate that the positive correlation between housing prices and small company entry rates is slightly stronger in collateral-dependent industries. This is shown by the positive coefficient on the interaction term for collateral-dependent small businesses. However, the difference is not statistically significant and, therefore, provides only tentative support for the collateral channel. The lack of statistical significance could reflect the fact that the split between collateral-dependent and independent industries is somewhat arbitrary.
Finally, the results of estimating Equation (7) indicate that the positive correlation between housing prices and entry rates is not specific to non-tradeable industries that are dependent on local demand. This finding supports the collateral channel to the extent that it does not provide strong support for the competing hypothesis of the local demand channel.
For completeness, we find that entry rates are higher in areas with smaller populations, on average. There is no correlation between entry rates and average personal income levels.
5. ConclusionsThis paper has explored the relationship between housing collateral and entrepreneurship in Australia from two angles: first, we interviewed small business finance experts at a range of lending institutions to better understand the role of collateral in small business lending; and second, we econometrically tested the relationship between measures of housing collateral and entrepreneurial activity using two different datasets.
The key messages we took away from the liaison with lenders was that the provision of housing collateral influences small business lending decisions. While the lenders naturally place much more focus on the capacity of the potential borrower to service the loan, providing housing collateral is viewed by some lenders as evidence that the borrower has the capacity to build wealth and has strong incentives to repay the loan. Where the presence of housing collateral appears to be particularly important is in determining the terms of the loan, with lenders willing to lend larger amounts at lower interest rates against residential security. Consistent with these facts, all the lenders indicated that a high proportion of their small business lending was collateralised.
The liaison also highlighted the challenges that start-up businesses face in accessing intermediated lending products. Start-ups face a high hurdle to demonstrate their capacity to repay the loan without a cash-flow history. While the lenders emphasised that the provision of collateral was not
28 However, large companies may also have multiple locations and this geographic diversification may lower the sensitivity of their entry rate decision to local housing prices.
1 4 3CON F E R E NC E VOLU M E | 2 015
HOUSI NG PR IC E S A N D E N T R E PR E N EU R SH I P: EV I DE NC E FOR T H E HOUSI NG COL L AT E R A L C H A N N E L I N AUST R A L I A
sufficient of itself to justify lending to a start-up without evidence of serviceability, it nevertheless increased the likelihood of lending. Looking ahead, young entrepreneurs may find it more difficult to access debt finance given the high level of house prices relative to incomes, which could restrict their capacity to build the housing equity necessary to access residential-secured small business lending products.
Econometric models estimated using Australian household survey data yield evidence consistent with the existence of a housing collateral channel, although the estimated effects are relatively small. Specifically, the dollar value of housing equity is positively correlated with: business formation; the use of business debt conditional on business formation; and the number of workers employed by new entrepreneurs. One result that further supports the existence of a housing collateral channel is that, unlike housing equity, non-housing equity seems to be insignificant in predicting business formation. This is also consistent with lenders being less willing to lend for business purposes against non-housing collateral. However, we cannot discount the possibility that our results reflect wealth effects. This might be the case if, for instance, entrepreneurial risk appetite is a function of housing wealth but not non-housing wealth.
We find supporting evidence of a positive correlation between housing prices and entrepreneurship using a completely different dataset based on Australian company registrations. In particular, we find a clear and robust positive correlation between the level of housing prices and the share of new companies measured across postcodes. The correlation is only apparent for small companies and appears to be relatively broad based across industries.
In the absence of a natural experiment (as in Jensen et al (2014)), it is difficult to disentangle the housing collateral channel from wealth effects. Nevertheless, our results are relevant for policy. In terms of understanding the monetary policy transmission mechanism, a decrease in interest rates may have less impact through the housing collateral channel if lenders’ balance sheets were to become impaired or if their lending were to become constrained by capital requirements. If a housing collateral channel exists, it too may have distributional effects because entrepreneurs that do not own their own homes are adversely affected by a rise in housing prices relative to those entrepreneurs that own their homes. This should be taken into account when designing policies aimed at influencing home ownership rates or entrepreneurs’ access to business finance.
There are many avenues for further research on the housing collateral channel in Australia. While this paper has focused on the relationship between housing collateral and business formation, we have not explored the effect on the outcomes for existing businesses. While the effects found in this paper seem reasonably small in general, this is consistent with the liaison with lenders, which confirmed that new businesses have more difficulty accessing finance, regardless of their housing collateral. It may be the case that the housing collateral channel is more important for the activity of existing businesses. As the time series from the HILDA Survey grows, it would be worthwhile examining the effect of housing collateral over the life cycle of a small business.
1 4 4 R E SE RV E BA N K OF AUST R A L I A
E L L IS CON NOL LY, G I A N N I L A C AVA A N D M AT T H EW R E A D
ReferencesAdelino M, A Schoar and F Severino (2013), ‘House Prices, Collateral and Self-Employment’, NBER Working
Paper No 18868.
APRA (Australian Prudential Regulation Authority) (2008), ‘Prudential Standard APS 113: Capital
Adequacy: Internal Ratings-Based Approach to Credit Risk’. Available at <http://www.apra.gov.au/adi/
Documents/cfdocs/Final-APS-113-November-2007.pdf>.
Bernanke B and M Gertler (1989), ‘Agency Costs, Net Worth, and Business Fluctuations’, The American
Economic Review, 79(1), pp 14–31.
Corradin S and A Popov (2013), ‘House Prices, Home Equity and Entrepreneurships’, European Central Bank
Working Paper Series No 1544.
Fort TC, J Haltiwanger, RS Jarmin and J Miranda (2013), ‘How Firms Respond to Business Cycles: The Role
of Firm Age and Firm Size’, NBER Working Paper Series No 19134.
Genesove D and J Hansen (2014), ‘Predicting Dwelling Prices with Consideration of the Sales Mechanism’,
RBA Research Discussion Paper No 2014-09.
Greene WH (2012), Econometric Analysis, 7th edn, Prentice Hall, Upper Saddle River, pp 696–699.
Haltiwanger J, RS Jarmin and J Miranda (2013), ‘Who Creates Jobs? Small Versus Large Versus Young’,
The Review of Economics and Statistics, 95(2), pp 347–361.
Hurst E and A Lusardi (2004), ‘Liquidity Constraints, Household Wealth, and Entrepreneurship’, Journal of
Political Economy, 112(2), pp 319–347.
Jensen TL, S Leth-Petersen and R Nanda (2014), ‘Housing Collateral, Credit Constraints and
Entrepreneurship - Evidence from a Mortgage Reform’, NBER Working Paper Series No 20583.
Kerr SP, WR Kerr and R Nanda (2014), ‘House Money and Entrepreneurship’, Paper presented at Fordham
Graduate School of Business, Center for Research in Contemporary Finance, Finance Research Seminar,
New York, 21 November.
Kiyotaki N and J Moore (1997), ‘Credit Cycles’, Journal of Political Economy, 105(2), pp 211–248.
Kleiner K (2015), ‘Does Collateral Drive Access to Formal Lending Markets? Evidence from Home
Equity Loans’, Unpublished manuscript, Indiana University, Kelley School of Business. Available at
<http://kelley.iu.edu/kleinerk/Home_Equity_Kleiner.pdf>.
Mian A and A Sufi (2014), ‘What Explains the 2007–2009 Drop in Employment?’, Econometrica, 82(6),
pp 2197–2223.
OECD (Organisation for Economic Co-operation and Development) (2013), Financing SMEs and
Entrepreneurs 2013: An OECD Scoreboard, OECD Publishing, Paris.
RBA (Reserve Bank of Australia) (2012), ‘Small Business Finance Roundtable: Summary of Discussion’,
RBA Bulletin, June, pp 91–94.
Read M, C Stewart and G La Cava (2014), ‘Mortgage-Related Financial Difficulties: Evidence from Australian
Micro-Level Data’, RBA Research Discussion Paper No 2014-13.
Schmalz MC, DA Sraer and D Thesmar (2013), ‘Housing Collateral and Entrepreneurship’, NBER Working
Paper Series No 19680.
Windsor C, G La Cava and J Hansen (2014), ‘Home Price Beliefs in Australia’, RBA Research Discussion
Paper No 2014-04.
Wooldridge JM (2010), Econometric Analysis of Cross Section and Panel Data, 2nd edn, MIT Press, Cambridge,
pp 577–578.

1 4 5CON F E R E NC E VOLU M E | 2 015
Discussion
1. David HargreavesOver the years I have come to expect research work from the Reserve Bank of Australia to be rigorous and well focused on an important policy issue, and this paper is no exception. I like how the authors have combined careful liaison work with empirical work in the paper.
The lending officers that the RBA spoke with emphasised the importance of the character and capacity (serviceability) of a prospective borrower. At the same time, it appears that most small business lending is collateralised, and that housing equity is a very important source of collateral. My interpretation of these somewhat contradictory viewpoints is that while banks will not lend without satisfying themselves of the character and capacity of the borrower, collateral still provides a very important margin of safety for their lending. Since serviceability assessments for a business are based on inherently uncertain forecasts, the credit risk associated with uncollateralised small business loans is fairly significant. Banks are able to offer larger loans and considerably better terms when collateral is available.1
Given its current importance, it is interesting to consider whether residential property collateral is likely to have been as important for small business lending in the past as it appears to be now. My understanding is that the situation has changed in the period since financial deregulation in the 1980s in important ways. For one, there was no ‘right’ in the past to redraw on loans that had been amortised, and it was much harder to borrow against existing housing equity and at high loan-to-value ratios than it is today.2 House prices were also much lower relative to income and interest rates much higher – factors that would tend to make it harder to use housing collateral to start a business if there was any doubt about cash-flow projections.
Turning to the household-level empirical work, the authors demonstrate that home equity raises the probability of a household starting a business, while non-housing equity does not. Furthermore, the businesses are more likely to have employees, and debt, if the owner has home equity. Overall, these results seem convincing. While the economic significance of the effects found are fairly small, they are nontrivial.3 The sample of households starting businesses is relatively small, but because there are few business datasets with so much information about the balance sheet of the underlying household this is probably unavoidable.
My main comment on the household-level results is that it seems counterintuitive that non-housing wealth does not contribute to business formation. The authors should possibly
1 While this is sometimes seen as a ‘regulatory capital’ issue, I think it would actually still be true in an environment without regulatory risk weights. Regardless of capital requirements, banks would be aware of the higher expected loss from uncollateralised lending (and larger risk of unexpected loss) and make business decisions accordingly.
2 This is not empirically well documented. Some evidence for New Zealand is gathered by Coleman (2007).
3 As an aside, some studies do not provide enough information for readers to understand the economic significance of reported coefficients. In this paper, the authors illustrate the economic significance of their key coefficients in a very useful and intuitive way.
1 4 6 R E SE RV E BA N K OF AUST R A L I A
DISC US SION
think further about the full range of options available to someone raising funds to start a business. It could be that much non-housing wealth is in superannuation accounts and thus somewhat inaccessible – but a footnote suggests that this is not the key driver. Accessible financial assets can be liquidated to generate cash (and indeed housing equity can also be sold, especially if the household owns investment properties). There seems no reason why a household that wanted to start a business would not do so if they had adequate funds in the bank, if the same household would happily borrow against housing wealth to start the business if they didn’t have money in the bank. Perhaps this counterintuitive result reflects the fact that non-superannuation financial wealth is concentrated in a relatively small, wealthy section of the population that has fewer incentives to take the risk of starting a business.4
Because the authors have balance sheet statistics (both before and after the business formation) for households that started a business, they should be able to examine how the businesses in their sample were funded by the owning households, beyond the use of bank debt.
Turning to the postcode-level analysis, this also has intuitive and interesting conclusions. Companies are more likely to start in places where house prices are rising. This effect is particularly strong for small companies and for collateral-dependent industries. Finally, the result is not just due to companies setting up to service an increasingly affluent local market – i.e. cafes and the like – but also includes companies providing tradeable goods or services to a larger market.
The key question I have about this analysis concerns the possibility of reverse causality. There are some regions that have developed agglomerations in tradeable industries over time – Silicon Valley is a leading example. This is likely to involve a lot of businesses starting at the same time as house prices increase quickly. The reverse causality is that the high business formation rates generate demand for housing – and therefore increase house prices – because entrepreneurs move to the area to start businesses.
This issue is similar to the one discussed by Mian and Sufi (2009). Mian and Sufi use an index of housing supply elasticity to show that house prices mainly rose during the pre-financial crisis expansion in areas where supply was inelastic, but that the increase in credit was more universal. This provides evidence that credit drove rising house prices rather than the other way around. The authors may wish to look for underlying variables that might drive business formation and house price growth and see if these drive the results. One example would be if the resource price boom had led to business formation and house price growth in resource-rich regions of Australia. It is possible that Mian and Sufi’s methodology would work in this context as well. For example, if there are many regions in Australia with above-normal business formation, but house prices only rise alongside rapid business formation in regions where housing supply is inelastic, that would tend to suggest house price growth is not the underlying causal variable.
Looking towards the future, there are interesting new technologies being employed to obtain unsecured finance via peer-to-peer lending and crowdfunding. These appear to be quite successful in niche areas and will probably become more important over time, potentially reducing the importance of housing collateral. As others at this Conference have noted, this may be important because the next generation of people looking to start small businesses will be less likely to own housing.
4 Data from the Australian Bureau of Statistics ‘Household Wealth and Wealth Distribution’ release show that non-superannuation financial assets are mostly held by the highest wealth quintile.
1 4 7CON F E R E NC E VOLU M E | 2 015
DISC US SION
ReferencesColeman A (2007), ‘Credit Constraints and Housing Markets in New Zealand’, Reserve Bank of New Zealand
Discussion Paper Series DP2007/11.
Mian A and A Sufi (2009), ‘The Consequences of Mortgage Credit Expansion: Evidence from the U.S.
Mortgage Default Crisis’, The Quarterly Journal of Economics, 124(4), pp 1449–1496.
2. General DiscussionDiscussion began with queries about the econometrics used in the paper. One participant questioned the construction of a business formation rate using the number of businesses as the denominator, because changes in the number of businesses due to business exits will be driven by factors similar to those that drive business formation. Gianni La Cava explained that using working-age population as the denominator yielded similar results; however, there were timing problems with data availability, which is why the paper used the number of businesses. A participant noted that reverse causality might be a problem if geographical centres for innovation – like Silicon Valley – are reflected in the data. In these areas, demand by new entrepreneurs for housing drives up house prices. Dr La Cava agreed that this effect is difficult to control for, but that postcode-level population and income growth partially account for it.
One participant questioned whether the paper had controlled for age, citing that over 30 per cent of businesses are owned by the over 55 years age group, compared with just 3 per cent of businesses that are owned by young entrepreneurs. Matthew Read responded that the paper’s analysis controlled for age and that the findings were robust to age effects.
Another participant was interested in the importance of the housing collateral channel relative to other factors relating to business formation. The participant suggested using the effect of income on business formation as a benchmark. Relatedly, some participants also remarked on the seeming importance of some of the demographic characteristics used as controls in the analysis. In particular, one participant noted that gender had a much larger effect on new business formation than housing collateral. Mr Read agreed that many of the demographic controls had effects that were much larger than the housing collateral channel; however, the paper had not drawn attention to these findings because they were less relevant to monetary policy.
Participants noted that the paper’s finding that a large proportion of new business lending is secured against housing collateral was intuitive and accorded with other evidence. Several participants noted that there is no cost for lenders in using housing collateral if it is available and, from the perspective of entrepreneurs, large differences in price between secured lending and unsecured lending would encourage using housing as collateral.
Participants discussed the role of personal credit cards in financing small businesses. One participant noted that it is common for personal credit cards to be issued with new home loans and that these might be used as a cash-flow tool by small business owners. Another participant suggested that the application process for a personal credit card is sometimes easier than for a business credit card, for example due to difficulty in providing evidence of business cash flow. The same participant observed that some lenders have had to promote the benefits of loyalty

1 4 8 R E SE RV E BA N K OF AUST R A L I A
DISC US SION
programs to encourage small business owners to apply for business credit cards, rather than continuing to use their personal credit card.
Discussion closed by turning to the policy implications of the paper’s findings. One participant made the point that economies with lower levels of home ownership nonetheless have similar levels of entrepreneurship. The participant suggested that these economies might have similar savings rates but instead invest their wealth in other assets. In these economies, wealth in the form of, for instance, bank deposits might be used to fund new ventures purely as an equity investment, rather than using housing equity to secure financing. The participant opined that this suggests that the housing collateral channel might not pose a problem for policy. Dr La Cava agreed that this observation was plausible and that it related to the difficulty of separating wealth effects from the housing collateral channel. He noted that it is possible that rising house prices boost home owners’ wealth, leading some home owners to develop an appetite for more risk. These home owners might choose to channel this risk by forming new businesses; this channel does not depend on housing collateral.
A participant questioned whether policy has a role to play in ensuring entrepreneurs without housing equity have access to finance and, in particular, whether there is scope for superannuation funds to play a role in equity financing. Picking up on this question, one participant suggested that self-managed superannuation funds could already be used to purchase a business premises or shares in newly formed companies. Ellis Connolly noted that small business owners using their self-managed superannuation fund to purchase business premises only benefits those who have already accumulated wealth – like those close to retirement – and could not help younger entrepreneurs. Another participant suggested that superannuation funds would face large fixed transaction costs in the provision of equity finance to small businesses. Consequently, it was unlikely to be a viable option. Mr Connolly agreed and questioned whether there was space in the market for an intermediary to develop technology for superannuation funds that could help to assess applications for equity finance. This technology would reduce the transaction costs of investing in small to medium-sized enterprises.

1 4 9CON F E R E NC E VOLU M E | 2 015
The Dynamics of Trade Credit and Bank Debt in SME Finance: International EvidenceLars Norden and Stefan van Kampen*
1. IntroductionSmall to medium-sized enterprises (SMEs) are of key importance for economic activity, employment and growth in many countries. The European Commission (2005) defines SMEs as firms with fewer than 250 employees, turnover of less than €50 million and total assets less than €43 million. SMEs represent 98 per cent of all firms, and account for 67 per cent of total employment and 56 per cent of total gross value added in the European Union. In 2014 there were approximately 21 million SMEs in the European Union. However, SME finance remains challenging because these firms are more opaque, riskier, more financially constrained, and more bank-dependent than large firms. They cannot access capital markets or issue stocks or bonds. Instead, they largely depend on private debt, such as bank loans or trade credit to raise external finance.
However, little is known about the dynamics of the two main sources of external finance for SMEs: bank debt and trade credit. This is surprising because trade credit represents the second most important source of credit for SMEs after bank debt (see, for example, Petersen and Rajan (1994, 1997)). The overall level of trade credit also varies significantly across countries. In Italy, the median ratio of accounts payable to total assets is 26 per cent, but in Germany it is only 9 per cent.
Research has started to examine the importance of trade credit in different contexts.1 For example, Carbó-Valverde et al (forthcoming) analyse the importance of trade credit for SMEs in Spain. They find that credit-unconstrained Spanish firms fund their investments mainly with bank finance, but strongly credit-constrained firms fund their investments with trade credit and this dependency increased during the global financial crisis.
In this paper, we investigate the dynamics of trade credit and bank debt at the firm level over time. Specifically, we study whether there is a substitution relationship between firms’ use of bank debt and trade credit and how this relationship varies over time and across countries. This question is relevant because a high or low availability of debt finance can amplify or weaken the business
1 For examples of the recent literature on trade credit, see Giannetti, Burkart and Ellingsen (2011); Boissay and Gropp (2013); Ferrando and Mulier (2013); Garcia-Appendini and Montoriol-Garriga (2013); Liu (2014); Carbó-Valverde, Rodriguez-Fernandez and Udell (forthcoming).
* The authors thank Annalisa Ferrando (the discussant) and the participants at the Reserve Bank of Australia (RBA) Annual Conference on ‘Small Business Conditions and Finance’ for comments and suggestions. We are also grateful to John Simon and Alexandra Heath (the Conference organisers) and the RBA for financial support. Corresponding author: Lars Norden.
1 5 0 R E SE RV E BA N K OF AUST R A L I A
L A R S NOR DE N A N D ST E FA N VA N K A M PE N
cycle.2 If firms offset a shock to their bank debt with trade credit they can stabilise their total credit through the cycle. However, if bank debt and trade credit are complementary (i.e. they increase or decrease at the same time) then booms and recessions are amplified, resulting in higher volatility of economic activity over time. Hence, understanding the interplay between bank debt and trade credit over time and across countries has important policy implications.
Some studies provide support for a substitution relationship between bank debt and trade credit (Biais and Gollier 1997; Petersen and Rajan 1997; Cuñat 2007). Moreover, there is evidence that financially unconstrained firms redistribute part of their bank debt to financially constrained client firms by providing trade credit (Love, Preve and Sarria-Allende 2007; Garcia-Appendini and Montoriol-Garriga 2013; Liu 2014).
However, there is also evidence that bank debt and trade credit do not exhibit a substitution relationship. First, the relationship between bank debt and trade credit is time-varying. Kestens, Van Cauwenberge and Vander Bauwhede (2012) and Bastos and Pindado (2013) show that trade credit extension declined during the recent financial crisis – in contrast to the substitution hypothesis – due to the risk of credit contagion in the supply chain. If the substitution relationship held in all states of the economy, we should see an increase in trade credit extension during recessions as firms become more constrained. Second, there are studies showing that firms accumulate trade credit even if they are unconstrained and sufficiently liquid. Petersen and Rajan (1997) report a U-shaped relationship between trade payables and profitability; this relationship should be monotonically decreasing under the substitution hypothesis. Similarly, Fisman and Love (2003) show that firm age is positively related to trade credit, but theoretically we should expect a negative relationship under the substitution hypothesis.
Based on the evidence provided by the studies above, it is not clear whether there is a substitution or complementary relationship between trade credit and bank debt and which factors drive the relationship between these two sources of credit. The goal of this study is to provide comprehensive evidence on these questions. We base our analysis on a large-scale dataset of SMEs from the five biggest European Union countries during 2006–11.
Our identification strategy relies on three elements. First, we consider SMEs that have demand for credit. This focus is important because a complementary relationship could mean two things: either firms cannot substitute or they do not want to substitute. It is therefore crucial to investigate the substitution between different sources of credit for firms that actually have demand for external finance (Becker and Ivashina 2014). We do so by following Rajan and Zingales (1998) and considering only firm-year observations where the value of a firm’s investments exceeds the value of its cash flows to ensure that the firm has demand for external finance. Second, we examine what happens when these firms exhibit a decrease in their bank debt. Third, we focus on the years of the recent financial crisis when banks were forced to contract their credit supply.
We measure whether a firm substitutes between bank debt and trade credit by using a new firm-specific and time-varying binary indicator. This substitution indicator (SIit
binary ) equals zero if trade credit decreases after a negative shock to short-term bank debt (complementary relationship) and equals one if trade credit increases after a negative shock to bank debt (substitution relationship).
2 See, for example, King and Levine (1993a, 1993b); Beck, Levine and Loayza (2000); Beck and Demirgüç-Kunt (2006).
1 5 1CON F E R E NC E VOLU M E | 2 015
T H E DY NA M IC S OF T R A DE CR EDI T A N D BA N K DEBT I N SM E F I NA NCE: I N T ER NAT IONA L EV I DENCE
Our study contributes to the literature in several ways. First, our measurement approach based on the substitution indicator has several advantages. It allows us to study the cross-sectional and time-series variation of the interplay between trade credit and bank debt. There could be a complementary relationship in certain periods and a substitution relationship in other periods, and these dynamics might depend on firm characteristics. The substitution indicator is flexible enough to detect both types of heterogeneity and makes it possible – in combination with the two other building blocks of our empirical strategy (a shock to bank debt during the crisis and focusing on SMEs that depend on external finance) – to identify a causal effect.
Second, we focus on SMEs because these firms are missing in the studies of Garcia-Appendini and Montoriol-Garriga (2013) and Liu (2014), who investigate the trade credit provision of large firms in the United States. Because SMEs cannot access public debt markets, their financing is limited to the choice between internal finance and external finance in the form of bank debt and trade credit. Hence, SMEs are the ideal testing ground for our study.
Third, many of the related studies use single-country data, which makes it difficult to generalise the results. We base our study on cross-country data from the five biggest European Union countries. Considering cross-country heterogeneity is important because firm characteristics, the financial system and the legal environment differ significantly between these countries, which affects the supply of and demand for different types of debt (see, for example, La Porta et al (1997); Demirgüç-Kunt and Maksimovic (2002); Beck, Demirgüç-Kunt and Maksimovic (2004); Berger and Udell (2006); Haselmann, Pistor and Vig (2010)).
We obtain the following principal results:
• First, we find that substitution and complementary relationships are almost equally likely over the entire sample period from 2006 to 2011. However, there is substantial variation across countries and over time. We find that the probability of a firm displaying a substitution relationship decreased significantly during the crisis. Compared to pre-crisis times, the probability of a firm displaying a substitution relationship is 28.7 per cent lower during the first stage of the crisis and 59.5 per cent lower during the second stage.
• Second, higher credit quality firms are more likely to display a substitution relationship.
• Third, substitution becomes more difficult during macroeconomic downturns; the probability of a firm displaying a substitution relationship was approximately 48 per cent lower at the peak of the crisis than before the financial crisis.
• Fourth, the effect of credit quality on substitution follows an inverse U-shaped relationship in the level of financial constraints. This finding suggests that the credit quality of the firm is most important for firms with an intermediate level of financial constraints.
Overall, we conclude that trade credit has rather limited scope to step into the gap when banks cut lending to SMEs.
Our findings indicate that the substitution relationship between bank debt and trade credit is not as straightforward as assumed in the existing literature. Firms with a lower credit quality have more difficulty in offsetting a shock to their short-term bank debt with trade credit. This finding contradicts the substitution theory of trade credit because these are exactly the firms that should substitute. Moreover, the probability of substitution decreased significantly when the financial
1 5 2 R E SE RV E BA N K OF AUST R A L I A
L A R S NOR DE N A N D ST E FA N VA N K A M PE N
crisis deepened. This finding indicates that the substitution relationship between bank debt and trade credit is time-varying and ultimately procyclical (less substitution when the crisis is most severe), potentially amplifying the effect of recessions.
The remainder of the paper is organised as follows. In Section 2 we summarise the related literature and present our research questions. In Section 3 we describe the data and report summary statistics. In Section 4 we present the main results. Section 5 concludes.
2. Related Literature and Research QuestionsThe literature has identified several supply- and demand-side rationales for why trade credit is an important component of debt finance. From the supply side, trade credit:
• helps firms acquire private information about their customers (Smith 1987; Mian and Smith 1992; Petersen and Rajan 1997; Jain 2001)
• helps to enhance strong bargaining positions over customers (Giannetti et al 2011)
• decreases warehouse costs (Emery 1987)
• could result in a long-term supplier-customer relationship, leading to future business opportunities (Ng, Smith and Smith 1999).
The most important demand-side rationale for trade credit is that many firms, especially SMEs, resort to trade credit because they are financially constrained and, thus, have limited or no access to other forms of external funding (Biais and Gollier 1997; Petersen and Rajan 1997). This implies that bank debt and trade credit are substitutes because these firms attract trade credit if they have insufficient access to bank debt.
The substitution theory coincides with the redistribution view on trade credit (for example, see Love et al (2007) and Kestens et al (2012)). The redistribution view implies that firms that borrow from financial intermediaries redistribute their borrowings to those who do not have access to financial intermediaries. Garcia-Appendini and Montoriol-Garriga (2013) and Liu (2014) found empirical evidence for this mechanism. However, the evidence is based on trade credit provision among large firms from the United States.
Empirical research has shown that macroeconomic conditions have a significant influence on borrower-lender relationships (Petersen and Rajan 1994; Berger and Udell 2002; Nilsen 2002; Giannetti 2003; Puri, Rocholl and Steffen 2011). Access to credit deteriorates during recessions because creditors become more risk averse and therefore restrict credit extensions (Gertler and Gilchrist 1994). Accordingly, the relationship between trade credit and bank debt varies with the state of the economy.
Ferrando and Mulier (2013) find that firms use trade credit to manage growth. Trade credit matters more for growth in countries where trade credit is more common, though its marginal impact is lower. Financially constrained firms also rely more on trade credit for growth.
Bastos and Pindado (2013) provide an explanation for how the role of trade credit may change during macroeconomic downturns. The breakout of a crisis will trigger liquidity shocks for certain firms. These shocks make firms less creditworthy and therefore their credit availability at financial institutions will decrease. This can lead to two opposite scenarios. The good scenario follows the
1 5 3CON F E R E NC E VOLU M E | 2 015
T H E DY NA M IC S OF T R A DE CR EDI T A N D BA N K DEBT I N SM E F I NA NCE: I N T ER NAT IONA L EV I DENCE
substitution theory. In this case, firms suffering from credit constraints due to liquidity shocks will be able to get more trade credit in lieu of bank debt. The bad scenario holds that bank debt and trade credit exhibit a complementary relationship. In this scenario, firms facing liquidity shocks will see their access to trade credit restricted at the same time as their access to bank debt declines because of the risk of credit contagion (Jorion and Zhang 2009; Jacobson and von Schedvin 2015). Bastos and Pindado (2013) find that firms with a high share of accounts payable postponed payment during the global financial crisis to prevent liquidity problems. This transferred liquidity risk to suppliers, which eventually results in suppliers extending less trade credit. Kestens et al (2012) show that trade credit extension in Belgium decreased progressively during the recent financial crisis and this deterioration was more pronounced for firms that were dependent on short-term debt funding in the period directly before the crisis.
In summary, the dominant view in the literature is that trade credit and bank debt are substitutes. We have several critical remarks on this view.
• Bastos and Pindado (2013) show that an economic or financial crisis might change the substitution effect into a complementary effect because of contagion.
• Petersen and Rajan (1997) find that the most profitable firms strongly use trade credit. They also find that firms located in US Metropolitan Statistical Areas with poorly developed financial institutions have more trade credit. Both findings are not consistent with the substitution hypothesis.
• Fisman and Love (2003) find that young firms have the most difficulties in obtaining trade credit. This is in contrast with the substitution hypothesis, which implies that these firms cannot borrow from banks and therefore rely on trade credit.
• Many studies on trade credit do not consider its interplay with short-term bank debt and do not address the endogeneity between trade credit and bank debt. We take this issue explicitly into account in our empirical strategy.
• Studies on trade credit often rely on single-country data.3 Haselmann et al (2010) document that national laws affect the modes of debt finance, suggesting that cross-country variation should be taken into account.
• From a conceptual perspective, firms cannot use bank debt and trade credit in the same way because these modes of debt finance have different liquidity effects. Firms that receive trade credit do not experience a cash inflow, while firms that receive bank debt experience a cash inflow that can be used in a flexible way.
Based on this discussion, we investigate the following research questions:
1. Is there a substitution or complementary relationship between trade credit and bank debt at the firm level?
2. How do firm credit quality, size and financial constraints affect this relationship?
3. How does this relationship vary across countries and over time?
3 See, for example, Biais and Gollier (1997); Petersen and Rajan (1997); Yang (2011); Kestens et al (2012); Boissay and Gropp (2013); Jacobson and von Schedvin (2015); and Carbó-Valverde et al (forthcoming).
1 5 4 R E SE RV E BA N K OF AUST R A L I A
L A R S NOR DE N A N D ST E FA N VA N K A M PE N
3. Data and Summary StatisticsOur dataset comprises financial statement information from the Orbis and Sabi databases, both provided by Bureau van Dijk. It contains firm-year observations from the five largest countries in the European Union (France, Germany, Italy, Spain and the United Kingdom). Data for Spain come from the Sabi database; data for the other four countries are derived from Orbis. We restrict our analysis to firms that are not publicly listed and that have total assets less than €43 million in the last available calendar year, following the European Commission’s definition of SMEs (European Commission 2005). We exclude financial firms, which is standard practice in empirical corporate finance research. Moreover, in Orbis there are many data points with values of zero. These have an ambiguous meaning – they can either mean zero, ‘missing’ or ‘unknown’. To prevent this ambiguity in our dataset, we consider only data on firms where the value of accounts payable, accounts receivable and short-term bank debt equals at least €1 000 in all of the years in our sample period. We note that this threshold is rather low and it helps improve the quality of the final dataset.
Applying these selection criteria results in country-specific datasets with yearly observations from 2006 to 2011 (2006 to 2010 for Spain). The sample sizes differ substantially across countries. The samples from Italy (299 439 firm-year observations) and France (139 027 firm-year observations) are the largest; the sample from Germany is the smallest (8 302 firm-year observations). We therefore construct an aggregate dataset in a way that gives each country a weight that corresponds to its average GDP share among the five countries during the sample period. We do so by taking the x per cent biggest firms from the country-specific raw samples, where x is chosen to arrive at a sample composition that is in line with the country’s average GDP share. The final aggregate dataset comprises 29 333 firm-year observations with 1 186 firms from Germany (28 per cent), 922 from France (22 per cent), 920 from the United Kingdom (21 per cent), 751 from Italy (17 per cent), and 501 from Spain (12 per cent). Alternatively, we construct a random aggregate sample. We stratified each of the country-specific raw samples into country-specific firm size quintiles and randomly select the same number of firms from each size quintile to arrive at a sample that is in line with the country’s GDP share. The results for this random aggregate sample are similar to the ones we subsequently report.
3.1 The substitution indicatorWhile earlier studies have focused on the determinants of trade credit, we focus on the determinants of the substitution relationship directly. This is the key difference between this paper and related studies.
We adopt this approach because the relationship between bank debt and trade credit (or changes in both variables) is potentially endogenously determined. This endogeneity problem has not been sufficiently considered in many papers because they either regress trade credit on bank debt (or the other way around) or do not control for bank debt at all. These methodological choices make it difficult to draw conclusions about the complementarity or substitutability of trade credit for bank debt.4
4 See, for example, Nilsen (2002); Cuñat (2007); Love et al (2007); Kestens et al (2012); Bastos and Pindado (2013); Garcia-Appendini and Montoriol-Garriga (2013); Carbó-Valverde et al (forthcoming).
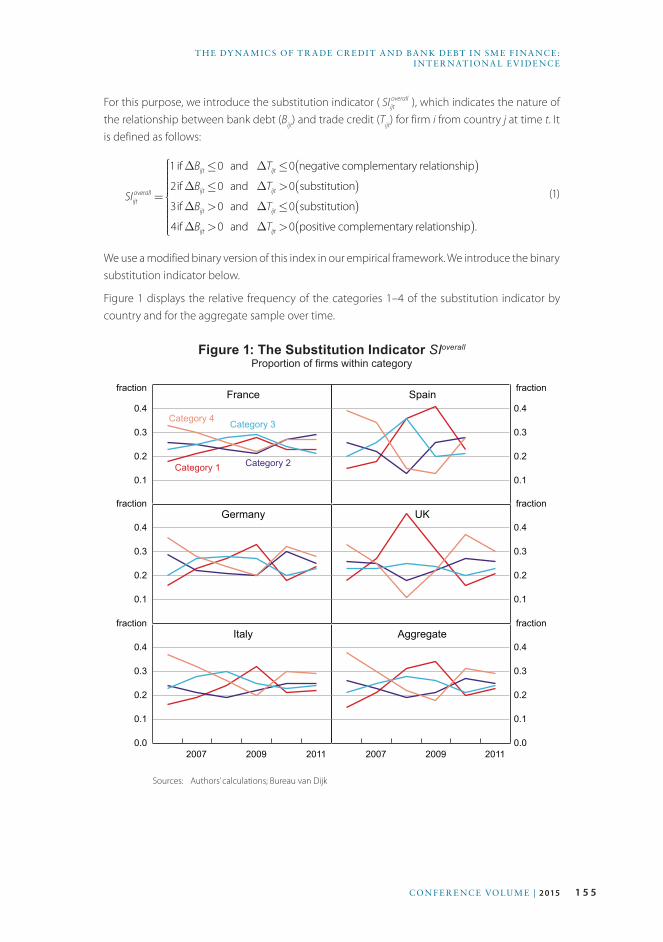
1 5 5CON F E R E NC E VOLU M E | 2 015
T H E DY NA M IC S OF T R A DE CR EDI T A N D BA N K DEBT I N SM E F I NA NCE: I N T ER NAT IONA L EV I DENCE
For this purpose, we introduce the substitution indicator ( SIijtoverall ), which indicates the nature of
the relationship between bank debt (Bijt) and trade credit (Tijt) for firm i from country j at time t. It is defined as follows:
SIijtoverall =
1 ifΔBijt≤0 and ΔTijt≤0 negative complementary relationship( )2ifΔBijt≤0 and ΔTijt>0 substitution( )3ifΔBijt>0 and ΔTijt≤0 substitution( )4ifΔBijt>0 and ΔTijt>0 positive complementary relationship( ).
⎧
⎨
⎪⎪⎪⎪⎪⎪
⎩
⎪⎪⎪⎪⎪⎪
(1)
We use a modified binary version of this index in our empirical framework. We introduce the binary substitution indicator below.
Figure 1 displays the relative frequency of the categories 1–4 of the substitution indicator by country and for the aggregate sample over time.
Figure 1: The Substitution Indicator SIoverall
Proportion of firms within category
2007 2009 20110.0
0.1
0.2
0.3
0.4
2007 2009 20110.0
0.1
0.2
0.3
0.4
0.1
0.2
0.3
0.4
0.1
0.2
0.3
0.4
Category 1
fractionFrance
0.1
0.2
0.3
0.4
0.1
0.2
0.3
0.4
fraction
fraction
fraction
fraction
fraction
Category 2
Category 3Category 4
Spain
Germany UK
Italy Aggregate
Sources: Authors’ calculations; Bureau van Dijk
1 5 6 R E SE RV E BA N K OF AUST R A L I A
L A R S NOR DE N A N D ST E FA N VA N K A M PE N
For the entire sample period, the proportion of firms displaying a complementary relationship (categories 1 and 4 combined) or a substitution relationship (categories 2 and 3 combined) is almost the same; both relationships occur about half the time, in aggregate. However, there is substantial variation across countries and over time. For instance, we see a sharp increase in the proportion of firms in category 1 (i.e. negative complementary relationship) in all five countries in the years 2008–09. We also see that the peak for France, Germany, Italy and Spain is in 2009. Spain and the United Kingdom – the country that experienced the spillover of the financial crisis from the United States earliest – show a large increase of the proportion of firms in category 1 in 2008. The proportion of firms in category 4 (positive complementary relationship) follows a pattern that is inverse to that of category 1. This descriptive analysis suggests that the interplay of trade credit and bank debt shifted to a negative complementary relationship during the crisis.
The financial crisis has been characterised as a shock to credit supply from banks (Ivashina and Scharfstein 2010). Accordingly, we continue with a modified binary version of the substitution indicator that is conditional on a negative shock to firms’ short-term bank debt in the previous year. The SIit
binary equals zero for a complementary relationship (category 1 in Equation (1)) and one for a substitution relationship (category 2 in Equation (1)). This binary indicator is not defined for categories 3 and 4 because we want to restrict our attention to how SMEs responded to a shock to their bank debt – the main issue during the financial crisis. SIit
binary has the main advantage that it allows us to condense information about changes in Bit and Tit into one dependent variable. This makes it possible to bypass the endogeneity problems present in earlier studies.
3.2 Empirical framework and identification strategyOur identification strategy relies on three elements. First, we only include firms that have demand for external finance to ensure that all firms in our sample want to substitute bank debt for trade credit. Firms that have no need for external finance do not have to substitute because they have sufficient internal finance to fund their operations (Becker and Ivashina 2014). We do so by considering only firm-year observations where the value of a firm’s investments exceeds the value of its cash flows to ensure that the firm has demand for external finance, following Rajan and Zingales (1998). Second, we investigate the relationship between bank debt and trade credit conditional on a negative shock to bank debt in the previous year. Third, we focus on the years of the global financial crisis.
The second and the third point are important because we expect that many SMEs in our sample were facing declines in bank debt. This is because our time frame of 2006 to 2011 includes a severe recession in which many banks were forced to contract lending due to illiquidity and insolvency problems. Therefore, it is most relevant to analyse the response of trade credit after a negative shock to bank debt.
3.3 Explanatory variablesThis section provides summary statistics for the main explanatory variables, which are potential factors that could influence the dynamics of trade credit and bank debt at the firm level.
The most important explanatory variable is the credit quality of the firm, which we measure using Altman’s Z-score (Z) adjusted for private firms (Altman 1968, 2000). The Z-score is a widely used
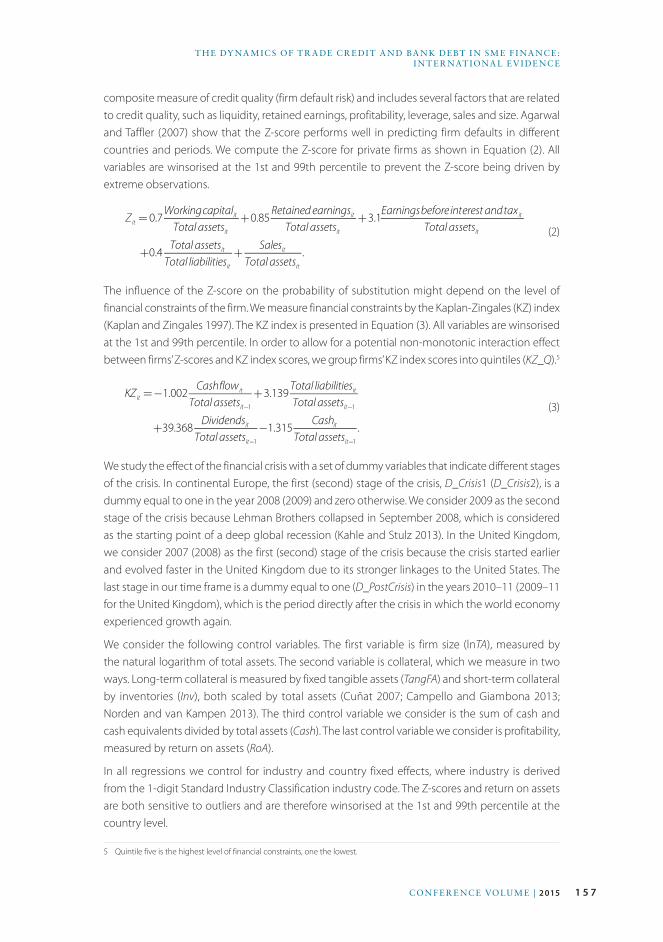
1 5 7CON F E R E NC E VOLU M E | 2 015
T H E DY NA M IC S OF T R A DE CR EDI T A N D BA N K DEBT I N SM E F I NA NCE: I N T ER NAT IONA L EV I DENCE
composite measure of credit quality (firm default risk) and includes several factors that are related to credit quality, such as liquidity, retained earnings, profitability, leverage, sales and size. Agarwal and Taffler (2007) show that the Z-score performs well in predicting firm defaults in different countries and periods. We compute the Z-score for private firms as shown in Equation (2). All variables are winsorised at the 1st and 99th percentile to prevent the Z-score being driven by extreme observations.
Zit =0.7WorkingcapitalitTotal assetsit
+0.85Retainedearningsit
Total assetsit+3.1
Earningsbeforeinterest andtaxitTotal assetsit
+0.4Total assetsitTotal liabilitiesit
+Salesit
Total assetsit.
(2)
The influence of the Z-score on the probability of substitution might depend on the level of financial constraints of the firm. We measure financial constraints by the Kaplan-Zingales (KZ) index (Kaplan and Zingales 1997). The KZ index is presented in Equation (3). All variables are winsorised at the 1st and 99th percentile. In order to allow for a potential non-monotonic interaction effect between firms’ Z-scores and KZ index scores, we group firms’ KZ index scores into quintiles (KZ_Q).5
KZit =−1.002Cashflowit
Total assetsit−1
+3.139Total liabilitiesitTotal assetsit−1
+39.368Dividendsit
Total assetsit−1
−1.315Cashit
Total assetsit−1
.
(3)
We study the effect of the financial crisis with a set of dummy variables that indicate different stages of the crisis. In continental Europe, the first (second) stage of the crisis, D_Crisis1 (D_Crisis2), is a dummy equal to one in the year 2008 (2009) and zero otherwise. We consider 2009 as the second stage of the crisis because Lehman Brothers collapsed in September 2008, which is considered as the starting point of a deep global recession (Kahle and Stulz 2013). In the United Kingdom, we consider 2007 (2008) as the first (second) stage of the crisis because the crisis started earlier and evolved faster in the United Kingdom due to its stronger linkages to the United States. The last stage in our time frame is a dummy equal to one (D_PostCrisis) in the years 2010–11 (2009–11 for the United Kingdom), which is the period directly after the crisis in which the world economy experienced growth again.
We consider the following control variables. The first variable is firm size (lnTA), measured by the natural logarithm of total assets. The second variable is collateral, which we measure in two ways. Long-term collateral is measured by fixed tangible assets (TangFA) and short-term collateral by inventories (Inv), both scaled by total assets (Cuñat 2007; Campello and Giambona 2013; Norden and van Kampen 2013). The third control variable we consider is the sum of cash and cash equivalents divided by total assets (Cash). The last control variable we consider is profitability, measured by return on assets (RoA).
In all regressions we control for industry and country fixed effects, where industry is derived from the 1-digit Standard Industry Classification industry code. The Z-scores and return on assets are both sensitive to outliers and are therefore winsorised at the 1st and 99th percentile at the country level.
5 Quintile five is the highest level of financial constraints, one the lowest.
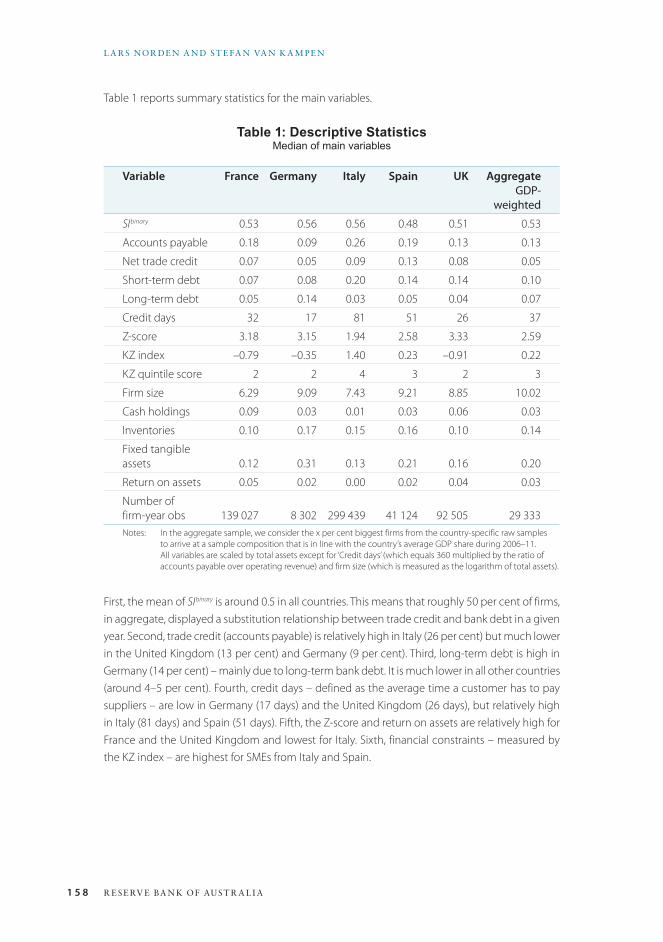
1 5 8 R E SE RV E BA N K OF AUST R A L I A
L A R S NOR DE N A N D ST E FA N VA N K A M PE N
Table 1 reports summary statistics for the main variables.
Table 1: Descriptive StatisticsMedian of main variables
Variable France Germany Italy Spain UK AggregateGDP-
weighted
SI binary 0.53 0.56 0.56 0.48 0.51 0.53
Accounts payable 0.18 0.09 0.26 0.19 0.13 0.13
Net trade credit 0.07 0.05 0.09 0.13 0.08 0.05
Short-term debt 0.07 0.08 0.20 0.14 0.14 0.10
Long-term debt 0.05 0.14 0.03 0.05 0.04 0.07
Credit days 32 17 81 51 26 37
Z-score 3.18 3.15 1.94 2.58 3.33 2.59
KZ index –0.79 –0.35 1.40 0.23 –0.91 0.22
KZ quintile score 2 2 4 3 2 3
Firm size 6.29 9.09 7.43 9.21 8.85 10.02
Cash holdings 0.09 0.03 0.01 0.03 0.06 0.03
Inventories 0.10 0.17 0.15 0.16 0.10 0.14
Fixed tangible assets 0.12 0.31 0.13 0.21 0.16 0.20
Return on assets 0.05 0.02 0.00 0.02 0.04 0.03
Number of firm-year obs 139 027 8 302 299 439 41 124 92 505 29 333Notes: In the aggregate sample, we consider the x per cent biggest firms from the country-specific raw samples
to arrive at a sample composition that is in line with the country’s average GDP share during 2006–11. All variables are scaled by total assets except for ‘Credit days’ (which equals 360 multiplied by the ratio of accounts payable over operating revenue) and firm size (which is measured as the logarithm of total assets).
First, the mean of SI binary is around 0.5 in all countries. This means that roughly 50 per cent of firms, in aggregate, displayed a substitution relationship between trade credit and bank debt in a given year. Second, trade credit (accounts payable) is relatively high in Italy (26 per cent) but much lower in the United Kingdom (13 per cent) and Germany (9 per cent). Third, long-term debt is high in Germany (14 per cent) – mainly due to long-term bank debt. It is much lower in all other countries (around 4–5 per cent). Fourth, credit days – defined as the average time a customer has to pay suppliers – are low in Germany (17 days) and the United Kingdom (26 days), but relatively high in Italy (81 days) and Spain (51 days). Fifth, the Z-score and return on assets are relatively high for France and the United Kingdom and lowest for Italy. Sixth, financial constraints – measured by the KZ index – are highest for SMEs from Italy and Spain.

1 5 9CON F E R E NC E VOLU M E | 2 015
T H E DY NA M IC S OF T R A DE CR EDI T A N D BA N K DEBT I N SM E F I NA NCE: I N T ER NAT IONA L EV I DENCE
4. Empirical Results
4.1 The probability of substitutionFirst, we investigate the factors that potentially influence the probability of substitution towards trade credit after a shock to SMEs’ bank debt in the previous year. We take the binary substitution indicator (SI binary) as the dependent variable and use the lagged credit quality (Z-score) and indicators for the different stages of the financial crisis as the main explanatory variables. We add lags of firm size, cash holdings, inventories, tangible assets, and return on assets as control variables.
Table 2 presents the results. We report the effects as odds ratios (i.e. values above one indicate a positive effect; values below one indicate a negative effect). In columns (1)–(5) we control for industry fixed effects and column (6) for industry and country fixed effects.
We find that firms’ credit quality (Zit – 1) has a positive effect on the probability of substitution across the board. This result implies that low credit quality firms – the ones that are most likely to have been hit by a shock to their bank debt during the financial crisis – cannot as easily substitute towards trade credit as higher credit quality firms, contrary to what is suggested by the existing literature. The highest impact of credit quality is found for SMEs from Italy (1.307). We further find that the probability of a firm displaying a substitution relationship decreases significantly during the crisis. Compared with pre-crisis, the probability of a firm displaying a substitution relationship is 28.7 per cent lower during the first stage of the crisis and 59.5 per cent lower during the second stage. The probability of a firm displaying a substitution relationship after the crisis is not significantly different from the pre-crisis years in Germany and in the aggregate sample. In contrast, it is significantly lower in France, Italy and Spain. In unreported analysis, we confirm the findings of column (6) with variables that are demeaned at the country-level median.
This analysis provides differentiated evidence on the dynamics of trade credit and bank debt at the firm level and indicates important differences across countries and over time.
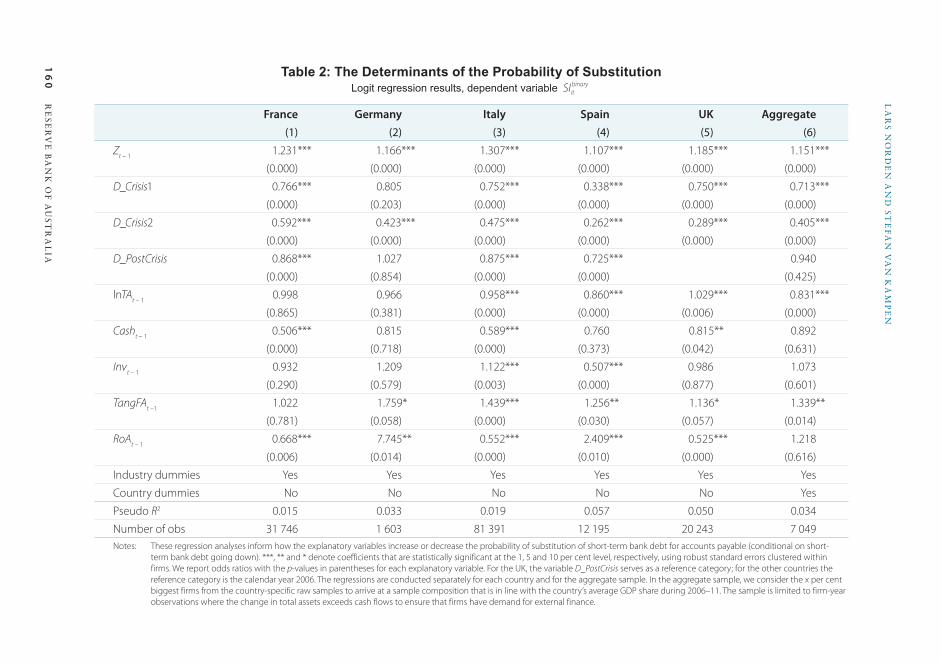
16
0R
ES
ER
VE
BA
NK
OF
AU
ST
RA
LIA
LA
RS
NO
RD
EN
AN
D S
TE
FA
N V
AN
KA
MP
EN
Table 2: The Determinants of the Probability of SubstitutionLogit regression results, dependent variable SIit
binary
France Germany Italy Spain UK Aggregate(1) (2) (3) (4) (5) (6)
Zt – 1 1.231*** 1.166*** 1.307*** 1.107*** 1.185*** 1.151***
(0.000) (0.000) (0.000) (0.000) (0.000) (0.000)
D_Crisis1 0.766*** 0.805 0.752*** 0.338*** 0.750*** 0.713***
(0.000) (0.203) (0.000) (0.000) (0.000) (0.000)
D_Crisis2 0.592*** 0.423*** 0.475*** 0.262*** 0.289*** 0.405***
(0.000) (0.000) (0.000) (0.000) (0.000) (0.000)
D_PostCrisis 0.868*** 1.027 0.875*** 0.725*** 0.940
(0.000) (0.854) (0.000) (0.000) (0.425)
lnTAt – 1 0.998 0.966 0.958*** 0.860*** 1.029*** 0.831***
(0.865) (0.381) (0.000) (0.000) (0.006) (0.000)
Casht – 1 0.506*** 0.815 0.589*** 0.760 0.815** 0.892
(0.000) (0.718) (0.000) (0.373) (0.042) (0.631)
Invt – 1 0.932 1.209 1.122*** 0.507*** 0.986 1.073
(0.290) (0.579) (0.003) (0.000) (0.877) (0.601)
TangFAt –1 1.022 1.759* 1.439*** 1.256** 1.136* 1.339**
(0.781) (0.058) (0.000) (0.030) (0.057) (0.014)
RoAt – 1 0.668*** 7.745** 0.552*** 2.409*** 0.525*** 1.218
(0.006) (0.014) (0.000) (0.010) (0.000) (0.616)
Industry dummies Yes Yes Yes Yes Yes Yes
Country dummies No No No No No Yes
Pseudo R2 0.015 0.033 0.019 0.057 0.050 0.034
Number of obs 31 746 1 603 81 391 12 195 20 243 7 049Notes: These regression analyses inform how the explanatory variables increase or decrease the probability of substitution of short-term bank debt for accounts payable (conditional on short-
term bank debt going down). ***, ** and * denote coefficients that are statistically significant at the 1, 5 and 10 per cent level, respectively, using robust standard errors clustered within firms. We report odds ratios with the p-values in parentheses for each explanatory variable. For the UK, the variable D_PostCrisis serves as a reference category; for the other countries the reference category is the calendar year 2006. The regressions are conducted separately for each country and for the aggregate sample. In the aggregate sample, we consider the x per cent biggest firms from the country-specific raw samples to arrive at a sample composition that is in line with the country’s average GDP share during 2006–11. The sample is limited to firm-year observations where the change in total assets exceeds cash flows to ensure that firms have demand for external finance.
1 6 1CON F E R E NC E VOLU M E | 2 015
T H E DY NA M IC S OF T R A DE CR EDI T A N D BA N K DEBT I N SM E F I NA NCE: I N T ER NAT IONA L EV I DENCE
4.2 The effect of firm sizeWe now investigate whether firms’ ability to replace bank debt with trade credit depends on firm size, as well as financial constraints. We follow a different strategy than Carbó-Valverde et al (forthcoming).
First, we consider potential interaction effects with firm size. For this purpose, we create country-specific firm size tercile dummies and interact these dummies with the Z-score. The fact that we focus on SMEs already creates a relatively homogenous sample (i.e. we leave aside large and listed companies that can access capital markets to raise external finance). Nonetheless, there might be differences between micro-, small and medium-sized enterprises. Moreover, the distribution of firm size and Z-score differs across countries.
Table 3 confirms the baseline effect from Table 2. The Z-score is significant and positive in all samples and the magnitude of the effect varies by country, as in Table 2.
We find that the sensitivity of the probability of a firm displaying a substitution relationship to firm credit quality is lower for bigger firms, as indicated by odds ratios below one for the interaction between the Z-score and the mid-tercile dummy (D_Size2) and upper-tercile dummy (D_Size3). This effect is mainly present in firms from Italy and to some extent also in firms from Spain. It is not found for firms from Germany. We see two explanations for these results. First, larger firms tend to have a higher bargaining power vis-à-vis their suppliers, which might offset negative effects from a deterioration of their credit quality. As a result, the probability of substitution becomes less sensitive to the Z-score, as found for Italy. Second, the sample of Italian firms is the largest in our dataset and heterogeneity in firm size and the Z-score is smaller than in the sample of German firms.
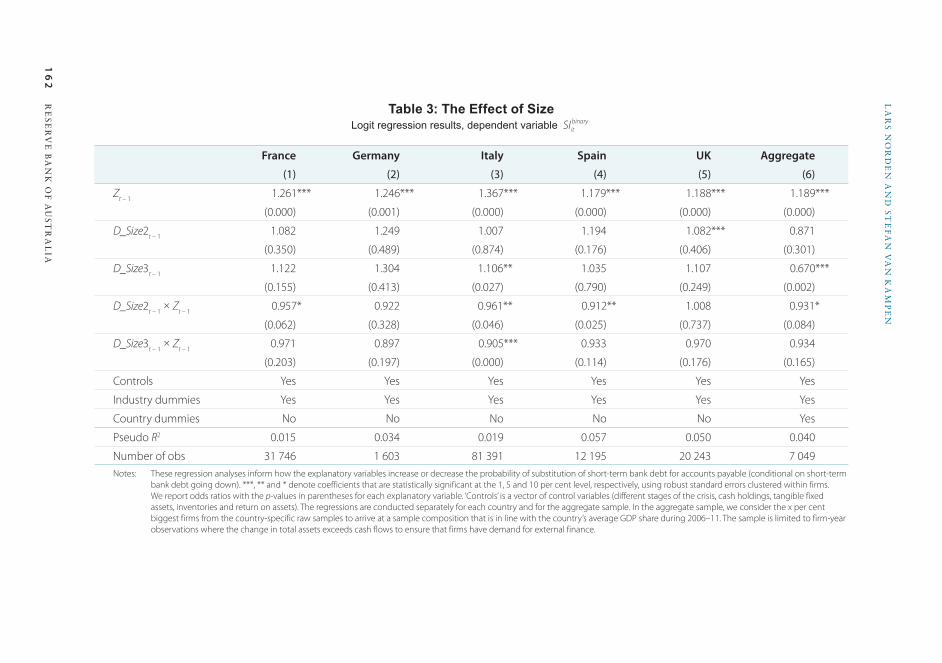
16
2R
ES
ER
VE
BA
NK
OF
AU
ST
RA
LIA
LA
RS
NO
RD
EN
AN
D S
TE
FA
N V
AN
KA
MP
EN
Table 3: The Effect of SizeLogit regression results, dependent variable SIit
binary
France Germany Italy Spain UK Aggregate
(1) (2) (3) (4) (5) (6)
Zt – 1 1.261*** 1.246*** 1.367*** 1.179*** 1.188*** 1.189***
(0.000) (0.001) (0.000) (0.000) (0.000) (0.000)
D_Size2t – 1 1.082 1.249 1.007 1.194 1.082*** 0.871
(0.350) (0.489) (0.874) (0.176) (0.406) (0.301)
D_Size3t – 1 1.122 1.304 1.106** 1.035 1.107 0.670***
(0.155) (0.413) (0.027) (0.790) (0.249) (0.002)
D_Size2t – 1 × Zt – 1 0.957* 0.922 0.961** 0.912** 1.008 0.931*
(0.062) (0.328) (0.046) (0.025) (0.737) (0.084)
D_Size3t – 1 × Zt – 1 0.971 0.897 0.905*** 0.933 0.970 0.934
(0.203) (0.197) (0.000) (0.114) (0.176) (0.165)
Controls Yes Yes Yes Yes Yes Yes
Industry dummies Yes Yes Yes Yes Yes Yes
Country dummies No No No No No Yes
Pseudo R2 0.015 0.034 0.019 0.057 0.050 0.040
Number of obs 31 746 1 603 81 391 12 195 20 243 7 049Notes: These regression analyses inform how the explanatory variables increase or decrease the probability of substitution of short-term bank debt for accounts payable (conditional on short-term
bank debt going down). ***, ** and * denote coefficients that are statistically significant at the 1, 5 and 10 per cent level, respectively, using robust standard errors clustered within firms. We report odds ratios with the p-values in parentheses for each explanatory variable. ‘Controls’ is a vector of control variables (different stages of the crisis, cash holdings, tangible fixed assets, inventories and return on assets). The regressions are conducted separately for each country and for the aggregate sample. In the aggregate sample, we consider the x per cent biggest firms from the country-specific raw samples to arrive at a sample composition that is in line with the country’s average GDP share during 2006–11. The sample is limited to firm-year observations where the change in total assets exceeds cash flows to ensure that firms have demand for external finance.
1 6 3CON F E R E NC E VOLU M E | 2 015
T H E DY NA M IC S OF T R A DE CR EDI T A N D BA N K DEBT I N SM E F I NA NCE: I N T ER NAT IONA L EV I DENCE
4.3 The effect of financial constraintsIn the next step, we examine whether there are interaction effects between firm credit quality and financial constraints. As pointed out in the related literature, financial constraints and financial distress (default risk) are related but clearly not identical concepts. Financial constraints are rooted in informational asymmetries that lead to relatively high costs of external finance and a potential mismatch between growth and funding opportunities. Financial distress – or firms’ credit quality – refers to the probability of default and depends on firm-specific and economy-wide factors, such as leverage, profitability and macroeconomic conditions. As noted in Section 3.3, we measure financial constraints by the KZ index, which is firm specific and time varying. It is a widely used measure of financial constraints.6
In the following regression, we interact the Z-score with KZ index quintile dummies to investigate whether there is an interaction between these two characteristics and the probability of a firm displaying a substitution relationship between trade credit and bank debt. Table 4 reports the results.
This analysis yields a clear result. For all five countries and in the aggregate sample we find an inverse U-shaped pattern in the sensitivity of the probability of substitution to the interaction term of credit quality and financial constraints.
First, the results suggest that the credit quality of SMEs with intermediate financial constraints matters most for the probability of substitution. For firms with low and high financial constraints, the impact of credit quality on the probability of substitution is weaker – but for different reasons. For the low-constraints group, the need for substitution is lower because they might have access to alternative sources of external finance. For the high-constraints group, it is likely that credit rationing is at work: firms are rejected across the board, irrespective of their credit quality.
Second, there are level effects across countries. Both the single-term effects and interaction-term effects are most pronounced in Italy and Spain; they are qualitatively similar but smaller in France, the United Kingdom and Germany.
6 There has been discussion in the literature about how to measure corporate financial constraints, and this has led to different indices that are based on different concepts. For a recent discussion, see Hadlock and Pierce (2010) and Farre-Mensa and Ljungqvist (2013).
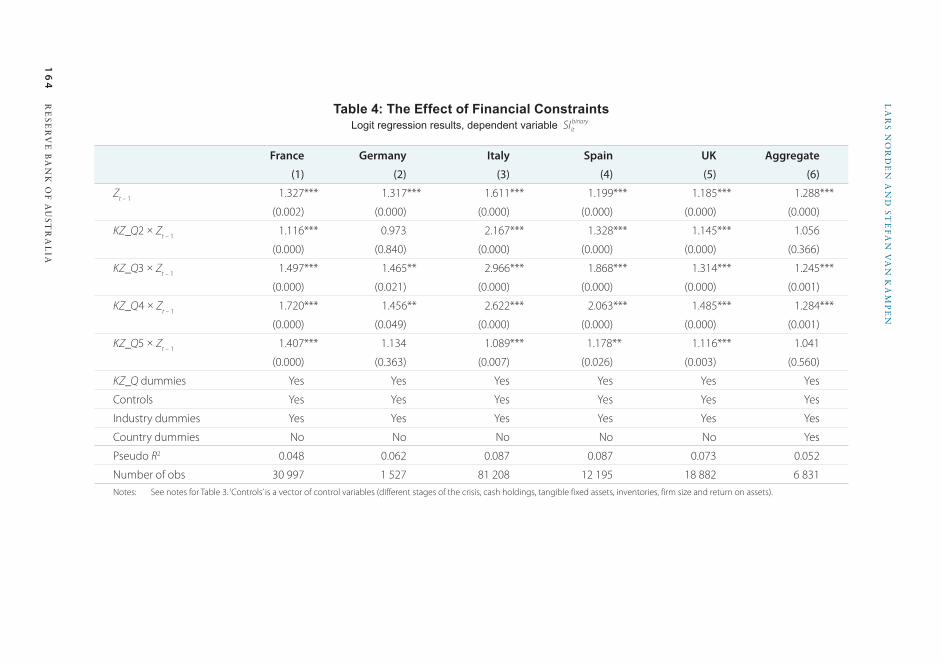
16
4R
ES
ER
VE
BA
NK
OF
AU
ST
RA
LIA
LA
RS
NO
RD
EN
AN
D S
TE
FA
N V
AN
KA
MP
EN
Table 4: The Effect of Financial ConstraintsLogit regression results, dependent variable SIit
binary
France Germany Italy Spain UK Aggregate
(1) (2) (3) (4) (5) (6)
Zt – 1 1.327*** 1.317*** 1.611*** 1.199*** 1.185*** 1.288***
(0.002) (0.000) (0.000) (0.000) (0.000) (0.000)
KZ_Q2 × Zt – 1 1.116*** 0.973 2.167*** 1.328*** 1.145*** 1.056
(0.000) (0.840) (0.000) (0.000) (0.000) (0.366)
KZ_Q3 × Zt – 1 1.497*** 1.465** 2.966*** 1.868*** 1.314*** 1.245***
(0.000) (0.021) (0.000) (0.000) (0.000) (0.001)
KZ_Q4 × Zt – 1 1.720*** 1.456** 2.622*** 2.063*** 1.485*** 1.284***
(0.000) (0.049) (0.000) (0.000) (0.000) (0.001)
KZ_Q5 × Zt – 1 1.407*** 1.134 1.089*** 1.178** 1.116*** 1.041
(0.000) (0.363) (0.007) (0.026) (0.003) (0.560)
KZ_Q dummies Yes Yes Yes Yes Yes Yes
Controls Yes Yes Yes Yes Yes Yes
Industry dummies Yes Yes Yes Yes Yes Yes
Country dummies No No No No No Yes
Pseudo R2 0.048 0.062 0.087 0.087 0.073 0.052
Number of obs 30 997 1 527 81 208 12 195 18 882 6 831Notes: See notes for Table 3. ‘Controls’ is a vector of control variables (different stages of the crisis, cash holdings, tangible fixed assets, inventories, firm size and return on assets).

1 6 5CON F E R E NC E VOLU M E | 2 015
T H E DY NA M IC S OF T R A DE CR EDI T A N D BA N K DEBT I N SM E F I NA NCE: I N T ER NAT IONA L EV I DENCE
4.4 Stages of the financial crisis We continue the analysis by investigating how the sensitivity of the probability of substitution to credit quality varies in the different stages of the financial crisis. We split the sample period into a pre-crisis period (2006–07), first stage of the crisis (2008), second stage of the crisis (2009) and post-crisis period (2010–11).7 We then interact the indicator variables for these stages with the Z-score. Table 5 presents the results.
We find that the probability of a firm displaying a substitution relationship decreased significantly in the first stage of the crisis in Spain and the United Kingdom and decreased strongly in all countries in the second stage of the crisis. This effect is most pronounced for firms from Spain.
The interaction terms of the Z-score and the stages of the crises are mostly statistically significant and are below one. This finding together with the single-term effects suggests that the proportion of firms able to substitute went down during the crisis. Moreover, the likelihood of a firm substituting trade credit for bank debt became increasingly disconnected from credit quality. Overall, the evidence shows that trade credit has only limited scope to replace the gap when banks cut their lending to SMEs.
7 For the United Kingdom, we use 2007 for the first stage of the crisis and do not have data for a pre-crisis stage because we use one-year lags of the explanatory variables in our regression models.
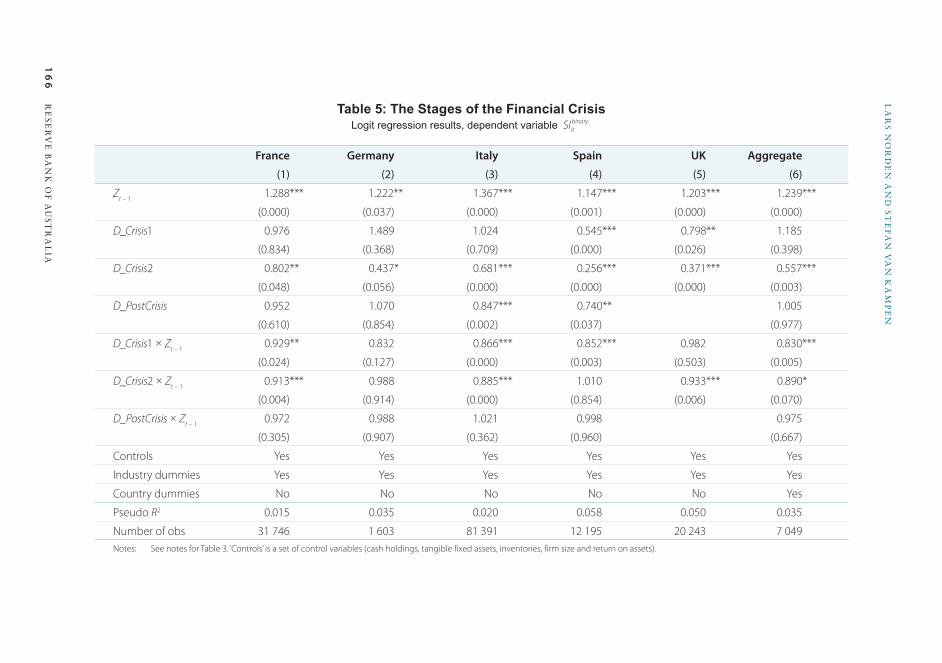
16
6R
ES
ER
VE
BA
NK
OF
AU
ST
RA
LIA
LA
RS
NO
RD
EN
AN
D S
TE
FA
N V
AN
KA
MP
EN
Table 5: The Stages of the Financial CrisisLogit regression results, dependent variable SIit
binary
France Germany Italy Spain UK Aggregate
(1) (2) (3) (4) (5) (6)
Zt – 1 1.288*** 1.222** 1.367*** 1.147*** 1.203*** 1.239***
(0.000) (0.037) (0.000) (0.001) (0.000) (0.000)
D_Crisis1 0.976 1.489 1.024 0.545*** 0.798** 1.185
(0.834) (0.368) (0.709) (0.000) (0.026) (0.398)
D_Crisis2 0.802** 0.437* 0.681*** 0.256*** 0.371*** 0.557***
(0.048) (0.056) (0.000) (0.000) (0.000) (0.003)
D_PostCrisis 0.952 1.070 0.847*** 0.740** 1.005
(0.610) (0.854) (0.002) (0.037) (0.977)
D_Crisis1 × Zt – 1 0.929** 0.832 0.866*** 0.852*** 0.982 0.830***
(0.024) (0.127) (0.000) (0.003) (0.503) (0.005)
D_Crisis2 × Zt – 1 0.913*** 0.988 0.885*** 1.010 0.933*** 0.890*
(0.004) (0.914) (0.000) (0.854) (0.006) (0.070)
D_PostCrisis × Zt – 1 0.972 0.988 1.021 0.998 0.975
(0.305) (0.907) (0.362) (0.960) (0.667)
Controls Yes Yes Yes Yes Yes Yes
Industry dummies Yes Yes Yes Yes Yes Yes
Country dummies No No No No No Yes
Pseudo R2 0.015 0.035 0.020 0.058 0.050 0.035
Number of obs 31 746 1 603 81 391 12 195 20 243 7 049Notes: See notes for Table 3. ‘Controls’ is a set of control variables (cash holdings, tangible fixed assets, inventories, firm size and return on assets).
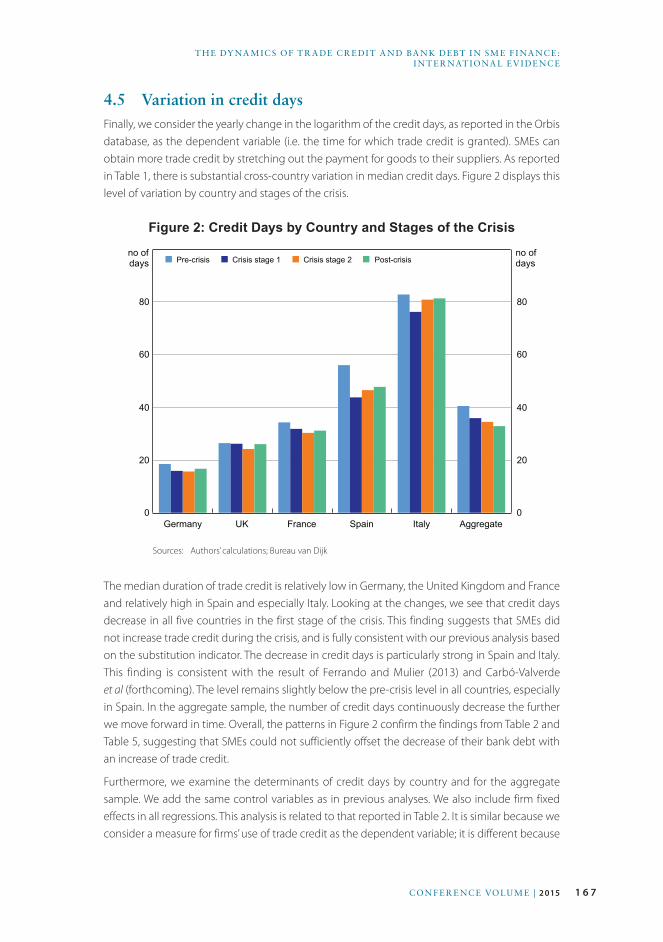
1 6 7CON F E R E NC E VOLU M E | 2 015
T H E DY NA M IC S OF T R A DE CR EDI T A N D BA N K DEBT I N SM E F I NA NCE: I N T ER NAT IONA L EV I DENCE
4.5 Variation in credit daysFinally, we consider the yearly change in the logarithm of the credit days, as reported in the Orbis database, as the dependent variable (i.e. the time for which trade credit is granted). SMEs can obtain more trade credit by stretching out the payment for goods to their suppliers. As reported in Table 1, there is substantial cross-country variation in median credit days. Figure 2 displays this level of variation by country and stages of the crisis.
Figure 2: Credit Days by Country and Stages of the Crisis
Germany UK France Spain Italy Aggregate0
20
40
60
80
0
20
40
60
80
no ofdays■ Pre-crisis ■ Crisis stage 1 ■ Crisis stage 2 ■ Post-crisis
no ofdays
Sources: Authors’ calculations; Bureau van Dijk
The median duration of trade credit is relatively low in Germany, the United Kingdom and France and relatively high in Spain and especially Italy. Looking at the changes, we see that credit days decrease in all five countries in the first stage of the crisis. This finding suggests that SMEs did not increase trade credit during the crisis, and is fully consistent with our previous analysis based on the substitution indicator. The decrease in credit days is particularly strong in Spain and Italy. This finding is consistent with the result of Ferrando and Mulier (2013) and Carbó-Valverde et al (forthcoming). The level remains slightly below the pre-crisis level in all countries, especially in Spain. In the aggregate sample, the number of credit days continuously decrease the further we move forward in time. Overall, the patterns in Figure 2 confirm the findings from Table 2 and Table 5, suggesting that SMEs could not sufficiently offset the decrease of their bank debt with an increase of trade credit.
Furthermore, we examine the determinants of credit days by country and for the aggregate sample. We add the same control variables as in previous analyses. We also include firm fixed effects in all regressions. This analysis is related to that reported in Table 2. It is similar because we consider a measure for firms’ use of trade credit as the dependent variable; it is different because
1 6 8 R E SE RV E BA N K OF AUST R A L I A
L A R S NOR DE N A N D ST E FA N VA N K A M PE N
instead of examining the trade-off between bank debt and trade credit we here examine the change in the duration of trade credit (and we ignore what happens to firms’ bank debt). Table 6 reports the results.
We obtain several findings that are in line with previous analyses. The coefficients of the Z-score are significantly positive in all samples. Hence, the better the credit quality of a firm, the longer the firm’s credit days. The findings on the stages of the crisis and the interaction with credit quality are quite different across countries – as expected given the patterns presented in Figure 2. For instance, in the first stage of the crisis we see an increase of credit days in Italy, while credit days decreased in Spain. Moreover, credit days develop similarly in France, Germany and the United Kingdom. For these three countries, the coefficients for the different stages of the crisis and the post-crisis indicator variable are all negative (and most of them are statistically significant). Finally, the interaction term of D_Crisis2 and the Z-score is positive and statistically significant in France, Germany and Spain. The interaction term of D_PostCrisis and the Z-score is positive and statistically significant in France, Italy and the United Kingdom. These findings indicate that higher credit quality firms could use more trade credit during and after the crisis.
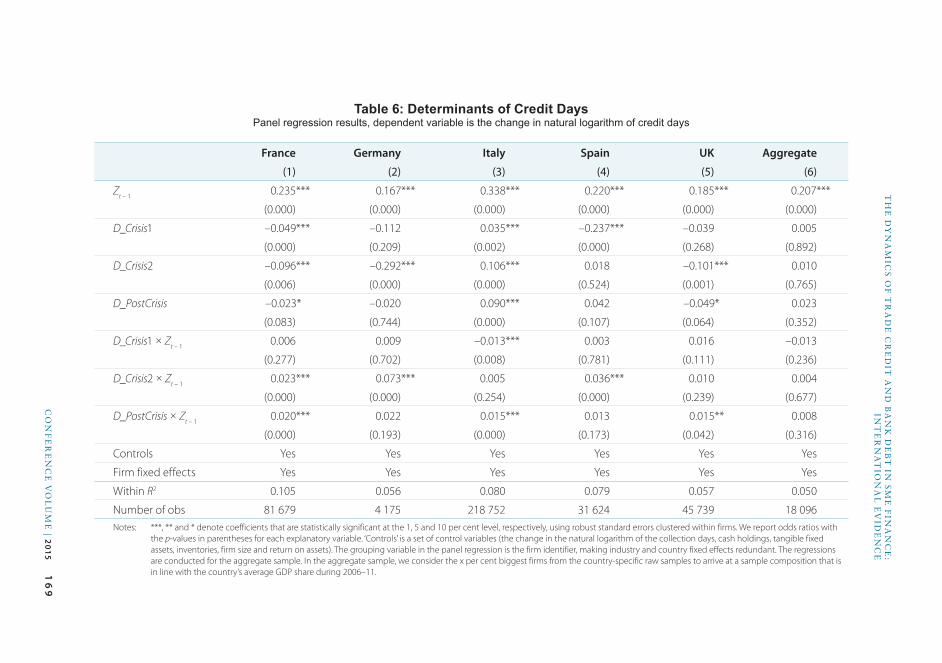
16
9C
ON
FE
RE
NC
E V
OL
UM
E | 2
015
TH
E D
YN
AM
ICS
OF
TR
AD
E C
RE
DIT
AN
D B
AN
K D
EB
T IN
SM
E F
INA
NC
E:
INT
ER
NA
TIO
NA
L E
VID
EN
CE
Table 6: Determinants of Credit DaysPanel regression results, dependent variable is the change in natural logarithm of credit days
France Germany Italy Spain UK Aggregate
(1) (2) (3) (4) (5) (6)
Zt – 1 0.235*** 0.167*** 0.338*** 0.220*** 0.185*** 0.207***
(0.000) (0.000) (0.000) (0.000) (0.000) (0.000)
D_Crisis1 –0.049*** –0.112 0.035*** –0.237*** –0.039 0.005
(0.000) (0.209) (0.002) (0.000) (0.268) (0.892)
D_Crisis2 –0.096*** –0.292*** 0.106*** 0.018 –0.101*** 0.010
(0.006) (0.000) (0.000) (0.524) (0.001) (0.765)
D_PostCrisis –0.023* –0.020 0.090*** 0.042 –0.049* 0.023
(0.083) (0.744) (0.000) (0.107) (0.064) (0.352)
D_Crisis1 × Zt – 1 0.006 0.009 –0.013*** 0.003 0.016 –0.013
(0.277) (0.702) (0.008) (0.781) (0.111) (0.236)
D_Crisis2 × Zt – 1 0.023*** 0.073*** 0.005 0.036*** 0.010 0.004
(0.000) (0.000) (0.254) (0.000) (0.239) (0.677)
D_PostCrisis × Zt – 1 0.020*** 0.022 0.015*** 0.013 0.015** 0.008
(0.000) (0.193) (0.000) (0.173) (0.042) (0.316)
Controls Yes Yes Yes Yes Yes Yes
Firm fixed effects Yes Yes Yes Yes Yes Yes
Within R2 0.105 0.056 0.080 0.079 0.057 0.050
Number of obs 81 679 4 175 218 752 31 624 45 739 18 096Notes: ***, ** and * denote coefficients that are statistically significant at the 1, 5 and 10 per cent level, respectively, using robust standard errors clustered within firms. We report odds ratios with
the p-values in parentheses for each explanatory variable. ‘Controls’ is a set of control variables (the change in the natural logarithm of the collection days, cash holdings, tangible fixed assets, inventories, firm size and return on assets). The grouping variable in the panel regression is the firm identifier, making industry and country fixed effects redundant. The regressions are conducted for the aggregate sample. In the aggregate sample, we consider the x per cent biggest firms from the country-specific raw samples to arrive at a sample composition that is in line with the country’s average GDP share during 2006–11.
1 7 0 R E SE RV E BA N K OF AUST R A L I A
L A R S NOR DE N A N D ST E FA N VA N K A M PE N
5. ConclusionWe investigate the dynamics of trade credit and bank debt at the firm level and the variation in these dynamics over time and across countries. We focus on SMEs because they are more opaque, riskier, more credit constrained and more bank dependent than large firms. We base our analysis on a new multinomial measure, the substitution indicator, which we apply to a large dataset comprising SMEs from the five largest European Union countries during 2006–11. This measure makes it possible to examine the relative importance of trade credit and bank debt at the firm level over time.
We find that firms are almost equally likely to display substitution and complementary relationships between bank debt and trade credit, but there is substantial cross-country and time variation. The probability of a firm substituting toward trade credit after a negative shock to their bank debt is significantly higher if the firm has higher credit quality. The probability of a firm substituting into trade credit decreased in the first stage of the financial crisis and further decreased in the second stage of the crisis compared with the pre-crisis period. Interestingly, the effect of credit quality on the probability of substitution shows an inverse U-shaped pattern in the level of financial constraints in all countries. Credit quality matters most for firms with intermediate financial constraints, while it is less important for the least- and most-constrained firms.
The interplay of bank debt and trade credit is much more complex than suggested in earlier studies. We conclude that trade credit has limited scope to replace the funding gap when banks cut lending to SMEs. High credit quality firms are more likely to attract trade credit, regardless of the nature of the shock to bank debt. The dynamics of trade credit and bank debt change from a substitution relationship in the pre-crisis period to a negative complementary relationship during the financial crisis. Finally, there are significant cross-country differences in the importance of firm risk characteristics on SMEs’ ability to substitute between bank debt and trade credit. Our study provides differentiated evidence on the dynamics of trade credit and bank debt in SME finance and has implications for the institutional and legal design of the lending environment and economic policy.
1 7 1CON F E R E NC E VOLU M E | 2 015
T H E DY NA M IC S OF T R A DE CR EDI T A N D BA N K DEBT I N SM E F I NA NCE: I N T ER NAT IONA L EV I DENCE
ReferencesAgarwal V and RJ Taffler (2007), ‘Twenty-Five Years of the Taffler Z-Score Model: Does it Really have
Predictive Ability?’, Accounting and Business Research, 37(4), pp 285–300.
Altman EI (1968), ‘Financial Ratios, Discriminant Analysis and the Prediction of Corporate Bankruptcy’,
The Journal of Finance, 23(4), pp 589–609.
Altman EI (2000), ‘Predicting Financial Distress of Companies: Revisiting the Z-Score and Zeta® Model’,
Unpublished manuscript, New York University, July.
Bastos R and J Pindado (2013), ‘Trade Credit during a Financial Crisis: A Panel Data Analysis’, Journal of
Business Research, 66(5), pp 614–620.
Beck T and A Demirgüç-Kunt (2006), ‘Small and Medium-Size Enterprises: Access to Finance as a Growth
Constraint’, Journal of Banking & Finance, 30(11), pp 2931–2943.
Beck T, A Demirgüç-Kunt and V Maksimovic (2004), ‘Bank Competition and Access to Finance: International
Evidence’, Journal of Money, Credit and Banking, 36(3, Part 2), pp 627–648.
Beck T, R Levine and N Loayza (2000), ‘Finance and the Sources of Growth’, Journal of Financial Economics,
58(1–2), pp 261–300.
Becker B and V Ivashina (2014), ‘Cyclicality of Credit Supply: Firm Level Evidence’, Journal of Monetary
Economics, 62, pp 76–93.
Berger AN and GF Udell (2002), ‘Small Business Credit Availability and Relationship Lending: The Importance
of Bank Organisational Structure’, The Economic Journal, 112(477), pp F32–F53.
Berger AN and GF Udell (2006), ‘A More Complete Conceptual Framework for SME Finance’, Journal of
Banking & Finance, 30(11), pp 2945–2966.
Biais B and C Gollier (1997), ‘Trade Credit and Credit Rationing’, The Review of Financial Studies, 10(4),
pp 903–937.
Boissay F and R Gropp (2013), ‘Payment Defaults and Interfirm Liquidity Provision’, Review of Finance, 17(6),
pp 1853–1894.
Campello M and E Giambona (2013), ‘Real Assets and Capital Structure’, Journal of Financial and Quantitative
Analysis, 48(5), pp 1333–1370.
Carbó-Valverde S, F Rodriguez-Fernandez and GF Udell (forthcoming), ‘Trade Credit, the Financial Crisis,
and SME Access to Finance’, Journal of Money, Credit and Banking.
Cuñat V (2007), ‘Trade Credit: Suppliers as Debt Collectors and Insurance Providers’, The Review of Financial
Studies, 20(2), pp 491–527.
Demirgüç-Kunt A and V Maksimovic (2002), ‘Funding Growth in Bank-Based and Market-Based Financial
Systems: Evidence from Firm-Level Data’, Journal of Financial Economics, 65(3), pp 337–363.
Emery GW (1987), ‘An Optimal Financial Response to Variable Demand’, Journal of Financial and Quantitative
Analysis, 22(2), pp 209–225.
European Commission (2005), The New SME Definition: User Guide and Model Declaration, Enterprise and
Industry Publications, European Commission, Luxembourg.
Farre-Mensa J and A Ljungqvist (2013), ‘Do Measures of Financial Constraints Measure Financial
Constraints?’, NBER Working Paper No 19551.
1 7 2 R E SE RV E BA N K OF AUST R A L I A
L A R S NOR DE N A N D ST E FA N VA N K A M PE N
Ferrando A and K Mulier (2013), ‘Do Firms Use the Trade Credit Channel to Manage Growth?’, Journal of
Banking & Finance, 37(8), pp 3035–3046.
Fisman R and I Love (2003), ‘Trade Credit, Financial Intermediary Development, and Industry Growth’,
The Journal of Finance, 58(1), pp 353–374.
Garcia-Appendini E and J Montoriol-Garriga (2013), ‘Firms as Liquidity Providers: Evidence from the
2007–2008 Financial Crisis’, Journal of Financial Economics, 109(1), pp 272–291.
Gertler M and S Gilchrist (1994), ‘Monetary Policy, Business Cycles, and the Behavior of Small Manufacturing
Firms’, The Quarterly Journal of Economics, 109(2), pp 309–340.
Giannetti M (2003), ‘Bank–Firm Relationships and Contagious Banking Crises’, Journal of Money, Credit and
Banking, 35(2), pp 239–261.
Giannetti M, M Burkart and T Ellingsen (2011), ‘What You Sell Is What You Lend? Explaining Trade Credit
Contracts’, The Review of Financial Studies, 24(4), pp 1261–1298.
Hadlock CJ and JR Pierce (2010), ‘New Evidence on Measuring Financial Constraints: Moving Beyond the
KZ Index’, The Review of Financial Studies, 23(5), pp 1909–1940.
Haselmann R, K Pistor and V Vig (2010), ‘How Law Affects Lending’, The Review of Financial Studies, 23(2),
pp 549–580.
Ivashina V and D Scharfstein (2010), ‘Bank Lending during the Financial Crisis of 2008’, Journal of Financial
Economics, 97(3), pp 319–338.
Jacobson T and E von Schedvin (2015), ‘Trade Credit and the Propagation of Corporate Failure: An Empirical
Analysis’, Econometrica, 83(4), pp 1315–1371.
Jain N (2001), ‘Monitoring Costs and Trade Credit’, The Quarterly Review of Economics and Finance, 41(1),
pp 89–110.
Jorion P and G Zhang (2009), ‘Credit Contagion from Counterparty Risk’, The Journal of Finance, 64(5),
pp 2053–2087.
Kahle KM and RM Stulz (2013), ‘Access to Capital, Investment, and the Financial Crisis’, Journal of Financial
Economics, 110(2), pp 280–299.
Kaplan SN and L Zingales (1997), ‘Do Investment-Cash Flow Sensitivities Provide Useful Measures of
Financing Constraints?’, The Quarterly Journal of Economics, 112(1), pp 169–215.
Kestens K, P Van Cauwenberge and H Vander Bauwhede (2012), ‘Trade Credit and Company Performance
during the 2008 Financial Crisis’, Accounting & Finance, 52(4), pp 1125–1151.
King RG and R Levine (1993a), ‘Finance and Growth: Schumpeter Might Be Right’, The Quarterly Journal of
Economics, 108(3), pp 717–737.
King RG and R Levine (1993b), ‘Finance, Entrepreneurship and Growth: Theory and Evidence’, Journal of
Monetary Economics, 32(3), pp 513–542.
La Porta R, F Lopez-de-Silanes, A Shleifer and RW Vishny (1997), ‘Legal Determinants of External Finance’,
The Journal of Finance, 52(3), pp 1131–1150.
Liu V (2014), ‘Impact of Bank Lending on Trade Credit’, Job Market Paper, Department of Economics,
Princeton University.
Love I, LA Preve and V Sarria-Allende (2007), ‘Trade Credit and Bank Credit: Evidence from Recent Financial
Crises’, Journal of Financial Economics, 83(2), pp 453–469.
1 7 3CON F E R E NC E VOLU M E | 2 015
T H E DY NA M IC S OF T R A DE CR EDI T A N D BA N K DEBT I N SM E F I NA NCE: I N T ER NAT IONA L EV I DENCE
Mian SL and CW Smith Jr (1992), ‘Accounts Receivable Management Policy: Theory and Evidence’,
The Journal of Finance, 47(1), pp 169–200.
Ng CK, JK Smith and RL Smith (1999), ‘Evidence on the Determinants of Credit Terms Used in Interfirm
Trade’, The Journal of Finance, 54(3), pp 1109–1129.
Nilsen JH (2002), ‘Trade Credit and the Bank Lending Channel’, Journal of Money, Credit and Banking, 34(1),
pp 226–253.
Norden L and S van Kampen (2013), ‘Corporate Leverage and the Collateral Channel’, Journal of Banking &
Finance, 37(12), pp 5062–5072.
Petersen MA and RG Rajan (1994), ‘The Benefits of Lending Relationships: Evidence from Small Business
Data’, The Journal of Finance, 49(1), pp 3–37.
Petersen MA and RG Rajan (1997), ‘Trade Credit: Theories and Evidence’, The Review of Financial Studies,
10(3), pp 661–691.
Puri M, J Rocholl and S Steffen (2011), ‘Global Retail Lending in the Aftermath of the US Financial Crisis:
Distinguishing between Supply and Demand Effects’, Journal of Financial Economics, 100(3), pp 556–578.
Rajan RG and L Zingales (1998), ‘Financial Dependence and Growth’, The American Economic Review, 88(3),
pp 559–586.
Smith JK (1987), ‘Trade Credit and Informational Asymmetry’, The Journal of Finance, 42(4), pp 863–872.
Yang X (2011), ‘The Role of Trade Credit in the Recent Subprime Financial Crisis’, Journal of Economics &
Business, 63(5), pp 517–529.
1 7 4 R E SE RV E BA N K OF AUST R A L I A
Discussion
1. Annalisa Ferrando*Trade credit is an important source of finance for firms, especially when firms find it difficult to obtain external funding via credit institutions. This channel is especially relevant in Europe because capital markets are less developed than in the United States. In this context, a long debated issue is whether trade credit and bank debt are external funding sources that are substitutes or complements for one another. The two possibilities have different implications for the business cycle. In the former case, economic activity will display higher volatility over time; in the latter case, trade credit might be an important mechanism for mitigating the effects of an adverse change in the availability of bank credit.
The main result of the paper is that, over the full sample period, substitution and complementarity between bank debt and trade credit are almost equally likely. During the crisis period, however, the probability of a negative complementary relationship more than doubled. Moreover, only firms with high credit quality and intermediate financial constraints were able to substitute between trade credit and bank loans.
Empirical evidence for the euro area is not clear cut (Ferrando and Mulier 2013). Figure 1 shows the growth of trade credit and short-term debt to non-financial corporations in the euro area. Over recent years, trade credit has moved broadly in line with the business cycle. This procyclical pattern of accounts payable is unsurprising, because accounts payable are closely linked to the exchange of goods and services and, hence, to economic activity. In general, trade credit has remained a stable source of finance for euro area companies but it tended to decline from 2005 to 2007, when bank credit was becoming easily accessible. During the recent financial crisis, there was an increase in the use of trade credit which likely compensated for the strong decline in short-term bank loans. Interestingly, the fact that the increase in the annual growth of accounts payable between non-financial firms has been more pronounced than the increase in nominal GDP growth may indicate that trade credit between companies has played a buffer role in the recent crisis. However, Figure 1 shows that in the first stages of the crisis the decline in trade credit was similar to the decline in bank debt – that is, these two sources of finance displayed a (negative) complementary relationship.
* The views expressed are those of the author and not necessarily those of the European Central Bank.
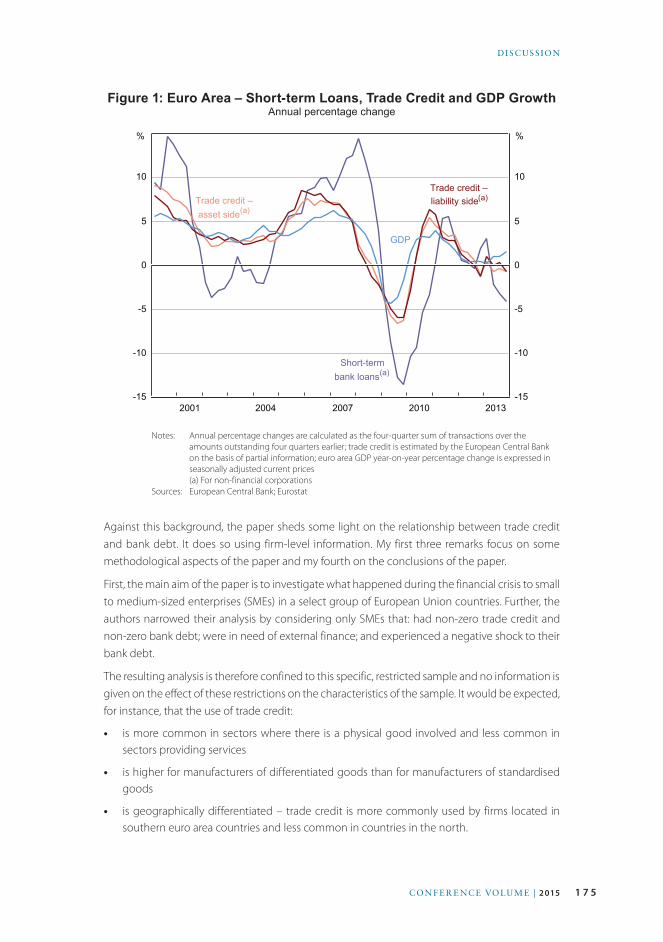
1 7 5CON F E R E NC E VOLU M E | 2 015
DISC US SION
Figure 1: Euro Area – Short-term Loans, Trade Credit and GDP GrowthAnnual percentage change
-15
-10
-5
0
5
10
-15
-10
-5
0
5
10
GDP
2013
%%
2010200720042001
Trade credit –asset side(a)
Short-termbank loans(a)
Trade credit –liability side(a)
Notes: Annual percentage changes are calculated as the four-quarter sum of transactions over the amounts outstanding four quarters earlier; trade credit is estimated by the European Central Bank on the basis of partial information; euro area GDP year-on-year percentage change is expressed in seasonally adjusted current prices
(a) For non-financial corporations Sources: European Central Bank; Eurostat
Against this background, the paper sheds some light on the relationship between trade credit and bank debt. It does so using firm-level information. My first three remarks focus on some methodological aspects of the paper and my fourth on the conclusions of the paper.
First, the main aim of the paper is to investigate what happened during the financial crisis to small to medium-sized enterprises (SMEs) in a select group of European Union countries. Further, the authors narrowed their analysis by considering only SMEs that: had non-zero trade credit and non-zero bank debt; were in need of external finance; and experienced a negative shock to their bank debt.
The resulting analysis is therefore confined to this specific, restricted sample and no information is given on the effect of these restrictions on the characteristics of the sample. It would be expected, for instance, that the use of trade credit:
• is more common in sectors where there is a physical good involved and less common in sectors providing services
• is higher for manufacturers of differentiated goods than for manufacturers of standardised goods
• is geographically differentiated – trade credit is more commonly used by firms located in southern euro area countries and less common in countries in the north.
1 7 6 R E SE RV E BA N K OF AUST R A L I A
DISC US SION
Hence, the sample analysed by the authors could differ from these characteristics and this could have implications for inferences about the overall economy.
Second, the paper finds that SMEs with lower credit quality have more difficulties in offsetting a shock to their short-term bank debt via trade credit. I would question whether the credit quality of firms is really so important for trade credit, or whether it is the ability of firms to produce goods or provide services that is more relevant. In contrast with the paper’s results, there is evidence that trade credit is used as an instrument of price discrimination and it is often extended to buyers on the same basis, regardless of the buyer’s credit quality. Hence, financially weaker firms typically pay lower effective prices than financially stronger borrowers (Fitzpatrick and Lien 2013). Furthermore, trade credit is also related to soft information/mutual trust (Berger and Udell 2006; Atradius 2014).
Third, the paper finds that there is a non-linear relationship between credit quality and financial constraints affecting the probability of substitution between trade credit and bank debt. My doubts are related to the robustness of these findings and, in particular, the variable used to define financial constraints. The paper uses the Kaplan-Zingales index (KZ index), which is one of most popular measures of financial constraints. The actual KZ index is the result of the work of Lamont, Polk and Saá-Requejo (2001), who estimated an ordered logit model relating the degree of financial constraints (based on the way firms were classified in Kaplan and Zingales (1997)) to five readily available accounting variables – cash flow, market value, debt, dividends and cash holdings – each scaled by total assets. The model is estimated on 49 firms that were categorised by their degree of financial constraints on the basis of other characteristics. The estimated regression coefficients can then be used to construct a KZ index score for any firm, using the coefficients from the original regression and the relevant accounting variables for the firm. A higher index value suggests that a firm is more constrained. The index loads positively on market-to-book ratio and leverage and negatively on cash flow, dividends and cash holdings. To summarise: it is an index based on estimations from the early 2000s on a sample of a very few US companies. Many papers have found weaknesses with this indicator in detecting financial constraints (Farre-Mensa and Ljungqvist 2013). My additional concern with the KZ index is the application of this indicator to European firms, which have different capital structures, cash management and institutional frameworks compared with the US firms on which the index was originally based.
I have suggested that the authors run some robustness checks using alternative measures of financial constraints. Such measures could be based on different a priori classifications or on business surveys, although there are limited data available. The European Central Bank has run a survey about access to finance and has used the replies of interviewed firms to construct an index of bank-constrained firms. These firms are defined as firms that applied for loans and were rejected or firms that did not apply for fear of rejection. This index could easily be used by the authors (ECB 2014).
My fourth, and final, comment is about the main result of the paper concerning the use of trade credit during the financial crisis. The paper claims that trade credit had limited scope to replace bank debt, particularly for firms that were facing financial constraints. I would question this strong conclusion on the basis of my previous remarks and also because other analysis that I and colleagues have carried out using survey data points to a different direction. In particular, we found that bank-constrained firms used trade credit as an alternative source of finance during the
1 7 7CON F E R E NC E VOLU M E | 2 015
DISC US SION
crisis (ECB 2015). However, bank-constrained firms in euro area stressed countries (countries that suffered from the combination of the financial crisis and the sovereign debt crisis) found it more difficult to substitute towards trade credit than firms in non-stressed countries.
To conclude, trade credit has played an important role during the financial crisis in Europe, but the interplay of bank debt and trade credit is complex. It depends on a variety of factors that go beyond the characteristics of firms and includes the overall economic conditions of the countries in which firms operate. A point for policy reflection is related to the different purposes attached to bank loans and trade credit. The purpose of an SME loan typically falls into one of three categories: working capital financing, fixed asset financing and acquisition financing. By contrast, trade credit is typically associated only with working capital financing (Udell this volume). Firms that receive credit or equity experience a cash inflow that can be used in a flexible way; firms that receive trade credit do not experience a cash inflow. This difference is important when considering the effect of trade credit and other finance on investment and growth decisions of firms.
ReferencesAtradius (2014), ‘Atradius Payment Practices Barometer: International Survey of B2B Payment Behaviour –
Survey Results for Western Europe’, May. Available at <http://www.atradius.co.uk/images/stories/PPB/ppb14_
we_regional_fin.pdf>.
Berger AN and GF Udell (2006), ‘A More Complete Conceptual Framework for SME Finance’, Journal of
Banking & Finance, 30(11), pp 2945–2966.
ECB (European Central Bank) (2014), ‘Box 4: Survey on the Access to Finance of Enterprises in the Euro
Area: April to September 2014’, ECB Monthly Bulletin, November, pp 38–42.
ECB (2015), ‘Box 6: Non-Bank Financing for Euro Area NFCs during the Crisis’, ECB Economic Bulletin, 4,
pp 49–51.
Farre-Mensa J and A Ljungqvist (2013), ‘Do Measures of Financial Constraints Measure Financial
Constraints?’, NBER Working Paper No 19551.
Ferrando A and K Mulier (2013), ‘Do Firms Use the Trade Credit Channel to Manage Growth?’, Journal of
Banking & Finance, 37(8), pp 3035–3046.
Fitzpatrick A and B Lien (2013), ‘The Use of Trade Credit by Businesses’, RBA Bulletin, September, pp 39–46.
Kaplan SN and L Zingales (1997), ‘Do Investment-Cash Flow Sensitivities Provide Useful Measures of
Financing Constraints?’, The Quarterly Journal of Economics, 112(1), pp 169–215.
Lamont O, C Polk and J Saá-Requejo (2001), ‘Financial Constraints and Stock Returns’, The Review of
Financial Studies, 14(2), pp 529–554.
2. General DiscussionDiscussion initially focused on the relationship between the use of trade credit and the size of the firm. One participant noted that the finding was intuitive: a big firm uses trade credit because it can, not because it needs to, as it has ready access to bank credit. On the other hand, a small firm may not have access to bank credit at all, so might have to rely on trade credit as its only source of finance.
1 7 8 R E SE RV E BA N K OF AUST R A L I A
DISC US SION
Participants then discussed the policy implications of the paper’s findings. A participant commented on the stark variation in the use of trade credit across countries, and asked to what extent encouraging the use of trade credit could alleviate current bank lending constraints in the European Union. They also noted that policymakers care about encouraging the financing of SMEs; having diverse sources of credit available to SMEs, not just bank credit, is therefore a positive.
In response, Lars Norden noted that these were complex questions, but that the results of the paper could help policymakers and were robust. He explained that the paper finds that trade credit may help in a credit crisis but it cannot fully fill the gap left by a fall in bank credit provision. Accordingly, policymakers could not expect trade credit to be a full substitute. A participant noted that – from a monetary policy perspective – whether firms get a cash inflow or not makes a big difference for investment. Thus, trade credit and bank debt have different effects on firms’ investment; the latter provides cash, while the former does not. Professor Norden added that this is a very important point that is also made in the paper. Furthermore, the participant pointed out that the crisis was so severe in the European Union and the reduction in bank credit so sharp that any funding firms could get was welcomed by policymakers.
Turning to other aspects of the paper, a participant noted that it would be interesting to look at how credit days – not just the volume of trade credit – moved during the financial crisis, and whether these displayed the same inverse U-shaped relationship. The participant commented that the strongest firms in the crisis could still get bank credit, it was just more expensive. The participant noted that, if there had been an increase in credit days, bigger firms might have been stretching out terms on their trade credit (which would likely have been cheaper than bank debt) and putting some of this cost burden on their suppliers, which were often smaller firms. If this were true, it would reinforce the findings of the paper. Another participant clarified that the credit days data in the paper are constructed mechanically from data on trade credit volume and days in a year. This means it is impossible to distinguish increases in the number of days due to changes in duration from changes due to trade credit volumes. The participant suggested that this would be better addressed using survey data.
Another participant noted that work done using Australian firm-level data for the unlisted business sector showed that the number of trade credit days expanded in Australia during the financial crisis. Regression analysis looking at bank debt and trade credit suggested that, in Australia, this increase was mostly firms substituting bank debt for trade credit. At the margin this substitution might have helped the SMEs through the crisis. Nonetheless, the participant cautioned that the experience in Australia may have been different to that in the European Union, because Australia largely escaped the credit crisis.
Discussion then moved to the paper’s methodology. One participant sought clarification about whether the paper used net flows or gross flows of trade credit. The participant explained that there are two ways to adjust to a negative bank debt shock – the first is to request an extension on accounts payable and the second is to call in accounts receivable. Both are interesting and important aspects of small business financing. Professor Norden responded that the paper looked only at accounts payable rather than accounts receivable or net trade credit. He explained that considering both sides of the balance sheet simultaneously raises endogeneity problems. Since the paper focused on SMEs, the paper did not consider bigger firms that might both borrow and
1 7 9CON F E R E NC E VOLU M E | 2 015
DISC US SION
lend trade credit. Accordingly, it made sense to focus only on accounts payable because smaller firms tend to be borrowing constrained.
A participant queried why the direction of credit flows was used as the dependent variable, rather than both the size and the direction of the flows. Professor Norden responded that he had run the main regression model using the logarithm of credit flows rather than focusing on the direction. However, that specification was very noisy and there are identification problems when the flow is zero. Using the direction indicator simplified identification and it made the regressions more robust.
In response to comments by the discussant, Professor Norden noted that, of the four different cases presented in the substitution indicator constructed in the paper, the paper only considered the two cases where bank credit was falling because its focus was the financial crisis. Professor Norden explained that he plans to do follow-up work looking at increases in bank credit as well, and how the relationship with trade credit operates in an upswing. Professor Norden also touched on the KZ index as a measure of financial constraints. He noted that it is well established in the literature for big firms and has applications for small firms. However, he agreed that the suggestion of alternative indices based on size and age were interesting alternatives to consider in further work.

1 8 0 R E SE RV E BA N K OF AUST R A L I A

1 8 1CON F E R E NC E VOLU M E | 2 015
Does Innovation Make (SME) Firms More Productive?Alfons Palangkaraya, Thomas Spurling and Elizabeth Webster*
1. IntroductionThere is no shortage of dialogues and commentaries extolling the need for more innovation to regenerate sagging national productivity growth. However, hard evidence on whether or not innovation makes a difference is largely absent because most firm-level studies are drawn from cross-sectional data which cannot disentangle cause and effect.1
This paper advances this state of the art by bringing a dynamic element to the modelling. We use a panel of approximately 7 000 Australian small to medium-sized enterprises (SMEs), over a five-year period, to estimate the effect of introducing a new product, or new managerial, operational or marketing method on the firm’s future productivity. In our context, we define these as changes that were new to the firm, rather than new to the world. Over and above innovation, we also test for whether collaborative arrangements with external parties make further contributions to firm productivity.
We begin this paper with a review of the accepted stylised facts concerning firm-level innovation and productivity. We then describe and estimate our model. We find that firms that introduced an innovation saw their (total factor) productivity rise by 2.7 percentage points annually over the subsequent years relative to other firms in their industry. Those firms that accompanied their innovations with an innovation-oriented collaboration raised their productivity by an additional 3.3 percentage points.
2. BackgroundThere is a clear deductive case that change, spearheaded by improved knowledge, is necessary to enhance economic wellbeing. If knowledge is static, marginal returns to investment into more of the same plant, equipment or worker skills will eventually diminish to zero. Unless new-to-the-world, and subsequently new-to-the-firm, products and methods of production are realised, firm-level productivity will plateau and our standard of living will stagnate. By contrast, the returns to accumulated knowledge are unbounded for it is difficult to imagine a limit to advances in our stock of knowledge.
1 See Hall (2011) for a review. Temporal or combined cross-sectional and time series firm-level estimations are more common for research and development and productivity studies (Hall, Mairesse and Mohnen (2010) found 45 such studies).
* The authors are from the Centre for Transformative Innovation, Swinburne University of Technology. This study was financed by the Australian Council of Learned Academies (ACOLA). We wish to thank Paul Jensen, Russell Thomson, Jongsay Yong, Gaétan de Rassenfosse, Kwang Lim and Angus Moore for comments; Diane Braskic, Helen Teasdale, Francesco Tornatore and Andrew Harwood from the Australian Bureau of Statistics (ABS) for making the analysis of the ABS data possible; and John Bell from ACOLA for support.
1 8 2 R E SE RV E BA N K OF AUST R A L I A
A L FONS PA L A NGK A R AYA , T HOM A S SPU R L I NG A N D E L I Z A BET H W E B ST E R
Two stylised facts stand out from the literature. First, persistent and large differences exist between firms in output per worker, even after allowing for the magnitude of tangible capital.2 Second, these differences – and their persistence – are correlated with research and development (R&D)spending,3 innovation activity,4 collaboration,5 and managerial acumen.6 Both facts have been found across many countries, across and within industries, and when using pooled and fixed effects estimation methods.
Although suggestive, the estimated models behind this literature are, by and large, quite mechanical. Typically, they only explain between 15 and 20 per cent of the variation in firm output.7 By mechanical we mean that the explanatory variables are merely counts of employed workers or (deflated) accounting values of past investments in plant, equipment and real estate.8 To the man in the street, this model might seem too superficial. Even a casual observer of firms would expect two firms – of the same size and operating in the same market – to have different growth paths and profit outcomes. Although luck plays its inevitable role, common sense dictates that the dynamism of managers, the choice of products to develop, the choice of markets to seek and the choices about which internal processes to adopt also have a hand in firm performance. And this hand can be great.
The persistent differences between firms imply that these ‘intangible’ factors of production are difficult to buy off-the-shelf and are therefore not simply eroded by competition. Although managerial acumen and the insight about how to manage change are scarce, these skills can be hired, albeit within an imperfect market. Similarly, blueprints for technologies and products’
2 See Bartelsman and Doms (2000) and Syverson (2011) for surveys; Palangkaraya, Stierwald and Yong (2009) for Australian evidence; and Lokshin, Belderbos and Carree (2008) and Raymond et al (2013) for recent international evidence.
3 R&D typically only covers part of the spectrum of innovative activities. It usually correlates with upstream technological activities surrounding product and process innovation but misses organisational, managerial and marketing innovations. It is also a very poor indicator of innovation in many industries, especially the primary and services sectors where innovation expenditure is often defined informally. Nonetheless, analyses using R&D data provide valuable information that cannot be gleaned elsewhere. In an extensive review of 58 firm-level studies, Hall et al (2010) report that the evidence consistently finds that R&D spending by firms increases firm-level productivity. The average estimated elasticity is 0.08, which suggests that a 100 per cent increase in R&D spending per worker will raise output per worker by 8 per cent, ceteris paribus.
4 Studies that use more general measures of innovation are fewer and more recent than the R&D studies. However, most rely on cross-sectional datasets that are typically based on specially designed surveys of innovation activities. Griffith, Harrison and Van Reenen (2006) use a cross-section of Community Innovation Survey data from 1998 to 2000 for four countries, and find that product innovation is correlated with productivity in France, Spain and the United Kingdom but not Germany. Hall, Lotti and Mairesse (2009) find similar results for Italy; Halpern and Muraközy (2012) find that product innovation is correlated with productivity in Hungary. Panel estimations have only recently appeared. Bartelsman, Dobbelaere and Peters (forthcoming) show a positive effect of product innovation on labour productivity – an effect that is stronger for the most productive firms – using data from a sample of over 20 000 firms from Germany and the Netherlands between 2000 and 2008. They find no overall effect for process innovation and a negative effect of process innovation on the most productive firms. Bloom, Sadun and Van Reenen (2012) find evidence consistent with the view that the productive use of IT depends on complementary management practices. Raymond et al (2013) use two measures of innovation: a binary measure of whether an innovation has taken place and an intensity measure of the share of sales attributable to new products. Using a sample of about 3 000 firms from the Netherlands and France, they find clear results that innovation raises productivity. Furthermore, they observe a pattern in the data that suggests that, in the short run, innovation reduces labour productivity as firms adjust to their new production routines. Bartel, Ichniowski and Shaw (2007) use data on 290 distinct valve products made during 1999 to 2003 and find a clear positive effect of IT innovation on productivity. Hubbard (2003) also finds a positive impact of IT use on productivity in the trucking industry.
5 See Belderbos, Carree and Lokshin (2004).
6 See Green (2009) and Bloom and Van Reenen (2010).
7 Aiello and Ricotta (2014) find in their estimations for Italian firms that labour and tangible capital explain less than 20 per cent of the variation in firm output. Despite this, it is common in the literature to assume a priori that labour and tangible capital exhibit constant returns to scale (e.g. Lokshin et al 2008).
8 Strictly, tangible assets also include cash.
1 8 3CON F E R E NC E VOLU M E | 2 015
DOE S I N NOVAT ION M A K E (SM E) F I R MS MOR E PRODUC T I V E?
brands can be bought and sold via the intellectual property market. By contrast, firm-specific characteristics are less easy to buy and sell. These characteristics include:
• the synergies between skilled and experienced staff who are needed to forge change through an organisation
• know-how
• the presence of complementary teams within the firm
• governance structures appropriately tailored for the firm’s position
• strategic informal contacts with external parties.
Given the observed clustering of successful innovators, it is also conceivable that the external environment – that is, local knowledge infrastructure and the depth of the labour market for innovation-savvy workers – matters. In this respect, knowledge infrastructure comprises the local institutions that support the generation, sharing and translation of ideas into commercial products. This includes mechanisms designed to compensate knowledge originators for the spillovers they create, such as: R&D tax credits; government procurement contracts for high-risk ventures; public investment into inter-firm and university-industry collaboration; and royalties from intellectual property.
Ultimately, policymakers want to know which factor from the list of potential factors is the most important driver of the ‘unexplained’ 80–85 per cent of firm performance. Encouraging firms that lack the necessary supporting internal and external factors to innovate without addressing these issues could be counterproductive. Policymakers need to answer: what effect would the adoption of an innovation strategy have on the firm performance of non-innovators? Alternatively: if innovation (either new to the firm or new to the world) systematically raises firm productivity, why do not all firms do it? Or, if it systematically lowers firm productivity, why do any firms do it?
Although we have derided the mechanical nature of existing productivity models, we find that models incorporating innovation can be just as empty and sterile. Including innovation as an explanation for productivity differences gets us only so far. Understanding the magic that makes some firms take the plunge – and some of these succeed – is still a work in progress.
3. Empirical FrameworkTo estimate if, and how, innovative activity affects productivity, we first need to estimate the productivity of each firm, while making sure there is no reverse causality (feedback from productivity to a firm’s decision on whether to innovate or not). We follow the existing literature by specifying that the output of each firm i in year t (Yit) can be represented by a common across-firm Cobb-Douglas production function of the form:
Yit ≡ JitK itαk Litαl (1)
where Jit denotes the Solow or production residual, Kit denotes the tangible capital stock and Lit denotes the size of employment. Jit has also been called the intangible capital stock. We do not need a coefficient or exponent for Jit because it is not defined in natural units such as dollars or
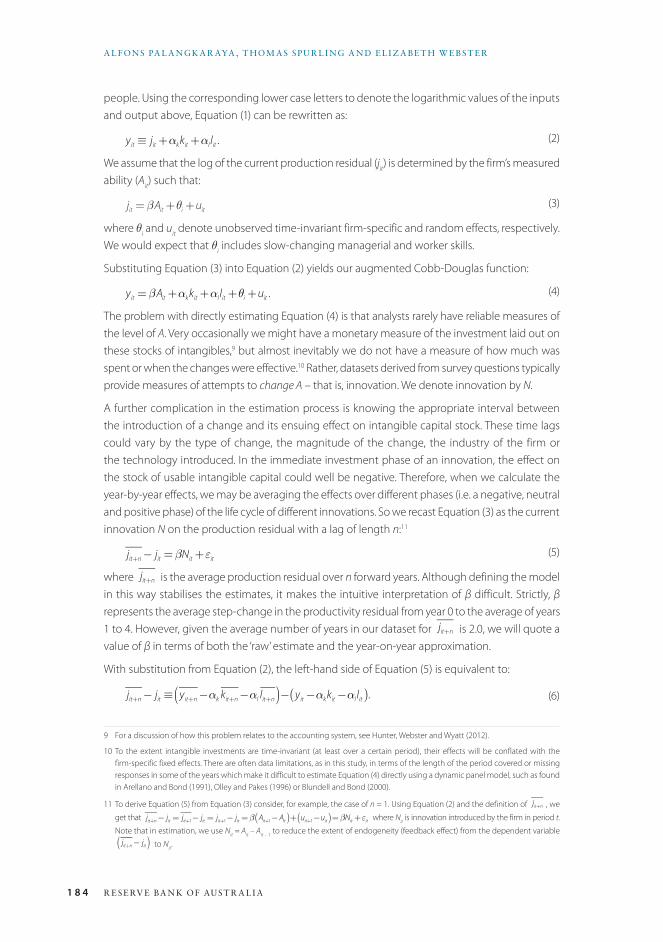
1 8 4 R E SE RV E BA N K OF AUST R A L I A
A L FONS PA L A NGK A R AYA , T HOM A S SPU R L I NG A N D E L I Z A BET H W E B ST E R
people. Using the corresponding lower case letters to denote the logarithmic values of the inputs and output above, Equation (1) can be rewritten as:
yit ≡ jit+αkkit+αl lit . (2)
We assume that the log of the current production residual (jit ) is determined by the firm’s measured ability (Ait) such that:
jit =βAit+θi+uit (3)
where θi and uit denote unobserved time-invariant firm-specific and random effects, respectively. We would expect that θi includes slow-changing managerial and worker skills.
Substituting Equation (3) into Equation (2) yields our augmented Cobb-Douglas function:
yit =βAit+αkkit+αl lit+θi+uit . (4)
The problem with directly estimating Equation (4) is that analysts rarely have reliable measures of the level of A. Very occasionally we might have a monetary measure of the investment laid out on these stocks of intangibles,9 but almost inevitably we do not have a measure of how much was spent or when the changes were effective.10 Rather, datasets derived from survey questions typically provide measures of attempts to change A – that is, innovation. We denote innovation by N.
A further complication in the estimation process is knowing the appropriate interval between the introduction of a change and its ensuing effect on intangible capital stock. These time lags could vary by the type of change, the magnitude of the change, the industry of the firm or the technology introduced. In the immediate investment phase of an innovation, the effect on the stock of usable intangible capital could well be negative. Therefore, when we calculate the year-by-year effects, we may be averaging the effects over different phases (i.e. a negative, neutral and positive phase) of the life cycle of different innovations. So we recast Equation (3) as the current innovation N on the production residual with a lag of length n:11
jit+n− jit =βNit+εit (5)
where jit+n is the average production residual over n forward years. Although defining the model in this way stabilises the estimates, it makes the intuitive interpretation of β difficult. Strictly, β represents the average step-change in the productivity residual from year 0 to the average of years 1 to 4. However, given the average number of years in our dataset for jit+n is 2.0, we will quote a value of β in terms of both the ‘raw’ estimate and the year-on-year approximation.
With substitution from Equation (2), the left-hand side of Equation (5) is equivalent to:
jit+n− jit ≡ yit+n−αk kit+n−αl lit+n( )− yit−αkkit−αl lit( ). (6)
9 For a discussion of how this problem relates to the accounting system, see Hunter, Webster and Wyatt (2012).
10 To the extent intangible investments are time-invariant (at least over a certain period), their effects will be conflated with the firm-specific fixed effects. There are often data limitations, as in this study, in terms of the length of the period covered or missing responses in some of the years which make it difficult to estimate Equation (4) directly using a dynamic panel model, such as found in Arellano and Bond (1991), Olley and Pakes (1996) or Blundell and Bond (2000).
11 To derive Equation (5) from Equation (3) consider, for example, the case of n = 1. Using Equation (2) and the definition of jit+n , we
get that jit+n− jit = jit+1− jit = jit+1− jit =β Ait+1−Ait( )+ uit+1−uit( )=βNit+εit where Nit is innovation introduced by the firm in period t.
Note that in estimation, we use Nit = Ait – Ait – 1 to reduce the extent of endogeneity (feedback effect) from the dependent variable jit+n− jit( ) to Nit.

1 8 5CON F E R E NC E VOLU M E | 2 015
DOE S I N NOVAT ION M A K E (SM E) F I R MS MOR E PRODUC T I V E?
Our aim is to estimate the β in Equation (5). To do that we first need to estimate the change in the production residual from Equation (6). Then we regress the estimated jit+n− jit on innovation (Nit ), as shown in Equation (5). By construction, we expect no feedback effect from net output (estimated using later period data) on N (measured from earlier period data). However, this proposition is testable.
We can expand Equation (5) by disaggregating firm-level innovation (N) into firm-level innovation in: the range of products (Pit); managerial processes (Mit); operational procedures (Oit); and marketing methods (Dit), such that:
jit+n− jit =βpPit+βmMit+βoOit+βdDit+εit . (5a)
Furthermore, we can also expand Equation (5) by including the effect of prior collaborations on changes to intangible capital stock by including a prior collaboration variable (Cit) in the estimation.
jit+n− jit =βpNit+βcCit+εit . (5b)
Equations (5), (5a) and (5b) are our main estimating equations.
4. The ABS Data Our empirical analysis uses an unpublished, confidential Australian Bureau of Statistics (ABS) dataset of over 7 000 Australian SMEs for the period 2005/06 to 2011/12. In this dataset, Business Characteristics Survey data is linked by Australian business number to the corresponding business income taxation and business activity taxation data (the taxation data is from the Australian Taxation Office (ATO)). To contain respondent burden, firms are rotated out of the survey after five years and replaced by a new cohort. The response rate for the survey was approximately 95 per cent in all years.12 After we exclude firms from agriculture, forestry and fishing, we are left with 23 380 firm-year observations. For the analysis of these data, the data extraction and execution of our programs was undertaken by officers of the ABS who removed all identifiers from the outputs before release.
The advantage of this dataset is twofold: size and diversity. With the exception of R&D studies, most existing studies use datasets that are either cross-sectional, small or unrepresentative. Although suggestive, one cannot draw strong causality conclusions from these studies – a causal analysis should, as a minimum, include both cross-sectional and time-series dimensions. Second, the explanatory and dependent variables in the ABS dataset are drawn from separate sources. As it is much harder to find patterns in data drawn from independent sources, any statistically significant results have an additional degree of robustness. It is too easy to find correlations in data reported by the same respondent.
We define our time of analysis to be the survey sequence year, not calendar year, due to the cohort rotation. This means we model the effect of a change in innovation (N) in year 0 on the average yearly growth in productivity over the subsequent one to four years (bearing in mind we are using an unbalanced panel of up to five years).
Table A1 compares our sample with the estimated population of SME firm counts. It shows an over-representation of mining and manufacturing firms and an under-representation in construction,
12 Firms are directed by the Australian Government to complete the survey and the response rate is very high.

1 8 6 R E SE RV E BA N K OF AUST R A L I A
A L FONS PA L A NGK A R AYA , T HOM A S SPU R L I NG A N D E L I Z A BET H W E B ST E R
retail trade, professional, scientific & technical services, and health care & social assistance firms. Aside from these differences, the sample is broadly representative. Table A2 shows that nearly two-thirds of firms were private companies, one in five were trusts and one in ten were partnerships.
A full description of the variables used in the estimations is presented in Table A3. Briefly: the value of output is total sales less material inputs; the value of the tangible capital stock is non-current assets; and employment is the number of persons working in the firm during the last pay period. To control for cross-industry effects in the productivity estimates, we normalise each variable in the production function with respect to the industry average for each year. For variables denoted in current prices, such as output and tangible capital, the normalisation also substitutes for the need for industry-specific price deflators (Klette 1999).13 Flow variables refer to activity up until year-end 30 June and stock variables are as of 30 June. The first stage, Equation (2), only includes (normalised) output, capital stock and employment.
In the second stage (Equations (5), (5a) and (5b)) we regress jit+n− jit against prior measures of innovative activities. We measure the explanatory variable – innovation – in three different ways:
• a binary variable for whether or not the business introduced any new or significantly improved goods and services, operational processes, organisational and managerial processes or marketing methods
• the mean number of types of innovations introduced (from a possible 19 types)14
• a factor comprising: the four types of business innovation listed above; the number of types of innovations introduced; whether the firm had been involved in a collaboration; whether the firm had collaborated for the purpose of innovation; and the extent of business focus on innovation.
All innovation variables relate to the firm’s activity in the year to 30 June.
In Equation (5a), we disaggregate innovative activity into the four main types listed in the first bullet point above. In Equation (5b), we test for the effect of prior collaboration in two possible ways. First, whether the firm was involved in a collaborative arrangement for any purpose such as marketing, joint buying, manufacturing, supply chain access or R&D. Second, whether the business collaborated specifically for the purposes of innovation (given the firm had introduced an innovation). We are able to disaggregate the second measure according to whether the partners were in Australia or overseas, or were from a research-oriented organisation (science-based collaboration) or not. All collaboration variables relate to the firm’s activity in the year to 30 June.
Table 1 presents the mean and standard deviation for these variables for the first and last years of our dataset. The mean value of output was $1.14 million in 2005/06 and $1.41 million in 2011/12. The mean
13 The alternative is using either a combination of broader GDP or sector price deflators or nominal values. Our estimates are robust to whether or not we use nominal values.
14 Separately identified innovations comprise new or significantly improved: goods; services; methods of manufacturing or producing goods or services; logistics, delivery or distribution methods for goods and services; supporting activities for business operations; other operational processes; knowledge management processes; the organisation of work; business practices for organising procedures; methods of organising work responsibilities and decision-making; significant changes in relations with others; methods of organising external relations with other firms or institutions; other organisational/managerial processes; the design or packaging of a good or service; media or techniques for product promotion; sales or distribution methods/methods of product placement or sales channels; methods of pricing goods or services; and other market innovation.
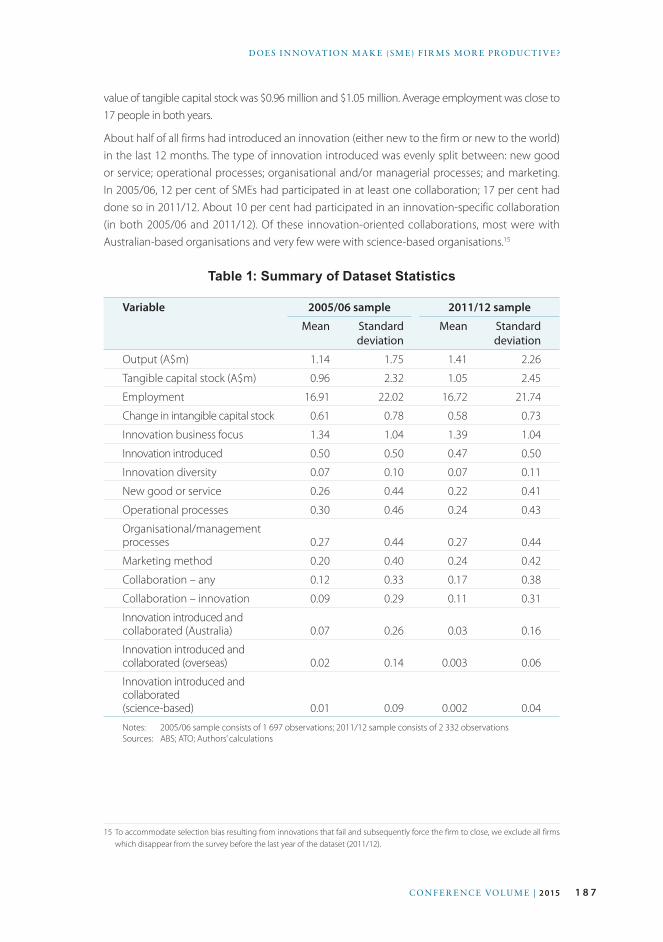
1 8 7CON F E R E NC E VOLU M E | 2 015
DOE S I N NOVAT ION M A K E (SM E) F I R MS MOR E PRODUC T I V E?
value of tangible capital stock was $0.96 million and $1.05 million. Average employment was close to 17 people in both years.
About half of all firms had introduced an innovation (either new to the firm or new to the world) in the last 12 months. The type of innovation introduced was evenly split between: new good or service; operational processes; organisational and/or managerial processes; and marketing. In 2005/06, 12 per cent of SMEs had participated in at least one collaboration; 17 per cent had done so in 2011/12. About 10 per cent had participated in an innovation-specific collaboration (in both 2005/06 and 2011/12). Of these innovation-oriented collaborations, most were with Australian-based organisations and very few were with science-based organisations.15
Table 1: Summary of Dataset Statistics
Variable 2005/06 sample 2011/12 sample
Mean Standard deviation
Mean Standard deviation
Output (A$m) 1.14 1.75 1.41 2.26
Tangible capital stock (A$m) 0.96 2.32 1.05 2.45
Employment 16.91 22.02 16.72 21.74
Change in intangible capital stock 0.61 0.78 0.58 0.73
Innovation business focus 1.34 1.04 1.39 1.04
Innovation introduced 0.50 0.50 0.47 0.50
Innovation diversity 0.07 0.10 0.07 0.11
New good or service 0.26 0.44 0.22 0.41
Operational processes 0.30 0.46 0.24 0.43
Organisational/management processes 0.27 0.44 0.27 0.44
Marketing method 0.20 0.40 0.24 0.42
Collaboration – any 0.12 0.33 0.17 0.38
Collaboration – innovation 0.09 0.29 0.11 0.31
Innovation introduced and collaborated (Australia) 0.07 0.26 0.03 0.16
Innovation introduced and collaborated (overseas) 0.02 0.14 0.003 0.06
Innovation introduced and collaborated (science-based) 0.01 0.09 0.002 0.04
Notes: 2005/06 sample consists of 1 697 observations; 2011/12 sample consists of 2 332 observationsSources: ABS; ATO; Authors’ calculations
15 To accommodate selection bias resulting from innovations that fail and subsequently force the firm to close, we exclude all firms which disappear from the survey before the last year of the dataset (2011/12).
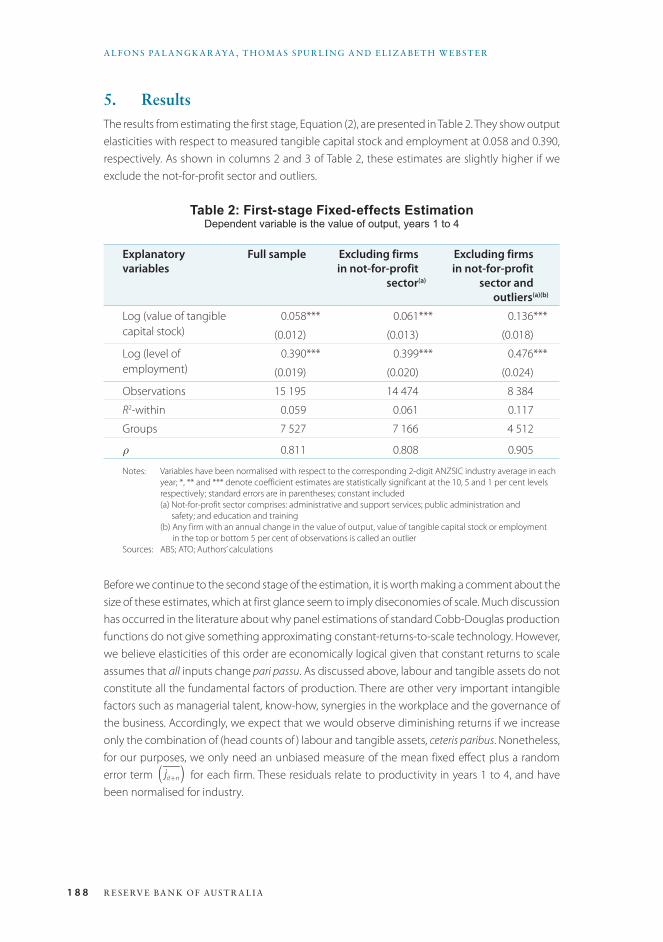
1 8 8 R E SE RV E BA N K OF AUST R A L I A
A L FONS PA L A NGK A R AYA , T HOM A S SPU R L I NG A N D E L I Z A BET H W E B ST E R
5. ResultsThe results from estimating the first stage, Equation (2), are presented in Table 2. They show output elasticities with respect to measured tangible capital stock and employment at 0.058 and 0.390, respectively. As shown in columns 2 and 3 of Table 2, these estimates are slightly higher if we exclude the not-for-profit sector and outliers.
Table 2: First-stage Fixed-effects EstimationDependent variable is the value of output, years 1 to 4
Explanatory variables
Full sample Excluding firmsin not-for-profit
sector(a)
Excluding firmsin not-for-profit
sector and outliers(a)(b)
Log (value of tangible capital stock)
0.058*** 0.061*** 0.136***
(0.012) (0.013) (0.018)
Log (level of employment)
0.390*** 0.399*** 0.476***
(0.019) (0.020) (0.024)
Observations 15 195 14 474 8 384
R2-within 0.059 0.061 0.117
Groups 7 527 7 166 4 512
ρ 0.811 0.808 0.905
Notes: Variables have been normalised with respect to the corresponding 2-digit ANZSIC industry average in each year; *, ** and *** denote coefficient estimates are statistically significant at the 10, 5 and 1 per cent levels respectively; standard errors are in parentheses; constant included
(a) Not-for-profit sector comprises: administrative and support services; public administration and safety; and education and training
(b) Any firm with an annual change in the value of output, value of tangible capital stock or employment in the top or bottom 5 per cent of observations is called an outlier
Sources: ABS; ATO; Authors’ calculations
Before we continue to the second stage of the estimation, it is worth making a comment about the size of these estimates, which at first glance seem to imply diseconomies of scale. Much discussion has occurred in the literature about why panel estimations of standard Cobb-Douglas production functions do not give something approximating constant-returns-to-scale technology. However, we believe elasticities of this order are economically logical given that constant returns to scale assumes that all inputs change pari passu. As discussed above, labour and tangible assets do not constitute all the fundamental factors of production. There are other very important intangible factors such as managerial talent, know-how, synergies in the workplace and the governance of the business. Accordingly, we expect that we would observe diminishing returns if we increase only the combination of (head counts of ) labour and tangible assets, ceteris paribus. Nonetheless, for our purposes, we only need an unbiased measure of the mean fixed effect plus a random error term jit+n( ) for each firm. These residuals relate to productivity in years 1 to 4, and have been normalised for industry.

1 8 9CON F E R E NC E VOLU M E | 2 015
DOE S I N NOVAT ION M A K E (SM E) F I R MS MOR E PRODUC T I V E?
From Table 2, in the full sample, we calculate the log of the production residual for firm i in year 0 as:
ji0= yi0−0.058∗ki0−0.390∗ li0−constant.16
We use the difference jl1,2,3,4− ji0( ) as the dependent variable in the estimation of Equations (5), (5a) and (5b).
The second stage – Equations (5), (5a) and (5b) – comprises: two measures of overall innovative activity; four disaggregated measures of innovation; and five measures of collaboration. Since the model has been specified in logs, the β coefficients shown in Tables 3 to 5 give the semi-elasticity (percentage point change in output).
As shown in column (1) in Table 3, introducing an innovation in year 0 increased productivity (production residual) by 5.4 percentage points. This increment of 5.4 represents the change between year 0 and the average of years 1 to 4. Given that the average time span was 2.0 years, we can say that the introduction of an innovation leads to an annual productivity increase of 2.7 percentage points. For example, if the production residual of a non-innovator increased by 1 percentage point a year, the residual for the innovator would increase by 3.7 percentage points a year. Column (2) indicates that introducing all 19 sub-types of innovation, compared with no innovation at all, would predict a rise in productivity of about 30 percentage points (or 15 percentage points per year).17 These findings are echoed by column (3), which uses the innovation factor as the explanatory variable.
Columns (4) and (5) use the presence of collaborative arrangements as a predictor of productivity growth. They show that collaboration for any reason has no effect on productivity, but collaboration for the purpose of innovation raises productivity by 8.2 percentage points (or 4.1 percentage points per year).
Bearing in mind that the four disaggregated types of innovation are not mutually exclusive, we find that only goods and services and marketing methods innovation had an impact on productivity. Column (6) shows that good or service innovation had a positive and significant effect on productivity (a rise of 6.5 percentage points, or 3.2 percentage points per year) but the coefficients for the other forms of innovation are not statistically significant. The null finding for operational processes and organisational and managerial innovation does not rule out the possibility that these forms of innovation have an effect. There could be an effect that evaporates within a shorter time window or only emerges after the five-year window.
16 We use stored values and calculate to seven decimal places.
17 Because our model is semi-log and the right-hand side variables are levels, the coefficients can be read directly as semi-elasticities.
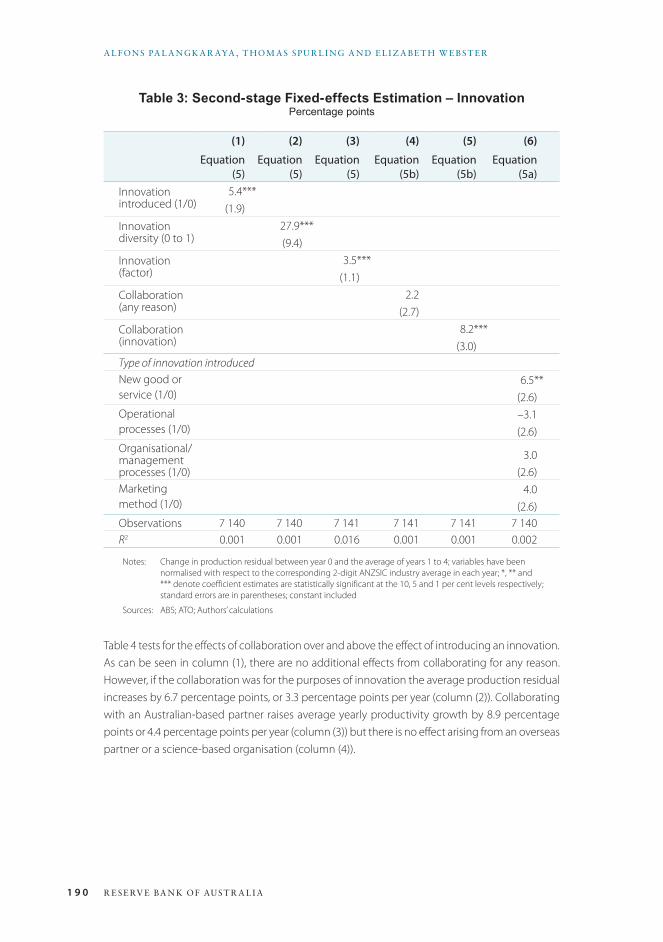
1 9 0 R E SE RV E BA N K OF AUST R A L I A
A L FONS PA L A NGK A R AYA , T HOM A S SPU R L I NG A N D E L I Z A BET H W E B ST E R
Table 3: Second-stage Fixed-effects Estimation – InnovationPercentage points
(1) (2) (3) (4) (5) (6)
Equation (5)
Equation (5)
Equation (5)
Equation (5b)
Equation (5b)
Equation (5a)
Innovation introduced (1/0)
5.4***(1.9)
Innovation diversity (0 to 1)
27.9***(9.4)
Innovation (factor)
3.5***(1.1)
Collaboration (any reason)
2.2(2.7)
Collaboration (innovation)
8.2***(3.0)
Type of innovation introducedNew good or service (1/0)
6.5**(2.6)
Operational processes (1/0)
–3.1(2.6)
Organisational/management processes (1/0)
3.0(2.6)
Marketing method (1/0)
4.0(2.6)
Observations 7 140 7 140 7 141 7 141 7 141 7 140R2 0.001 0.001 0.016 0.001 0.001 0.002
Notes: Change in production residual between year 0 and the average of years 1 to 4; variables have been normalised with respect to the corresponding 2-digit ANZSIC industry average in each year; *, ** and *** denote coefficient estimates are statistically significant at the 10, 5 and 1 per cent levels respectively; standard errors are in parentheses; constant included
Sources: ABS; ATO; Authors’ calculations
Table 4 tests for the effects of collaboration over and above the effect of introducing an innovation. As can be seen in column (1), there are no additional effects from collaborating for any reason. However, if the collaboration was for the purposes of innovation the average production residual increases by 6.7 percentage points, or 3.3 percentage points per year (column (2)). Collaborating with an Australian-based partner raises average yearly productivity growth by 8.9 percentage points or 4.4 percentage points per year (column (3)) but there is no effect arising from an overseas partner or a science-based organisation (column (4)).
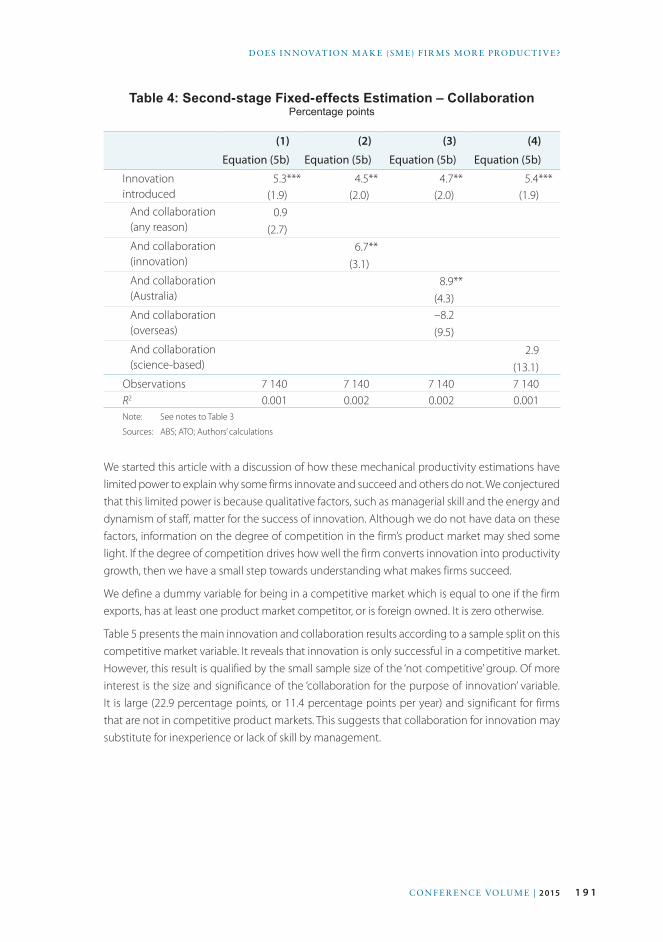
1 9 1CON F E R E NC E VOLU M E | 2 015
DOE S I N NOVAT ION M A K E (SM E) F I R MS MOR E PRODUC T I V E?
Table 4: Second-stage Fixed-effects Estimation – CollaborationPercentage points
(1) (2) (3) (4)
Equation (5b) Equation (5b) Equation (5b) Equation (5b)
Innovation introduced
5.3*** 4.5** 4.7** 5.4***(1.9) (2.0) (2.0) (1.9)
And collaboration (any reason)
0.9(2.7)
And collaboration (innovation)
6.7**(3.1)
And collaboration (Australia)
8.9**(4.3)
And collaboration (overseas)
–8.2(9.5)
And collaboration (science-based)
2.9(13.1)
Observations 7 140 7 140 7 140 7 140R2 0.001 0.002 0.002 0.001Note: See notes to Table 3
Sources: ABS; ATO; Authors’ calculations
We started this article with a discussion of how these mechanical productivity estimations have limited power to explain why some firms innovate and succeed and others do not. We conjectured that this limited power is because qualitative factors, such as managerial skill and the energy and dynamism of staff, matter for the success of innovation. Although we do not have data on these factors, information on the degree of competition in the firm’s product market may shed some light. If the degree of competition drives how well the firm converts innovation into productivity growth, then we have a small step towards understanding what makes firms succeed.
We define a dummy variable for being in a competitive market which is equal to one if the firm exports, has at least one product market competitor, or is foreign owned. It is zero otherwise.
Table 5 presents the main innovation and collaboration results according to a sample split on this competitive market variable. It reveals that innovation is only successful in a competitive market. However, this result is qualified by the small sample size of the ‘not competitive’ group. Of more interest is the size and significance of the ‘collaboration for the purpose of innovation’ variable. It is large (22.9 percentage points, or 11.4 percentage points per year) and significant for firms that are not in competitive product markets. This suggests that collaboration for innovation may substitute for inexperience or lack of skill by management.
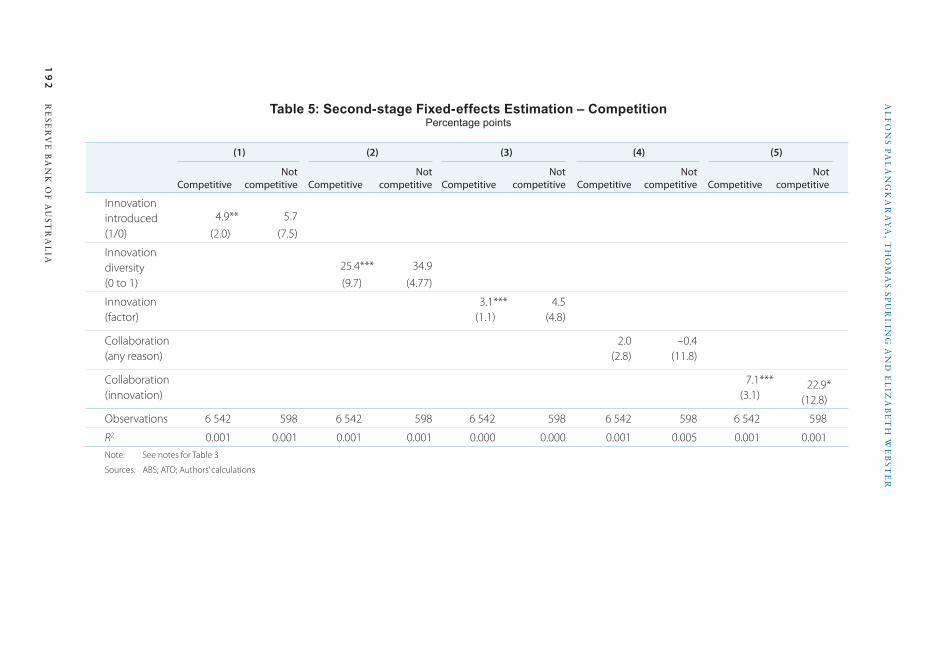
19
2R
ES
ER
VE
BA
NK
OF
AU
ST
RA
LIA
AL
FO
NS
PA
LA
NG
KA
RA
YA
, TH
OM
AS
SP
UR
LIN
G A
ND
EL
IZA
BE
TH
WE
BS
TE
R
Table 5: Second-stage Fixed-effects Estimation – CompetitionPercentage points
(1) (2) (3) (4) (5)
CompetitiveNot
competitive CompetitiveNot
competitive CompetitiveNot
competitive CompetitiveNot
competitive CompetitiveNot
competitive
Innovation introduced (1/0)
4.9**(2.0)
5.7(7.5)
Innovation diversity (0 to 1)
25.4***(9.7)
34.9(4.77)
Innovation (factor)
3.1***(1.1)
4.5(4.8)
Collaboration (any reason)
2.0(2.8)
–0.4(11.8)
Collaboration (innovation)
7.1***(3.1)
22.9*(12.8)
Observations 6 542 598 6 542 598 6 542 598 6 542 598 6 542 598
R2 0.001 0.001 0.001 0.001 0.000 0.000 0.001 0.005 0.001 0.001Note: See notes for Table 3
Sources: ABS; ATO; Authors’ calculations

1 9 3CON F E R E NC E VOLU M E | 2 015
DOE S I N NOVAT ION M A K E (SM E) F I R MS MOR E PRODUC T I V E?
6. ConclusionUntil now, there have been no large-scale firm-level econometric analyses of the effects of innovation (and collaboration) on firm productivity for Australia. Our headline conclusion is that SME firms that previously introduced innovations had an annual productivity increase that was 2.7 percentage points higher than non-innovating firms over the subsequent year. Furthermore, innovating firms with Australian-based collaborations raised their productivity by 4.4 percentage points per year.
Given the nexus between profits and productivity, one might well ask: why don’t all firms innovate? Why doesn’t competition force all firms to be active and aggressive promoters of new products and ways of operating? One explanation is that competition is simply missing in many markets. Managers may know what would improve performance but lack the incentives from competition or the owners of the business to implement them.
However, competition, or lack thereof, may not be the only explanation. Economic theory tells us that some factors of production can be difficult to replicate; some firms possess these and others do not. A factor that is not easily imitated will not be eroded by competition. The managerial literature is more advanced and nuanced on this point. According to Bloom et al (2013), managers might not innovate because they do not realise that they are inefficient or, if they do, they may not know how to implement the necessary changes. A complicated constellation of complementary activities may be needed for success, such as: particular collaborations; specialist in-house skills; intellectual property; marketing activities; capital investments; and training for employees. Identifying what these factors are is the Holy Grail and the subject of our ongoing research.
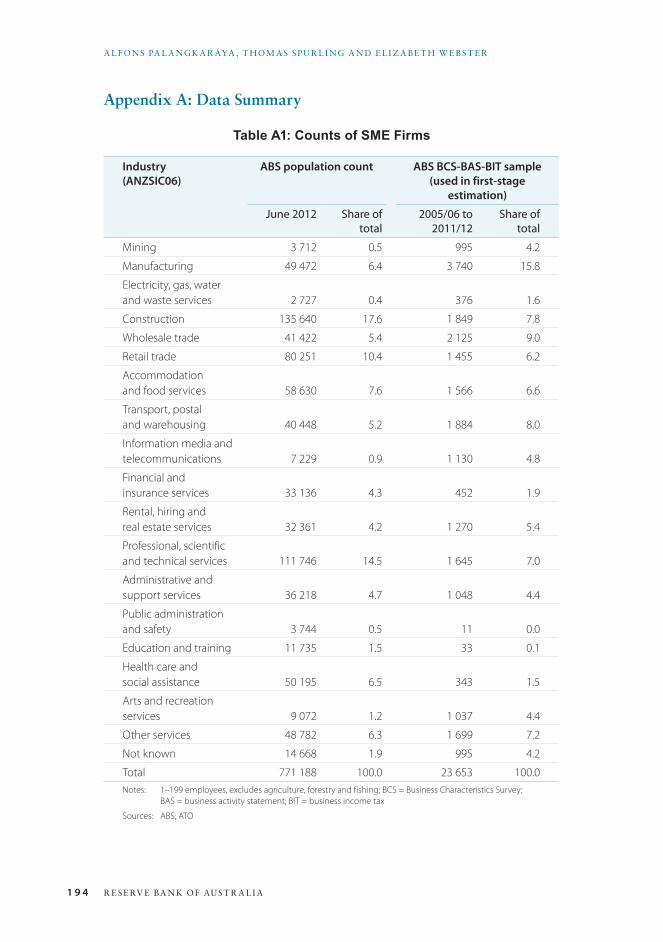
1 9 4 R E SE RV E BA N K OF AUST R A L I A
A L FONS PA L A NGK A R AYA , T HOM A S SPU R L I NG A N D E L I Z A BET H W E B ST E R
Appendix A: Data Summary
Table A1: Counts of SME Firms
Industry (ANZSIC06)
ABS population count ABS BCS-BAS-BIT sample(used in first-stage
estimation)
June 2012 Share of total
2005/06 to 2011/12
Share of total
Mining 3 712 0.5 995 4.2
Manufacturing 49 472 6.4 3 740 15.8
Electricity, gas, water and waste services 2 727 0.4 376 1.6
Construction 135 640 17.6 1 849 7.8
Wholesale trade 41 422 5.4 2 125 9.0
Retail trade 80 251 10.4 1 455 6.2
Accommodation and food services 58 630 7.6 1 566 6.6
Transport, postal and warehousing 40 448 5.2 1 884 8.0
Information media and telecommunications 7 229 0.9 1 130 4.8
Financial and insurance services 33 136 4.3 452 1.9
Rental, hiring and real estate services 32 361 4.2 1 270 5.4
Professional, scientific and technical services 111 746 14.5 1 645 7.0
Administrative and support services 36 218 4.7 1 048 4.4
Public administration and safety 3 744 0.5 11 0.0
Education and training 11 735 1.5 33 0.1
Health care and social assistance 50 195 6.5 343 1.5
Arts and recreation services 9 072 1.2 1 037 4.4
Other services 48 782 6.3 1 699 7.2
Not known 14 668 1.9 995 4.2
Total 771 188 100.0 23 653 100.0Notes: 1–199 employees, excludes agriculture, forestry and fishing; BCS = Business Characteristics Survey;
BAS = business activity statement; BIT = business income tax
Sources: ABS; ATO
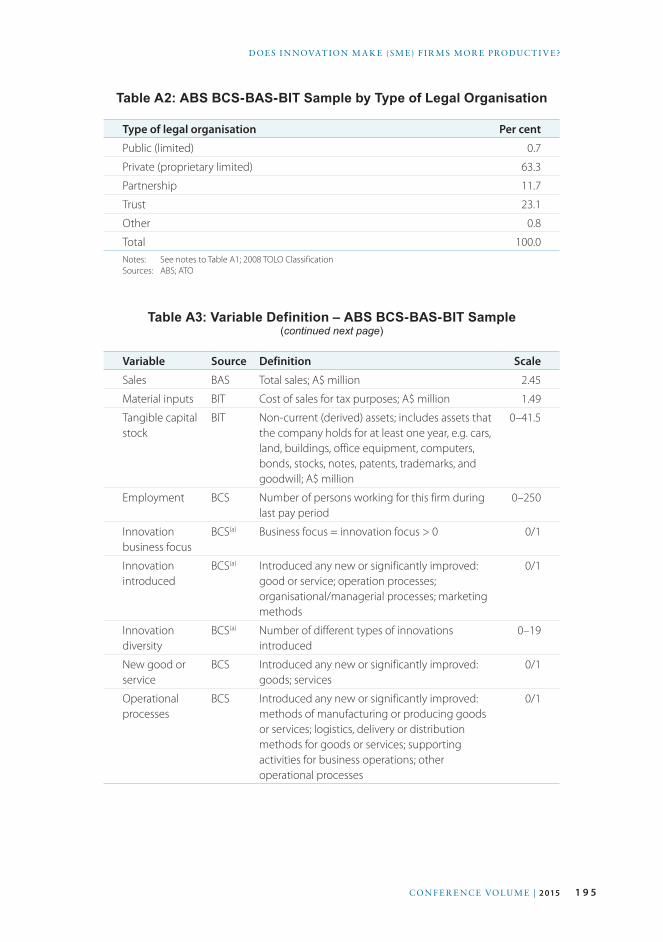
1 9 5CON F E R E NC E VOLU M E | 2 015
DOE S I N NOVAT ION M A K E (SM E) F I R MS MOR E PRODUC T I V E?
Table A2: ABS BCS-BAS-BIT Sample by Type of Legal Organisation
Type of legal organisation Per cent
Public (limited) 0.7
Private (proprietary limited) 63.3
Partnership 11.7
Trust 23.1
Other 0.8
Total 100.0Notes: See notes to Table A1; 2008 TOLO ClassificationSources: ABS; ATO
Table A3: Variable Definition – ABS BCS-BAS-BIT Sample(continued next page)
Variable Source Definition Scale
Sales BAS Total sales; A$ million 2.45
Material inputs BIT Cost of sales for tax purposes; A$ million 1.49
Tangible capital stock
BIT Non-current (derived) assets; includes assets that the company holds for at least one year, e.g. cars, land, buildings, office equipment, computers, bonds, stocks, notes, patents, trademarks, and goodwill; A$ million
0–41.5
Employment BCS Number of persons working for this firm during last pay period
0–250
Innovation business focus
BCS(a) Business focus = innovation focus > 0 0/1
Innovation introduced
BCS(a) Introduced any new or significantly improved: good or service; operation processes; organisational/managerial processes; marketing methods
0/1
Innovation diversity
BCS(a) Number of different types of innovations introduced
0–19
New good or service
BCS Introduced any new or significantly improved: goods; services
0/1
Operational processes
BCS Introduced any new or significantly improved: methods of manufacturing or producing goods or services; logistics, delivery or distribution methods for goods or services; supporting activities for business operations; other operational processes
0/1
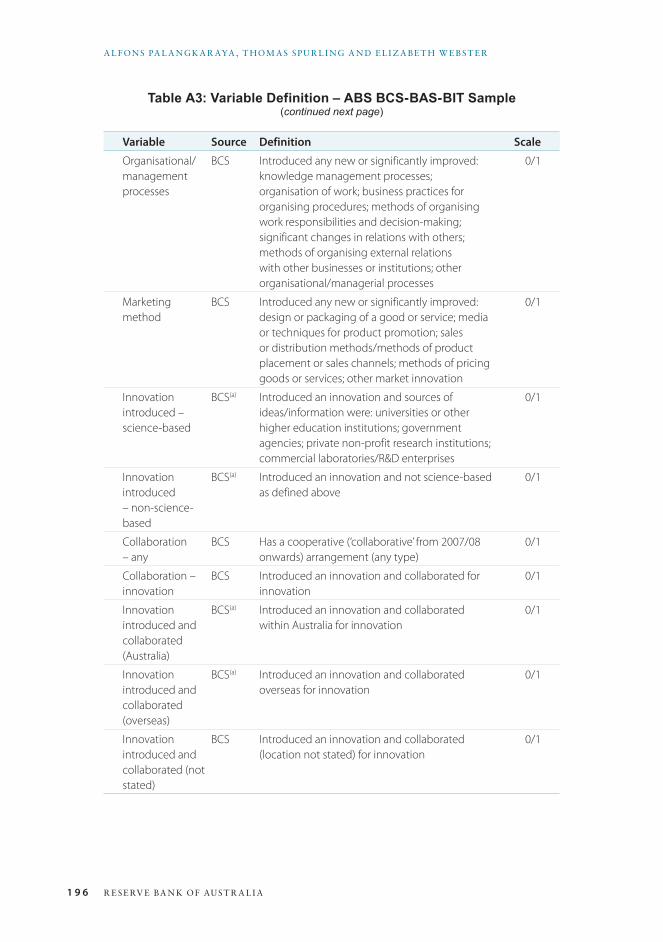
1 9 6 R E SE RV E BA N K OF AUST R A L I A
A L FONS PA L A NGK A R AYA , T HOM A S SPU R L I NG A N D E L I Z A BET H W E B ST E R
Variable Source Definition Scale
Organisational/management processes
BCS Introduced any new or significantly improved: knowledge management processes; organisation of work; business practices for organising procedures; methods of organising work responsibilities and decision-making; significant changes in relations with others; methods of organising external relations with other businesses or institutions; other organisational/managerial processes
0/1
Marketing method
BCS Introduced any new or significantly improved: design or packaging of a good or service; media or techniques for product promotion; sales or distribution methods/methods of product placement or sales channels; methods of pricing goods or services; other market innovation
0/1
Innovation introduced – science-based
BCS(a) Introduced an innovation and sources of ideas/information were: universities or other higher education institutions; government agencies; private non-profit research institutions; commercial laboratories/R&D enterprises
0/1
Innovation introduced – non-science-based
BCS(a) Introduced an innovation and not science-based as defined above
0/1
Collaboration – any
BCS Has a cooperative (‘collaborative’ from 2007/08 onwards) arrangement (any type)
0/1
Collaboration – innovation
BCS Introduced an innovation and collaborated for innovation
0/1
Innovation introduced and collaborated (Australia)
BCS(a) Introduced an innovation and collaborated within Australia for innovation
0/1
Innovation introduced and collaborated (overseas)
BCS(a) Introduced an innovation and collaborated overseas for innovation
0/1
Innovation introduced and collaborated (not stated)
BCS Introduced an innovation and collaborated (location not stated) for innovation
0/1
Table A3: Variable Definition – ABS BCS-BAS-BIT Sample(continued next page)
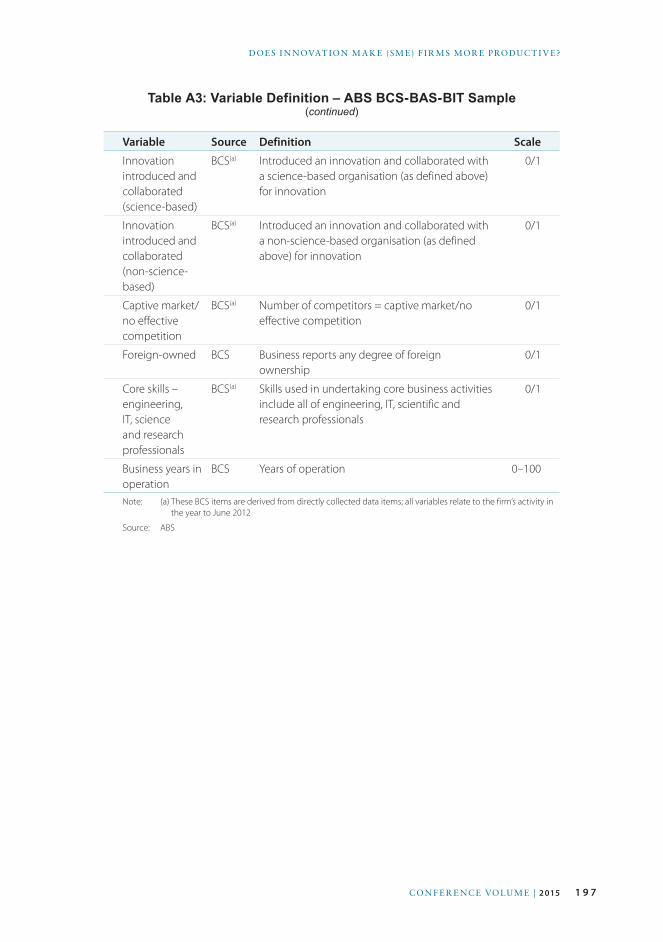
1 9 7CON F E R E NC E VOLU M E | 2 015
DOE S I N NOVAT ION M A K E (SM E) F I R MS MOR E PRODUC T I V E?
Variable Source Definition Scale
Innovation introduced and collaborated (science-based)
BCS(a) Introduced an innovation and collaborated with a science-based organisation (as defined above) for innovation
0/1
Innovation introduced and collaborated (non-science-based)
BCS(a) Introduced an innovation and collaborated with a non-science-based organisation (as defined above) for innovation
0/1
Captive market/no effective competition
BCS(a) Number of competitors = captive market/no effective competition
0/1
Foreign-owned BCS Business reports any degree of foreign ownership
0/1
Core skills – engineering, IT, science and research professionals
BCS(a) Skills used in undertaking core business activities include all of engineering, IT, scientific and research professionals
0/1
Business years in operation
BCS Years of operation 0–100
Note: (a) These BCS items are derived from directly collected data items; all variables relate to the firm’s activity in the year to June 2012
Source: ABS
Table A3: Variable Definition – ABS BCS-BAS-BIT Sample(continued)
1 9 8 R E SE RV E BA N K OF AUST R A L I A
A L FONS PA L A NGK A R AYA , T HOM A S SPU R L I NG A N D E L I Z A BET H W E B ST E R
ReferencesAiello F and Ricotta F (2014), ‘Firm Heterogeneity In Productivity across Europe. What Explains What?’,
Dipartimento di Economia, Statistica e Finanza, Università della Calabria, Working Paper No 04 - 2014.
Arellano M and S Bond (1991), ‘Some Tests of Specification for Panel Data: Monte Carlo Evidence and an
Application to Employment Equations’, The Review of Economic Studies, 58(2), pp 277–297.
Bartel A, C Ichniowski and K Shaw (2007), ‘How Does Information Technology Affect Productivity?
Plant-Level Comparisons of Product Innovation, Process Improvement, and Worker Skills’, The Quarterly
Journal of Economics, 122(4), pp 1721–1758.
Bartelsman EJ, S Dobbelaere and B Peters (forthcoming), ‘Allocation of Human Capital and Innovation
at the Frontier: Firm-Level Evidence on Germany and the Netherlands’, Industrial and Corporate Change.
Bartelsman EJ and M Doms (2000), ‘Understanding Productivity: Lessons from Longitudinal Microdata’,
Journal of Economic Literature, 38(3), pp 569–594.
Belderbos R, Carree M, and Lokshin B (2004), ‘Cooperative R&D and Firm Performance’, Research Policy,
33(10), pp 1477–1492.
Bloom N, B Eifert, A Mahajan, D McKenzie and J Roberts (2013), ‘Does Management Matter? Evidence
from India’, The Quarterly Journal of Economics, 128(1), pp 1–51.
Bloom N, R Sadun and J Van Reenen (2012), ‘Americans Do IT Better: US Multinationals and the
Productivity Miracle’, The American Economic Review, 102(1), pp 167–201.
Bloom N and J Van Reenen (2010), ‘Why Do Management Practices Differ across Firms and Countries?’,
The Journal of Economic Perspectives, 24(1), pp 203–224.
Blundell R and S Bond (2000), ‘GMM Estimation with Persistent Panel Data: An Application to Production
Functions’, Econometric Reviews, 19(3), pp 321–340.
Green R (2009), Management Matters in Australia: Just How Productive Are We?, Findings from the Australian
Management Practices and Productivity Global Benchmarking Project, Department of Innovation, Industry,
Science and Research, Canberra.
Griffith R, R Harrison and J Van Reenen (2006), ‘How Special Is the Special Relationship? Using the Impact
of U.S. R&D Spillovers on U.K. Firms as a Test of Technology Sourcing’, The American Economic Review, 96(5),
pp 1859–1875.
Hall BH (2011), ‘Innovation and Productivity’, NBER Working Paper No 17178.
Hall BH, F Lotti and J Mairesse (2009), ‘Innovation and Productivity in SMEs: Empirical Evidence for Italy’,
Small Business Economics, 33(1), pp 13–33.
Hall BH, J Mairesse and P Mohnen (2010), ‘Measuring the Returns to R&D’, in BH Hall and N Rosenberg
(eds), Handbook of the Economics of Innovation, Vol 2, Handbooks in Economics, North-Holland, Amsterdam,
pp 1033–1082.
Halpern L and B Muraközy (2012), ‘Innovation, Productivity and Exports: The Case of Hungary’, Economics
of Innovation and New Technology, 21(2), pp 151–173.
Hubbard TN (2003), ‘Information, Decisions, and Productivity: On-Board Computers and Capacity Utilization
in Trucking’, The American Economic Review, 93(4), pp 1328–1353.
Hunter L, E Webster and A Wyatt (2012), ‘Accounting for Expenditures on Intangibles’, Abacus, 48(1),
pp 104–145.

1 9 9CON F E R E NC E VOLU M E | 2 015
DOE S I N NOVAT ION M A K E (SM E) F I R MS MOR E PRODUC T I V E?
Klette TJ (1999), ‘Market Power, Scale Economies and Productivity: Estimates from a Panel of Establishment
Data’, The Journal of Industrial Economics, 47(4), pp 451–476.
Lokshin B, R Belderbos and M Carree (2008), ‘The Productivity Effects of Internal and External R&D:
Evidence from a Dynamic Panel Data Model’, Oxford Bulletin of Economics And Statistics, 70(3), pp 399–413.
Olley GS and A Pakes (1996), ‘The Dynamics of Productivity in the Telecommunications Equipment
Industry’, Econometrica, 64(6), pp 1263–1297.
Palangkaraya A, A Stierwald and J Yong (2009), ‘Is Firm Productivity Related to Size and Age? The Case of
Large Australian Firms’, Journal of Industry, Competition and Trade, 9(2), pp 167–195.
Raymond W, J Mairesse, P Mohnen and F Palm (2013), ‘Dynamic Models of R&D, Innovation and
Productivity: Panel Data Evidence for Dutch and French Manufacturing’, CESifo Working Paper No 4290.
Syverson C (2011), ‘What Determines Productivity?’, Journal of Economic Literature, 49(2), pp 326–365.
2 0 0 R E SE RV E BA N K OF AUST R A L I A
Discussion
1. Roy GreenThe merit of this elegant and insightful paper is that it confirms the influence of innovation on firm-level productivity performance. It does so using an unusually large and representative dataset of 7 000 Australian small and medium-sized enterprises. The paper finds that firms that introduced an innovation in one of four defined Australian Bureau of Statistics (ABS) categories achieved a bit over 2.7 percentage points higher productivity per year than the industry average, and that this was increased by 3.3 percentage points when accompanied by an innovation-enhancing collaboration strategy. The four innovation categories are: new or significantly improved goods and services; operational processes; organisational and/or managerial processes; and marketing methods.
This finding is particularly relevant in the context of Australia’s productivity slowdown over the past decade, masked as it was by the positive terms of trade effects associated with the resources boom. With the recent sudden – but hardly unexpected – terms of trade reversal, our challenge is to identify new sources of growth and productivity in the Australian economy. For, in the absence of a revival of non-mining trade-exposed activities, we will face an inevitable decline in national income. This paper suggests that a renewed focus on supporting sector- and firm-level innovation strategies would be a fruitful direction for public policy, particularly those strategies with an emphasis on collaboration.
In establishing the argument, the paper begins with the obvious point that ‘persistent and large differences exist between firms in output per worker, even after allowing for the magnitude of tangible capital’. Less obvious, however, are the (mainly intangible) factors that account for these differences, and attempts in the existing literature have left an ‘unexplained residual’. The authors speculate that at least an element of this residual may be due to variations in management capability and performance, as well as research and technology development. This would certainly align with earlier findings from the literature, including the multi-country research project on management and productivity, ‘Management Matters’, which was expanded to include Australia (Green 2009).
Unfortunately, this line of thought is not pursued much further because it is subsumed into a discussion of the Solow/production residual in a conventional production function. In turn, the authors posit that changes in this residual can be determined – at least in part – by firm-level innovations. Again, reference is made in this context to ‘slow-changing managerial and worker skills’, but this factor is not followed up due to lack of data. However, the authors remind us in discussion that this is only the first stage of a much larger study of productivity, so further investigation may be anticipated.
On the other hand, it is possible with the data available to analyse how the degree of competition facing firms affects their productivity. The authors show that ‘innovation is only successful in a competitive market’. Moreover, for firms not in a competitive market, collaborative approaches
2 0 1CON F E R E NC E VOLU M E | 2 015
DISC US SION
to innovation are more significant, signifying that ‘collaboration for innovation may substitute for inexperience or lack of skill by management’.
Given the demonstrably positive effect of innovation on productivity – and hence on profitability – the authors ask, ‘why don’t all firms innovate? Why doesn’t competition force all firms to be active and aggressive promoters of new products and ways of operating?’. This is a question that is often asked, with no straightforward answer. The paper suggests that an ‘explanation is that competition is simply missing in many markets. Managers may know what would improve performance but lack the incentives from competition or the owners of the business to implement them’. There is also the possibility that some firms possess factors of production that others do not, or that ‘managers might not innovate because they do not realise that they are inefficient or, if they do, they may not know how to implement the necessary changes’.
The point is that, whatever the reason, management’s failure to innovate – even in the interests of the firm, let alone the economy as a whole – should not be depicted as market failure but as ‘systems failure’. The authors hint at this by suggesting that a ‘complicated constellation of complementary activities may be needed for success, such as: particular collaborations; specialist in-house skills; intellectual property; marketing activities; capital investments; and training for employees’. This is why many advanced countries have established sophisticated national innovation systems, underpinned by foresight exercises, innovation support programs and investment in knowledge and capability building. Australia has a lot of catching up to do.
The further point is that it becomes very difficult, if not impossible, to model such systems in a production function context, or indeed with static equilibrium approaches. More fruitful are Schumpetarian approaches to modelling dynamic systems that are driven by both technological change and non-technological innovations, such as: new business models; design integration; and high performance work and management practices. The authors recognise that, ‘[g]iven the observed clustering of successful innovators, it is also conceivable that the external environment – that is, local knowledge infrastructure and the depth of the labour market for innovation-savvy workers – matters’.
Finally, the authors highlight the institutional dimensions of knowledge infrastructure, which ‘support the generation, sharing and translation of ideas into commercial products’. The authors have demonstrated the significance of innovation for the productivity performance of firms. The next steps are to understand and assess ‘what works’ in the knowledge infrastructure of market-based economies, the implications for future public policy in Australia, and the institutional elements required for an effective and coherent national innovation system.
ReferenceGreen R (2009), Management Matters in Australia: Just How Productive Are We?, Findings from the Australian
Management Practices and Productivity Global Benchmarking Project, Department of Innovation, Industry,
Science and Research, Canberra.
2 0 2 R E SE RV E BA N K OF AUST R A L I A
DISC US SION
2. General DiscussionThe discussion opened with questions of clarification about the results and consideration of their implications and interpretation. One participant asked how they should think about the measure of ‘innovation’ used in the paper, given that it was a broader definition than commonly used metrics such as patents or patent citations. Beth Webster replied that most research in Australia had focused on patents and trademarks, and that her own previous research had shown that an increase in the stock of patents or trademarks held by a firm increased its market value and profits. However, these were examples of ‘new-to-the-world’ innovations, while this paper studied a broader measure of ‘new-to-the-firm’ innovations, a much more prevalent form of innovation.
Participants noted that innovation is expensive, risky, and can often lead to firm failure. A participant noted that the paper had excluded firms that went out of business, and another participant cited an earlier conference paper that showed that exit rates for small to medium-sized businesses are in the order of 20–30 per cent after four years. Professor Webster explained that only firms that filed tax returns and earned over a certain threshold ($70 000) were included in the ABS’s dataset. Generally, firms that had been dropped from the sample had indeed gone into external administration.
A participant followed up by noting that while some small businesses have no desire for growth, others try to innovate, and this paper had not addressed interesting questions about the costs and risk of failed innovation. Were the firms who failed less innovative, or did they try to innovate and fail? In response, Professor Webster mentioned previous research that had showed that firms that had recently applied for patents were indeed less likely to survive, but commented that it is difficult to model both innovation and survival at the same time. However, this paper focused on new-to-the-firm innovations, which are likely to be less risky because they had already been proven in other firms. There were too few firms undertaking new-to-the-world innovations in the sample to be analysed separately in the paper.
Participants asked whether product or process innovations were the more prevalent form of innovation, and which had the larger effect on productivity. One participant drew a contrast between a new marketing strategy for an existing product to win a larger market share, and the creation of a new product, arguing that they had very different implications for aggregate productivity. Professor Webster showed results from the paper suggesting that while the four main types of innovation considered were roughly equally common, product innovation was the only type found to significantly increase productivity.
Discussion then turned to the robustness of the results and methodological questions. Several participants asked whether the authors had tested for interactions between innovation and firm variables such as age, size, industry, tangible capital stock and employment. A positive interaction would imply that innovation not only increases productivity but steepens the path of growth. In response, Professor Webster agreed that there were reasons to imagine that both the level and the slope of the response of productivity to innovation might change with different levels of such variables (e.g. a firm might buy new equipment at the same time as introducing a new product), and that this was an extension the authors would consider.

2 0 3CON F E R E NC E VOLU M E | 2 015
DISC US SION
Relatedly, a participant asked whether differences in productivity by industry affected the results. While the paper had controlled for differences in industry-level productivity in its results, it had not explicitly examined those differences, and Professor Webster agreed that this would be an interesting area for further work.
One participant asked whether the authors would be better to look at the effects of innovation on profits, rather than productivity. Professor Webster agreed that firms were more likely to be motivated by profits than by productivity, and that it could be the dependent variable in the same analysis. However, she noted that productivity was the key concern from a public policy point of view, and was therefore the motivation for the study.
Finally, a participant asked how the paper distinguished productivity gains generated by innovation from those generated by employees within the firm learning and getting better at their roles over time. In response, Professor Webster noted that the paper focused not just on new firms but also existing firms, for whom the learning effect would be much less prevalent. In addition, the paper used a difference-in-differences framework, so such changes would be controlled for to the extent they were stable across firms.

2 0 4 R E SE RV E BA N K OF AUST R A L I A
2 0 5CON F E R E NC E VOLU M E | 2 015
Firm Dynamics and Public Policy: Evidence from OECD CountriesDan Andrews, Chiara Criscuolo, Peter Gal and Carlo Menon
1. IntroductionCross-country differences in GDP per capita mainly reflect large and persistent differences in labour productivity. At the same time, boosting labour productivity growth is an urgent policy priority, especially in countries where declining working-age populations pose a major headwind to future improvements in living standards. However, productivity growth has slowed in many Organisation for Economic Co-operation and Development (OECD) economies over the past decade, including Australia. This slowdown in productivity growth raises important questions about the structural and policy factors that shape productivity performance.
Cross-country differences in aggregate-level productivity outcomes are increasingly being linked to the widespread within-sector heterogeneity in firm performance (Hsieh and Klenow 2009; Bartelsman, Haltiwanger and Scarpetta 2013). The distribution of firm productivity is typically not clustered around the mean (as would be the case with a normal distribution), but is instead characterised by many below-average performers and a smaller number of star performers. Moreover, the degree of heterogeneity is striking: even within narrowly defined industries in the United States, firms at the 90th percentile of the total factor productivity distribution are twice as productive as firms at the 10th percentile (Syverson 2004).1 These findings suggest that the focus on average outcomes is misleading and, thus, research is increasingly focusing on the star performers, which disproportionately drive productivity and job growth (Haltiwanger, Jarmin and Miranda 2013; Criscuolo, Gal and Menon 2014b).
Given the tendency for highly productive firms to coexist with low productivity firms within narrowly defined sectors, the recent literature has focused on resource misallocation as a potential explanation for why some countries are more productive than others (Hsieh and Klenow 2009; Bartelsman et al 2013).
Accordingly, this paper reviews evidence from recent OECD research that links cross-country differences in aggregate productivity performance to the widespread within-sector heterogeneity in firm size and productivity. A number of key findings emerge, which carry important implications for public policy.
First, contrary to the widespread popular perception, not all small businesses are net job creators. Rather, estimates show that only young businesses – which are predominantly small – are the primary drivers of job creation.
1 The same is true with respect to the firm size distribution, with many small firms coexisting with a smaller number of very large firms (Bartelsman et al 2013).

2 0 6 R E SE RV E BA N K OF AUST R A L I A
DA N A N DR EWS , C H I A R A C R ISC UOLO, PET E R GA L A N D C A R LO M E NON
Second, there are important differences across OECD countries in the age composition and post-entry growth patterns of small businesses. While these differences imply a greater degree of experimentation by entrants in some countries rather than others, they also reflect the ability of economies to channel resources to the most productive firms. Accordingly, we highlight important differences across OECD countries in the efficiency of resource allocation, as measured by the extent to which: (i) the most productive firms are also the largest (i.e. static allocative efficiency); and (ii) resources flow to innovative firms (i.e. dynamic allocative efficiency).
The paper proceeds as follows. Section 2 documents some stylised facts relating to young businesses and employment growth. These facts hold across countries, but the magnitudes of the phenomena differ. Accordingly, the section also explores the cross-country differences in employment dynamics and in the extent to which start-ups are able to grow. A key advance in the productivity and firm dynamics literature in recent years is the focus on how the distributions of firm productivity and firm size are related. Consequently, Section 3 presents recent estimates on the efficiency of resource allocation. These estimates indicate that some countries are more successful than others at channelling scarce resources to productive and innovative firms. Section 4 shows that these outcomes partly reflect cross-country differences in the policy environment.
Section 5 offers some concluding thoughts and draws policy implications. In particular, the facts presented in this paper caution against the use of size-contingent policies and highlight the importance of policies that facilitate the reallocation of scarce resources to innovative firms. In this regard, well-functioning product, labour and capital markets as well as efficient judicial systems and bankruptcy laws that do not overly penalise failure can raise the expected returns to innovative activity and, therefore, the amount of innovative activity. These benefits are partly realised through stronger competitive pressures and more efficient reallocation, which make it easier for successful firms to implement and commercialise new ideas and, by lowering the costs of failure, encourage firms to experiment with uncertain growth opportunities.
2. Cross-country Evidence on Business DynamicsThe dynamism of employment varies significantly across countries. Recent cross-country evidence suggests that these differences exist not only in terms of the entry and exit patterns of firms but also in terms of the size of firms at entry and their post-entry growth performance (Bartelsman, Scarpetta and Schivardi 2003; Calvino, Criscuolo and Menon 2015). For example, the size of entering and exiting firms tends to be smaller in the United States than in Europe and successful young firms tend to expand relatively more quickly in the United States than elsewhere (Bartelsman et al 2013). This is consistent with a more dynamic distribution of firm growth in the United States – where successful firms grow faster and unsuccessful firms shrink faster – than in Europe. Moreover, Europe has a higher share of slow-growing and stagnant firms relative to the United States (Bravo-Biosca, Criscuolo and Menon 2013). The levels and growth rates of firm productivity within industries also tend to be more dispersed in the United States than in Europe (Bartelsman, Haltiwanger and Scarpetta 2004). More recent evidence also points to important differences in productivity dispersion across countries within Europe (Altomonte 2010).

2 0 7CON F E R E NC E VOLU M E | 2 015
F I R M DY NA M IC S A N D PU BL IC POL IC Y: EV I DENCE F ROM OECD COU N T R I E S
These differences between the United States and Europe appear to reflect a greater degree of experimentation and ‘learning by doing’ among entrants in the United States. The largest differences can be found in high technology and emerging sectors. In these sectors, the imperative for experimentation and intensity in the use of knowledge-based capital is likely to be greatest (Aghion et al 2008). Experimentation may be particularly important in a time of extensive technological change, when the success of new business models and applications may only become apparent through testing in the market. The gap in experimentation between the United States and Europe suggests that differences in institutional factors – which shape differences in the cost of reallocating resources – may explain the relative sluggishness of some European countries in capitalising on the information and communications technology revolution (Conway et al 2007; Bartelsman, Gautier and de Wind 2010) and realising the potential for growth embodied in knowledge-based capital.
Box A: DynEmp – A New OECD Project on Firm-level DynamicsThis paper uses data collected by the OECD for a database called DynEmp. The purpose of the DynEmp database is to collect cross-country evidence from countries’ business registers in order to identify the sources of job creation and destruction across countries and over time. The project aims to quantify the extent to which firms that differ in terms of age, size and sector contribute to job creation and job destruction, and to see how firm entry, growth and exit shape employment dynamics across countries and over time. The resulting statistics also provide insights on the effect of the recent global financial crisis on business dynamics.
A first phase of the project (DynEmp Express) has collected non-confidential comparable statistics on employment, gross job creation and destruction by firm age, size and macro-sectors for 18 countries in its first phase: Austria, Belgium, Brazil, Canada, Finland, France, Hungary, Italy, Japan, Luxembourg, the Netherlands, New Zealand, Norway, Portugal, Spain, Sweden, the United Kingdom and the United States. The second phase of the project is ongoing. It aims to collect detailed data at the two-digit industry code level and follow cohorts of businesses over three, five and seven years.
Although efforts have been made to harmonise the data, limitations in cross-country comparability remain. Differences in the source data might persist, for example, in the minimum threshold above which a business is captured in the relevant country’s business register or because mergers and acquisitions could be accounted for in only a few countries. Owing to methodological differences in constructing these indicators, DynEmp Express statistics may deviate from official statistics published by national statistical offices. For instance, firms that enter and exit the data in the same year, and those that are never seen to employ more than one employee, are excluded from DynEmp Express-based figures.
For further information, see Criscuolo, Gal and Menon (2014b, 2014c).
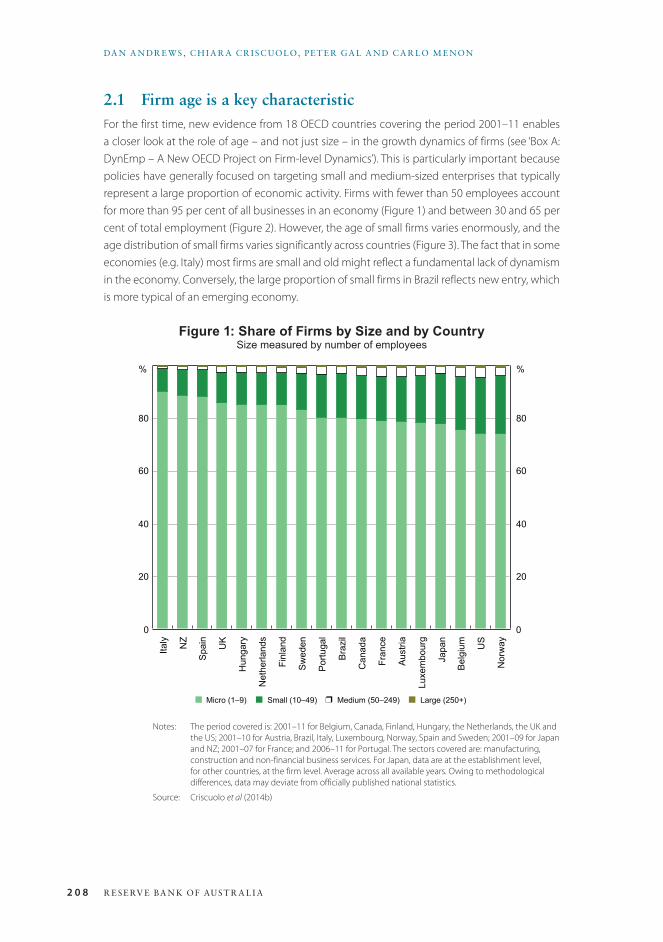
2 0 8 R E SE RV E BA N K OF AUST R A L I A
DA N A N DR EWS , C H I A R A C R ISC UOLO, PET E R GA L A N D C A R LO M E NON
2.1 Firm age is a key characteristicFor the first time, new evidence from 18 OECD countries covering the period 2001–11 enables a closer look at the role of age – and not just size – in the growth dynamics of firms (see ‘Box A: DynEmp – A New OECD Project on Firm-level Dynamics’). This is particularly important because policies have generally focused on targeting small and medium-sized enterprises that typically represent a large proportion of economic activity. Firms with fewer than 50 employees account for more than 95 per cent of all businesses in an economy (Figure 1) and between 30 and 65 per cent of total employment (Figure 2). However, the age of small firms varies enormously, and the age distribution of small firms varies significantly across countries (Figure 3). The fact that in some economies (e.g. Italy) most firms are small and old might reflect a fundamental lack of dynamism in the economy. Conversely, the large proportion of small firms in Brazil reflects new entry, which is more typical of an emerging economy.
Figure 1: Share of Firms by Size and by CountrySize measured by number of employees
Italy NZ
Spa
in UK
Hun
gary
Net
herla
nds
Finl
and
Sw
eden
Por
tuga
l
Bra
zil
Can
ada
Fran
ce
Aus
tria
Luxe
mbo
urg
Japa
n
Bel
gium U
S
Nor
way
0
20
40
60
80
0
20
40
60
80
%
■ Micro (1–9) ■ Small (10–49) ❒ Medium (50–249) ■ Large (250+)
%
Notes: The period covered is: 2001–11 for Belgium, Canada, Finland, Hungary, the Netherlands, the UK and the US; 2001–10 for Austria, Brazil, Italy, Luxembourg, Norway, Spain and Sweden; 2001–09 for Japan and NZ; 2001–07 for France; and 2006–11 for Portugal. The sectors covered are: manufacturing, construction and non-financial business services. For Japan, data are at the establishment level, for other countries, at the firm level. Average across all available years. Owing to methodological differences, data may deviate from officially published national statistics.
Source: Criscuolo et al (2014b)
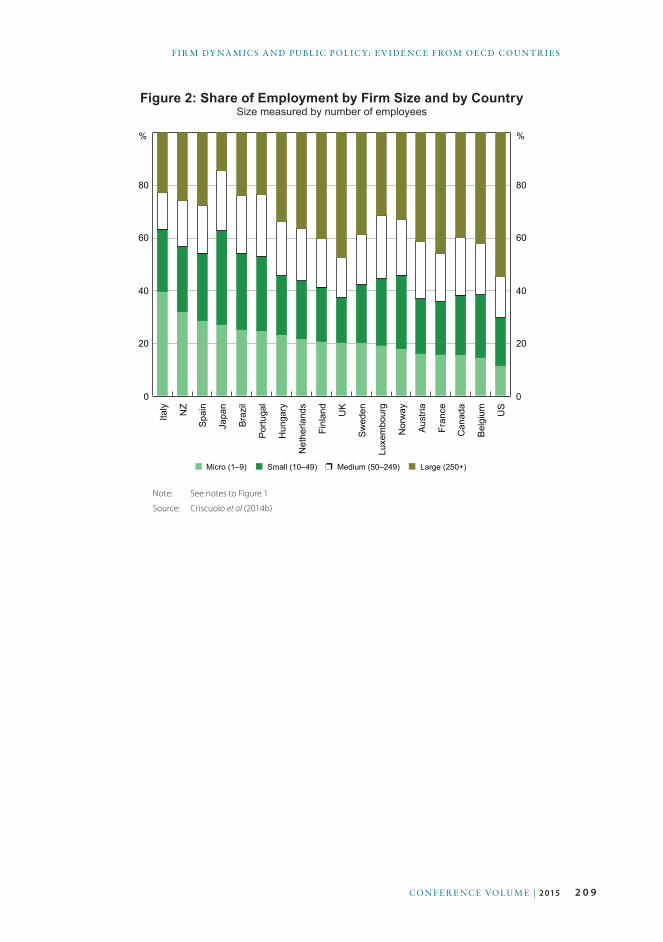
2 0 9CON F E R E NC E VOLU M E | 2 015
F I R M DY NA M IC S A N D PU BL IC POL IC Y: EV I DENCE F ROM OECD COU N T R I E S
Figure 2: Share of Employment by Firm Size and by CountrySize measured by number of employees
Italy NZ
Spa
in
Japa
n
Bra
zil
Por
tuga
l
Hun
gary
Net
herla
nds
Finl
and
UK
Sw
eden
Luxe
mbo
urg
Nor
way
Aus
tria
Fran
ce
Can
ada
Bel
gium U
S
0
20
40
60
80
0
20
40
60
80
%
■ Micro (1–9) ■ Small (10–49) ❒ Medium (50–249) ■ Large (250+)
%
Note: See notes to Figure 1
Source: Criscuolo et al (2014b)
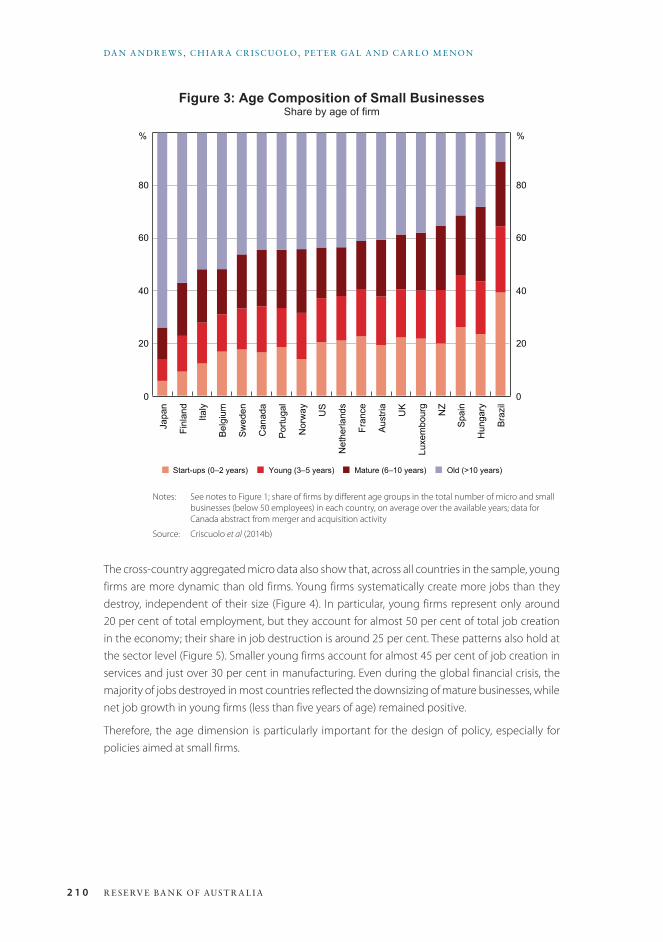
2 1 0 R E SE RV E BA N K OF AUST R A L I A
DA N A N DR EWS , C H I A R A C R ISC UOLO, PET E R GA L A N D C A R LO M E NON
Figure 3: Age Composition of Small BusinessesShare by age of firm
Japa
n
Finl
and
Italy
Bel
gium
Sw
eden
Can
ada
Por
tuga
l
Nor
way US
Net
herla
nds
Fran
ce
Aus
tria
UK
Luxe
mbo
urg
NZ
Spa
in
Hun
gary
Bra
zil0
20
40
60
80
0
20
40
60
80
%
■ Start-ups (0–2 years) ■ Young (3–5 years) ■ Mature (6–10 years) ■ Old (>10 years)
%
Notes: See notes to Figure 1; share of firms by different age groups in the total number of micro and small businesses (below 50 employees) in each country, on average over the available years; data for Canada abstract from merger and acquisition activity
Source: Criscuolo et al (2014b)
The cross-country aggregated micro data also show that, across all countries in the sample, young firms are more dynamic than old firms. Young firms systematically create more jobs than they destroy, independent of their size (Figure 4). In particular, young firms represent only around 20 per cent of total employment, but they account for almost 50 per cent of total job creation in the economy; their share in job destruction is around 25 per cent. These patterns also hold at the sector level (Figure 5). Smaller young firms account for almost 45 per cent of job creation in services and just over 30 per cent in manufacturing. Even during the global financial crisis, the majority of jobs destroyed in most countries reflected the downsizing of mature businesses, while net job growth in young firms (less than five years of age) remained positive.
Therefore, the age dimension is particularly important for the design of policy, especially for policies aimed at small firms.
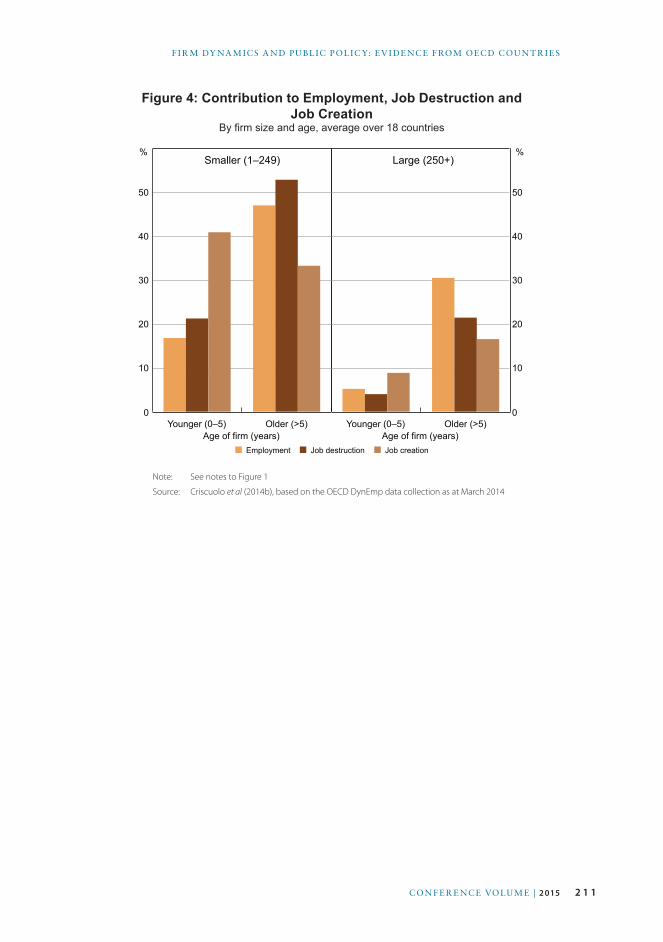
2 1 1CON F E R E NC E VOLU M E | 2 015
F I R M DY NA M IC S A N D PU BL IC POL IC Y: EV I DENCE F ROM OECD COU N T R I E S
Figure 4: Contribution to Employment, Job Destruction and Job Creation
By firm size and age, average over 18 countries
Younger (0–5) Older (>5)0
10
20
30
40
50
Age of firm (years)
%Smaller (1–249)
■ Employment ■ Job destruction ■ Job creation
Younger (0–5) Older (>5)0
10
20
30
40
50
Age of firm (years)
Large (250+)%
Note: See notes to Figure 1
Source: Criscuolo et al (2014b), based on the OECD DynEmp data collection as at March 2014
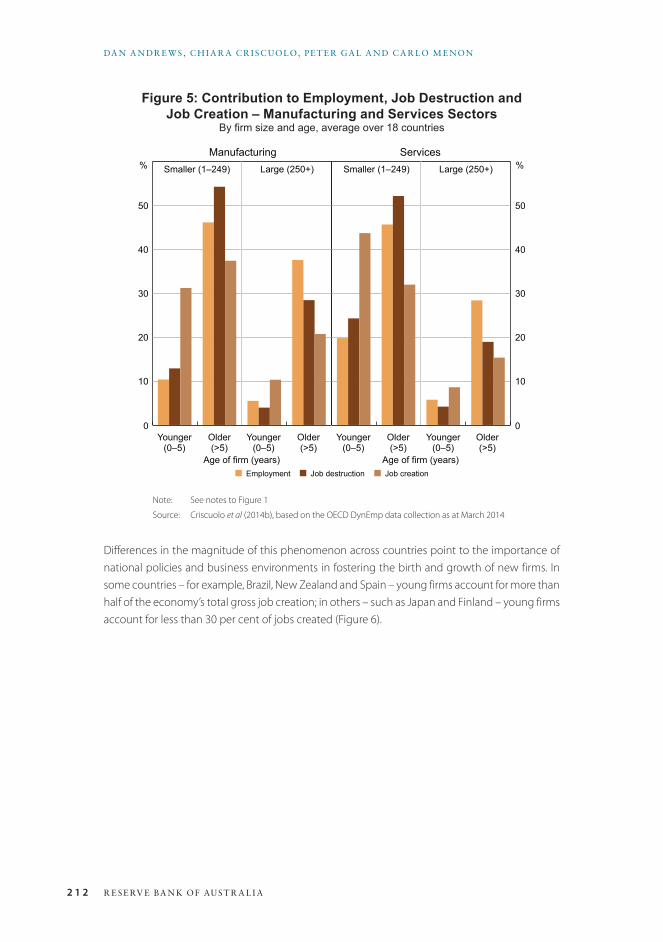
2 1 2 R E SE RV E BA N K OF AUST R A L I A
DA N A N DR EWS , C H I A R A C R ISC UOLO, PET E R GA L A N D C A R LO M E NON
Figure 5: Contribution to Employment, Job Destruction and Job Creation – Manufacturing and Services Sectors
By firm size and age, average over 18 countries
Younger(0–5)
Older(>5)
Younger(0–5)
Older(>5)
0
10
20
30
40
50
Age of firm (years)
%Smaller (1–249)
■ Employment ■ Job destruction ■ Job creation
Younger(0–5)
Older(>5)
Younger(0–5)
Older(>5)
0
10
20
30
40
50
Age of firm (years)
Large (250+)%Manufacturing Services
Smaller (1–249)Large (250+)
Note: See notes to Figure 1
Source: Criscuolo et al (2014b), based on the OECD DynEmp data collection as at March 2014
Differences in the magnitude of this phenomenon across countries point to the importance of national policies and business environments in fostering the birth and growth of new firms. In some countries – for example, Brazil, New Zealand and Spain – young firms account for more than half of the economy’s total gross job creation; in others – such as Japan and Finland – young firms account for less than 30 per cent of jobs created (Figure 6).
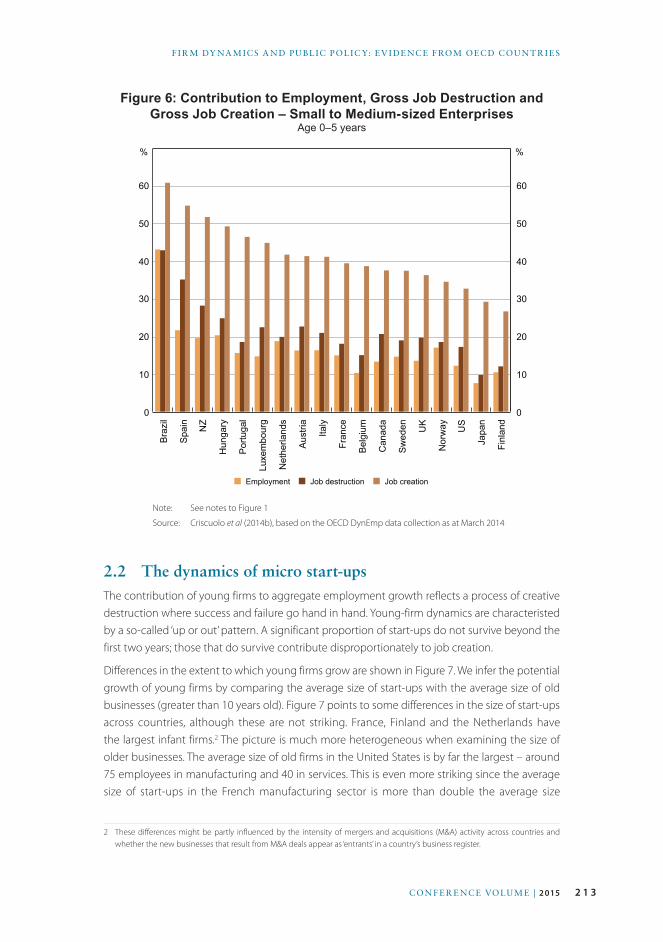
2 1 3CON F E R E NC E VOLU M E | 2 015
F I R M DY NA M IC S A N D PU BL IC POL IC Y: EV I DENCE F ROM OECD COU N T R I E S
Figure 6: Contribution to Employment, Gross Job Destruction and Gross Job Creation – Small to Medium-sized Enterprises
Age 0–5 years
Bra
zil
Spa
in NZ
Hun
gary
Por
tuga
l
Luxe
mbo
urg
Net
herla
nds
Aus
tria
Italy
Fran
ce
Bel
gium
Can
ada
Sw
eden UK
Nor
way US
Japa
n
Finl
and
0
10
20
30
40
50
60
0
10
20
30
40
50
60
%
■ Employment ■ Job destruction ■ Job creation
%
Note: See notes to Figure 1
Source: Criscuolo et al (2014b), based on the OECD DynEmp data collection as at March 2014
2.2 The dynamics of micro start-upsThe contribution of young firms to aggregate employment growth reflects a process of creative destruction where success and failure go hand in hand. Young-firm dynamics are characteristed by a so-called ‘up or out’ pattern. A significant proportion of start-ups do not survive beyond the first two years; those that do survive contribute disproportionately to job creation.
Differences in the extent to which young firms grow are shown in Figure 7. We infer the potential growth of young firms by comparing the average size of start-ups with the average size of old businesses (greater than 10 years old). Figure 7 points to some differences in the size of start-ups across countries, although these are not striking. France, Finland and the Netherlands have the largest infant firms.2 The picture is much more heterogeneous when examining the size of older businesses. The average size of old firms in the United States is by far the largest – around 75 employees in manufacturing and 40 in services. This is even more striking since the average size of start-ups in the French manufacturing sector is more than double the average size
2 These differences might be partly influenced by the intensity of mergers and acquisitions (M&A) activity across countries and whether the new businesses that result from M&A deals appear as ‘entrants’ in a country’s business register.
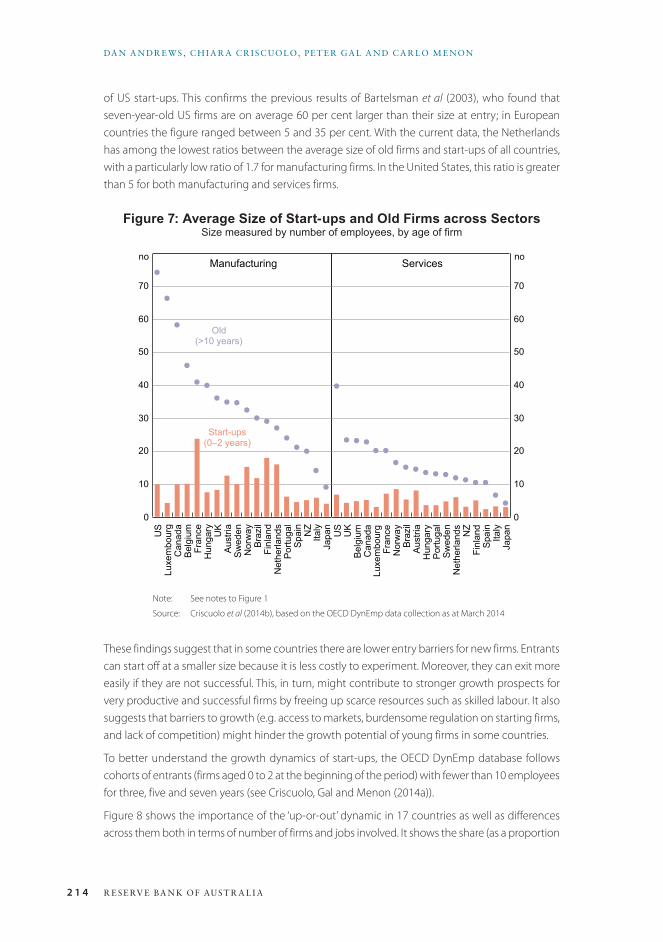
2 1 4 R E SE RV E BA N K OF AUST R A L I A
DA N A N DR EWS , C H I A R A C R ISC UOLO, PET E R GA L A N D C A R LO M E NON
of US start-ups. This confirms the previous results of Bartelsman et al (2003), who found that seven-year-old US firms are on average 60 per cent larger than their size at entry; in European countries the figure ranged between 5 and 35 per cent. With the current data, the Netherlands has among the lowest ratios between the average size of old firms and start-ups of all countries, with a particularly low ratio of 1.7 for manufacturing firms. In the United States, this ratio is greater than 5 for both manufacturing and services firms.
Figure 7: Average Size of Start-ups and Old Firms across SectorsSize measured by number of employees, by age of firm
J
J
J
J
J JJ J J
JJ J
JJJ J
J
J
US
Luxe
mbo
urg
Can
ada
Bel
gium
Fran
ceH
unga
ry UK
Aus
tria
Sw
eden
Nor
way
Bra
zil
Finl
and
Net
herla
nds
Por
tuga
lS
pain NZ
Italy
Japa
n
0
10
20
30
40
50
60
70
no
Old(>10 years)
Manufacturing
J
J J JJ J
J J J J J J J J J JJJ
US
UK
Bel
gium
Can
ada
Luxe
mbo
urg
Fran
ceN
orw
ayB
razi
lA
ustri
aH
unga
ryP
ortu
gal
Sw
eden
Net
herla
nds
NZ
Finl
and
Spa
inIta
lyJa
pan
0
10
20
30
40
50
60
70
Servicesno
Start-ups(0–2 years)
Note: See notes to Figure 1
Source: Criscuolo et al (2014b), based on the OECD DynEmp data collection as at March 2014
These findings suggest that in some countries there are lower entry barriers for new firms. Entrants can start off at a smaller size because it is less costly to experiment. Moreover, they can exit more easily if they are not successful. This, in turn, might contribute to stronger growth prospects for very productive and successful firms by freeing up scarce resources such as skilled labour. It also suggests that barriers to growth (e.g. access to markets, burdensome regulation on starting firms, and lack of competition) might hinder the growth potential of young firms in some countries.
To better understand the growth dynamics of start-ups, the OECD DynEmp database follows cohorts of entrants (firms aged 0 to 2 at the beginning of the period) with fewer than 10 employees for three, five and seven years (see Criscuolo, Gal and Menon (2014a)).
Figure 8 shows the importance of the ‘up-or-out’ dynamic in 17 countries as well as differences across them both in terms of number of firms and jobs involved. It shows the share (as a proportion
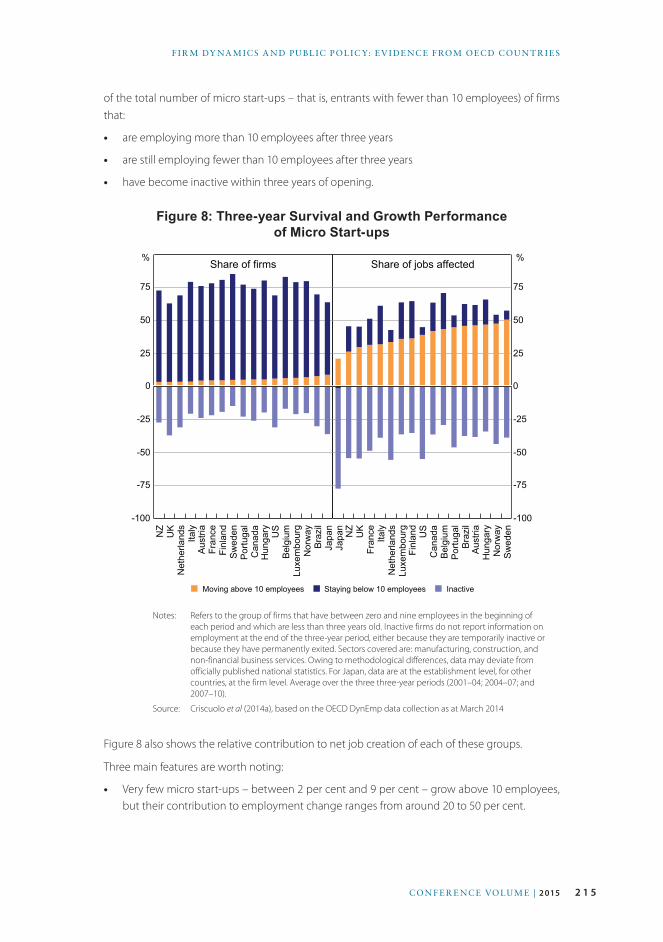
2 1 5CON F E R E NC E VOLU M E | 2 015
F I R M DY NA M IC S A N D PU BL IC POL IC Y: EV I DENCE F ROM OECD COU N T R I E S
of the total number of micro start-ups – that is, entrants with fewer than 10 employees) of firms that:
• are employing more than 10 employees after three years
• are still employing fewer than 10 employees after three years
• have become inactive within three years of opening.
Figure 8: Three-year Survival and Growth Performance of Micro Start-ups
NZ
UK
Net
herla
nds
Italy
Aus
tria
Fran
ceFi
nlan
dS
wed
enP
ortu
gal
Can
ada
Hun
gary US
Bel
gium
Luxe
mbo
urg
Nor
way
Bra
zil
Japa
n
-100
-75
-50
-25
0
25
50
75
%Share of firms
■ Moving above 10 employees ■ Staying below 10 employees ■ Inactive
Japa
nN
ZU
KFr
ance
Italy
Net
herla
nds
Luxe
mbo
urg
Finl
and
US
Can
ada
Bel
gium
Por
tuga
lB
razi
lA
ustri
aH
unga
ryN
orw
ayS
wed
en-100
-75
-50
-25
0
25
50
75
Share of jobs affected%
Notes: Refers to the group of firms that have between zero and nine employees in the beginning of each period and which are less than three years old. Inactive firms do not report information on employment at the end of the three-year period, either because they are temporarily inactive or because they have permanently exited. Sectors covered are: manufacturing, construction, and non-financial business services. Owing to methodological differences, data may deviate from officially published national statistics. For Japan, data are at the establishment level, for other countries, at the firm level. Average over the three three-year periods (2001–04; 2004–07; and 2007–10).
Source: Criscuolo et al (2014a), based on the OECD DynEmp data collection as at March 2014
Figure 8 also shows the relative contribution to net job creation of each of these groups.
Three main features are worth noting:
• Very few micro start-ups – between 2 per cent and 9 per cent – grow above 10 employees, but their contribution to employment change ranges from around 20 to 50 per cent.
2 1 6 R E SE RV E BA N K OF AUST R A L I A
DA N A N DR EWS , C H I A R A C R ISC UOLO, PET E R GA L A N D C A R LO M E NON
• Most firms remain within the same size class (i.e. they still employ fewer than 10 employees after three years) and while they still create a reasonable number of jobs, their contribution is less than proportional to their weight in terms of number of firms. For some cohorts and countries, these small start-ups actually contribute negatively to net job creation.
• The extent to which micro start-ups survive is very different across countries.
3. Cross-country Evidence on Resource AllocationThese aggregations from micro data point to important cross-country differences in business dynamics. An important difference is the extent to which some countries are more successful than others in channelling resources towards innovative and high-productivity firms – so-called allocative efficiency. Indeed, a key advance in the productivity and firm dynamics literature in recent years is to focus on how the distributions of firm productivity and firm size are related.
This section expands on this idea by using other recent OECD firm-level evidence, based on harmonised cross-country data, to examine how allocative efficiency varies across countries.
These differences in allocative efficiency may partly be due to structural differences between the economies – e.g. in the role of different sectors in the economy – but are also likely to reflect policies and institutional frameworks. We investigate the latter in Section 4.
3.1 Static allocative efficiencyAccording to Olley and Pakes (1996), at any point in time, differences in aggregate labour productivity will reflect:
• the productivity distribution of firms (i.e. the fraction of ‘better’ relative to ‘worse’ firms)
• the extent to which, all else equal, it is the more productive firms that command a larger share of industry value added (i.e. allocative efficiency), which will be the outcome of the shift in resources between firms in previous periods.
More formally, an index of productivity of industry j, defined as the weighted average of firm-level productivity (Pj = ΣijθiPi ), can be written as:
Σi∈ jθiPi =Pj+Σi∈ j θi−θ j( ) Pi−Pj( ) (1)
where: Pj =1/NjΣi∈ jPi is the unweighted mean of firm productivity; θi is a measure of the relative size of each firm (e.g. the employment share); and θ j =1/Nj is the average share at the industry level. Hence, aggregate productivity (Pj) can be decomposed into two terms: a moment of the firm productivity distribution (the unweighted mean); and a joint moment of firm productivity and the firm size distribution. This latter term reflects the extent to which firms with higher efficiency also have a larger relative size. This is known as the ‘Olley-Pakes covariance’ term and it measures static allocative efficiency.
Using this metric, Andrews and Cingano (2014) find that more productive firms are likely to account for a much larger share of manufacturing employment in the United States and some Nordic countries than in some other European countries (see Figure 9). In the United States, manufacturing sector labour productivity is 50 per cent higher due to the actual allocation of employment across firms, compared to a hypothetical situation where labour is randomly
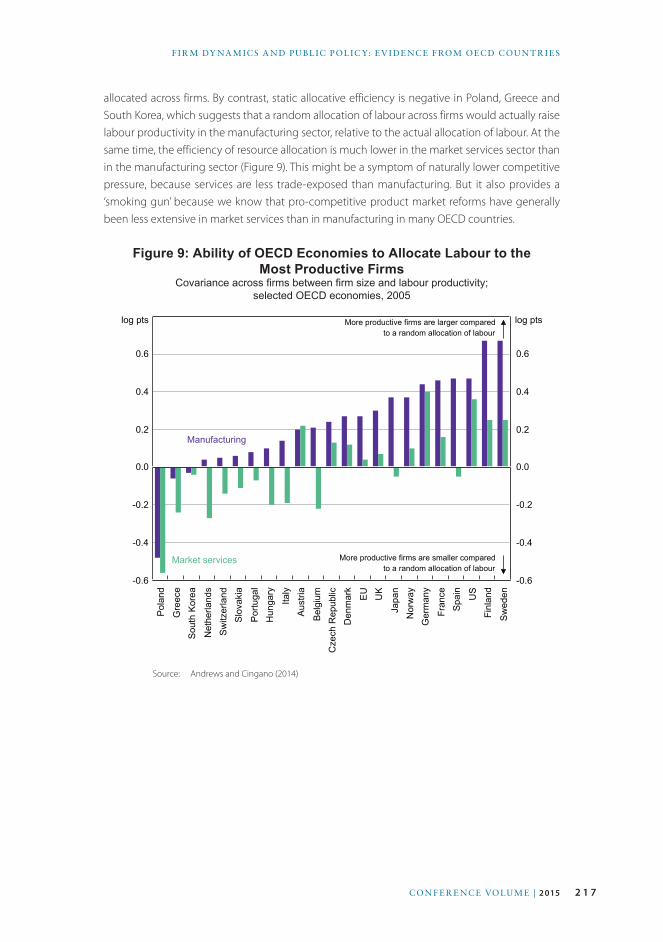
2 1 7CON F E R E NC E VOLU M E | 2 015
F I R M DY NA M IC S A N D PU BL IC POL IC Y: EV I DENCE F ROM OECD COU N T R I E S
allocated across firms. By contrast, static allocative efficiency is negative in Poland, Greece and South Korea, which suggests that a random allocation of labour across firms would actually raise labour productivity in the manufacturing sector, relative to the actual allocation of labour. At the same time, the efficiency of resource allocation is much lower in the market services sector than in the manufacturing sector (Figure 9). This might be a symptom of naturally lower competitive pressure, because services are less trade-exposed than manufacturing. But it also provides a ‘smoking gun’ because we know that pro-competitive product market reforms have generally been less extensive in market services than in manufacturing in many OECD countries.
Figure 9: Ability of OECD Economies to Allocate Labour to the Most Productive Firms
Covariance across firms between firm size and labour productivity; selected OECD economies, 2005
Pol
and
Gre
ece
Sou
th K
orea
Net
herla
nds
Sw
itzer
land
Slo
vaki
a
Por
tuga
lH
unga
ry
Italy
Aus
tria
Bel
gium
Cze
ch R
epub
licD
enm
ark
EU
UK
Japa
nN
orw
ayG
erm
any
Fran
ceS
pain US
Finl
and
Sw
eden
-0.6
-0.4
-0.2
0.0
0.2
0.4
0.6
-0.6
-0.4
-0.2
0.0
0.2
0.4
0.6
log pts
Market services
log pts
Manufacturing
More productive firms are larger comparedto a random allocation of labour
More productive firms are smaller comparedto a random allocation of labour
Source: Andrews and Cingano (2014)
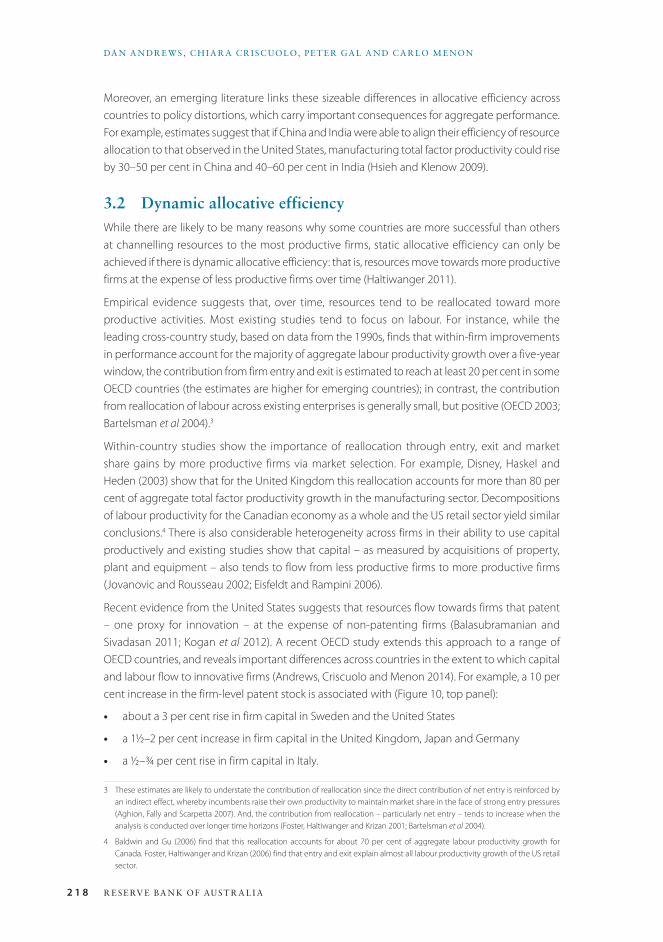
2 1 8 R E SE RV E BA N K OF AUST R A L I A
DA N A N DR EWS , C H I A R A C R ISC UOLO, PET E R GA L A N D C A R LO M E NON
Moreover, an emerging literature links these sizeable differences in allocative efficiency across countries to policy distortions, which carry important consequences for aggregate performance. For example, estimates suggest that if China and India were able to align their efficiency of resource allocation to that observed in the United States, manufacturing total factor productivity could rise by 30–50 per cent in China and 40–60 per cent in India (Hsieh and Klenow 2009).
3.2 Dynamic allocative efficiencyWhile there are likely to be many reasons why some countries are more successful than others at channelling resources to the most productive firms, static allocative efficiency can only be achieved if there is dynamic allocative efficiency: that is, resources move towards more productive firms at the expense of less productive firms over time (Haltiwanger 2011).
Empirical evidence suggests that, over time, resources tend to be reallocated toward more productive activities. Most existing studies tend to focus on labour. For instance, while the leading cross-country study, based on data from the 1990s, finds that within-firm improvements in performance account for the majority of aggregate labour productivity growth over a five-year window, the contribution from firm entry and exit is estimated to reach at least 20 per cent in some OECD countries (the estimates are higher for emerging countries); in contrast, the contribution from reallocation of labour across existing enterprises is generally small, but positive (OECD 2003; Bartelsman et al 2004).3
Within-country studies show the importance of reallocation through entry, exit and market share gains by more productive firms via market selection. For example, Disney, Haskel and Heden (2003) show that for the United Kingdom this reallocation accounts for more than 80 per cent of aggregate total factor productivity growth in the manufacturing sector. Decompositions of labour productivity for the Canadian economy as a whole and the US retail sector yield similar conclusions.4 There is also considerable heterogeneity across firms in their ability to use capital productively and existing studies show that capital – as measured by acquisitions of property, plant and equipment – also tends to flow from less productive firms to more productive firms (Jovanovic and Rousseau 2002; Eisfeldt and Rampini 2006).
Recent evidence from the United States suggests that resources flow towards firms that patent – one proxy for innovation – at the expense of non-patenting firms (Balasubramanian and Sivadasan 2011; Kogan et al 2012). A recent OECD study extends this approach to a range of OECD countries, and reveals important differences across countries in the extent to which capital and labour flow to innovative firms (Andrews, Criscuolo and Menon 2014). For example, a 10 per cent increase in the firm-level patent stock is associated with (Figure 10, top panel):
• about a 3 per cent rise in firm capital in Sweden and the United States
• a 1½–2 per cent increase in firm capital in the United Kingdom, Japan and Germany
• a ½–¾ per cent rise in firm capital in Italy.
3 These estimates are likely to understate the contribution of reallocation since the direct contribution of net entry is reinforced by an indirect effect, whereby incumbents raise their own productivity to maintain market share in the face of strong entry pressures (Aghion, Fally and Scarpetta 2007). And, the contribution from reallocation – particularly net entry – tends to increase when the analysis is conducted over longer time horizons (Foster, Haltiwanger and Krizan 2001; Bartelsman et al 2004).
4 Baldwin and Gu (2006) find that this reallocation accounts for about 70 per cent of aggregate labour productivity growth for Canada. Foster, Haltiwanger and Krizan (2006) find that entry and exit explain almost all labour productivity growth of the US retail sector.
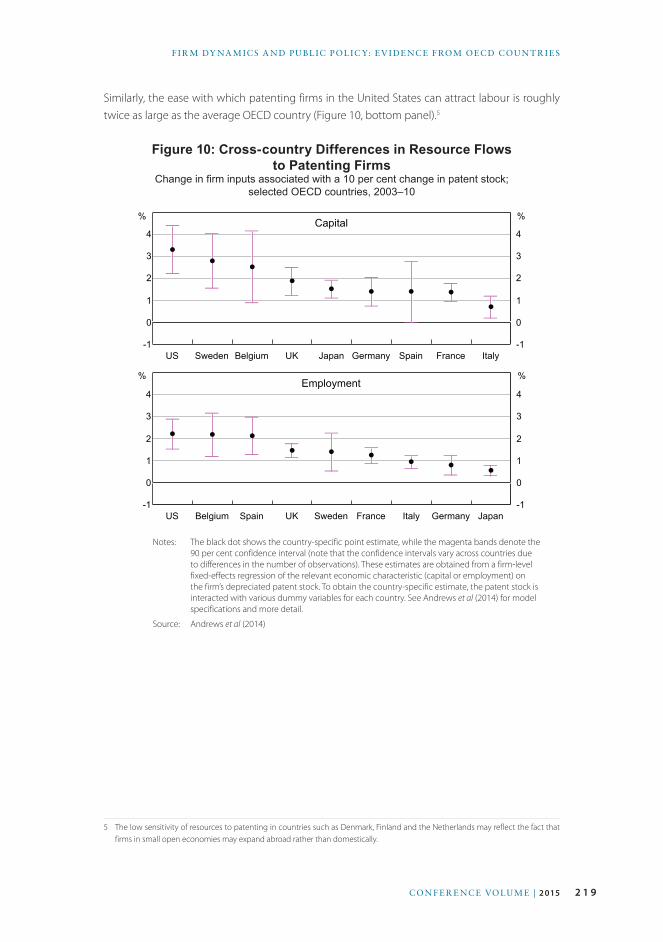
2 1 9CON F E R E NC E VOLU M E | 2 015
F I R M DY NA M IC S A N D PU BL IC POL IC Y: EV I DENCE F ROM OECD COU N T R I E S
Similarly, the ease with which patenting firms in the United States can attract labour is roughly twice as large as the average OECD country (Figure 10, bottom panel).5
Figure 10: Cross-country Differences in Resource Flows to Patenting Firms
Change in firm inputs associated with a 10 per cent change in patent stock; selected OECD countries, 2003–10
Capital
⎯⎯
⎯⎯ ⎯
⎯⎯
⎯⎯
⎯⎯ ⎯
⎯⎯ ⎯
⎯
⎯⎯
●
●●
●
● ● ● ●
●
US Sweden Belgium UK Japan Germany Spain France Italy-1
0
1
2
3
4
-1
0
1
2
3
4
⎯⎯ ⎯ ⎯
⎯⎯ ⎯ ⎯ ⎯
⎯ ⎯ ⎯
⎯⎯
⎯⎯ ⎯
⎯
● ● ●
● ●●
●●
●
US Belgium Spain UK Sweden France Italy Germany Japan-1
0
1
2
3
4
-1
0
1
2
3
4Employment
%
%
%
%
Notes: The black dot shows the country-specific point estimate, while the magenta bands denote the 90 per cent confidence interval (note that the confidence intervals vary across countries due to differences in the number of observations). These estimates are obtained from a firm-level fixed-effects regression of the relevant economic characteristic (capital or employment) on the firm’s depreciated patent stock. To obtain the country-specific estimate, the patent stock is interacted with various dummy variables for each country. See Andrews et al (2014) for model specifications and more detail.
Source: Andrews et al (2014)
5 The low sensitivity of resources to patenting in countries such as Denmark, Finland and the Netherlands may reflect the fact that firms in small open economies may expand abroad rather than domestically.

2 2 0 R E SE RV E BA N K OF AUST R A L I A
DA N A N DR EWS , C H I A R A C R ISC UOLO, PET E R GA L A N D C A R LO M E NON
These patterns are significant because firms require a range of complementary tangible resources to test ideas (e.g. to develop prototypes and business models), develop marketing strategies and eventually produce at a commercially viable scale. They also bear some resemblance to cross-country differences in post-entry employment dynamics, which illustrate that young firms in the United States – and to a lesser extent, Sweden – exhibit ‘up or out’ dynamics, suggesting that market selection is very harsh and reallocation is significant in such environments (Haltiwanger et al 2013; Criscuolo et al 2014b). By contrast, the potential growth of firms in southern European countries – particularly Italy – is much lower, which tends to manifest itself in a high share of old and small firms, which tend to be less innovative.
4. Differences in Cross-country Resource Allocation: The Role of Public Policy
The working hypothesis in this paper is that these apparent differences in the efficiency of resource allocation are closely related to the design of public policies. Accordingly, this section reviews recent OECD evidence on the link between the efficiency of resource allocation and selected public policies.
4.1 Product market regulationsAcross OECD countries, less stringent regulations affecting product markets tend to be associated with higher static allocative efficiency in manufacturing sectors and this relationship is confirmed by econometric analysis (Figure 11). This may reflect the tendency for such regulations to reduce firm entry, prolong the existence of inefficient firms in the market and raise the cost structure of inputs that are required by innovative firms to underpin their expansion. Product market regulations also influence innovation through the ability of successful firms to attract the complementary tangible resources that are required to implement and commercialise new ideas. Figure 12 shows how the estimated flow of resources to patenting firms – a concept introduced in Figure 10 – varies with different public policy settings, based on new OECD econometric modelling (Andrews et al 2014). For example, the estimates imply that the responsiveness of firm employment to increases in the patent stock would more than double if the stringency of product market regulation was reduced from the highest observed level (Poland) to the sample mean value (Belgium).
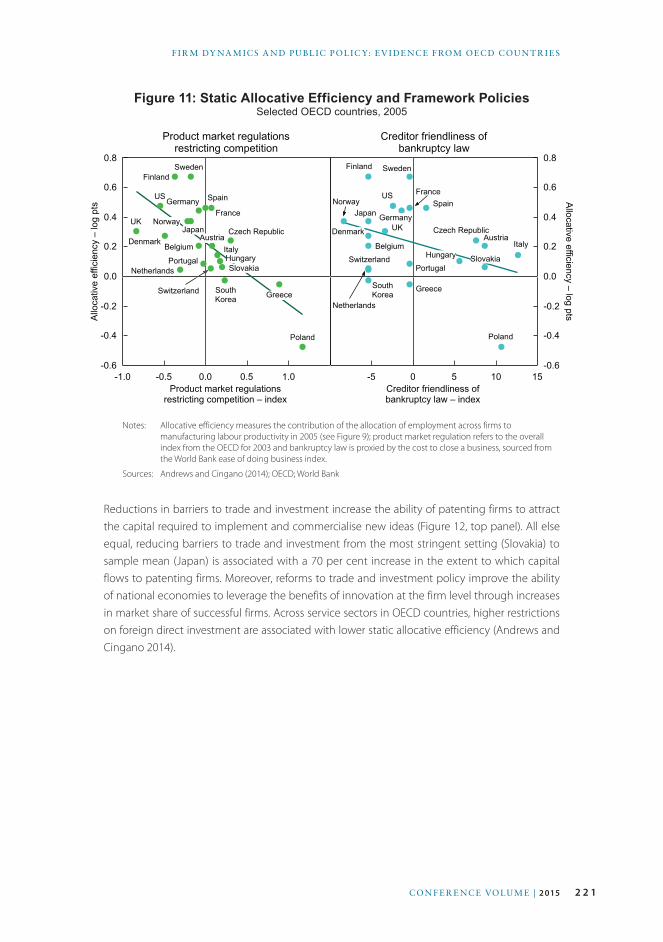
2 2 1CON F E R E NC E VOLU M E | 2 015
F I R M DY NA M IC S A N D PU BL IC POL IC Y: EV I DENCE F ROM OECD COU N T R I E S
Figure 11: Static Allocative Efficiency and Framework PoliciesSelected OECD countries, 2005
Product market regulationsrestricting competition
JJ
J
J
J
J
J
J
J
J
J
JJ
J
JJ
J
J
J J
J
J
-0.6
-0.4
-0.2
0.0
0.2
0.4
0.6
0.8
-1.0 -0.5 0.0 0.5 1.0
Allo
cativ
e ef
ficie
ncy
– lo
g pt
s
Product market regulations restricting competition – index
AustriaBelgium
Switzerland
Czech Republic
Germany
Denmark
Spain
Finland
FranceUK
Greece
HungaryItaly
Japan
South Korea
Netherlands
Norway
Poland
PortugalSlovakia
Sweden
US
JJ
J
J
J
J
J
J
J
J
J
J J
J
JJ
J
J
J J
J
J
-0.6
-0.4
-0.2
0.0
0.2
0.4
0.6
0.8
-5 0 5 10 15
Allocative efficiency – log pts
Creditor friendliness of bankruptcy law – index
AustriaBelgium
Switzerland
Czech RepublicGermany
Denmark
Spain
Finland
France
UK
Greece
HungaryItaly
Japan
South Korea
Netherlands
Norway
Poland
PortugalSlovakia
Sweden
US
Creditor friendliness ofbankruptcy law
Notes: Allocative efficiency measures the contribution of the allocation of employment across firms to manufacturing labour productivity in 2005 (see Figure 9); product market regulation refers to the overall index from the OECD for 2003 and bankruptcy law is proxied by the cost to close a business, sourced from the World Bank ease of doing business index.
Sources: Andrews and Cingano (2014); OECD; World Bank
Reductions in barriers to trade and investment increase the ability of patenting firms to attract the capital required to implement and commercialise new ideas (Figure 12, top panel). All else equal, reducing barriers to trade and investment from the most stringent setting (Slovakia) to sample mean (Japan) is associated with a 70 per cent increase in the extent to which capital flows to patenting firms. Moreover, reforms to trade and investment policy improve the ability of national economies to leverage the benefits of innovation at the firm level through increases in market share of successful firms. Across service sectors in OECD countries, higher restrictions on foreign direct investment are associated with lower static allocative efficiency (Andrews and Cingano 2014).
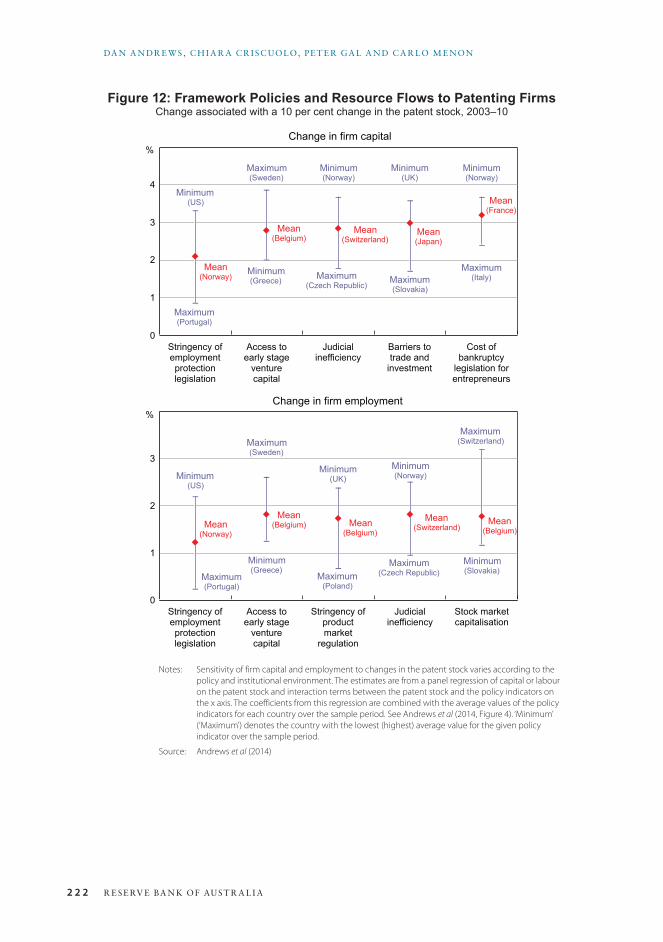
2 2 2 R E SE RV E BA N K OF AUST R A L I A
DA N A N DR EWS , C H I A R A C R ISC UOLO, PET E R GA L A N D C A R LO M E NON
Figure 12: Framework Policies and Resource Flows to Patenting FirmsChange associated with a 10 per cent change in the patent stock, 2003–10
%
Minimum(US)
Change in firm capital
−
−− −
−
−
−− − −
◆
◆ ◆◆
◆
Stringency of employment protection legislation
Access to early stage
venture capital
Judicial inefficiency
Barriers to trade and
investment
Cost of bankruptcy
legislation for entrepreneurs
0
1
2
3
4
Maximum(Portugal)
Mean(Japan)
Minimum(Greece)
Minimum(Norway)
Minimum(UK)
Minimum(Norway)
Mean(France)
Mean(Switzerland)
Mean(Belgium)
Mean(Norway)
Maximum(Sweden)
Maximum(Czech Republic)
Maximum(Slovakia)
Maximum(Italy)
%
Minimum(US)
Change in firm employment
−
−
−−
−
−
−− −
−
◆
◆ ◆ ◆ ◆
Stringency of employment protection legislation
Access to early stage
venture capital
Stringency of product market
regulation
Judicial inefficiency
Stock market capitalisation
0
1
2
3
Maximum(Portugal)
Mean(Switzerland)
Minimum(Greece)
Minimum(UK)
Minimum(Norway)
Maximum(Switzerland)
Mean(Belgium)
Mean(Belgium)
Mean(Belgium)Mean
(Norway)
Maximum(Sweden)
Maximum(Poland)
Maximum(Czech Republic)
Minimum(Slovakia)
Notes: Sensitivity of firm capital and employment to changes in the patent stock varies according to the policy and institutional environment. The estimates are from a panel regression of capital or labour on the patent stock and interaction terms between the patent stock and the policy indicators on the x axis. The coefficients from this regression are combined with the average values of the policy indicators for each country over the sample period. See Andrews et al (2014, Figure 4). ‘Minimum’ (‘Maximum’) denotes the country with the lowest (highest) average value for the given policy indicator over the sample period.
Source: Andrews et al (2014)
2 2 3CON F E R E NC E VOLU M E | 2 015
F I R M DY NA M IC S A N D PU BL IC POL IC Y: EV I DENCE F ROM OECD COU N T R I E S
4.2 Employment protection legislation Employment protection legislation that imposes heavy or unpredictable costs on hiring and firing slows down the reallocation process. Moreover, by raising the costs of exit in case of business failure, stringent employment protection legislation makes it less attractive for firms to experiment with highly uncertain technologies. For example, in sectors with naturally higher reallocation needs – measured by job lay-off, firm turnover and information and communication technology intensity (e.g. electrical and optical equipment) – less stringent employment protection legislation disproportionately raises static allocative efficiency relative to other sectors (Andrews and Cingano 2014). Similarly, in more research and development (R&D)-intensive industries, less-stringent employment protection legislation raises productivity growth to the extent that it is associated with a more dynamic firm growth distribution – that is, a lower share of static firms and higher share of growing and shrinking firms (Bravo-Biosca et al 2013).
Consistent with these findings, less-stringent employment protection legislation significantly increases the ability of innovative firms to attract resources that are required to implement and commercialise new ideas (Figure 12). For example, a policy reform that reduced the stringency of employment protection legislation from the highest observed level (Portugal) to the mean level (Norway) is estimated to more than double the extent to which labour flows to patenting firms. Andrews et al (2014) also find that the burden of stringent employment protection legislation falls disproportionately on young firms, which is consistent with existing studies showing that stringent employment protection legislation reduces the scope for experimentation with uncertain technologies.
4.3 Bankruptcy legislation and judicial efficiencyBankruptcy legislation that does not excessively penalise failure – as measured by a lower cost to close a business – can promote the flow of capital to more innovative firms (Figure 12, top panel), by reducing:
• the expectation of entrepreneurs that they will be heavily penalised in case of failure
• the likelihood that scarce resources are trapped in inefficient firms.
By contrast, if the cost of winding down a business is particularly high, risky entrepreneurial ventures might not be brought to the market to avoid incurring high exit costs in case of failure. Indeed, bankruptcy codes that more heavily penalise failure are negatively associated with multifactor productivity growth and the share of high growth firms in capital-intensive industries (Bravo-Biosca et al 2013). Finally, across OECD countries, less-stringent bankruptcy legislation is to some extent associated with higher static allocative efficiency (Figure 11, right panel), and this effect is particularly strong in sectors with naturally higher firm turnover rates, where regulations affecting exit costs are most likely to bind (Andrews and Cingano 2014).
The swift reallocation of resources from failed ventures will also be affected by the time required for the full completion of all legal procedures to wind up a business and the obstacles to the use of out-of-court arrangements. In extreme cases, these legal procedures might take years to complete, thus undermining effective reallocation and the accumulation of entrepreneurial capital. In fact, well-designed legal systems can support efficient resource allocation and raise the returns to
2 2 4 R E SE RV E BA N K OF AUST R A L I A
DA N A N DR EWS , C H I A R A C R ISC UOLO, PET E R GA L A N D C A R LO M E NON
innovation (Nunn 2007; Haltiwanger 2011). For example, in countries with more efficient judicial systems – proxied by a lower cost of enforcing contracts – labour flows more readily to patenting firms (Figure 12, bottom panel).6
4.4 Financial development and access to risk capital Resource flows to patenting firms tend to be stronger in countries with more developed financial markets (Figure 12). This effect is particularly important for young firms (Andrews et al 2014). Thus, financial systems play an important role in helping credit-constrained firms implement and commercialise new ideas, in turn raising the returns to innovation. Similarly, resources flow more freely to young patenting firms in countries with more developed markets for seed and early stage venture capital (Figure 12). This suggests that seed and early stage venture capital plays an important role in ensuring the growth of young patenting firms and the development of radical innovations. For example, all else equal, increasing access to early stage venture capital from the lowest level (Greece) to the sample mean (Belgium) implies that capital flows to patenting firms would be around one-third higher than otherwise.
4.5 The unintended consequences of R&D fiscal incentivesR&D tax incentives – a non-discriminatory tool that aims to reduce firms’ marginal costs of R&D activities – are present in most OECD countries and also in some non-OECD countries, such as Brazil, China, India and the Russian Federation. Support for business R&D through the tax system is typically combined with a broader set of direct support policies (e.g. grants, loans and loan guarantees) that are also intended to address market failures related to investment in innovation. While significant cross-country differences exist in the policy mix, there has recently been a general shift away from direct support toward more generous R&D tax incentives (Andrews and Criscuolo 2013).
OECD evidence suggests that R&D tax incentives have the unintended consequence of protecting incumbents to the detriment of potential entrants, thus slowing down the reallocation process (Bravo-Biosca et al 2013). Figure 13 shows that more generous R&D tax credits are associated with a more static distribution of firm growth in R&D intensive sectors – that is, a higher share of stagnant firms and a lower share of shrinking firms. This means that R&D tax incentives disproportionately benefit the slowest-growing incumbent firms.
This finding raises the possibility that R&D tax incentives may slow down the reallocation process if not designed properly. Indeed, one policy recommendation to follow from this research is that it is important that R&D tax incentives are refundable or contain carryover provisions. Including these features in R&D tax incentives would help avoid overly favouring less dynamic incumbents at the expense of dynamic young firms (Andrews and Criscuolo 2013). Many young innovative firms typically make losses in the early years of an R&D project and, thus, will not benefit from R&D tax incentives unless the incentives contain provisions for immediate cash refunds or allow such firms to carry associated losses forward to deduct against future tax burdens.
6 The cost of enforcing contracts is sourced from the World Bank and measures the court costs and legal fees as a per cent of the debt value.
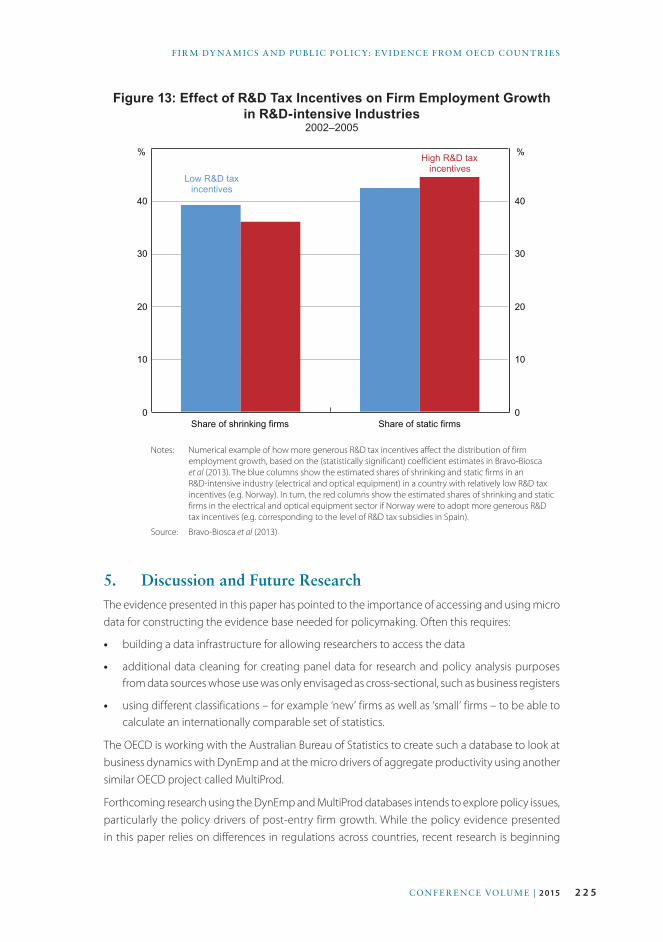
2 2 5CON F E R E NC E VOLU M E | 2 015
F I R M DY NA M IC S A N D PU BL IC POL IC Y: EV I DENCE F ROM OECD COU N T R I E S
Figure 13: Effect of R&D Tax Incentives on Firm Employment Growth in R&D-intensive Industries
2002–2005
Share of shrinking firms Share of static firms0
10
20
30
40
0
10
20
30
40
% High R&D taxincentives
%
Low R&D taxincentives
Notes: Numerical example of how more generous R&D tax incentives affect the distribution of firm employment growth, based on the (statistically significant) coefficient estimates in Bravo-Biosca et al (2013). The blue columns show the estimated shares of shrinking and static firms in an R&D-intensive industry (electrical and optical equipment) in a country with relatively low R&D tax incentives (e.g. Norway). In turn, the red columns show the estimated shares of shrinking and static firms in the electrical and optical equipment sector if Norway were to adopt more generous R&D tax incentives (e.g. corresponding to the level of R&D tax subsidies in Spain).
Source: Bravo-Biosca et al (2013)
5. Discussion and Future ResearchThe evidence presented in this paper has pointed to the importance of accessing and using micro data for constructing the evidence base needed for policymaking. Often this requires:
• building a data infrastructure for allowing researchers to access the data
• additional data cleaning for creating panel data for research and policy analysis purposes from data sources whose use was only envisaged as cross-sectional, such as business registers
• using different classifications – for example ‘new’ firms as well as ‘small’ firms – to be able to calculate an internationally comparable set of statistics.
The OECD is working with the Australian Bureau of Statistics to create such a database to look at business dynamics with DynEmp and at the micro drivers of aggregate productivity using another similar OECD project called MultiProd.
Forthcoming research using the DynEmp and MultiProd databases intends to explore policy issues, particularly the policy drivers of post-entry firm growth. While the policy evidence presented in this paper relies on differences in regulations across countries, recent research is beginning

2 2 6 R E SE RV E BA N K OF AUST R A L I A
DA N A N DR EWS , C H I A R A C R ISC UOLO, PET E R GA L A N D C A R LO M E NON
to highlight the adverse consequences for aggregate productivity of regulations that vary in stringency depending on firm size. For example, Garicano, LeLarge and Van Reenan (2013) show that labour regulations in France – which become more stringent once a firm reaches a size of 50 employees – induce a bunching of firms just below the 50 employee threshold. This carries adverse consequences for allocative efficiency since these firms are relatively more productive than larger firms on the other side of the threshold. The welfare costs of this phenomenon are estimated to be around 4–5 per cent of GDP. Using the data collected from the second phase of the DynEmp project, combined with a newly collected database on size-contingent labour regulations (Calvino et al forthcoming), new research is exploring the effect of size-contingent policies on the firm size distribution across selected countries. This would also appear to be relevant for Australia, given that the stringency of labour regulations varies with firm size and there has been recent debate over whether a two-tier corporate tax rate that varies according to firm size should be introduced.
2 2 7CON F E R E NC E VOLU M E | 2 015
F I R M DY NA M IC S A N D PU BL IC POL IC Y: EV I DENCE F ROM OECD COU N T R I E S
ReferencesAghion P, E Bartelsman, E Perotti and S Scarpetta (2008), ‘Barriers to Exit, Experimentation and Comparative
Advantage’, Regional Comparative Advantage and Knowledge-Based Entrepreneurship (RICAFE 2) Working
Paper No 056.
Aghion P, T Fally and S Scarpetta (2007), ‘Credit Constraints as a Barrier to the Entry and Post-Entry Growth
of Firms: Theory and Evidence’, Economic Policy, 22(52), pp 731, 733–779.
Altomonte C (2010), ‘Micro-Founding “Europe 2020”’, Presentation at Bruegel Workshop ‘EU2020: Building
Blocks for Europe’s Growth and Employment Strategy’, Brussels, 11 January.
Andrews D and F Cingano (2014), ‘Public Policy and Resource Allocation: Evidence from Firms in OECD
Countries’, Economic Policy, 29(78), pp 253, 255–296.
Andrews D and C Criscuolo (2013), ‘Knowledge-Based Capital, Innovation and Resource Allocation’, OECD
Economics Department Working Papers No 1046.
Andrews D, C Criscuolo and C Menon (2014), ‘Do Resources Flow to Patenting Firms? Cross-Country
Evidence from Firm Level Data’, OECD Economics Department Working Papers No 1127.
Balasubramanian N and J Sivadasan (2011), ‘What Happens When Firms Patent? New Evidence from U.S.
Economic Census Data’, The Review of Economics and Statistics, 93(1), pp 126–146.
Baldwin JR and W Gu (2006), Competition, Firm Turnover and Productivity Growth, Economic Analysis (EA)
Research Paper Series, Cat No 11F0027MIE — No 042, Statistics Canada, Ottawa.
Bartelsman E, PA Gautier and J de Wind (2010), ‘Employment Protection, Technology Choice, and Worker
Allocation’, IZA Discussion Paper No 4895.
Bartelsman E, J Haltiwanger and S Scarpetta (2004), ‘Microeconomic Evidence of Creative Destruction in
Industrial and Developing Countries’, IZA Discussion Paper No 1374.
Bartelsman E, J Haltiwanger and S Scarpetta (2013), ‘Cross-Country Differences in Productivity: The Role
of Allocation and Selection’, The American Economic Review, 103(1), pp 305–334.
Bartelsman E, S Scarpetta and F Schivardi (2003), ‘Comparative Analysis of Firm Demographics and
Survival: Micro-Level Evidence for the OECD Countries’, OECD Economics Department Working Papers No 348.
Bravo-Biosca A, C Criscuolo and C Menon (2013), ‘What Drives the Dynamics of Business Growth?’, OECD
Science, Technology and Industry Policy Papers No 1.
Calvino F, C Criscuolo and C Menon (2015), ‘Cross-Country Evidence on Start-Up Dynamics’, OECD Science,
Technology and Industry Working Papers No 2015/06.
Calvino F, C Criscuolo, C Menon and N Johnstone (forthcoming), ‘The Role of Size-Contingent Policies for
Firm Size and Growth Distributions’, OECD Working Paper.
Conway P, D de Rosa, G Nicoletti and F Steiner, (2007), ‘Product Market Regulation and Productivity
Convergence’, OECD Economic Studies, 2006(2), pp 39–76.
Criscuolo C, PN Gal and C Menon (2014a), ‘Do Micro Start-Ups Fuel Job Creation? Cross-Country Evidence
from the DynEmp Express Database’, Unpublished manuscript, OECD.
Criscuolo C, PN Gal and C Menon (2014b), ‘The Dynamics of Employment Growth: New Evidence from
18 Countries’, OECD Science, Technology and Industry Policy Papers No 14.
Criscuolo C, PN Gal and C Menon (2014c), ‘DynEmp: A Stata® Routine for Distributed Micro-Data Analysis of
Business Dynamics’, OECD Science, Technology and Industry Working Papers No 2014/02.
2 2 8 R E SE RV E BA N K OF AUST R A L I A
DA N A N DR EWS , C H I A R A C R ISC UOLO, PET E R GA L A N D C A R LO M E NON
Disney R, J Haskel and Y Heden (2003), ‘Restructuring and Productivity Growth in UK Manufacturing’, The
Economic Journal, 113(489), pp 666–694.
Eisfeldt AL and AA Rampini (2006), ‘Capital Reallocation and Liquidity’, Journal of Monetary Economics,
53(3), pp 369–399.
Foster L, J Haltiwanger, and CJ Krizan (2001), ‘Aggregate Productivity Growth: Lessons from Microeconomic
Evidence’, in CR Hulten, ER Dean and MJ Harper (eds), New Developments in Productivity Analysis, NBER Studies
in Income and Wealth, Vol 63, University of Chicago Press, Chicago, pp 303–363.
Foster L, J Haltiwanger and CJ Krizan (2006), ‘Market Selection, Reallocation, and Restructuring in the U.S.
Retail Trade Sector in the 1990s’, The Review of Economics and Statistics, 88(4), pp 748–758.
Garicano L, C LeLarge and J Van Reenen (2013), ‘Firm Size Distortions and the Productivity Distribution:
Evidence from France’, NBER Working Paper No 18841.
Haltiwanger J (2011), ‘Firm Dynamics and Economic Performance’, Paper presented at the Annual Bank
Conference on Development Economics (ABCDE) ‘Broadening Opportunities for Development’, Paris,
30 May–1 June.
Haltiwanger J, RS Jarmin and J Miranda (2013), ‘Who Creates Jobs? Small Versus Large Versus Young’, The
Review of Economics and Statistics, 95(2), pp 347–361.
Hsieh C-T and PJ Klenow (2009), ‘Misallocation and Manufacturing TFP in China and India’, The Quarterly
Journal of Economics, 124(4), pp 1403–1448.
Jovanovic B and PL Rousseau (2002), ‘The Q-Theory of Mergers’, The American Economic Review, 92(2),
pp 198–204.
Kogan L, D Papanikolaou, A Seru and N Stoffman (2012), ‘Technological Innovation, Resource Allocation,
and Growth’, NBER Working Paper No 17769.
Nunn N (2007), ‘Relationship-Specificity, Incomplete Contracts, and the Pattern of Trade’, The Quarterly
Journal of Economics, (122)2, pp 569–600.
OECD (Organisation for Economic Co-operation and Development) (2003), The Sources of Economic
Growth in OECD Countries, OECD Publishing, Paris.
Olley GS and A Pakes (1996), ‘The Dynamics of Productivity in the Telecommunications Equipment
Industry’, Econometrica, 64(6), pp 1263–1297.
Syverson C (2004), ‘Product Substitutability and Productivity Dispersion’, The Review of Economics and
Statistics, 86(2), pp 534–550.
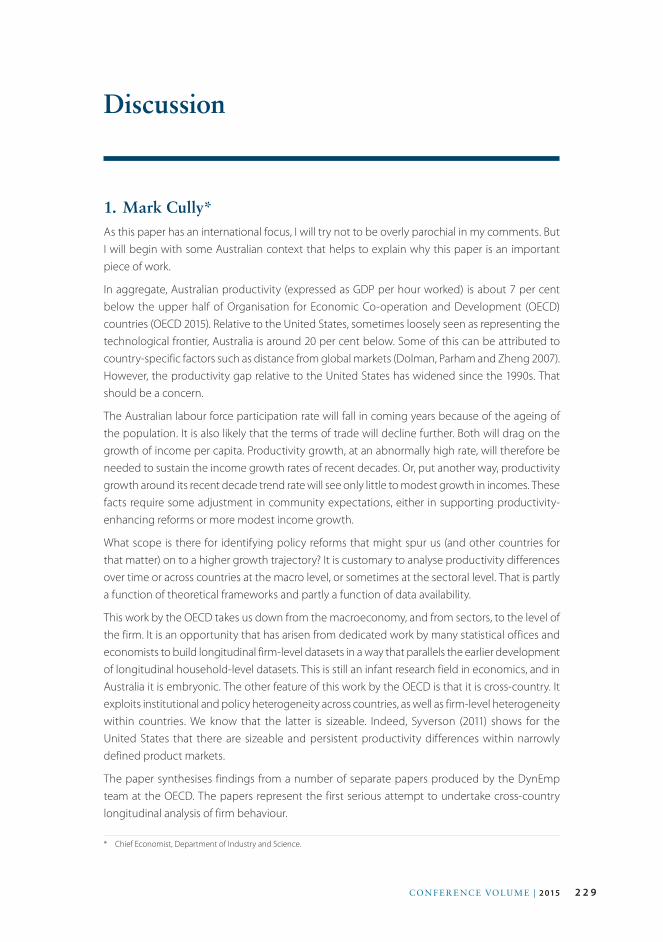
2 2 9CON F E R E NC E VOLU M E | 2 015
Discussion
1. Mark Cully*As this paper has an international focus, I will try not to be overly parochial in my comments. But I will begin with some Australian context that helps to explain why this paper is an important piece of work.
In aggregate, Australian productivity (expressed as GDP per hour worked) is about 7 per cent below the upper half of Organisation for Economic Co-operation and Development (OECD) countries (OECD 2015). Relative to the United States, sometimes loosely seen as representing the technological frontier, Australia is around 20 per cent below. Some of this can be attributed to country-specific factors such as distance from global markets (Dolman, Parham and Zheng 2007). However, the productivity gap relative to the United States has widened since the 1990s. That should be a concern.
The Australian labour force participation rate will fall in coming years because of the ageing of the population. It is also likely that the terms of trade will decline further. Both will drag on the growth of income per capita. Productivity growth, at an abnormally high rate, will therefore be needed to sustain the income growth rates of recent decades. Or, put another way, productivity growth around its recent decade trend rate will see only little to modest growth in incomes. These facts require some adjustment in community expectations, either in supporting productivity-enhancing reforms or more modest income growth.
What scope is there for identifying policy reforms that might spur us (and other countries for that matter) on to a higher growth trajectory? It is customary to analyse productivity differences over time or across countries at the macro level, or sometimes at the sectoral level. That is partly a function of theoretical frameworks and partly a function of data availability.
This work by the OECD takes us down from the macroeconomy, and from sectors, to the level of the firm. It is an opportunity that has arisen from dedicated work by many statistical offices and economists to build longitudinal firm-level datasets in a way that parallels the earlier development of longitudinal household-level datasets. This is still an infant research field in economics, and in Australia it is embryonic. The other feature of this work by the OECD is that it is cross-country. It exploits institutional and policy heterogeneity across countries, as well as firm-level heterogeneity within countries. We know that the latter is sizeable. Indeed, Syverson (2011) shows for the United States that there are sizeable and persistent productivity differences within narrowly defined product markets.
The paper synthesises findings from a number of separate papers produced by the DynEmp team at the OECD. The papers represent the first serious attempt to undertake cross-country longitudinal analysis of firm behaviour.
* Chief Economist, Department of Industry and Science.
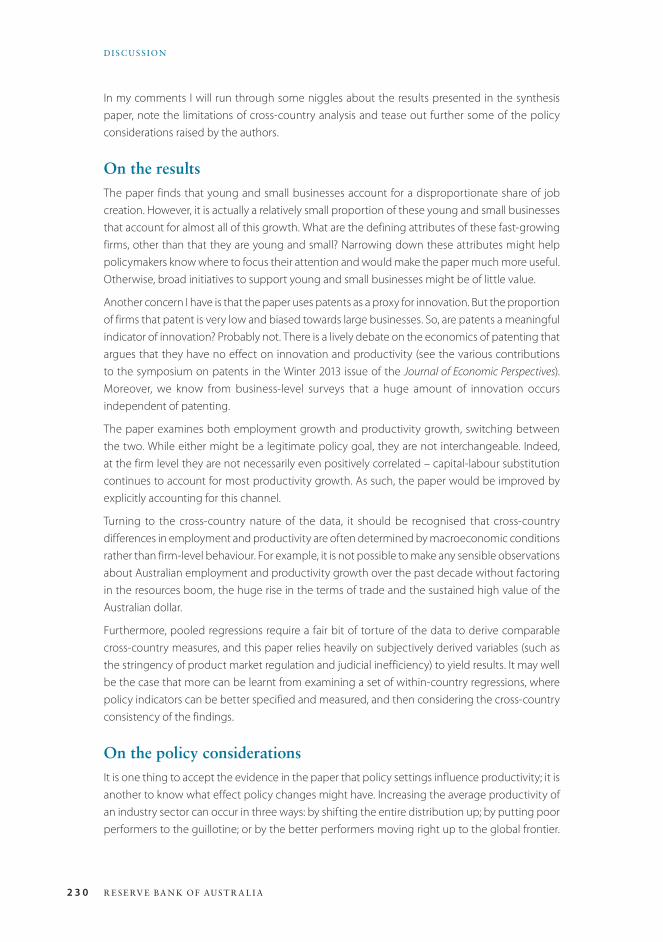
2 3 0 R E SE RV E BA N K OF AUST R A L I A
DISC US SION
In my comments I will run through some niggles about the results presented in the synthesis paper, note the limitations of cross-country analysis and tease out further some of the policy considerations raised by the authors.
On the resultsThe paper finds that young and small businesses account for a disproportionate share of job creation. However, it is actually a relatively small proportion of these young and small businesses that account for almost all of this growth. What are the defining attributes of these fast-growing firms, other than that they are young and small? Narrowing down these attributes might help policymakers know where to focus their attention and would make the paper much more useful. Otherwise, broad initiatives to support young and small businesses might be of little value.
Another concern I have is that the paper uses patents as a proxy for innovation. But the proportion of firms that patent is very low and biased towards large businesses. So, are patents a meaningful indicator of innovation? Probably not. There is a lively debate on the economics of patenting that argues that they have no effect on innovation and productivity (see the various contributions to the symposium on patents in the Winter 2013 issue of the Journal of Economic Perspectives). Moreover, we know from business-level surveys that a huge amount of innovation occurs independent of patenting.
The paper examines both employment growth and productivity growth, switching between the two. While either might be a legitimate policy goal, they are not interchangeable. Indeed, at the firm level they are not necessarily even positively correlated – capital-labour substitution continues to account for most productivity growth. As such, the paper would be improved by explicitly accounting for this channel.
Turning to the cross-country nature of the data, it should be recognised that cross-country differences in employment and productivity are often determined by macroeconomic conditions rather than firm-level behaviour. For example, it is not possible to make any sensible observations about Australian employment and productivity growth over the past decade without factoring in the resources boom, the huge rise in the terms of trade and the sustained high value of the Australian dollar.
Furthermore, pooled regressions require a fair bit of torture of the data to derive comparable cross-country measures, and this paper relies heavily on subjectively derived variables (such as the stringency of product market regulation and judicial inefficiency) to yield results. It may well be the case that more can be learnt from examining a set of within-country regressions, where policy indicators can be better specified and measured, and then considering the cross-country consistency of the findings.
On the policy considerationsIt is one thing to accept the evidence in the paper that policy settings influence productivity; it is another to know what effect policy changes might have. Increasing the average productivity of an industry sector can occur in three ways: by shifting the entire distribution up; by putting poor performers to the guillotine; or by the better performers moving right up to the global frontier.
2 3 1CON F E R E NC E VOLU M E | 2 015
DISC US SION
To induce any of these changes would require quite different policy prescriptions (and costs). One also needs to be mindful of wider consequences.
For instance, the paper suggests that reducing bankruptcy costs might promote entrepreneurship and be more permissive of failure. What effect might that have on average productivity? On the one hand, it might allow the odd black swan to emerge and flourish, thereby increasing average productivity. On the other, it could also stave off the death of laggard firms, dragging productivity down.
Similarly, the proposal in the paper of moving from high to low research and development (R&D) tax incentives would seem to run counter to the paper’s other idea of encouraging firms to move to the national or global frontier. And that is a different issue again from another proposal in the paper that R&D tax incentives should be refundable for loss-making firms (as the Australian scheme now allows) so that incentives are not biased towards incumbent firms.
As both of the above examples illustrate, policy design matters a lot, and it is likely to be path dependent and country contingent. Again, that suggests combining cross-country analysis with country-specific studies.
The discussion is missing some aspects that commonly feature in current policy dialogue. One is management capability. Bloom et al (2014) estimate that as much as a quarter of the variation in firm-level productivity across countries is attributable to differences in management capability. Should governments have a role in developing management capability, or can we leave that to business schools?
That question opens up broader considerations around the institutional environment in which firms operate, and whether these support innovation and productivity. One needs to be careful that in opening up analysis at the level of the firm, the role of the wider institutional environment is not lost. For example, it is generally believed that Australia is relatively poor at translating academic research ideas into commercial opportunities. The explanation for this failure likely lies at the intersection between academic researchers and business, something difficult to observe with firm-level data (or to even measure objectively at a country level).
More broadly, there has been something of a renaissance in industry policy in OECD countries. These policies have moved away from direct support of individual firms towards initiatives intended to overcome network and coordination failures at the industry level. This approach is the rationale for government programs such as Top sectors in the Netherlands, Catapult centres in the United Kingdom and Industry Growth Centres in Australia. Estimating the effectiveness of such programs is also likely to be beyond the capacity of firm-level datasets.
ConclusionTo reiterate, I believe this is an important piece of work and I believe we need more studies like this. And to that end, let me finish with two parochial observations.
First, business statistics have long been the poor cousin of social statistics in Australia. This has not been helped by an official mindset that tends to see business statistics as inputs to compiling the national accounts, rather than as data of analytical interest in their own right. Very tight access restrictions for outside researchers to firm-level data held by the Australian Bureau of Statistics (ABS) has also been a factor.
2 3 2 R E SE RV E BA N K OF AUST R A L I A
DISC US SION
Second, it would be terrific to see the Australian data for DynEmp be made widely available. These data are currently being compiled by the ABS with funding from the Department of Industry and Science. These data could help develop our understanding of the behaviour and economics of firms in the same way that HILDA – the Household, Income and Labour Dynamics in Australia Survey – has been used so richly to understand the behaviour and economics of households.
ReferencesBloom N, R Lemos, R Sadun, D Scur and J Van Reenen (2014), ‘JEEA-FBBVA Lecture 2013: The New Empirical
Economics of Management’, Journal of the European Economic Association, 12(4), pp 835–876.
Dolman B, D Parham and S Zheng (2007), Can Australia Match US Productivity Performance?, Productivity
Commission Staff Working Paper, Productivity Commission, Canberra, March.
OECD (Organisation for Economic Co-operation and Development) (2015), Economic Policy Reforms
2015: Going for Growth, OECD Publishing, Paris.
Syverson C (2011), ‘What Determines Productivity?’, Journal of Economic Literature, 49(2), pp 326–365.
2. General DiscussionMuch of the discussion focused on the policy implications of the paper. Participants highlighted the finding that young businesses, rather than small businesses, contribute disproportionately to employment growth and innovation. Participants attributed this distinction to the fact that many small businesses are not growth oriented. Instead, small businesses are often operated for lifestyle reasons and tend to target a particular income level; once they reach that level, these firms have little desire to grow further. While the paper did not include Australian data, participants agreed that the results would likely be similar in Australia. Participants took the paper’s findings to imply that policies to grow employment and encourage innovation should not be targeted at small businesses in general, but rather at the subset of businesses that are young. In particular, participants suggested that policies should not be biased towards incumbent firms. One participant noted that small businesses have many advocates in Australia, but there also need to be strong advocates for newly established firms and firms that don’t yet exist.
Relatedly, and in response to the discussant, Chiara Criscuolo spoke about the impact of R&D tax incentives. She reiterated her finding that R&D tax incentives often have the unintended consequence of supporting incumbents to the detriment of new entrants. This is because young businesses are often loss making, and so tax credits are of little use. In contrast, tax credits are useful for established, profit-making firms. She argued that R&D tax incentives need to take account of this, for example by allowing tax credits to be carried forward or refunded.
Bankruptcy regulation was noted as a key policy area for young businesses. Participants stressed the importance of policies that enable unsuccessful businesses to fail; when firms exit, resources become available to new entrants. Participants believed that policymakers should embrace this so-called ‘creative destruction’, for example by implementing policies that reduce the cost of failure. Participants were supportive of current Australian arrangements, which do not impose penalties for failure except in specific circumstances, such as when a law has been breached or a personal guarantee has been provided. There was also some discussion about the size of business
2 3 3CON F E R E NC E VOLU M E | 2 015
DISC US SION
failures. One participant noted that, at face value, most small business failures are small: on average, liquidators deal with less than $250 000 worth of assets and around half of failures have no assets at all. However, the participant argued that this understates the true size of failures because it ignores the loss of intangible assets, such as goodwill, intellectual property and productive managerial processes. Another participant highlighted the distinction between corporate and personal bankruptcy. The participant suggested that what matters when talking about small businesses is personal bankruptcy regulation. The participant questioned whether the paper’s measure of bankruptcy is able to distinguish these. Dr Criscuolo cited a previous study she had been involved in that discussed both corporate and personal bankruptcy. However, she noted that cross-country data limitations for personal bankruptcy meant that it could not be disentangled from corporate bankruptcy in the study’s empirical analysis (Bravo-Biosca, Criscuolo and Menon 2013).
The discussion then turned to the data and methods used in the paper. Some participants questioned how confidently the paper can identify the effect of policies, because it uses static measures of policy stances – such as the relative creditor-friendliness of bankruptcy regimes – to explain dynamic outcomes (growth in employment and productivity). Although the dataset showed strong correlations, identifying causality is problematic. Dr Criscuolo responded by noting that there was a small amount of time variation in the indices of bankruptcy regulation. In addition, other OECD work has tried to get around the identification problem by using difference-in-differences regressions with country fixed effects and sector fixed effects (Bravo-Biosca et al 2013). These methods allow identification of the effect of regulatory changes by exploiting the differential impact of policies across sectors within the same countries.
Participants were impressed with the paper’s dataset. They noted difficulties with obtaining useful firm-level data that can answer the types of questions addressed in the paper. Participants supported recent efforts by the ABS to improve its business dataset. This led to a discussion about the threshold for when a firm should be counted in the ABS Business Register, because new firms appear to be particularly important for studies on employment and innovation. Dr Criscuolo explained that her work counted new firms once they started employing. ABS data do not count firms that have not remitted goods and services tax in the last five quarters for quarterly remitters or in the last three years for annual remitters.
One participant questioned whether the paper’s methods could adequately capture the dynamics of firm growth because firms can grow internally by hiring, or externally by outsourcing; the latter would not be captured in the paper’s data. The participant cited previous research that found a surge in outsourcing activity around size-contingent policy thresholds. While it may appear that a firm is ‘stuck’ at a particular size, the firm may be growing by other means, such as outsourcing. If the extent of outsourcing varies by jurisdiction, it will be difficult to make meaningful cross-country comparisons. Dr Criscuolo recognised this limitation of the paper, and added that offshoring is similarly a concern. The paper was unable to address these issues due to data limitations, but noted that previous research based on industry-level data produced similar trends as the present paper.
ReferenceBravo-Biosca A, C Criscuolo and C Menon (2013), ‘What Drives the Dynamics of Business Growth?’, OECD
Science, Technology and Industry Policy Papers No 1.

2 3 4 R E SE RV E BA N K OF AUST R A L I A

2 3 5CON F E R E NC E VOLU M E | 2 015
Panel Discussion: What is the Future for Small Business?
The final session of the Conference was a panel discussion about the panellists’ experiences in the small business sector and how they saw the future for small businesses. The panellists were drawn from a wide cross-section of the small business sector, including representatives from the not-for-profit sector, the entrepreneurial sector and an industry body. The discussion was chaired by Michael Schaper, Deputy Chairman of the Australian Competition and Consumer Commission and Adjunct Professor at the Curtin Business School. The panellists were:
• Michael Henderson – Founder and Chairman of MEDSCI International Healthcare and Adjunct Professor with the Faculty of Medicine, Dentistry and Health Sciences at the University of Western Australia
• Bruce Jeffreys – Co-founder of GoGet CarShare and Dresden Optics
• Kate Carnell – Chief Executive Officer (CEO) of the Australian Chamber of Commerce and Industry.
Each panellist provided their views after which the Chair invited comments and questions from all participants.
1. Michael HendersonI am not an economist, nor a banker and I am not here with an academic hat on. Instead, what I want to do today is to look at a couple of grassroots examples of social and corporate entrepreneurship, from my perspective as an entrepreneur. I want to use these examples to illustrate the way that innovative technologies have changed, and will continue to change, the landscape for small and medium-sized enterprises (SMEs) and not-for-profit organisations. This matters because these enterprises can promote social outcomes like remote access to health care and can deliver cost savings for the health sector. The future of SMEs and the not-for-profit sector depends on ensuring that we continue to provide the technology platforms that permit these enterprises to achieve these outcomes and deliver these savings.
I have had a very personal experience with the way technology can and has transformed health care. Three years ago I was hit in the face by a tow rope while I was in a remote town north of Perth, Western Australia. The impact threw me into the air and I ended up with a critical injury of my eye, a broken nose, a broken cheek and a broken eye socket. I was taken to an after-hours medical centre, which was staffed by a nurse who was completely distraught about how to manage me and my injury. I was lucky that on my smart phone I could call a Professor of Ophthalmology, who was on holidays in Sydney at the time. We converted to a Skype call and – with intervention from the ophthalmologist – we were able to save my eye. Without that Skype call, I would have most likely lost my eye within the next five to ten minutes.
2 3 6 R E SE RV E BA N K OF AUST R A L I A
PANEL DISCUSSION: WHAT IS THE FUTURE FOR SMALL BUSINESS?
This experience really reinforced my view that everyone should be treated the same and have equal access to medical care via technology that is capable of delivering valuable social outcomes. Ultimately, I wanted to use technology to improve conventional medical support by potentially having up to six specialists over the shoulder of a paramedic, nurse or GP and to deliver specialist, acute advice that would not otherwise have been available to a paramedic, nurse or GP in a remote site. This support program has grown exponentially and is now providing acute point-of-injury and triage support for major resource companies – both onshore and offshore – and the program is now being backed by a major international emergency response group.
SMEs can be found in both the for-profit and not-for-profit sectors, and the future growth of both types can benefit from new technologies. For example, another not-for-profit SME delivering ‘multiplier’ social outcomes is the International Skills and Training Institute in Health (ISTIH), which I co-founded with Professor Bruce Robinson in 2005. The idea with ISTIH is to build healthcare capacity by having a volunteer doctor travel overseas to train and ‘upskill’ local doctors as trainers themselves. These doctors can, using the same training platform, pass this knowledge on to others. It is like dropping a pebble into a pond. These ripples mean that you have the expertise in place when the next tsunami or natural disaster strikes, to save the lives of people that would otherwise die in the first 6 to 12 hours if those services had not been developed.
One of the most interesting examples of a small not-for-profit using technology to transform health care is Silver Chain Group headquartered in Western Australia. They have now grown to be a significant national interest on the back of this technology. What they have been able to do is provide a unique and cost-effective model for managing patients. They are able to deliver services to groups of patients for say $60 million or less, when delivering services that would have previously cost state governments $80 million or more. The really interesting thing about this small not-for-profit is the technology that the organisation has developed. This technology is now being considered for sale to one of the major telecommunications companies and is not only going to change the way medicine is delivered nationally and internationally, it will also promote that social outcome of equal access to medicine that I discussed earlier.
All these SMEs are using technology in new ways to deliver social outcomes. The future of innovative SMEs really hinges on leveraging technology in innovative ways. So the real question that these observations and examples raise for me – and I put this out there as a grassroots individual, not an economist or policymaker – is: how do we provide SMEs and the not-for-profit sector with the skills and technology they need?
We need to be smart and think about this question in terms of an overarching and holistic funding model and not focus at the micro level in terms of an individual SME. We need to think about the best ways to fund and bring together organisations like the Commonwealth Scientific and Industrial Research Organisation (CSIRO) and National ICT Australia (NICTA) to provide technological infrastructure for SMEs. We need to ensure that these efforts are focused and not spread randomly across disparate federal government organisations. We need to make sure that these institutions can provide tools for SMEs and the not-for-profit sector, particularly because both these types of enterprises can provide significant cost savings for the burgeoning federal health budget and promote valuable social outcomes. With the government funding constraints that are in play at the moment, we need to think laterally about these issues. The future of these sectors depends on addressing the question I raised above.
2 3 7CON F E R E NC E VOLU M E | 2 015
PANEL DISCUSSION: WHAT IS THE FUTURE FOR SMALL BUSINESS?
2. Bruce JeffreysFor me, there are really two major changes that are shaping the future for small businesses. But I want to first detail the two businesses I am involved in and then link these businesses to the changes that I see.
I founded GoGet with Nic Lowe in 2003. It seemed like an easy idea: why not share unused cars rather than everyone owning a car? It was a classic small business: no capital; two people who did not really know what they were doing; and everything was built from the ground up. The only exception is that we were not based in a garage because we were in inner-city Sydney – all we had was a laundry. We started with three cars; we built a booking system; and then we put these cars online for people to become members and use them by the hour.
We had 12 customers initially. The cars were hardly used, which really underscores just how underutilised this very expensive fixed asset really is. It took us about three years to get to 20 to 30 cars, and then another couple of years to get to a couple of hundred. From there, it really took off. After 12 years, we now have 60 000 members and we are about to hit the 2 000 car mark.
It did not seem like what we were doing was that new because people had been sharing cars forever. But we formalised it, so it really was a whole new business model. As a result, we ran into a lot of barriers along the way. Financing was a problem; so were regulations and insurance. With everything we touched, we fell into a grey area. For instance, the then Road and Transit Authority did not know how to deal with us – they could not figure out if the cars were business or private. But we had extremely enthusiastic members who loved the service and who powered our growth through word of mouth.
The second business I am involved with is Dresden Optics, which I co-founded about a year ago. Dresden Optics is about challenging the manufacturing model for retail optics. The current optics industry – like many consumer goods industries – has an extremely long and complicated supply chain. We are launching a retail store with injection-moulding manufacturing instore. The idea is you can bring in plastics – like the lids of drink bottles – and mould them into glasses frames. It is about responsive manufacturing.
We are trying to reinvent the model for optometry with Dresden because the conventional optics industry delivery model is quite outmoded and extremely expensive. We want to break the model of having to make a booking and an appointment, and only doing so when you have a problem. We are offering free self-service eye testing that will then go – via the cloud – to ophthalmologists and optometrists. We want to screen the whole population and pick up things that are not currently an issue – including non-eye-related health issues like diabetes. This is possible because the costs for the equipment have fallen through the floor. The equipment that scans eyes used to cost $250 000; it now costs just $10 000. But the whole Medicare model is built on those old cost-of-equipment assumptions. What we are trying to do with Dresden really dovetails with what Michael was talking about with Silver Chain. We are using technology to change the way health services are delivered.
Those are the businesses I am involved in and where I have come from. I will turn now to what I think is changing in the small business sector and how that is going to shape the way future
2 3 8 R E SE RV E BA N K OF AUST R A L I A
PANEL DISCUSSION: WHAT IS THE FUTURE FOR SMALL BUSINESS?
small businesses may look. These changes are behind the success of GoGet and behind what we are trying to do with Dresden.
The first change is the internet and the fragmentation of the economy and systems. What we are doing with GoGet could not exist without the internet. We were fortunate with our timing when we started. The internet has allowed us to connect this decentralised micro-fleet of vehicles to everyone’s smart phone. You can pull up our website on your phone and have a car within walking distance that is ready to go, right now. It is an amazing convenience. With Dresden, the internet and this fragmentation have driven the commodification of manufacturing; small-scale manufacturing equipment is now really quite cheap to buy. We could not have the responsive-manufacturing model that we are building with Dresden without that. This fragmentation, driven by the internet, creates so many opportunities for small businesses to step into niches.
The other major factor is that values are changing – especially in younger people. When we started GoGet it was a bit of a ‘green’ thing to do; now it is just common sense. Environmental values are intrinsic now. There has been a big shift in values. With Dresden, what we are picking up on – and hopefully what will resonate with consumers – is that consumers feel cut out from the way that big businesses deliver products. Consumers feel very alienated. We are trying to tap into this grassroots movement that wants to know where products have been made, what’s in them and how they work. The small-scale manufacturing that we’re doing – in store – really taps into that shift in values.
And so I think small businesses have a huge opportunity now and into the future. Consumers want to feel connected to what they are buying; big businesses cannot provide that. With the internet and the fragmentation it creates, it is possible for small businesses to find their market, find their niche.
I will finish with what I think is the biggest barrier that small businesses in Australia face. It is extremely exciting starting businesses in Australia; it is incredible how easy it is to do. But the biggest barrier I face is my staff thinking of why they cannot do something. They have a very risk-averse mindset. Risk is viewed negatively; it is viewed as recklessness. But the advantage of small businesses is that they can take risks. The future of small businesses – and entrepreneurs in particular – depends on finding people who can move beyond just thinking about the risks to thinking about the benefits and only then thinking about what risks need to be taken.
3. Kate CarnellI thought I would start by going backwards for all the economists that are here today. Back in the 1770s, Scottish economist and philosopher Adam Smith was talking about division of labour and specialisation. What are we talking about here today? We are talking about specialisation – that small businesses in Australia can do smaller and smaller bits of a supply chain, do it really well and do it in a global free market. And before anyone in this room was born, Austrian-American economist Joseph Schumpeter was talking about creative destruction.
Maybe nothing is new in the universe.
I am from the Australian Chamber of Commerce and Industry (ACCI) and I bought my first small business – a pharmacy that I ran for 20 years – when I was 25. I have seen small business change

2 3 9CON F E R E NC E VOLU M E | 2 015
PANEL DISCUSSION: WHAT IS THE FUTURE FOR SMALL BUSINESS?
over the years, but the main issues have not. At ACCI, our members – and we represent more than 300 000 SMEs in Australia – tell us that their biggest issues are access to market, access to people and access to capital.
These same issues go all the way back to Smith and Schumpeter. What is exciting for the future of small business is how technology is changing the responses to these issues. Smith and Schumpeter did not have the internet.
Let’s talk about access to market. Technology has really changed how quickly businesses can take products to market and get take-up. It took 75 years for the telephone to get to half of the population; it took the smart phone less than 10. This increased pace means that businesses need to be more flexible, more nimble and more capable of changing quickly. This puts small businesses in a really good place.
In terms of the way small businesses are getting their products to market, there are three waves that describe how businesses look now and how they will look in the future.
The first wave is those businesses that are using technology as an add-on to their core business. Technology – the internet in particular – grows their market, but the underlying business has not changed. I will give you an example – although this one is partly second wave too – based on a dress shop called Birdsnest, a fashion retail outlet on the main street of Cooma. Birdsnest is a family-owned and operated business, and it was going broke. The family took the business online and they are now employing 100 staff. What they have done is personalise their service; Birdsnest helps you solve your fashion and style problems.
The second wave is businesses that are starting up with a tailored service, a service that is really about individuals. I will use a company called Shoes of Prey as an example. It is an Australian company that lets women design their own shoes. They can specify what heels they want, what colour and what add-ons – they design and order their own personalised shoes. And Shoes of Prey has a 365-day warranty where the shoes can be returned for a refund or sent back to be redesigned or fixed. It was winner of the Online Sales category in the 2014 Premier’s NSW Export Awards. It is a company that does not sell shoes; it works with customers to grow a product.
The third wave of businesses is very much about products and services we did not even know we needed and new solutions that no one had thought of. GoGet is a great example: I need to be able to travel, but now I need not have a car. Fifteen years ago, no one in Australia had thought of that.
So, in terms of access to market, there is a whole range of new and novel approaches.
Access to people is the next area that technology is changing. Once upon a time you would put an advertisement in the newspaper; that is not done very much now. After that, it all moved onto internet sites – you would put an advertisement on somewhere like Seek. Now you can go to somewhere like Freelancer, to use an Australian example. Freelancer’s approach is ‘if you’ve got a skill, we can get you a job’, not the other way around. With Freelancer, I can go online and find someone to do just about any job. A friend of mine’s Executive Assistant (EA) is in the Philippines – her EA is on the phone, on the internet, and she can manage her diary out of the Philippines just as well as anybody else. She is the only person I know who has an EA with a PhD. The internet is really expanding the capacity to find people for roles.
2 4 0 R E SE RV E BA N K OF AUST R A L I A
PANEL DISCUSSION: WHAT IS THE FUTURE FOR SMALL BUSINESS?
Another example is DesignCrowd. We used it recently for some graphic design work we needed done for a subsidiary company. We logged on to DesignCrowd, specified what we wanted and the price we were willing to pay; they asked a couple of questions and sent us back some ideas. After paying $250, we had a logo and some business cards. It turned out that the person who did the work for us was from a little town in Ohio.
Access to capital is the last area that I want to talk about. Our members tell us that their biggest problem is access to capital. Access to traditional finance is becoming harder and harder for young people – the people that are setting up innovative businesses and growing them – because so few young people own houses which they can use as security for a loan. Housing affordability is a real problem.
But the internet is changing access to capital for small businesses through crowdfunding and peer-to-peer lending. A great example of the success of crowdfunding is a product called Flow Hive. It is a new beehive design – developed by a father and son out of Tamworth – where you don’t have to pull apart the beehive to get the honey out. They needed $70 000 to take it to the next phase in order to manufacture their product. They went on to Indiegogo and, as of this morning, had raised over $6 million, a lot of which is from the United States. What you can do on that site is buy a beehive, or bits of a beehive, or just send money to support them. This is what the future of financing looks like for a lot of people. And you would be aware that the Federal Minister for Small Business – the Honourable Bruce Billson MP – has indicated that he is planning to launch a crowdfunding platform later this year, and he has been out consulting in the market.
I think the banks are starting to realise that the train has left the station with respect to crowdfunding. At ACCI, we have a line-up of banks asking what they can do for small business. They see that things have changed. But I think they still cannot get around their risk issues.
Research suggests that it might not be the age of the business that matters, but the digitalisation (Deloitte Access Economics 2013). It has found that the 16 per cent of small businesses that are highly digitalised are four times more likely to be employing. The internet and technology are changing all aspects of the economy, and that is a huge opportunity for small business. There are new and radically different answers to the issues that small businesses face – access to market, access to people and access to capital – because of the internet and technology.
The world has changed.
ReferenceDeloitte Access Economics (2013), ‘Connected Small Businesses: How Australian Small Businesses are
Growing in the Digital Economy’, Report prepared for Google Australia, April.
4. General DiscussionDiscussion focused on the public policy implications of the panellists’ remarks, particularly with respect to support and financing for small businesses.
A participant began the discussion by noting that all the panellists’ remarks had focused on the importance of the internet in connecting businesses with customers. In this light, the participant
2 4 1CON F E R E NC E VOLU M E | 2 015
PANEL DISCUSSION: WHAT IS THE FUTURE FOR SMALL BUSINESS?
asked the panellists’ views on the value of government-provided infrastructure – using the National Broadband Network (NBN) as an example – versus government subsidies such as the research and development tax credit.
Kate Carnell responded that small business subsidies tend not to work very well. ACCI’s members rarely say that what they need is more government support. Rather, they have problems with forms and red tape. As long as you have sensible policies – for example, sensible tax treatment of acquisitions and depreciation – what really matters is infrastructure: whether that be roads, ports or the internet. What matters for businesses is getting their product to market. If the infrastructure is not in place to do that, subsidies are no use. Michael Henderson stated the question was a bit like asking, ‘I have water and I have a glass, which would you prefer?’. Rather, the biggest value proposition is the entrepreneurial interaction with existing infrastructure – where someone looks entirely differently at something that everyone has access to. Professor Henderson opined that the more important question is how the government can inspire and capture the benefits of those innovations that lead to both national and international value.
Relatedly, a participant queried the panellists’ opinions on the importance of fibre-to-the-home or fibre-to-the-node for the NBN. The panellists agreed that it really depended on the application; most small businesses did not need the high speed provided by fibre-to-the-home. What was critical for small businesses was robust and reliable internet access. In addition, emerging new technologies – that were potentially more cost-effective – made it difficult to definitively state that one particular model was best.
Discussion turned to funding for small businesses. One participant noted that European regulators have been looking at crowdfunding platforms and have run into two competing considerations. On one hand, heterogeneity of regulation across the many regulatory regimes in Europe has meant that overseas platforms cannot operate in Europe and European platforms cannot even operate across all of Europe. On the other hand, regulators have to consider investor protection in the event of business failure. Balancing these two considerations is proving challenging. Ms Carnell noted that regulation of crowdfunding and peer-to-peer lending was likely to happen shortly in Australia. She stated that it would have to be a light-touch regime. Consumer and investor education about the risks is important, but overregulation will kill crowdfunding.
Continuing on the theme of crowdfunding, a participant noted that it is an adjunct to traditional bank funding, rather than an alternative (as it is often presented). Crowdfunding has a huge advantage because it can be used pre-production, before a firm has revenue. No bank can provide that sort of funding, because firms at that point cannot service the interest on a bank loan. The participant noted that the crowdfunding success stories – including the example discussed by the panellists – did not raise money to commercialise a product. Rather, they used crowdfunding to pre-book sales. The participant opined that there would be some interesting challenges emerging in the future around prepayment exposure – once a firm reaches its funding goal and charges everyone’s credit cards, the risk is back on the banks.
Another participant picked up on the same point and noted that the pre-sales model of crowdfunding solves a problem that banks cannot. Even if a bank is interested in a firm, the bank cannot know whether the firm’s products will succeed in the market. With the pre-sales model, lots of firms can put their products up on the sites unsuccessfully. However, unlike with a traditional

2 4 2 R E SE RV E BA N K OF AUST R A L I A
PANEL DISCUSSION: WHAT IS THE FUTURE FOR SMALL BUSINESS?
bank loan or equity investment, no one has committed to these unsuccessful firms and nobody loses any money. The participant opined that this was why pre-sales models have proven to be the most popular among crowdfunding platforms.
A participant stated that there was a disconnect in the regulatory dialogue about banks and small business lending. On one hand, the dialogue focuses on the importance of stable risk-averse banks, but on the other hand chides banks for not taking risks and lending to small businesses. Ms Carnell agreed that the Australian banks face difficulties in balancing the risks of small business lending. However, she noted that there was a problem going forward because so few young people – the people growing innovative businesses – own houses, which they could use as security for a loan. She noted that this was, by far, the biggest issue that ACCI hears from its members. A number of participants agreed, but noted that collateral is not the only factor that affects small business lending. Banks do lend to small businesses on an unsecured basis; however, the loans tend to be much smaller and more expensive.
Bruce Jeffreys noted that he had only been able to finance the cars used to start GoGet by using a house as collateral. On the topic of access to bank finance, he opined there was a dissonance between bank advertising and what small businesses experience. He stated that it would often be better for banks to always refuse to lend, so that small businesses could go and find alternative funding straightaway. Rather, it had been his experience that banks often took too long to say ‘no’ and spent too much time on time-consuming processes, such as interviews with branch managers. Small businesses are vulnerable because they are burning through their money; if it takes six months instead of a week to get refused a loan, it makes a big difference. In response, Professor Henderson partly disagreed. He stated that, in the areas and sectors that they operate in, the banks do a good job. However, he agreed that in other areas – particularly entrepreneurial SMEs – there was an opportunity to move those financing options that are seen as risky by regulators out of banks and into other processes for funding SMEs.
On the topic of the venture capital industry, a participant noted the puzzling finding that venture capital investments – at least in the United States – have been extraordinarily unprofitable. The participant cited a report by the Kauffman Foundation that showed that limited partners had consistently underperformed the market (Mulcahy, Weeks and Bradley 2012). The participant noted that this fact raised questions about crowdfunding and peer-to-peer lending. Mr Jeffreys agreed and stated that, in his view, the US venture capital model is very flawed. He noted that GoGet did not use venture capital funding; rather, it was grown by working for free and growing it organically. He stated that the venture capital model is flawed because it is a ‘star model’; it is built on the idea of the ‘crash-through’ entrepreneur who has a great idea. This model is at odds with reality; building a business is far less glamorous. The entrepreneur is on their own, dealing with the day-to-day tasks. However, too many young people automatically look to venture capital for funding. Mr Jeffreys noted that this was a concern because it set too many businesses up for failure unless they were a ‘superstar’. Professor Henderson agreed that the US venture capital model is very aggressive. However, he thought that the model was beginning to shrink back in Australia and was being replaced by a more relationship-based model, which was proving to be more manageable and a more effective model for SMEs.
2 4 3CON F E R E NC E VOLU M E | 2 015
PANEL DISCUSSION: WHAT IS THE FUTURE FOR SMALL BUSINESS?
The final comments for the discussion focused on the role of innovation. A participant noted that a paper earlier in the conference had shown that most firm-level innovations are firms using ideas obtained from other firms, rather than truly new innovations (Palangkaraya, Spurling and Webster this volume). By contrast, the panellists’ examples were mostly new innovations, which suggests that those types of innovations were the most important from a social perspective. However, firms cannot necessarily capture all the benefit of those types of innovations because other firms take the ideas, and in many cases those ideas won’t be patentable. The participant wondered whether enough was done to promote these types of innovations. Professor Henderson agreed that it was critical that there was support in place, whether at the federal, state or industry body level. He noted that Silver Chain Group illustrates how important SMEs can be in developing valuable intellectual property; the technology that Silver Chain Group has developed and patented is being considered for sale to a major telecommunications company. Ensuring there is support for SMEs is particularly important, because many do not have the luxury of being able to secure their intellectual property.
ReferenceMulcahy D, B Weeks and HS Bradley (2012), ‘”We Have Met the Enemy … and He is Us”: Lessons from
Twenty Years of the Kauffman Foundation’s Investments in Venture Capital Funds and the Triumph of Hope
over Experience’, Report, Ewing Marion Kauffman Foundation, May.

2 4 4 R E SE RV E BA N K OF AUST R A L I A
2 4 5CON F E R E NC E VOLU M E | 2 015
Biographies of Contributors
Bill AllenBill Allen is Regional Director for NSW at the Australian Bureau of Statistics (ABS) and Branch Head of Macroeconomic Indicators, which produces statistics on building and construction, retail and finance activity, mineral and petroleum exploration, capital expenditure and company profits, inventories, sales and labour costs. He also leads the ABS response to the Australian Government’s deregulation agenda. Until recently, he headed the Environmental Statistics and Integration Branch, which included producing environmental accounts for Australia, maintaining a list of all businesses in Australia, business demography and the use of taxation data in the ABS. He also has experience in market research for the public sector, having headed the Canberra office for ACNielsen. He holds an honours degree in statistics from the University of Melbourne.
Dan AndrewsDan Andrews is a Senior Economist in the Structural Policy Analysis Division of the Economics Department at the Organisation for Economic Co-operation and Development. In this role, he undertakes cross-country research into the impact of structural policies on productivity performance, with a special focus on resource misallocation and innovation. Prior to this, he worked in the Economic Group of the Reserve Bank of Australia for the best part of a decade. He holds a Bachelor of Arts and a Bachelor of Economics (First Class Honours) from the University of Queensland and a Master of Public Administration from the John F Kennedy School of Government, Harvard University.
Mark BryantMark Bryant is a Senior Research Economist at the Productivity Commission and is currently part of an inquiry team examining barriers to business start-ups and exits in Australia. Since joining the Commission in 2010, he has worked on a range of government-commissioned projects including into Australia’s childcare and aged care systems, the performance of the resource exploration industry, and several projects focused on addressing regulatory burdens faced by small businesses. He holds degrees in Economics (Hons) and Business from the University of Newcastle.
Kate CarnellKate Carnell is Chief Executive Officer (CEO) of the Australian Chamber of Commerce and Industry. She is well known and respected in the not-for-profit and business communities having served two years as CEO of beyondblue and four years as CEO of the Australian Food and Grocery Council. She also served as Chief Minister of the Australian Capital Territory from 1995 to 2000, becoming the first Liberal woman to be elected as Chief Minister or Premier in Australian political history.
2 4 6 R E SE RV E BA N K OF AUST R A L I A
BIOGR A PH I E S OF CON T R I BU TOR S
Having started her professional life as a pharmacist, she owned and managed pharmacies for some 20 years, was the inaugural chair of the ACT Branch of the Pharmacy Guild of Australia and went on to become National Vice President of the Pharmacy Guild of Australia. In 2006 she was appointed an Officer of the Order of Australia for her services to the community through contributions to economic development and support for the business sector, knowledge industries, the medical sector and medical technology advances.
Ellis ConnollyEllis Connolly is Deputy Head of the Domestic Markets Department at the Reserve Bank of Australia. He has previously served in various roles in the Reserve Bank’s Economic Analysis and Research Departments. Mr Connolly has written on a range of issues, including the determinants of productivity growth, the mining sector in Australia, the impact of superannuation on household saving and the effect of monetary policy transparency on financial markets. He holds a Bachelor of Economics (Hons) from the University of New South Wales, a Bachelor of Laws (Hons) from the University of Technology, Sydney, and a Master in Public Administration from Harvard University.
Chiara CriscuoloChiara Criscuolo is a Senior Economist in the Structural Policy Division of the Directorate for Science, Technology and Innovation at the Organisation for Economic Co-operation and Development (OECD), where she works on entrepreneurship, enterprise dynamics, productivity and policy evaluation. She is also a Research Associate at the Centre for Economic Performance (CEP) at the London School of Economics, and is currently coordinating large cross-country micro data projects on employment dynamics and on productivity. Prior to joining the OECD, she was a Research Fellow at the CEP. She has published in The American Economic Review, The Review of Economics and Statistics, the Journal of International Economics, the International Journal of Industrial Organization and the Canadian Journal of Economics. Dr Criscuolo holds an MSc in Economics (cum laude) and a PhD in Economics from University College London.
Mark CullyMark Cully is Chief Economist at the Department of Industry and Science. He has had a varied career in applied economic research at the intersection of government and academia. From 1992 to 1995 he was a British Council Commonwealth Scholar at the University of Warwick while working at the Warwick Business School. In 1995 he was appointed head of research on employment relations for the UK Government, where he ran what was the world’s largest survey of working life. He returned to Australia in 1999 to join the National Institute of Labour Studies as Deputy Director and was then General Manager at the National Centre for Vocational Education Research for six years, running its statistical then research operations. In 2009 he was appointed Chief Economist at the Department of Immigration and Citizenship, and in that role chaired the Organisation for Economic Co-operation and Development’s Working Party on Migration. He is a member of the CEDA Council on Economic Policy. He has a first class honours degree in Economics from the University of Adelaide and a Master of Arts in Industrial Relations from the University of Warwick.

2 4 7CON F E R E NC E VOLU M E | 2 015
BIOGR A PH I E S OF CON T R I BU TORS
Annalisa FerrandoAnnalisa Ferrando is Principal Economist in the Capital Markets and Financial Structure Division of the European Central Bank (ECB). Previously she worked in the Research Department at the Bank of Italy and the Directorate-General for Enterprise and Industry at the European Commission. Her current research interests lie in corporate finance, firms’ financial decisions and financing constraints. In these fields she has published numerous journal articles and working papers. More recently she has been closely monitoring the financial situation of small and medium-sized enterprises in the euro area and she is member of the ECB task force on Europe’s Capital Markets Union. She has a degree in Economics from the Università Ca’ Foscari, Venezia, a postgraduate diploma in Energy Economics and Management from the Scuola Superiore E Mattei, Milano, and an MPhil in Economics from Oxford University.
Geoff FrancisGeoff Francis is a Principal Adviser for the National Competition Policy Review. He has previously worked as a General Manager of the Competition and Consumer Policy Division in the Australian Treasury and at the International Monetary Fund. His work has covered areas such as taxation, international finance, industry, environmental and agricultural policy issues. He holds a Bachelor of Engineering (Civil) from the Royal Melbourne Institute of Technology and a Master’s Degree in Economics from Monash University.
Peter GalPeter Gal is an Economist in the Economics Department of the Organisation for Economic Co-operation and Development (OECD). He has worked on issues related to labour markets and productivity, both from micro and macro perspectives. He has also worked in the Directorate for Science, Technology and Industry as well as in the Directorate for Employment, Labour and Social Affairs. In the past, he was an Economist at the Economics Department of the central bank of Hungary, working on monetary policy and investment-related topics. He holds an MSc in Economics from the Corvinus University of Budapest and an MPhil in Economics from the Tinbergen Institute Amsterdam. He is also a PhD candidate at the Tinbergen Institute.
Roy GreenRoy Green is Dean of the UTS Business School at the University of Technology Sydney. He has worked in universities, business and government in Australia and overseas, published widely in the areas of innovation policy and management, and undertaken multi-country projects with the Organisation for Economic Co-operation and Development and European Commission. Professor Green has served as chair of the Australian Government’s Innovative Regions Centre, the Commonwealth Scientific and Industrial Research Organisation’s Manufacturing Sector Advisory Council and the NSW Manufacturing Council, and participated in the Prime Minister’s Taskforce on Manufacturing and Australian Bureau of Statistics Innovation Reference Group. He conducted the government’s review of the textile, clothing and footwear industries, led Australian participation in a global study of management and productivity, coordinated an Australian Business Deans Council initiative on the future of management education and has co-authored recent publications on

2 4 8 R E SE RV E BA N K OF AUST R A L I A
BIOGR A PH I E S OF CON T R I BU TOR S
productivity, skills and innovation. He graduated with first class honours from the University of Adelaide and has a PhD in Economics from the University of Cambridge.
Dhruba GuptaDhruba Gupta is the founder and Managing Director of DBM Consultants, one of Australia’s top 10 market research organisations. He has advised senior leaders of major corporations and government departments in Australia and the Asia Pacific region. He developed Australia’s largest business financial research program, used by all major banks and a number of government organisations and industry associations. He is an elected Fellow of the Australian Market & Social Research Society and is on the board of examiners for the accreditation of Australia’s Qualified Practising Market Researchers. He holds an MCom in Market Research from the University of Western Australia.
David HargreavesDavid Hargreaves is a macroeconomist and Manager of Macro-financial Policy at the Reserve Bank of New Zealand. In recent years he has worked with colleagues on macroprudential policy and stress testing of the banking system, as well as financial stability surveillance more generally. He holds a Bachelor of Economics (Hons) from Victoria University and an MSc in Economics (with distinction) from the London School of Economics.
Michael HendersonMichael Henderson is a rare combination of successful entrepreneur, philanthropist and humanist. Professor Henderson is Executive Chairman of Sandover Pinder, a successful architectural firm based in Perth with an impressive track record of major national and international projects. In 2010 he founded the not-for-profit International Skills and Training Institute in Health, which has developed significant training facilities in countries including Indonesia, Myanmar and Nepal. The training centres have had transformative impact on the communities they serve.
Throughout his career, Professor Henderson has made significant contributions to his field. He is a strong promoter of health care, education and research at an international level and has played an integral role in assisting Australian universities to establish ties with south-east Asian and global universities in the areas of health, law, agriculture, engineering, skills and training. Professor Henderson’s appointments include: Founder and Chairman of MEDSCI International Healthcare (a not-for-profit healthcare advisory service); Adjunct Professor in the Faculty of Medicine, Dentistry and Health Sciences at The University of Western Australia; Vice Chairman of Commonwealth Scientific and Industrial Research Organisation’s (CSIRO) Digital Productivity and Services Flagship National Advisory Committee; and he is a past Chairman of the Technology and Industry Advisory Council.
Professor Henderson is a highly respected member of both the business and academic community. In 2011, he was recognised with the prestigious Ernst & Young ‘Social Entrepreneur of the Year’ Award. He has made significant contributions within the National Innovation System working closely with university groups, in particular The University of Western Australia, engaging and

2 4 9CON F E R E NC E VOLU M E | 2 015
BIOGR A PH I E S OF CON T R I BU TORS
connecting widely within CSIRO, and taking an active role with the Committee for Economic Development of Australia.
Scott HolmesScott Holmes is Deputy Vice-Chancellor (Research and Development) at the University of Western Sydney. He is also an Honorary Professor at the University of Queensland and a Life Member of the Small Enterprise Association of Australia and New Zealand, reflecting almost three decades of research and support for the small business sector. Professor Holmes is an internationally recognised researcher in business management and health economics. His economic and business background is extensive, having published six books and over 60 refereed articles. In 2006 he received the Business/Higher Education Round Table (BHERT) Award for Best Entrepreneurial Educator of the Year and in 2012 he received an Excellence in Innovation Award from the University of Newcastle. He holds a Bachelor of Commerce from the University of Newcastle and a PhD in Economics and Commerce from the Australian National University.
Bruce JeffreysBruce Jeffreys is Co-founder of GoGet CarShare, Australia’s first and now largest professional car sharing service. In the 1990s, Bruce partnered with the Australian Government and Singapore Airlines to organise the first Australian film festival to be held in Turkey. After returning to Perth, he coordinated Australia’s first university-to-school peer tutoring program, STAR, which was partly funded by BP Australia. After moving to Sydney, he was a founding member of the Interactive Division at the advertising agency Singelton Ogilvy & Mather, and then joined the newly formed Sustainability Unit within the NSW Department of Planning. In 2014, Bruce co-founded Dresden, a German-Australian partnership that, for the first time, manufactures high-quality eyewear on demand and in-store. Bruce also drives part-time for Sydney Buses on various routes operated out of the Leichhardt Depot.
Gianni La CavaGianni La Cava is a Senior Research Manager in the Economic Research Department at the Reserve Bank of Australia. He is currently the head of a team of economists that undertakes macroeconomic policy-relevant research using microeconomic data. His research is typically devoted to exploring the links between financial markets and the real economy, with a particular focus on housing markets and financial stability. Dr La Cava holds Arts and Commerce degrees from the University of Sydney and a PhD from the London School of Economics.
Carlo MenonCarlo Menon is an Economist in the Structural Policy Division of the Directorate for Science, Technology and Innovation of the Organisation for Economic Co-operation and Development. In this capacity, he contributes to evidence-based policy analysis on enterprise dynamics, allocative efficiency and innovation. He has previously worked as a Research Economist at the Bank of Italy, where he authored a number of reports and research papers in the fields of policy evaluation, urban and regional economics, and industrial policy. He is also an affiliate with the Spatial

2 5 0 R E SE RV E BA N K OF AUST R A L I A
BIOGR A PH I E S OF CON T R I BU TOR S
Economics Research Centre at the London School of Economics. His research has been published in recognised academic journals, including the Journal of Economic Geography, The World Bank Economic Review and the Journal of Banking & Finance, and the findings from his work have often captured the attention of leading Italian and international media. Dr Menon holds a BSc (Econ) and an MRes from the University of Venice and a PhD from the London School of Economics.
Angus MooreAngus Moore is a Research Economist in the Economic Research Department at the Reserve Bank of Australia. Prior to this, he was an analyst in the Payments Policy Department. He holds a Bachelor of Economics (Hons) with the University Medal and a Bachelor of Laws from the University of Adelaide.
Warren MundyWarren Mundy is a Commissioner of the Productivity Commission and was recently appointed the Commissioner responsible for the Australian Government Competitive Neutrality Complaints Office. Since his initial appointment to the Productivity Commission as an Associate Commissioner in 2009, he has worked on a range of studies and inquiries, including being the Presiding Commissioner on studies into the role of local government as regulator and regulator engagement with small business, as well as its inquiry into access to civil justice. He is currently the Presiding Commissioner on the inquiry into business setups, transfers and closures. Dr Mundy is a Fellow of the Royal Aeronautical Society and the Australian Institute of Company Directors. He is also an Adjunct Professor in the School of Aviation at the University of New South Wales and a member of the University’s Aviation Industry Advisory Committee. Since February 2014, he has been a director of the Sydney Desalination Plant and also provides advice to a number of Australian airports on pricing, regulatory and environmental issues. Previously he served on the Board of Airservices Australia, was a member of the joint NSW and Commonwealth Government Steering Group overseeing the development of the Aviation Strategic Plan for the Sydney Region and has been a Director of VicForests, the Airport Operators Association of the United Kingdom and James Watt College of Higher and Further Education in Scotland. He has also worked as an executive in airport companies in Australia and Europe, and has worked for McKinsey & Company, the Western Australian Treasury Corporation and the Reserve Bank of Australia. Dr Mundy holds an honours degree in statistics from the University of New South Wales, a Master of Environmental Law (Hons) from Australian National University and a PhD in Economics from Kings College Cambridge where he was a British Council Commonwealth Scholar.
Sam NichollsSam Nicholls is an Economist at the Reserve Bank of Australia. He is currently part of the Bank’s business liaison team, which meets regularly with businesses and associations across a range of sectors. Prior to this, he worked as an analyst in the Bank’s Financial Stability Department. He holds a Bachelor of Economics (Hons) with the University Medal from the University of Tasmania.
2 5 1CON F E R E NC E VOLU M E | 2 015
BIOGR A PH I E S OF CON T R I BU TORS
Lars NordenLars Norden is Professor of Banking and Finance at the Getulio Vargas Foundation, Brazilian School of Public and Business Administration (FGV EBAPE) in Rio de Janeiro. Before joining FGV EBAPE he was Professor at the Rotterdam School of Management (RSM), Erasmus University, from 2009 to 2015. He is a Fellow at the European Banking Center and has been a Visiting Fellow at FGV EBAPE, Indiana University and the Research Centre of the Deutsche Bundesbank. His research interests include financial intermediation, empirical banking, corporate finance and credit risk. His work has been published in the leading academic journals in the field including The Review of Financial Studies, Management Science, the Journal of Financial and Quantitative Analysis, the Review of Finance and the Journal of Banking & Finance. He is a regular presenter at top conferences including the American Economic Association, American Finance Association, Western Finance Association, European Finance Association and the Financial Intermediation Research Society. Professor Norden holds graduate degrees from the University of Mannheim and ESSEC Business School in France and a doctoral degree in business administration from the University of Mannheim.
David OrsmondDavid Orsmond is the Deputy Head (Domestic) of the Financial Stability Department at the Reserve Bank of Australia. Until recently, he headed up the Bank’s Regional and Industry Analysis Section located within the Bank’s Economic Group. Prior to his appointment at the Bank, Dr Orsmond worked at the International Monetary Fund (IMF). During 1999–2001, he was appointed as the IMF Resident Representative to Ukraine, based in Kiev, to help oversee their reform program. He has written on a range of issues, including global imbalances, the mining sector in Australia, and labour markets. Dr Orsmond holds a PhD from Duke University and degrees from the University of Sydney and the Kiel Institute of World Economics in Germany.
Alfons PalangkarayaAlfons Palangkaraya is an Associate Professor at the Centre for Transformative Innovation at Swinburne University of Technology. His current research focuses on applied microeconometric studies of innovation, intellectual property rights, globalisation and firm performance. He is one of the foremost experts on Australian intellectual property and firm-level datasets. He has provided research consulting services to institutions such as the Department of Industry and Science, the Association of Southeast Asian Nations (ASEAN) Secretariat and the Economic Research Institute for ASEAN and East Asia on topics such as innovation, patterns of international trade, and globalisation and regional integration. His academic research has appeared in The RAND Journal of Economics, The Review of Economics and Statistics, The World Economy, and many other journals. Dr Palangkaraya holds a BS in Statistics from the University of Missouri, an MA in Economics from Pennsylvania State University and a PhD in Economics from Oregon State University.
2 5 2 R E SE RV E BA N K OF AUST R A L I A
BIOGR A PH I E S OF CON T R I BU TOR S
Matthew ReadMatthew Read is an Economist in the Economic Research Department at the Reserve Bank of Australia. Prior to this, he was an analyst in the Financial Stability Department. He holds a BSc/BCom (Hons) with the University Medal from the University of Sydney.
John SimonJohn Simon is Head of Economic Research Department at the Reserve Bank of Australia. Prior to this he undertook a three-year secondment to the International Monetary Fund, where he worked on the World Economic Outlook. He was previously the Chief Manager in the Payments Policy Department of the Bank. He has published numerous articles on macroeconomics, including on the ‘Great Moderation’, monetary policy and payments policy. Dr Simon holds a Bachelor of Economics (Hons) and a Bachelor of Science from the Australian National University and a PhD from the Massachusetts Institute of Technology.
Thomas SpurlingThomas Spurling is Professor of Innovation Studies in the Centre for Transformative Innovation at Swinburne University of Technology. He is a physical chemist by training who in recent years has written extensively about innovation policy and the history of Australian science and innovation. His recent work includes a book on the development of Australia’s polymer banknotes – The Plastic Banknote (with David Solomon) – and a paper ‘The Science and Industry Endowment Fund: Supporting the Development of Australian Science’ (with Susan Smith). He is a member of the Commonwealth Scientific and Industrial Research Organisation’s Board and is Chairman of the Board of Advanced Molecular Technologies – a small to medium-sized enterprise that manufactures high-value specialty chemicals.
Gregory F UdellGregory F Udell is the Chase Chair of Banking and Finance at the Kelley School of Business, Indiana University. He is, or has been, a visiting economist, visiting scholar and/or consultant to the Board of Governors of the Federal Reserve System, the Bank of Japan, the Bank of Italy, the European Central Bank, the Federal Reserve Banks of Chicago and San Francisco, the International Finance Corporation, the Organisation for Economic Co-operation and Development, the People’s Bank of China, the Sveriges Riksbank and the World Bank. Before joining the Kelley School of Business in 1998 he was Professor of Finance and Director of the William R Berkley Center for Entrepreneurial Studies at the Stern School of Business at New York University. Prior to his academic career, Professor Udell was a commercial loan officer in Chicago. In addition to publishing in leading economics and finance journals, he is the author of a textbook on asset-based lending, Asset-Based Finance. He holds a BA in Economics from DePauw University, Indiana, an MA in Economics from Northern Illinois University, and an MBA and PhD in Finance from Indiana University.
2 5 3CON F E R E NC E VOLU M E | 2 015
BIOGR A PH I E S OF CON T R I BU TORS
Stefan van KampenStefan van Kampen is a lecturer and PhD candidate at the Rotterdam School of Management (RSM), Erasmus University. His research focuses on empirical corporate finance, and he has published in the Journal of Banking & Finance. In addition, he is responsible for the master thesis supervision of approximately 40 RSM students per year. He holds a Bachelor of Science in Business Administration and a Master of Science in Finance and Investments from Erasmus University, Rotterdam.
Beth WebsterBeth Webster is the Director of the Centre for Transformative Innovation at Swinburne University of Technology. She is also an Honorary Professorial Fellow, Melbourne Institute of Applied Economic and Social Research at the University of Melbourne. She has authored over 100 articles on the economics of innovation and firm performance and has been published in The RAND Journal of Economics, The Review of Economics and Statistics, Oxford Economic Papers, The Journal of Law & Economics and the Cambridge Journal of Economics. She has been appointed to a number of committees including the Lomax-Smith Base Funding Review, CEDA Council on Economic Policy and the Advisory Council on Intellectual Property. She is also a Board Member of the European Policy for Intellectual Property, and founding President and Board Member of the Asia Pacific Innovation Network. Professor Webster holds a BEc (Hons) and a MEc from Monash University and a PhD in Economics from the University of Cambridge.

2 5 4 R E SE RV E BA N K OF AUST R A L I A

2 5 5CON F E R E NC E VOLU M E | 2 015
List of Conference Participants
Bill Allen Australian Bureau of Statistics
Chris Aylmer Reserve Bank of Australia
Sasan Bakhtiari Department of Industry and Science
Mark Bryant Productivity Commission
Sean Carmody Westpac Banking Corporation
Kate Carnell Australian Chamber of Commerce and Industry
Jon Cheshire Reserve Bank of Australia
Ellis Connolly Reserve Bank of Australia
Chiara Criscuolo Organisation for Economic Co-operation and Development
Mark Cully Department of Industry and Science
Per Davidsson Queensland University of Technology
Guy Debelle Reserve Bank of Australia
Malcolm Edey Reserve Bank of Australia
Annalisa Ferrando European Central Bank
Geoff Firth Rabobank
Geoff Francis The Australian Treasury
Kate Gibson Australia and New Zealand Banking Group
Roy Green University of Technology, Sydney
Dhruba Gupta DBM Consultants
David Hargreaves Reserve Bank of New Zealand
Alexandra Heath Reserve Bank of Australia
Michael Henderson MEDSCI International Healthcare
Scott Holmes University of Western Sydney
Glenn Homan Australian Prudential Regulation Authority
Toni Howard National Australia Bank
Bruce Jeffreys GoGet CarShare
Adrian Kemp National Australia Bank
2 5 6 R E SE RV E BA N K OF AUST R A L I A
L IST OF CON F E R E NC E PA RT IC I PA N TS
Christopher Kent Reserve Bank of Australia
Gianni La Cava Reserve Bank of Australia
Angus Moore Reserve Bank of Australia
Warren Mundy Productivity Commission
Sam Nicholls Reserve Bank of Australia
Lars Norden Getulio Vargas Foundation, Brazilian School of Public and Business Administration
David Orsmond Reserve Bank of Australia
Matthew Read Reserve Bank of Australia
Michael Schaper Australian Competition and Consumer Commission
John Scilly Cobalt Linkages
John Simon Reserve Bank of Australia
Gregory Udell Indiana University, Kelley School of Business
Beth Webster Swinburne University of Technology
AcknowledgementThe editors are grateful to Wendy Baker, Paula Drew, John Fear, Alexandra Heath, Phillipa Kelly, Sue Morris, Tamara Mulroney, Lydia Papandrea, Rachel Williams and the staff of Economic Research and Information Departments for much help in organising the Conference and producing this volume.
2 5 7CON F E R E NC E VOLU M E | 2 015
Other Volumes in this Series
2014 Financial Flows and Infrastructure Financing
2013 Liquidity and Funding Markets
2012 Property Markets and Financial Stability
2011 The Australian Economy in the 2000s
2010 Reserve Bank of Australia 50th Anniversary Symposium
2009 Inflation in an Era of Relative Price Shocks
2008 Lessons from the Financial Turmoil of 2007 and 2008
2007 The Structure and Resilience of the Financial System
2006 Demography and Financial Markets
2005 The Changing Nature of the Business Cycle
2004 The Future of Inflation Targeting
2003 Asset Prices and Monetary Policy
2002 Globalisation, Living Standards and Inequality
2001 Future Directions for Monetary Policies in East Asia
2000 The Australian Economy in the 1990s
1999 Capital Flows and the International Financial System
1998 Unemployment and the Australian Labour Market
1997 Monetary Policy and Inflation Targeting
1996 The Future of the Financial System
1995 Productivity and Growth
1994 International Integration of the Australian Economy
1993 The Exchange Rate, International Trade and the Balance of Payments
1992 Inflation, Disinflation and Monetary Policy
1991 The Deregulation of Financial Intermediaries
1990 The Australian Macro-Economy in the 1980s
1989 Studies in Money and Credit

2 5 8 R E SE RV E BA N K OF AUST R A L I A
2 5 9CON F E R E NC E VOLU M E | 2 015
Copyright and Disclaimer Notices
APM DisclaimerThe Australian property price data used in the paper ‘Housing Prices and Entrepreneurship: Evidence for the Housing Collateral Channel in Australia’ in this Conference Volume are sourced from Australian Property Monitors Pty Limited ACN 061 438 006 of level 5, 1 Darling Island Road Pyrmont NSW 2009 (P: 1 800 817 616).
In providing these data, Australian Property Monitors relies upon information supplied by a number of external sources (including the governmental authorities referred to below). These data are supplied on the basis that while Australian Property Monitors believes all the information provided will be correct at the time of publication, it does not warrant its accuracy or completeness and to the full extent allowed by law excludes liability in contract, tort or otherwise, for any loss or damage sustained by you, or by any other person or body corporate arising from or in connection with the supply or use of the whole or any part of the information in this publication through any cause whatsoever and limits any liability it may have to the amount paid to the Publisher for the supply of such information.
New South Wales Land and Property Information
Contains property sales information provided under licence from the Department of Finance, Services and Innovation, Land and Property Information.
State of Victoria
The State of Victoria owns the copyright in the Property Sales Data and reproduction of that data in any way without the consent of the State of Victoria will constitute a breach of the Copyright Act 1968 (Cth). The State of Victoria does not warrant the accuracy or completeness of the Property Sales Data and any person using or relying upon such information does so on the basis that the State of Victoria accepts no responsibility or liability whatsoever for any errors, faults, defects or omissions in the information supplied.
State of Queensland
© State of Queensland (Department of Natural Resources and Mines) 2012. In consideration of the State permitting use of this data you acknowledge and agree that the State gives no warranty in relation to the data (including accuracy, reliability, completeness, currency or suitability) and accepts no liability (including without limitation, liability in negligence) for any loss, damage or costs (including consequential damage) relating to any use of the data. Data must not be used for direct marketing or be used in breach of the privacy laws.

2 6 0 R E SE RV E BA N K OF AUST R A L I A
COPY R IGH T A N D DISC L A I M E R NOT IC E S
HILDAThe following Disclaimer applies to data obtained from the HILDA Survey and reported in the paper ‘Housing Prices and Entrepreneurship: Evidence for the Housing Collateral Channel in Australia’ in this Conference Volume.
Disclaimer
The Household, Income and Labour Dynamics in Australia (HILDA) Survey was initiated and is funded by the Australian Government Department of Social Services (DSS), and is managed by the Melbourne Institute of Applied Economic and Social Research (Melbourne Institute). The findings and views based on these data should not be attributed to either DSS or the Melbourne Institute.

2 5 9CON F E R E NC E VOLU M E | 2 015


