Slippage and viscosity predictions in carbon micropores and their
13
Slippage and viscosity predictions in carbon micropores and their influence on CO2 and CH4 transport Mahnaz Firouzi and Jennifer Wilcox Citation: J. Chem. Phys. 138, 064705 (2013); doi: 10.1063/1.4790658 View online: http://dx.doi.org/10.1063/1.4790658 View Table of Contents: http://jcp.aip.org/resource/1/JCPSA6/v138/i6 Published by the American Institute of Physics. Additional information on J. Chem. Phys. Journal Homepage: http://jcp.aip.org/ Journal Information: http://jcp.aip.org/about/about_the_journal Top downloads: http://jcp.aip.org/features/most_downloaded Information for Authors: http://jcp.aip.org/authors Downloaded 22 Apr 2013 to 171.67.34.205. This article is copyrighted as indicated in the abstract. Reuse of AIP content is subject to the terms at: http://jcp.aip.org/about/rights_and_permissions
Transcript of Slippage and viscosity predictions in carbon micropores and their

Slippage and viscosity predictions in carbon micropores and their influenceon CO2 and CH4 transportMahnaz Firouzi and Jennifer Wilcox Citation: J. Chem. Phys. 138, 064705 (2013); doi: 10.1063/1.4790658 View online: http://dx.doi.org/10.1063/1.4790658 View Table of Contents: http://jcp.aip.org/resource/1/JCPSA6/v138/i6 Published by the American Institute of Physics. Additional information on J. Chem. Phys.Journal Homepage: http://jcp.aip.org/ Journal Information: http://jcp.aip.org/about/about_the_journal Top downloads: http://jcp.aip.org/features/most_downloaded Information for Authors: http://jcp.aip.org/authors
Downloaded 22 Apr 2013 to 171.67.34.205. This article is copyrighted as indicated in the abstract. Reuse of AIP content is subject to the terms at: http://jcp.aip.org/about/rights_and_permissions

THE JOURNAL OF CHEMICAL PHYSICS 138, 064705 (2013)
Slippage and viscosity predictions in carbon microporesand their influence on CO2 and CH4 transport
Mahnaz Firouzi and Jennifer Wilcoxa)
Department of Energy Resources Engineering, Stanford University, Stanford, California 94305-2220, USA
(Received 21 November 2012; accepted 16 January 2013; published online 14 February 2013)
Non-equilibrium molecular dynamics simulations of pure carbon dioxide and methane and theirequimolar mixtures have been carried out with an external driving force imposed on carbon slitpores to investigate gas slippage and Klinkenberg effects. Simulations were conducted to determinethe effect of pore size and exposure to an external potential on the velocity profile and slip-stickboundary conditions. The simulations indicate that molecule-wall collisions influence the velocityprofile, which deviates significantly from the Navier-Stokes hydrodynamic prediction for micro-and mesopores. Also, the shape of the velocity profile is found to be independent of the appliedpressure gradient in micropores. The results indicate that the velocity profile is uniform for pore sizesless than 2 nm (micropores) where the transport is mainly due to molecular streaming or Knudsendiffusion and, to a lesser extent, molecular diffusion. As pore sizes increase to 10 nm, parabolicprofiles are observed due to the reduced interaction of gas molecules with the pore walls. A 3D porenetwork, representative of porous carbon-based materials, has been generated atomistically using theVoronoi tessellation method. Simulations have been carried out to determine the effect of the porestructure and modeled viscosity on permeability and Klinkenberg parameters. The use of the bulk-phase viscosity for estimating the permeability of CO2 in units of Darcy in a 3D micropore networkis not an appropriate assumption as it significantly underestimates the CO2 permeability. On the otherhand, since the transport properties of CH4 are less influenced by the pore walls compared with CO2,the use of the bulk-phase CH4 viscosity estimates are a reasonable assumption. © 2013 AmericanInstitute of Physics. [http://dx.doi.org/10.1063/1.4790658]
I. INTRODUCTION
Transport and separation of carbon dioxide (CO2) in mi-croporous carbon-based materials is a problem of industrialimportance, particularly for the mitigation of greenhouse gasemissions, which is currently of fundamental and practical in-terest. Carbon capture and storage (CCS) has the capacity topotentially mitigate gigatons of CO2 emissions. Among thevarious geologic formations investigated, some of which in-clude deep saline aquifers, depleted oil/gas reservoirs, andunmineable coalbeds, each has different storage capacities.1
Depleted oil and gas reservoirs are estimated to have a stor-age capacity of 675–900 GtCO2, with deep saline formationshaving a potential storage capacity of at least 1000 GtCO2.2
Although the capacities of unmineable coal seams are signif-icantly lower (i.e., 3 GtCO2 up to 200 GtCO2)2 than salineaquifers and depleted oil and gas reservoirs, they are particu-larly useful for enhanced coal-bed methane recovery (ECBM)applications. Another advantage of storing CO2 in coalbeds isthat they are often close in proximity to electricity genera-tion sources.3, 4 However, obstacles including technical matu-rity and cost, as well as public perception, regulatory aspectsand environmental issues have thus far hindered wide-scaledeployment of this strategy.2
It is important to understand the transport properties ofCO2 and its interaction with its local surroundings on the
a)Author to whom correspondence should be addressed. Electronic mail:[email protected].
molecular-scale to design efficient and reliable strategies forcarbon storage at full-scale. Fundamental understanding ofthe microstructure of coal and gas shale and their influenceon the transmissibility of methane is of great importance inthe recovery of this valuable resource.5 To understand themolecular processes relevant to storage of CO2 in unmine-able coal seams or gas shale with enhanced methane recov-ery, gas transport phenomena in the matrix require furtherinvestigation.
Although theories of gas transport in porous media havebeen used and applied for many years, specific complexi-ties such as material and pore size heterogeneities make eachproblem and case unique. Some examples include, but arenot limited to gas transport through tight sands, coal-bedmethane, and unconventional shale gas reservoirs, in whichmore reliable and precise modeling are required.6–8 Each ofthese example systems is composed of a network of verysmall pores, which are partially responsible for uncertaintiesin permeability and flux estimates based upon Navier-Stokesapproaches.
Classical Navier-Stokes hydrodynamics is known to de-scribe the macroscopic flow of simple fluids.9 Flow throughtypical porous media composed of large pores (i.e., on theorder of microns) such as sandstones of depleted oil andgas reservoirs may be modeled using Darcy’s law derivedfrom the Navier-Stokes equation by using a formal averag-ing procedure,10, 11 in which the continuum flow assumptionis valid. However, when temperature and density vary appre-ciably on a scale comparable to the molecular mean free path,
0021-9606/2013/138(6)/064705/12/$30.00 © 2013 American Institute of Physics138, 064705-1
Downloaded 22 Apr 2013 to 171.67.34.205. This article is copyrighted as indicated in the abstract. Reuse of AIP content is subject to the terms at: http://jcp.aip.org/about/rights_and_permissions

064705-2 M. Firouzi and J. Wilcox J. Chem. Phys. 138, 064705 (2013)
these equations break down.12 Therefore, flow through verynarrow channels or pores may not be accurately describedbased upon these traditional macroscopic approaches.9 Aspores become smaller the flow no longer obeys Darcy’s lawand correction factors associated with the transport may berequired.6, 13
Interestingly, in small pores unlike in large pores (wherecontinuum flow occurs), the gas velocity at the walls isnon-zero and predicted gas transport is somewhat enhancedas the gas flow transitions from a parabolic velocity profileto plug-flow.14 Gas molecules are transported along the wallsby molecular streaming or Knudsen diffusion due to gasslippage or surface hopping of adsorbed gas molecules.14
The hydrodynamic boundary condition of methane and argonflowing in graphene nanochannels were previously examinedusing molecular dynamics (MD) simulations, and the no-slipboundary condition was shown to be violated for fluids con-fined by graphene surfaces owing to their atomic smoothnessand lyophobicity.15 Using a lattice Boltzmann simulation ap-proach, previous investigations have shown that due to stronggas-solid interactions, molecular streaming along carbon porewalls dominates the gas transport mechanism in kerogen.14
Also, It has been shown that the shape of the velocity profileis independent of the applied pressure gradient in smallpores, while classical Navier-Stokes behavior is approachedfor channel widths greater than ∼10 molecular diameters.9
Within the current work we investigate the gas slippageand simulated viscosity effects for a model gas confined tomicro- and mesopores. The density and streaming velocityprofiles of the gas undergoing a pressure gradient along thepore length are examined in detail. Klinkenberg16 was the firstto apply results of gas slippage theory to the petrophysical do-main, and assumed that the porous medium consists of a bun-dle of equidimensional pore capillaries of radius r and arguedthat, in capillaries with a diameter comparable to the meanfree path of the gas, interactions between the gas moleculesand the capillary walls contribute to the forward movement ofgas molecules in the transport direction. This “gas slippage”reduces viscous drag and increases permeability. Under theassumptions of Klinkenberg, a thin layer exists close to thepore wall in which only collisions between the gas and walltake place, with gas-gas interactions ignored.17 Klinkenbergnoted that in the pore capillary system the mean free path (λ)is inversely proportional to the mean pressure (pm) and com-bined Poiseuille’s law for gas flow in capillaries with Darcy’slaw for flow in porous media, to obtain the Klinkenbergequation
kg = k∞
(1 + b
pm
), (1)
where k∞ is the permeability at infinite pressure (liquid per-meability) and b is referred to as the gas slippage factor.16, 18
As previously described, the mean free path is inverselyproportional to the mean pressure, thus at lower pressures themean free path increases, and the slippage effect and subse-quent gas permeability are enhanced. At higher mean pres-sures, the slippage effect is suppressed and permeability isreduced until at infinite mean pressure the mean free path isreduced to zero at which point the gas molecules are consid-
ered to behave as a liquid, with the gas and inert liquid per-meability, k∞, becoming equivalent.18
Molecular simulation investigations are carried out in thecurrent work and are based on non-equilibrium molecular dy-namics (NEMD), a technique ideally suited for the experi-mental situation in which an external driving force, such as achemical potential or pressure gradient, is applied to a givenpore or pore network. A dual control-volume-grand-canonicalmolecular dynamics (DCV-GCMD) technique, which hasbeen used extensively19–41 has been utilized in the currentwork.
To date there exists little fundamental knowledge regard-ing gas transport and slippage in carbon-based porous sys-tems on the molecular scale. The current investigation wasdesigned to shed light on the details of transport processesat the atomistic level and to demonstrate the possible use ofthis common technique in the field of CO2 transport and stor-age. This work represents the steps required for a deeper un-derstanding of the phenomena involved during the transportof gas mixtures in carbon-based materials. The results indi-cate that molecular phenomena play a significant role on thetransport of gases in confined spaces, and offer unique insightinto the behavior and transport of gases inside porous carbon-based materials.
II. COMPUTATIONAL METHODS
A. Carbon slit pore
A single carbon slit pore was modeled to investigate theKlinkenberg effect and gas slippage. A schematic representa-tion of the pore model is shown in Figure 1, in which the ori-gin of the coordinate system lies at the center of the pore. Thetwo carbon walls are located at the top and bottom xy planes.The external driving force is a chemical potential or, equiva-lently, a pressure gradient applied in the x-direction. The sys-tem is divided into three regions: the h- and l-regions repre-sent, respectively, the two control volumes (CVs) exposed tothe bulk gas at high (upstream) and low (downstream) chemi-cal potential or pressure, while the middle region representsthe pore. The pore’s length is nL with n defined as an in-teger. In our calculations we used n = 1. Periodic bound-ary conditions were employed only in the y-direction. Theslit pore model has been used in previous related studies inwhich gas transport in carbon molecular sieve membraneswas investigated.38–41 Surface roughness was not taken intoaccount in this initial study and as such the pore’s walls areassumed to be smooth (structureless).34–37
B. Three-dimensional (3D) carbon-basedpore network
To predict the gas permeabilities using a more realistic3D carbon-based porous structure, the pore network modelwas generated by the Voronoi tessellation of a solid materialcomposed of hundreds of thousands of atoms, and by des-ignating a fraction of the Voronoi polyhedra as the pores.The model allows for the investigation of the effect of themorphology of the pore space, i.e., its pore size distribution
Downloaded 22 Apr 2013 to 171.67.34.205. This article is copyrighted as indicated in the abstract. Reuse of AIP content is subject to the terms at: http://jcp.aip.org/about/rights_and_permissions

064705-3 M. Firouzi and J. Wilcox J. Chem. Phys. 138, 064705 (2013)
Transport h l
Direction
Pore
n L L L
W
H
t h lPorerr
W
H
X Y
Z
FIG. 1. Schematic of the slit pore model used in the simulations. The h and l regions represent the high- and low-pressure control volumes, respectively.
and pore connectivity, on the gas transport of CH4 and CO2
components.42 In this method, described in detail in previ-ous work,42 we begin with a 3D cell of carbon atoms with astructure corresponding to graphite so that the number den-sity of carbon atoms is 114 nm−3 and the spacing betweenthe adjacent graphite layers in the z direction is 0.335 nm.The size of the initial graphite cell is 102, 103, and 103 Å inx, y, and z directions, respectively, and consists of 124,992carbon atoms. Periodic boundary conditions are applied in alldirections. The graphite cell is then tessellated through theinsertion of a given number of Poisson points at random po-sitions inside the simulation cell, each of which is used forconstructing a 3D Voronoi polyhedron, such that every pointinside each polyhedron is closer to its own Poisson point thanto any other Poisson point. The pore space is then generatedby fixing its desired porosity and selecting a number of poly-hedra that may be chosen randomly or by first sorting andlisting the polyhedra in the cell according to their sizes fromsmallest to largest (or vice versa), in such a way that theirtotal volume fraction equals the desired porosity. The polyhe-dra, so chosen, are then designated as the pores by removingthe carbon atoms comprising them, as well as those that areconnected to only one neighboring carbon atom (the danglingatoms, i.e., connected to only one other atom). The remainingcarbon atoms constitute the solid matrix, while the pore spaceconsists of interconnected pores of various shapes and sizes.The equivalent radius of each polyhedron is taken to be theradius of a sphere that has the same volume as the polyhe-dron. The computed pore size distribution (PSD) of the porenetwork with the average pore size 20 Å when the porosityis 20% and the pores are selected randomly is given in thesupplementary material.43
C. DCV-GCMD method
The DCV-GCMD method was employed to investi-gate the transport properties of gas molecules, which com-bines the MD moves in the entire system with the grand-canonical Monte Carlo (GCMC) insertions and deletions ofthe molecules in the two CVs. The densities, or the corre-sponding chemical potentials, of the components in the CVswere maintained using a sufficient number of GCMC inser-tions and deletions.19, 21, 23, 34–42 The probability of inserting a
molecule of component i is given by
p+i = min
{ZiVc
Ni + 1exp (−�U/kBT ) , 1
}, (2)
where Zi = exp (μi/kBT ) /�3i is the absolute activity at tem-
perature T, �i, and μi are, respectively, the de Broglie wave-length (�i) and the chemical potential of component i, kB isthe Boltzmann’s constant, �U is the potential energy changeresulting from inserting or removing a molecule, and Vc andNi are the volume of the CV and number of atoms of compo-nent i in each CV, respectively. Similarly, the probability ofdeleting a molecule is given by
p−i = min
{Ni
ZiVc
exp (−�U/kBT ) , 1
}. (3)
The chemical potentials were converted to equivalentpressures using a Lennard-Jones (LJ) equation of state.44
When a molecule is inserted in a CV, it is assigned a thermalvelocity selected from the Maxwell–Boltzmann distributionat the given T. Typically, 10 GCMC insertions and deletionsin each CV were followed by one MD integration step. In theMD simulations, the Verlet velocity algorithm was used tointegrate the equations of motion with a dimensionless timestep, �t∗ = 5 × 10⁻³ (i.e., �t = 0.00685 ps). The equationsof motion were integrated with up to 5 × 10⁶ time steps to en-sure that steady state has been reached. Steady state was typi-cally reached in the system after 3 × 10⁶ time steps; however,the simulation is continued up to 5 × 10⁶ time steps, afterwhich the properties, such as concentration and velocity pro-files, fluxes, etc., were calculated and averaged over the last1 × 106 time steps. During the MD calculations moleculesthat crossed the outer boundaries of the CVs were removed.However, the number of such molecules was very small, typ-ically about 1% of the total number of molecules deleted dur-ing the GCMC simulations. To study the transport of a gasmolecule due to an applied pressure gradient, the temperatureof the system was held constant at 25 ◦C to eliminate any con-tribution of the temperature gradient to the transport; hence,isokinetic conditions were maintained by rescaling the veloc-ity independently in all the three directions. In this work thewalls are rigid.
Downloaded 22 Apr 2013 to 171.67.34.205. This article is copyrighted as indicated in the abstract. Reuse of AIP content is subject to the terms at: http://jcp.aip.org/about/rights_and_permissions

064705-4 M. Firouzi and J. Wilcox J. Chem. Phys. 138, 064705 (2013)
D. Potential models of the moleculesand carbon walls
The molecules CO2 and CH4 were represented usingLJ potentials and characterized by the effective LJ size andenergy parameters, σ and ε, respectively.45 We used σ CO2
= 3.79 Å, and εCO2/kB = 225.3 K, and σ CH4 = 3.81 Å,εCH4/kB = 148.1 K.38 For the cross-term LJ parameters, theLorentz-Berthelot mixing rules were used to compute the sizeand energy parameters of the unlike molecules.46
The gas-gas interactions were modeled with the cut-and-shifted LJ 6–12 potential with a cut-off distance rc = 9.5 Å(2.5σ CH4).36, 38–42 As previously mentioned, we utilizedsmooth pore walls described by the 10-4-3 Steele potential,
Uiw(z) = 2πρcεiwσ 2iw�
×{
2
5
(σiw
z
)10
−(
σiw
z
)4
− σ 4iw
3�(0.61� + z)3
},
(4)
which was used to calculate the interaction between a gasmolecule and the wall, where � = 0.335 nm is the spacebetween the adjacent carbon layers, ρc = 114 nm−3 is thenumber density of carbon atoms in the layer, z is the distancefrom the wall, and σiw and εiw are the LJ parameters betweenthe walls and molecule i. The dimensions of the pore usedare W = 76.2 Å (20σ CH4) and L = 152.4 Å (40σ CH4), whilethe pore sizes (heights) may vary from micropores with H= 11.4 (3σ CH4) and 19.0 Å (5σ CH4) to mesopores withH = 26.7 (7σ CH4), 38.1 (10σ CH4), 57.1 (15σ CH4), 76.2 Å(20σ CH4), and 100 Å (26.2σ CH4) to assess the effect of thepore sizes on the transport phenomena.
We computed several quantities of interest, includingthe velocity profiles, vx
i (z), of the component i along the z-direction at the particular value of x and the density profilesof the component i along the x- and z-directions, ρz
i (x) andρx
i (z), respectively. To calculate ρzi (x), the simulation box in
the x-direction was divided into grids of size 3.81 Å (σ CH4),and for each MD step the density profiles ρz
i (x) were obtainedby averaging the number of molecules of component i over thedistance 3.81 Å. A similar procedure was used for computingρx
i (z) and vxi (z), with the averaging carried out over small dis-
tances of 0.38, 0.64, 0.89, 1.27, 1.90, 2.54, and 3.33 Å withcorresponding pore sizes of H = 11.4, 19.0, 26.7, 38.1, 57.1,76.2, and 100 Å, respectively. As discussed next in greaterdetail, these quantities are important in understanding the gastransport properties in nanoconfined pore systems.
In addition, for each component i the flux, Ji, in the direc-tion of the applied pressure gradient was calculated by mea-suring the net number of gas molecules crossing a given yzplane. The permeability, Ki, of component i was then calcu-lated using
Ki = Ji
�Pi/nL= nLJi
�Pi
, (5)
where �Pi = xi�P is the partial pressure drop for componenti along the pore, with xi being the mole fraction of componenti, and �P is the total pressure drop imposed along the pore.
E. Viscosity modeling using GCMC and MD methods
To calculate the viscosity using MD, the adsorptionisotherms of CH4 and CO2 in the pore model were calcu-lated using the conventional GCMC simulations. The averagenumber densities of CH4 and CO2 molecules obtained fromGCMC simulations were then used as the input for the canon-ical (NVT) MD simulations to predict the self-diffusion coeffi-cients of CH4 and CO2 inside the pore network model to cal-culate the viscosity using molecular simulation as describedbelow.
In the GCMC simulations the chemical potential, tem-perature, and pore volume are fixed with periodic boundaryconditions applied in all directions. The initial configurationwas randomly generated with a few number of gas moleculesinside the simulation box. The Metropolis algorithm was usedto create the new configurations by changing the positionof a randomly selected gas molecule and by insertion or re-moval of gas molecules from the pore network structure.For each combination of chemical potential and temperature,4 × 106 configurations were generated. Half of the configu-rations were used to reach system equilibrium and the otherconfigurations were divided into 200 intervals to average thethermodynamic properties.47
In the MD simulations, the Verlet velocity algorithm wasused to integrate the equations of motion with a dimension-less time step, �t∗ = 5 × 10⁻³ (i.e., �t = 0.00685 ps). Theperiodic boundary conditions were imposed in all directionswith the temperature held at 25 ◦C. The initial configurationsallowed for equilibration up to 1,000,000 time steps and thenanother 100,000 steps used to sample and collect the informa-tion for the velocity autocorrelation function (ACF) equationsand diffusion coefficients.
The self-diffusion coefficients were calculated from theGreen-Kubo relation in three dimensions using
D = 1
3
∫ ∞
0〈vi (t) .vi(0)〉dt, (6)
where N is the total number of molecules, and vi(t) is the ve-locity of molecule i at time t. The bracketed quantity repre-sents the velocity ACF. The viscosity then was estimated fromthe Einstein relation using
μ = kBT
3πdD, (7)
where kB is the Boltzmann’s constant, T is the temperature,d is the diameter of the gas molecule, and D is the self-diffusivity estimated from Eq. (6). In what follows, we presentand discuss the results of our simulations. The temperature ofthe system was held constant at 25◦C.
III. RESULTS AND DISCUSSION
Non-equilibrium molecular dynamics simulations mod-eling the transport properties of pure CH4 and CO2 and theirequimolar mixtures were conducted. Figure 2 represents thetime-averaged velocity profiles, vx
i (z), for pure CH4 and CO2
in the yz planes (perpendicular to the direction of the appliedpressure gradient) at 1/4, 1/2, and 3/4 of the pore length. AsFigure 2 shows, the velocity profiles of both CH4 and CO2
Downloaded 22 Apr 2013 to 171.67.34.205. This article is copyrighted as indicated in the abstract. Reuse of AIP content is subject to the terms at: http://jcp.aip.org/about/rights_and_permissions

064705-5 M. Firouzi and J. Wilcox J. Chem. Phys. 138, 064705 (2013)
FIG. 2. Velocity profiles vx (z) of pure CH4 (solid curves) and CO2 (dotted curves) in pore’s cross sections at 1/4 (a), 1/2 (b), and 3/4 (c) of the pore length. Thepore size is 11.4 Å and the upstream and downstream pressures are 3 and 1 atm, respectively.
deviate from Navier-Stokes hydrodynamic predictions. Theparabolic profile is replaced with a uniform velocity profile(plug-flow) along the entire length of the pore, as molecularstreaming becomes the dominant transport mechanism due tothe increased pore-wall effects.14
Also, the velocity profiles of both CH4 and CO2 are non-zero at the closest layer to the wall. We may then concludethat the molecule-wall collisions likely influence the velocityprofile and, due to the increased pore-wall effects, molecu-lar streaming becomes dominant. A thin layer adjacent to thewall exists where only collisions of gas molecules with thepore wall occur and gas-gas collisions may be ignored, whichis consistent with the theory of Klinkenberg.17 In addition,the velocity of CH4 molecules is larger than that of CO2 dueto the enhanced adsorption effect of CO2 on the carbon sur-face and the resulting higher mobility of CH4 molecules inthe pores. Moreover, as the gas approaches the lower pressurealong the pore the velocity increases, as expected, which ismore noticeable for CH4 molecules than CO2 molecules.
Figure 3 represents the same CH4 and CO2 velocity pro-files as shown in Figure 2 in an equimolar mixture. All thequalitative features of the profiles are similar to those shownin Figure 2, except that the velocity profiles of both compo-nents in the mixture are equal in the pore. This phenomenoncan be attributed to the fact that the CO2 molecules have ashielding effect which is stronger for tighter pores, in that,they reduce the mobility of CH4 molecules, resulting in theuniform transport of both components in the gas mixturealong the pore.
To better understand the distributions of CH4 and CO2 inthe pore, Figure 4 presents the time-averaged densities, ρx
i (z),of CH4 and CO2 in an equimolar mixture in the yz planes at
1/4, 1/2, and 3/4 of the pore length. As shown, each com-ponent in the gas mixture forms only two adsorbed layersclose to the walls, which indicates that most gas moleculesare distributed near the pore walls. Another feature of Figure3 worth mentioning is that the density of CO2 is higher thanthat of CH4, an effect caused by the relative adsorption affini-ties of the gases for the carbon surface. The energy contri-bution of CO2-carbon interactions is greater than that of CH4-carbon interactions, i.e., the carbon atom of the pore surface ismore attractive to CO2 than to CH4 molecules. This is consis-tent with CO2 having a significant quadrupole moment (i.e.,13.4 C m2), whereas CH4 is nonpolar.49
Figure 5 presents the time-averaged density profiles,ρz
i (x) (averaged in the yz planes), of CH4 and CO2 in anequimolar mixture as functions of x along the pore, defined asthe region, −76.2 < x < 76.2 Å, computed by averaging theresults over the last 1,000,000 time steps. In this and subse-quent figures, the vertical dashed lines indicate the boundariesof the pore region. The density profiles are essentially flat inthe two CVs, with numerical values that match those obtainedby the GCMC method at the same conditions, indicating thatthe chemical potentials in the two CVs have been properlymaintained during the NEMD simulations. As can be seen inFigure 5, in the transport region, i.e., −76.2 < x < 76.2 Å, thedensities for both components decrease along the pore, whichis expected. The density of CO2 is larger than that of CH4 dueto the affinity of CO2 for carbon surfaces, as described previ-ously and in earlier studies.3, 50 However, the density profilesin the transport region are not linear due to the existence of theoverall bulk pressure gradient (or an overall non-zero stream-ing velocity). The diffusive and convective fluxes make up thetotal flux, which result in a nonlinear profile. These features
Downloaded 22 Apr 2013 to 171.67.34.205. This article is copyrighted as indicated in the abstract. Reuse of AIP content is subject to the terms at: http://jcp.aip.org/about/rights_and_permissions

064705-6 M. Firouzi and J. Wilcox J. Chem. Phys. 138, 064705 (2013)
FIG. 3. Velocity profiles vx (z) of CH4 (solid curves) and CO2 (dotted curves) in an equimolar mixture in the pore’s cross sections at 1/4 (a), 1/2 (b), and 3/4(c) of the pore length. The pore size is 11.4 Å and the upstream and downstream pressures are 3 and 1 atm, respectively.
are clearly seen in Figure 6, where we show snapshots of thesame pore and the distribution of the gas molecules for thesame mixture as in Figure 5, obtained at steady state after 5× 10⁶ time steps. From this figure it is evident that the den-sities of both components in the mixtures decrease from leftto right, and the number of the CO2 molecules in the pore islarger than the number of CH4 molecules.
It is important to determine the pore size depicting thetransition from plug-flow to a parabolic velocity profile sothat accurate transport properties may be incorporated intolarger scale reservoir models. To determine the effect of pore
size on the velocity profiles, the pore size was increased frommicro- to mesopores. Figure 7 shows the time-averaged ve-locity profiles, vx
i (z), of CH4 and CO2 in an equimolar mix-ture at the center of the pore under precisely the same con-ditions as Figure 3, except that the pore sizes investigated inFigure 7 are 19.0, 26.7, 38.1, and 57.1 Å. The results indicatethat, as the pore size increases, the pore becomes less packedand as molecular transport through the pore is less hindered,the gas velocity increases. This is more noticeable for CH4
molecules than CO2 molecules as CH4 is more evenly dis-tributed throughout the pore. As a result, by increasing the
FIG. 4. Density profiles ρx(z) of CH4 (solid curves) and CO2 (dotted curves) in an equimolar mixture in the pore’s cross sections at 1/4 (a), 1/2 (b), and 3/4 (c)of the pore length. The pore size is 11.4 Å and the upstream and downstream pressures are 3 and 1 atm, respectively.
Downloaded 22 Apr 2013 to 171.67.34.205. This article is copyrighted as indicated in the abstract. Reuse of AIP content is subject to the terms at: http://jcp.aip.org/about/rights_and_permissions

064705-7 M. Firouzi and J. Wilcox J. Chem. Phys. 138, 064705 (2013)
0.000
0.001
0.002
0.003
0.004
0.005
0.006
-220 -180 -140 -100 -60 -20 20 60 100 140 180 220
Den
sity
(n
um
ber
/ Å3 )
X(Å)
FIG. 5. Time-averaged density profiles ρz(x) of CH4 (solid curve) and CO2(dotted curve) in an equimolar mixture in the transport direction x. The poresize is 11.4 Å and the upstream and downstream pressures are 3 and 1 atm,respectively. Dashed vertical lines indicate the boundaries of the pore region.
pore size the velocity of CH4 molecules becomes larger thanthat of CO2, which can be attributed to the higher adsorp-tion of CO2 on the carbon surface, as described previously,and the higher mobility of CH4 molecules in the larger pores.This implies that as pores become larger, the shielding ef-fects and pore blocking of CH4 molecules caused by CO2
molecules that exists in the smaller pores as described previ-ously in Figure 3, decreases. Moreover, it seems that as poresize increases, the velocity profile becomes more parabolicand classical Navier-Stokes behavior is approached. The ve-locity profile of CO2 is affected only weakly by the changein pore size, while the velocity profile of CH4 appears to de-pend rather strongly on the pore size. These features shouldbe compared with those encountered with smaller pores whenthe gas molecule-wall collisions influence the velocity profile.
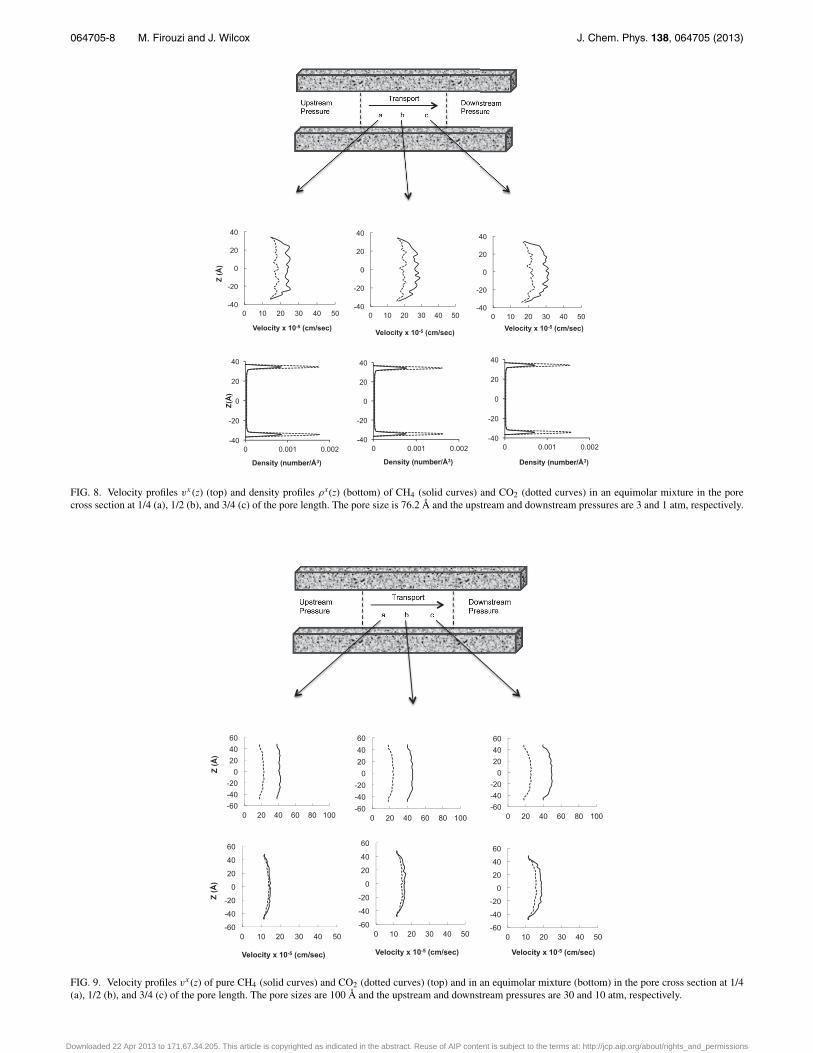
Figure 8 shows the time-averaged velocity profiles,vxi (z),
and density profiles,ρxi (z), of CH4 and CO2 in an equimolar
mixture in the yz planes at 1/4, 1/2, and 3/4 of the pore lengthfor a pore size of 76.2 Å. All of the qualitative features of theprofiles are similar to those shown in Figures 7 and 4, exceptthat in the larger pores the velocity profile is more parabolicthroughout the pore, especially for the CH4 gas molecules.Also, when pore size is increased, the density profiles of thetwo components in the pore are lower. This is due to decreasedadsorption onto the carbon walls in the larger pores, where thegas molecules form only two adsorbed layers near the pore
-3
-2
-1
0
1
2
3
4
-300 -200 -100 0 100 200 300
Z (
Å)
X (Å)
FIG. 6. A snapshot of the pore with the distributions of CH4 (triangles) andCO2 (circles) in an equimolar mixture, when the pore size is 11.4 Å and theupstream and downstream pressures are 3 and 1 atm, respectively. Dashedvertical lines indicate the boundaries of the pore region.
walls, leaving the center of the pore nearly empty. Similar toFigure 3, the results show that the velocities of both compo-nents increase as the pressure gradient decreases along thepore, as described previously.
As the pore size increases to 100 Å [10 nm] parabolic ve-locity profiles are observed due to the reduced interaction ofgas molecules with the carbon pore surfaces. Figure 9 showsthe time-averaged velocity profiles, vx
i (z), of pure CH4 andCO2 as well as in an equimolar mixture of the two compo-nents for a 100 Å pore size when the upstream and down-stream pressures are 30 and 10 atm, respectively. The time-averaged velocity profiles of pure CH4 and CO2 as well asin an equimolar mixture of the two components for a 100 Åpore size when the upstream and downstream pressures are 3and 1 atm, respectively, are also given in the supplementarymaterial.43
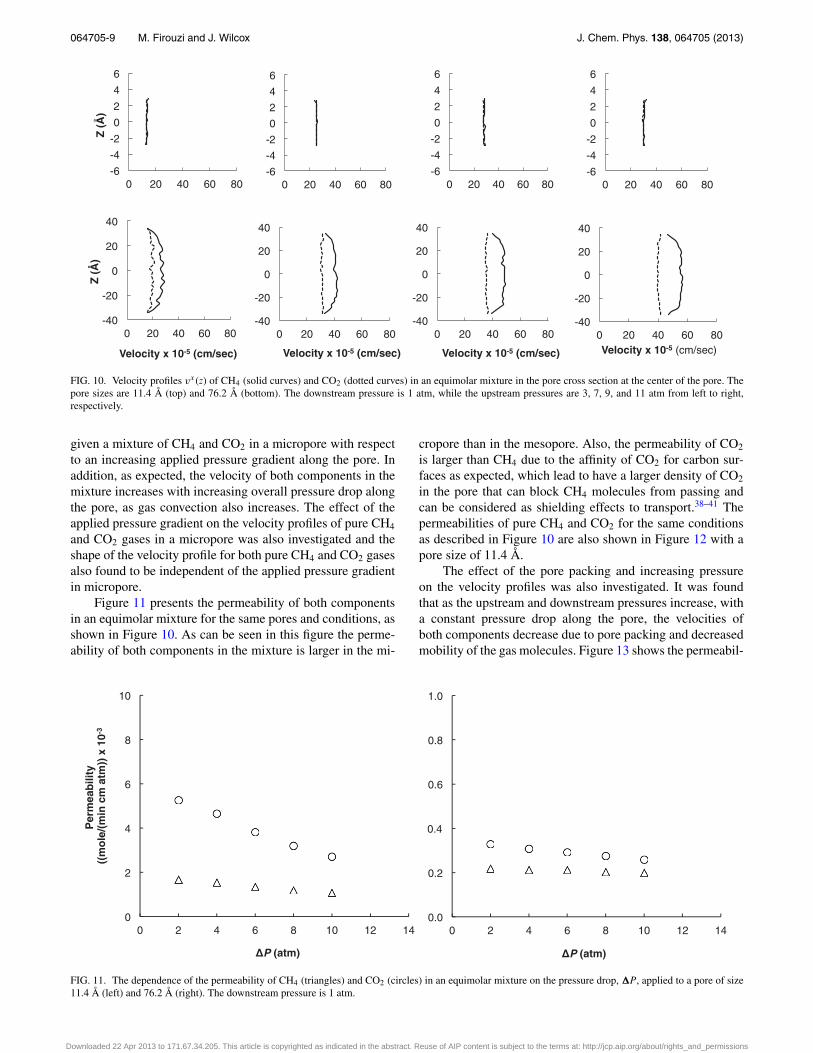
Figure 10 shows the time-averaged velocity profiles,vx
i (z), of CH4 and CO2 in an equimolar mixture in the cen-ter plane of a micro- and mesopore of 11.4 and 76.2 Å, re-spectively. The downstream pressure is fixed at 1 atm, whilethe upstream pressures are varied between 3 and 11 atm inorder to assess the effect of the applied pressure drop �P onthe transport behavior. In previous studies, it was shown thatthe shape of the velocity profile is independent of the appliedpressure gradient.9 Our results are in agreement with this inthat there is no effect on the shape of the velocity profiles
-10
-6
-2
2
6
10
0 10 20 30 40 50
Z (
Å)
Velocity x 10-5 (cm/sec)
-15 -10
-5 0 5
10 15
0 10 20 30 40 50
Velocity x 10-5 (cm/sec)
-20
-10
0
10
20
0 10 20 30 40 50
Velocity x 10-5 (cm/sec)
-30
-15
0
15
30
0 10 20 30 40 50
Velocity x 10-5 (cm/sec)
FIG. 7. Velocity profiles vx (z) of CH4 (solid curves) and CO2 (dotted curves) in an equimolar mixture in the pore cross section at the center of the pore. Thepore sizes are 19.0, 26.7, 38.1, and 57.1 Å from left to right, respectively. The upstream and downstream pressures are 3 and 1 atm, respectively.
Downloaded 22 Apr 2013 to 171.67.34.205. This article is copyrighted as indicated in the abstract. Reuse of AIP content is subject to the terms at: http://jcp.aip.org/about/rights_and_permissions
064705-8 M. Firouzi and J. Wilcox J. Chem. Phys. 138, 064705 (2013)
number number number
FIG. 8. Velocity profiles vx (z) (top) and density profiles ρx(z) (bottom) of CH4 (solid curves) and CO2 (dotted curves) in an equimolar mixture in the porecross section at 1/4 (a), 1/2 (b), and 3/4 (c) of the pore length. The pore size is 76.2 Å and the upstream and downstream pressures are 3 and 1 atm, respectively.
FIG. 9. Velocity profiles vx (z) of pure CH4 (solid curves) and CO2 (dotted curves) (top) and in an equimolar mixture (bottom) in the pore cross section at 1/4(a), 1/2 (b), and 3/4 (c) of the pore length. The pore sizes are 100 Å and the upstream and downstream pressures are 30 and 10 atm, respectively.
Downloaded 22 Apr 2013 to 171.67.34.205. This article is copyrighted as indicated in the abstract. Reuse of AIP content is subject to the terms at: http://jcp.aip.org/about/rights_and_permissions
064705-9 M. Firouzi and J. Wilcox J. Chem. Phys. 138, 064705 (2013)
-6
-4
-2
0
2
4
6
0 20 40 60 80
Z (
Å)
-6
-4
-2
0
2
4
6
0 20 40 60 80 -6
-4
-2
0
2
4
6
0 20 40 60 80 -6
-4
-2
0
2
4
6
0 20 40 60 80
-40
-20
0
20
40
0 20 40 60 80
Z (
Å)
Velocity x 10-5 (cm/sec)
-40
-20
0
20
40
0 20 40 60 80
Velocity x 10-5 (cm/sec)
-40
-20
0
20
40
0 20 40 60 80
Velocity x 10-5 (cm/sec)
-40
-20
0
20
40
0 20 40 60 80 Velocity x 10-5 (cm/sec)
FIG. 10. Velocity profiles vx (z) of CH4 (solid curves) and CO2 (dotted curves) in an equimolar mixture in the pore cross section at the center of the pore. Thepore sizes are 11.4 Å (top) and 76.2 Å (bottom). The downstream pressure is 1 atm, while the upstream pressures are 3, 7, 9, and 11 atm from left to right,respectively.
given a mixture of CH4 and CO2 in a micropore with respectto an increasing applied pressure gradient along the pore. Inaddition, as expected, the velocity of both components in themixture increases with increasing overall pressure drop alongthe pore, as gas convection also increases. The effect of theapplied pressure gradient on the velocity profiles of pure CH4
and CO2 gases in a micropore was also investigated and theshape of the velocity profile for both pure CH4 and CO2 gasesalso found to be independent of the applied pressure gradientin micropore.
Figure 11 presents the permeability of both componentsin an equimolar mixture for the same pores and conditions, asshown in Figure 10. As can be seen in this figure the perme-ability of both components in the mixture is larger in the mi-
cropore than in the mesopore. Also, the permeability of CO2
is larger than CH4 due to the affinity of CO2 for carbon sur-faces as expected, which lead to have a larger density of CO2
in the pore that can block CH4 molecules from passing andcan be considered as shielding effects to transport.38–41 Thepermeabilities of pure CH4 and CO2 for the same conditionsas described in Figure 10 are also shown in Figure 12 with apore size of 11.4 Å.
The effect of the pore packing and increasing pressureon the velocity profiles was also investigated. It was foundthat as the upstream and downstream pressures increase, witha constant pressure drop along the pore, the velocities ofboth components decrease due to pore packing and decreasedmobility of the gas molecules. Figure 13 shows the permeabil-
0.0
0.2
0.4
0.6
0.8
1.0
0 2 4 6 8 10 12 14
P (atm)
0
2
4
6
8
10
0 2 4 6 8 10 12 14
Per
mea
bili
ty
((m
ole
/(m
in c
m a
tm))
x 1
0-3
P (atm)
FIG. 11. The dependence of the permeability of CH4 (triangles) and CO2 (circles) in an equimolar mixture on the pressure drop, �P, applied to a pore of size11.4 Å (left) and 76.2 Å (right). The downstream pressure is 1 atm.
Downloaded 22 Apr 2013 to 171.67.34.205. This article is copyrighted as indicated in the abstract. Reuse of AIP content is subject to the terms at: http://jcp.aip.org/about/rights_and_permissions

064705-10 M. Firouzi and J. Wilcox J. Chem. Phys. 138, 064705 (2013)
FIG. 12. The dependence of the permeability of pure CH4 (triangles) andCO2 (circles) on the pressure drop, �P, applied to a pore of size 11.4 Å. Thedownstream pressure is 1 atm.
ity of both components in an equimolar mixture with a pres-sure drop of 2 atm and upstream pressures of 3, 5, 7, 9, and11 atm. Similar to Figure 11, the permeability of both com-ponents in the mixture is greater in the micro- than the meso-pore, and the permeability of CO2 is greater than that of CH4.In addition, by increasing the upstream and downstream pres-sures but maintaining the same pressure drop along the pore,the permeability of both components decreases. This effectis more noticeable in the micropore. This phenomena canbe defined based on the theory of Klinkenberg in that at thelower pressures the mean free path increases thereby increas-ing the slippage effect and leading to enhanced gas perme-ability, while at the higher mean pressures the slippage effectis suppressed leading to reduced permeability.
Previous studies indicate that in a realistic disorderedporous natural system, the gas transport is dominated
by the geometrical and topological characteristics of thematerial.36, 39, 42, 51 As a result, the use of a single carbonslit pore as used in this work to model the velocity pro-files and slip boundary conditions, is a grossly inadequatemodel to predict gas permeability in real porous natural sys-tems. A more accurate approach involves the use of a three-dimensional molecular pore network for modeling gas trans-port in porous media. To predict the CH4 and CO2 permeabil-ities using a more realistic 3D carbon-based porous structure,the 3D pore network model was generated as described ear-lier. The porosity in the generated 3D pore network is 20%and the pores are selected randomly, with average pore sizeof 20 Å. The number of inserted Poisson points in the simu-lation cell is 240.
In previous studies it has been shown that the viscosityof confined fluids is dependent on the structure and pore di-ameter, which is often different from the viscosity of the bulksystem.52, 53,48 To investigate the effect of varying viscosity onthe transport, the adsorption isotherms of CH4 and CO2 in thegenerated pore network structure were calculated using theconventional GCMC simulations. The average number densi-ties of gas molecules obtained from GCMC simulations arethen used as the input for the canonical (NVT) MD simula-tions to predict the self-diffusion coefficients using Einsteinand Green-Kubo relations to calculate the viscosity theoreti-cally as described previously. The velocity ACF of pure CH4
and CO2 in the pore network model was first simulated andfound that after a short time the velocity ACF declines sharplyand then fluctuates around zero.48, 54 The velocity autocorre-lation function of pure CH4 and CO2 in the pore network at20 atm is given in the supplementary material.43
Then, the self-diffusivities of pure CH4 and CO2 in thepore network model obtained from Eq. (6), exhibiting a higherself-diffusivity for CH4 than CO2 as expected due to thehigher adsorption affinity of CO2 on the carbon surface of thepore. The self-diffusivities of pure CH4 and CO2 in the porenetwork model are given in the supplementary material.43 The
0.0
0.2
0.4
0.6
0.8
1.0
0 2 4 6 8 10 12 14
Upstream Pressure (atm)
0
2
4
6
8
10
0 2 4 6 8 10 12 14
Per
mea
bili
ty
(m
ole
/(m
in c
m a
tm))
x 1
0-3
Upstream pressure (atm)
FIG. 13. The dependence of the permeability of CH4 (triangles) and CO2 (circles) in an equimolar mixture on the upstream pressure applied to a pore of size11.4 Å (left) and 76.2 Å (right). The pressure drop applied to the pores is 2 atm.
Downloaded 22 Apr 2013 to 171.67.34.205. This article is copyrighted as indicated in the abstract. Reuse of AIP content is subject to the terms at: http://jcp.aip.org/about/rights_and_permissions
064705-11 M. Firouzi and J. Wilcox J. Chem. Phys. 138, 064705 (2013)
0
2
4
6
8
10
0 10 20 30 40 50 60
Per
mea
bili
ty
((m
ole
/(m
in c
m a
tm))
x 1
0-8
P (atm)
0
200
400
600
800
1000
0.02 0.03 0.04 0.05 0.06 0.07
Per
mea
bili
ty (
nan
o-D
arcy
)
Inverse mean pressure (atm-1)
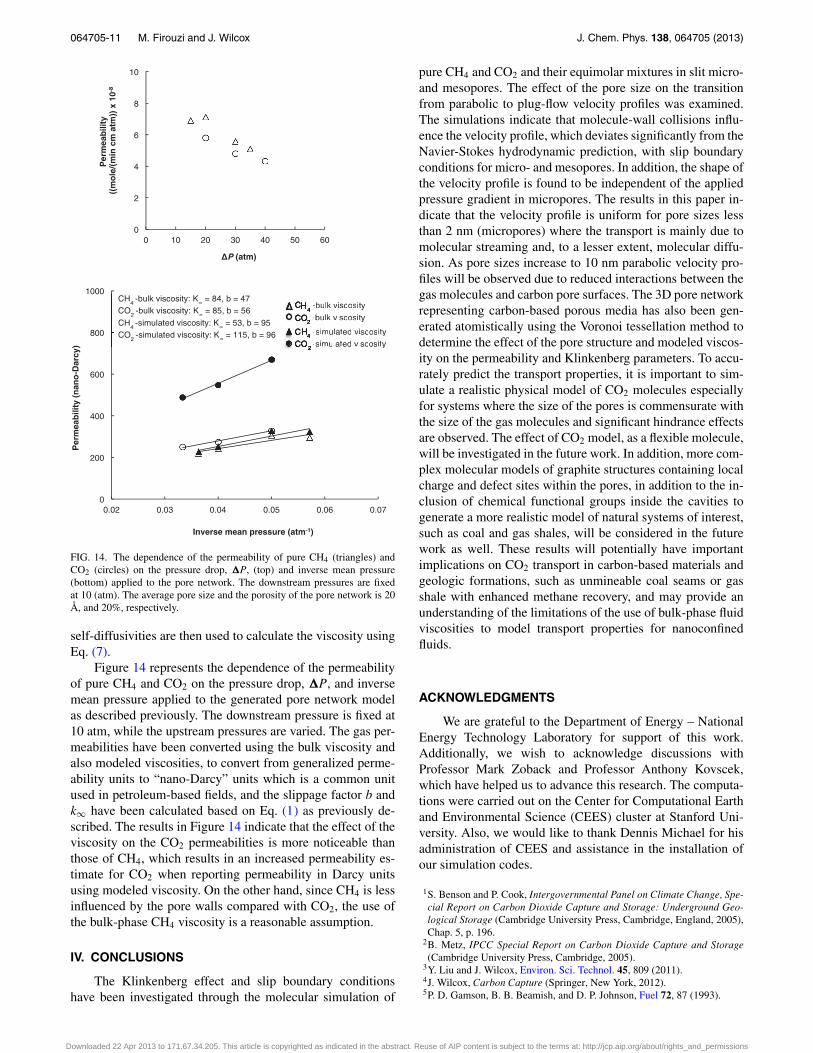
-bulk viscosity -bulk viscosity
-simulated viscosity -simulated viscosity
-bulk viscosity
-bulk viscosity
-simulated viscosity-simulated viscosity
CH4
-bulk viscosity: K = 84, b = 47 CO
2 -bulk viscosity: K = 85, b = 56
CH4
-simulated viscosity: K = 53, b = 95 CO
2 -simulated viscosity: K = 115, b = 96
FIG. 14. The dependence of the permeability of pure CH4 (triangles) andCO2 (circles) on the pressure drop, �P, (top) and inverse mean pressure(bottom) applied to the pore network. The downstream pressures are fixedat 10 (atm). The average pore size and the porosity of the pore network is 20Å, and 20%, respectively.
self-diffusivities are then used to calculate the viscosity usingEq. (7).
Figure 14 represents the dependence of the permeabilityof pure CH4 and CO2 on the pressure drop, �P, and inversemean pressure applied to the generated pore network modelas described previously. The downstream pressure is fixed at10 atm, while the upstream pressures are varied. The gas per-meabilities have been converted using the bulk viscosity andalso modeled viscosities, to convert from generalized perme-ability units to “nano-Darcy” units which is a common unitused in petroleum-based fields, and the slippage factor b andk∞ have been calculated based on Eq. (1) as previously de-scribed. The results in Figure 14 indicate that the effect of theviscosity on the CO2 permeabilities is more noticeable thanthose of CH4, which results in an increased permeability es-timate for CO2 when reporting permeability in Darcy unitsusing modeled viscosity. On the other hand, since CH4 is lessinfluenced by the pore walls compared with CO2, the use ofthe bulk-phase CH4 viscosity is a reasonable assumption.
IV. CONCLUSIONS
The Klinkenberg effect and slip boundary conditionshave been investigated through the molecular simulation of
pure CH4 and CO2 and their equimolar mixtures in slit micro-and mesopores. The effect of the pore size on the transitionfrom parabolic to plug-flow velocity profiles was examined.The simulations indicate that molecule-wall collisions influ-ence the velocity profile, which deviates significantly from theNavier-Stokes hydrodynamic prediction, with slip boundaryconditions for micro- and mesopores. In addition, the shape ofthe velocity profile is found to be independent of the appliedpressure gradient in micropores. The results in this paper in-dicate that the velocity profile is uniform for pore sizes lessthan 2 nm (micropores) where the transport is mainly due tomolecular streaming and, to a lesser extent, molecular diffu-sion. As pore sizes increase to 10 nm parabolic velocity pro-files will be observed due to reduced interactions between thegas molecules and carbon pore surfaces. The 3D pore networkrepresenting carbon-based porous media has also been gen-erated atomistically using the Voronoi tessellation method todetermine the effect of the pore structure and modeled viscos-ity on the permeability and Klinkenberg parameters. To accu-rately predict the transport properties, it is important to sim-ulate a realistic physical model of CO2 molecules especiallyfor systems where the size of the pores is commensurate withthe size of the gas molecules and significant hindrance effectsare observed. The effect of CO2 model, as a flexible molecule,will be investigated in the future work. In addition, more com-plex molecular models of graphite structures containing localcharge and defect sites within the pores, in addition to the in-clusion of chemical functional groups inside the cavities togenerate a more realistic model of natural systems of interest,such as coal and gas shales, will be considered in the futurework as well. These results will potentially have importantimplications on CO2 transport in carbon-based materials andgeologic formations, such as unmineable coal seams or gasshale with enhanced methane recovery, and may provide anunderstanding of the limitations of the use of bulk-phase fluidviscosities to model transport properties for nanoconfinedfluids.
ACKNOWLEDGMENTS
We are grateful to the Department of Energy – NationalEnergy Technology Laboratory for support of this work.Additionally, we wish to acknowledge discussions withProfessor Mark Zoback and Professor Anthony Kovscek,which have helped us to advance this research. The computa-tions were carried out on the Center for Computational Earthand Environmental Science (CEES) cluster at Stanford Uni-versity. Also, we would like to thank Dennis Michael for hisadministration of CEES and assistance in the installation ofour simulation codes.
1S. Benson and P. Cook, Intergovernmental Panel on Climate Change, Spe-cial Report on Carbon Dioxide Capture and Storage: Underground Geo-logical Storage (Cambridge University Press, Cambridge, England, 2005),Chap. 5, p. 196.
2B. Metz, IPCC Special Report on Carbon Dioxide Capture and Storage(Cambridge University Press, Cambridge, 2005).
3Y. Liu and J. Wilcox, Environ. Sci. Technol. 45, 809 (2011).4J. Wilcox, Carbon Capture (Springer, New York, 2012).5P. D. Gamson, B. B. Beamish, and D. P. Johnson, Fuel 72, 87 (1993).
Downloaded 22 Apr 2013 to 171.67.34.205. This article is copyrighted as indicated in the abstract. Reuse of AIP content is subject to the terms at: http://jcp.aip.org/about/rights_and_permissions

064705-12 M. Firouzi and J. Wilcox J. Chem. Phys. 138, 064705 (2013)
6T. Ertekin, G. R. King, and F. C. Schewerer, SPEFE 1, 43 (1986).7A. Chawathe, T. Ertekin, and A. Grader, SPE Annual Technical Conferenceand Exhibition (Society of Petroleum Engineers, Denver, CO, 1996), pp.565–573.
8J. Jalali and S. D. A. Mohaghegh, SPE Eastern Regional Meeting, PaperNo. 91414 (Society of Petroleum Engineers, Charleston, WV, 2004).
9K. P. Travis, B. D. Todd, and D. J. Evans, Phys. Rev. E 55, 4288(1997).
10S. P. Neuman, Acta Mech. 25, 153 (1977).11S. Whitaker, Transp. Porous Media 1, 3 (1986).12I. Bitsanis, T. K. Vanderlick, M. Tirrel, and H. T. Davis, J. Chem. Phys. 89,
3152 (1988).13F. O. Jones and W. W. Owens, J. Pet. Technol. 32, 1631 (1980).14Y. Akkutlu and E. Fathi, SPE Journal 17, 1002 (2012).15S. K. Kannam, B. D. Todd, J. S. Hansen, and P. J. Daivis, J. Chem. Phys.
135, 144701 (2011).16L. J. Klinkenberg, API Drill. & Prod. Prac. 41, 200 (1941).17M. C. Bravo, J. Appl. Phys. 102, 074905 (2007).18C. A. McPhee and K. G. Arthur, Edinburgh Petroleum Services Limited,
UK.19R. F. Cracknell, D. Nicholson, and N. Quirke, Phys. Rev. Lett. 74, 2463
(1995).20D. M. Ford and E. D. Glandt, J. Phys. Chem. 99, 11543 (1995).21D. M. Ford and G. S. Heffelfinger, Mol. Phys. 94, 673 (1998).22S. Furukawa, K. Hayashi, and T. Nitta, J. Chem. Eng. Jpn. 30, 1107 (1997).23G. S. Heffelfinger and F. V. Swol, J. Chem. Phys. 100, 7548 (1994).24G. S. Heffelfinger and D. M. Ford, Mol. Phys. 94, 659 (1998).25S. Kjelstrup and B. Hafskjold, Ind. Eng. Chem. Res. 35, 4203 (1996).26M. Lupkowski and F. V. Swol, J. Chem. Phys. 95, 1995 (1991).27J. M. D. MacElroy, J. Chem. Phys. 101, 5274 (1994).28E. J. Maginn, A. T. Bell, and D. N. Theodorou, J. Phys. Chem. 97, 4173
(1993).29D. Nicholson, R. F. Cracknell, and N. Quirke, Langmuir 12, 4050 (1996).30P. I. Pohl and G. S. Heffelfinger, J. Membr. Sci. 155, 1 (1999).31M. Sun and C. Ebner, Phys. Rev. A 46, 4813 (1992).
32S. Sunderrajan, C. K. Hall, and B. D. Freeman, J. Chem. Phys. 105, 1621(1996).
33A. P. Thompson, D. M. Ford, and G. S. Heffelfinger, J. Chem. Phys. 109,6406 (1998).
34L. Xu, M. G. Sedigh, M. Sahimi, and T. T. Tsotsis, Phys. Rev. Lett. 80,3511 (1998).
35L. Xu, T. T. Tsotsis, and M. Sahimi, J. Chem. Phys. 111, 3252 (1999).36L. Xu, T. T. Tsotsis, and M. Sahimi, Phys. Rev. E 62, 6942 (2000).37L. Xu, M. G. Sedigh, T. T. Tsotsis, and M. Sahimi, J. Chem. Phys. 112, 910
(2000).38M. Firouzi, T. T. Tsotsis, and M. Sahimi, J. Chem. Phys. 119, 6810 (2003).39M. Firouzi, Kh. Molaai Nezhad, T. T. Tsotsis, and M. Sahimi, J. Chem.
Phys. 120, 8172 (2004).40M. Firouzi, M., Sahimi, and T. T. Tsotsis, Phys. Rev. E 73, 036312 (2006).41M. Firouzi, T. T. Tsotsis, and M. Sahimi, Chem. Eng. Sci. 62, 2777 (2007).42M. Firouzi and J. Wilcox, Microporous Mesoporous Mater. 158, 195
(2012).43See supplementary material at http://dx.doi.org/10.1063/1.4790658 for the
computed pore size distribution (PSD), the time-averaged velocity profiles,the velocity autocorrelation function, and the self-diffusivities.
44J. K. Johnson, J. A. Zollweg, and K. E. Gubbins, Mol. Phys. 78, 591 (1993).45D. M. Ruthven, Principles of Adsorption & Adsorption Processes (Wiley,
1984).46M. P. Allen and D. J. Tildesley, Computer Simulation of Liquids (Oxford
University Press, Oxford, 1987).47D. Cao and J. Wu, Langmuir 20, 3759 (2004).48M. Khademi and M. Sahimi, J. Chem. Phys. 135, 204509 (2011).49Y. Bae, O. K. Farha, J. T. Hupp, and R. Q. Snurr, J. Mater. Chem. 19, 2131
(2009).50Y. Liu and J. Wilcox, Environ. Sci. Technol. 46, 1940 (2012).51M. Sahimi and T. T. Tsotsis, Physica B 338, 291 (2003).52V. P. Sokhan, D. Nicholson, and N. Quirke, J. Chem. Phys. 117, 8531
(2002).53A. Thomas and A. J. H. McGaughey, Nano Lett. 8, 2788 (2008).54A. Rahman and F. H. Stillinger, J. Chem. Phys. 55, 3336 (1971).
Downloaded 22 Apr 2013 to 171.67.34.205. This article is copyrighted as indicated in the abstract. Reuse of AIP content is subject to the terms at: http://jcp.aip.org/about/rights_and_permissions