Slide Show 13: User Interface Design - Drawing Tools.pdf · User Interface Design. Overview...
23
INSIGHT AND OVERVIEW Slide Show 13: User Interface Design
Transcript of Slide Show 13: User Interface Design - Drawing Tools.pdf · User Interface Design. Overview...

INSIGHT
AND
OVERVIEW
Slide Show 13:
User Interface Design

Overview
Designing IGSS diagrams
• Toolbars available
• The Color Palette
• Drawing objects – Windows controls – Graphics –
Animations – ActiveX controls
(called Standard Descriptors in IGSS)
• Connecting IGSS objects to standard descriptors
• The Grid control
IGSS Dashboard (new in IGSS V8)

Drawing toolbar
Embedded graph
Embedded subdiagrams
Embedded alarm list Animated symbols
Windows button
Rectangle
Grid control
Group box
Zoom function
To connect a standard descriptor
directly to an IGSS object,
choose ”Objects” > ”Standard Descriptors” >
(Descriptor Type)

Library toolbar
Your favourite graphics
objects
(bmp, wmf, emf, gif, etc.)
Name of
thumbnail
Add new
object
Change thumbnail
dimensions
Drag and drop onto process diagram!
Your favourite
IGSS objects
(symbols only)

The Font toolbar
TypefaceType size
Bold Italic Underline
TIP:
Instead of integrating texts in a diagram background picture,
insert and format the texts directly in Definition. This gives you complete
control of type face and size.

The Color palette
Background color for diagram
In the ”Format” menu, click
”Set Background Color”
to apply a new color to the diagram.
Change color for lines, texts, etc.
Choose drawing object(s) or
object symbol(s) on the diagram
and choose the relevant color.

Standard descriptors (1)
Line Polygon
Drawing objects
Command button Progress barCombo box
Windows controls
Check boxes Radio buttons

Standard descriptors (2)
Graphics files
Multimedia files
Diagram reference(thumbnails)
Bitmaps as object symbols
(command buttons)
Bind *.avi or animated *.gif file to object value/state (analog, digital or counter)

Standard descriptors (3)
ActiveX controls
Bind to object value
Multiple displays in one
ActiveX control
Change alarm limit or setpoint
Examples:
- GMS Angular Gauge:
http://www.globalmajic.com/
- Symbol Factory:
http://www.softwaretoolbox.com

Connect IGSS objects to
standard descriptors
STEP 1:
Position and
resize the descriptor
STEP 2:
Right-click the descriptor
and choose ”Connect”
STEP 3:
Choose the object. For some descriptors
only certain object types are available.
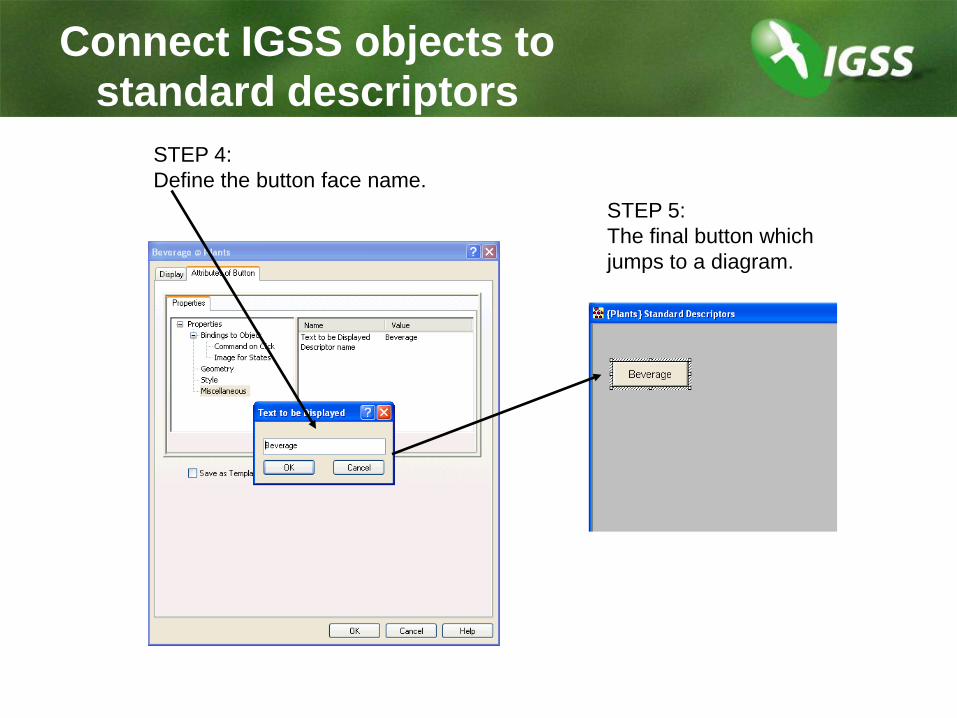
Connect IGSS objects tostandard descriptors
STEP 4:
Define the button face name.
STEP 5:
The final button which
jumps to a diagram.

Reconnect / Disconnect
Reconnect
When you choose ”Reconnect”,
another object of the same type
can be chosen.
Disconnect
When you choose ”Disconnect”,
the standard descriptor is disconnected
from the IGSS object.
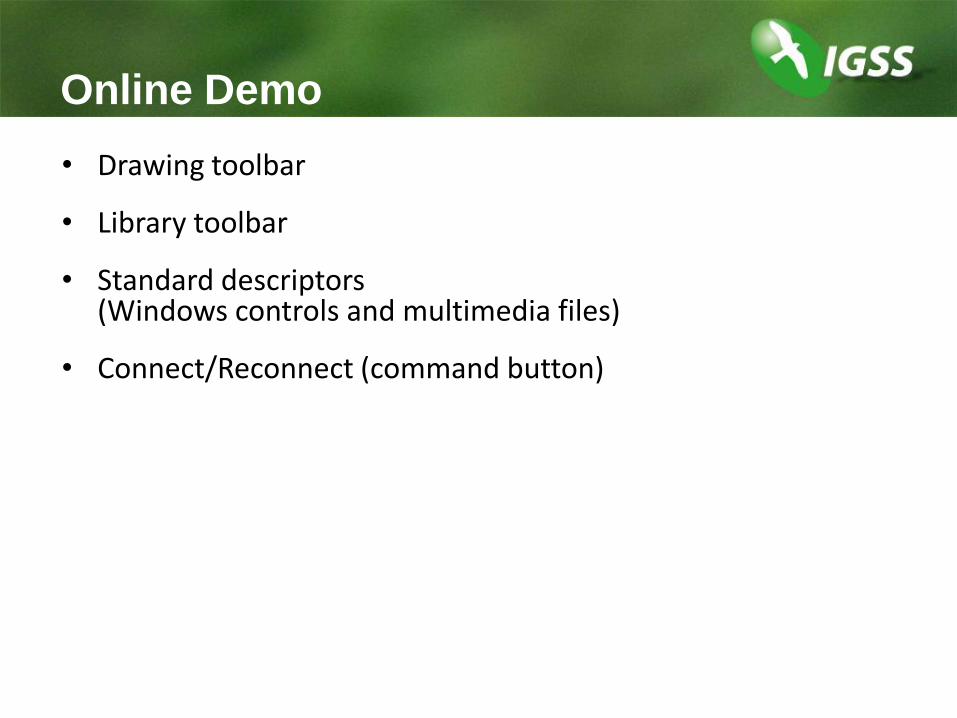
Online Demo
• Drawing toolbar
• Library toolbar
• Standard descriptors(Windows controls and multimedia files)
• Connect/Reconnect (command button)

Grid control - editing
Floating property sheet
(direct editing of cells)

IGSS Dashboard

Here’s a dashboard !
Application button(Doughnut)
Ribbon(context sensitive)
Widgets

The goal of the Dashboard
• Quick overview of process status
• Quick overview of key values in the process
• Provide analysis tools for the user to determine corrective action
• Provide dashboards for non-IGSS users(The dashboard client only needs an ODBC connection to the server – not charged as an operator station)

How the Dashboard works …
Dashboard 1
Dashboard 2
Dashboard 3
Configuration’s report folderIGSS ODBC Server The server must be running.Delivers data to the Dashboard.
Views available in the Dashboard –called Widgets
• LOG data• Reduced data (BCL)• Graph data • Online data• Audit Trail• Memo sticker• Web pages
Setup and Startup- Dashboard can be started automatically.This Is set up in System Configuration.
Memo text is saved in text filesEach memo is saved in a separate .txtfile in the configuration’s report folder.

Dashboards and memos are files
DASH and TXT files are saved in the report folder
• A dashboard is saved as a .dash file
• A .dash file can be used as a dashboard template
• DASH files can be backed up (System Configuration)
• Memo text is saved in .txt files
• TXT files can be reused in multiple dashboards
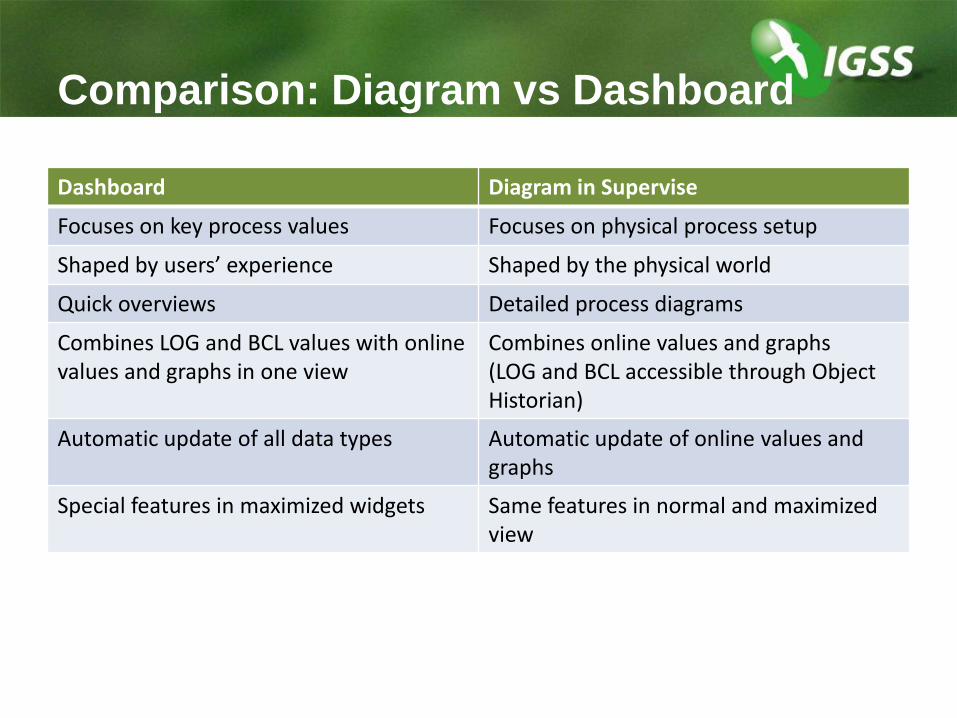
Comparison: Diagram vs Dashboard
Dashboard Diagram in Supervise
Focuses on key process values Focuses on physical process setup
Shaped by users’ experience Shaped by the physical world
Quick overviews Detailed process diagrams
Combines LOG and BCL values with online values and graphs in one view
Combines online values and graphs(LOG and BCL accessible through Object Historian)
Automatic update of all data types Automatic update of online values and graphs
Special features in maximized widgets Same features in normal and maximized view

Exercise:
Create a pump station dashboard
The finaldashboard

View mode
• The Dashboard starts in View mode
• The only tab available is View
The user selects a data period.A time offset can be defined forthe individual widget.

Configuration mode
• Press CTRL + D to enter configuration mode
• The Configuration tab allows you to add widgets to the dashboard
• When a widget is selected, the Widget and [Type-specific] tabs appear.
TIP: Hold down SHIFT when you add a widget. The focus will remain in the Configuration tab.
The default dashboard will beloaded on startup.