Slide Notes for Manitoba Emissions, Manitoba Solutions ...
24
Slide 1 MANITOBA EMISSIONS MANITOBA SOLUTIONS Curt Hull, P.Eng., Project Manager climatechangeconnection.org
Transcript of Slide Notes for Manitoba Emissions, Manitoba Solutions ...
Slide 1
MANITOBA EMISSIONS
MANITOBA SOLUTIONS
Curt Hull, P.Eng., Project Managerclimatechangeconnection.org
Slide 2
13,000
14,000
15,000
16,000
17,000
18,000
19,000
20,000
21,000
22,0001
99
0
19
91
19
92
19
93
19
94
19
95
19
96
19
97
19
98
19
99
2000
20
01
20
02
20
03
20
04
20
05
20
06
20
07
20
08
20
09
20
10
20
11
2012
20
13
To
tal a
nn
ua
l G
HG
em
issio
ns (
kT
CO
2e
)
Manitoba annual GHG emissions 1990 - 2013
Kyoto target
2030 Target
Actual
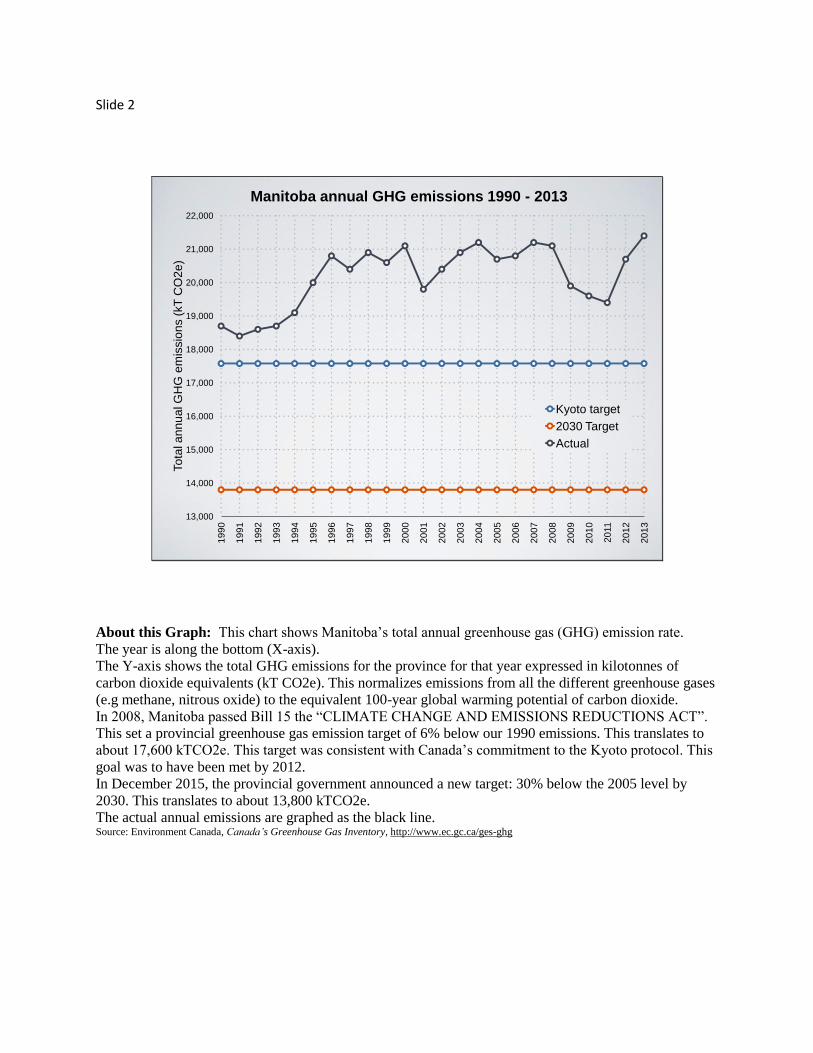
About this Graph: This chart shows Manitoba’s total annual greenhouse gas (GHG) emission rate.
The year is along the bottom (X-axis).
The Y-axis shows the total GHG emissions for the province for that year expressed in kilotonnes of
carbon dioxide equivalents (kT CO2e). This normalizes emissions from all the different greenhouse gases
(e.g methane, nitrous oxide) to the equivalent 100-year global warming potential of carbon dioxide.
In 2008, Manitoba passed Bill 15 the “CLIMATE CHANGE AND EMISSIONS REDUCTIONS ACT”.
This set a provincial greenhouse gas emission target of 6% below our 1990 emissions. This translates to
about 17,600 kTCO2e. This target was consistent with Canada’s commitment to the Kyoto protocol. This
goal was to have been met by 2012.
In December 2015, the provincial government announced a new target: 30% below the 2005 level by
2030. This translates to about 13,800 kTCO2e.
The actual annual emissions are graphed as the black line. Source: Environment Canada, Canada’s Greenhouse Gas Inventory, http://www.ec.gc.ca/ges-ghg
Slide 3
Transportation39%
Agriculture31%
Stationary combustion
20%Waste5%
Fugitive Sources2%
Industrial processes3%
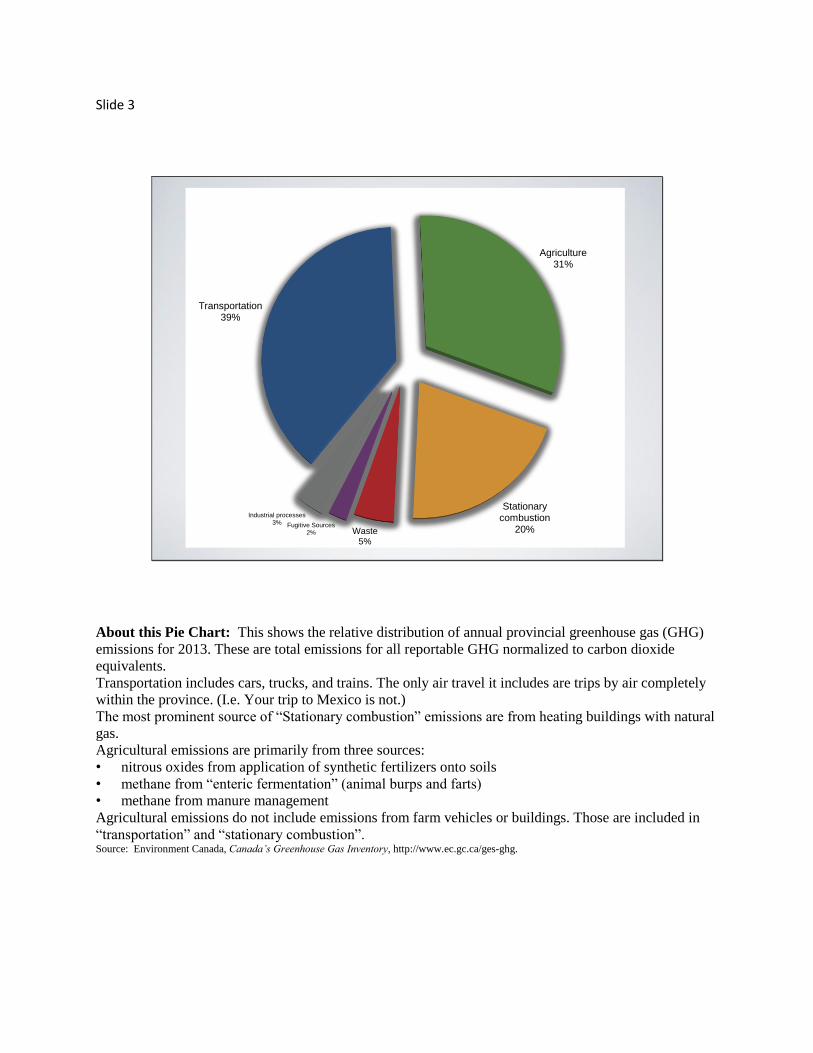
About this Pie Chart: This shows the relative distribution of annual provincial greenhouse gas (GHG)
emissions for 2013. These are total emissions for all reportable GHG normalized to carbon dioxide
equivalents.
Transportation includes cars, trucks, and trains. The only air travel it includes are trips by air completely
within the province. (I.e. Your trip to Mexico is not.)
The most prominent source of “Stationary combustion” emissions are from heating buildings with natural
gas.
Agricultural emissions are primarily from three sources:
• nitrous oxides from application of synthetic fertilizers onto soils
• methane from “enteric fermentation” (animal burps and farts)
• methane from manure management
Agricultural emissions do not include emissions from farm vehicles or buildings. Those are included in
“transportation” and “stationary combustion”. Source: Environment Canada, Canada’s Greenhouse Gas Inventory, http://www.ec.gc.ca/ges-ghg.
Slide 4
TRANSPORTATION
Slide 5
500
750
1,000
1,250
1,500
1,750
2,0001
99
0
19
91
19
92
19
93
19
94
19
95
19
96
19
97
19
98
19
99
20
00
20
01
20
02
20
03
20
04
20
05
20
06
20
07
20
08
20
09
20
10
20
11
20
12
20
13
An
nu
al G
HG
em
issio
ns (
kT
CO
2e
)
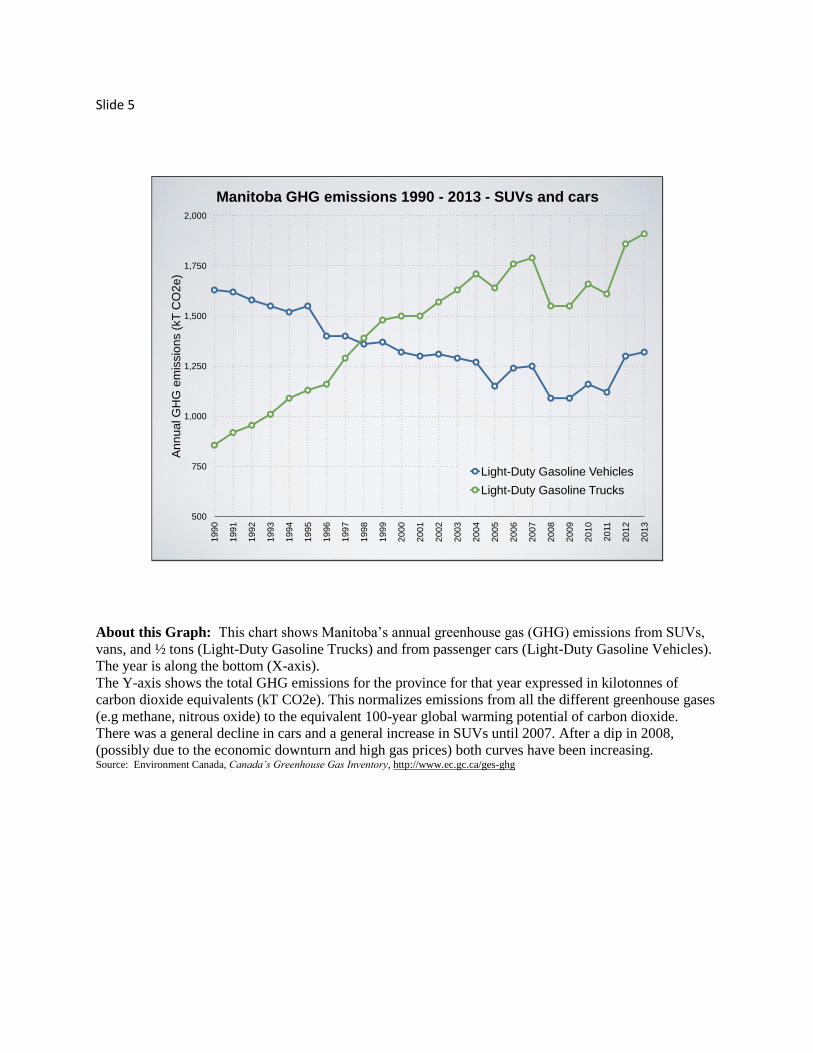
Manitoba GHG emissions 1990 - 2013 - SUVs and cars
Light-Duty Gasoline Vehicles
Light-Duty Gasoline Trucks
About this Graph: This chart shows Manitoba’s annual greenhouse gas (GHG) emissions from SUVs,
vans, and ½ tons (Light-Duty Gasoline Trucks) and from passenger cars (Light-Duty Gasoline Vehicles).
The year is along the bottom (X-axis).
The Y-axis shows the total GHG emissions for the province for that year expressed in kilotonnes of
carbon dioxide equivalents (kT CO2e). This normalizes emissions from all the different greenhouse gases
(e.g methane, nitrous oxide) to the equivalent 100-year global warming potential of carbon dioxide.
There was a general decline in cars and a general increase in SUVs until 2007. After a dip in 2008,
(possibly due to the economic downturn and high gas prices) both curves have been increasing. Source: Environment Canada, Canada’s Greenhouse Gas Inventory, http://www.ec.gc.ca/ges-ghg
Slide 6
AGRICULTURE
Slide 7
0
1,000
2,000
3,000
4,000
5,000
6,000
7,000
8,0001
99
0
19
91
19
92
19
93
19
94
19
95
19
96
19
97
19
98
19
99
20
00
20
01
20
02
20
03
20
04
20
05
20
06
20
07
20
08
20
09
20
10
20
11
20
12
20
13
An
nu
al G
HG
em
issio
ns (
kT
CO
2e
)
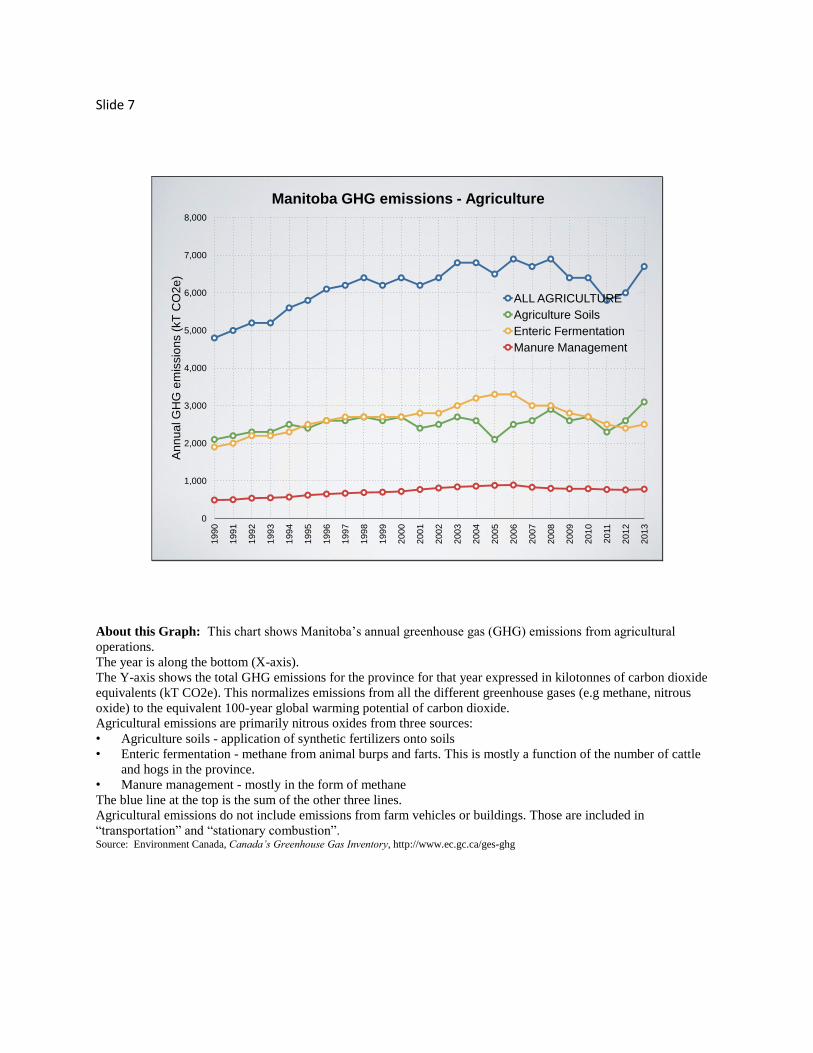
Manitoba GHG emissions - Agriculture
ALL AGRICULTURE
Agriculture Soils
Enteric Fermentation
Manure Management
About this Graph: This chart shows Manitoba’s annual greenhouse gas (GHG) emissions from agricultural
operations.
The year is along the bottom (X-axis).
The Y-axis shows the total GHG emissions for the province for that year expressed in kilotonnes of carbon dioxide
equivalents (kT CO2e). This normalizes emissions from all the different greenhouse gases (e.g methane, nitrous
oxide) to the equivalent 100-year global warming potential of carbon dioxide.
Agricultural emissions are primarily nitrous oxides from three sources:
• Agriculture soils - application of synthetic fertilizers onto soils
• Enteric fermentation - methane from animal burps and farts. This is mostly a function of the number of cattle
and hogs in the province.
• Manure management - mostly in the form of methane
The blue line at the top is the sum of the other three lines.
Agricultural emissions do not include emissions from farm vehicles or buildings. Those are included in
“transportation” and “stationary combustion”. Source: Environment Canada, Canada’s Greenhouse Gas Inventory, http://www.ec.gc.ca/ges-ghg
Slide 8
STATIONARY COMBUSTION
Slide 9
800
900
1,000
1,100
1,200
1,300
1,400
1,500
1,600
1,700
1,8001
99
0
19
91
19
92
19
93
19
94
19
95
19
96
19
97
19
98
19
99
20
00
20
01
20
02
20
03
20
04
20
05
20
06
20
07
20
08
20
09
20
10
20
11
20
12
20
13
An
nu
al G
HG
em
issio
ns (
kT
CO
2e
)
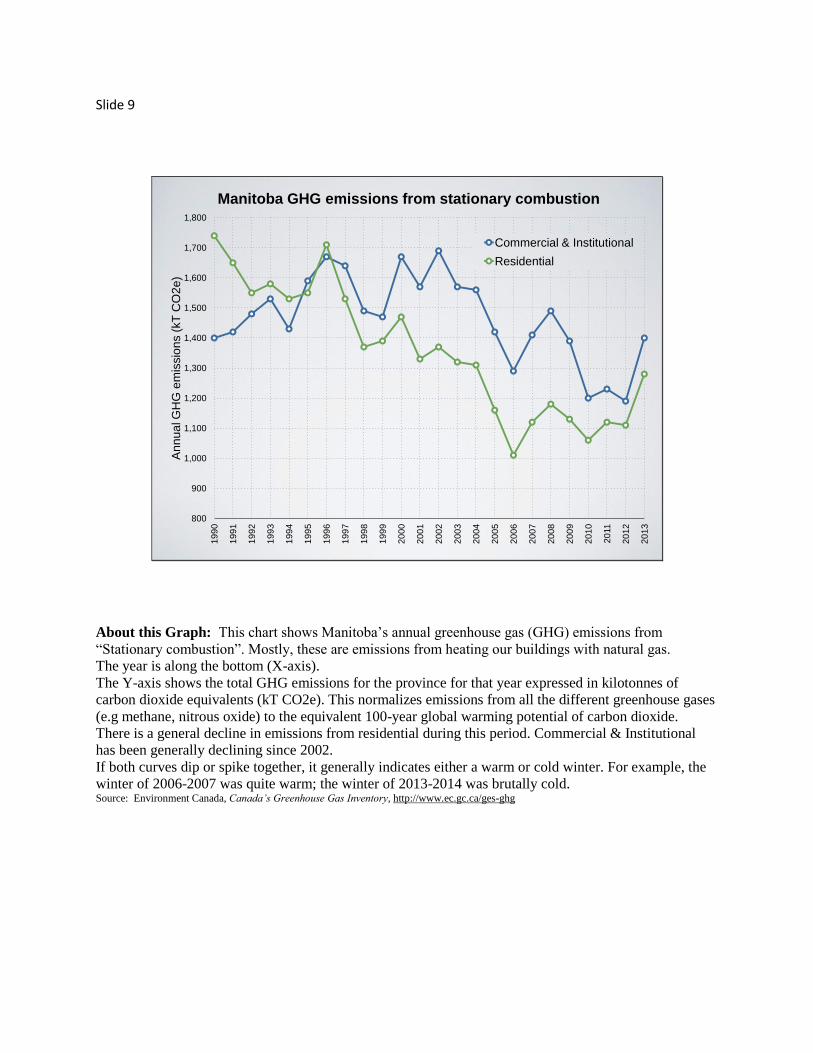
Manitoba GHG emissions from stationary combustion
Commercial & Institutional
Residential
About this Graph: This chart shows Manitoba’s annual greenhouse gas (GHG) emissions from
“Stationary combustion”. Mostly, these are emissions from heating our buildings with natural gas.
The year is along the bottom (X-axis).
The Y-axis shows the total GHG emissions for the province for that year expressed in kilotonnes of
carbon dioxide equivalents (kT CO2e). This normalizes emissions from all the different greenhouse gases
(e.g methane, nitrous oxide) to the equivalent 100-year global warming potential of carbon dioxide.
There is a general decline in emissions from residential during this period. Commercial & Institutional
has been generally declining since 2002.
If both curves dip or spike together, it generally indicates either a warm or cold winter. For example, the
winter of 2006-2007 was quite warm; the winter of 2013-2014 was brutally cold. Source: Environment Canada, Canada’s Greenhouse Gas Inventory, http://www.ec.gc.ca/ges-ghg
Slide 10
WASTE
Slide 11
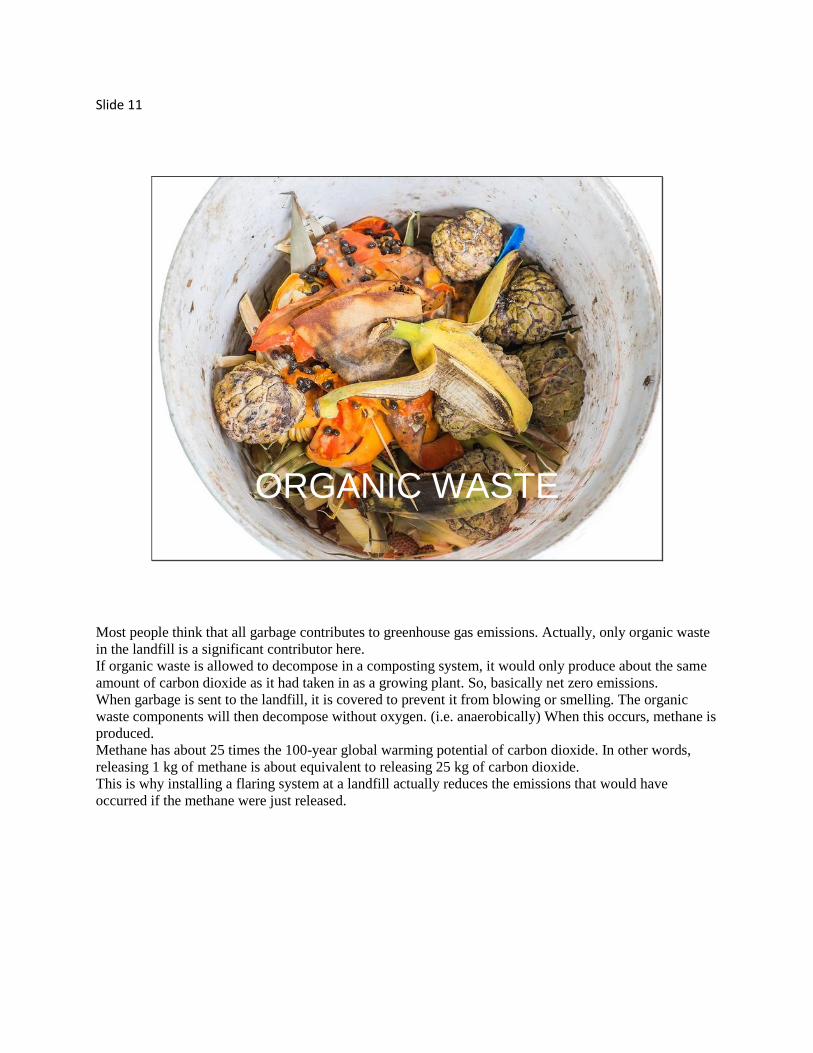
ORGANIC WASTE
Most people think that all garbage contributes to greenhouse gas emissions. Actually, only organic waste
in the landfill is a significant contributor here.
If organic waste is allowed to decompose in a composting system, it would only produce about the same
amount of carbon dioxide as it had taken in as a growing plant. So, basically net zero emissions.
When garbage is sent to the landfill, it is covered to prevent it from blowing or smelling. The organic
waste components will then decompose without oxygen. (i.e. anaerobically) When this occurs, methane is
produced.
Methane has about 25 times the 100-year global warming potential of carbon dioxide. In other words,
releasing 1 kg of methane is about equivalent to releasing 25 kg of carbon dioxide.
This is why installing a flaring system at a landfill actually reduces the emissions that would have
occurred if the methane were just released.
Slide 12
500
600
700
800
900
1,000
1,100
1,2001
99
0
19
91
19
92
19
93
19
94
19
95
19
96
19
97
19
98
19
99
20
00
20
01
20
02
20
03
20
04
20
05
20
06
20
07
20
08
20
09
20
10
20
11
20
12
20
13
An
nu
al G
HG
em
issio
ns (
kT
CO
2e
)
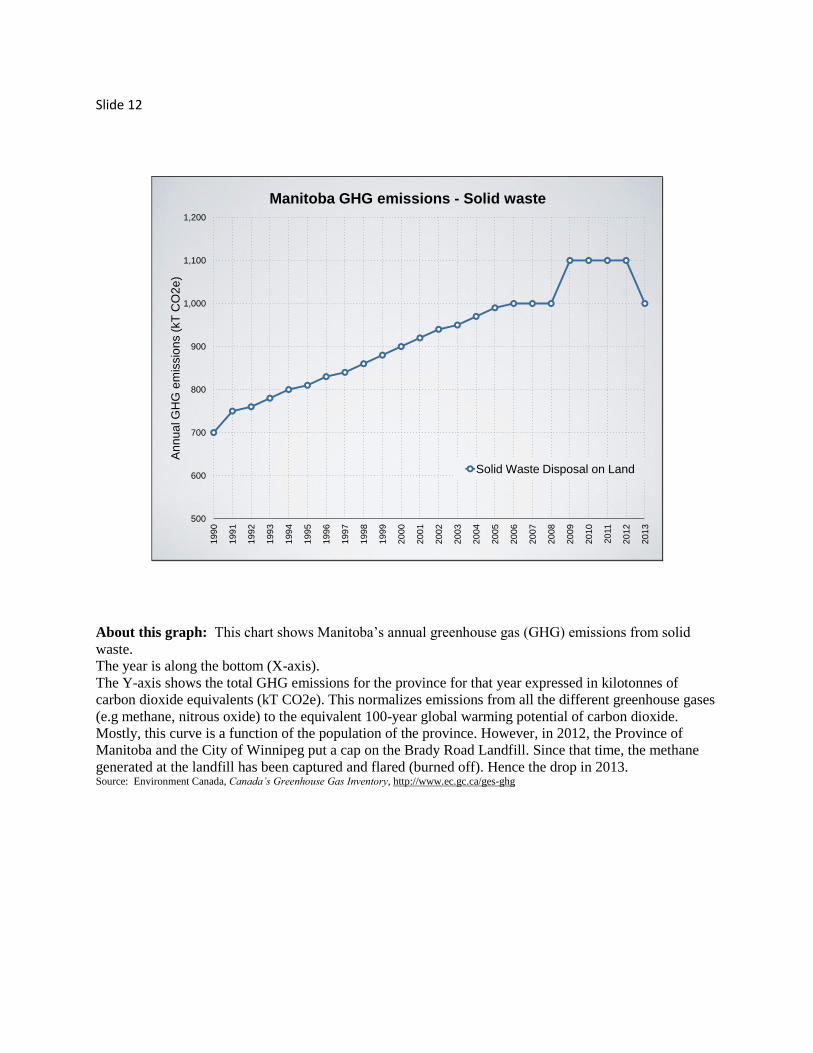
Manitoba GHG emissions - Solid waste
Solid Waste Disposal on Land
About this graph: This chart shows Manitoba’s annual greenhouse gas (GHG) emissions from solid
waste.
The year is along the bottom (X-axis).
The Y-axis shows the total GHG emissions for the province for that year expressed in kilotonnes of
carbon dioxide equivalents (kT CO2e). This normalizes emissions from all the different greenhouse gases
(e.g methane, nitrous oxide) to the equivalent 100-year global warming potential of carbon dioxide.
Mostly, this curve is a function of the population of the province. However, in 2012, the Province of
Manitoba and the City of Winnipeg put a cap on the Brady Road Landfill. Since that time, the methane
generated at the landfill has been captured and flared (burned off). Hence the drop in 2013. Source: Environment Canada, Canada’s Greenhouse Gas Inventory, http://www.ec.gc.ca/ges-ghg
Slide 13
RESILIENCE:
the capacity
to recover quickly
from difficulties
Slide 14
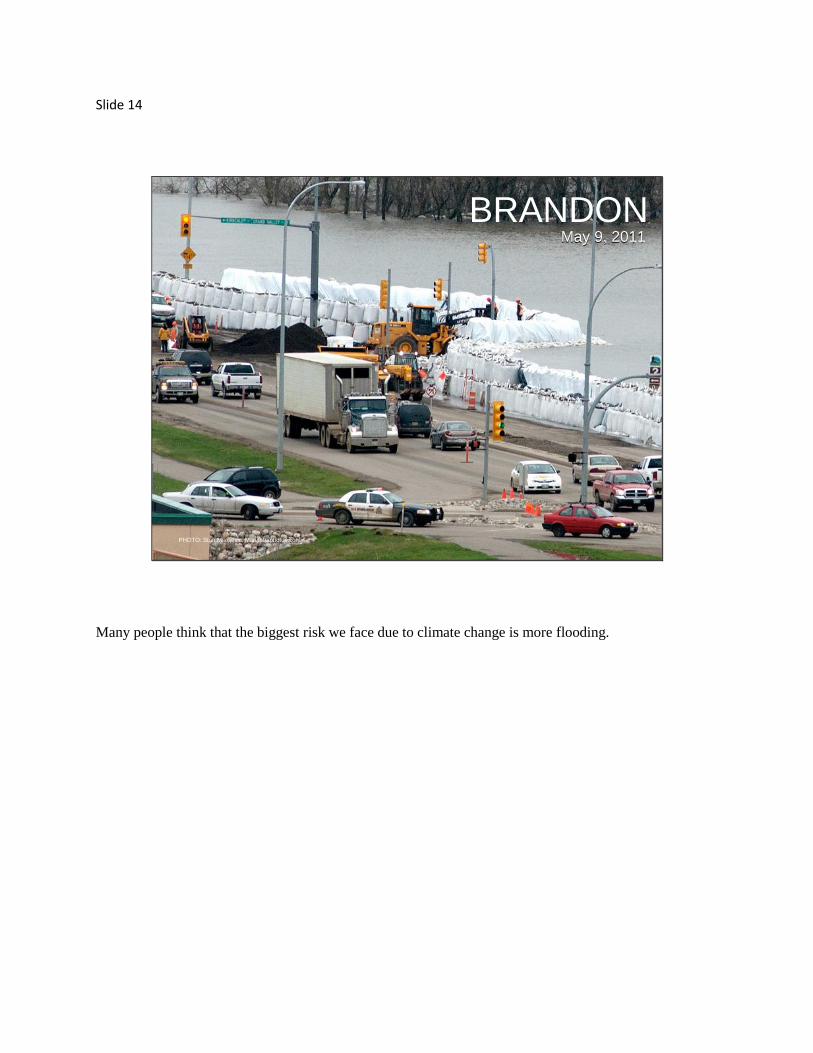
BRANDON
PHOTO: Stan Milosevic, Manitobaphotos.com
May 9, 2011
Many people think that the biggest risk we face due to climate change is more flooding.
Slide 15
$
Although increased flooding due to climate change is a risk Manitobans will face, it is the secondary or
consequential risks that we must also think about and build resistance to mitigate.
One of those consequential risks are impacts of climate change on the global economy.
Slide 16
the ability to meet
our basic needs
ourselves
& without fossil fuel
RESILIENCE:
Even if transportation costs remain low, we may not be able to afford to import as much stuff from far
away if our economy is in contraction.
We need to build our ability to provide more of our essential needs ourselves, from local sources.
Slide 17
BASIC NEEDS
• Water
• Food
• Heat
• Transportation
There is a difference between “wants” and “needs”. Three of the items above are “needs”. Some aspects
of transportation can be considered a “need” but much of our current transportation is to serve our
“wants”.
Slide 18
WATER
• Protect sources
• Reduce usage
Protect sources - We need to protect our sources of water from contamination. This is especially true
during times of flood. Floodwater can contaminate reservoirs and aquifers.
Reduce usage - We currently use drinking water unnecessarily such as for flushing toilets and washing
cars. We should consider adjusting building codes and permitting to allow these alternatives:
• Composting toilets - Perhaps there could be new business opportunities for companies to perform
periodic service on composting systems
• Grey water / Rainwater - An alternative to composting toilets might use grey water or rainwater for
flushing
Slide 19
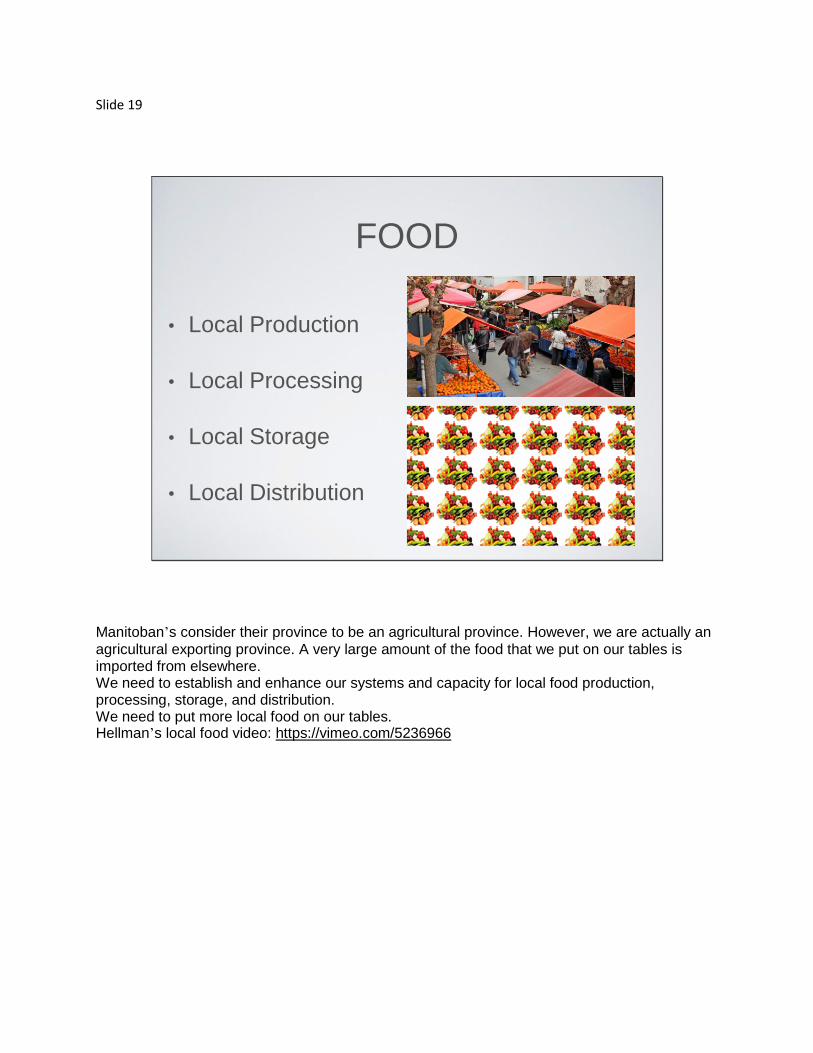
FOOD
• Local Production
• Local Processing
• Local Storage
• Local Distribution
Manitoban’s consider their province to be an agricultural province. However, we are actually an
agricultural exporting province. A very large amount of the food that we put on our tables is imported from elsewhere. We need to establish and enhance our systems and capacity for local food production, processing, storage, and distribution. We need to put more local food on our tables. Hellman’s local food video: https://vimeo.com/5236966
Slide 20
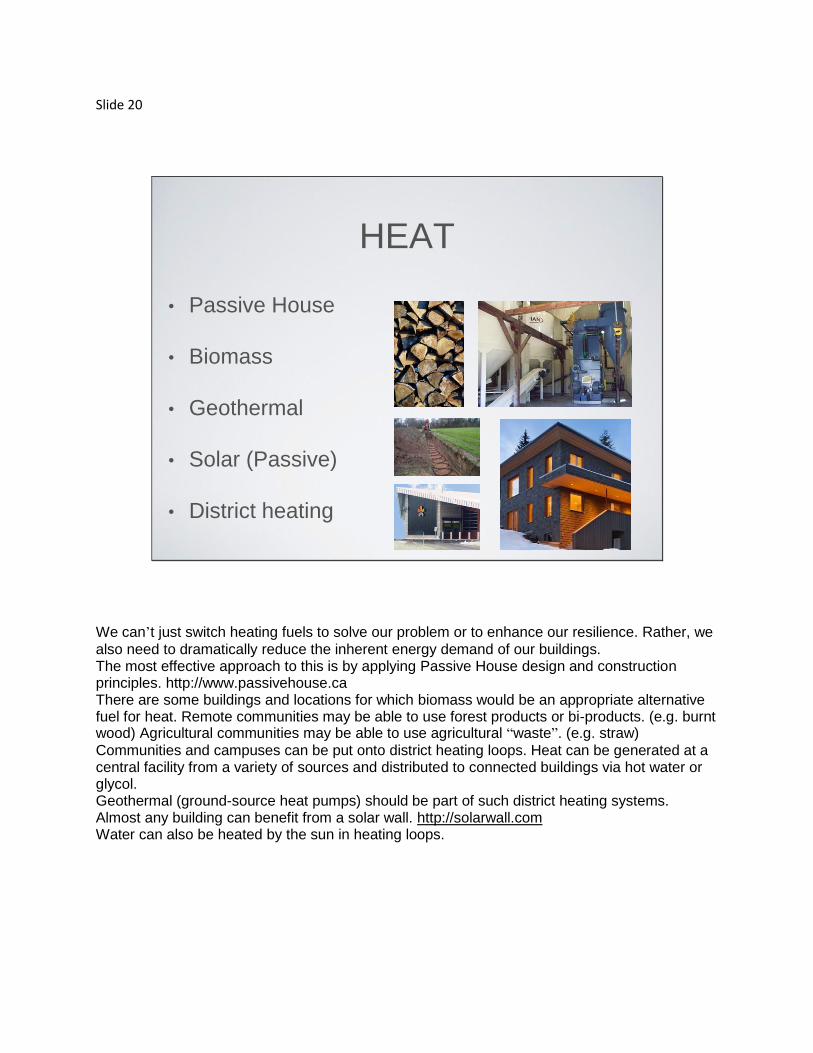
HEAT
• Passive House
• Biomass
• Geothermal
• Solar (Passive)
• District heating
We can’t just switch heating fuels to solve our problem or to enhance our resilience. Rather, we
also need to dramatically reduce the inherent energy demand of our buildings. The most effective approach to this is by applying Passive House design and construction principles. http://www.passivehouse.ca There are some buildings and locations for which biomass would be an appropriate alternative fuel for heat. Remote communities may be able to use forest products or bi-products. (e.g. burnt wood) Agricultural communities may be able to use agricultural “waste”. (e.g. straw)
Communities and campuses can be put onto district heating loops. Heat can be generated at a central facility from a variety of sources and distributed to connected buildings via hot water or glycol. Geothermal (ground-source heat pumps) should be part of such district heating systems. Almost any building can benefit from a solar wall. http://solarwall.com Water can also be heated by the sun in heating loops.
Slide 21
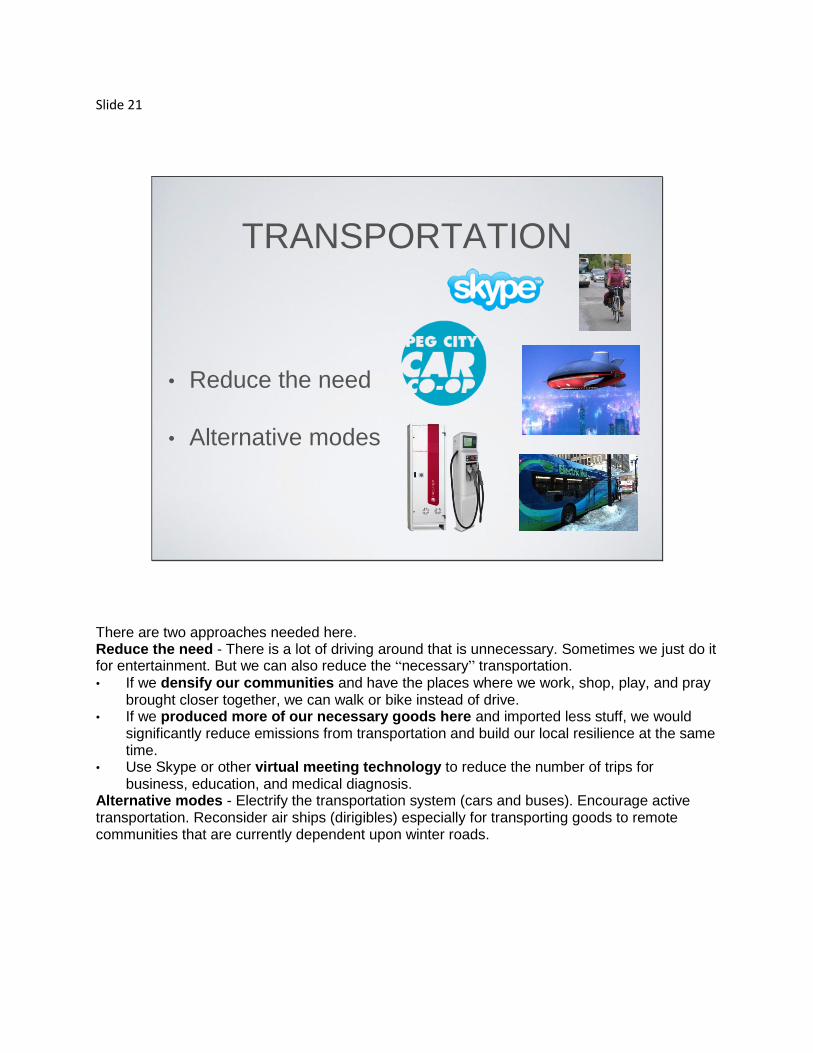
TRANSPORTATION
• Reduce the need
• Alternative modes
There are two approaches needed here. Reduce the need - There is a lot of driving around that is unnecessary. Sometimes we just do it for entertainment. But we can also reduce the “necessary” transportation. • If we densify our communities and have the places where we work, shop, play, and pray
brought closer together, we can walk or bike instead of drive. • If we produced more of our necessary goods here and imported less stuff, we would
significantly reduce emissions from transportation and build our local resilience at the same time.
• Use Skype or other virtual meeting technology to reduce the number of trips for business, education, and medical diagnosis.
Alternative modes - Electrify the transportation system (cars and buses). Encourage active transportation. Reconsider air ships (dirigibles) especially for transporting goods to remote communities that are currently dependent upon winter roads.

Slide 22
WHAT CAN I DO?
Slide 23
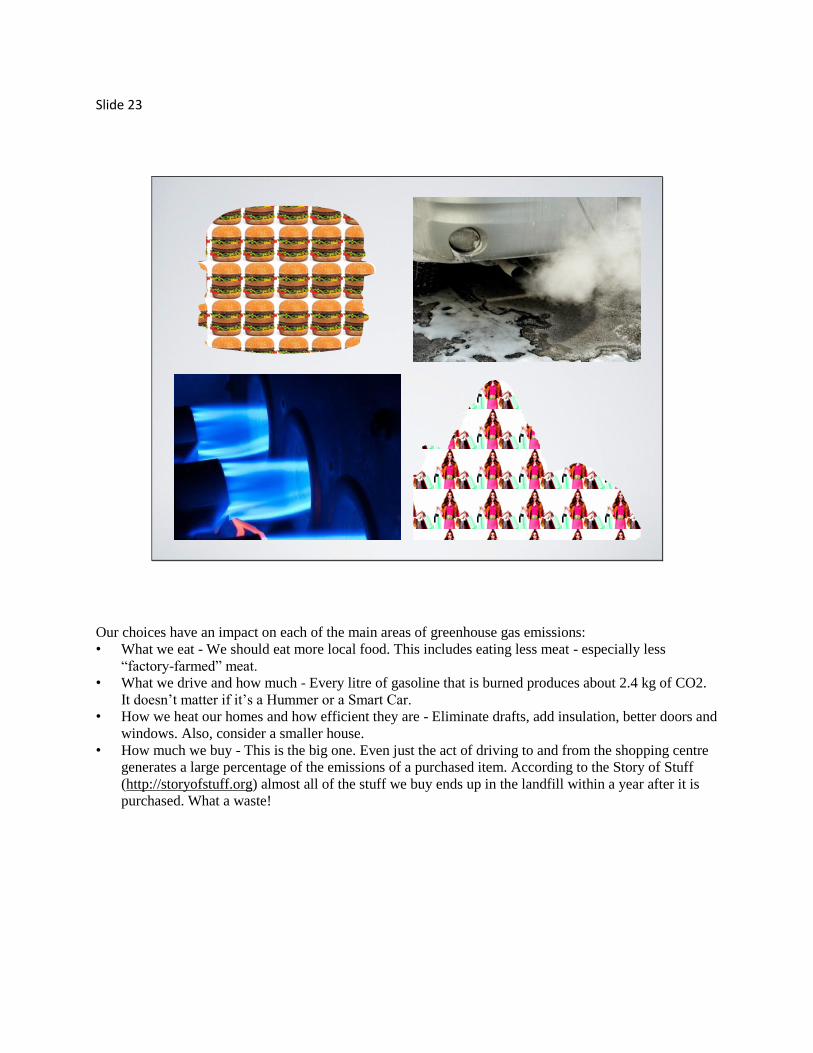
Our choices have an impact on each of the main areas of greenhouse gas emissions:
• What we eat - We should eat more local food. This includes eating less meat - especially less
“factory-farmed” meat.
• What we drive and how much - Every litre of gasoline that is burned produces about 2.4 kg of CO2.
It doesn’t matter if it’s a Hummer or a Smart Car.
• How we heat our homes and how efficient they are - Eliminate drafts, add insulation, better doors and
windows. Also, consider a smaller house.
• How much we buy - This is the big one. Even just the act of driving to and from the shopping centre
generates a large percentage of the emissions of a purchased item. According to the Story of Stuff
(http://storyofstuff.org) almost all of the stuff we buy ends up in the landfill within a year after it is
purchased. What a waste!

Slide 24
SUPPORT
This is another big one. We must support our leaders when they introduce measures to achieve all of these
things. Some of these measures (like putting a price on carbon) may seem like they are adding costs but
we should consider them to be investments in the future.