slide en update q4.2016 usd
28
IR Presentation Quarter IV - 2016 (Exchange rate: 22,159 VND/USD) Improving the values of life
Transcript of slide en update q4.2016 usd
IR Presentation
Quarter IV - 2016(Exchange rate: 22,159 VND/USD)
Improving the values of life
Table of contents1. General information
2. Investment highlights
3. Performance
1. General information Important Milestones Corporate Vision & Strategic Objectives Organization Structure Awards

VietinBank Overview
Vietnam Joint Stock Commercial Bank for Industry and Trade (VietinBank) is a leading financial and banking group, plays a key role in Vietnamese financial-banking system.
1988 Established upon the separation from The State Bank of Vietnam (SBV).
2008 Went public through IPO and listed on Hochiminh Stock Exchange (HOSE) one year later
2009 Officially renamed into Vietnam Joint Stock Commercial Bank for Industry and Trade (or VietinBank in short)
2011 IFC officially became the foreign strategic shareholder of VietinBank with 10% stake ownership
2012
Became the first bank in Vietnam to successfully issue USD250mil international bond listed on Singapore Exchange
Sold 19.73% stake to Bank of Tokyo-Mitsubishi UFJ (BTMU) as a second foreign strategic shareholder.
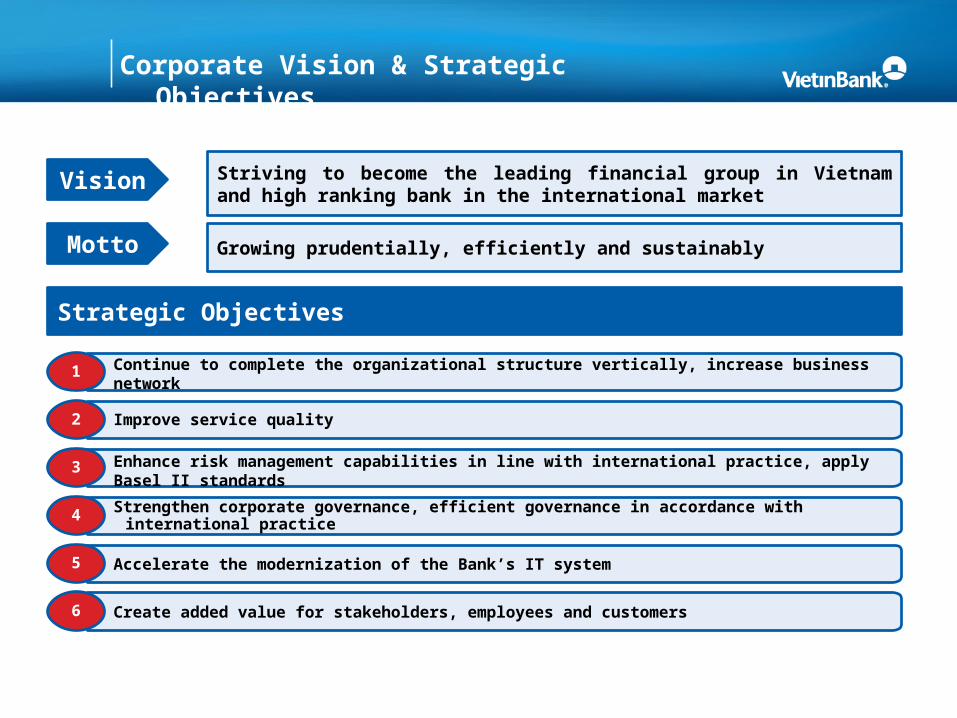
Corporate Vision & Strategic Objectives
Continue to complete the organizational structure vertically, increase business network1
Improve service quality2
Enhance risk management capabilities in line with international practice, apply Basel II standards3
Strengthen corporate governance, efficient governance in accordance with international practice4
Accelerate the modernization of the Bank’s IT system5
Create added value for stakeholders, employees and customers6
Vision Striving to become the leading financial group in Vietnam and high ranking bank in the international market
Strategic Objectives
Motto Growing prudentially, efficiently and sustainably

Strong operational structure
Head Office
VietinBank Laos Limited
Branches Representative Offices Non-profit Making Units
Subsidiarires and Associated Companies
Transaction Offices
Indovina Joint Venture Bank
Saving Offices
Non financial SubsidiariresFinancial Subsidiarires and Associated Companies
VietinBank Securities
JSC
VietinBank Fund
Management Company Ltd.
VietinBank Leasing
Company Ltd.
VietinBank Global Money
Transfer Company Ltd.
VietinBank Insurance
Company Ltd.
VietinBank Aviva Life Insurance
Company Ltd.
VietinBank Gold and Jewelry
Trading company Ltd .
VietinBank Debt and Asset
Management Company Ltd.
InsuranceOther Financial Services
Investment Bank
Commercial Bank

Solid management structure and governance
Supervisory Board
Board of Directors
Board of Management
Internal AuditCommittees:1. HR and Remuneration
Committee2. Assets and Liabilities
Management Committee3. Risk Management Committee4. Policy Committee
Corporate Banking Division
Retail Banking Division
General Shareholder s’ Meeting
Secretariat to the Board
Credit CommitteeFinancial Institutions Committee Payment Committee
Branches
Subsidiarires
Functional departments at Head Office and Branch Network
Risk Management
Division
Credit Approval Division
Human Resources Division
Treasury & Capital Markets Division
Information Technology
Division
Operation Division
Branding and Communications
Division
Other Department

Awards and accolades
VietinBank at the 5th place of Top 10 Vietnam Corporations of largest Income Tax Contribution. At the same time, VietinBank is the leading bank among 9 banks that was named in Top 50 Corporations of Highest Income Tax Contribution.
Our strength in technology advancement was honoured by Khue Star Award for three innovative products including Assets & Liabilities Management System, VietinBank iPay app for smart phones and non-cash payment service for hospital bills.
VietinBank is the only corporation in financial & banking industry that was named in Top 10 of Vietnam Gold Star Award.
VietinBank was the only Vietnamese banks in Global 400 with total brand value worth of USD 249 million; the only bank in Top 10 most valuable Vietnamese’s brands in 2016; highest growth brand.
VietinBank gained the best retail banking awards in Viet Nam for 2016.
VietinBank was named in Forbes Global 2000 for the fourth consecutive years.
VietinBank is the only bank that was recognized as “Best Information Security Bank in 2015”.
Top 3 payment award by Visa in 2015 and Top 3 highest transactions of MasterCard in 2014 - 2015.
Top 50 Vietnam Best Growth for 2009 -2014 period and Top 20 of 500 Largest Companies (VNR500) which was presented by Vietnam Report.
VietinBank is the 1st Vietnamese bank to achieve award as best supplier of trade finance activities, along with international famous banks in Asia, such as BTMU, JP Morgan Chase, Citibank, Standard Chartered, HSBC.
2. Investment highlights Chartered Capital, Total Equity and Total Asset Market Share Network Brand name & Client base Shareholder support Corporate governance and HR
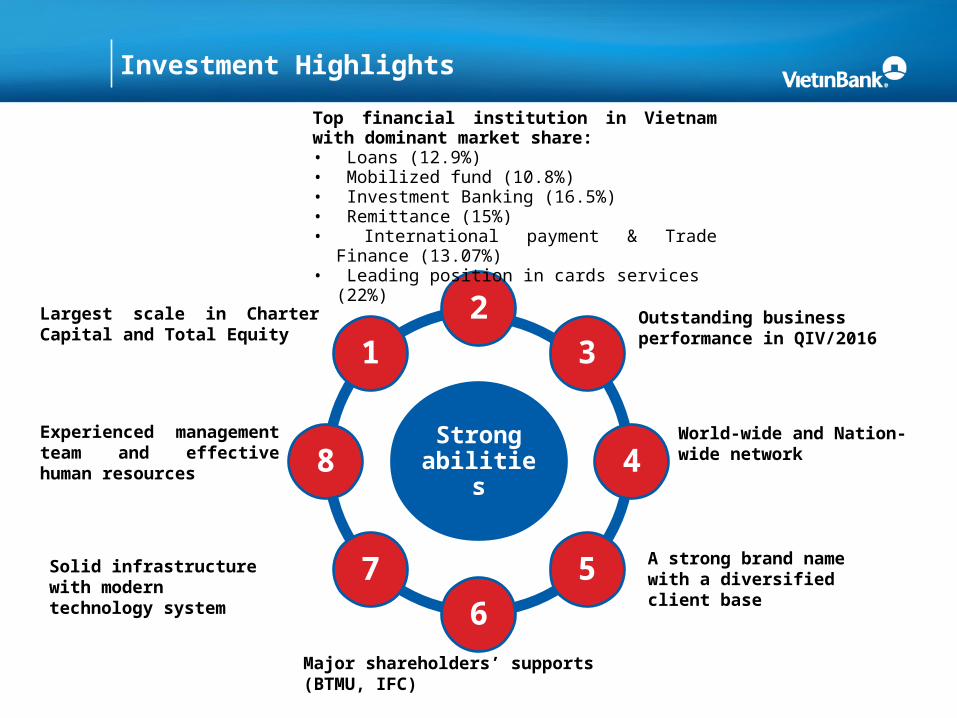
Strong abilities
23
4
56
7
8
1
Top financial institution in Vietnam with dominant market share: • Loans (12.9%)• Mobilized fund (10.8%)• Investment Banking (16.5%)• Remittance (15%)• International payment & Trade Finance (13.07%)• Leading position in cards services (22%)
Outstanding business performance in QIV/2016
World-wide and Nation-wide network
Largest scale in Charter Capital and Total Equity
Experienced management team and effective human resources
A strong brand name with a diversified client base
Major shareholders’ supports (BTMU, IFC)
Solid infrastructure with modern technology system
Investment Highlights
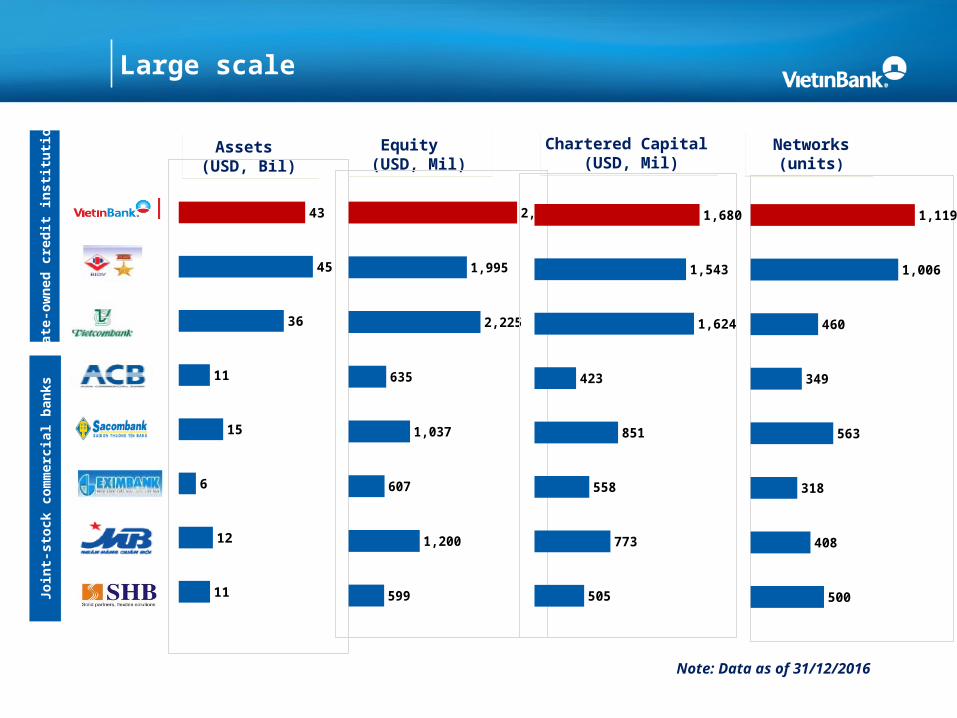
Large scale
Assets (USD, Bil)
Equity (USD, Mil)
Chartered Capital (USD, Mil)
Networks(units)
Stat
e-ow
ned
cred
it in
stitu
tions
Join
t-sto
ck c
omm
erci
al b
anks
11
12
6
15
11
36
45
43
599
1,200
607
1,037
635
2,225
1,995
2,842
505
773
558
851
423
1,624
1,543
1,680
500
408
318
563
349
460
1,006
1,119
Note: Data as of 31/12/2016

Network Overview
Presence across the nation:• 01 Head Office in Hanoi• 02 Representative offices in Da Nang and Ho Chi
Minh City• 155 Local branches, 961 transaction offices and
savings offices in all cities and provinces• 03 Functional units• 07 Subsidiaries (insurance, securities, financial
leasing, fund management, assets management, gold and jewelry, global money transfer)
• 02 Joint-venture companies (Indovina Bank & VietinBank Aviva Insurance Company)
• Nearly 2000 ATMs
Foreign expansion:• 01 Branch in Frankfurt, Germany• 01 Branch in Berlin, Germany• 01 Subsidiary in Laos (VietinBank Lao Ltd)• 01 Representative office in Myanmar
VietinBank has established banking relationships with 1000 banks in 90 countries and territories all over the world
Head Office in Ha Noi
3 Representative offices
155 branches, 961 transaction
offices and savings counters
2 Joint-Venture Companies
8 Subsidiaries
3 non-profit making units
North
Head Office 73 Branches
Central
29 Branches
South
53 Branches
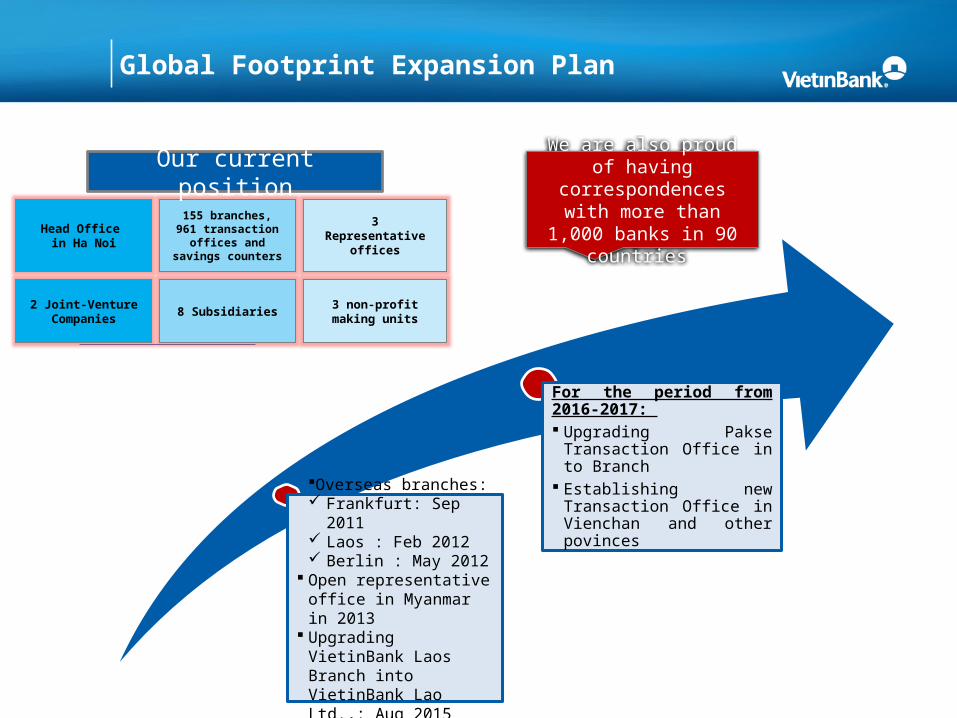
Global Footprint Expansion Plan
Head Office in Ha Noi
155 branches,961 transaction
offices and savings counters
3Representative
offices
2 Joint-Venture Companies 8 Subsidiaries 3 non-profit making
units
Our current position We are also proud of having correspondences
with more than 1,000 banks in 90 countries
Overseas branches: Frankfurt: Sep 2011 Laos : Feb 2012 Berlin : May 2012
Open representative office in Myanmar in 2013
Upgrading VietinBank Laos Branch into VietinBank Lao Ltd.,: Aug 2015
For the period from 2016-2017: Upgrading Pakse
Transaction Office in to Branch
Establishing new Transaction Office in Vienchan and other povinces

Reputable & Diversified Corporate Customer
VietinBank has fostered strong banking relationships with some of the most well-established corporates in Vietnam as well as SMEs, FDI & retail clients.

Structure of ownership
Major Shareholders’ stakes
Shareholder
VietnameseGovernment
IFC
BTMU
Support
Government owns 64.46% of VietinBank’s Charter Capital. Government ownership ratio will not fall below 51% at any time.
The majority of Board of Director’s members are appointed by the Government.
Cooperation Agreement with IFC covers: Risk management Banking services for SMEs Energy Efficiency Project Information technology
Technical Assistance & Business Collaboration Agreement with BTMU covers: Risk management & Basel II Implementation Information technology Investment banking Retail and SMEs banking Cash collection and settlement service
64.46%
19.73%
8.03%7.78%
State Bank of Vietnam BTMU
IFC Others
Major shareholders’ supports

2016’s strategic objectives
Strengthen capital base to enhance financial strength (CAR>9%, ROE in the range of 10-11% and ROA in the range of 0.9-1.2%)
Focus on Commercial Banking and Investment Banking pillars
Enlarge the retail banking business
Improve service quality to increase the portion of non-interest income
Focus on risk management: NPL ratio/total credit exposure <3.0%
Expand market and client base to increase market share.
Expand distribution network both domestically and internationally
Dividend: 7-9%Continues to consolidate organizational structure and operating model
Growth: Assets: 14% Mobilized fund: 14% Credit: 18%

3. Performance
Stable deposits growth & high liquidity High credit growth, well controlled NPL ratio Safe & diversified securities portfolio Strong financial results Efficient subsidiaries CTG Stock Performance

Stable deposits growth
Mobilized Fund structure (USD, Mil) Deposits of customers & credit institutions (USD, Mil)
Inner ring: As at 31 Dec 2015: USD 32,517 MilOuter ring: As at 31 Dec 2016: USD 39,262 Mil
1.86%
14%
69%
8%3%
4%
0.55%
10%
75%
1%3%
11%
Due to Gov and SBVDeposits & borrowing from other banksCustomer DepositsSponsor capital, Entrusted InvestmentValue paper issuedOther mobilized funds
2011 2012 2013 2014 2015 QI/2016
QII/2016
QIII/2016
QIV/2016
0
5,000
10,000
15,000
20,000
25,000
30,000
35,000
12,05013,568
17,156 19,95722,520
23,033
26,35128,497
29,5333,366
4,572
3,796
4,895
4,530 4,779
4,0283,069
3,843
Deposit &borrowing from other banksCustomer Deposits
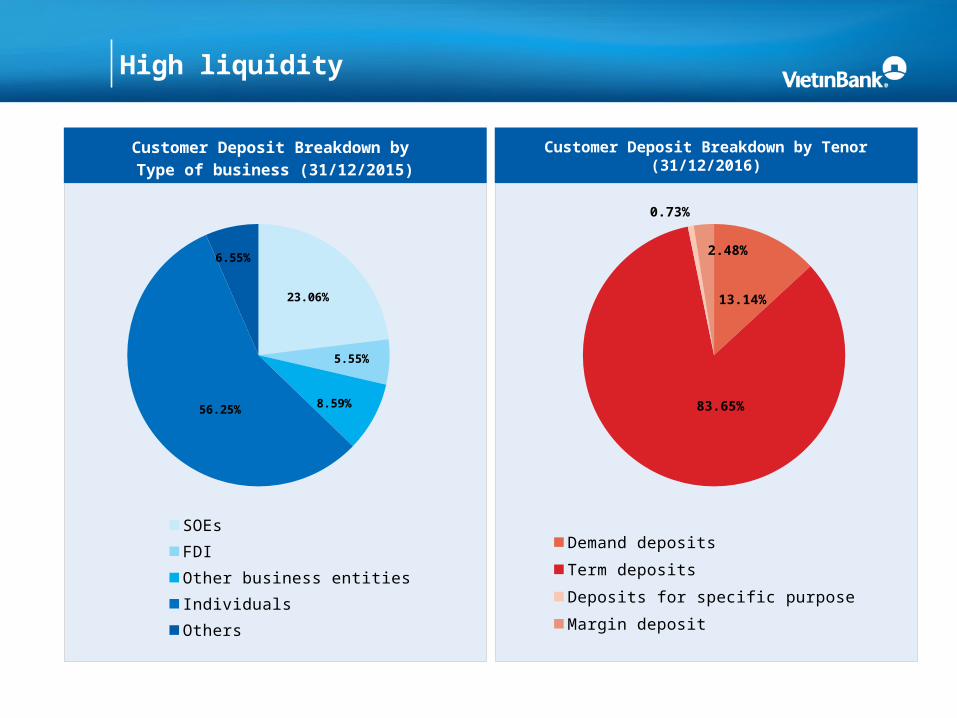
High liquidity
Customer Deposit Breakdown by Type of business (31/12/2015)
Customer Deposit Breakdown by Tenor (31/12/2016)
13.14%
83.65%
0.73%
2.48%
Demand deposits Term deposits
Deposits for specific purpose Margin deposit
23.06%
5.55%
8.59%56.25%
6.55%
SOEs FDI Other business entities
Individuals Others
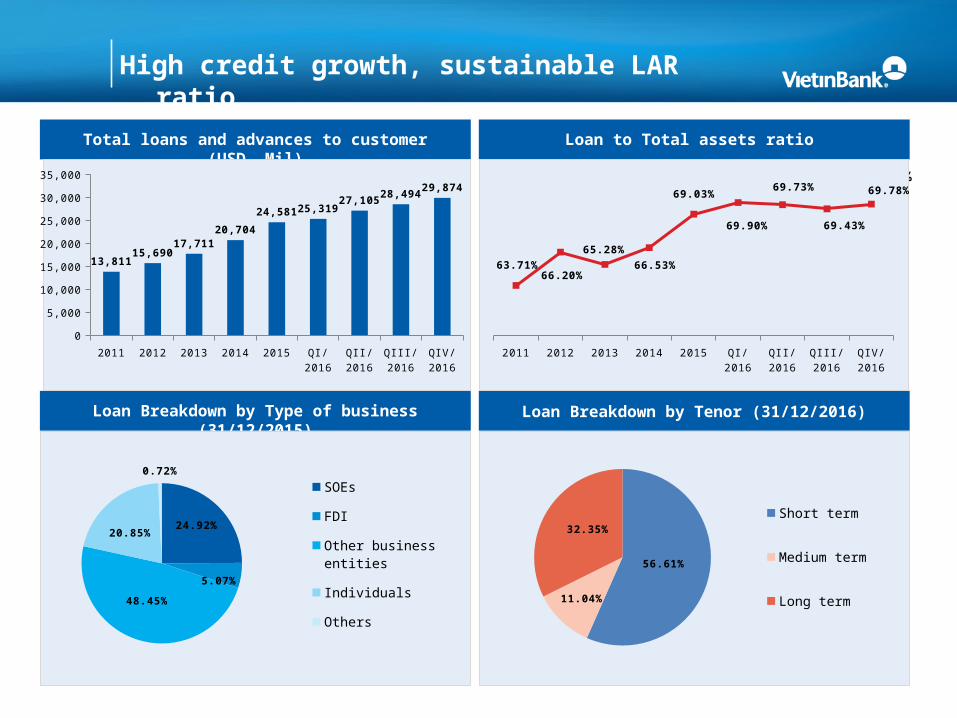
High credit growth, sustainable LAR ratio
Total loans and advances to customer (USD, Mil)
Loan Breakdown by Type of business (31/12/2015)
Loan to Total assets ratio
Loan Breakdown by Tenor (31/12/2016)
2010 2011 2012 2013 2014 1Q2015 2Q2015
63.69% 63.71%
66.20%65.28%
66.53%
69.69% 70.08%
56.61%
11.04%
32.35%Short term
Medium term
Long term
24.92%
5.07%
48.45%
20.85%
0.72%
SOEs
FDI
Other business entities
Individuals
Others
2011 2012 2013 2014 2015 QI/2016 QII/2016 QIII/2016
QIV/2016
63.71%66.20%
65.28%66.53%
69.03%
69.90%
69.73%
69.43%
69.78%
2011 2012 2013 2014 2015 QI/2016 QII/2016
QIII/2016
QIV/2016
0
5,000
10,000
15,000
20,000
25,000
30,000
35,000
13,81115,690
17,71120,704
24,581 25,31927,105 28,494 29,874
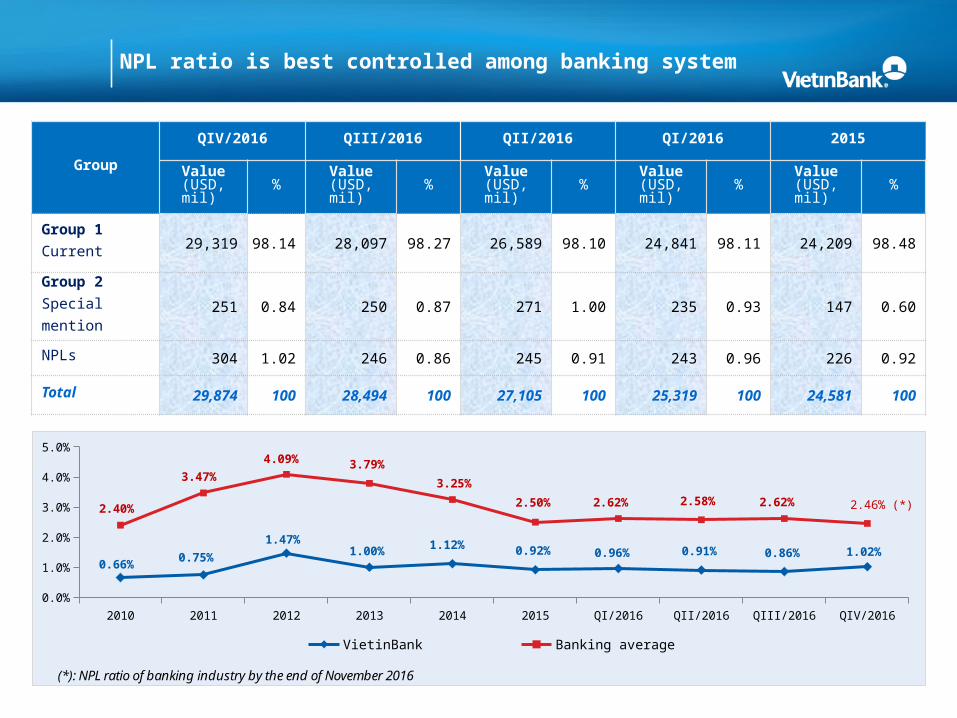
NPL ratio is best controlled among banking system
Group
QIV/2016 QIII/2016 QII/2016 QI/2016 2015
Value(USD, mil) % Value
(USD, mil) % Value(USD, mil) % Value
(USD, mil) % Value(USD, mil) %
Group 1Current 29,319 98.14 28,097 98.27 26,589 98.10 24,841 98.11 24,209 98.48
Group 2Special mention 251 0.84 250 0.87 271 1.00 235 0.93 147 0.60
NPLs 304 1.02 246 0.86 245 0.91 243 0.96 226 0.92
Total 29,874 100 28,494 100 27,105 100 25,319 100 24,581 100
2010 2011 2012 2013 2014 2015 QI/2016 QII/2016 QIII/2016 QIV/20160.0%0.5%1.0%1.5%2.0%2.5%3.0%3.5%4.0%4.5%
0.66% 0.75%1.47%
1.00% 1.12% 0.92% 0.96% 0.91% 0.86% 1.02%
2.40%
3.47%4.09% 3.79%
3.25%
2.50% 2.62% 2.58% 2.62% 2.46% (*)
VietinBank Banking average
(*): NPL ratio of banking industry by the end of November 2016

• VietinBank has a robust credit systems, clearly defining relevant exposure limits and credit risk appetite
• Such systems are enhanced by a strong credit culture, benefiting from well-defined delegations of authority and reporting lines
Robust Credit Systems
• Loans and advances are relatively well allocated according to business entities & industry sectors, ensuring a high degree of diversification of potential risks
• The credit policy has put in place strict exposure credit limits
Well Defined Sectoral, Single Party and Group Exposure
Credit Limits
• Comprehensive and detailed loan classification and provisioning requirements and policies are in place, in consistent with regulatory norms and guidelines
• Existence of robust procedures have resulted in positive developments in non-performing asset measures in recent times
Comprehensive Loan Classification and Provisioning
Requirements
• Strong Credit risk management system is in place which has ensured improvement in the asset quality in this growing economic environment
Strong Credit Risk Management System
Asset Quality Management

Safe & diversified securities portfolio
Components of Investment portfolioInvestment portfolio (USD, Mil)
2011 2012 2013 2014 2015 QI/2016
QII/2016
QIII/2016
QIV/2016
0%
5%
10%
15%
20%
25%
30%
35%
0
2,000
4,000
6,000
8,000
10,000
12,000
6,433 6,332
7,539
8,3278,915 8,470
9,283
10,32010,694
29.7%
26.7%
27.8%26.8%
28.5%
23.4%23.9%
25.1% 25.0%
Total investment Investment to total asset ratio
34%
64%
0.23%
2%
40%
58%
0.46%
1%
Interbank Debt securities Equity securities
Long-term investments
Inner ring: As at 31 Dec 2015Outer ring: As at 31 Dec 2016
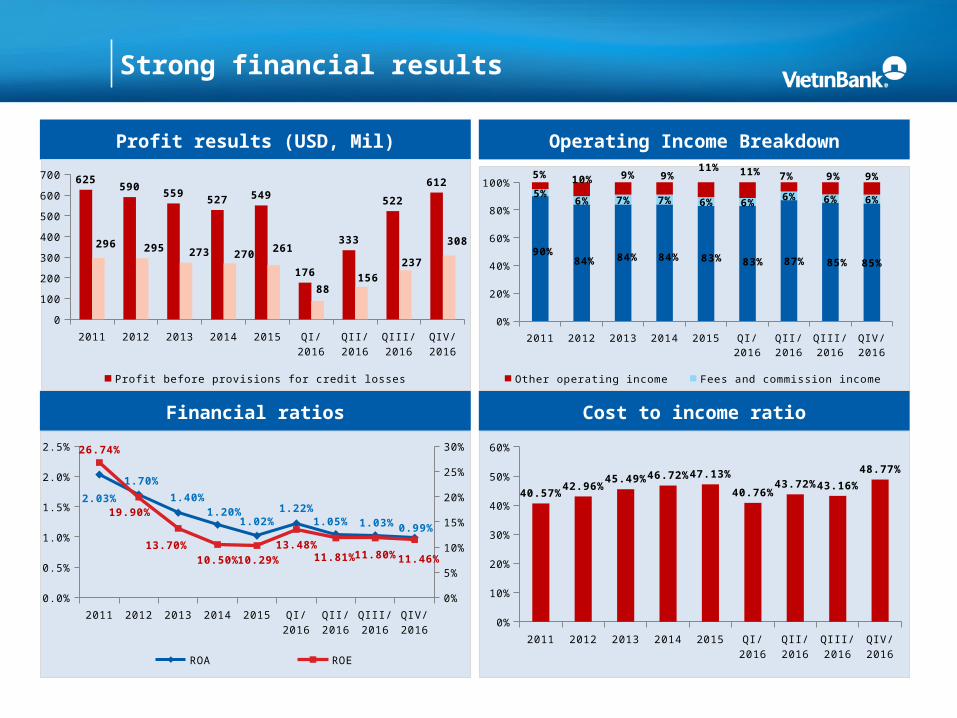
Strong financial results
Profit results (USD, Mil)
Financial ratios
Operating Income Breakdown
Cost to income ratio
2011 2012 2013 2014 2015 QI/2016 QII/2016
QIII/2016
QIV/2016
0
100
200
300
400
500
600
700 625 590 559 527 549
176
333
522612
296 295 273 270 261
88156
237
308
Profit before provisions for credit losses Profit after tax
2011 2012 2013 2014 2015 QI/2016
QII/2016
QIII/2016
QIV/2016
0.0%
0.5%
1.0%
1.5%
2.0%
2.5%
0%
5%
10%
15%
20%
25%
30%
2.03%1.70%
1.40%1.20%
1.02%1.22%
1.05% 1.03% 0.99%
26.74%
19.90%
13.70%10.50% 10.29%
13.48%11.81% 11.80% 11.46%
ROA ROE
2011 2012 2013 2014 2015 QI/2016 QII/2016
QIII/2016
QIV/2016
0%
20%
40%
60%
80%
100%
90%84% 84% 84% 83% 83% 87% 85% 85%
5%6% 7% 7% 6% 6% 6% 6% 6%
5% 10% 9% 9%11% 11% 7% 9% 9%
Other operating income Fees and commission income Net interest income
2011 2012 2013 2014 2015 QI/2016 QII/2016
QIII/2016
QIV/2016
0%
10%
20%
30%
40%
50%
60%
40.57% 42.96% 45.49% 46.72% 47.13%40.76%
43.72% 43.16%48.77%
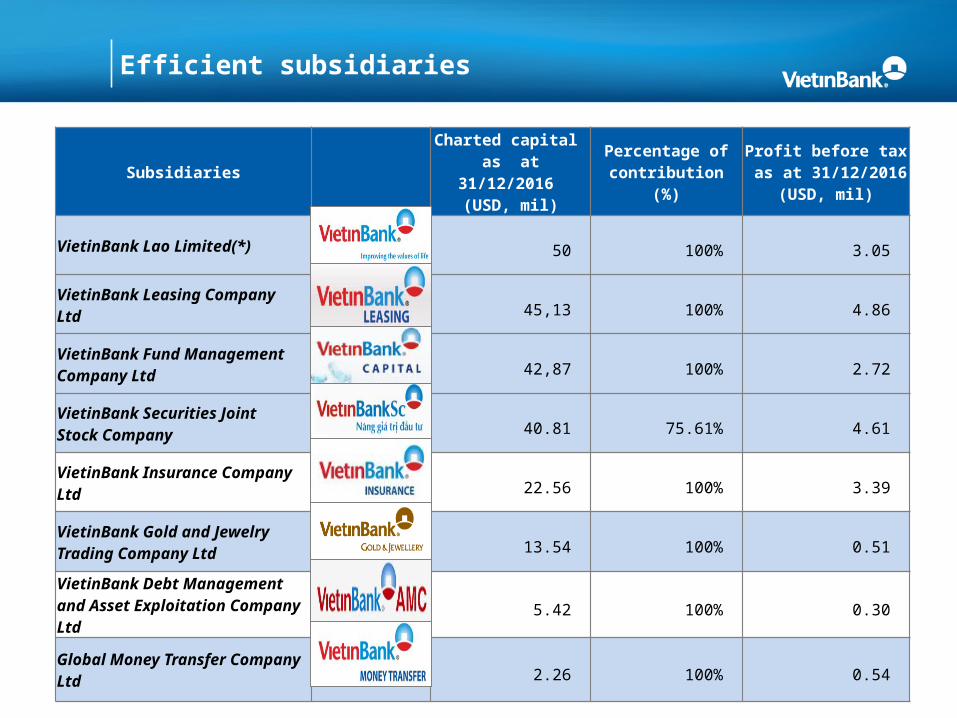
Efficient subsidiaries
SubsidiariesCharted capital
as at 31/12/2016 (USD, mil)
Percentage of contribution
(%)
Profit before tax as at 31/12/2016
(USD, mil)
VietinBank Lao Limited(*) 50 100% 3.05
VietinBank Leasing Company Ltd 45,13 100% 4.86
VietinBank Fund Management Company Ltd 42,87 100% 2.72
VietinBank Securities Joint Stock Company 40.81 75.61% 4.61
VietinBank Insurance Company Ltd 22.56 100% 3.39
VietinBank Gold and Jewelry Trading Company Ltd 13.54 100% 0.51
VietinBank Debt Management and Asset Exploitation Company Ltd
5.42 100% 0.30
Global Money Transfer Company Ltd 2.26 100% 0.54
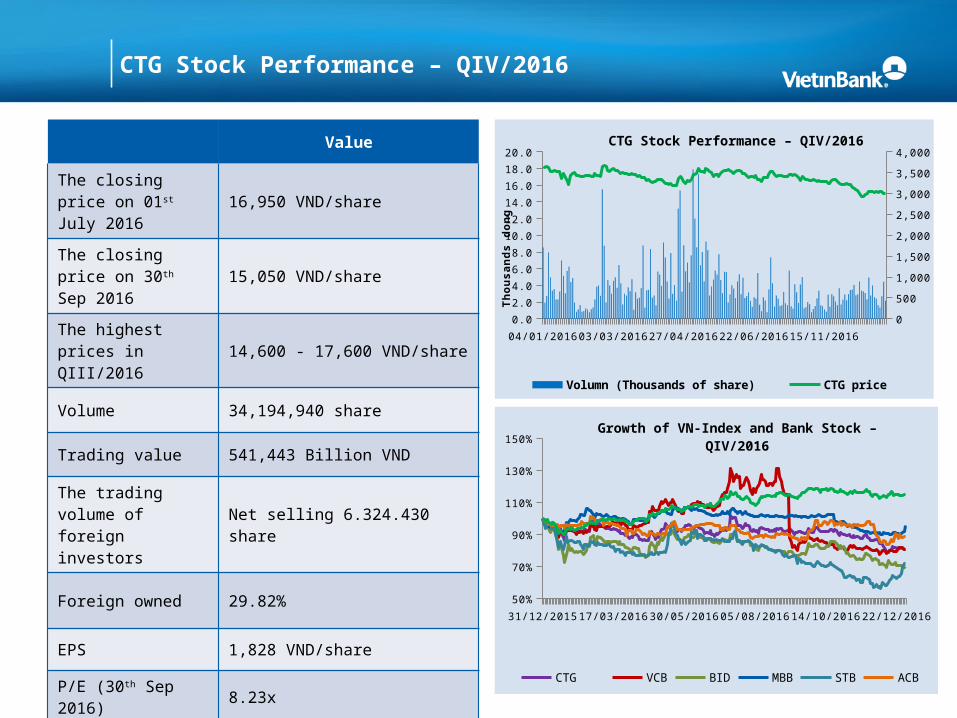
CTG Stock Performance – QIV/2016
Value
The closing price on 01st July 2016 16,950 VND/share
The closing price on 30th Sep 2016 15,050 VND/share
The highest prices in QIII/2016 14,600 - 17,600 VND/share
Volume 34,194,940 share
Trading value 541,443 Billion VND
The trading volume of foreign investors Net selling 6.324.430 share
Foreign owned 29.82%
EPS 1,828 VND/share
P/E (30th Sep 2016) 8.23x
BVPS 16,913 VND/share
P/B (30th Sep 2016) 0.89x
31/12/201502/03/201626/04/201621/06/201612/08/201606/10/201629/11/201650%
70%
90%
110%
130%
150%Growth of VN-Index and Bank Stock – QIV/2016
CTG VCB BID MBB STB ACBVNIndex
04/01/2016 22/02/2016 04/04/2016 19/05/2016 30/09/2016 11/11/2016 23/12/20160.02.04.06.08.0
10.012.014.016.018.020.0
0
500
1,000
1,500
2,000
2,500
3,000
3,500
4,000CTG Stock Performance – QIV/2016
Volumn (Thousands of share) CTG price
Thou
sand
s do
ng

Website for investorshttp://investor.vietinbank.vn
For further information, please contact:
Board of Director SecretariatsVietinBankAddress: 108 Tran Hung Dao street, Hanoi, Vietnam. Email: [email protected] Tel: 84-4-3 941 3622
Thank you!
Disclaimer : This presentation is prepared by using financial reports and other reliable sources with the aims to provide
information only. Readers should use this presentation as a reference source. The information might be updated from time to time and we have no responsibility to notify about that change.


![Fact Sheet, IFRS - INR Press Release & IFRS - USD Press Release [Company Update]](https://static.fdocuments.us/doc/165x107/577cb41a1a28aba7118c4d8c/fact-sheet-ifrs-inr-press-release-ifrs-usd-press-release-company-update.jpg)