Slide Deck from Public Webinar | Mass.gov - Massachusetts
31
2050 Roadmap: Building Solutions to Address Climate Change in the Commonwealth Presenters: Claire Miziolek, Decarbonization Roadmap Manager Hong-Hanh Chu, GWSA Program Manager Benjamin Miller, Decarbonization Roadmap Technical Lead
Transcript of Slide Deck from Public Webinar | Mass.gov - Massachusetts

2050 Roadmap:Building Solutions to Address Climate Change
in the CommonwealthPresenters:
Claire Miziolek, Decarbonization Roadmap Manager
Hong-Hanh Chu, GWSA Program Manager
Benjamin Miller, Decarbonization Roadmap Technical Lead
Agenda
2
Welcome and logistics GWSA and Integrated Climate Solutions GHG Emissions Inventory New Goal: Net-Zero Emissions by 2050 2050 Decarbonization Roadmap Study 2050 Preview: Decarbonization and Net-Zero Emissions Audience Feedback
4/1/2020

GWSA and Integrated Climate Solutions
3 4/1/2020
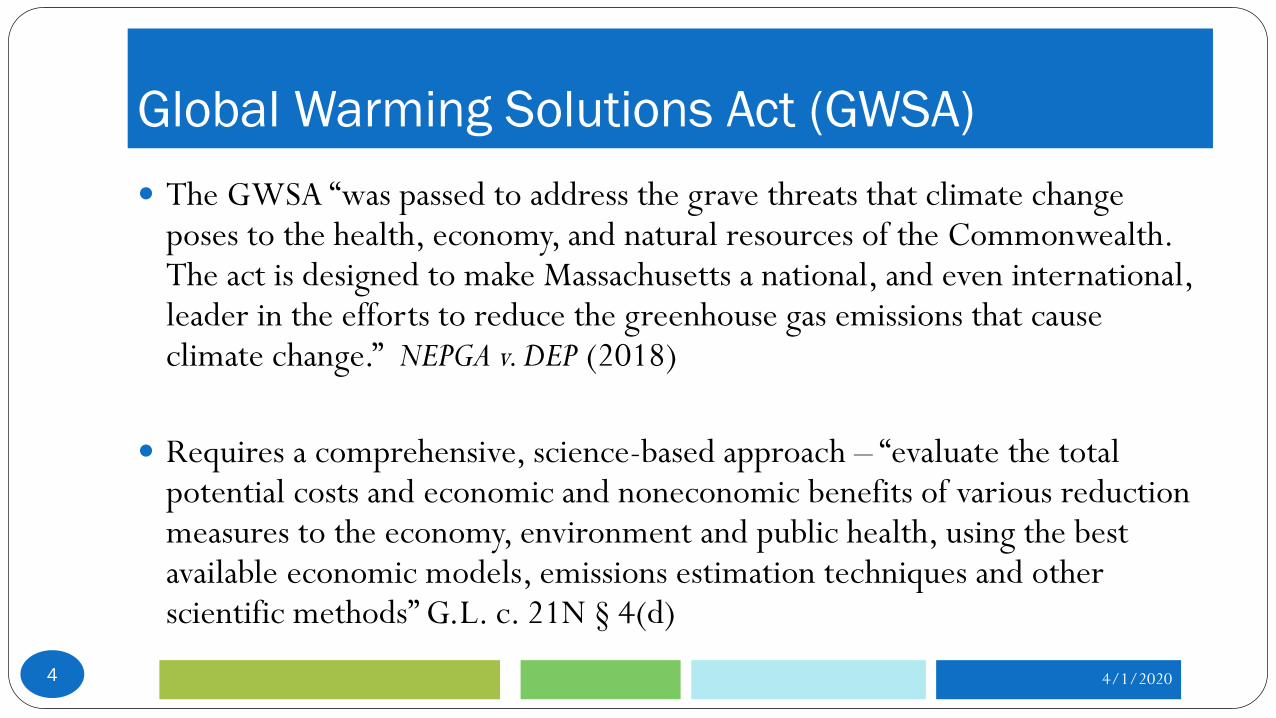
Global Warming Solutions Act (GWSA)
4
The GWSA “was passed to address the grave threats that climate change poses to the health, economy, and natural resources of the Commonwealth. The act is designed to make Massachusetts a national, and even international, leader in the efforts to reduce the greenhouse gas emissions that cause climate change.” NEPGA v. DEP (2018)
Requires a comprehensive, science-based approach – “evaluate the total potential costs and economic and noneconomic benefits of various reduction measures to the economy, environment and public health, using the best available economic models, emissions estimation techniques and other scientific methods” G.L. c. 21N § 4(d)
4/1/2020
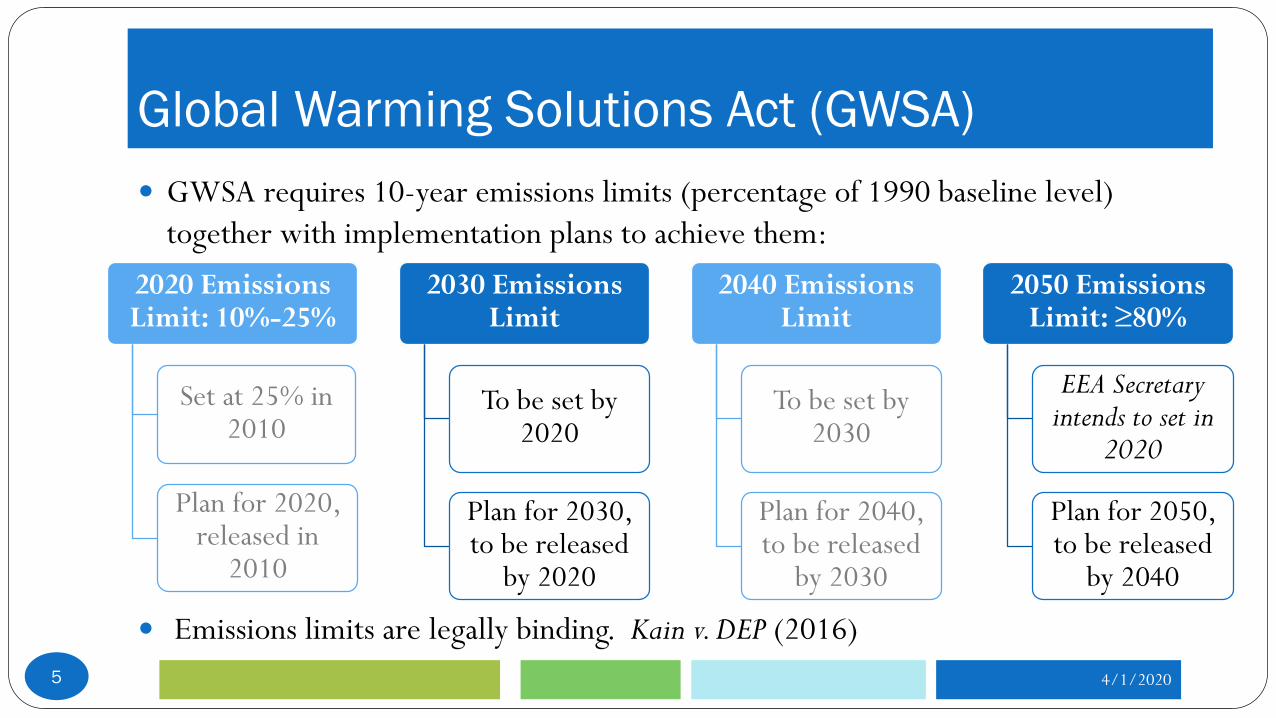
GWSA requires 10-year emissions limits (percentage of 1990 baseline level) together with implementation plans to achieve them:
Emissions limits are legally binding. Kain v. DEP (2016)
2020 Emissions Limit: 10%-25%
Set at 25% in 2010
Plan for 2020, released in
2010
2030 Emissions Limit
To be set by 2020
Plan for 2030, to be released
by 2020
2040 Emissions Limit
To be set by 2030
Plan for 2040, to be released
by 2030
2050 Emissions Limit: ≥80%
EEA Secretary intends to set in
2020
Plan for 2050, to be released
by 2040
5 4/1/2020
Global Warming Solutions Act (GWSA)
6 4/1/2020
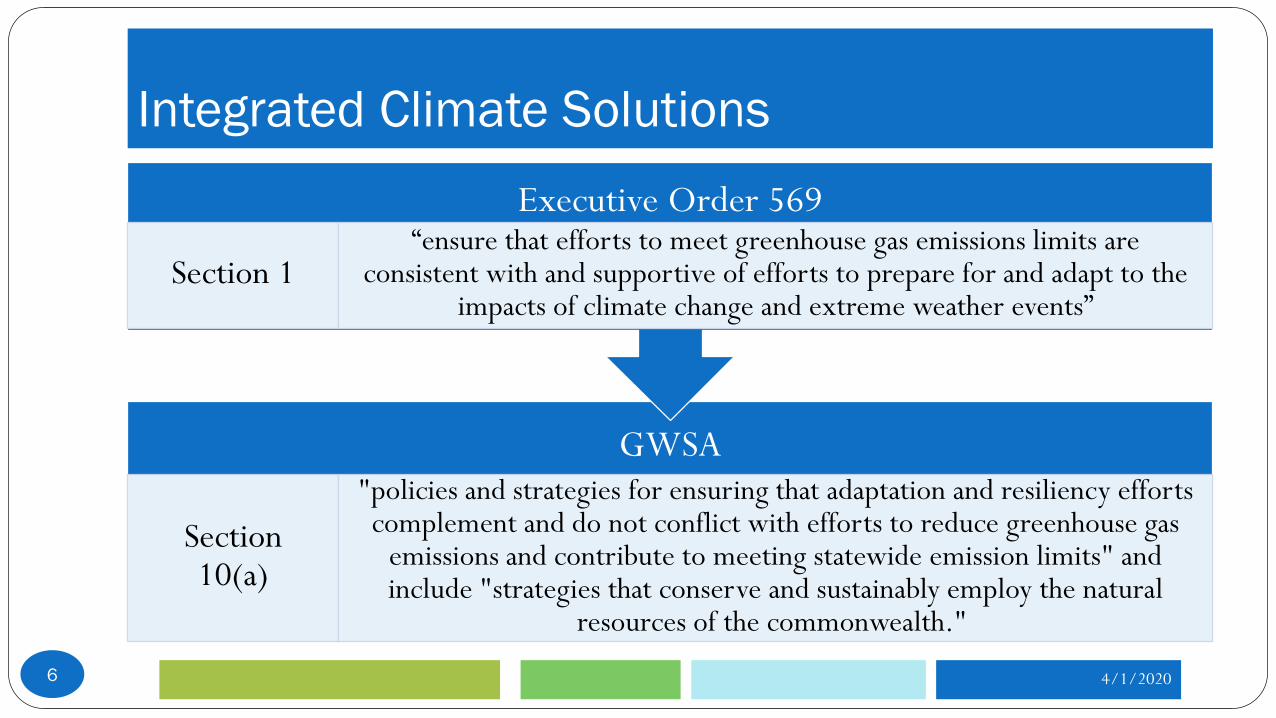
GWSA
Section 10(a)
"policies and strategies for ensuring that adaptation and resiliency efforts complement and do not conflict with efforts to reduce greenhouse gas
emissions and contribute to meeting statewide emission limits" and include "strategies that conserve and sustainably employ the natural
resources of the commonwealth."
Executive Order 569
Section 1“ensure that efforts to meet greenhouse gas emissions limits are
consistent with and supportive of efforts to prepare for and adapt to the impacts of climate change and extreme weather events”
Integrated Climate Solutions

7 4/1/2020
www.mass.gov/municipal-vulnerability-preparedness-program
Leading by ExampleLocal partnership
Building a Climate-Resilient Commonwealth
Greenhouse Gas (GHG) Emissions Inventory
8 4/1/2020
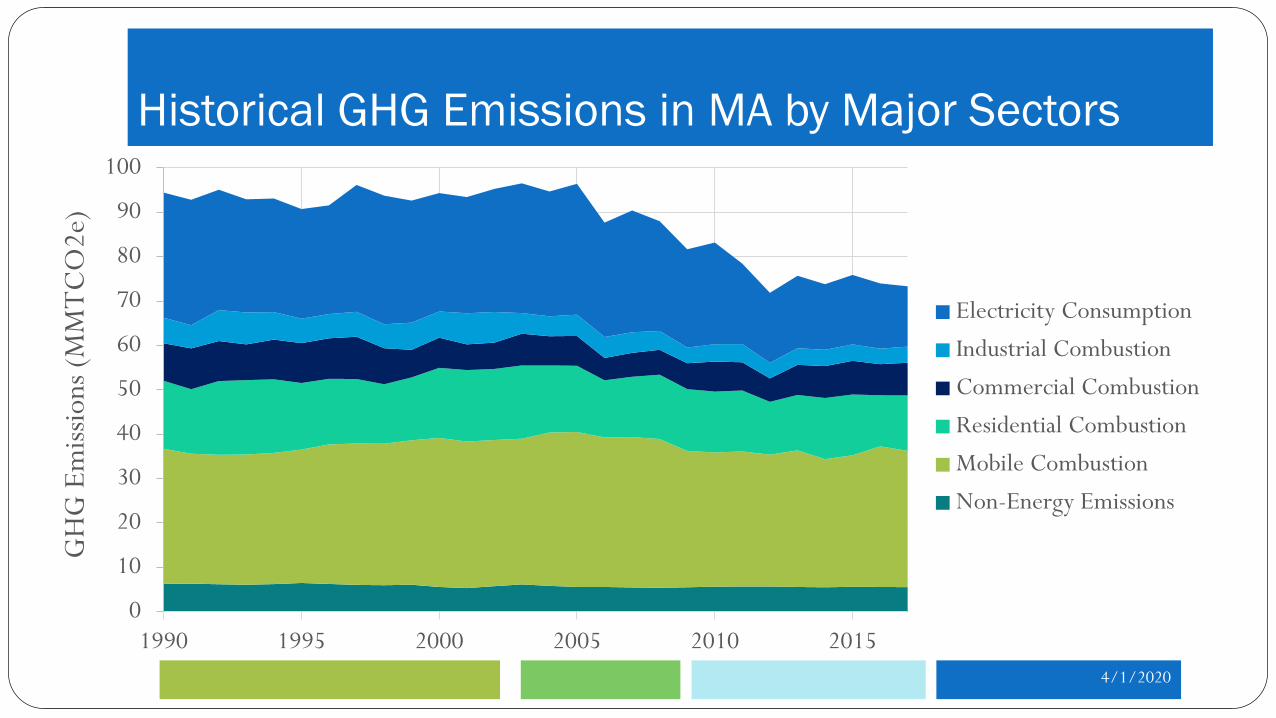
Historical GHG Emissions in MA by Major Sectors
4/1/2020
0
10
20
30
40
50
60
70
80
90
100
1990 1995 2000 2005 2010 2015
GH
G E
miss
ions
(MM
TCO
2e)
Electricity ConsumptionIndustrial CombustionCommercial CombustionResidential CombustionMobile CombustionNon-Energy Emissions
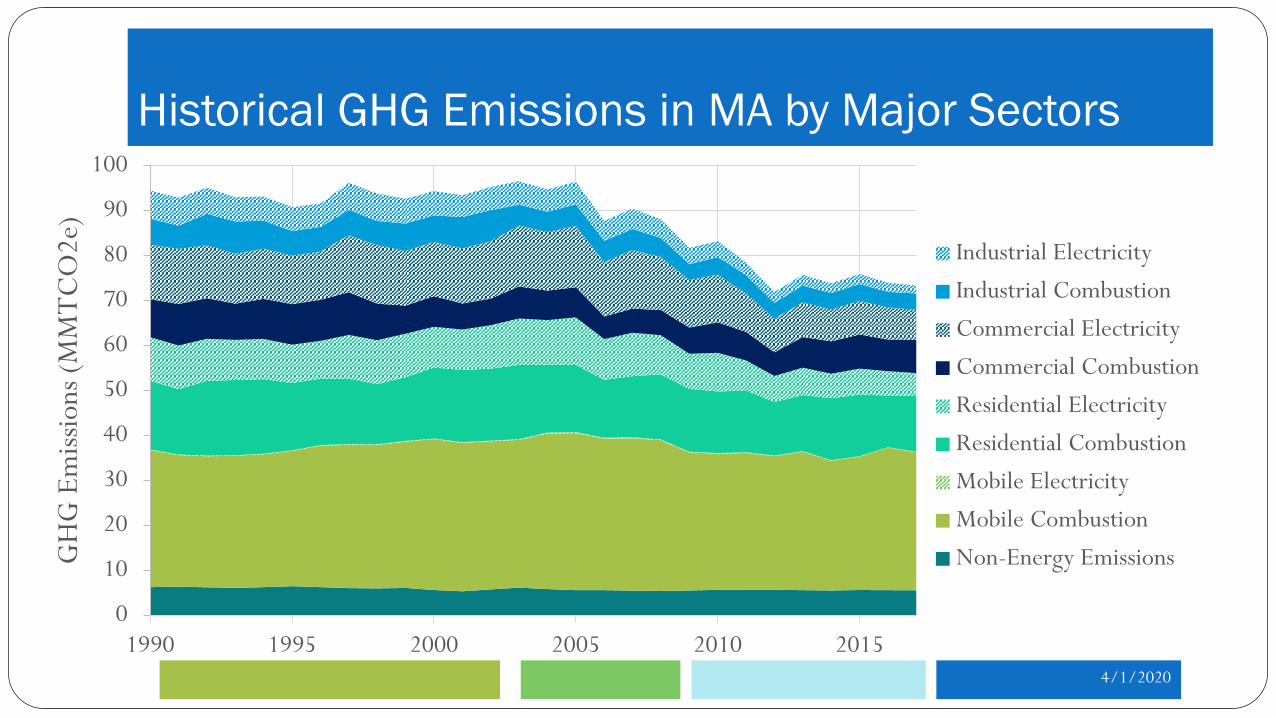
Historical GHG Emissions in MA by Major Sectors
0
10
20
30
40
50
60
70
80
90
100
1990 1995 2000 2005 2010 2015
GH
G E
miss
ions
(MM
TCO
2e)
Industrial ElectricityIndustrial CombustionCommercial ElectricityCommercial CombustionResidential ElectricityResidential CombustionMobile ElectricityMobile CombustionNon-Energy Emissions
4/1/2020
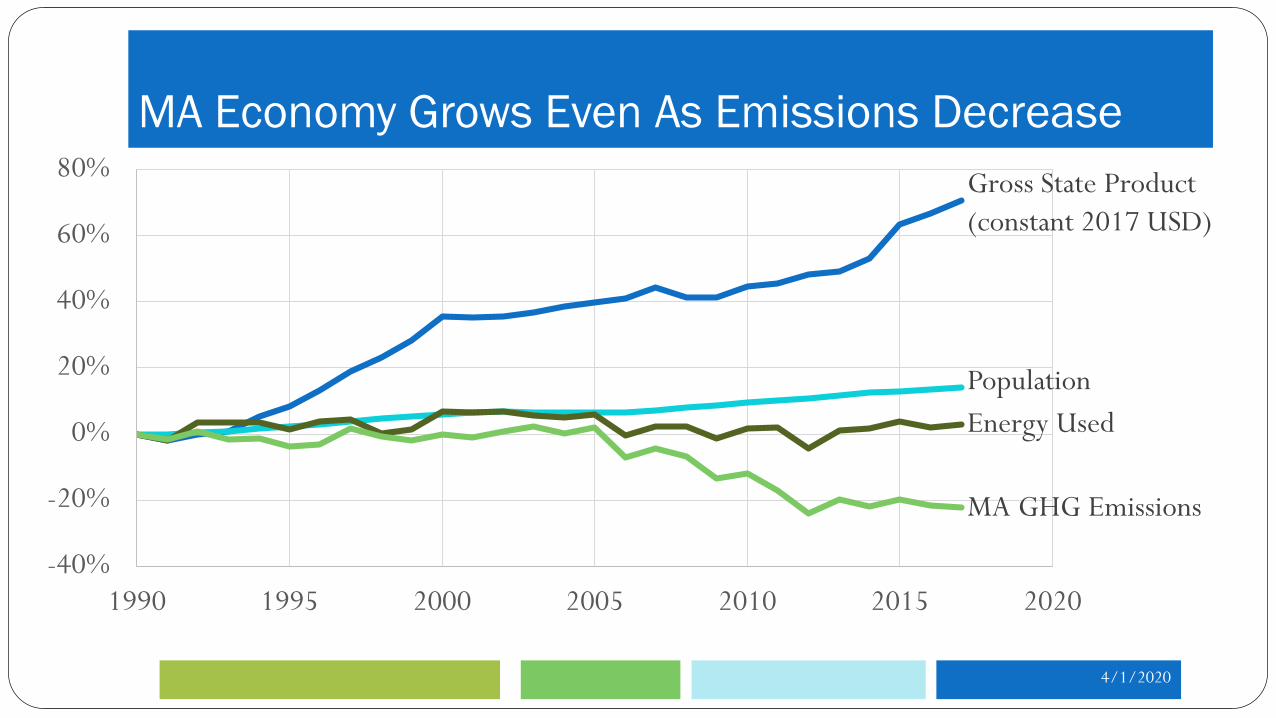
MA Economy Grows Even As Emissions Decrease
-40%
-20%
0%
20%
40%
60%
80%
1990 1995 2000 2005 2010 2015 2020
Gross State Product (constant 2017 USD)
PopulationEnergy Used
MA GHG Emissions
4/1/2020

New Goal: Net-Zero Emissions by 2050
4/1/2020
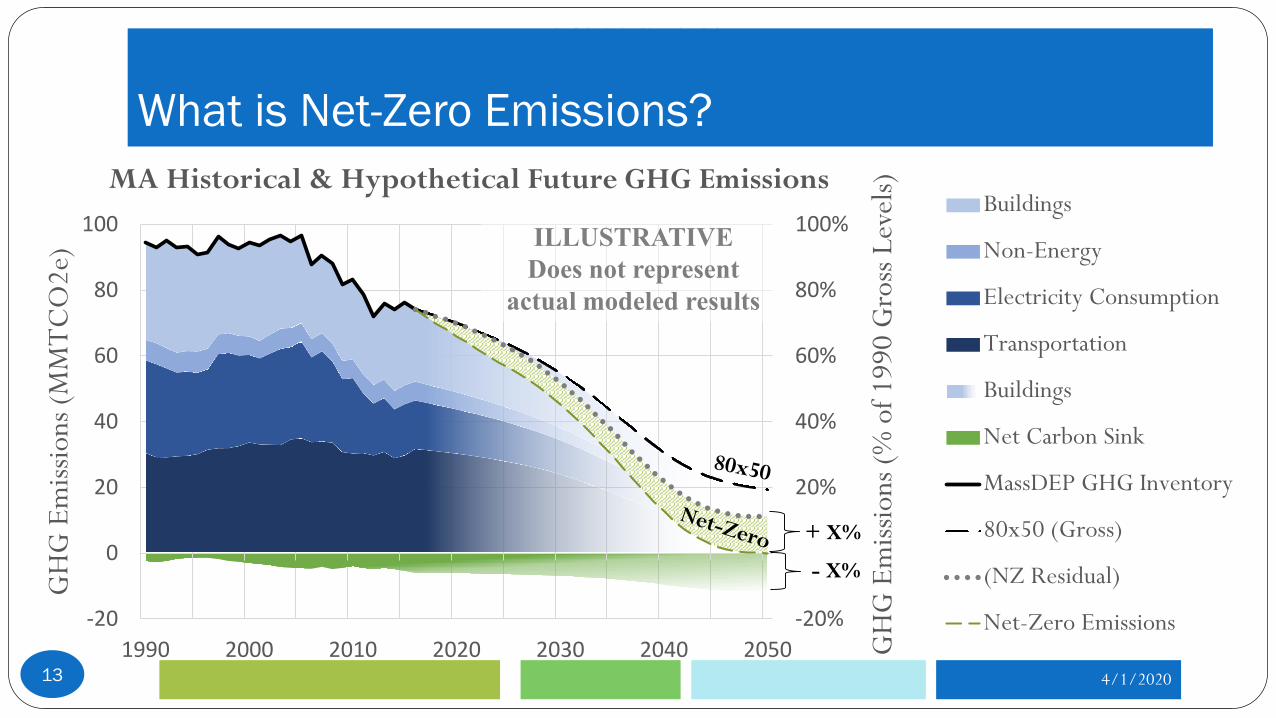
Draft for Policy Discussion Only
-20%
0%
20%
40%
60%
80%
100%
-20
0
20
40
60
80
100
1990 2000 2010 2020 2030 2040 2050 GH
G E
miss
ions
(% o
f 199
0 G
ross
Lev
els)
GH
G E
miss
ions
(MM
TCO
2e)
MA Historical & Hypothetical Future GHG Emissions Buildings
Non-Energy
Electricity Consumption
Transportation
Buildings
Net Carbon Sink
MassDEP GHG Inventory
80x50 (Gross)
(NZ Residual)
Net-Zero Emissions
+ X%
- X%
What is Net-Zero Emissions?
13 4/1/2020
ILLUSTRATIVE Does not represent
actual modeled results
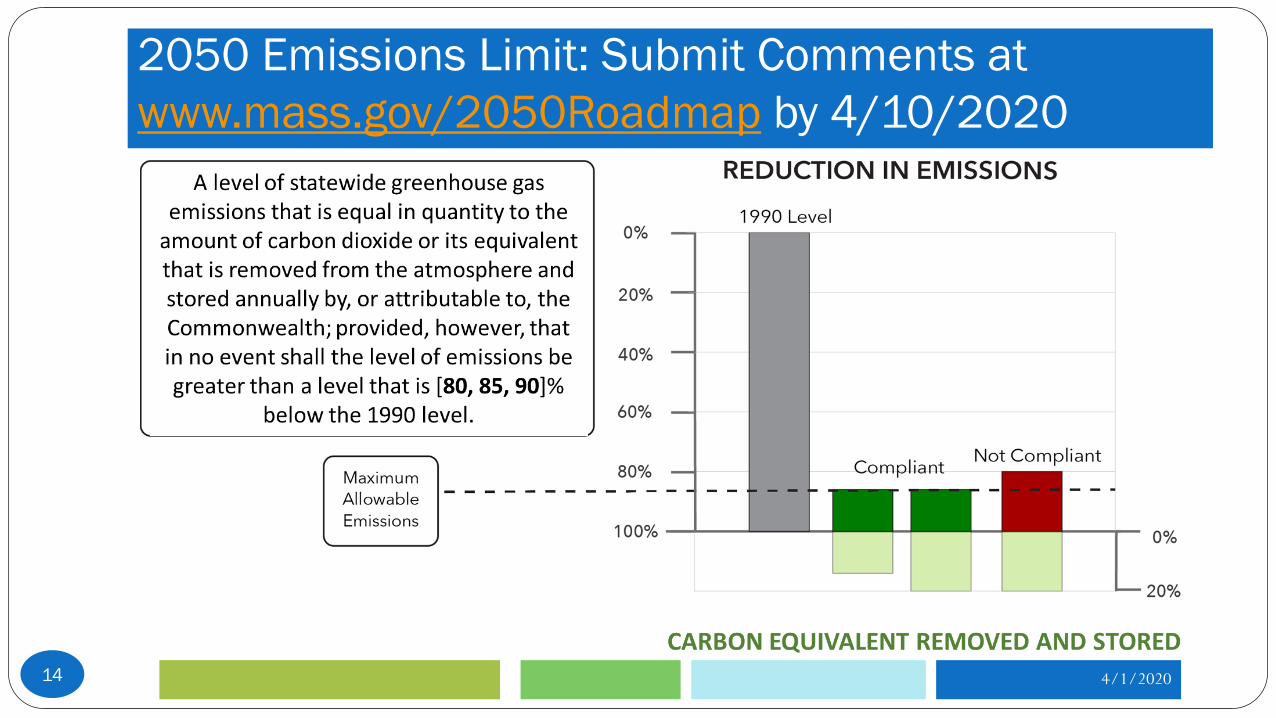
2050 Emissions Limit: Submit Comments at www.mass.gov/2050Roadmap by 4/10/2020
14 4/1/2020
The “2050 Roadmap”
15 4/1/2020
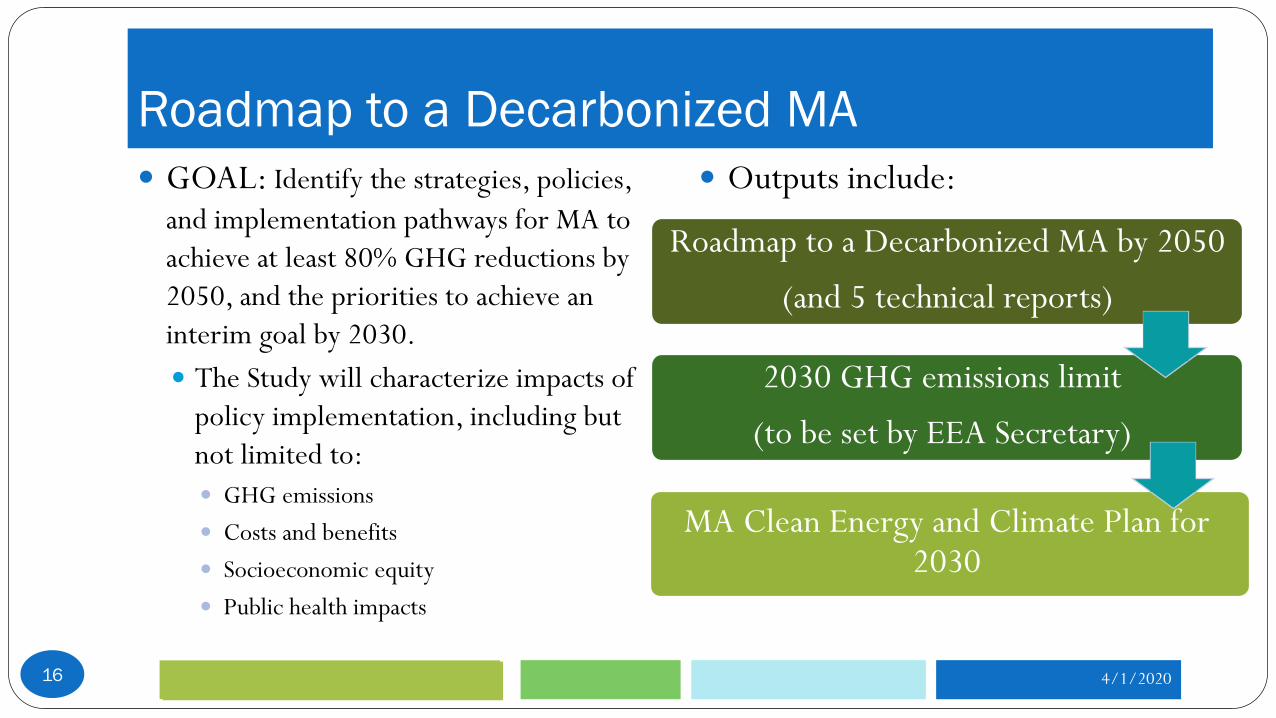
Roadmap to a Decarbonized MA
16
GOAL: Identify the strategies, policies, and implementation pathways for MA to achieve at least 80% GHG reductions by 2050, and the priorities to achieve an interim goal by 2030. The Study will characterize impacts of
policy implementation, including but not limited to: GHG emissions Costs and benefits Socioeconomic equity Public health impacts
Outputs include:
4/1/2020
Roadmap to a Decarbonized MA by 2050
(and 5 technical reports)
2030 GHG emissions limit
(to be set by EEA Secretary)
MA Clean Energy and Climate Plan for 2030

Project Components and Timeline
17Stakeholder Engagement
Public Meetings
Pathways & Policies Analyzed Together
Report Writing
Publish Reports
July 2019 Dec. 2020
4/1/2020
Project Kick-Off
Sector Models Built & Tested; Initial Pathways Developed & Policy Analysis
Scenario/Sensitivity Analysis: Pathway “Stress Testing”
Deep Decarbonization Pathways (DDPs) for MA
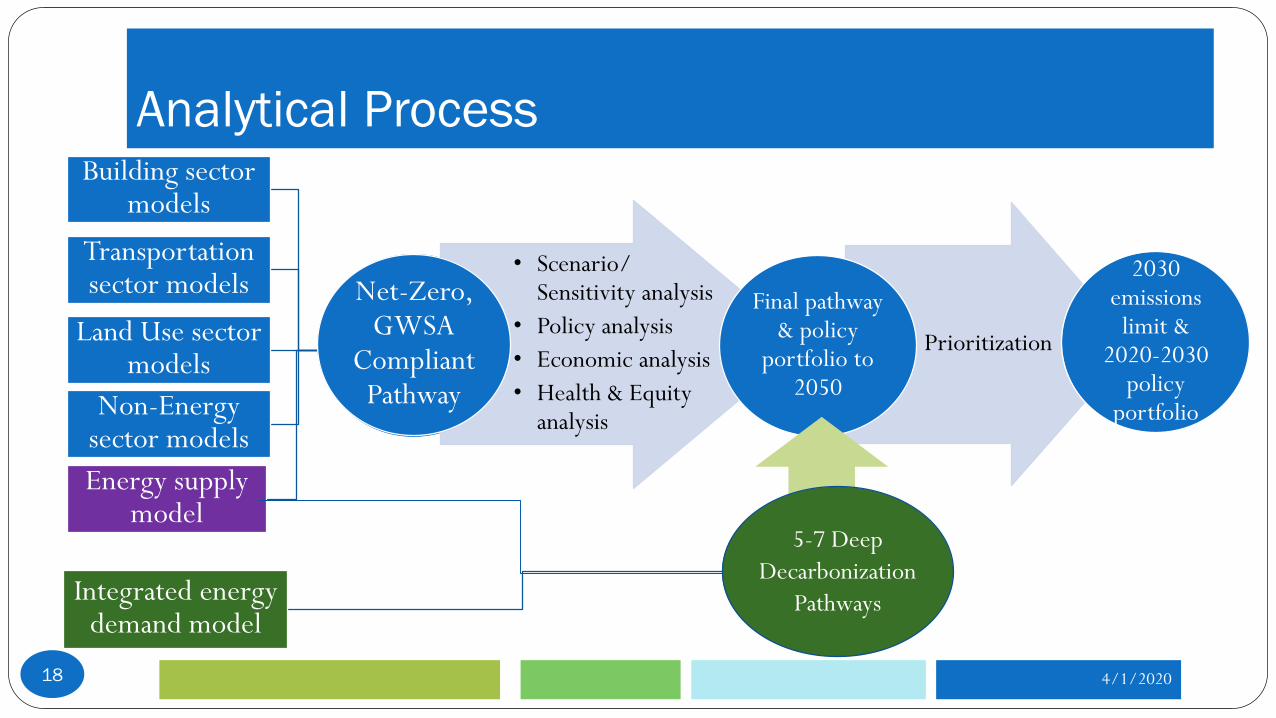
Net-Zero, GWSA PathwayIntegrated energy
demand model
Net-Zero, GWSA
Compliant Pathway
Building sector models
Transportation sector models
Land Use sector models
Non-Energy sector modelsEnergy supply
model
Analytical Process
18
Prioritization
• Scenario/ Sensitivity analysis
• Policy analysis• Economic analysis• Health & Equity
analysis
Net-Zero, GWSA
Compliant Pathway
2030 emissions limit &
2020-2030 policy
portfolio
Final pathway & policy
portfolio to 2050
4/1/2020
5-7 Deep Decarbonization
Pathways
19 4/1/2020
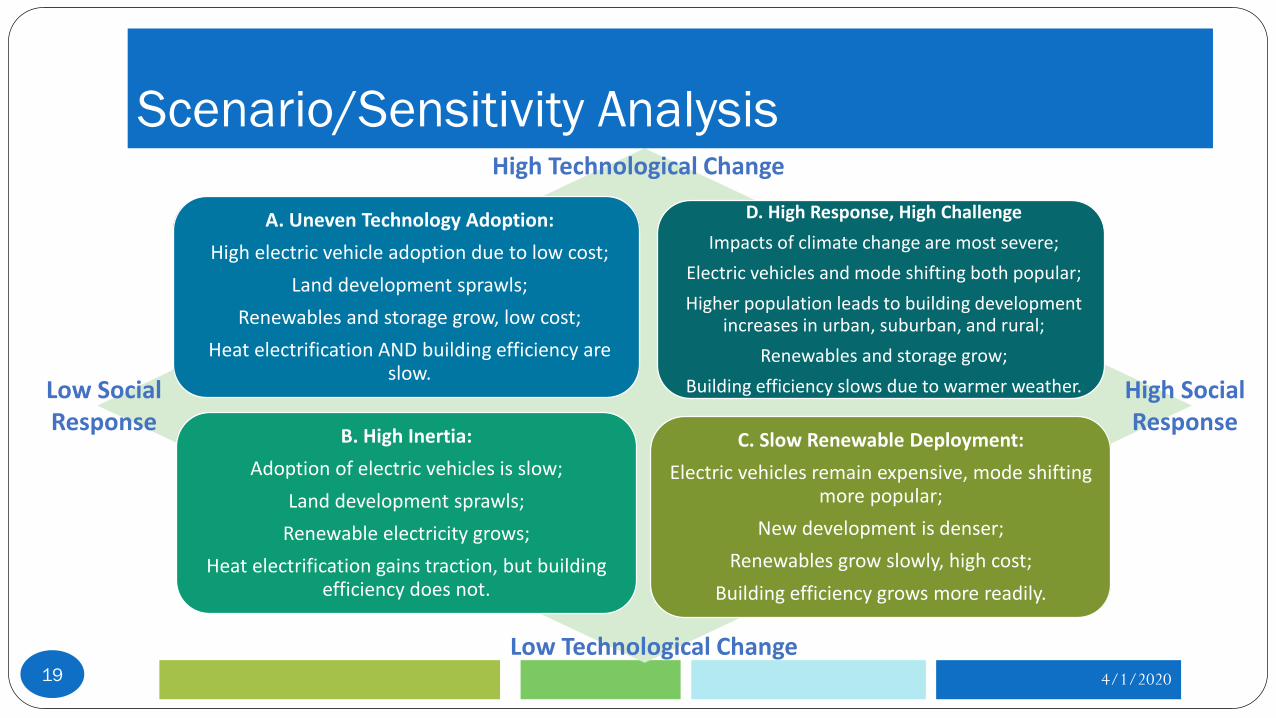
A. Uneven Technology Adoption:High electric vehicle adoption due to low cost;
Land development sprawls;Renewables and storage grow, low cost;
Heat electrification AND building efficiency are slow.
D. High Response, High ChallengeImpacts of climate change are most severe;
Electric vehicles and mode shifting both popular;Higher population leads to building development
increases in urban, suburban, and rural;Renewables and storage grow;
Building efficiency slows due to warmer weather.
B. High Inertia:Adoption of electric vehicles is slow;
Land development sprawls;Renewable electricity grows;
Heat electrification gains traction, but building efficiency does not.
C. Slow Renewable Deployment:Electric vehicles remain expensive, mode shifting
more popular;New development is denser;
Renewables grow slowly, high cost;Building efficiency grows more readily.
High Technological Change
Low Technological Change
Low Social Response
High Social Response
Scenario/Sensitivity AnalysisHigh Technological Change

2050 Preview:Decarbonization and Net-Zero Emissions
20 4/1/2020

Pillars of Decarbonization & Net-Zero
21
Increase Energy Efficiency, Reduce
Energy Consumption: Building weatherization,
passive house construction, public
transit, etc.
End-Use Fuel Switching:
Electric cars, hydrogen trucks, heat pumps, biofuels, etc.
Expand Clean Energy:
Renewable electricity, grid
storage, advanced biofuels, etc.
Increased Carbon Sequestration:
Conserving natural lands, best
management practices
4/1/2020
Icons made by Freepik from www.flaticon.com
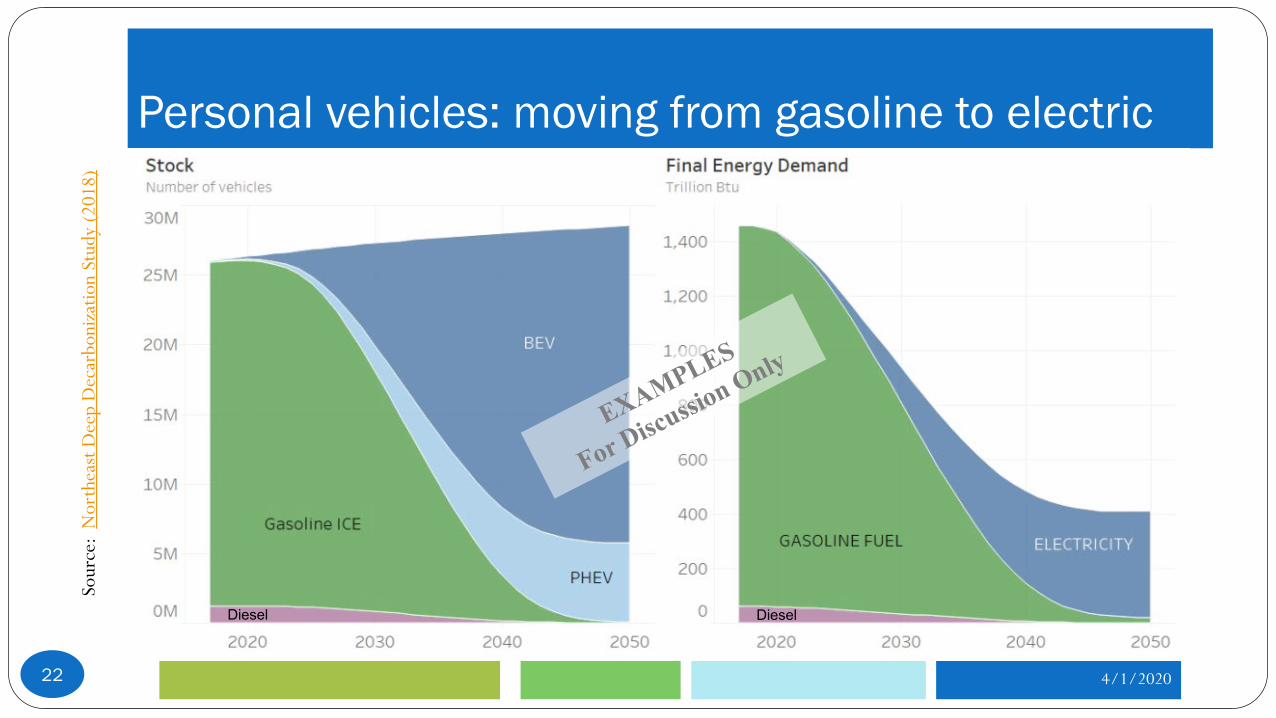
Personal vehicles: moving from gasoline to electric
22
Sour
ce:
Nor
thea
st D
eep
Dec
arbo
niza
tion
Stud
y (2
018)
4/1/2020
Diesel Diesel
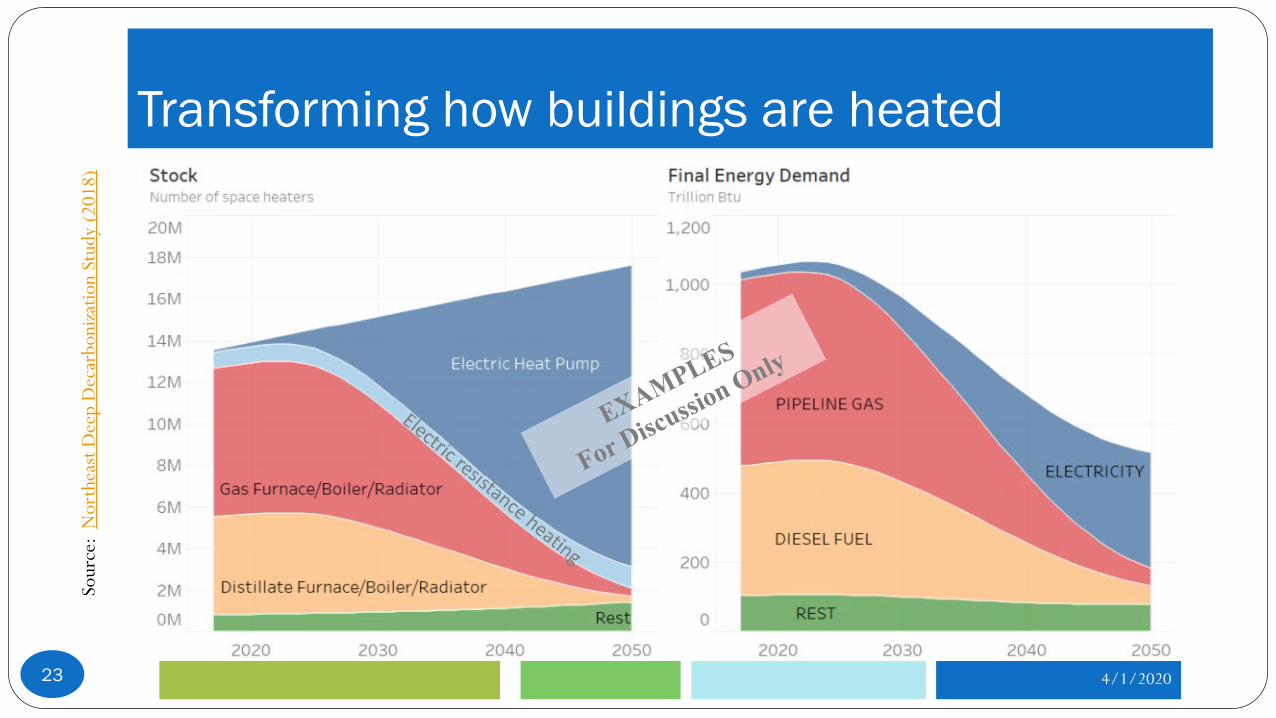
Transforming how buildings are heated
23 4/1/2020
Sour
ce:
Nor
thea
st D
eep
Dec
arbo
niza
tion
Stud
y (2
018)
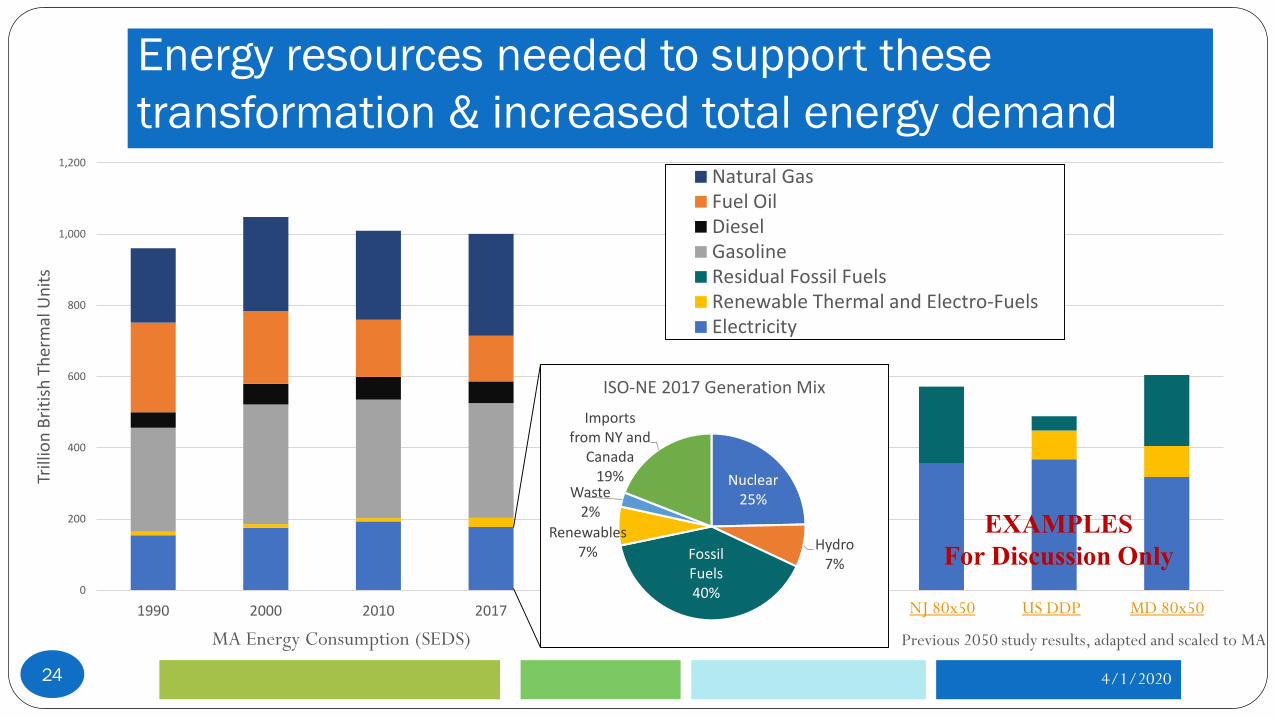
0
200
400
600
800
1,000
1,200
1990 2000 2010 2017 NJ 80x50 US DDP MD 80x50
Trill
ion
Briti
sh T
herm
al U
nits
Natural GasFuel OilDieselGasolineResidual Fossil FuelsRenewable Thermal and Electro-FuelsElectricity
Energy resources needed to support these transformation & increased total energy demand
24 4/1/2020
Previous 2050 study results, adapted and scaled to MAMA Energy Consumption (SEDS)
NJ 80x50 US DDP MD 80x50
EXAMPLES For Discussion Only
Nuclear25%
Hydro7%Fossil
Fuels40%
Renewables7%
Waste2%
Imports from NY and
Canada19%
ISO-NE 2017 Generation Mix

MA’s Land Cover Distribution
25 4/1/2020
1.4 million acres of natural lands conserved to date
Massachusetts 2017
Forest: 3.3 million acresBuilt: 1.1 million acres Cultural Grassland: 0.3 million acres
Source: Harvard Forest (2019)

See yourself in 2050
26 4/1/2020
Image Credit Renewable Energy World
Audience Feedback
27
If you have any clarifying questions on the content from this presentation, please type it into the GoToWebinar panel now
If you would like to provide verbal comments, please click on the “raise your hand” button. I will unmute you in the order the hands “line up.” Comments are welcome on anything from this webinar, including, but not limited to: The proposed emissions limit for 2050 Suggestions for implementation pathways, policies, programs, etc. to consider for greenhouse
gas emissions reduction Feedback on the anticipated systems transformations for achieving net-zero emissions
Please limit your remarks to ~1 minute to allow time for everyone to speak Note: Comments can also be submitted online at www.mass.gov/2050Roadmap. Comments on the 2050 emissions limit are being accepted until 5pm on April 10th. Once all
comments are submitted, these comments will be posted at www.mass.gov/2050Roadmap. There is another form for general comments that will be open throughout the duration of the
study and which is checked regularly.
4/1/2020
THANK YOU
28
Please feel free to provide written feedback on the 2050 emissions limit or the study more broadly at
www.mass.gov/2050Roadmap
4/1/2020
EXTRA SLIDES
29 4/1/2020
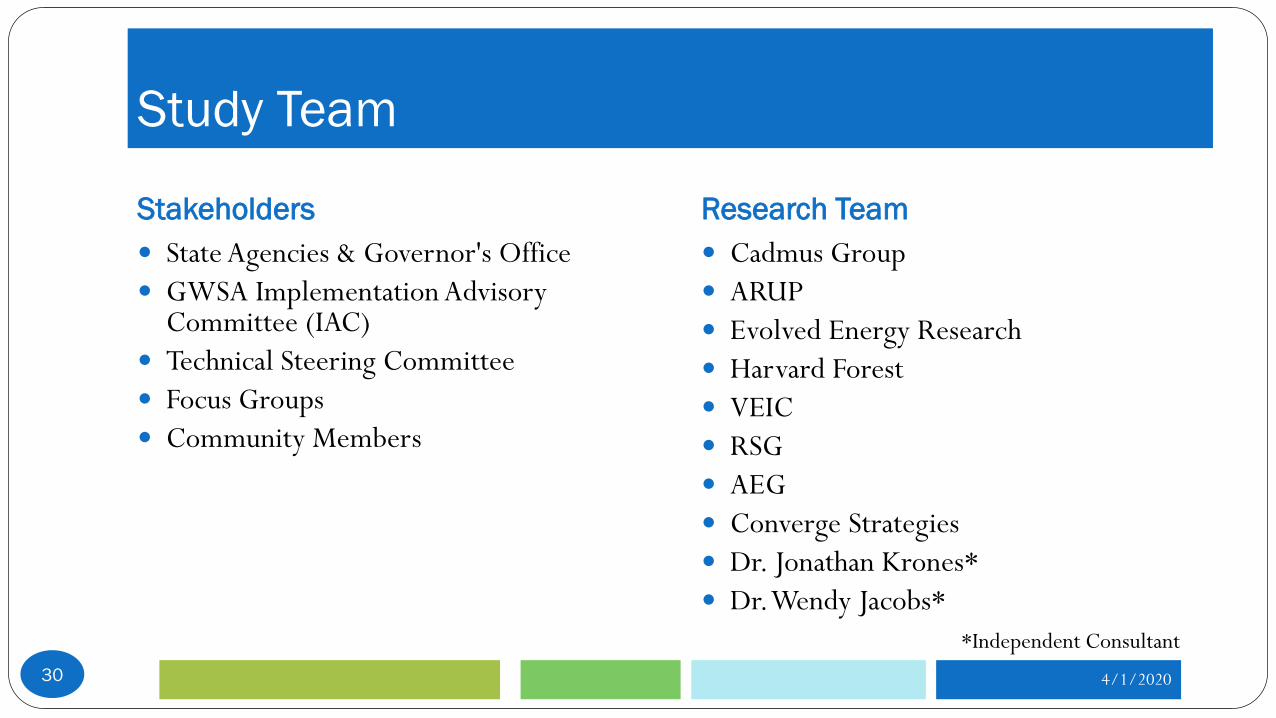
Study Team
Stakeholders Research Team
30
State Agencies & Governor's Office GWSA Implementation Advisory
Committee (IAC) Technical Steering Committee Focus Groups Community Members
Cadmus Group ARUP Evolved Energy Research Harvard Forest VEIC RSG AEG Converge Strategies Dr. Jonathan Krones* Dr. Wendy Jacobs*
4/1/2020
*Independent Consultant
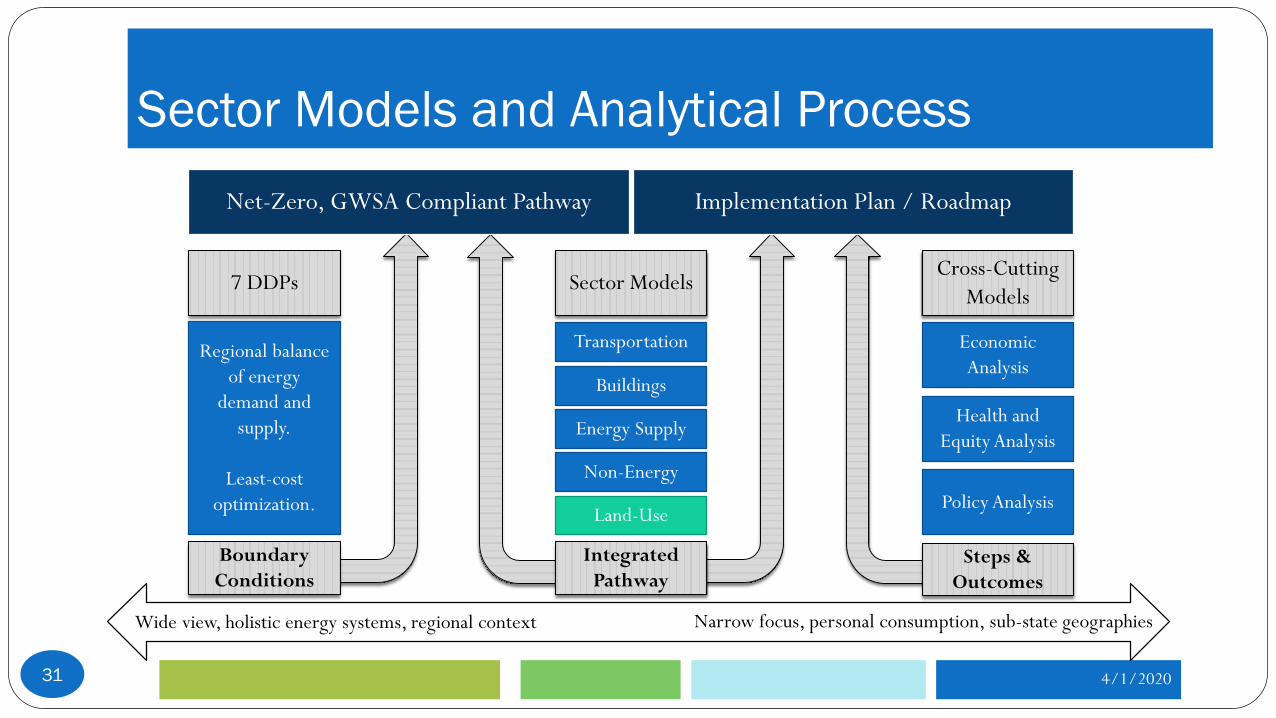
Sector Models and Analytical Process
31 4/1/2020
Wide view, holistic energy systems, regional context
7 DDPs
Transportation
Buildings
Energy Supply
Non-Energy
Land-Use
Sector Models
Regional balance of energy
demand and supply.
Least-cost optimization.
Net-Zero, GWSA Compliant Pathway
Economic Analysis
Health and Equity Analysis
Policy Analysis
Cross-Cutting Models
Implementation Plan / Roadmap
Narrow focus, personal consumption, sub-state geographies
Integrated Pathway
Boundary Conditions
Steps & Outcomes