Slide 4 - 1 Copyright © 2009 Pearson Education, Inc. Active Learning Lecture Slides For use with...
51
Slide 4 - 1 Copyright © 2009 Pearson Education, Inc. Active Learning Lecture Slides For use with Classroom Response Systems © 2009 Pearson Education, Inc. All rights reserved. Chapter 4 Linear Functions, Their Properties and Linear Models
-
Upload
austen-sparks -
Category
Documents
-
view
217 -
download
3
Transcript of Slide 4 - 1 Copyright © 2009 Pearson Education, Inc. Active Learning Lecture Slides For use with...

Slide 4 - 1Copyright © 2009 Pearson Education, Inc.
Active Learning Lecture SlidesFor use with Classroom Response Systems
© 2009 Pearson Education, Inc.All rights reserved.
Chapter 4Linear
Functions, Their
Properties and Linear Models

Slide 4 - 2Copyright © 2009 Pearson Education, Inc.
Determine the slope and y-intercept of the
a.
b.
c.
d.
f x 8
7x 4.function
m 8
7; b 4
m 7
8; b 4
m 4; b 8
7
m 8
7; b 4

Slide 4 - 3Copyright © 2009 Pearson Education, Inc.
Determine the slope and y-intercept of the
a.
b.
c.
d.
f x 8
7x 4.function
m 8
7; b 4
m 7
8; b 4
m 4; b 8
7
m 8
7; b 4

Slide 4 - 4Copyright © 2009 Pearson Education, Inc.
Graph
a. b.
c. d.
h x 1
2x 3.
Slide 4 - 5Copyright © 2009 Pearson Education, Inc.
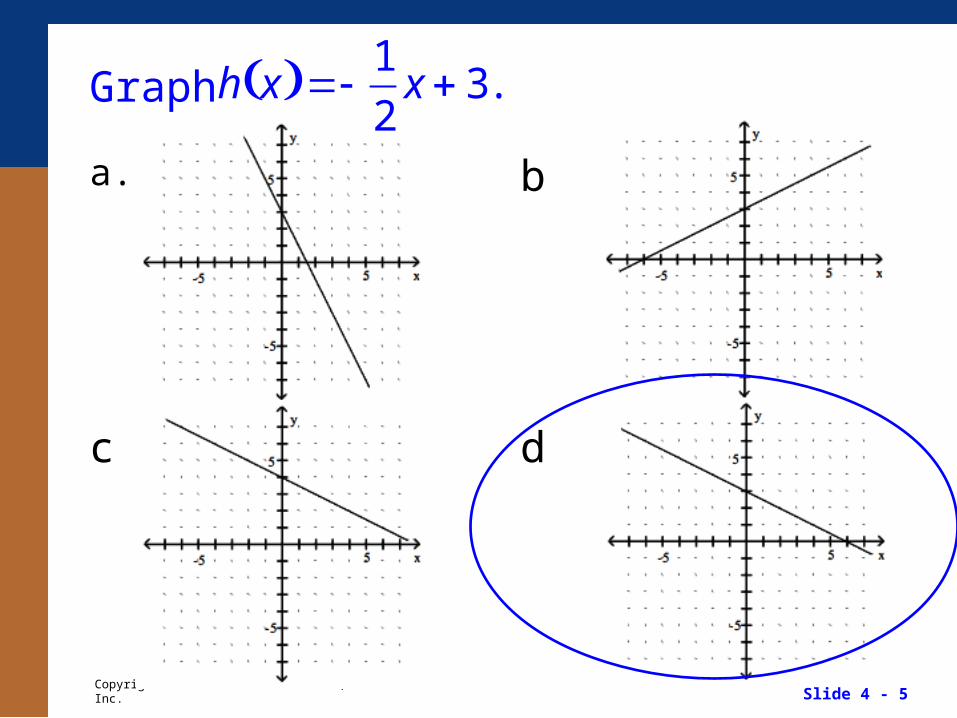
Graph
a. b.
c. d.
h x 1
2x 3.

Slide 4 - 6Copyright © 2009 Pearson Education, Inc.
Determine the average rate of change for the
a.
b.
c.
d.
f x 2
5x 3.function
3
3
2
5
2
5

Slide 4 - 7Copyright © 2009 Pearson Education, Inc.
Determine the average rate of change for the
a.
b.
c.
d.
f x 2
5x 3.function
3
3
2
5
2
5

Slide 4 - 8Copyright © 2009 Pearson Education, Inc.
Graph
a. decreasing b. increasing
c. increasing d. increasing
h x 3
4x 3. State whether it is
increasing, decreasing, or constant.

Slide 4 - 9Copyright © 2009 Pearson Education, Inc.
Graph
a. decreasing b. increasing
c. increasing d. increasing
h x 3
4x 3. State whether it is
increasing, decreasing, or constant.

Slide 4 - 10Copyright © 2009 Pearson Education, Inc.
To convert a temperature from degrees Celsius to degrees Fahrenheit, you multiply the temperature in degrees Celsius by 1.8 and then add 32 to the result. Express F as a linear function of C.
a.
b.
c.
d. F c c 32
1.8
F c 33.8c
F c 1.8c 32
F c 1.8 32c

Slide 4 - 11Copyright © 2009 Pearson Education, Inc.
To convert a temperature from degrees Celsius to degrees Fahrenheit, you multiply the temperature in degrees Celsius by 1.8 and then add 32 to the result. Express F as a linear function of C.
a.
b.
c.
d. F c c 32
1.8
F c 33.8c
F c 1.8c 32
F c 1.8 32c

Slide 4 - 12Copyright © 2009 Pearson Education, Inc.
The cost of a taxi ride is computed as follows: there is a fixed charge of $2.80 as soon as you get in the taxi, to which a charge of $2.45 per mile is added. Find the equation of the cost, C(x), an x mile taxi ride.
a.
b.
c.
d. C x 3.75x
C x 5.25x
C x 2.45 2.80x
C x 2.80 2.45x

Slide 4 - 13Copyright © 2009 Pearson Education, Inc.
The cost of a taxi ride is computed as follows: there is a fixed charge of $2.80 as soon as you get in the taxi, to which a charge of $2.45 per mile is added. Find the equation of the cost, C(x), an x mile taxi ride.
a.
b.
c.
d. C x 3.75x
C x 5.25x
C x 2.45 2.80x
C x 2.80 2.45x
Slide 4 - 14Copyright © 2009 Pearson Education, Inc.
Find the equation of the line containing the points (2, 1.2) and (9, 4.3) and graph the line on a scatter diagram of the given data.
a. b.
c. d.y 0.44x 0.31
y 0.49x 0.31 y 0.37x 0.47
y 0.44x 0.37

Slide 4 - 15Copyright © 2009 Pearson Education, Inc.
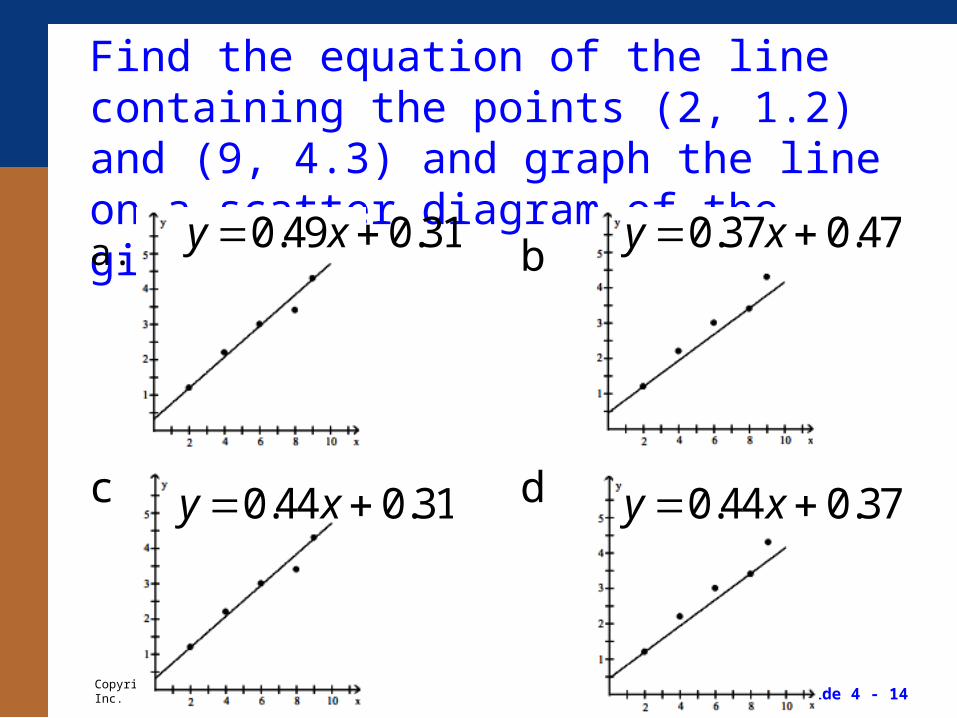
Find the equation of the line containing the points (2, 1.2) and (9, 4.3) and graph the line on a scatter diagram of the given data.
a. b.
c. d.y 0.44x 0.31
y 0.49x 0.31 y 0.37x 0.47
y 0.44x 0.37

Slide 4 - 16Copyright © 2009 Pearson Education, Inc.
The table gives the times spent watching TV and the grades of several students. Plot and interpret the appropriate scatter diagram.
a. More hours watching TV may reduce grades
Weekly TV (h) 6 12 18 24 30 36
Grade (%) 92.5 87.5 72.5 77.5 62.5 57.5
b. More hours watching TV may increase grades
c. More hours watching TV may reduce grades
d. More hours watching TV may increase grades

Slide 4 - 17Copyright © 2009 Pearson Education, Inc.
The table gives the times spent watching TV and the grades of several students. Plot and interpret the appropriate scatter diagram.
a. More hours watching TV may reduce grades
Weekly TV (h) 6 12 18 24 30 36
Grade (%) 92.5 87.5 72.5 77.5 62.5 57.5
b. More hours watching TV may increase grades
c. More hours watching TV may reduce grades
d. More hours watching TV may increase grades

Slide 4 - 18Copyright © 2009 Pearson Education, Inc.
Determine if the type of relation is linear, nonlinear, or none.
a. Linear
b. Nonlinear
c. None

Slide 4 - 19Copyright © 2009 Pearson Education, Inc.
Determine if the type of relation is linear, nonlinear, or none.
a. Linear
b. Nonlinear
c. None

Slide 4 - 20Copyright © 2009 Pearson Education, Inc.
Identify the scatter diagram of the relation that appears linear.a. b.
c. d.

Slide 4 - 21Copyright © 2009 Pearson Education, Inc.
Identify the scatter diagram of the relation that appears linear.a. b.
c. d.

Slide 4 - 22Copyright © 2009 Pearson Education, Inc.
Use a graphing utility to find the equation of the line of best fit. Round to two decimal places, if necessary.
a.
b.
c.
d. y 0.85x 2.79
y 0.80x 3.79
y 0.95x 2.79
y 0.90x 3.79
x 6 8 20 28 36
y 2 4 13 20 30

Slide 4 - 23Copyright © 2009 Pearson Education, Inc.
Use a graphing utility to find the equation of the line of best fit. Round to two decimal places, if necessary.
a.
b.
c.
d. y 0.85x 2.79
y 0.80x 3.79
y 0.95x 2.79
y 0.90x 3.79
x 6 8 20 28 36
y 2 4 13 20 30

Slide 4 - 24Copyright © 2009 Pearson Education, Inc.
Match the graph to one of the listed functions.
a.
b.
c.
d. y x2 10x
y x2 10x
y x2 10x
y x2 10x

Slide 4 - 25Copyright © 2009 Pearson Education, Inc.
Match the graph to one of the listed functions.
a.
b.
c.
d. y x2 10x
y x2 10x
y x2 10x
y x2 10x
Slide 4 - 26Copyright © 2009 Pearson Education, Inc.
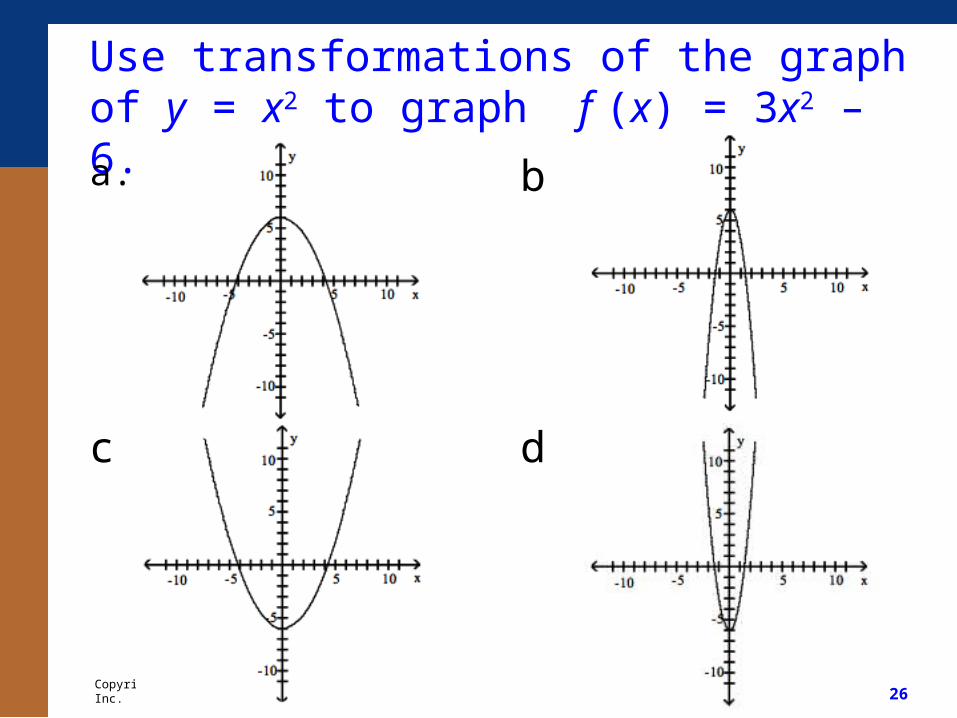
Use transformations of the graph of y = x2 to graph f (x) = 3x2 – 6.
a. b.
c. d.

Slide 4 - 27Copyright © 2009 Pearson Education, Inc.
Use transformations of the graph of y = x2 to graph f (x) = 3x2 – 6.
a. b.
c. d.

Slide 4 - 28Copyright © 2009 Pearson Education, Inc.
Find the vertex and axis of symmetry of the graph of the function
a.
b.
c.
d.
f x 3x2 18x.
3,0 ; x 3
3,27 ; x 3
3,27 ; x 3
3,0 ; x 3

Slide 4 - 29Copyright © 2009 Pearson Education, Inc.
Find the vertex and axis of symmetry of the graph of the function
a.
b.
c.
d.
f x 3x2 18x.
3,0 ; x 3
3,27 ; x 3
3,27 ; x 3
3,0 ; x 3

Slide 4 - 30Copyright © 2009 Pearson Education, Inc.
Graph the function f (x) = –x2 – 6x – 5 using its vertex, axis of symmetry, and intercepts.
a. b.
c. d.

Slide 4 - 31Copyright © 2009 Pearson Education, Inc.
Graph the function f (x) = –x2 – 6x – 5 using its vertex, axis of symmetry, and intercepts.
a. b.
c. d.
Slide 4 - 32Copyright © 2009 Pearson Education, Inc.
Find the domain and range of f (x) = x2 – 4x + 3.
a. Domain: all real numbers
Range: {y | y ≥ –1}
b. Domain: {x | x ≥ –2}
Range: {y | y ≥ –1}
c. Domain: all real numbers
Range: {y | y ≤ 1}
d. Domain: all real numbers
Range: all real numbers

Slide 4 - 33Copyright © 2009 Pearson Education, Inc.
Find the domain and range of f (x) = x2 – 4x + 3.
a. Domain: all real numbers
Range: {y | y ≥ –1}
b. Domain: {x | x ≥ –2}
Range: {y | y ≥ –1}
c. Domain: all real numbers
Range: {y | y ≤ 1}
d. Domain: all real numbers
Range: all real numbers

Slide 4 - 34Copyright © 2009 Pearson Education, Inc.
Determine where the function f (x) = –x2 – 2x + 8 is increasing and decreasing.
a. Increasing on (–1, ∞)Decreasing on (–∞, –1)
b. Increasing on (–∞, –1)Decreasing on (–1, ∞)
c. Increasing on (–∞, 9)Decreasing on (9, ∞)
d. Increasing on (–9, ∞)Decreasing on (–∞, 9)

Slide 4 - 35Copyright © 2009 Pearson Education, Inc.
Determine where the function f (x) = –x2 – 2x + 8 is increasing and decreasing.
a. Increasing on (–1, ∞)Decreasing on (–∞, –1)
b. Increasing on (–∞, –1)Decreasing on (–1, ∞)
c. Increasing on (–∞, 9)Decreasing on (9, ∞)
d. Increasing on (–9, ∞)Decreasing on (–∞, 9)

Slide 4 - 36Copyright © 2009 Pearson Education, Inc.
Determine the maximum or minimum value of the quadratic function f (x) = 2x2 – 2x + 9 .
a. Minimum value is
b. Maximum value is
c. Minimum value is
d. Maximum value is
19
2
19
21
21
2

Slide 4 - 37Copyright © 2009 Pearson Education, Inc.
Determine the maximum or minimum value of the quadratic function f (x) = 2x2 – 2x + 9 .
a. Minimum value is
b. Maximum value is
c. Minimum value is
d. Maximum value is
19
2
19
21
21
2

Slide 4 - 38Copyright © 2009 Pearson Education, Inc.
The owner of a video store has determined that the profits P of the store are approximately given by P (x) = –x2 + 50x + 53. Where x is the number of videos rented daily. Find the maximum profit to the nearest dollar.
a. $678
b. $625
c. $1303
d. $1250

Slide 4 - 39Copyright © 2009 Pearson Education, Inc.
The owner of a video store has determined that the profits P of the store are approximately given by P (x) = –x2 + 50x + 53. Where x is the number of videos rented daily. Find the maximum profit to the nearest dollar.
a. $678
b. $625
c. $1303
d. $1250
Slide 4 - 40Copyright © 2009 Pearson Education, Inc.
Alan is building a garden shaped like a rectangle with a semicircle attached to one short side. If he has 30 feet of fencing to go around it, what dimensions will give him maximum area?
a. L: 10.8 ft;
b. L: 8.4 ft;
c. L: 8.1 ft;
d. L: 4.2 ft;
W :60
48.4 ft
W :30
44.2 ft
W :60
85.4 ft
W :60
48.4 ft

Slide 4 - 41Copyright © 2009 Pearson Education, Inc.
Alan is building a garden shaped like a rectangle with a semicircle attached to one short side. If he has 30 feet of fencing to go around it, what dimensions will give him maximum area?
a. L: 10.8 ft;
b. L: 8.4 ft;
c. L: 8.1 ft;
d. L: 4.2 ft;
W :60
48.4 ft
W :30
44.2 ft
W :60
85.4 ft
W :60
48.4 ft

Slide 4 - 42Copyright © 2009 Pearson Education, Inc.
You have 96 feet of fencing to enclose a rectangular plot that borders on a river. If you do not fence the side along the river, find the length and width of the plot that will maximize the area.
a. length: 72 ft, width: 24 ft
b. length: 48 ft, width: 24 ft
c. length: 48 ft, width: 48 ft
d. length: 24 ft, width: 24 ft

Slide 4 - 43Copyright © 2009 Pearson Education, Inc.
You have 96 feet of fencing to enclose a rectangular plot that borders on a river. If you do not fence the side along the river, find the length and width of the plot that will maximize the area.
a. length: 72 ft, width: 24 ft
b. length: 48 ft, width: 24 ft
c. length: 48 ft, width: 48 ft
d. length: 24 ft, width: 24 ft

Slide 4 - 44Copyright © 2009 Pearson Education, Inc.
An engineer collects data showing the speed s of a car model and its average miles per gallon M. Use a graphing calculator to plot the scatter diagram and find the quadratic function of best fit.
a.
b.
c.
d.
M s 0.0063x2 0.720x 5.143
M s 0.631x2 0.720x 5.143
M s 6.309x2 0.720x 5.143
M s0.063x2 0.720x 5.143

Slide 4 - 45Copyright © 2009 Pearson Education, Inc.
An engineer collects data showing the speed s of a car model and its average miles per gallon M. Use a graphing calculator to plot the scatter diagram and find the quadratic function of best fit.
a.
b.
c.
d.
M s 0.0063x2 0.720x 5.143
M s 0.631x2 0.720x 5.143
M s 6.309x2 0.720x 5.143
M s0.063x2 0.720x 5.143

Slide 4 - 46Copyright © 2009 Pearson Education, Inc.
Use the figure to solve the inequality.
a.
b.
c.
d.
x x 1 or x 2 ; ° , 1 or 2,°
x 1 x 2 ; 1,2
x x 1 or x 2 ; ° , 1 or 2,°
x 1x 2 ; 1,2

Slide 4 - 47Copyright © 2009 Pearson Education, Inc.
Use the figure to solve the inequality.
a.
b.
c.
d.
x x 1 or x 2 ; ° , 1 or 2,°
x 1 x 2 ; 1,2
x x 1 or x 2 ; ° , 1 or 2,°
x 1x 2 ; 1,2

Slide 4 - 48Copyright © 2009 Pearson Education, Inc.
Solve the inequality.
a.
b.
c.
d.
7 ; , 7x x
7 or 1 ; , 7 or 1,x x x
1 ; 1,x x
x 7 x 1 ; 7,1
x2 6x 7 0

Slide 4 - 49Copyright © 2009 Pearson Education, Inc.
Solve the inequality.
a.
b.
c.
d.
7 ; , 7x x
7 or 1 ; , 7 or 1,x x x
1 ; 1,x x
x 7 x 1 ; 7,1
x2 6x 7 0

Slide 4 - 50Copyright © 2009 Pearson Education, Inc.
The revenue achieved by selling x graphing calculators is figured to be x(38 – 0.2x) dollars. The cost of each calculator is $22. How many graphing calculators must be sold to make a profit (revenue – cost) of at least $295.80?
a.
b.
c.
d.
x 30 x 28 ; 30,28
x 9 x 31 ; 9,31
x 31 x 49 ; 31,49
x 29 x 51 ; 29,51

Slide 4 - 51Copyright © 2009 Pearson Education, Inc.
The revenue achieved by selling x graphing calculators is figured to be x(38 – 0.2x) dollars. The cost of each calculator is $22. How many graphing calculators must be sold to make a profit (revenue – cost) of at least $295.80?
a.
b.
c.
d.
x 30 x 28 ; 30,28
x 9 x 31 ; 9,31
x 31 x 49 ; 31,49
x 29 x 51 ; 29,51