Slide # 1 Copyright © 2013 HealthInsuranceCE LLC The Health Insurance Broker as Risk Manager some...
92
Slide # 1 Copyright © 2013 HealthInsuranceCE LLC The Health Insurance Broker as Risk Manager some slides from July 25 lecture in Westborough, MA Gary Fradin [email protected] 508-878-3785
-
Upload
della-nicholson -
Category
Documents
-
view
213 -
download
0
Transcript of Slide # 1 Copyright © 2013 HealthInsuranceCE LLC The Health Insurance Broker as Risk Manager some...

Slide # 1Copyright © 2013 HealthInsuranceCE LLC
The Health Insurance Brokeras Risk Manager
some slides from July 25 lecture in Westborough, MA
Gary [email protected]
508-878-3785

Slide # 2Copyright © 2013 HealthInsuranceCE LLC
Lecture outline
Putting consumerism into Consumer Driven
1. The need to manage healthcare risks2. Utilization risks (today’s focus)
– Which tests? Preference-sensitive decisions
3. Employee risks– Who gets sick? Disease patterns by income, status
4. One tool for managing test and Rx risks – Out of 100 people like me….
5. Treatment variation risks6. Conclusion: the high deductible / self insured
world

Slide # 3Copyright © 2013 HealthInsuranceCE LLC
Our point of departure: Wennberg, Tracking Medicine, page 117
It is not the prices, it is the use of care – the volume –
that matters more

Slide # 4Copyright © 2013 HealthInsuranceCE LLC
Consumer DrivenPhysician Driven
Government Driven
85% of medicine involves choices. Whose?Different risk management tools for each type
– Consumer driven = consumer decides• Facilities … also treatments, tests, medications etc• Management tool: teach consumers how to decide• Test: sometimes disagree with your doc, gov’t
recommendations
– Fact / Value distinction• Fact: Vitamin D strengthens bones & stresses
kidneys• Value: how to weigh facts. Risk averse?
Conservative? Which effect more important to you?

Slide # 5Copyright © 2013 HealthInsuranceCE LLC
Different risk management toolsNot today’s lecture
• Physician driven: physician decides– Management tool: alter physician behavior– Managed care / Kaiser Permanente
• Government driven: gov’t decides– VHA: excellent outcomes at lower costs– Mandates: e.g. free cancer screening ($ incentive)– Process: USPSTF, expert committee recommends,
Medicare funds, private carriers follow
Physician and Government Driven:Someone decides for you

Slide # 6Copyright © 2013 HealthInsuranceCE LLC
Part 1:Americans spend more on healthcare than anyone
else
Slide # 7Copyright © 2013 HealthInsuranceCE LLC
Americans Get More of Almost Everything
OECD Health at a Glance 2011, OECD Health Data 2012

Slide # 8Copyright © 2013 HealthInsuranceCE LLC

Slide # 9Copyright © 2013 HealthInsuranceCE LLC

Slide # 10Copyright © 2013 HealthInsuranceCE LLC

Slide # 11Copyright © 2013 HealthInsuranceCE LLC
Slide # 12Copyright © 2013 HealthInsuranceCE LLC
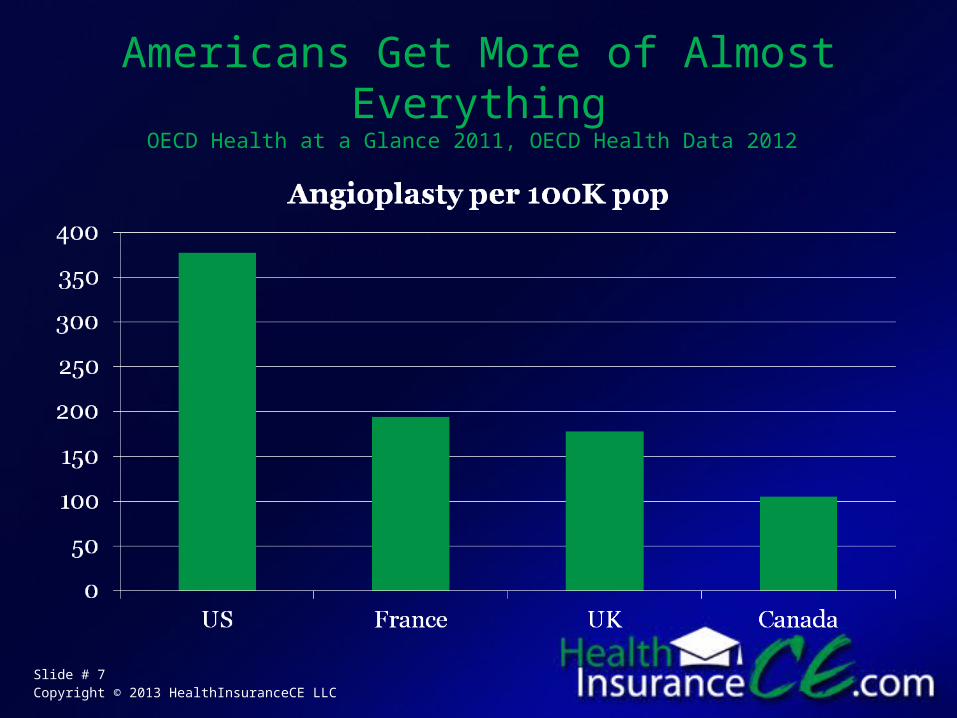
But Americans aren’t more satisfied‘Not feeling the benefits of high spending’ Khoury and Brown, 3/31/09,
Gallup.com

Slide # 13Copyright © 2013 HealthInsuranceCE LLC
Americans don’t enjoy better outcomes:Infant mortality rates
Deaths/1000 live births, OECD Health Data 2012

Slide # 14Copyright © 2013 HealthInsuranceCE LLC
Life Expectancy at Birthibid

Slide # 15Copyright © 2013 HealthInsuranceCE LLC
Life expectancy age 65, malesibid

Slide # 16Copyright © 2013 HealthInsuranceCE LLC
Summary iJohn Wennberg, Dartmouth Med School, Tracking Medicine, page 4
Much of healthcare is of questionable value
For example

Slide # 17Copyright © 2013 HealthInsuranceCE LLC
Stress TestsFrom the American College of Cardiology
choosingwisely.org
• 1. Don’t perform stress cardiac imaging in the initial evaluation of patients without cardiac symptoms unless high-risk markers are present.
• 2. Don’t perform annual stress cardiac as part of routine follow-up in asymptomatic patients.
• This practice may lead to unnecessary invasive procedures without any proven impact on patients’ outcomes.

Slide # 18Copyright © 2013 HealthInsuranceCE LLC
Back MRIsfrom American Academy of Family Physicians
106,000 members; choosingwisely.org
• Don’t do imaging for low back pain within the first six weeks, unless red flags are present.
• …Imaging of the lower spine before six weeks does not improve outcomes, but does increase costs. Low back pain is the fifth most common reason for all physician visits.

Slide # 19Copyright © 2013 HealthInsuranceCE LLC
And many more…
ChoosingWisely has
• 5 recommendations from each of• 26 medical societies =
• 130 medical tests and procedures that patients should not get…According to the medical society
whose members provide those services!

Slide # 20Copyright © 2013 HealthInsuranceCE LLC
Part 2
Utilization risksin a Consumer Driven world
Preference-sensitive decision making
the essence of consumer driven
Which medical risks concern you?Which medical interventions appeal to you?
How to make an informed decision?
Ask the right questions and get useful information
Slide # 21Copyright © 2013 HealthInsuranceCE LLC
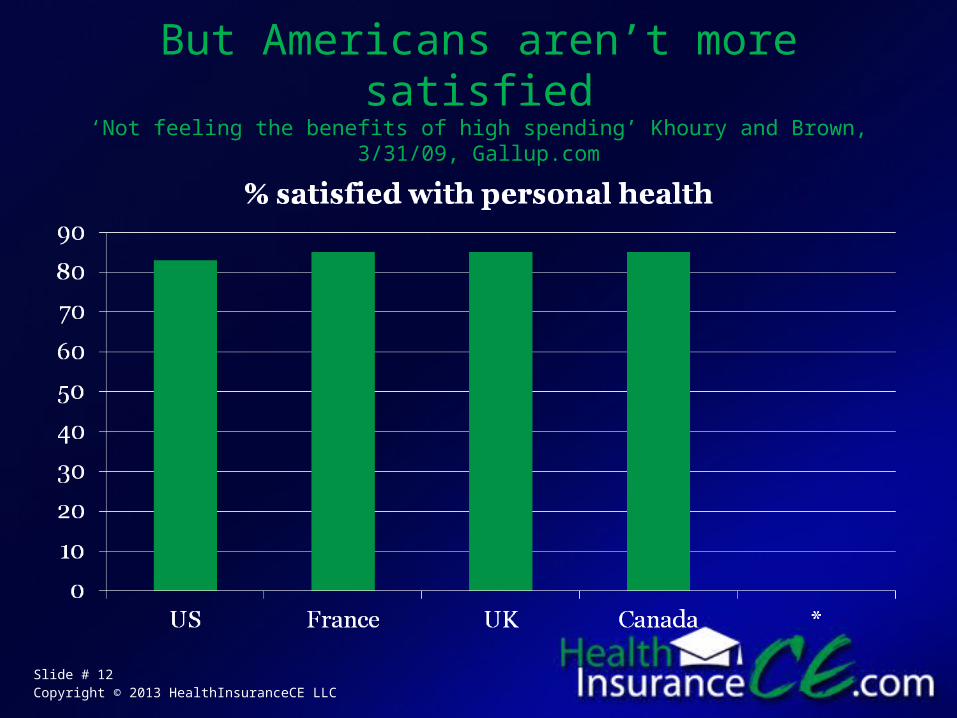
Noise vs. Useful InfoWhat is this car’s gas mileage?
(how many lives/1000 screened does this test save over 10 years?)
Noise• Very good gas mileage• 30% better than
competitors• Highly rated for gas
mileage• Most buyers recommend• Autobuyer.com rates ‘buy’• > 350 miles on a tank of gas• Owners average less than
$1000 in gas per year *• * compared to national average of
$1800
Useful Info
• 28 miles highway / 22 miles city

Slide # 22Copyright © 2013 HealthInsuranceCE LLC
Background
1 million internal substances, functions or chemicals that we can measure,
analyze and test Newman, Hippocrates’ Shadow, page 202
20,000/week
Which to worry about? Which to get screened for?Which to take meds for?
Slide # 23Copyright © 2013 HealthInsuranceCE LLC
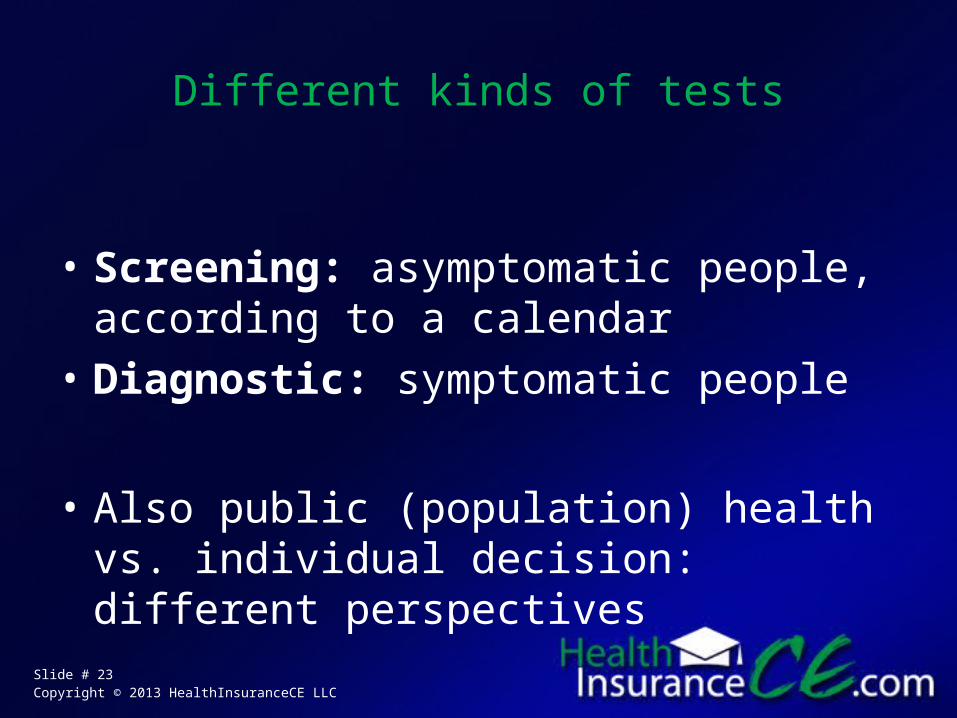
Different kinds of tests
• Screening: asymptomatic people, according to a calendar
• Diagnostic: symptomatic people
• Also public (population) health vs. individual decision: different perspectives

Slide # 24Copyright © 2013 HealthInsuranceCE LLC
Some potential tests partial list of ‘A’ from WebMD
• Abdominal MRI (look for tumors)
• Abdominal Tap (screen for liver cancer)
• Abdominal Ultrasound (liver, gallbladder, liver evaluation)
• Acoustic reflect test (screening for hearing problems)
• Activated Partial Thromboplastin Time (test of blood clotting)
• Adrenocorticotropic Hormone test (check for problems in pituitary or adrenal glands)

Slide # 25Copyright © 2013 HealthInsuranceCE LLC
Some cancer risksNational Cancer Institute and SEER Stat Fact Sheets
40 different cancers listed
Cancer Type New cases/year Deaths/year Vulva 4,700 990 Testicular 7,920 370 Cervix 12,340 4,030 Stomach 21,600 10,990 Pancreatic 45,220 38,460 Thyroid 60,220 1,850 Kidney and renal pelvis 65,150 13,680 Colon 142,820 50,830

Slide # 26Copyright © 2013 HealthInsuranceCE LLC
Some medical risks(thousands more)
• Ankylosing Spondylitis• Osgood-Schlatter's disease • Dercum's disease • Uterine leiomyosarcoma• Tardive Dyskinesia• Lupus (various forms)• Gaucher’s disease• Male breast cancer

Slide # 27Copyright © 2013 HealthInsuranceCE LLC
Just because a test or treatment exists doesn’t
mean you should have it!*
* Even if free!
Consumer Driven vs.Physician Driven vs.Government Driven

Slide # 28Copyright © 2013 HealthInsuranceCE LLC
How to decideA 4-step program
Useful info vs. Noise
• Determine Starting Risk– Chance of a specific bad event without medical
care
• Determine Modified Risk– Chance of same specific event with medical care
• Determine Treatment Benefit * (next slide)
– Impact of medical care: Starting Risk – Modified Risk
• Determine Treatment Risk(s) / Harms– Harms caused by the medical care

Slide # 29Copyright © 2013 HealthInsuranceCE LLC
* 3 potential reasons for treatment benefits:1. Better treatments2. Earlier treatment of symptomatic
people (due to more widespread education)
3. Early treatment of asymptomatic people, from screening

Slide # 30Copyright © 2013 HealthInsuranceCE LLC
Starting Risk
• Why you don’t wear a bike helmet when you walk

Slide # 31Copyright © 2013 HealthInsuranceCE LLC
Case study #1Would you have this test?
Considerations
Starting Risk: Do you need the test?
4 in 1000 die over 10 years;99.6% chance of not dying.
Modified Risk
Treatment Benefit
Treatment Harms

Slide # 32Copyright © 2013 HealthInsuranceCE LLC
Modified Risk:Does the test work well enough to have?
Considerations
Starting Risk: Do you need the test?
4 in 1000 die over 10 years;99.6% chance of not dying.
Modified Risk: How many still die with the test and associated care?
3 in 1000 still die over 10 years
Treatment Benefit
Treatment Harms

Slide # 33Copyright © 2013 HealthInsuranceCE LLC
Treatment Benefits:Does the test work well enough to have?
Considerations
Starting Risk: Do you need the test?
4 in 1000 die over 10 years;99.6% chance of not dying.
Modified Risk: How many still die with the test and associated care?
3 in 1000 still die over 10 years
Treatment Benefit: How many benefit by avoiding death?
1 fewer death per 1000 people over 10 years
Treatment Harms
Slide # 34Copyright © 2013 HealthInsuranceCE LLC
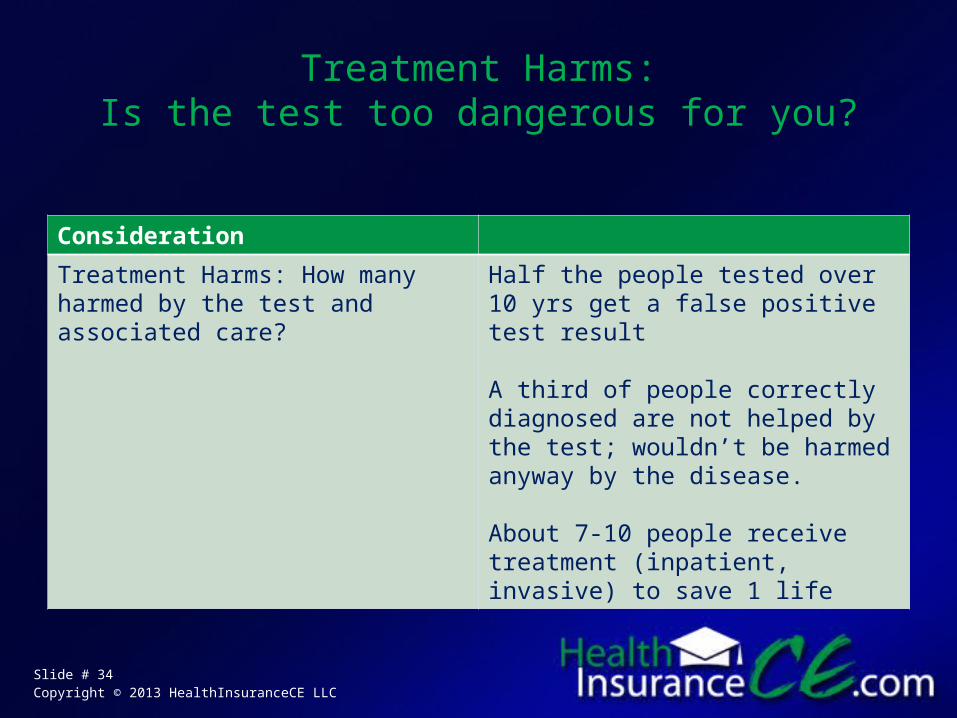
Treatment Harms:Is the test too dangerous for you?
Consideration
Treatment Harms: How many harmed by the test and associated care?
Half the people tested over 10 yrs get a false positive test result
A third of people correctly diagnosed are not helped by the test; wouldn’t be harmed anyway by the disease.
About 7-10 people receive treatment (inpatient, invasive) to save 1 life

Slide # 35Copyright © 2013 HealthInsuranceCE LLC
Summary:Would you have this test?
Considerations
Starting Risk: Do you need the test? 4 in 1000 die over 10 years;99.6% chance of not dying.
Modified Risk: How many still die with the test and associated care?
3 in 1000 still die over 10 years
Treatment Benefit: How many benefit by avoiding death?
1 fewer death per 1000 people over 10 years
Treatment Harms: How many harmed by the test and associated care?
50% false positives over 10 yrs.
30% of true positive results are unnecessarily diagnosed and not helped by the test.
About 7-10 people receive treatment (invasive, aggressive) to save 1 life

Slide # 36Copyright © 2013 HealthInsuranceCE LLC
What is this test and condition?
• Mammography for breast cancer• Benefit and risk data for 50 year old
woman over 10 years

Slide # 37Copyright © 2013 HealthInsuranceCE LLC
References
• Starting Risk: Risk Charts, Woloshin, Journal National Cancer Institute, June 5, 2002
• Mammography Benefit: Otis Brawley est that mammography + better breast awareness reduces breast cancer mortality by 15 – 30%, various articles, American Cancer Society website, How We Do Harm
• Mammography risks: US Preventive Services Task Force, Woloshin, JAMA, 2010

Slide # 38Copyright © 2013 HealthInsuranceCE LLC
‘big’ or ‘small’ impact‘good’ gas mileage
• 1 in 100 - 150 heart attacks prevented is ‘major’, ‘significant’ or ‘big benefit’
• But .6 in 100 - 150 diabetes caused is ‘rare’, ‘infrequent’ or ‘minor’

Slide # 39Copyright © 2013 HealthInsuranceCE LLC
Get numbers!
But you need to ask the right questions to get the right numbers
Slide # 40Copyright © 2013 HealthInsuranceCE LLC
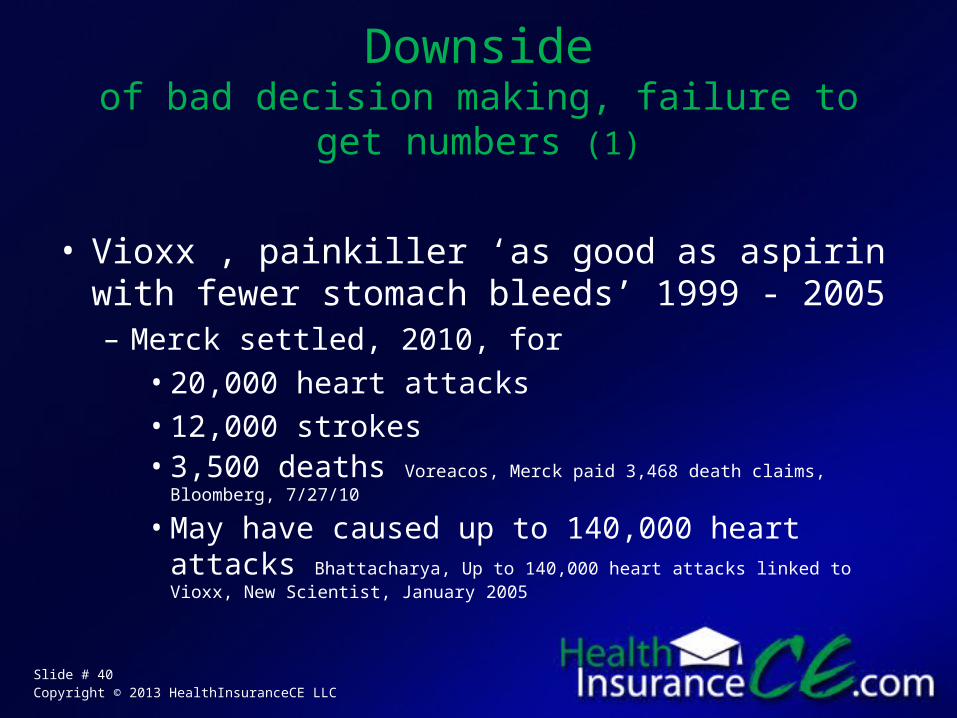
Downsideof bad decision making, failure to get
numbers (1)
• Vioxx , painkiller ‘as good as aspirin with fewer stomach bleeds’ 1999 - 2005– Merck settled, 2010, for• 20,000 heart attacks• 12,000 strokes• 3,500 deaths Voreacos, Merck paid 3,468 death claims,
Bloomberg, 7/27/10
• May have caused up to 140,000 heart attacks Bhattacharya, Up to 140,000 heart attacks linked to Vioxx, New Scientist, January 2005

Slide # 41Copyright © 2013 HealthInsuranceCE LLC
Downsideof bad decision making, failure to get numbers (2)
Harris, Research ties diabetes drug to heart woes, NY Times, 2/19/10
• Avandia, $3.2 billion sales 2006• US gov’t report: if all people taking
Avandia switched to a safer drug, would avoid– 500 heart attacks per month– 300 heart failures per month
• 304 people died during 3rd quarter, 2009 alone
Slide # 42Copyright © 2013 HealthInsuranceCE LLC
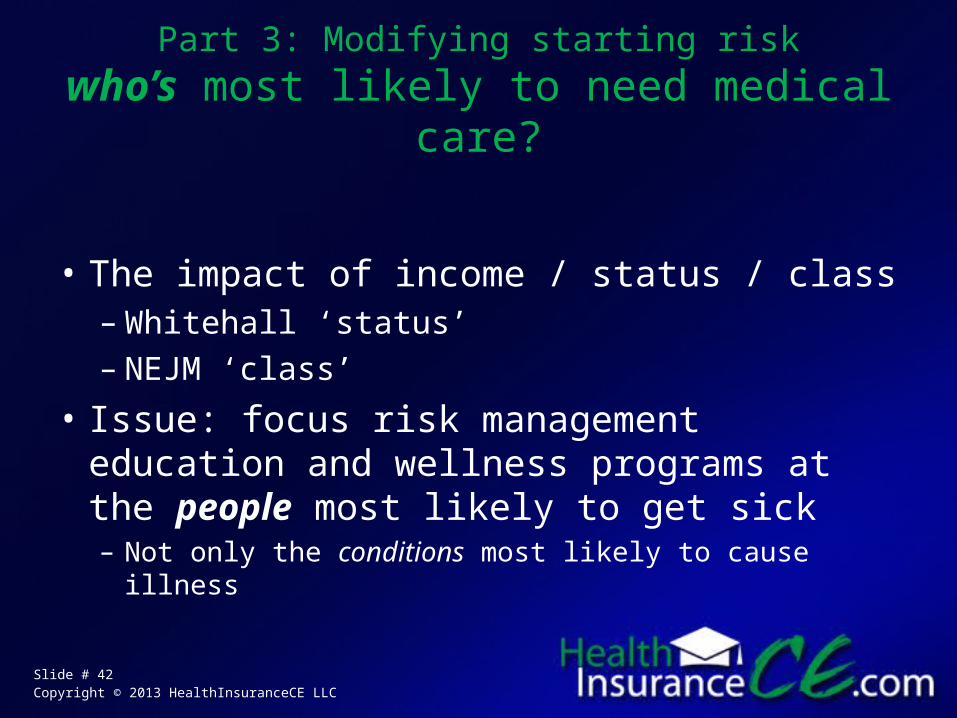
Part 3: Modifying starting riskwho’s most likely to need medical
care?
• The impact of income / status / class –Whitehall ‘status’–NEJM ‘class’
• Issue: focus risk management education and wellness programs at the people most likely to get sick– Not only the conditions most likely to cause
illness

Slide # 43Copyright © 2013 HealthInsuranceCE LLC
Sir Michael MarmotDirector of the Whitehall studiesglobetrotter.berkeley.edu/people2/marmot
• Firstly, just looking at heart disease, it was not the case that people in high stress jobs had a higher risk of heart attack, rather it went exactly the other way: people at the bottom of the hierarchy had a higher risk of heart attacks.
• Secondly, it was a social gradient. The lower you were in the hierarchy, the higher the risk. So it wasn't top versus bottom, but it was graded.
• And, thirdly, the social gradient applied to all the major causes of death.

Slide # 44Copyright © 2013 HealthInsuranceCE LLC
Marmot’s exampleRemember – this study was from 1970s – early 2000s
• How many times have you called the telephone company, and, in exasperation, asked to speak to the person's supervisor? You do this because the discretion of the lower-status [and lower paid] person to make decisions is limited
• Boss derides secretary for making mistakes, destroys her self confidence
• ‘Underling’ given instructions by manager that are inefficient ‘I like reports this way’ – even if underling has better way to do it
• Cleaner gets reprimanded for washing floors incorrectly…
But bank president doesn’t get fired for making a bad loan!

Slide # 45Copyright © 2013 HealthInsuranceCE LLC
Class – the ignored determinant of the nation’s health
NEJM, Sept 9, 2004
• Differences in rates of premature death, illness and disability are closely tied to socio-economic status
• Unhealthy behavior and lifestyle alone do not explain the poor health of those in lower classes
• There is something about lower socioeconomic status itself that increases the risk of premature death

Slide # 46Copyright © 2013 HealthInsuranceCE LLC
Other examplesDrexler, The People’s Epidemiologists, Harvard Magazine, March 2006
• Smoking cessation attempts same for working class and higher class people. Success rates vary. Will power? Social supports?– Or because job so boring that lighting up only
way to break the tedium?

Slide # 47Copyright © 2013 HealthInsuranceCE LLC
Breast cancer survival ratesBouchardy et al, Social class is an important and independent prognostic factor of breast cancer mortality, International Journal of Cancer, Vol 119,
Issue 5, March 2006
• In this study, we clearly demonstrate that breast cancer patients of low Socio-Economic Status have a significantly increased risk of dying as a result of breast cancer compared to the risk in patients of high SES.
• Low SES patients were diagnosed at a later stage, had different tumor characteristics and more often received suboptimal treatment.
• However, these important prognostic factors explained less than 50% of the overmortality linked to low SES.

Slide # 48Copyright © 2013 HealthInsuranceCE LLC
ibid.
Even after adjusting for all these factors, the risk of dying of breast cancer remained 70% higher among patients of low SES than that among patients of high SES.

Slide # 49Copyright © 2013 HealthInsuranceCE LLC
Summary observationsDrexler, Harvard Magazine
• ‘an individual’s health can’t be torn from context and history. We are both social and biological beings….
• and the social is every bit as real as the biological’

Slide # 50Copyright © 2013 HealthInsuranceCE LLC
Back to Michael Marmot
• The social gradient applied to all the major causes of death -- to cardiovascular disease, to gastrointestinal disease, to renal disease, to stroke, to accidental and violent deaths, to cancers that were not related to smoking as well as cancers that were related to smoking -- all the major causes of death.

Slide # 51Copyright © 2013 HealthInsuranceCE LLC
• We see similar findings in the United States, in Canada, in Australia, New Zealand, and most European countries that looked for it.
Slide # 52Copyright © 2013 HealthInsuranceCE LLC
• we looked at the usual risk factors that one believes that are related to lifestyle -- smoking prime among them, but plasma cholesterol, related in part to fatty diet and an overweight, sedentary lifestyle.
• We asked how much of the social gradient in coronary disease could be accounted for by smoking, blood pressure, cholesterol, overweight, and being sedentary.
• The answer was somewhere between a quarter and a third, no more.

Slide # 53Copyright © 2013 HealthInsuranceCE LLC
• we looked at never smokers, and we found the same gradient in never smokers as we found in smokers.
• two-thirds, at least, of this gradient is unexplained….

Slide # 54Copyright © 2013 HealthInsuranceCE LLC
Bell curve: % of employees with various disease factors
(smoking, obesity, cholesterol, blood pressure, blood sugar, etc)
What causes disease?
Slide # 55Copyright © 2013 HealthInsuranceCE LLC
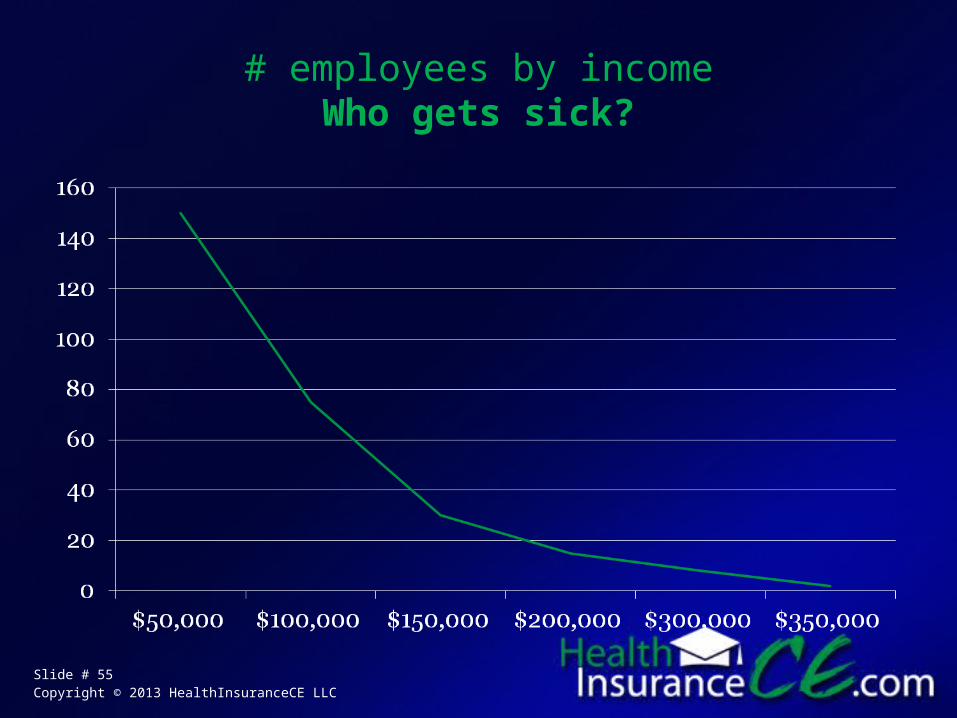
# employees by incomeWho gets sick?

Slide # 56Copyright © 2013 HealthInsuranceCE LLC
Risk management example:Hypothetical company
• 10 employees earn > $250,000 (high status)
• 100 earn < $35,000 (low status, $15/hour, 45 hours/wk)
• According to Marmot– For every 1 heart attack in the highly
compensated group….
–30 in the lowest income group• (3x the risk) x (10x the number of employees)

Slide # 57Copyright © 2013 HealthInsuranceCE LLC
Marmot
• we showed very clear social differences in people's experience of the workplace -- how much control they had at work, how fairly they were treated at work, how interesting their work was.
• All of which correlated to disease and mortality rates

Slide # 58Copyright © 2013 HealthInsuranceCE LLC
Summary so far
• Much medical care provides no benefit• ‘Necessary’ and ‘unnecessary’ defined by
each consumer– Requires consumer involvement and education
• ‘Treatment benefit’ = starting risk – modified risk
• ‘Starting risk’ and ‘treatment benefit’ defined by both biology and demography

Slide # 59Copyright © 2013 HealthInsuranceCE LLC
Part 4:
Managing Preventive Test and Rx Risks
Does ‘better safe than sorry’ mean anything?

Slide # 60Copyright © 2013 HealthInsuranceCE LLC
4 questions to askwhen you research, advise, talk to physicians
Phrasing is critical!
• 1. Out of 100 people like me, how many will have the bad medical event without medical intervention?
• 2. Out of 100 people like me, how many will still have the bad medical event with medical intervention?
• 3. Out of 100 like me, how many benefit by avoiding the bad medical event?
• 4. Out of 100 people like me, how many harmed by the test and treatment?

Slide # 61Copyright © 2013 HealthInsuranceCE LLC
Out of 100 people…
• Absolute risk reduction• Question requires answer of a
number• Reason: avoid relative risk reduction
numbers

Slide # 62Copyright © 2013 HealthInsuranceCE LLC
relative risk reduction always exaggerates
Absolute risk reduction
• Starting risk: 2 in 100• Modified risk: 1 in 100• Risk reduction: 1 in
100• Summary statement:
This treatment benefits 1% of people who have it.
Relative risk reduction
• Starting risk: 2 in 100• Modified risk: 1 in 100• Risk reduction: 1 in 2• Summary statement:
This treatment cuts your risk by 50%, or
• 50% fewer heart attacks, breast cancer deaths, etc

Slide # 63Copyright © 2013 HealthInsuranceCE LLC
Avoid all this confusion…
Ask
Out of 100 people…..

Slide # 64Copyright © 2013 HealthInsuranceCE LLC
Out of 100 people
like me• Reported, advertised data often best case– We generally don’t know the population
• Many of our treatments haven’t been rigorously studied, and even if they have, large swaths of the population are woefully underrepresented in clinical trials — the very old, the very sick, women, members of racial and ethnic minorities, children, pregnant women and those low on the socioeconomic scale. Uncertainty is Hard for Doctors, Danielle Orfi MD, NY Times, 6/6/13

Slide # 65Copyright © 2013 HealthInsuranceCE LLC
ATPIIIThird Report of the National Cholesterol Education Program Expert Panel on
Detection, Evaluation and Treatment of High Blood Cholesterol in Adults, pages II-31 and II-32
• “Two primary prevention studies with statins were the West of Scotland Coronary Prevention Study and the Air Force/Texas Atherosclerosis Prevention Study”
• “In both trials, statin therapy significantly reduced relative risk for major coronary events”

Slide # 66Copyright © 2013 HealthInsuranceCE LLC
West of Scotlanda Whitehall-type analysis
Quotes from various BBC reports
• Glasgow ‘world’s heart attack capital’ BBC, 1999
• A stressful job, where people have little control over their work, increased the risk of heart disease by half. ‘Glasgow heart disease leader’ BBC Nov 21, 2000
• ‘Scots have worse rates of heart disease than their bad lifestyles would explain’ BBC, ‘English have healthier hearts’ 2007
What was Glasgow’s economic situation?

Slide # 67Copyright © 2013 HealthInsuranceCE LLC
Breakthrough Glasgow: Ending the Costs of Social Breakdown, 2008, bbc.co.uk
• Nearly 110,000 working-age residents in Glasgow are economically inactive, accounting for almost 30 per cent of Glasgow’s total working-age population.
• Researchers developed a new category to describe Glasgow residents: Shettleston Man

Slide # 68Copyright © 2013 HealthInsuranceCE LLC
• Shettleston Man is the collective name given for a group of men in Shettleston.
• Shettleston Man’s life expectancy is 63, he lives in social housing and is terminally out of work.
• His white blood cell count is killing him due to the stress of living in deprivation.
Does this sound like your clients?

Slide # 69Copyright © 2013 HealthInsuranceCE LLC
Who participates in drug trials?
• Boston Metro: lots of medical trial ads
• Boston Globe, New York Times: no medical trial ads
What does this suggest?
Slide # 70Copyright © 2013 HealthInsuranceCE LLC
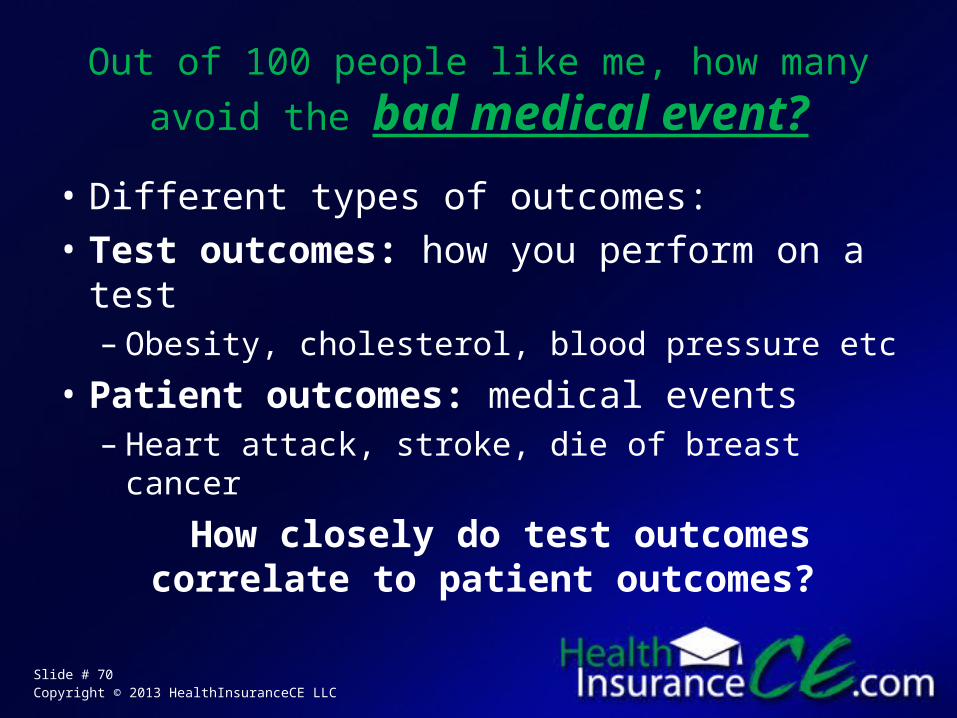
Out of 100 people like me, how many avoid
the bad medical event?
• Different types of outcomes:• Test outcomes: how you perform on
a test– Obesity, cholesterol, blood pressure etc
• Patient outcomes: medical events–Heart attack, stroke, die of breast cancer
How closely do test outcomescorrelate to patient outcomes?

Slide # 71Copyright © 2013 HealthInsuranceCE LLC
ZETIA exampledifference between test and patient outcomes
• Test benefit: • in a clinical study, people who added ZETIA to
their statin medication reduced their bad cholesterol on average by an additional 25% compared with 4% in people who added a placebo. Parade magazine 9/11/11
• Patient benefit
• ZETIA has not been shown to prevent heart disease or heart attacks ibid.
• ZETIA annual sales: about $2 billion

Slide # 72Copyright © 2013 HealthInsuranceCE LLC
NiacinThomas, NY Times, Dec 20, 2012, Merck Says Niacin Drug Has Failed Large
TrialsHerper, Forbes, Dec 20, 2012, Why Merck’s Niacin Failure Will Scare Drug
Researchers
• Niacin (B3) raises HDL (good) cholesterol and slightly lowers LDL (bad). – ‘has been used for 40 years to help millions of
patients control their cholesterol’ (Herper)…– including Niaspin, Abbott Labs, annual sales $900
million
• But 4 year study of 26,000 people found no reduction heart attacks, strokes, deaths or procedures
Higher HDL ≠ fewer heart attacksTest benefit ≠ patient benefit

Slide # 73Copyright © 2013 HealthInsuranceCE LLC
When you know the patient benefit…and even if the test or treatment is free
…
Are the benefits good enough for you?
»Mammography»Statins»Blood sugar lowering meds»Knee surgery, etc
Consider risks too!

Slide # 74Copyright © 2013 HealthInsuranceCE LLC
Better safe than sorry?
No!• There are risks and benefits of
testing…– And risks and benefits of not testing.
• Benefits and risks of taking preventive meds– And benefits and risks of not taking
• Individual decision…
if you have the right tools

Slide # 75Copyright © 2013 HealthInsuranceCE LLC
Broker’s role
• 1. Empower people to make their own medical decisions … –with their doc, of course!
• 2. Provide them with decision-making tools– Right questions to ask, info to get
Slide # 76Copyright © 2013 HealthInsuranceCE LLC
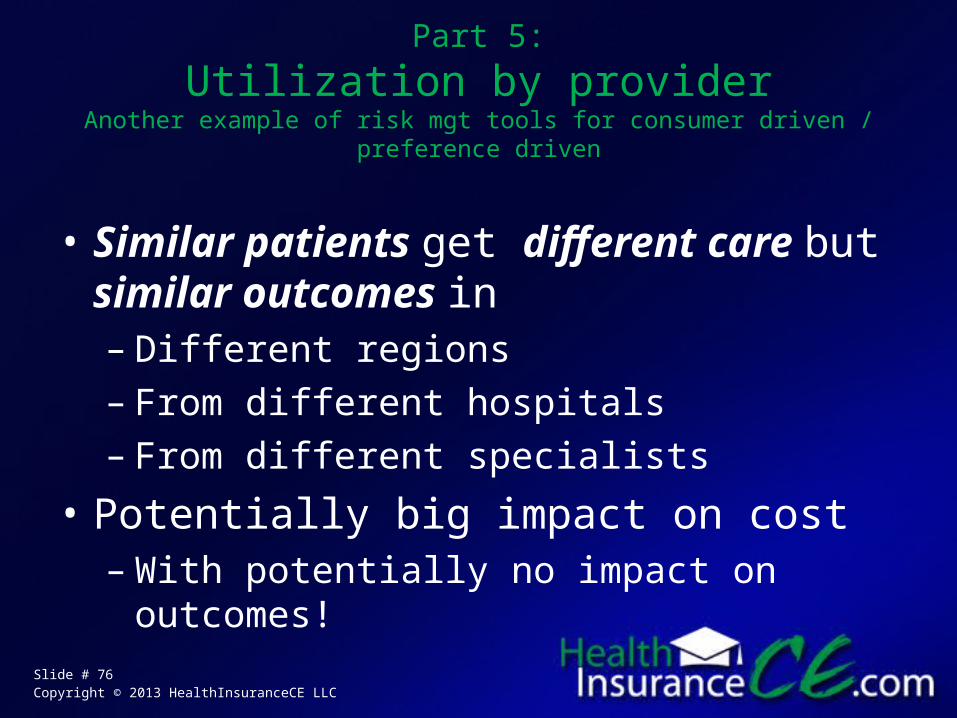
Part 5:
Utilization by providerAnother example of risk mgt tools for consumer driven / preference
driven
• Similar patients get different care but similar outcomes in– Different regions– From different hospitals– From different specialists
• Potentially big impact on cost–With potentially no impact on
outcomes!

Slide # 77Copyright © 2013 HealthInsuranceCE LLC
Utilization by regionMastectomies per 100,000 Medicare women,
2010, Dartmouth Atlas

Slide # 78Copyright © 2013 HealthInsuranceCE LLC
Breast cancer incidence per 100K womenAmerican Cancer Society, Cancer Facts and Figures, 2011-2012

Slide # 79Copyright © 2013 HealthInsuranceCE LLC
Breast cancer mortality per 100,000 women
http://www.cancer.org/acs/groups/content/@epidemiologysurveilance/documents/document/acspc-030975.pdf
Slide # 80Copyright © 2013 HealthInsuranceCE LLC
Consumer Driven Risk Mgt tool
Am I in a high or low utilization region?
Explain what utilization means
Can I have referral for 2nd opinion in a different utilization region?

Slide # 81Copyright © 2013 HealthInsuranceCE LLC
Utilization by Hospital: C-sectionsMin 490 deliveries
mass.gov/birth report, 2009

Slide # 82Copyright © 2013 HealthInsuranceCE LLC
Why the differences?Globe, Why Caesarean birth rates differ at area hospitals, June 7, 2010
• Dr. Lauren Smith, Medical Director, Mass DPH:
– “There are a complex array of factors that contribute in each individual case to whether or not a woman delivers vaginally or via caesarean … some of those are factors are at the hospital level, such as how do they organize the staffing of their labor and delivery units, what are the resources that might be available”
Other states looked into same phenomenon

Slide # 83Copyright © 2013 HealthInsuranceCE LLC
Big impact on costs:
C-sections cost about $5,000 more!

Slide # 84Copyright © 2013 HealthInsuranceCE LLC
Consumer Driven Risk Mgt Tool
What are the C-section rates at my local hospitals?
Do I increase or decrease my risks – or my baby’s - by using a different
hospital?Requires outcome data by hospital

Slide # 85Copyright © 2013 HealthInsuranceCE LLC
Beware of choosing hospital network based on price
You need to know utilization rates also!

Slide # 86Copyright © 2013 HealthInsuranceCE LLC
Lower priced hospitals?C-section rates

Slide # 87Copyright © 2013 HealthInsuranceCE LLC
Possible broker actionsNot ‘go to lowest priced hospital’
• 1. Publicize C-section rates• 2. Reference-based pricing to hospitals
with lowest C-section rates, not lowest negotiated vaginal delivery prices
• 3. Reduce employee contribution to hospitals with lower C-section rates
Need to incorporate utilization rates with listed prices to
manage risk!

Slide # 88Copyright © 2013 HealthInsuranceCE LLC
Massachusetts inpatient coronary angiography
per 1000 Medicare, 2010

Slide # 89Copyright © 2013 HealthInsuranceCE LLC
The concerns:
• 1. The cost. Perhaps $5,000/angiogram• 2. The findings.– Since most people who are middle-aged and
older have atherosclerosis, the angiogram will more often than not show a narrowing. Inevitably, the patient gets a stent. Kolata, NY Times, 3/21/04
• 3. Stent insertion costs about $11,000 Wieffering, Patients and taxpayers bear the cost of stent wars, Star Tribune, 6/18/2011

Slide # 90Copyright © 2013 HealthInsuranceCE LLC
Morale
Where you go is what you get
Risk Mgt Tool:Ask the right questions!
• Am I in a high or low utilization region?• How frequently does the test lead to
treatment?• How frequently does the treatment help?
(out of 100 people like me….)
Slide # 91Copyright © 2013 HealthInsuranceCE LLC
Impact of High Deductibles and Self Insurance
• Change the incentives• Change the risk-management focus• From physician driven, control
physicians• To consumer driven, empower
consumers– Both cost and quality-based decision
making

Slide # 92Copyright © 2013 HealthInsuranceCE LLC
Conclusion:Stages of facing new broker realities
Wennberg
• Stage 1. “The data are wrong”• Stage 2. “The data are right, but it’s
not a problem”• Stage 3. “The data are right, it is a
problem, but it is not my problem”
• Stage 4. “I accept the burden of improvement”