Sleep Stage Classification Based on Multi-level Feature · PDF file ·...
11
1 Sleep Stage Classification Based on Multi-level Feature Learning and Recurrent Neural Networks via Wearable Device Xin Zhang, Weixuan Kou, Eric I-Chao Chang, He Gao, Yubo Fan and Yan Xu* Abstract—This paper proposes a practical approach for auto- matic sleep stage classification based on a multi-level feature learning framework and Recurrent Neural Network (RNN) classifier using heart rate and wrist actigraphy derived from a wearable device. The feature learning framework is designed to extract low- and mid-level features. Low-level features capture temporal and frequency domain properties and mid-level fea- tures learn compositions and structural information of signals. Since sleep staging is a sequential problem with long-term dependencies, we take advantage of RNNs with Bidirectional Long Short-Term Memory (BLSTM) architectures for sequence data learning. To simulate the actual situation of daily sleep, experiments are conducted with a resting group in which sleep is recorded in resting state, and a comprehensive group in which both resting sleep and non-resting sleep are included. We evaluate the algorithm based on an eight-fold cross validation to classify five sleep stages (W, N1, N2, N3, and REM). The proposed algorithm achieves weighted precision, recall and F1 score of 58.0%, 60.3%, and 58.2% in the resting group and 58.5%, 61.1%, and 58.5% in the comprehensive group, respectively. Various comparison experiments demonstrate the effectiveness of feature learning and BLSTM. We further explore the influence of depth and width of RNNs on performance. Our method is specially proposed for wearable devices and is expected to be applicable for long-term sleep monitoring at home. Without using too much prior domain knowledge, our method has the potential to generalize sleep disorder detection. Index Terms—Heart rate, Long Short-Term Memory, Recur- rent neural networks, Sleep stage classification, Wearable device. I. I NTRODUCTION This work is supported by Microsoft Research under the eHealth program, the National Natural Science Foundation in China under Grant 81771910, the National Science and Technology Major Project of the Ministry of Science and Technology in China under Grant 2017YFC0110903, the Beijing Natural Science Foundation in China under Grant 4152033, the Technology and Innovation Commission of Shenzhen in China under Grant shenfagai2016- 627, the Beijing Young Talent Project in China, the Fundamental Research Funds for the Central Universities of China under Grant SKLSDE-2017ZX- 08 from the State Key Laboratory of Software Development Environment in Beihang University in China, the 111 Project in China under Grant B13003. * indicates corresponding author. Xin Zhang, Weixuan Kou, Yubo Fan and Yan Xu are with the State Key Laboratory of Software Development Environment and the Key Laboratory of Biomechanics and Mechanobiology of Ministry of Education and Research Institute of Beihang University in Shenzhen and Beijing Advanced Innovation Centre for Biomedical Engineering, Beihang University, Beijing 100191, China (email: [email protected]; [email protected]; yubo- [email protected]; [email protected]). Eric I-Chao Chang, and Yan Xu are with Microsoft Research, Beijing 100080, China (email:[email protected]; [email protected]). He Gao is with Clinical Sleep Medicine Center, the General Hospital of the Air Force, Beijing 100142, China (email:[email protected]). S LEEP is a fundamental physiological activity of the hu- man body, which contributes to self-recovery and memory consolidation [1], [2]. Regular sleep facilitates the performance of daily work. However, many sleep disorders, such as in- somnia, apnea, and narcolepsy, disturb sleep quality and thus threaten human health [3]. Effective diagnosis and treatment of these sleep disturbances rely on accurate detection of sleep and sleep cycles [4]. Therefore, sleep stage classification is a premise and significant step for sleep analysis. The standard technique for scoring sleep is to use polysomnography (PSG) to synchronously record multichan- nel biological signals which include electroencephalogram (EEG), electrooculogram (EOG), electromyogram (EMG), electrocardiogram (ECG), respiratory effort signals, blood oxygen saturation, and other measurements all through the night in a hospital. These recordings are divided into nonover- lapping 30-second epochs. Domain experts evaluate sleep epoch by epoch, based on Rechtschaffen and Kales (R&K) rules [5] and the more recent American Academy of Sleep Medicine (AASM) [6] guideline. According to the AASM, sleep is categorized into five stages: Wake (W), Rapid Eye Movement (REM) and Non-Rapid Eye Movement (NREM, including N1, N2, and N3). Monitoring sleep through the PSG system has many dis- advantages with respect to home use. First, patients have to wear numerous sensors on different parts of the body. It may negatively impact patients’ normal sleep and thus produce discrepant results which are not able to reflect the actual sleep condition. Second, PSG is expensive, which makes it not available for most ordinary families. Third, PSG is not portable, making it inappropriate for long-term home monitor- ing. To overcome the above shortcomings, utilizing a wearable device in place of the PSG system to classify sleep stages automatically is a promising strategy. A wearable device can readily record heart rate and body movement without causing many obstructions to natural sleep. Additionally, relationships between sleep stage transition and both heart rate and body movement have been extensively investigated in previous studies [7], [8]. By designing a suitable algorithm based on such a principle, the wearable device can be an alternative choice to score sleep automatically at home. Many physiological studies of sleep have indicated that sleep structure is associated with autonomic nervous system (ANS) regulation [7], [9], [10]. The contribution of parasym- pathetic and sympathetic activity varies between different sleep stages. Meanwhile, ANS activity during sleep can be measured arXiv:1711.00629v1 [stat.ML] 2 Nov 2017
Transcript of Sleep Stage Classification Based on Multi-level Feature · PDF file ·...
1
Sleep Stage Classification Based on Multi-levelFeature Learning and Recurrent Neural Networks
via Wearable DeviceXin Zhang, Weixuan Kou, Eric I-Chao Chang, He Gao, Yubo Fan and Yan Xu*
Abstract—This paper proposes a practical approach for auto-matic sleep stage classification based on a multi-level featurelearning framework and Recurrent Neural Network (RNN)classifier using heart rate and wrist actigraphy derived from awearable device. The feature learning framework is designed toextract low- and mid-level features. Low-level features capturetemporal and frequency domain properties and mid-level fea-tures learn compositions and structural information of signals.Since sleep staging is a sequential problem with long-termdependencies, we take advantage of RNNs with BidirectionalLong Short-Term Memory (BLSTM) architectures for sequencedata learning. To simulate the actual situation of daily sleep,experiments are conducted with a resting group in which sleepis recorded in resting state, and a comprehensive group in whichboth resting sleep and non-resting sleep are included. We evaluatethe algorithm based on an eight-fold cross validation to classifyfive sleep stages (W, N1, N2, N3, and REM). The proposedalgorithm achieves weighted precision, recall and F1 score of58.0%, 60.3%, and 58.2% in the resting group and 58.5%,61.1%, and 58.5% in the comprehensive group, respectively.Various comparison experiments demonstrate the effectiveness offeature learning and BLSTM. We further explore the influenceof depth and width of RNNs on performance. Our method isspecially proposed for wearable devices and is expected to beapplicable for long-term sleep monitoring at home. Without usingtoo much prior domain knowledge, our method has the potentialto generalize sleep disorder detection.
Index Terms—Heart rate, Long Short-Term Memory, Recur-rent neural networks, Sleep stage classification, Wearable device.
I. INTRODUCTION
This work is supported by Microsoft Research under the eHealth program,the National Natural Science Foundation in China under Grant 81771910, theNational Science and Technology Major Project of the Ministry of Scienceand Technology in China under Grant 2017YFC0110903, the Beijing NaturalScience Foundation in China under Grant 4152033, the Technology andInnovation Commission of Shenzhen in China under Grant shenfagai2016-627, the Beijing Young Talent Project in China, the Fundamental ResearchFunds for the Central Universities of China under Grant SKLSDE-2017ZX-08 from the State Key Laboratory of Software Development Environment inBeihang University in China, the 111 Project in China under Grant B13003.* indicates corresponding author.
Xin Zhang, Weixuan Kou, Yubo Fan and Yan Xu are with the State KeyLaboratory of Software Development Environment and the Key Laboratory ofBiomechanics and Mechanobiology of Ministry of Education and ResearchInstitute of Beihang University in Shenzhen and Beijing Advanced InnovationCentre for Biomedical Engineering, Beihang University, Beijing 100191,China (email: [email protected]; [email protected]; [email protected]; [email protected]).
Eric I-Chao Chang, and Yan Xu are with Microsoft Research, Beijing100080, China (email:[email protected]; [email protected]).
He Gao is with Clinical Sleep Medicine Center, the General Hospital ofthe Air Force, Beijing 100142, China (email:[email protected]).
SLEEP is a fundamental physiological activity of the hu-man body, which contributes to self-recovery and memory
consolidation [1], [2]. Regular sleep facilitates the performanceof daily work. However, many sleep disorders, such as in-somnia, apnea, and narcolepsy, disturb sleep quality and thusthreaten human health [3]. Effective diagnosis and treatmentof these sleep disturbances rely on accurate detection of sleepand sleep cycles [4]. Therefore, sleep stage classification is apremise and significant step for sleep analysis.
The standard technique for scoring sleep is to usepolysomnography (PSG) to synchronously record multichan-nel biological signals which include electroencephalogram(EEG), electrooculogram (EOG), electromyogram (EMG),electrocardiogram (ECG), respiratory effort signals, bloodoxygen saturation, and other measurements all through thenight in a hospital. These recordings are divided into nonover-lapping 30-second epochs. Domain experts evaluate sleepepoch by epoch, based on Rechtschaffen and Kales (R&K)rules [5] and the more recent American Academy of SleepMedicine (AASM) [6] guideline. According to the AASM,sleep is categorized into five stages: Wake (W), Rapid EyeMovement (REM) and Non-Rapid Eye Movement (NREM,including N1, N2, and N3).
Monitoring sleep through the PSG system has many dis-advantages with respect to home use. First, patients have towear numerous sensors on different parts of the body. It maynegatively impact patients’ normal sleep and thus producediscrepant results which are not able to reflect the actualsleep condition. Second, PSG is expensive, which makes itnot available for most ordinary families. Third, PSG is notportable, making it inappropriate for long-term home monitor-ing. To overcome the above shortcomings, utilizing a wearabledevice in place of the PSG system to classify sleep stagesautomatically is a promising strategy. A wearable device canreadily record heart rate and body movement without causingmany obstructions to natural sleep. Additionally, relationshipsbetween sleep stage transition and both heart rate and bodymovement have been extensively investigated in previousstudies [7], [8]. By designing a suitable algorithm based onsuch a principle, the wearable device can be an alternativechoice to score sleep automatically at home.
Many physiological studies of sleep have indicated thatsleep structure is associated with autonomic nervous system(ANS) regulation [7], [9], [10]. The contribution of parasym-pathetic and sympathetic activity varies between different sleepstages. Meanwhile, ANS activity during sleep can be measured
arX
iv:1
711.
0062
9v1
[st
at.M
L]
2 N
ov 2
017

2
using heart rate variability (HRV) as a quantitative indexof parasympathetic or sympathetic output [11]–[13]. Hence,it is reasonable to consider making use of heart rate fordetermining sleep stages. More specifically, the sympatheticinput is reduced and parasympathetic activity predominates inNREM sleep. Thus heart rate decreases, with less variability.During REM sleep, in contrast, sympathetic activity showsmore predominate influence. Accordingly, heart rate increasesand becomes more unstable [14]. The spectral componentsof heart rate also exhibit different characteristics in sleeptransition [9], [15]. The ratio of the power in low frequency(LF, 0.04-0.15 Hz) to high frequency (HF, 0.15-0.4 Hz) tendsto decrease in NREM sleep and significantly increase in REMsleep.
Quite a few sleep staging methods have been developedbased on HRV, with most of them emphasizing the appli-cability in home-based scenarios. Yoon et al. [16] designedthresholds and a heuristic rule based on automatic activa-tions derived from HRV to determine the slow wave sleep(SWS). An overall accuracy of 89.97% was achieved. Longet al. [17] also designed an SWS detection method usingcardiorespiratory signals. With a feature smoothing and timedelay procedures, they achieved a Cohen’s Kappa coefficientof 0.57. Ebrahimi et al. [18] extracted time-domain features,nonlinear-dynamics features and time-frequency features fromHRV using empirical mode decomposition (EMD) and discretewavelet transform (DWT), followed by linear discriminant(LD) and quadratic discriminant (QD) classifiers. Xiao et al.[19] extracted 41 HRV features in a similar way and randomforest (RF) [20] was used to classify 3 different sleep stages(wake, REM, and NREM). A mean accuracy of 72.58% wasachieved in the subject independent scheme.
Actigraphy-based methods which capture body movementduring sleep have long been investigated, especially to identifywake/sleep [8], [21], [22]. They are easy to understand sincethe body tends to remain stationary when we fall asleep, andthe motion amplitude becomes distinctively smaller than inwake state. Various studies have been implemented to evaluatesleep staging with actigraphy. Herscovici et al. [23] presentedan REM sleep detection algorithm based on the peripheralarterial tone (PAT) signal and actigraphy which were recordedwith an ambulatory wrist-worn device. Kawamoto et al. [24]demonstrated that respiratory information could be estimatedfrom actigraphy and detected REM sleep based on detectedrespiratory rate. Long et al. [25] designed features based ondynamic warping (DW) methods to classify sleep and wakeusing actigraphy and respiratory efforts.
So far, few sleep staging methods have been developed thatuse both heart rate and wrist actigraphy. Note that the twosignals can be easily derived together by a wearable device,it is worth attempting to design such a kind of algorithm.Furthermore, most protocols in previous studies focus ondesigning low-level features which are extracted in the timedomain, frequency domain, and nonlinear analysis. This causesthe effectiveness of feature extraction to be overly dependenton the expertise analysis of signals, which makes these hand-engineered features not robust and flexible enough to adaptdifferent circumstances. In this paper, we propose a multi-level
feature learning framework which extracts low- and mid-levelfeatures. Low-level features capture temporal and frequencydomain properties and mid-level features learn compositionsand structural information of signals. Specifically, the meanvalue and Discrete Cosine Transform (DCT) [26] are adoptedto heart rate and cepstral analysis [27] is adopted to wristactigraphy to extract low-level features, respectively. Mid-levelfeatures are extracted based on low-level ones.
Recently, deep learning theories have made dramaticprogress, based on which state-of-the-art results are achievedin many important applications. With complicated networkarchitectures, deep learning methods can mine informationwithout finely designed features, showing stronger robustness.Tsinalis et al. [28] utilized convolutional neural networks(CNNs) based on single-channel raw EEG to predict sleepstages without using prior domain knowledge. The sparsedeep belief net (DBN) was applied in [29] as an unsuper-vised method to extract features from EEG, EOG and EMG.Sleep staging is a sequential problem [6] since sleep showstypically cyclic characteristics and NREM/REM sleep appearsalternately. Moreover, manual sleep stage scoring depends onnot only temporally local features, but also the epochs beforeand after the current epoch [30]. Recurrent neural networks(RNNs), particularly those using Bidirectional Long Short-Term Memory (BLSTM) hidden units, are powerful modelsfor learning from sequence data [31], [32]. They are capable ofcapturing long-range dependencies, which make RNNs quitesuitable for modeling sleep data. Inspired by this, we apply aBLSTM-based RNN architecture for classification.
In this paper, we develop an automatic sleep stage classifi-cation algorithm using heart rate and wrist actigraphy derivedfrom the wearable device. The proposed method consistsof two phases: multi-level feature learning and RNN-basedclassification. In the feature extraction phase, contrary to tra-ditional methods that extract specific hand-engineered featuresusing much prior domain knowledge, we aim to obtain maininformation of sleep data. Low-level features (mean value,DCT, cepstral analysis) are extracted from raw signals andmid-level representations are explored. In the classificationphase, the BLSTM-based RNN architecture is employed tolearn temporally sequential patterns.
The contributions of our algorithm include:1) A complete sleep stage classification solution specially
designed for wearable devices is proposed which lever-ages heart rate and wrist actigraphy.
2) We introduce mid-level feature learning into sleep stag-ing area, and demonstrate its effectiveness.
3) The feasibility of using RNN to model sleep signals isverified.
II. METHODS
Our method consists of two phases: multi-level featurelearning and RNN-based classification. The flowchart of thewhole algorithm is shown in Fig. 1.
A. Feature extraction1) Low-level feature extraction: Low-level features reflect
intuitive properties of underlying activities in signals. We first

3
𝐇𝐞𝐚𝐫𝐭 𝐫𝐚𝐭𝐞
𝐖𝐫𝐢𝐬𝐭𝐚𝐜𝐭𝐢𝐠𝐫𝐚𝐩𝐡𝐲
𝐃𝐂𝐓
𝐜𝐞𝐩𝐬𝐭𝐫𝐮𝐦
𝐟𝐫𝐚𝐦𝐞𝐬
𝐑𝐍𝐍
𝐦𝐞𝐚𝐧
𝐋𝐨𝐰-𝐥𝐞𝐯𝐞𝐥 𝐌𝐢𝐝-𝐥𝐞𝐯𝐞𝐥𝐊-𝐦𝐞𝐚𝐧𝐬
𝐜𝐨𝐧𝐜𝐚𝐭𝐞𝐧𝐚𝐭𝐢𝐨𝐧 𝐒𝐥𝐞𝐞𝐩𝐒𝐭𝐚𝐠𝐞𝐬
Fig. 1 The flowchart of the proposed method. The method consists of two phases: multi-level feature learning and RNN-basedclassification. In the first phase, low-level features are extracted from heart rate and wrist actigraphy signals. Then mid-levelfeatures are obtained based on low-level ones. Combining two levels of features, we arrive at the final representations. In thesecond phase, a BLSTM-based RNN architecture is applied for classification. The obtained features serve as inputs to thenetwork and predictions of sleep stages are finally output by RNN.
divide each heart rate and actigraphy records into 30s epochssynchronizing in time with PSG classification results. Foreach epoch, low-level features of heart rate and actigraphyare extracted, respectively. Then they are combined to learnmid-level features.
Previous research efforts in HRV analysis have shown thatboth time domain and frequency domain measures containvaluable information related to sleep staging [11]. Therefore,both temporal and frequency properties of heart rate areconsidered. To make features more representative in context,the feature extraction procedure is carried out based on thesliding window technique by sampling overlapping framesfrom signal streams. We extract features in a frame whichincludes 10 epochs centered around the current one. Featuresare extracted within each epoch and then concatenated to formthe final features of the current sleep epoch. First, we deriveRR intervals from heart rate,
RR = 60/HR, (1)
in which RR refers to RR intervals and HR refers to heartrate.
Time domain analysis, which reveals the overall level andvariation of the signal by statistical evaluation, is one of themost common approaches to characterize HRV. We computethe mean RR intervals of each epoch in the frame to constitutea mean value vector.
Frequency domain features of RR intervals can capturethe activity of ANS. Compared with Discrete Fourier Trans-form (DFT), Discrete Cosine Transform (DCT) shows betterperformance with respect to energy concentration [33]. Weadopt DCT to RR intervals through which dominant frequencycomponents in each epoch are procured to form the frequencyfeature vector. To measure the fluctuation of RR intervals infrequency domain, we also calculate the first and the secondorder difference of the dominant frequency components vectoracquired above. Then the zero order (the dominant frequencycomponents vector), first order, and second order differencefrequency components are joined together as frequency do-main features of heart rate.
Humans usually keep still most of the time during sleep,and body movement tends to be transient, which means that awide range of context information is not needed for actigraphy.Meanwhile, the sampling rate of actigraphy in our work is highenough to capture details. Therefore, actigraphy features are
extracted only within the current epoch. The cepstral analysis,which is widely used in action recognition area [34], has alsobeen implemented in sleep study to assess body movement[35]. In this study, we calculate the first order difference of theactigraphy along three axes, respectively. Then the dominantcepstrum components of the aforementioned difference in eachaxis are concatenated to form the actigraphy feature vector.
2) Mid-level feature learning: Mid-level feature learningmethods are widely used in various kinds of pattern recog-nition tasks and give a nice performance boost [36]–[38].Compared with low-level feature extraction which involvesanalyzing properties in time and frequency domains, mid-levelfeature learning pays more attention to analyzing compositionsand exploring inherent structure of signals [39]. It can beassumed that sleep is comprised of different compositions.Weights of each composition vary in different stages. Thusbag-of-words (BOW), a kind of dictionary learning method isquite appropriate for obtaining mid-level sleep representations.In this work, we implement BOW based on low-level featuresof both heart rate and actigraphy signals.
The dictionary is first constructed upon low-level featuresfrom the training set through K-means algorithm [40], [41]. Kclusters are thus generated, and each cluster center representsone composition. The dictionary is composed of these clustercenters and forms the whole sleep structure. We define a set ofsamples as {x1, x2, . . . , xn}, xi ∈ Rd×1, i ∈ {1, 2, . . . , n}and each sample xi is related to an index zi ∈ {1, 2, . . . ,K}.If zi = j ∈ {1, 2, . . . ,K}, xi belongs to the j-th cluster. Thecenter of the j-th cluster is denoted as
mj =
n∑i=1
1{zi = j}xi
/n∑
i=1
1{zi = j} , mj ∈ Rd×1, (2)
in which mj refers to a word (i.e. sleep composition) and jrefers to the corresponding index in the dictionary (i.e. thewhole sleep structure). After clusters are first built using K-means clustering algorithm, the Euclidean distances betweenlow-level features and each cluster are computed as mid-levelfeatures which manifest different impacts of each composition.
We concatenate low-level and mid-level features as finalfeatures. Final features are then normalized with Z-scorestrategy.
4
𝒉(𝑡−1)
𝒉(𝑡−1)
𝒙(𝑡−1)
ෝ𝒚(𝑡−1)
╳
tanh ╳
╳
ℎ(𝑡−1)
𝑥(𝑡)
ℎ(𝑡−1)
𝑥(𝑡)
ℎ(𝑡−1) 𝑥(𝑡)
ℎ(𝑡−1)
𝑥(𝑡)
𝑐(𝑡−1)
𝑐(𝑡−1)
𝑓(𝑡)
𝑐(𝑡)
𝑐(𝑡)
𝑜(𝑡)
ℎ(𝑡)
𝑐(𝑡−1)
𝑖(𝑡)𝑔(𝑡)
𝒉(𝑡)
𝒉(𝑡)
𝒙(𝑡)
ෝ𝒚(𝑡)
𝒉(𝑡+1)
𝒉(𝑡+1)
𝒙(𝑡+1)
ෝ𝒚(𝑡+1)
Inputs
tanh
tanh
tanhForget gate
Input gate
Output gate
tanhForwardlayer
Backwardlayer
Outputs
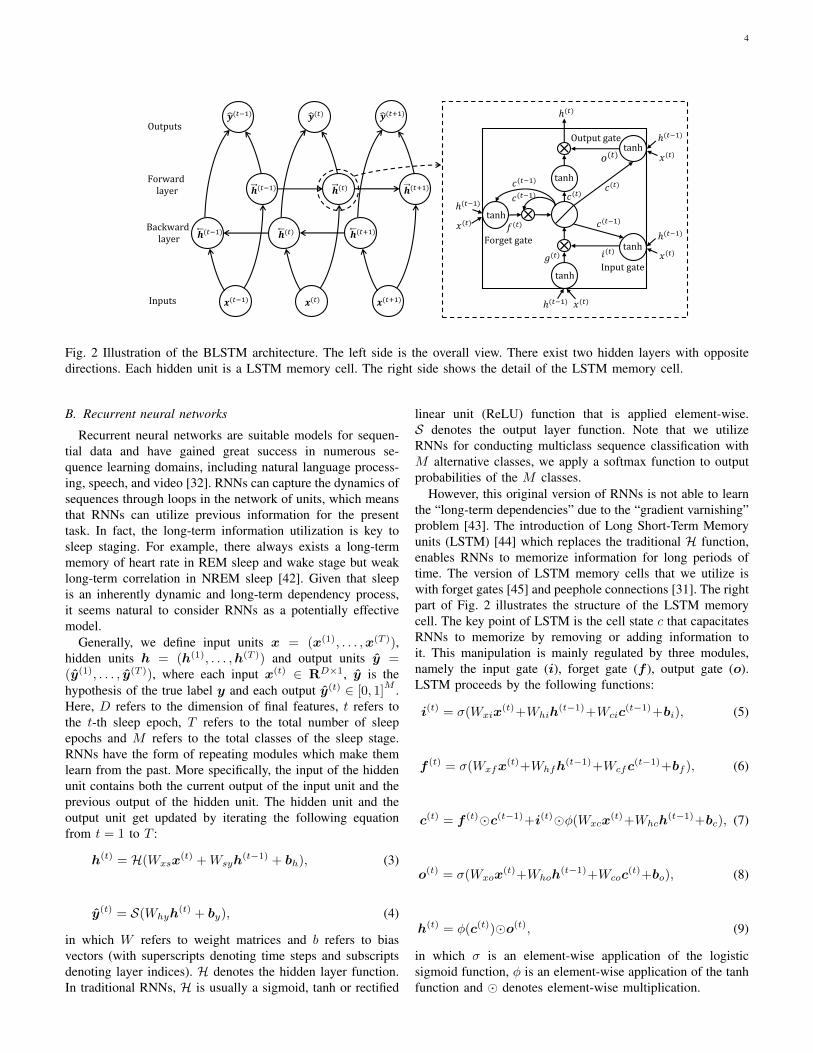
Fig. 2 Illustration of the BLSTM architecture. The left side is the overall view. There exist two hidden layers with oppositedirections. Each hidden unit is a LSTM memory cell. The right side shows the detail of the LSTM memory cell.
B. Recurrent neural networks
Recurrent neural networks are suitable models for sequen-tial data and have gained great success in numerous se-quence learning domains, including natural language process-ing, speech, and video [32]. RNNs can capture the dynamics ofsequences through loops in the network of units, which meansthat RNNs can utilize previous information for the presenttask. In fact, the long-term information utilization is key tosleep staging. For example, there always exists a long-termmemory of heart rate in REM sleep and wake stage but weaklong-term correlation in NREM sleep [42]. Given that sleepis an inherently dynamic and long-term dependency process,it seems natural to consider RNNs as a potentially effectivemodel.
Generally, we define input units x = (x(1), . . . ,x(T )),hidden units h = (h(1), . . . ,h(T )) and output units y =(y(1), . . . , y(T )), where each input x(t) ∈ RD×1, y is thehypothesis of the true label y and each output y(t) ∈ [0, 1]
M .Here, D refers to the dimension of final features, t refers tothe t-th sleep epoch, T refers to the total number of sleepepochs and M refers to the total classes of the sleep stage.RNNs have the form of repeating modules which make themlearn from the past. More specifically, the input of the hiddenunit contains both the current output of the input unit and theprevious output of the hidden unit. The hidden unit and theoutput unit get updated by iterating the following equationfrom t = 1 to T :
h(t) = H(Wxsx(t) +Wsyh
(t−1) + bh), (3)
y(t) = S(Whyh(t) + by), (4)
in which W refers to weight matrices and b refers to biasvectors (with superscripts denoting time steps and subscriptsdenoting layer indices). H denotes the hidden layer function.In traditional RNNs, H is usually a sigmoid, tanh or rectified
linear unit (ReLU) function that is applied element-wise.S denotes the output layer function. Note that we utilizeRNNs for conducting multiclass sequence classification withM alternative classes, we apply a softmax function to outputprobabilities of the M classes.
However, this original version of RNNs is not able to learnthe “long-term dependencies” due to the “gradient varnishing”problem [43]. The introduction of Long Short-Term Memoryunits (LSTM) [44] which replaces the traditional H function,enables RNNs to memorize information for long periods oftime. The version of LSTM memory cells that we utilize iswith forget gates [45] and peephole connections [31]. The rightpart of Fig. 2 illustrates the structure of the LSTM memorycell. The key point of LSTM is the cell state c that capacitatesRNNs to memorize by removing or adding information toit. This manipulation is mainly regulated by three modules,namely the input gate (i), forget gate (f ), output gate (o).LSTM proceeds by the following functions:
i(t) = σ(Wxix(t)+Whih
(t−1)+Wcic(t−1)+bi), (5)
f (t) = σ(Wxfx(t)+Whfh
(t−1)+Wcfc(t−1)+bf ), (6)
c(t) = f (t)�c(t−1)+i(t)�φ(Wxcx(t)+Whch
(t−1)+bc), (7)
o(t) = σ(Wxox(t)+Whoh
(t−1)+Wcoc(t)+bo), (8)
h(t) = φ(c(t))�o(t), (9)
in which σ is an element-wise application of the logisticsigmoid function, φ is an element-wise application of the tanhfunction and � denotes element-wise multiplication.

5
……
Raw data Featureextraction
…… ……
……
……
Previous time steps
……
……
Hidden layers
P(W)
P(N1)
P(N2)
P(N3)
P(REM)
SoftmaxInput layer
𝑥(1)
ොy(1)
𝑥(2)
ොy(2)
𝑥(3)
ොy(3)
𝑥(𝑡−1)
ොy(𝑡−1)
𝑥(𝑡)
ොy(𝑡)
𝑥(𝑡+1)
ොy(𝑡+1)
…… ……
Backward Unit
Forward Unit
Fig. 3 Illustration of the proposed RNN classifier. The upper part is the detailed structure of the network. In order to expressconcisely, we omit the full connection between layers. The lower part depicts the workflow of the RNN. For a certain sleepepoch, data are processed in two opposite directions. The output layer predicts the sleep stage of the current epoch.
Apart from the gradient problem, traditional RNNs alsohave a defect that they are only able to make use of previ-ous information. Since sleep is a kind of sequential signalthat shows periodic variations over time, combining contextinformation from both past and future may contribute tobetter modeling. Bidirectional RNNs (BRNNs) [46] meet thisrequirement by deploying two separate hidden layers. Asshown in Fig. 2, both hidden layers are connected to input andoutput, but the processing of data in two hidden layers are ofopposite directions: one has recurrent connections from pasttime steps, the other from the future. The output layer doesnot get updated until both hidden layers finish computation.The following three equations describe BRNNs:−→h (t) = H(W
x−→hx(t) +W−→
h−→h
−→h (t−1) + b−→
h), (10)
←−h (t) = H(W
x←−hx(t) +W←−
h←−h
←−h (t+1) + b←−
h), (11)
y(t) = S(W−→h y
−→h (t) +W←−
h y
←−h (t) + by), (12)
in which−→h and
←−h represent the hidden layers in the forwards
and backwards directions, respectively.As mentioned above, LSTM introduces a new type of unit
that constitutes the hidden layer, and BRNNs highlight thestrategy of network connections. Combining the above twoideas, bidirectional LSTM (BLSTM) [47], [48] is formed,which can exploit long-range information in both input di-rections.
In this paper, we train a BLSTM-based RNN model withmultiple hidden units. We also evaluate how RNN can benefitfrom the use of deep architectures. Specifically, by stackingmultiple recurrent hidden layers on top of each other, the waythat conventional deep networks do, we arrive at the deepBLSTM. The structure of the deep BLSTM is shown in Fig.3. Assuming there are N hidden layers with hidden units ofBLSTM, the hidden sequences h
(t)n are computed from n = 1
to N and t = 1 to T as below:
h(t)n = H(Whn−1hn
h(t)n−1 +Whnhn
h(t−1)n + bh,n). (13)
Thus the output y(t) can be defined as:
y(t) = S(WhNyh(t)N + by). (14)
According to the softmax output, cross entropy function isused as the loss function that we optimize:
loss(y,y) = − 1
T
t=T∑t=1
(y(t)·log(y(t))+(1−y(t))·log(1−y(t))),
(15)
in which y(t) refers to the true label at time step t.
III. EXPERIMENTS AND RESULTS
A. Subjects and data
1) Subjects: Sleep recordings (heart rate and wrist actig-raphy) used in this study were obtained from the GeneralHospital of the Air Force, PLA, Beijing, China. The studyrecruited 40 healthy subjects (30 males and 10 females) with

6
an age range of 19-64 years old. None of them took drugsor medications that could affect sleep before the experiment.During sleep, subjects were equipped with both the wearabledevice and the PSG system. The former was used to collectheart rate and wrist actigraphy. The latter was used for labelingsleep data to obtain “golden standard”. From a practicalperspective, whether the patient is in a resting state or has justfinished exercise is unknown, and changes in heart rate undertwo different conditions are not quite the same. Therefore, tocope with the aforementioned issue, we conducted experimentsin two groups: the resting group, recordings of which aregathered in resting state, and the comprehensive group, whichaims to simulate sleep in the actual situation. 28 recordingswere included in the resting group. The remaining 12 subjectswere asked to do adequate exercise one to two hours beforesleep. All recordings are combined to form the comprehensivegroup. Eventually, we obtained 39 sleep recordings, with thecollection of one recording in non-resting state failed.
2) Data collection: The wearable device that we utilizedwas Microsoft Band 1. Subjects were required to get plenty ofexercise during the daytime and not to take a nap at noon. Theband was worn on the right wrist. The placement of the bandand PSG electrodes were completed before 9: 00 p.m. Subjectswere awakened by the doctor at 6: 00 the next morning.The band was fully charged and synchronized with the PSGsystem. After the subject awakened, heart rate and triaxialwrist actigraphy were exported and the band was recharged. Itis worth noting that the band exported heart rate by convertingthe RR interval at each detected R peak. The actigraphy wasstored in the unit of gravity (g) and sampled at 32 Hz.
3) Ground truth: PSG data were acquired using Com-pumedics E-64. All subjects slept at the same sleep lab andused the same set of PSG equipment. The sleep physicianassigned one of the five stages (W, N1, N2, N3, and REM)to the overnight sleep at each epoch according to the standardprotocol of the AASM guideline. To ensure accuracy of groundtruth, each subject’s PSG recording was scored by 5 physiciansfrom the General Hospital of the Air Force independently.Then we adopted the voting strategy to obtain final stagingresults. For the cases in which multiple stages tied for themost votes, we followed the stage of the previous epoch. Anexample of recordings is shown in Fig. 4. Details of subjectdemographics are listed in Table I.
TABLE ISUBJECT DEMOGRAPHICS
Resting group Comprehensive groupParameter Mean±Std Range Mean±Std RangeNum 28 39M/F 20/8 30/9Age (y) 26.25±7.77 19-48 27.72±10.12 19-64BMI 21.81±2.66 17.07-29.05 21.81±2.68 17.07-29.05TRT (h) 7.80±0.52 6.92-8.80 7.86±0.54 6.82-8.80W (%) 19.14±8.80 4.81-40.24 19.37±9.13 4.81-40.24N1 (%) 5.79±3.20 1.73-14.18 6.05±3.43 1.73-15.09N2 (%) 45.00±9.48 26.04-62.31 46.14±8.84 26.04-62.31N3 (%) 14.86±9.57 0.00-42.23 13.47±8.73 0.00-42.23REM (%) 15.20±4.47 6.15-24.30 14.96±4.15 6.15-24.30
Num = number of recordings, M/F = male/female, BMI = body mass index,TRT = total recording time.
Fig. 4 Illustration of the recording. The top one representsan overnight heart rate signal. The middle one representsan actigraphy signal (Here, to save space, we integrate theactigraphy in X, Y, and Z axes). The bottom one representsthe corresponding sleep stages.
B. Performance Evaluation
In this study, a subject independent cross validation (CV)procedure is considered in order to present unbiased perfor-mance of the RNN model. More precisely, an eight-fold CV isconducted. On each iteration, we use six portions for training,one portion for validation, and one portion for testing. Finally,testing results of each iteration are averaged to form the overallperformance of RNN classifiers. We execute the CV for threerounds and calculate average results.
Considering that the distribution of the five sleep stagesis severely unbalanced, to adapt this characteristic, weightedprecision (P), recall (R) and F1 score (F1) are selected toevaluate the performance of our method. Evaluation measuresare defined as:
P =∑i
ωi·TPi/ (TPi + FPi) , (16)
R =∑i
ωi·TPi/ (TPi + FNi) , (17)
F1 =∑i
2 · ωi·Pi ·Ri/ (Pi +Ri) , (18)
in which i refers to the stage category and ωi is the proportionof the i-th stage class in all classes. TP is the number oftrue positives, FP is the number of false positives, TN isthe number of true negatives and FN is the number of falsenegatives (Here, we omit the subscript i.).

7
C. Experiments
In order to fully explore the property of the proposedapproach, we conduct the following experimental procedures:(1) we exhibit our algorithm’s results, and compare them withthe existing method; (2) we prove the effectiveness of mid-level feature learning; (3) we provide a comparison betweena BLSTM-based RNN and two frequently-used classifiers forclassification; (4) we explore the sensitivity of parameters inthe feature extraction process; (5) we evaluate the performanceof RNN models with different hidden layer width, depth,and unit types. As W and N1 stages are morphologicallysimilar and hard to separate, we also conduct experiments thatcombine W and N1 into one stage, resulting in 4 classes ofclassification. Meanwhile, the resting group and comprehen-sive group are both experimented on, respectively.
1) Comparison with the existing method: We first describeparameter settings of our procedure and present the results.Then we compare our algorithm with a similar one describedin [19] which classifies sleep stages based on HRV and RF.
In low-level feature extraction, for frequency domain fea-tures of heart rate, the first 5 frequency components of eachepoch are collected to make up frequency features. Conse-quently, we obtain a 120-dimension feature (40 dimensionsfor each axis, respectively). For actigraphy features, we jointhe first 30 cepstrum components in each axis to shape intoa 90-dimension actigraphy feature. Based on the above low-level features, we extract mid-level features. The size of thedictionary, K, is set to 300. The final features are formed bythe concatenation of low-level and mid-level features, holdinga dimension of 520. The RNN architecture that we designfor classification is a three-layer structure with the number ofinput layer units equal to the dimension of the final featurevector, one hidden layer of 400 BLSTM cells and the outputlayer of 5 units. RNN is trained by using stochastic gradientdescent [49] with the learning rate of 10−6 and weights arerandomly initialized with Gaussian distribution of (0, 0.1). Tobe more generalized, the network is trained with the Gaussianweighted noise (σ = 0.005). We implement the proposedRNN architecture under the CURRENNT framework [50].
Noting that the existing study used different datasets forevaluation, it is not appropriate to make a comparison bydirectly using the results in their paper. Here we implementthe baseline method using RR intervals in our dataset. Thebaseline method extracts 41-dimension hand-engineered fea-tures based on HRV in time domain (8 dimensions), fre-quency domain (20 dimensions) and nonlinear analysis (13dimensions) and these features are then trained and testedthrough RF. To make a fair comparison, we also implement ourproposed algorithm without actigraphy. Moreover, we add ourextracted actigraphy features to 41-dimension HRV featuresto perform the baseline method. Both the resting group andthe comprehensive group are used to evaluate experiments for5-class classification. Table II shows the results.
It can be observed from Table II that our method surpassesthe baseline both with and without actigraphy features. Thebest performances, weighted precision, recall and F1 score of58.0%, 60.3%, and 58.2% in the resting group and 58.5%,
TABLE IICOMPARISON WITH THE EXISTING METHOD FORFIVE-CLASS CLASSIFICATION
Method RG CGP R F1 P R F1
Baseline (HR) 50.2 47.5 43.2 48.8 47,2 42.1Baseline (HR+Act) 53.5 51.7 46.0 52.2 51.9 45.5Proposed (HR) 53.9 56.0 53.2 53.2 55.5 52.8Proposed (HR+Act) 58.0 60.3 58.2 58.5 61.1 58.5
RG = resting group, CG = comprehensive group, HR = heart rate, Act= actigraphy.
61.1%, and 58.5% in the comprehensive group are achievedthrough our method using heart rate combined with actigraphy.Compared with the hand-engineered feature extraction methodin the baseline which is overly dependent on expert knowledge,our feature learning method aims to obtain main informationof signals and RNN is able to further refine features. As littleprior domain knowledge is used in our method, the method hasthe potential to generalize sleep disorder detection. Approx-imately, the differences of results between the resting groupand comprehensive group using our method are smaller thanthat using the baseline. Since sleep data in the comprehensivegroup are more diverse, it shows the robustness of RNN.
Furthermore, it can be noticed that the performances ofboth methods are improved when actigraphy features areconsidered, which suggests that body movement during sleepcontains useful information for sleep stage classification.
2) Effectiveness of mid-level learning: To demonstrate theeffectiveness of mid-level feature learning, we design a con-trast experiment in which low-level features directly serve asthe input to RNN without mid-level feature learning. Parametersettings remain the same. We conduct experiments with theresting group for 5-class classification. 1 to 4 hidden layers ofRNN are implemented.
As shown in Table III, the performance is improved sig-nificantly when mid-level features are involved. By buildinga dictionary, we obtain the spacial distribution of sleep com-positions and explore inherent structures, which can describesleep in a more representative way.
TABLE IIICOMPARISON OF RESULTS WITH AND WITHOUT MID-LEVEL LEARNING WITH THE RESTING GROUP FOR5-CLASS CLASSIFICATION
HL With mid-level learning Without mid-level learningP R F1 P R F1
1 58.0 60.3 58.2 52.8 54.7 52.72 57.7 59.6 57.1 53.5 55.5 53.33 56.3 59.6 57.1 53.1 55.7 53.14 55.4 58.7 56.4 52.2 54.7 51.5
HL = number of hidden layers.
3) Comparison with various classifiers: We make a com-parison between RNN and two classic classifiers, includingSupport Vector Machine (SVM) [51] and Random Forest(RF). All three classifiers use the same features extracted inthe first experiment. The comparison is performed with thecomprehensive group for 5-class classification.

8
The SVM uses the radial basis function (RBF) kernel withthe kernel coefficient gamma of 0.0021. Penalty parameter Cis set to 1 to regularize the estimation. The shrinking heuristicis also utilized. 600 estimators are set in the RF, and thefunction to measure the quality of a split is the Gini impurity.The number of features to consider when looking for the bestsplit is denoted as p, which is equal to the square root of thenumber of total features. The minimum number of samplesrequired to split an internal node and be at a leaf node arep1/2 and 1.
The results shown in Table IV indicate that RNN is superiorto RF in all three metrics and to SVM in weighted recall andF1 score. Despite both SVM and RF being able to deal withhigh dimension situations, RNN works better at learning long-term dependencies.
TABLE IVCOMPARISON OF VARIOUS CLASSIFIERS WITH THECOMPREHENSIVE GROUP FOR 5-CLASS CLASSIFICA-TION
Classifier P R F1
SVM 60.3 60.6 55.6RF 56.5 59.2 53.3RNN 58.5 61.1 58.5
4) Sensitivity of parameters: This section elucidates theassessment of the variable sensitivity in feature extraction,including the dominant frequency component size of DCTand the dictionary size in mid-level feature learning. Weevaluate the sensitivity with the comprehensive group for 4-class classification. Hidden layers from 1 to 4 are employed.
The dominant frequency component size ranges from 5 to25. The results are shown in Table V and Fig. 5(a). It can beseen that performance decreases as frequency component sizeincreases. This may be because the high frequency componentsare mostly noise and thus impact classification. Even so, theworst result, weighted F1 score of 56.2%, is still higherthan that of the baseline method, which demonstrates theeffectiveness of the proposed method.
We change the dictionary size in mid-level feature learningfrom 100 to 500. The results are shown in Table VI andFig. 5(b). The variation trend of performance is small. Itcan be attributed to as lack of data. Although the increasein dictionary size creates a more detailed description ofsleep compositions, the larger size means that there are moreparameters to optimize in RNN. Under such conditions, sleepdata of around 37,000 epochs are not sufficient for trainingthe RNN model.
5) Neural networks configurations: We carry out extensiveexperiments to assess the performance of neural networkswith different hidden layer width, depth, and unit types. Weconsider 6 scales of hidden units numbers: 100 to 600, 4 scalesof hidden layers: 1 to 4, and 3 types of the neural networks:multilayer perceptron (MLP), LSTM, and BLSTM.
Tables VIII and VII summarize the results of multipleneural network architectures with the resting group as wellas the comprehensive group for 4- and 5-class classification.Fig. 6 illustrates the general trend of the weighted F1 score
(a) Frequency component size (b) Dictionary size
Fig. 5 The sensitivity of DCT and dictionary size parameters.
along with the number of hidden units of four experimentgroups. It is obvious that RNNs with LSTM and BLSTMunits achieve much better results than MLP in all experiments,which demonstrates the efficacy of RNN to learn the tem-poral relationships of sleep sequences. BLSTM outperformsLSTM slightly. As the number of hidden units increases, theimprovement of performance in MLP is most significant. Itis reasonable because MLP models are relatively simple andthe collected sleep data are sufficient for optimizing the MLPmodel with a deeper and wider structure. The performanceresults for LSTM and BLSTM show a slight decrease as thenumber of hidden units and layers increase. This may becaused by the mismatch between excessive parameters andrelatively sparse data.
(a) 4 classes of Resting group (b) 4 classes of Comprehensive group
(c) 5 classes of Resting group (d) 5 classes of Comprehensive group
Fig. 6 Performances of RNN networks with different hiddenlayers and units.

9
TABLE VTHE EFFECT OF THE DOMINANT FREQUENCY COMPONENT SIZE OF DCT
WITH THE COMPREHENSIVE GROUP FOR 4-CLASS CLASSIFICATION
ComponentsHL
1 2 3 4P R F1 P R F1 P R F1 P R F1
5 63.0 63.1 62.1 62.1 61.9 61.5 61.7 61.9 60.8 60.6 60.8 60.010 60.3 61.2 60.0 60.6 60.9 59.9 60.0 60.3 58.9 59.5 60.1 58.415 60.1 61.2 59.0 59.6 60.3 58.6 58.7 59.4 57.8 59.9 60.3 58.820 59.4 60.6 58.9 58.5 59.2 58.1 57.9 58.5 56.2 57.6 59.0 57.125 58.0 59.5 57.1 57.4 58.9 57.0 58.0 59.0 57.0 57.3 58.9 56.6
HL = number of hidden layers.
TABLE VITHE EFFECT OF DICTIONARY SIZE ON THE MID-LEVEL FEATURE
LEARNING WITH THE COMPREHENSIVE GROUP FOR 4-CLASSCLASSIFICATION
KHL
1 2 3 4P R F1 P R F1 P R F1 P R F1
100 61.6 62.2 61.3 62.4 62.7 61.7 60.9 61.3 60.6 60.9 61.1 60.1200 62.4 62.7 62.1 61.2 61.4 60.7 60.5 61.0 60.3 61.5 61.4 59.8300 63.0 63.1 62.1 62.1 61.9 61.5 61.7 61.9 60.8 60.6 60.8 60.0400 62.6 62.9 61.4 60.7 61.2 60.3 61.1 61.3 60.7 60.1 60.3 59.1500 62.0 62.7 61.6 62.1 62.5 61.8 62.2 62.0 60.9 60.6 60.9 59.7
HL = number of hidden layers.
TABLE VIICOMPARISON OF DIFFERENT NETWORK ARCHITECTURES FOR 5-CLASS CLASSIFICATION
Sub. HT HLHU
100 200 300 400 500 600P R F1 P R F1 P R F1 P R F1 P R F1 P R F1
MLP
RG
1 48.7 54.3 46.0 51.5 55.8 49.0 52.0 56.3 50.0 52.2 56.5 50.5 53.0 56.5 50.4 53.5 56.8 51.32 45.6 54.9 45.3 50.8 55.9 47.9 52.8 56.4 49.4 54.8 57.6 52.1 55.4 57.7 52.2 56.3 57.9 52.23 43.4 54.4 43.2 53.3 56.7 49.2 53.1 56.6 49.8 54.8 57.3 50.7 55.7 58.2 52.6 56.2 58.9 54.44 41.4 54.1 42.4 47.2 55.7 46.2 51.4 56.9 49.5 52.2 57.5 50.9 54.7 57.4 51.0 58.2 59.2 55.0
CG
1 50.6 56.3 48.2 52.7 56.8 49.8 53.8 57.7 51.5 53.1 56.8 49.5 53.2 57.2 50.6 54.5 57.5 51.12 47.3 55.5 45.5 52.0 57.0 49.0 54.2 57.4 50.7 55.3 58.4 52.7 55.1 57.9 51.7 56.4 59.0 53.13 44.8 55.5 45.2 50.5 56.2 47.6 56.2 58.1 51.3 55.8 58.4 52.3 56.7 58.7 53.2 55.5 58.9 52.24 44.8 55.7 45.0 49.2 55.8 46.2 49.1 56.9 48.9 56.2 58.3 52.7 56.1 58.9 54.1 55.7 58.6 52.6
LSTM
RG
1 58.7 61.0 58.5 58.1 60.2 57.6 58.2 60.8 58.6 58.4 60.5 58.3 57.7 60.2 57.9 58.0 60.2 58.32 56.4 60.1 57.6 56.6 60.3 57.7 57.3 60.4 57.7 55.8 58.6 56.4 56.1 59.1 56.9 56.0 59.0 56.63 56.9 60.6 57.9 56.4 59.8 57.3 55.7 59.2 56.6 55.8 58.8 56.1 55.5 58.4 55.7 55.0 58.2 55.94 55.7 59.3 56.4 55.9 59.4 56.7 54.4 57.5 55.2 54.2 57.3 54.7 54.8 57.5 55.0 54.1 57.2 54.8
CG
1 58.9 61.3 58.3 59.0 61.1 58.2 58.4 61.0 58.3 57.3 59.8 57.3 58.0 60.6 58.2 57.8 60.3 58.02 57.0 60.8 57.9 56.7 60.6 57.6 56.0 59.9 56.9 55.8 58.9 56.0 55.4 58.8 56.1 56.2 59.3 56.53 56.4 60.4 57.5 56.1 60.1 57.2 56.1 59.4 56.5 55.3 59.1 55.9 55.8 59.2 56.2 55.0 58.4 55.54 55.3 59.3 56.6 55.7 59.7 56.6 54.7 58.5 55.7 54.9 58.6 55.4 54.9 58.1 55.0 55.3 58.5 55.5
BLSTM
RG
1 58.6 61.0 58.5 58.6 60.8 58.5 58.3 60.6 58.2 58.0 60.3 58.2 58.7 61.0 58.7 58.0 60.3 58.22 57.5 60.2 57.7 57.2 60.5 58.1 58.5 61.0 58.6 57.7 59.6 57.1 56.6 59.3 57.0 57.3 59.8 57.73 55.6 59.3 56.7 55.7 59.2 56.9 56.0 59.5 56.9 56.3 59.6 57.1 55.7 58.6 56.4 56.3 59.1 56.74 54.6 58.3 55.7 56.1 59.7 57.2 57.6 59.2 56.9 55.4 58.7 56.4 55.7 58.8 56.1 55.7 58.4 56.1
CG
1 59.0 61.5 58.9 58.4 60.9 58.2 57.6 60.5 57.9 58.5 61.1 58.5 58.2 60.7 58.3 58.1 60.7 58.22 56.8 60.7 58.0 57.1 60.9 58.0 56.3 60.2 57.5 56.7 59.9 57.0 56.9 59.9 56.9 56.7 59.7 57.23 58.6 60.4 57.5 57.0 60.6 57.8 56.8 60.7 57.7 55.9 59.4 56.6 56.4 59.5 56.4 55.5 58.9 56.04 55.1 59.2 56.1 55.5 59.4 56.8 58.0 59.8 56.9 55.0 58.7 56.3 55.3 58.9 56.0 54.7 58.1 55.6
Sub. = subjects, RG = resting group, CG = comprehensive group, HT = hidden unit type, HL = number of hidden layers, HU = number of hidden units.

10
TABLE VIIICOMPARISON OF DIFFERENT NETWORK ARCHITECTURES FOR 4-CLASS CLASSIFICATION
Sub. HT HLHU
100 200 300 400 500 600P R F1 P R F1 P R F1 P R F1 P R F1 P R F1
MLP
RG
1 53.1 55.8 49.9 55.5 57.1 51.9 53.7 56.8 50.9 57.7 58.5 54.0 58.0 59.3 55.4 58.1 58.8 55.12 44.9 51.0 41.9 56.8 58.2 52.6 57.3 59.4 54.6 59.4 59.8 55.8 57.3 58.9 53.5 58.1 59.6 55.73 52.9 56.6 48.8 51.9 56.6 49.1 56.3 57.4 50.8 57.2 59.4 54.6 59.4 59.8 55.6 61.2 61.0 57.74 49.9 57.1 48.4 56.7 58.2 51.8 56.9 59.2 54.2 60.7 60.6 57.1 59.9 60.5 56.8 60.9 61.2 58.5
CG
1 56.5 58.2 52.8 56.5 58.7 53.8 58.6 59.8 55.6 59.5 60.4 56.2 59.1 60.1 55.8 59.3 60.4 56.62 54.0 57.9 51.3 57.9 59.6 54.8 59.2 60.4 56.3 59.5 60.5 56.2 59.9 60.7 56.8 60.1 60.9 57.03 51.8 57.8 49.7 57.9 59.3 53.4 60.2 60.8 56.5 59.6 60.9 57.0 60.1 61.2 57.6 60.2 60.9 57.34 53.4 57.7 49.4 58.0 59.7 54.4 59.9 60.7 57.0 59.6 60.7 57.2 59.7 60.9 57.3 60.5 61.4 58.4
LSTM
RG
1 62.3 62.6 62.0 62.8 63.0 62.3 63.0 63.1 62.4 62.0 62.1 61.6 62.6 62.8 62.2 62.2 62.4 61.72 62.5 62.5 61.8 61.8 61.7 61.2 61.4 61.4 60.6 60.5 60.7 59.8 60.3 60.4 59.7 60.5 60.6 59.93 60.7 60.8 60.1 61.3 61.2 60.7 60.7 60.6 59.7 60.0 60.0 59.3 60.2 60.1 59.5 60.5 60.3 59.74 60.6 60.5 59.9 60.7 60.7 59.9 59.4 59.2 58.4 58.7 58.6 57.6 59.3 59.2 58.6 59.1 59.1 58.4
CG
1 62.9 63.3 62.4 62.8 63.2 62.3 62.3 62.6 61.8 62.9 63.2 62.5 62.0 62.4 61.6 61.6 62.0 61.12 62.6 62.8 61.9 61.8 61.9 61.1 61.3 61.6 60.5 61.2 61.4 60.6 61.7 61.9 60.9 60.3 60.7 59.53 61.8 61.9 61.2 61.1 61.2 60.3 60.9 61.0 59.9 60.6 60.8 59.7 59.9 60.3 59.0 59.7 59.9 59.14 61.6 61.7 60.8 61.5 61.3 60.5 60.1 60.3 59.2 59.5 59.7 58.5 59.5 59.7 58.5 59.4 59.7 58.6
BLSTM
RG
1 62.8 62.9 62.4 62.2 62.5 61.9 62.3 62.4 61.9 61.9 62.0 61.4 62.3 62.5 61.6 62.8 63.0 62.52 62.6 62.5 62.0 62.0 62.1 61.6 62.1 62.1 61.6 61.1 61.1 60.6 61.3 61.4 60.7 60.8 61.0 60.33 61.4 61.4 60.9 61.4 61.2 60.6 61.1 60.8 60.3 60.2 60.4 59.7 59.9 60.0 59.2 60.3 60.3 59.54 60.0 60.0 59.4 61.1 61.0 60.5 60.5 60.5 60.1 60.2 60.3 59.6 60.2 60.3 59.6 60.0 60.1 59.2
CG
1 62.5 62.9 61.9 62.4 62.9 62.0 63.1 63.6 62.7 63.0 63.1 62.1 62.1 62.7 61.8 62.0 62.4 61.72 62.5 62.7 61.9 62.2 62.1 61.3 61.8 62.0 60.9 62.1 61.9 61.5 61.2 61.5 60.5 60.6 61.0 60.33 60.8 61.0 60.1 61.5 61.3 60.6 60.9 61.2 60.5 61.7 61.9 60.8 60.3 60.7 59.8 60.3 60.7 59.84 61.4 61.2 60.3 61.2 61.2 60.4 60.8 61.2 60.3 60.6 60.8 60.0 60.8 61.1 60.2 60.0 60.5 59.6
Sub. = subjects, RG = resting group, CG = comprehensive group, HT = hidden unit type, HL = number of hidden layers, HU = number of hidden units.
IV. CONCLUSION
We present a novel method for automatic sleep stageclassification for wearable devices using heart rate and wristactigraphy. The method consists of two phases: the multi-level feature learning framework and the BLSTM-based RNNclassifier. Unlike traditional approaches which focus on hand-engineered features, feature extraction in this work is designedto capture properties of raw sleep data and composition-basedstructural representation. RNN learns temporally sequentialpatterns of sleep. We have demonstrated the effectiveness ofthe proposed method. Our method is suitable for utilizationin wearable devices. As little prior domain knowledge is usedfor the task, our method can be applied to other sleep-relatedissues, for example, sleep disorders diagnose. Future work willbe conducted on improving automatic scoring performance.
ACKNOWLEDGMENT
The authors would like to thank Microsoft Research Asiafor providing the Microsoft Band 1 and the General Hospitalof the Air Force, PLA, Beijing, China for scoring sleep data.
REFERENCES
[1] R. Stickgold, “Sleep-dependent memory consolidation,” Nature, vol.437, no. 7063, p. 1272, 2005.
[2] M. A. Carskadon, W. C. Dement et al., “Normal human sleep: anoverview,” Principles and practice of sleep medicine, vol. 4, pp. 13–23, 2005.
[3] A. A. of Sleep Medicine et al., “International classification of sleepdisorders,” Diagnostic and coding manual, pp. 148–152, 2005.
[4] X. Li, L. Cui, S. Tao, J. Chen, X. Zhang, and G.-Q. Zhang, “Hyclasss:A hybrid classifier for automatic sleep stage scoring,” IEEE Journal ofBiomedical and Health Informatics, 2017.
[5] A. Rechtschaffen, “A manual of standardized terminology, techniquesand scoring system for sleep stages of human subjects,” Public healthservice, 1968.
[6] R. B. Berry, R. Brooks, C. E. Gamaldo, S. M. Harding, C. Marcus,and B. Vaughn, “The aasm manual for the scoring of sleep andassociated events,” Rules, Terminology and Technical Specifications,Darien, Illinois, American Academy of Sleep Medicine, 2012.
[7] T. F. of the European Society of Cardiology et al., “Heart rate variability:standards of measurement, physiological interpretation, and clinical use,”circulation, vol. 93, pp. 1043–1065, 1996.
[8] R. J. Cole, D. F. Kripke, W. Gruen, D. J. Mullaney, and J. C. Gillin,“Automatic sleep/wake identification from wrist activity,” Sleep, vol. 15,no. 5, pp. 461–469, 1992.
[9] A. Baharav, S. Kotagal, V. Gibbons, B. Rubin, G. Pratt, J. Karin,and S. Akselrod, “Fluctuations in autonomic nervous activity duringsleep displayed by power spectrum analysis of heart rate variability,”Neurology, vol. 45, no. 6, pp. 1183–1187, 1995.
[10] J. Trinder, J. Kleiman, M. Carrington, S. Smith, S. Breen, N. Tan, andY. Kim, “Autonomic activity during human sleep as a function of timeand sleep stage,” Journal of sleep research, vol. 10, no. 4, pp. 253–264,2001.
[11] H. Otzenberger, C. Gronfier, C. Simon, A. Charloux, J. Ehrhart, F. Pi-quard, and G. Brandenberger, “Dynamic heart rate variability: a tool forexploring sympathovagal balance continuously during sleep in men,”American Journal of Physiology-Heart and Circulatory Physiology, vol.275, no. 3, pp. H946–H950, 1998.
[12] R. Jerath, K. Harden, M. Crawford, V. A. Barnes, and M. Jensen,“Role of cardiorespiratory synchronization and sleep physiology: effectson membrane potential in the restorative functions of sleep,” Sleepmedicine, vol. 15, no. 3, pp. 279–288, 2014.
[13] M. Bonnet and D. Arand, “Heart rate variability: sleep stage, timeof night, and arousal influences,” Electroencephalography and clinicalneurophysiology, vol. 102, no. 5, pp. 390–396, 1997.
[14] H. Nazeran, Y. Pamula, and K. Behbehani, “Heart rate variability(hrv): sleep disordered breathing,” Wiley Encyclopedia of BiomedicalEngineering, 2006.
[15] M. Malik, “Task force of the european society of cardiology andthe north american society of pacing and electrophysiology. heart ratevariability. standards of measurement, physiological interpretation, andclinical use,” Eur Heart J., vol. 17, pp. 354–381, 1996.
[16] H. N. Yoon, S. H. Hwang, J. W. Choi, Y. J. Lee, D. U. Jeong, and K. S.Park, “Slow-wave sleep estimation for healthy subjects and osa patients

11
using rr intervals,” IEEE Journal of Biomedical and Health Informatics,2017.
[17] X. Long, P. Fonseca, R. M. Aarts, R. Haakma, J. Rolink, and S. Leon-hardt, “Detection of nocturnal slow wave sleep based on cardiorespira-tory activity in healthy adults,” IEEE Journal of Biomedical and HealthInformatics, vol. 21, no. 1, pp. 123–133, 2017.
[18] F. Ebrahimi, S.-K. Setarehdan, J. Ayala-Moyeda, and H. Nazeran,“Automatic sleep staging using empirical mode decomposition, discretewavelet transform, time-domain, and nonlinear dynamics features ofheart rate variability signals,” Computer Methods and Programs inBiomedicine, vol. 112, no. 1, pp. 47–57, 2013.
[19] M. Xiao, H. Yan, J. Song, Y. Yang, and X. Yang, “Sleep stages classi-fication based on heart rate variability and random forest,” BiomedicalSignal Processing and Control, vol. 8, no. 6, pp. 624–633, 2013.
[20] L. Breiman, “Random forests,” Machine learning, vol. 45, no. 1, pp.5–32, 2001.
[21] A. Sadeh, K. M. Sharkey, and M. A. Carskadon, “Activity-based sleep-wake identification: an empirical test of methodological issues.” Sleep,vol. 17, no. 3, pp. 201–207, 1994.
[22] J. Paquet, A. Kawinska, and J. Carrier, “Wake detection capacity ofactigraphy during sleep,” Sleep, vol. 30, no. 10, pp. 1362–1369, 2007.
[23] S. Herscovici, A. Peer, S. Papyan, and P. Lavie, “Detecting rem sleepfrom the finger: an automatic rem sleep algorithm based on peripheralarterial tone (pat) and actigraphy,” Physiological Measurement, vol. 28,no. 2, pp. 129–140, 2007.
[24] K. Kawamoto, H. Kuriyama, and S. Tajima, “Actigraphic detection ofrem sleep based on respiratory rate estimation,” Journal of Medical andBioengineering, vol. 2, no. 1, pp. 20–25, 2013.
[25] X. Long, P. Fonseca, J. Foussier, R. Haakma, and R. M. Aarts, “Sleepand wake classification with actigraphy and respiratory effort usingdynamic warping,” IEEE journal of biomedical and health informatics,vol. 18, no. 4, pp. 1272–1284, 2014.
[26] A. Quiceno-Manrique, J. Alonso-Hernandez, C. Travieso-Gonzalez,M. Ferrer-Ballester, and G. Castellanos-Dominguez, “Detection of ob-structive sleep apnea in ecg recordings using time-frequency distribu-tions and dynamic features,” in EMBC, Minneapolis, MN, USA. IEEE,2009, pp. 5559–5562.
[27] S. Furui, “Cepstral analysis technique for automatic speaker verifica-tion,” IEEE Transactions on Acoustics, Speech, and Signal Processing,vol. 29, no. 2, pp. 254–272, 1981.
[28] O. Tsinalis, P. M. Matthews, Y. Guo, and S. Zafeiriou, “Automaticsleep stage scoring with single-channel eeg using convolutional neuralnetworks,” arXiv preprint arXiv:1610.01683, 2016.
[29] J. Zhang, Y. Wu, J. Bai, and F. Chen, “Automatic sleep stage classi-fication based on sparse deep belief net and combination of multipleclassifiers,” Transactions of the Institute of Measurement and Control,vol. 38, no. 4, pp. 435–451, 2016.
[30] H. Dong, A. Supratak, W. Pan, C. Wu, P. M. Matthews, and Y. Guo,“Mixed neural network approach for temporal sleep stage classification,”IEEE Transactions on Neural Systems and Rehabilitation Engineering,2017.
[31] F. A. Gers, N. N. Schraudolph, and J. Schmidhuber, “Learning precisetiming with lstm recurrent networks,” The Journal of Machine LearningResearch, vol. 3, no. Aug, pp. 115–143, 2002.
[32] Z. C. Lipton, J. Berkowitz, and C. Elkan, “A critical review ofrecurrent neural networks for sequence learning,” arXiv preprintarXiv:1506.00019, 2015.
[33] N. Ahmed, T. Natarajan, and K. R. Rao, “Discrete cosine transform,”IEEE transactions on Computers, vol. 100, no. 1, pp. 90–93, 1974.
[34] W.-J. Kang, J.-R. Shiu, C.-K. Cheng, J.-S. Lai, H.-W. Tsao, and T.-S.Kuo, “The application of cepstral coefficients and maximum likelihoodmethod in emg pattern recognition [movements classification],” IEEETransactions on Biomedical Engineering, vol. 42, no. 8, pp. 777–785,1995.
[35] J. M. Kortelainen, M. O. Mendez, A. M. Bianchi, M. Matteucci, andS. Cerutti, “Sleep staging based on signals acquired through bed sensor,”IEEE Transactions on Information Technology in Biomedicine, vol. 14,no. 3, pp. 776–785, 2010.
[36] Q. Barthelemy, C. Gouy-Pailler, Y. Isaac, A. Souloumiac, A. Larue, andJ. I. Mars, “Multivariate temporal dictionary learning for eeg,” Journalof neuroscience methods, vol. 215, no. 1, pp. 19–28, 2013.
[37] T. Liu, Y. Si, D. Wen, M. Zang, and L. Lang, “Dictionary learning forvq feature extraction in ecg beats classification,” Expert Systems WithApplications, vol. 53, pp. 129–137, 2016.
[38] J. Wang, P. Liu, M. She, S. Nahavandi, and A. Z. Kouzani, “Biomedicaltime series clustering based on non-negative sparse coding and proba-
bilistic topic model,” Computer Methods and Programs in Biomedicine,vol. 111, no. 3, pp. 629–641, 2013.
[39] Y. Xu, Z. Shen, X. Zhang, Y. Gao, S. Deng, Y. Wang, Y. Fan, I. Eric, andC. Chang, “Learning multi-level features for sensor-based human actionrecognition,” Pervasive and Mobile Computing, vol. 40, pp. 324–338,2017.
[40] A. Coates and A. Y. Ng, “Learning feature representations with k-means,” in Neural networks: Tricks of the trade. Springer, 2012, pp.561–580.
[41] S. Gunes, K. Polat, and S. Yosunkaya, “Efficient sleep stage recognitionsystem based on eeg signal using k-means clustering based featureweighting,” Expert Systems With Applications, vol. 37, no. 12, pp. 7922–7928, 2010.
[42] A. Bunde, S. Havlin, J. W. Kantelhardt, T. Penzel, J.-H. Peter, andK. Voigt, “Correlated and uncorrelated regions in heart-rate fluctuationsduring sleep,” Physical Review Letters, vol. 85, no. 17, p. 3736, 2000.
[43] Y. Bengio, P. Simard, and P. Frasconi, “Learning long-term dependencieswith gradient descent is difficult,” IEEE transactions on neural networks,vol. 5, no. 2, pp. 157–166, 1994.
[44] S. Hochreiter and J. Schmidhuber, “Long short-term memory,” Neuralcomputation, vol. 9, no. 8, pp. 1735–1780, 1997.
[45] F. A. Gers, J. Schmidhuber, and F. Cummins, “Learning to forget:Continual prediction with lstm,” pp. 850–855, 1999.
[46] M. Schuster and K. K. Paliwal, “Bidirectional recurrent neural net-works,” IEEE Transactions on Signal Processing, vol. 45, no. 11, pp.2673–2681, 1997.
[47] A. Graves and J. Schmidhuber, “Framewise phoneme classificationwith bidirectional lstm and other neural network architectures,” NeuralNetworks, vol. 18, no. 5, pp. 602–610, 2005.
[48] A. Graves, A.-r. Mohamed, and G. Hinton, “Speech recognition withdeep recurrent neural networks,” in ICASSP, Vancouver, BC, Canada.IEEE, 2013, pp. 6645–6649.
[49] O. Bousquet and L. Bottou, “The tradeoffs of large scale learning,” inNIPS, Vancouver, B.C., Canada, 2008, pp. 161–168.
[50] F. Weninger, J. Bergmann, and B. Schuller, “Introducing currennt: Themunich open-source cuda recurrent neural network toolkit,” The Journalof Machine Learning Research, vol. 16, no. 1, pp. 547–551, 2015.
[51] J. A. Suykens and J. Vandewalle, “Least squares support vector machineclassifiers,” Neural processing letters, vol. 9, no. 3, pp. 293–300, 1999.