Slater & Gordon · Slater & Gordon A$6.09 - BUY Financials Year to 30 June 13A 14A 15CL 16CL 17CL...
22
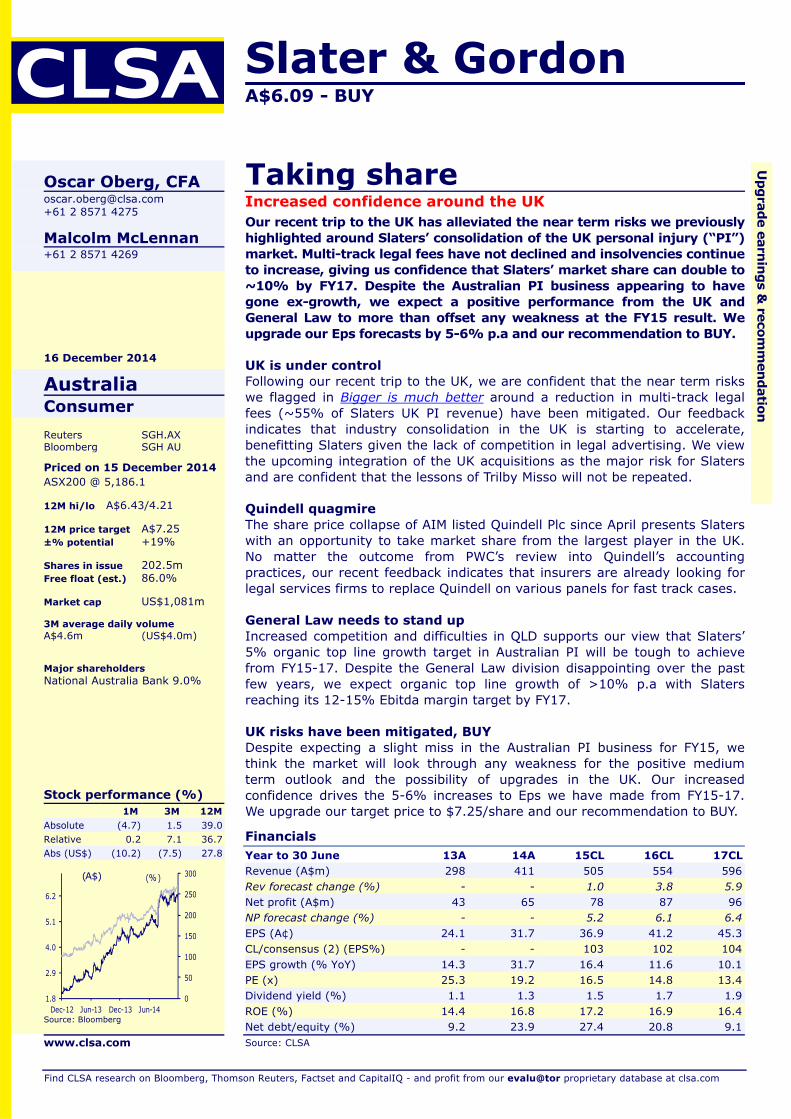
Slater & Gordon A$6.09 - BUY Financials Year to 30 June 13A 14A 15CL 16CL 17CL Revenue (A$m) 298 411 505 554 596 Rev forecast change (%) - - 1.0 3.8 5.9 Net profit (A$m) 43 65 78 87 96 NP forecast change (%) - - 5.2 6.1 6.4 EPS (A¢) 24.1 31.7 36.9 41.2 45.3 CL/consensus (2) (EPS%) - - 103 102 104 EPS growth (% YoY) 14.3 31.7 16.4 11.6 10.1 PE (x) 25.3 19.2 16.5 14.8 13.4 Dividend yield (%) 1.1 1.3 1.5 1.7 1.9 ROE (%) 14.4 16.8 17.2 16.9 16.4 Net debt/equity (%) 9.2 23.9 27.4 20.8 9.1 Source: CLSA Find CLSA research on Bloomberg, Thomson Reuters, Factset and CapitalIQ - and profit from our evalu@tor proprietary database at clsa.com Oscar Oberg, CFA [email protected] +61 2 8571 4275 Malcolm McLennan +61 2 8571 4269 16 December 2014 Australia Consumer Reuters SGH.AX Bloomberg SGH AU Priced on 15 December 2014 ASX200 @ 5,186.1 12M hi/lo A$6.43/4.21 12M price target A$7.25 ±% potential +19% Shares in issue 202.5m Free float (est.) 86.0% Market cap US$1,081m 3M average daily volume A$4.6m (US$4.0m) Major shareholders National Australia Bank 9.0% Stock performance (%) 1M 3M 12M Absolute (4.7) 1.5 39.0 Relative 0.2 7.1 36.7 Abs (US$) (10.2) (7.5) 27.8 0 50 100 150 200 250 300 1.8 2.9 4.0 5.1 6.2 Dec-12 Jun-13 Dec-13 Jun-14 (A$) (%) Source: Bloomberg www.clsa.com Upgrade earnings & recommendation Taking share Increased confidence around the UK Our recent trip to the UK has alleviated the near term risks we previously highlighted around Slaters’ consolidation of the UK personal injury (“PI”) market. Multi-track legal fees have not declined and insolvencies continue to increase, giving us confidence that Slaters’ market share can double to ~10% by FY17. Despite the Australian PI business appearing to have gone ex-growth, we expect a positive performance from the UK and General Law to more than offset any weakness at the FY15 result. We upgrade our Eps forecasts by 5-6% p.a and our recommendation to BUY. UK is under control Following our recent trip to the UK, we are confident that the near term risks we flagged in Bigger is much better around a reduction in multi-track legal fees (~55% of Slaters UK PI revenue) have been mitigated. Our feedback indicates that industry consolidation in the UK is starting to accelerate, benefitting Slaters given the lack of competition in legal advertising. We view the upcoming integration of the UK acquisitions as the major risk for Slaters and are confident that the lessons of Trilby Misso will not be repeated. Quindell quagmire The share price collapse of AIM listed Quindell Plc since April presents Slaters with an opportunity to take market share from the largest player in the UK. No matter the outcome from PWC’s review into Quindell’s accounting practices, our recent feedback indicates that insurers are already looking for legal services firms to replace Quindell on various panels for fast track cases. General Law needs to stand up Increased competition and difficulties in QLD supports our view that Slaters’ 5% organic top line growth target in Australian PI will be tough to achieve from FY15-17. Despite the General Law division disappointing over the past few years, we expect organic top line growth of >10% p.a with Slaters reaching its 12-15% Ebitda margin target by FY17. UK risks have been mitigated, BUY Despite expecting a slight miss in the Australian PI business for FY15, we think the market will look through any weakness for the positive medium term outlook and the possibility of upgrades in the UK. Our increased confidence drives the 5-6% increases to Eps we have made from FY15-17. We upgrade our target price to $7.25/share and our recommendation to BUY.
Transcript of Slater & Gordon · Slater & Gordon A$6.09 - BUY Financials Year to 30 June 13A 14A 15CL 16CL 17CL...
Slater & Gordon A$6.09 - BUY
Financials Year to 30 June 13A 14A 15CL 16CL 17CLRevenue (A$m) 298 411 505 554 596Rev forecast change (%) - - 1.0 3.8 5.9Net profit (A$m) 43 65 78 87 96NP forecast change (%) - - 5.2 6.1 6.4EPS (A¢) 24.1 31.7 36.9 41.2 45.3CL/consensus (2) (EPS%) - - 103 102 104EPS growth (% YoY) 14.3 31.7 16.4 11.6 10.1PE (x) 25.3 19.2 16.5 14.8 13.4Dividend yield (%) 1.1 1.3 1.5 1.7 1.9ROE (%) 14.4 16.8 17.2 16.9 16.4Net debt/equity (%) 9.2 23.9 27.4 20.8 9.1Source: CLSA
Find CLSA research on Bloomberg, Thomson Reuters, Factset and CapitalIQ - and profit from our evalu@tor proprietary database at clsa.com
Oscar Oberg, CFA [email protected] +61 2 8571 4275
Malcolm McLennan +61 2 8571 4269
16 December 2014
Australia Consumer Reuters SGH.AX Bloomberg SGH AU
Priced on 15 December 2014 ASX200 @ 5,186.1 12M hi/lo A$6.43/4.21 12M price target A$7.25 ±% potential +19% Shares in issue 202.5m Free float (est.) 86.0% Market cap US$1,081m 3M average daily volume A$4.6m (US$4.0m) Major shareholders National Australia Bank 9.0%
Stock performance (%) 1M 3M 12M
Absolute (4.7) 1.5 39.0 Relative 0.2 7.1 36.7 Abs (US$) (10.2) (7.5) 27.8
0
50
100
150
200
250
300
1.8
2.9
4.0
5.1
6.2
Dec-12 Jun-13 Dec-13 Jun-14
(A$) (%)
Source: Bloomberg
www.clsa.com
Upgrade earnings &
recomm
endation
Taking shareIncreased confidence around the UK Our recent trip to the UK has alleviated the near term risks we previously highlighted around Slaters’ consolidation of the UK personal injury (“PI”) market. Multi-track legal fees have not declined and insolvencies continue to increase, giving us confidence that Slaters’ market share can double to ~10% by FY17. Despite the Australian PI business appearing to have gone ex-growth, we expect a positive performance from the UK and General Law to more than offset any weakness at the FY15 result. We upgrade our Eps forecasts by 5-6% p.a and our recommendation to BUY.
UK is under control Following our recent trip to the UK, we are confident that the near term risks we flagged in Bigger is much better around a reduction in multi-track legal fees (~55% of Slaters UK PI revenue) have been mitigated. Our feedback indicates that industry consolidation in the UK is starting to accelerate, benefitting Slaters given the lack of competition in legal advertising. We view the upcoming integration of the UK acquisitions as the major risk for Slaters and are confident that the lessons of Trilby Misso will not be repeated.
Quindell quagmire The share price collapse of AIM listed Quindell Plc since April presents Slaters with an opportunity to take market share from the largest player in the UK. No matter the outcome from PWC’s review into Quindell’s accounting practices, our recent feedback indicates that insurers are already looking for legal services firms to replace Quindell on various panels for fast track cases.
General Law needs to stand up Increased competition and difficulties in QLD supports our view that Slaters’ 5% organic top line growth target in Australian PI will be tough to achieve from FY15-17. Despite the General Law division disappointing over the past few years, we expect organic top line growth of >10% p.a with Slaters reaching its 12-15% Ebitda margin target by FY17.
UK risks have been mitigated, BUY Despite expecting a slight miss in the Australian PI business for FY15, we think the market will look through any weakness for the positive medium term outlook and the possibility of upgrades in the UK. Our increased confidence drives the 5-6% increases to Eps we have made from FY15-17. We upgrade our target price to $7.25/share and our recommendation to BUY.
Taking share Slater & Gordon - BUY
16 December 2014 [email protected] 2
UK is under control Following our recent trip to the UK, we are confident that the near term risks we flagged in Bigger is much better around a reduction in multi-track legal fees (~55% of Slaters UK PI revenue) have been mitigated. Our feedback indicates that industry consolidation in the UK is starting to accelerate, benefitting Slaters given the lack of competition in legal advertising. We view the upcoming integration of the UK acquisitions as the major risk for Slaters and are confident that the lessons of Trilby Misso will not be repeated.
Jackson has changed the industry Up to the adoption of the Jackson reforms in April 2013, UK personal injury law firms were more or less free to charge their legal fees as they saw fit, with additional costs such as after the event insurance and referral fees to claims management companies (“CMC’s”) paid by the losing defendant (i.e. an insurance company). As we highlighted in Bigger is much better, the adoption of the Jackson reforms has impacted the UK legal services industry as firms have had to become used to an environment where legal fees have reduced considerably.
We have previously identified the major changes brought on by the Jackson reforms and our views around the impact they would have on the broader legal services industry. We have set out the key changes below noting their impact on the industry to date following a recent trip to the UK. We identify the impact of these changes and whether there is the prospect of further reform in the next 12-18 months.
Figure 1
Impact from the Jackson reforms Jackson reform
Overview of recommendation Impact of regulatory change
Conditional fee arrangement
Success fees permitted but not recoverable from the other party ATE insurance premiums not recoverable from
defendant
Clients have largely accepted paying the success fee. ATE insurance premiums continue to be paid
out of a client’s damagesDamages based agreement
Legal costs paid as a % of damages Majority of fees continue to be paid on a CFA basis
Referral fees Ban the payment of referral fees paid to CMC's CMC industry has declined substantially, however, the larger players have survived
Fixed fees Fixed legal fees for damages <£25,000 but no prohibition on clients agreeing to pay difference
Fast track (<£25,000) cases have seen a 30% decline in fees on average
10% increase in tortious damages
Increase damages in UK due to ban on CFA success fee Has done little to offset the impact from having the success fee taken out of the client's damages
Focus on proportionality
Costs should represent complexity of the matter Needs to be enforced by the High Court
Costs management
Parties for >£25,000 cases need to prepare budgets Courts are yet to enforce this rule
Tougher stance by the courts
Courts will not tolerate time wasting or breach of orders Courts are yet to enforce this rule
Source: CLSA
Changes are under control for now The consensus among the industry contacts we spoke to for Bigger is much better was that FY15-16 would be the period where the Jackson reforms would negatively impact the industry. Since the changes brought on by Jackson did not apply retrospectively, the average 18-36 month duration of a personal injury case meant that firms were working through existing cases that were entered into prior to 1 April 2013 through FY13 and FY14. For these
The UK has had a long held tradition of making
the losing party pay legal costs
Our industry contactswere pointing to a 10-
15% decline in revenuefor FY15-16 due to the
Jackson reforms
Our view back in June was that Jackson had not
impacted the UK legal services industry as yet
Taking share Slater & Gordon - BUY
16 December 2014 [email protected] 3
reasons our industry contacts were negative around the medium term outlook and pointed to the potential for an average 10-15% decline in their revenue for FY15-16 which compared to Slaters’ own expectation of 8-10% organic growth.
In the past month we have revisited the work we did earlier in the year and have spoken to a number of industry contacts on our recent trip to the UK. While most of the firms we have spoken to expected weakness over the next 12-18 months from the adoption of the Jackson reforms, the majority of firms that have a similar mix of cases as Slaters achieved revenue growth in CY14 and are confident around the outlook CY15. While we note that the confidence for the next 12 months depends upon the particular firm’s exposure to the “fast track” (damages <£25,000) and the “multi track” (damages >£25,000), each firm we have spoken to are expecting a better year in CY15.
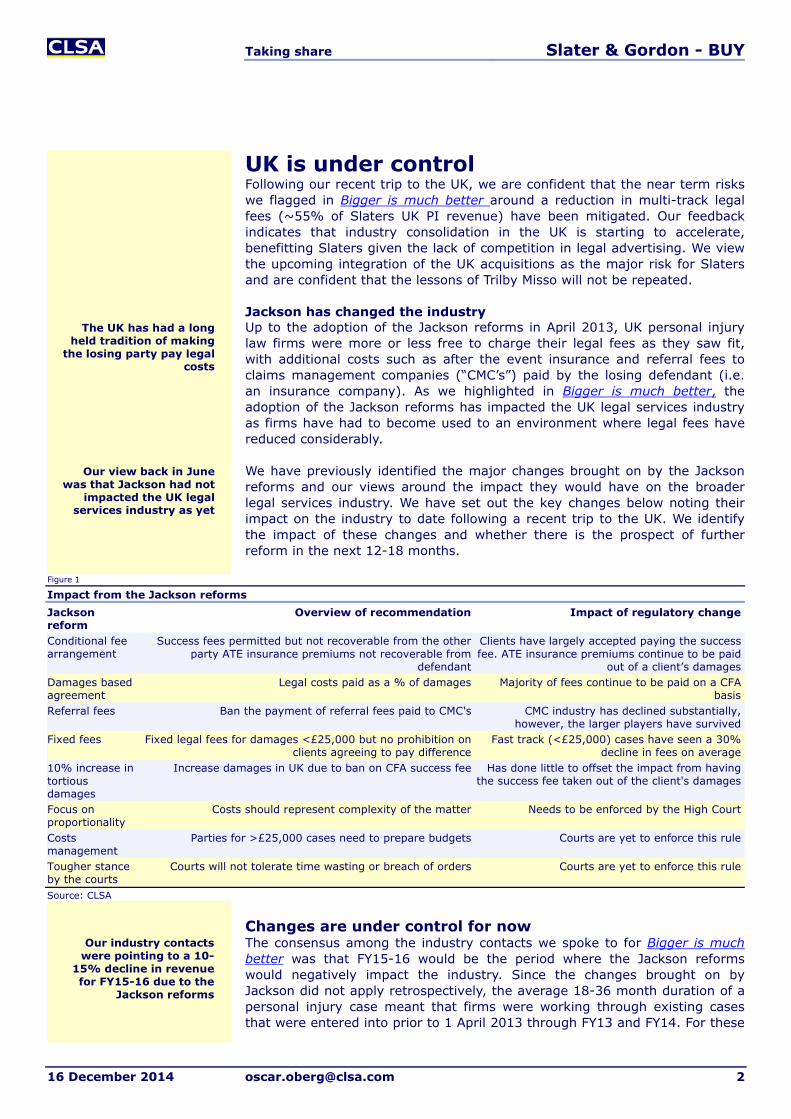
The distinction between the outlook of cases within the fast track and multi track is important for Slaters given the majority of earnings derived from the “FY14 acquisitions” (Fentons, Pannone, Taylor Vinters, Goodmans and Pickerings) were focused in more complex cases (i.e. multi track). Of the £2-3bn p.a personal injury law industry in the UK we estimate that 90-95% of the cases entered into relate to fast track cases. We note that Slaters’ has a much higher exposure to the multi track (~20% of cases) compared to the industry (~5-10%). Over time we expect this exposure to reduce, given the higher availability of acquisitions focused in the fast track.
With the vast majority of these cases subject to fixed fees following the implementation of the Jackson reforms in April 2013, the revenue and profitability of fast track cases are much lower than multi track. Given their lack of complexity and short duration, we estimate that cases in the fast track generate a lower proportion of industry revenue (60-65%) and earnings (~40-45%) despite contributing 90-95% of cases entered into in the UK.
Figure 2
Slater and Gordon FY15 revenue breakdown (CLSA estimate)
Source: CLSA, Company reports
Signs of a recovery in fast track We understand that the vast majority of firms exposed to the fast track have experienced a sharp decline in average fees and new claims following the adoption of the Jackson reforms due to the shift to fixed fees and the banning
Non Personal Injury23%
Fast track33%
Multi track44%
Personal Injury77%
We are much more confident around the
outlook for cases in the multi track
Slaters’ multi track cases represent 30% of its UK personal injury revenue
exposure
Most of our industry contacts are now more
optimistic around the near term outlook
Firms in the fast track have suffered in the
current environment

Taking share Slater & Gordon - BUY
16 December 2014 [email protected] 4
of CMC’s. The feedback we have received to date indicates that a number of smaller firms exposed to the fast track that do not have the scale or the appropriate systems in place to deal with a shift towards fixed fees are leaving the industry by seeking a buyer or by selling books of work in progress (“WIP”). We also understand that financial institutions are less willing to provide overdrafts and professional indemnity insurance to smaller personal injury firms that are attempting to stay afloat in this difficult environment.
The strain on the industry following the implementation of the Jackson reforms are supported by the following chart which highlights the number of liquidations for each quarter from March 2009 to June 2014. Since the April 2013 commencement date for the majority of changes brought on by Jackson, insolvencies in the UK legal services industry have increased. We note that the 20 insolvencies recorded in the six months to June 2014 compares to the 27 recorded in CY13. With so many UK firms continuing to work through pre-Jackson cases, our industry contacts continue to expect consolidation in the industry as smaller players struggle to compete in a fixed fee environment.
Figure 3
UK creditors’ voluntary liquidations by industry
Source: CLSA, UK Insolvency register
We understand that the predicted number of new personal injury cases will be around 700,000 in CY14, representing a 12-13% decline on the 800,000 that were available in CY13. This is supported by the Roads, Traffic and Accidents Portal (“RTA Portal”) which saw a 9% pcp reduction based on a 12 month run rate to 31 March 2014 for both new and settled cases respectively. We note that the cases through the RTA Portal represent ~30-40% of the total number of personal injury cases that are taken on in the UK during a given year.
Despite the pressure on firms exposed to the fast track in CY14, our UK industry contacts have pointed to a bottoming in new claims and a recovery over the past few months. This is supported by the charts below where the number of new fast track motor vehicle claims has begun to show monthly improvements since June 2014. While we think it is too early to call a meaningful recovery in the fast track as yet, the firms that have spent the time preparing for Jackson by investing into their systems are confident in achieving top-line growth and maintaining margins in CY15. Given the spike in insolvencies since the implementation of the Jackson reforms in April 2013,
0
2
4
6
8
10
12
14
1Q09A 3Q09A 1Q10A 3Q10A 1Q11A 3Q11A 1Q12A 3Q12A 1Q13A 3Q13A 1Q14A
UK liquidations
Our feedback from the UK suggests that the fast
track may be recovering
The market is becoming more consolidated
Insolvencies in legal services have increased in
the last 12 months

Taking share Slater & Gordon - BUY
16 December 2014 [email protected] 5
the data below may suggest that the larger firms who have prepared for the changes may be starting to increase their market share.
Figure 4 Figure 5
Number of monthly new claims – RTA Portal Number of settled new claims – RTA Portal
Source: CLSA, RTA Claims Portal Source: CLSA, RTA Claims Portal
Figure 6 highlights the monthly pcp growth in new claims into the RTA Portal since June 2014.
Figure 6
New and settled claims monthly growth %
Source: CLSA, RTA Claims Portal
Multi-track risks have not transpired Discussions with a number of industry contacts for Bigger is much better indicated a negative outlook for revenues generated in the multi track (>£25,000 in damages) for FY15 and FY16. The consistent feedback we heard was that industry revenue could potentially decline 10-15% p.a. for the next two years as “post-Jackson” cases began to represent a higher proportion of industry revenue. With an estimated 55% and 65% of Slaters’ UK revenue and earnings relating to the multi track respectively, we saw a disconnect between our feedback from competitors and Slaters’ positive expectations for 8-10% p.a. organic growth.
While we expected the removal of referral fees and an increase in the threshold from £10,000 to £25,000 in damages to have a greater impact to cases in the fast track, we had expected the shift to the conditional fee arrangement (i.e. the lawyer’s success fee being deducted from the client’s
10,000
20,000
30,000
40,000
50,000
60,000
70,000
80,000
90,000
100,000
Oct 11 Apr 12 Oct 12 Apr 13 Oct 13 Apr 14 Oct 14
Number of new RTA cases (#)
10,000
12,000
14,000
16,000
18,000
20,000
22,000
24,000
26,000
28,000
Oct 11 Apr 12 Oct 12 Apr 13 Oct 13 Apr 14 Oct 14
Number of settled RTA cases (#)
-30%
-20%
-10%
0%
10%
20%
30%
40%
Oct 12 Apr 13 Oct 13 Apr 14 Oct 14
Settled claims pcp growth % New claims pcp growth %
New fast track claims have been increasing on a
pcp basis since June
We are more confident on the outlook for multi track

Taking share Slater & Gordon - BUY
16 December 2014 [email protected] 6
damages) as having a negative impact on cases within the multi track through a reduction in fees across the industry.
To demonstrate this we have used a simple example of a £100,000 award of damages for a plaintiff in a multi-track case held under a conditional fee agreement. We have used the average legal fee of £20,000 for a case of this size to highlight the net amount that a client is able to receive pre and post Jackson reform. In this simple example the net value of damages received by the client has fallen by £10,000 assuming the legal firm keeps its’ fees at the same level (£20,000):
• Pre Jackson reform – April 2013: Defendant pays £100,000 damages to the client and pays £20,000 in legal fees and a £20,000 success bonus to the winning legal firm. Client receives a net amount of £100,000 in damages and the defendant pays £140,000 in total
• Post Jackson reform – April 2013: Defendant pays £110,000 damages (increased by 10%) to the client and the £20,000 in legal fees charged to the defendant. The £20,000 success bonus to the winning legal firm is then deducted from the clients’ damages. Client receives a net amount of £90,000 in damages and the defendant pays £130,000 in total
Despite the majority of our UK industry contacts expecting a reduction in multi track legal fees due to the move towards a conditional fee arrangement, clients have for the most part accepted the new environment where the final award of damages for post-Jackson cases is lower than it was prior to April 2013. This is supported by a number of Australian based personal injury lawyers we have spoken to since arriving back in Australia who highlighted a similar situation in the mid-2000’s following intense regulatory reform following the collapse of HIH.
For these reasons the majority of multi track focused firms we have spoken to have not experienced a decline in legal fees and are expecting a similar year of organic top-line growth in CY15. To date we note that the number of new cases taken on following Jackson has continued to grow strongly and margins have remained between 30-40%.
Despite the near term risks we pointed to in June for the multi track not eventuating as we had expected, the consistent feedback we received from all of the firms we spoke to was that a reduction in multi track legal fees was likely over the next few years with one of the recommendations of Jackson yet to be fully adopted by the courts. Under the test of “proportionality” the Jackson reforms were looking to ensure that the legal fees paid by the losing defendant would be in proportion to the damages sought. Feedback from our trip to the UK suggested that particular areas of the law such as clinical negligence and industrial deafness were continuing to be taken advantage of by firms in the multi track with Jackson doing little to reduce fees and the flow of new cases. An example of this was a recent case called Coventry vs Lawrence which had created negative media publicity in the last few months where legal fees of £1,067,000 compared to the value of the family home in question of the dispute which was worth £300,000.
The majority of firms we spoke to in our recent trip to the UK were fearful around the adoption of a proportionality test by the courts. However, given
Success fees now get deducted from the client’s
damages
A reduction in legal fees is likely to have been
pushed out from FY15-16
Test of “proportionality” is the medium term risk
around legal fees
Our industry contacts expect fees to decline
over time
Taking share Slater & Gordon - BUY
16 December 2014 [email protected] 7
the estimated 2-3 year length of a personal injury case in the multi track and the time it would take for a “post-Jackson” case to go through various courts of appeal, the majority of our industry contacts were of the view that a decision impacting legal fees was not likely until CY17-18.
Further regulatory reform is unlikely Based on our recent feedback from the UK, the majority of firms we spoke to have not seen any evidence to suggest that a change in government will contribute to further regulatory reform. Given the publicity and the changes brought on by Jackson at the previous election, all of the firms we spoke to expect minimal changes, irrespective of the political party that wins in the election in May.
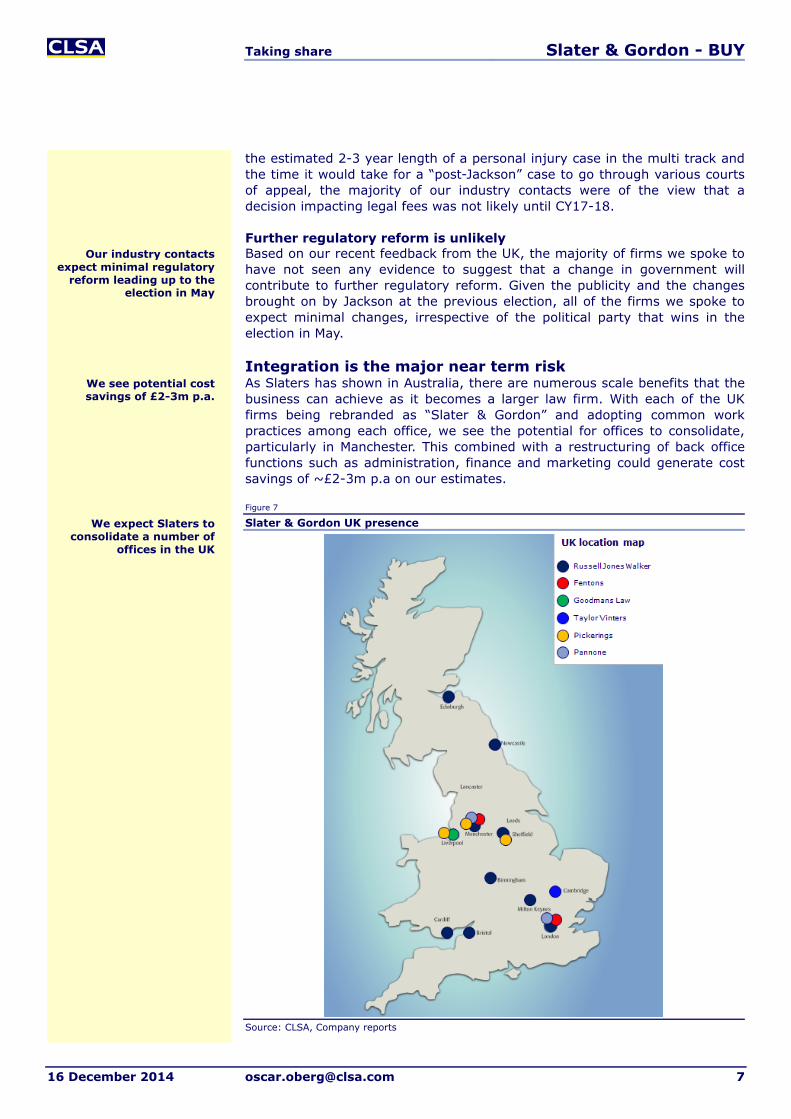
Integration is the major near term risk As Slaters has shown in Australia, there are numerous scale benefits that the business can achieve as it becomes a larger law firm. With each of the UK firms being rebranded as “Slater & Gordon” and adopting common work practices among each office, we see the potential for offices to consolidate, particularly in Manchester. This combined with a restructuring of back office functions such as administration, finance and marketing could generate cost savings of ~£2-3m p.a on our estimates.
Figure 7
Slater & Gordon UK presence
Source: CLSA, Company reports
We expect Slaters to consolidate a number of
offices in the UK
We see potential cost savings of £2-3m p.a.
Our industry contacts expect minimal regulatory
reform leading up to the election in May

Taking share Slater & Gordon - BUY
16 December 2014 [email protected] 8
We understand that the four individual offices of Russell Jones Walker, Pannone, Fentons and Pickerings in Manchester will be consolidated into a single office within the next few weeks. Following this the integration and rebranding of the three operating brands (Slater and Gordon, Fentons and Pannone) will occur with an estimated completion date of March 2015. Despite pushing out the start date for the integration, management has taken their time to plan extensively for the transition and are confident in the March 2015 completion date. With Russell Jones Walker successfully transitioning to the Slater and Gordon brand in September 2013, we see the possibility for Slaters FY14 acquisitions to achieve organic growth notwithstanding the negative impact that the integration may have on the firms in the near term (refer to Section 4).
As we have seen in Australia the integration of legal services acquisitions is an arduous process which takes a significant amount of time. The experience of Trilby Misso in QLD (refer to Section 3) suggests that Slaters will be keen to integrate Fentons and Pannone under the Slater and Gordon brand as soon as possible to ensure minimal duplication and that advertising returns are maximized. With management spending a lot of time in the UK and having the experience of integrating Russell Jones Walker, we expect Slaters to successfully integrate its UK acquisitions.
While we are more confident in the outlook for Slaters following our recent trip to the UK, we acknowledge that the main risk to the business in the near term will be Slaters’ integration of the FY14 acquisitions. Should management experience issues, we understand that the existing systems and brand names of the acquired law firms will remain the same for an extended period of time beyond the March completion date. As we have seen with the performance of Trilby Misso in QLD we see risks in delaying the integration process and hope that management spend the necessary time in FY15 to get the completion of the integration correct. For these reasons we will be monitoring developments around the integration very closely over the coming months.
Expecting M&A following a successful integration The importance of the integration of the UK acquisitions was highlighted on our recent trip to the UK. Banks continue to remain hesitant to provide financing to legal services firms and it appears that only Irwin Mitchell is Slaters’ serious competition for acquisitions (Irwin Mitchell recently increased its line of credit to £90m). As we highlight in Section 2, a number of the large firms like Quindell are struggling in the current environment, providing Slaters with an opportunity to consolidate the industry further.
While there appears to be a lack of firms generating £15-20m of revenue, there is an abundance of smaller bolt-ons across the UK which are achieving £8-10m of revenue that have a mix of fast and multi track cases. We understand that Slaters does not have a large presence in cities like Liverpool, Leeds, Cardiff, Birmingham and Sheffield and has not yet entered the Scottish market. Our feedback suggests that there are a large number of these firms for sale with Slaters continuing to have a first mover advantage in the sector. Furthermore we understand that Canada is beginning to seriously look at opening up its country to alternative business structures (“ABS”) to become the third country to allow listed legal firms. While this is likely to be 18-24 months away, a successful integration in the UK will give management confidence in expanding into this new market over time.
Slaters expect the integration to be
complete by March 2015
We view Slaters’ integration of the UK as
the major near term risk on the company
Expecting acquisitions from 1H16
We expect acquisitions of several £8-10m revenue
businesses
Taking share Slater & Gordon - BUY
16 December 2014 [email protected] 9
Given the importance of the upcoming integration to Slaters’ long term success in the UK, we do not expect decent sized acquisitions in the UK until the integration is complete by March 2015. Following this point we expect 2-3 acquisitions of medium sized firms (£8-10m revenue) that can be bolted on to the Slaters network. Should the integration succeed as planned, then we expect market share to double from the estimated ~5% at present to ~10% by FY17.
FY15 guidance can be achieved We had previously pointed to near-term risks around Slaters’ expansion into the UK, focusing on the changes made by the Jackson reforms in relation to legal fees and the impact this would have on multi track personal injury cases. Following our trip to the UK we think these risks have been largely mitigated and pushed out until at least FY17. While we will monitor this situation closely, we think that a successful integration can allow Slaters to revert back to acquisitive growth in FY16 and further enhance its market share to offset any sort of negative impact that Jackson may still have on the industry.
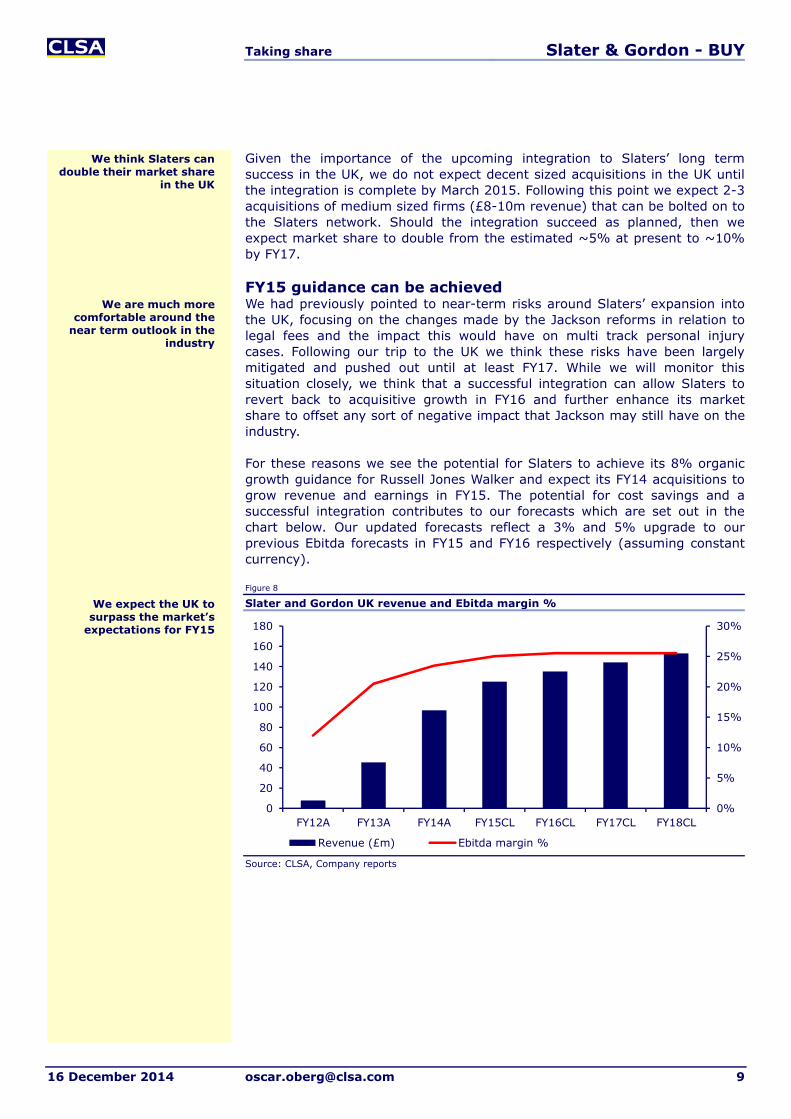
For these reasons we see the potential for Slaters to achieve its 8% organic growth guidance for Russell Jones Walker and expect its FY14 acquisitions to grow revenue and earnings in FY15. The potential for cost savings and a successful integration contributes to our forecasts which are set out in the chart below. Our updated forecasts reflect a 3% and 5% upgrade to our previous Ebitda forecasts in FY15 and FY16 respectively (assuming constant currency).
Figure 8
Slater and Gordon UK revenue and Ebitda margin %
Source: CLSA, Company reports
0%
5%
10%
15%
20%
25%
30%
0
20
40
60
80
100
120
140
160
180
FY12A FY13A FY14A FY15CL FY16CL FY17CL FY18CL
Revenue (£m) Ebitda margin %
We think Slaters can double their market share
in the UK
We are much more comfortable around the
near term outlook in the industry
We expect the UK to surpass the market’s
expectations for FY15
Taking share Slater & Gordon - BUY
16 December 2014 [email protected] 10
Quindell quagmire The share price collapse of AIM listed Quindell Plc since April presents Slaters with an opportunity to take market share from the largest player in the UK. No matter the outcome from PWC’s review into Quindell’s accounting practices, our recent feedback indicates that insurers are already looking for legal services firms to replace Quindell on various panels for fast track cases.
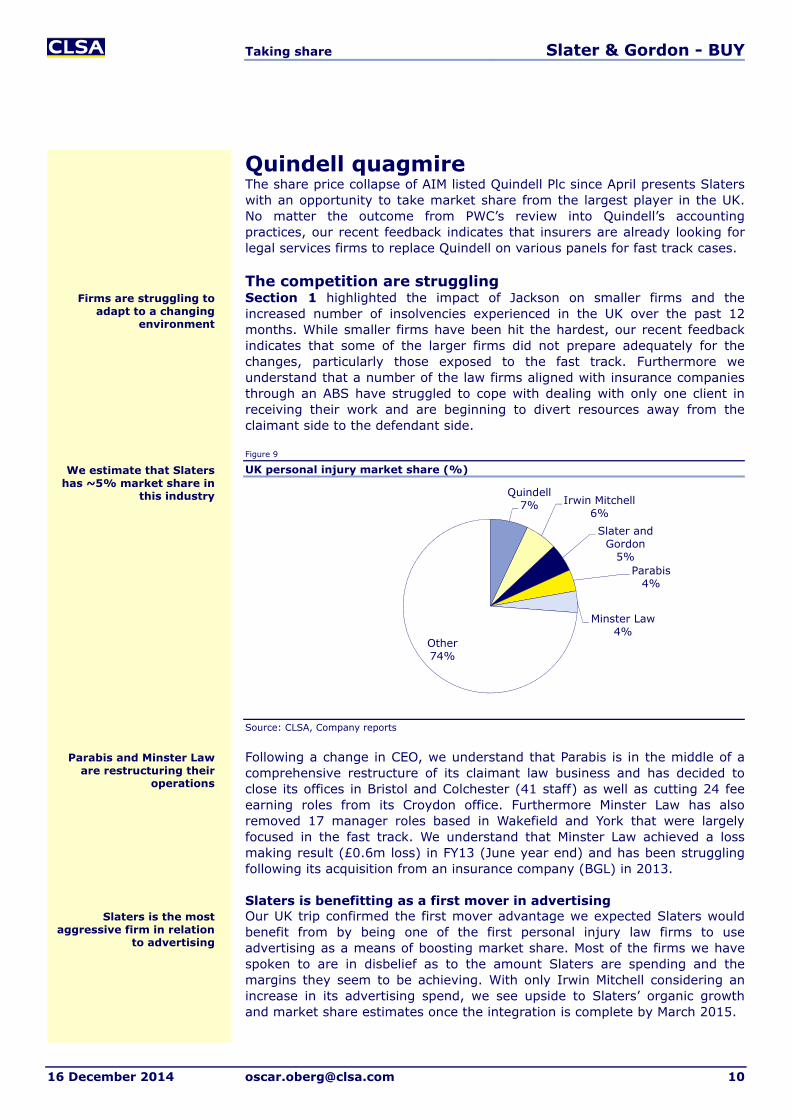
The competition are struggling Section 1 highlighted the impact of Jackson on smaller firms and the increased number of insolvencies experienced in the UK over the past 12 months. While smaller firms have been hit the hardest, our recent feedback indicates that some of the larger firms did not prepare adequately for the changes, particularly those exposed to the fast track. Furthermore we understand that a number of the law firms aligned with insurance companies through an ABS have struggled to cope with dealing with only one client in receiving their work and are beginning to divert resources away from the claimant side to the defendant side.
Figure 9
UK personal injury market share (%)
Source: CLSA, Company reports
Following a change in CEO, we understand that Parabis is in the middle of a comprehensive restructure of its claimant law business and has decided to close its offices in Bristol and Colchester (41 staff) as well as cutting 24 fee earning roles from its Croydon office. Furthermore Minster Law has also removed 17 manager roles based in Wakefield and York that were largely focused in the fast track. We understand that Minster Law achieved a loss making result (£0.6m loss) in FY13 (June year end) and has been struggling following its acquisition from an insurance company (BGL) in 2013.
Slaters is benefitting as a first mover in advertising Our UK trip confirmed the first mover advantage we expected Slaters would benefit from by being one of the first personal injury law firms to use advertising as a means of boosting market share. Most of the firms we have spoken to are in disbelief as to the amount Slaters are spending and the margins they seem to be achieving. With only Irwin Mitchell considering an increase in its advertising spend, we see upside to Slaters’ organic growth and market share estimates once the integration is complete by March 2015.
Quindell7% Irwin Mitchell
6%Slater and
Gordon5%
Parabis4%
Minster Law4%
Other74%
Firms are struggling to adapt to a changing
environment
Slaters is the most aggressive firm in relation
to advertising
We estimate that Slaters has ~5% market share in
this industry
Parabis and Minster Law are restructuring their
operations
Taking share Slater & Gordon - BUY
16 December 2014 [email protected] 11
Quindell opportunity In Bigger is much better we highlighted our estimate of the top five personal injury lawyers in the UK and compared it to Australia when Slaters listed in FY07. Unlike the Australian market that has been dominated by three players (Slaters, Shine and Maurice Blackburn), the UK market is more fragmented with an estimated five firms contributing to ~25% of the market.
We estimate that Quindell Plc (“Quindell”) is the largest personal injury law firm in the UK having listed on the AIM exchange in May 2011 as a technology focused company. Quindell has been able to leverage off its proprietary software solutions in the insurance and legal services industries to create a disruptive business model. This has allowed Quindell to quickly establish itself as the largest claims processor in the UK, with a focus on motor vehicle insurance and personal injury claims predominantly in the fast track.
The business has looked to use its technology platform to lower the cost of legal claims for insurers by providing a broad offering of solutions and services that assist across the entire lifecycle of a standard personal injury claim. Since listing in 2011 Quindell has grown rapidly by acquiring 17 acquisitions across the insurance claims process. Quindell acquired the legal practices of Silverbeck Rymer, Pinto Potts and The Compensation Lawyers in December 2012 which now makes up Quindell Legal Services along with two CMC’s: Compass Costs and Accident Advice Helpline. In CY13 the Legal Services division of Quindell achieved £157m in revenue which would make it the UK’s largest personal injury law firm with an estimated ~7% market share.
Extraordinary growth has been achieved Quindell’s operations are underpinned by the Challenger Enterprise platform, which incorporates all aspects of claims management such as legal and health services to help settle claims at a lower cost to insurers. On the other side of the business, Quindell provides a range of telematics services that are utilised by insurers to reduce the incidence of claims and reduce driver premiums.
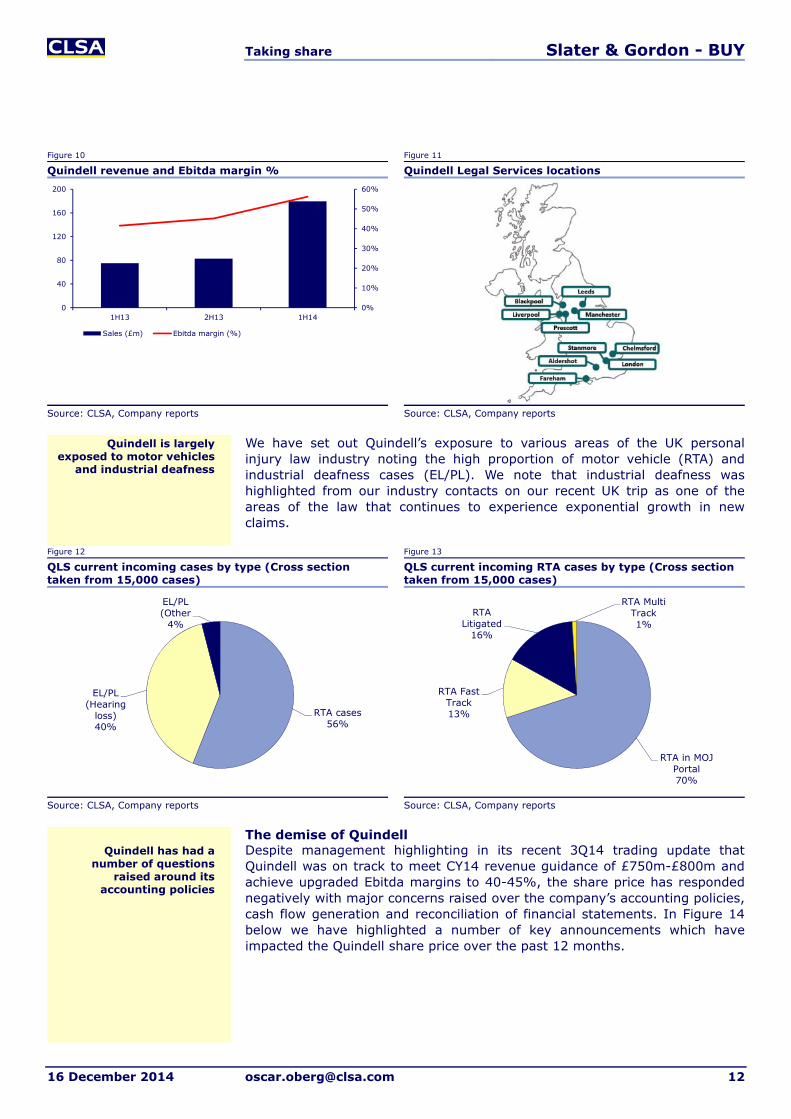
Quindell’s Legal Services (“QLS”) division operates from 10 locations across the UK and recorded 82,350 new cases in 1H14. QLS deals with Employer Liability and Public Liability (“EL/PL”) cases with a focus on hearing loss and Road Traffic Act (“RTA”) cases focusing on personal injury. We understand that QLS provides services to eight of the top ten insurers in the UK where it receives large volumes of lower value fast track claims. The business has grown exponentially in the last 12 months achieving £180m of revenue in the 1H14 result (December year end) which compares to the £157m of revenue achieved in CY13.
Australia is a more consolidated market than
the UK in relation to personal injury
We estimate that Quindell has ~7% market share
Quindell’s platform is used across the entire lifecycle of a personal
injury claim
The legal services division (“QLS”) has grown
considerably in the last 18 months
Quindell is the largest law firm focussed in personal
injury
Taking share Slater & Gordon - BUY
16 December 2014 [email protected] 12
Figure 10 Figure 11
Quindell revenue and Ebitda margin % Quindell Legal Services locations
Source: CLSA, Company reports Source: CLSA, Company reports
We have set out Quindell’s exposure to various areas of the UK personal injury law industry noting the high proportion of motor vehicle (RTA) and industrial deafness cases (EL/PL). We note that industrial deafness was highlighted from our industry contacts on our recent UK trip as one of the areas of the law that continues to experience exponential growth in new claims.
Figure 12 Figure 13
QLS current incoming cases by type (Cross section taken from 15,000 cases)
QLS current incoming RTA cases by type (Cross section taken from 15,000 cases)
Source: CLSA, Company reports Source: CLSA, Company reports
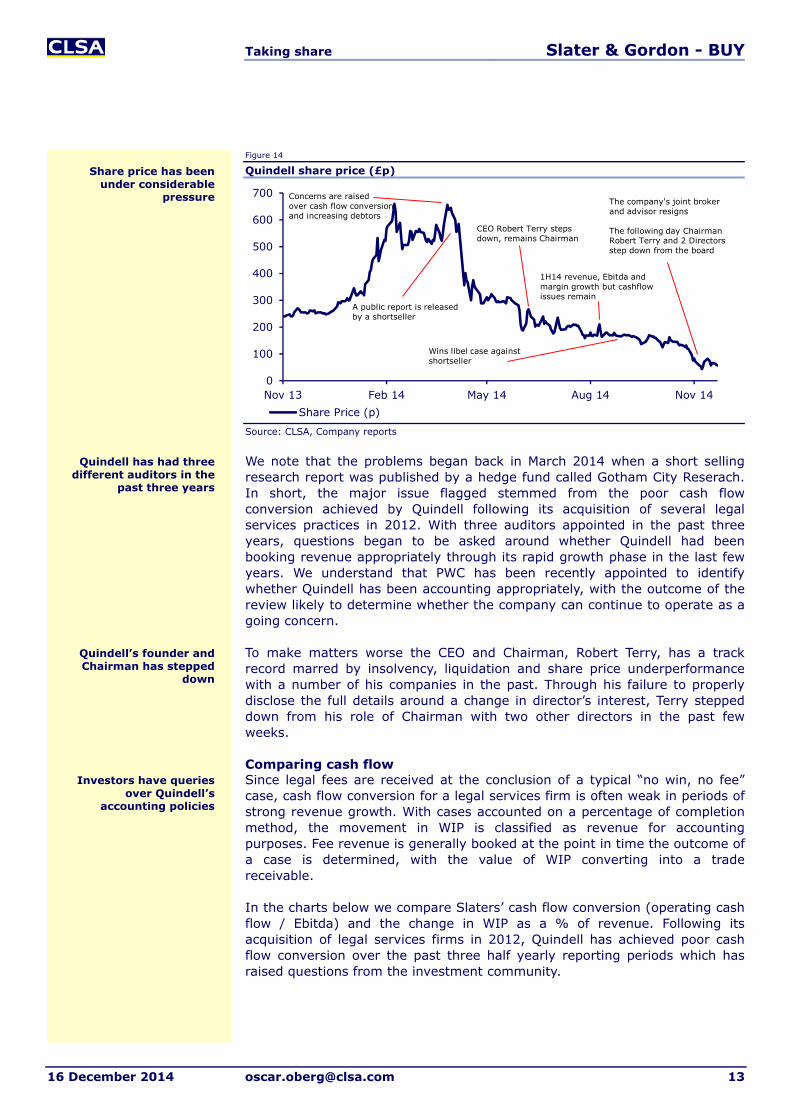
The demise of Quindell Despite management highlighting in its recent 3Q14 trading update that Quindell was on track to meet CY14 revenue guidance of £750m-£800m and achieve upgraded Ebitda margins to 40-45%, the share price has responded negatively with major concerns raised over the company’s accounting policies, cash flow generation and reconciliation of financial statements. In Figure 14 below we have highlighted a number of key announcements which have impacted the Quindell share price over the past 12 months.
0%
10%
20%
30%
40%
50%
60%
0
40
80
120
160
200
1H13 2H13 1H14
Sales (£m) Ebitda margin (%)
RTA cases56%
EL/PL (Hearing
loss)40%
EL/PL (Other
4%
RTA in MOJ Portal70%
RTA Fast Track13%
RTA Litigated
16%
RTA Multi Track1%
Quindell has had a number of questions
raised around its accounting policies
Quindell is largely exposed to motor vehicles
and industrial deafness
Taking share Slater & Gordon - BUY
16 December 2014 [email protected] 13
Figure 14
Quindell share price (£p)
Source: CLSA, Company reports
We note that the problems began back in March 2014 when a short selling research report was published by a hedge fund called Gotham City Reserach. In short, the major issue flagged stemmed from the poor cash flow conversion achieved by Quindell following its acquisition of several legal services practices in 2012. With three auditors appointed in the past three years, questions began to be asked around whether Quindell had been booking revenue appropriately through its rapid growth phase in the last few years. We understand that PWC has been recently appointed to identify whether Quindell has been accounting appropriately, with the outcome of the review likely to determine whether the company can continue to operate as a going concern.
To make matters worse the CEO and Chairman, Robert Terry, has a track record marred by insolvency, liquidation and share price underperformance with a number of his companies in the past. Through his failure to properly disclose the full details around a change in director’s interest, Terry stepped down from his role of Chairman with two other directors in the past few weeks.
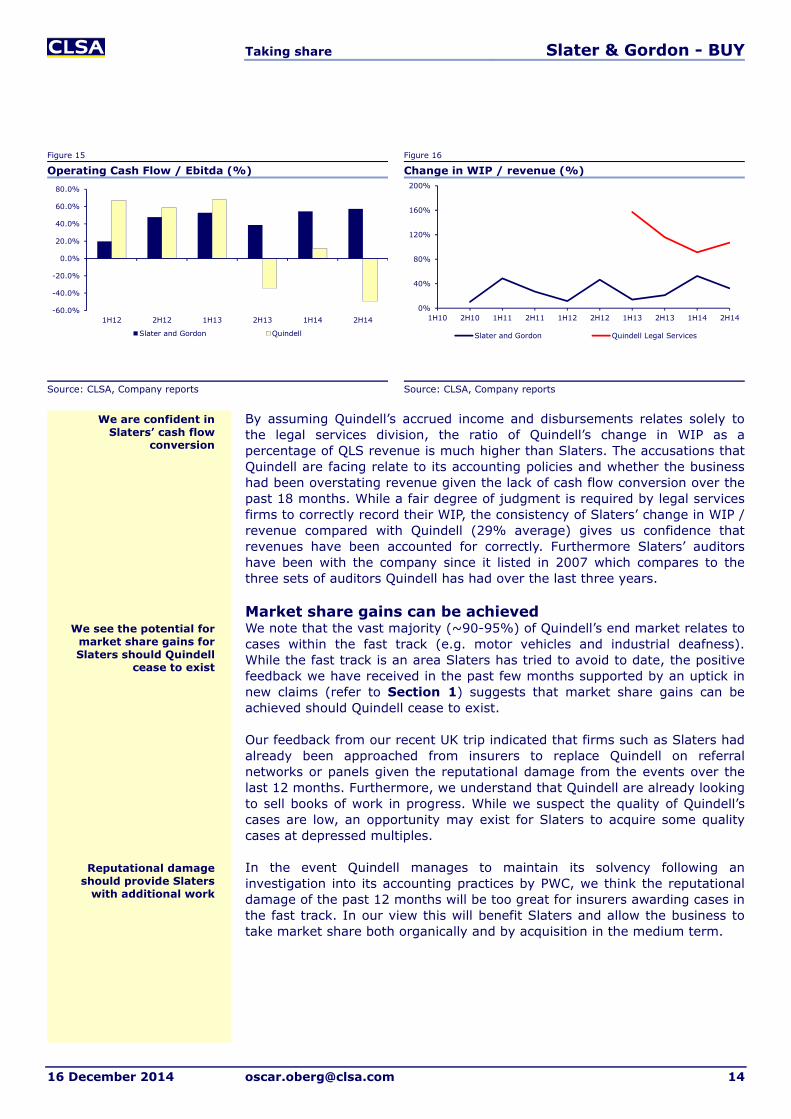
Comparing cash flow Since legal fees are received at the conclusion of a typical “no win, no fee” case, cash flow conversion for a legal services firm is often weak in periods of strong revenue growth. With cases accounted on a percentage of completion method, the movement in WIP is classified as revenue for accounting purposes. Fee revenue is generally booked at the point in time the outcome of a case is determined, with the value of WIP converting into a trade receivable.
In the charts below we compare Slaters’ cash flow conversion (operating cash flow / Ebitda) and the change in WIP as a % of revenue. Following its acquisition of legal services firms in 2012, Quindell has achieved poor cash flow conversion over the past three half yearly reporting periods which has raised questions from the investment community.
0
100
200
300
400
500
600
700
Nov 13 Feb 14 May 14 Aug 14 Nov 14Share Price (p)
Concerns are raisedover cash flow conversionand increasing debtors
A public report is releasedby a shortseller
Wins libel case againstshortseller
The company's joint brokerand advisor resigns
The following day Chairman Robert Terry and 2 Directorsstep down from the board
CEO Robert Terry steps down, remains Chairman
1H14 revenue, Ebitda andmargin growth but cashflowissues remain
Share price has been under considerable
pressure
Quindell has had three different auditors in the
past three years
Quindell’s founder and Chairman has stepped
down
Investors have queries over Quindell’s
accounting policies
Taking share Slater & Gordon - BUY
16 December 2014 [email protected] 14
Figure 15 Figure 16
Operating Cash Flow / Ebitda (%) Change in WIP / revenue (%)
Source: CLSA, Company reports Source: CLSA, Company reports
By assuming Quindell’s accrued income and disbursements relates solely to the legal services division, the ratio of Quindell’s change in WIP as a percentage of QLS revenue is much higher than Slaters. The accusations that Quindell are facing relate to its accounting policies and whether the business had been overstating revenue given the lack of cash flow conversion over the past 18 months. While a fair degree of judgment is required by legal services firms to correctly record their WIP, the consistency of Slaters’ change in WIP / revenue compared with Quindell (29% average) gives us confidence that revenues have been accounted for correctly. Furthermore Slaters’ auditors have been with the company since it listed in 2007 which compares to the three sets of auditors Quindell has had over the last three years.
Market share gains can be achieved We note that the vast majority (~90-95%) of Quindell’s end market relates to cases within the fast track (e.g. motor vehicles and industrial deafness). While the fast track is an area Slaters has tried to avoid to date, the positive feedback we have received in the past few months supported by an uptick in new claims (refer to Section 1) suggests that market share gains can be achieved should Quindell cease to exist.
Our feedback from our recent UK trip indicated that firms such as Slaters had already been approached from insurers to replace Quindell on referral networks or panels given the reputational damage from the events over the last 12 months. Furthermore, we understand that Quindell are already looking to sell books of work in progress. While we suspect the quality of Quindell’s cases are low, an opportunity may exist for Slaters to acquire some quality cases at depressed multiples.
In the event Quindell manages to maintain its solvency following an investigation into its accounting practices by PWC, we think the reputational damage of the past 12 months will be too great for insurers awarding cases in the fast track. In our view this will benefit Slaters and allow the business to take market share both organically and by acquisition in the medium term.
-60.0%
-40.0%
-20.0%
0.0%
20.0%
40.0%
60.0%
80.0%
1H12 2H12 1H13 2H13 1H14 2H14
Slater and Gordon Quindell
0%
40%
80%
120%
160%
200%
1H10 2H10 1H11 2H11 1H12 2H12 1H13 2H13 1H14 2H14
Slater and Gordon Quindell Legal Services
We see the potential for market share gains for Slaters should Quindell
cease to exist
Reputational damage should provide Slaters
with additional work
We are confident in Slaters’ cash flow
conversion

Taking share Slater & Gordon - BUY
16 December 2014 [email protected] 15
General Law needs to stand up Increased competition and difficulties in QLD supports our view that Slaters’ 5% organic top line growth target in Australian PI will be tough to achieve from FY15-17. Despite the General Law division disappointing over the past few years, we expect organic top line growth of >10% p.a with Slaters reaching its 12-15% Ebitda margin target by FY17.
Tougher environment for growth Despite our favourable view of Slaters’ consolidation strategy in Australia, our Bigger is much better report set out our views that Slaters’ first mover advantage was diminishing with a large number of competitors now looking to use advertising expenditure as a way of generating organic growth. We set out below our estimates for Australian related advertising expenditure and note the increase as a % of revenue from ~3.0% to ~6.5% from FY05-14. In our view Figure 18 demonstrates that Slaters is achieving less organic top-line growth for every additional dollar spent on advertising.
Figure 17 Figure 18
SGH Australia advertising as a % of revenue SGH Australia organic revenue / advertising
Source: CLSA, Company reports Source: CLSA, Company reports
With market share around ~25%, we believe that Slaters’ Australian personal injury business is approaching a stage of maturity which will make management’s target of >5% p.a. organic growth difficult to achieve. For these reasons we believe that a more appropriate organic growth rate for Slaters is ~3-5% p.a. with the business approaching a stage of maturity.
QLD continues to be weak At the FY14 result management identified weakness in its QLD business due to regulatory change and the rebranding of the Trilby Misso brand to Slater and Gordon. We understand that this weakness has continued in the first half of the year and while management are confident that the issues in QLD has been resolved, organic growth is likely to be negative over the course of FY15.
With QLD representing around 22% of Slaters’ PI revenue in Australia, Slaters must achieve high single digit organic growth from its other states to achieve its 5% organic growth forecast. Based on our industry feedback, we think increased competition from Shine and Maurice Blackburn will make it difficult for Slaters to achieve these growth estimates. For these reasons we have assumed 3.5% organic growth for Slaters’ Australian PI business in FY15 and expect the possibility of a flat 1H15 result.
0.0%
1.0%
2.0%
3.0%
4.0%
5.0%
6.0%
7.0%
8.0%
0
2
4
6
8
10
12
14
16
18
FY05A FY06A FY07A FY08A FY09A FY10A FY11A FY12A FY13A FY14A
Australia AUS advertising as a % of AUS revenue
0.0
2.0
4.0
6.0
8.0
10.0
FY07A FY08A FY09A FY10A FY11A FY12A FY13A FY14A
Organic revenue / Advertising (#)
We think Slaters’ market share in AUS PI is
“maxing” out
Slaters’ Australian PIbusiness is approaching
maturity with ~25%market share
We think organic growth expectations in AUS PI should be 3-5% rather
than >5%
Taking share Slater & Gordon - BUY
16 December 2014 [email protected] 16
The time is now for General Law Slaters’ General Law division represented ~19% of Australian revenue (~10% of Group revenue) in FY14 and consists of three broad revenue streams including conveyancing, family law and specialized litigation practices. Despite the business streams within General Law growing at twice the rate of personal injury (1-2% p.a), Slaters has underperformed in the division over the past five years. We understand that a number of these problems have stemmed from a lack of volume through its conveyancing practice following the acquisition of Conveyancing Works in FY13 combined with difficulties Slaters has faced in shifting to a different fee paying model within family law.
Our discussions with industry contacts suggest that legal services within General Law are more competitive with Slaters having low market penetration compared to its personal injury practice. Furthermore we see the potential for legal services such as conveyancing to be commoditized over time through the introduction of disruptive legal services firms that operate solely online. Despite this view we see a longer term strategic value for Slaters to be in this sector with legal services such as conveyancing, divorce and wills and estates usually the first forms of legal advice a consumer requires during their life. Apart from the obvious benefits around cash flow generation given the faster speed of case conversion, the General Law division provides another form of advertising and allows Slaters to regularly contact previous clients for higher value legal services in the future such as personal injury.
After a period of restructuring we understand that the family law and specialized litigation practices are delivering an improved performance in FY15 and are on track to deliver double digit organic revenue growth. We understand that Slaters have a backlog of class action cases that are set to complete in the near term which should further assist in the top-line growth of the division. We understand that the conveyancing practice continues to be a drag on the division with Slaters operating at around 75% of the 20,000 cases required to achieve the 12-15% Ebitda margins that management have targeted.
Despite the division being on track for >10% organic growth in FY15, we continue to expect mid to high single digit Ebitda margins for the division. Given our views on the declining organic growth profile of the Australian personal injury business, we expect the General Law division to begin delivering on the 12-15% targeted Ebitda margins from FY17. While we understand the business is on track to hit this target, we will be continuing to monitor the performance of the division as we believe its success is important for the Australian division to continue maintaining its consistent Ebitda margins of ~25%.
General Law consists of Conveyancing, Family Law and Specialised Litigation
General Law services are more competitive than
Personal Injury
Conveyancing has underperformed
General Law needs to perform to offset a
declining organic growth profile in Personal Injury
Taking share Slater & Gordon - BUY
16 December 2014 [email protected] 17
UK risks have been mitigated, BUY Despite expecting a slight miss in the Australian PI business for FY15, we think the market will look through any weakness for the positive medium term outlook and the potential for upgrades in the UK. Our increased confidence drives the 5-6% increases to Eps we have made from FY15-17. We upgrade our target price to $7.25/share and our recommendation to BUY.
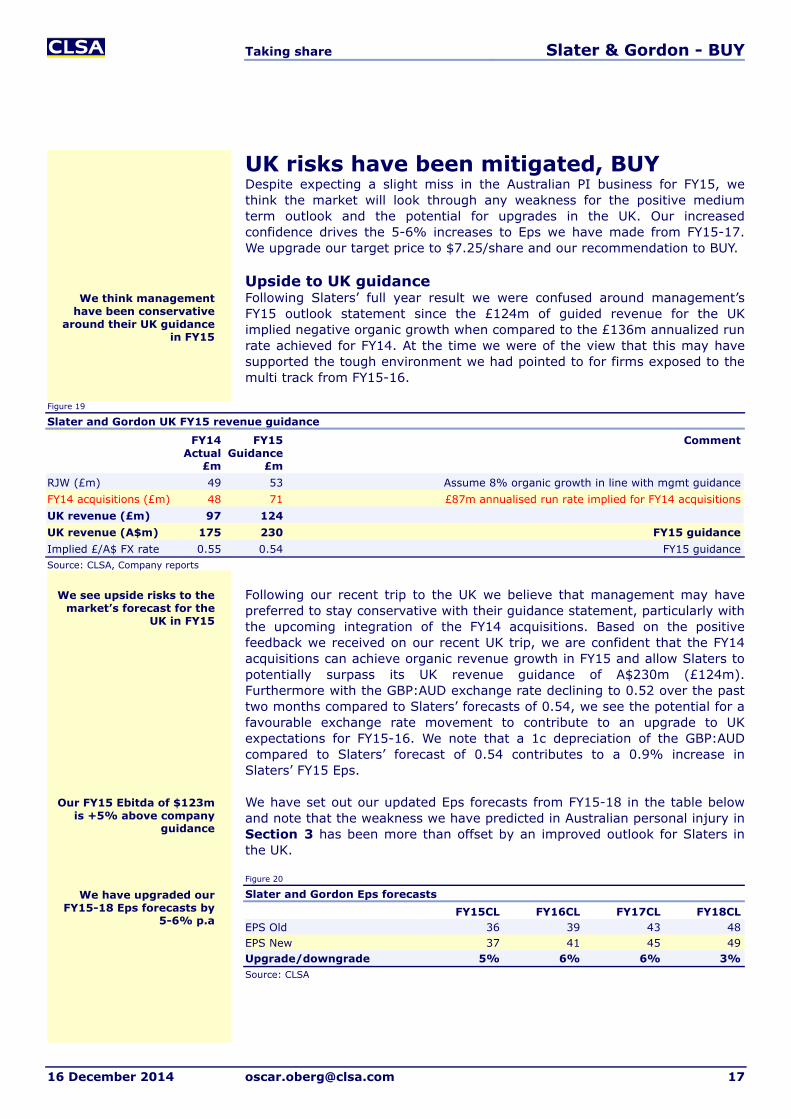
Upside to UK guidance Following Slaters’ full year result we were confused around management’s FY15 outlook statement since the £124m of guided revenue for the UK implied negative organic growth when compared to the £136m annualized run rate achieved for FY14. At the time we were of the view that this may have supported the tough environment we had pointed to for firms exposed to the multi track from FY15-16.
Figure 19
Slater and Gordon UK FY15 revenue guidance
FY14 Actual
£m
FY15 Guidance
£m
Comment
RJW (£m) 49 53 Assume 8% organic growth in line with mgmt guidanceFY14 acquisitions (£m) 48 71 £87m annualised run rate implied for FY14 acquisitionsUK revenue (£m) 97 124 UK revenue (A$m) 175 230 FY15 guidanceImplied £/A$ FX rate 0.55 0.54 FY15 guidanceSource: CLSA, Company reports
Following our recent trip to the UK we believe that management may have preferred to stay conservative with their guidance statement, particularly with the upcoming integration of the FY14 acquisitions. Based on the positive feedback we received on our recent UK trip, we are confident that the FY14 acquisitions can achieve organic revenue growth in FY15 and allow Slaters to potentially surpass its UK revenue guidance of A$230m (£124m). Furthermore with the GBP:AUD exchange rate declining to 0.52 over the past two months compared to Slaters’ forecasts of 0.54, we see the potential for a favourable exchange rate movement to contribute to an upgrade to UK expectations for FY15-16. We note that a 1c depreciation of the GBP:AUD compared to Slaters’ forecast of 0.54 contributes to a 0.9% increase in Slaters’ FY15 Eps.
We have set out our updated Eps forecasts from FY15-18 in the table below and note that the weakness we have predicted in Australian personal injury in Section 3 has been more than offset by an improved outlook for Slaters in the UK.
Figure 20
Slater and Gordon Eps forecasts FY15CL FY16CL FY17CL FY18CLEPS Old 36 39 43 48EPS New 37 41 45 49Upgrade/downgrade 5% 6% 6% 3%Source: CLSA
We have upgraded our FY15-18 Eps forecasts by
5-6% p.a
Our FY15 Ebitda of $123m is +5% above company
guidance
We think management have been conservative
around their UK guidance in FY15
We see upside risks to the market’s forecast for the
UK in FY15
Taking share Slater & Gordon - BUY
16 December 2014 [email protected] 18
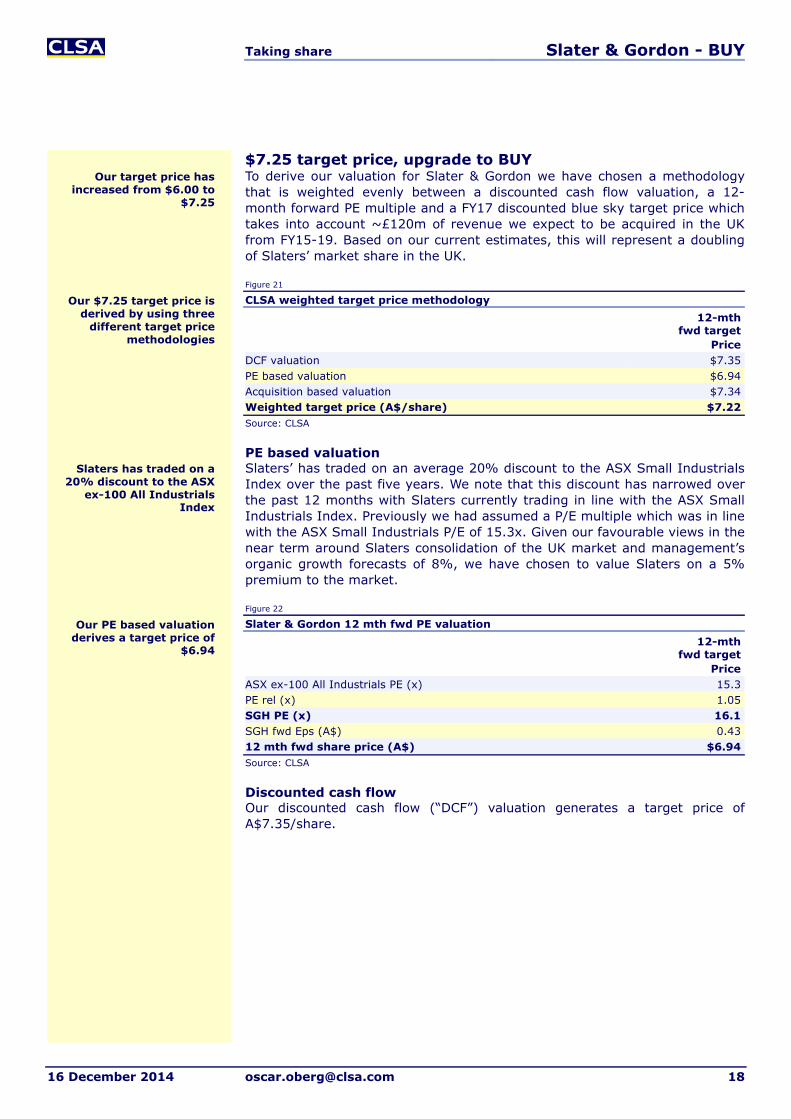
$7.25 target price, upgrade to BUY To derive our valuation for Slater & Gordon we have chosen a methodology that is weighted evenly between a discounted cash flow valuation, a 12-month forward PE multiple and a FY17 discounted blue sky target price which takes into account ~£120m of revenue we expect to be acquired in the UK from FY15-19. Based on our current estimates, this will represent a doubling of Slaters’ market share in the UK.
Figure 21
CLSA weighted target price methodology 12-mth
fwd target Price
DCF valuation $7.35PE based valuation $6.94Acquisition based valuation $7.34Weighted target price (A$/share) $7.22Source: CLSA
PE based valuation Slaters’ has traded on an average 20% discount to the ASX Small Industrials Index over the past five years. We note that this discount has narrowed over the past 12 months with Slaters currently trading in line with the ASX Small Industrials Index. Previously we had assumed a P/E multiple which was in line with the ASX Small Industrials P/E of 15.3x. Given our favourable views in the near term around Slaters consolidation of the UK market and management’s organic growth forecasts of 8%, we have chosen to value Slaters on a 5% premium to the market.
Figure 22
Slater & Gordon 12 mth fwd PE valuation 12-mth
fwd target Price
ASX ex-100 All Industrials PE (x) 15.3PE rel (x) 1.05SGH PE (x) 16.1SGH fwd Eps (A$) 0.4312 mth fwd share price (A$) $6.94Source: CLSA
Discounted cash flow Our discounted cash flow (“DCF”) valuation generates a target price of A$7.35/share.
Our $7.25 target price is derived by using three
different target price methodologies
Our target price has increased from $6.00 to
$7.25
Our PE based valuation derives a target price of
$6.94
Slaters has traded on a 20% discount to the ASX
ex-100 All Industrials Index
Taking share Slater & Gordon - BUY
16 December 2014 [email protected] 19
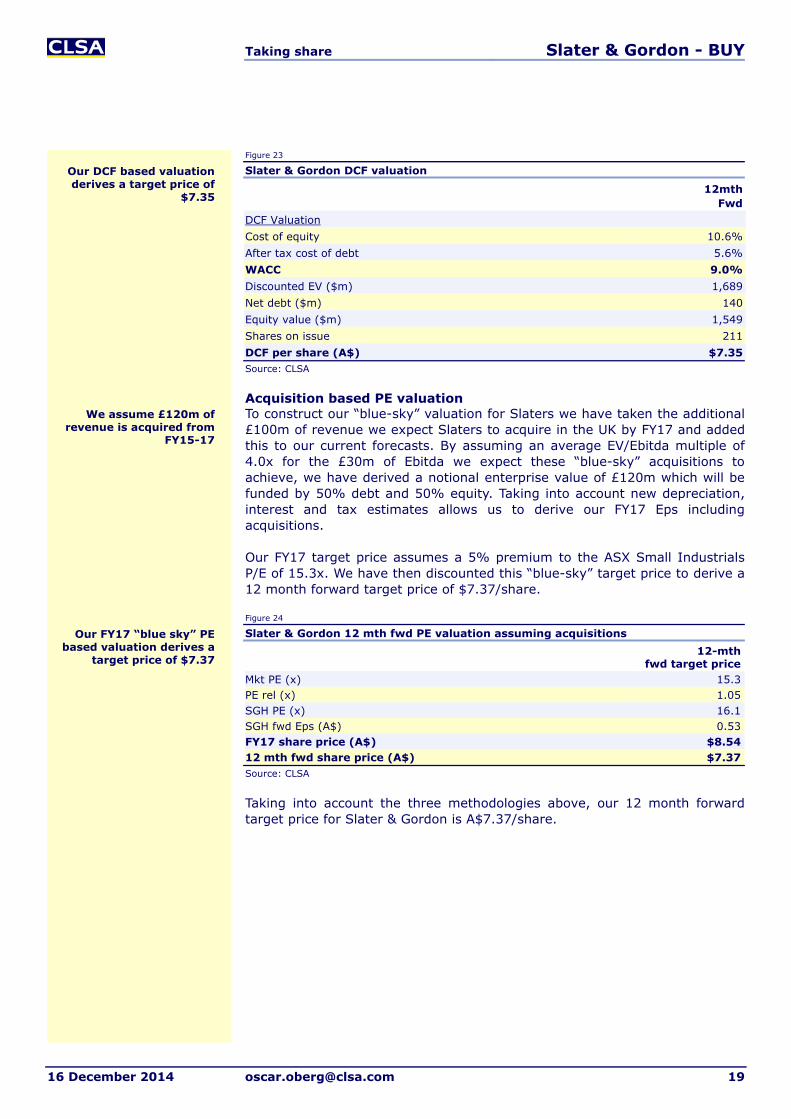
Figure 23
Slater & Gordon DCF valuation
12mthFwd
DCF Valuation Cost of equity 10.6%After tax cost of debt 5.6%WACC 9.0%Discounted EV ($m) 1,689Net debt ($m) 140Equity value ($m) 1,549Shares on issue 211DCF per share (A$) $7.35Source: CLSA
Acquisition based PE valuation To construct our “blue-sky” valuation for Slaters we have taken the additional £100m of revenue we expect Slaters to acquire in the UK by FY17 and added this to our current forecasts. By assuming an average EV/Ebitda multiple of 4.0x for the £30m of Ebitda we expect these “blue-sky” acquisitions to achieve, we have derived a notional enterprise value of £120m which will be funded by 50% debt and 50% equity. Taking into account new depreciation, interest and tax estimates allows us to derive our FY17 Eps including acquisitions.
Our FY17 target price assumes a 5% premium to the ASX Small Industrials P/E of 15.3x. We have then discounted this “blue-sky” target price to derive a 12 month forward target price of $7.37/share.
Figure 24
Slater & Gordon 12 mth fwd PE valuation assuming acquisitions 12-mth
fwd target priceMkt PE (x) 15.3PE rel (x) 1.05SGH PE (x) 16.1SGH fwd Eps (A$) 0.53FY17 share price (A$) $8.5412 mth fwd share price (A$) $7.37Source: CLSA
Taking into account the three methodologies above, our 12 month forward target price for Slater & Gordon is A$7.37/share.
Our FY17 “blue sky” PE based valuation derives a
target price of $7.37
Our DCF based valuation derives a target price of
$7.35
We assume £120m of revenue is acquired from
FY15-17
Taking share Slater & Gordon - BUY
16 December 2014 [email protected] 20
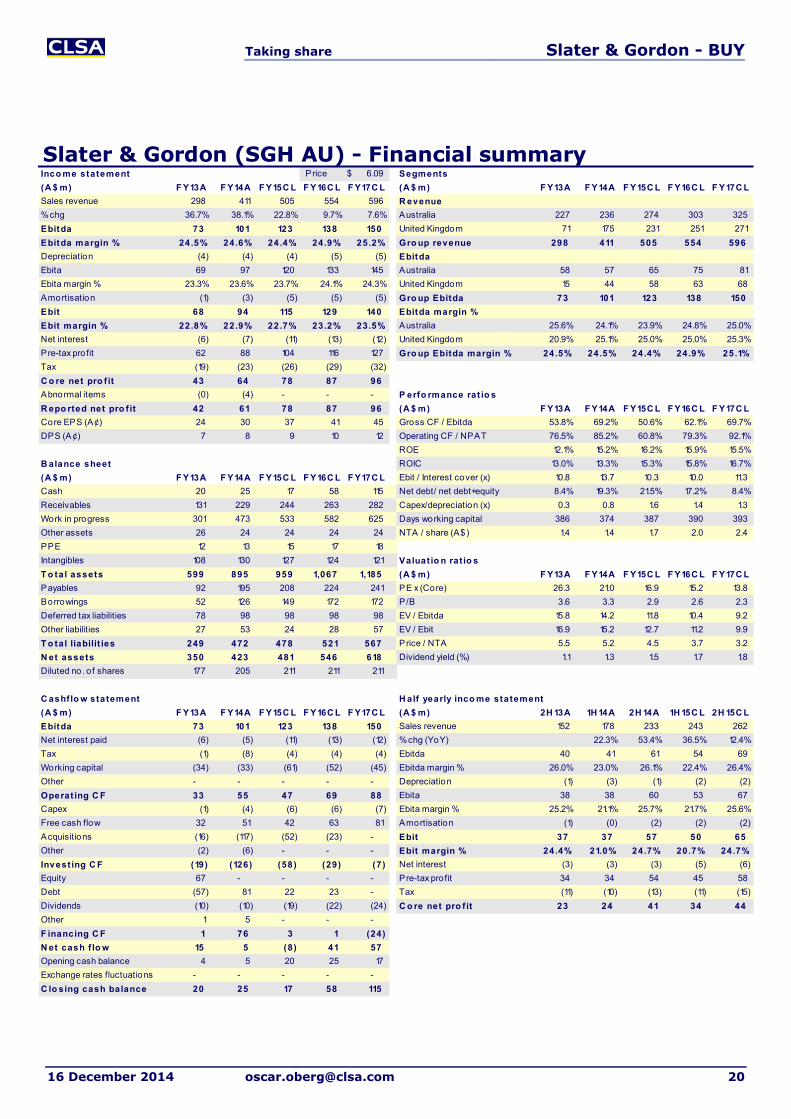
Slater & Gordon (SGH AU) - Financial summaryInco me statement Price 6.09$ Segments
(A $ m) F Y13A F Y14A F Y15C L F Y16C L F Y17C L (A $ m) F Y13A F Y14A F Y15C L F Y16C L F Y17C L
Sales revenue 298 411 505 554 596 R evenue
% chg 36.7% 38.1% 22.8% 9.7% 7.6% Australia 227 236 274 303 325
Ebitda 73 101 123 138 150 United Kingdom 71 175 231 251 271
Ebitda margin % 24.5% 24.6% 24.4% 24.9% 25.2% Gro up revenue 298 411 505 554 596
Depreciation (4) (4) (4) (5) (5) Ebitda
Ebita 69 97 120 133 145 Australia 58 57 65 75 81
Ebita margin % 23.3% 23.6% 23.7% 24.1% 24.3% United Kingdom 15 44 58 63 68
Amortisation (1) (3) (5) (5) (5) Gro up Ebitda 73 101 123 138 150
Ebit 68 94 115 129 140 Ebitda margin %
Ebit margin % 22.8% 22.9% 22.7% 23.2% 23.5% Australia 25.6% 24.1% 23.9% 24.8% 25.0%
Net interest (6) (7) (11) (13) (12) United Kingdom 20.9% 25.1% 25.0% 25.0% 25.3%
Pre-tax profit 62 88 104 116 127 Gro up Ebitda margin % 24.5% 24.5% 24.4% 24.9% 25.1%
Tax (19) (23) (26) (29) (32)
C o re net pro f it 43 64 78 87 96
Abnormal items (0) (4) - - - P erfo rmance rat io s
R epo rted net pro f it 42 61 78 87 96 (A $ m) F Y13A F Y14A F Y15C L F Y16C L F Y17C L
Core EPS (A¢) 24 30 37 41 45 Gross CF / Ebitda 53.8% 69.2% 50.6% 62.1% 69.7%
DPS (A¢) 7 8 9 10 12 Operating CF / NPAT 76.5% 85.2% 60.8% 79.3% 92.1%
ROE 12.1% 15.2% 16.2% 15.9% 15.5%
B alance sheet ROIC 13.0% 13.3% 15.3% 15.8% 16.7%
(A $ m) F Y13A F Y14A F Y15C L F Y16C L F Y17C L Ebit / Interest cover (x) 10.8 13.7 10.3 10.0 11.3
Cash 20 25 17 58 115 Net debt/ net debt+equity 8.4% 19.3% 21.5% 17.2% 8.4%
Receivables 131 229 244 263 282 Capex/depreciation (x) 0.3 0.8 1.6 1.4 1.3
Work in progress 301 473 533 582 625 Days working capital 386 374 387 390 393
Other assets 26 24 24 24 24 NTA / share (A$) 1.4 1.4 1.7 2.0 2.4
PPE 12 13 15 17 18
Intangibles 108 130 127 124 121 Valuat io n rat io s
T o tal assets 599 895 959 1,067 1,185 (A $ m) F Y13A F Y14A F Y15C L F Y16C L F Y17C L
Payables 92 195 208 224 241 PE x (Core) 26.3 21.0 16.9 15.2 13.8
Borrowings 52 126 149 172 172 P /B 3.6 3.3 2.9 2.6 2.3
Deferred tax liabilities 78 98 98 98 98 EV / Ebitda 15.8 14.2 11.8 10.4 9.2
Other liabilities 27 53 24 28 57 EV / Ebit 16.9 15.2 12.7 11.2 9.9
T o tal liabilit ies 249 472 478 521 567 Price / NTA 5.5 5.2 4.5 3.7 3.2
N et assets 350 423 481 546 618 Dividend yield (%) 1.1 1.3 1.5 1.7 1.8
Diluted no. o f shares 177 205 211 211 211
C ashflo w statement H alf yearly inco me statement
(A $ m) F Y13A F Y14A F Y15C L F Y16C L F Y17C L (A $ m) 2H 13A 1H 14A 2H 14A 1H 15C L 2H 15C L
Ebitda 73 101 123 138 150 Sales revenue 152 178 233 243 262
Net interest paid (6) (5) (11) (13) (12) % chg (YoY) 22.3% 53.4% 36.5% 12.4%
Tax (1) (8) (4) (4) (4) Ebitda 40 41 61 54 69
Working capital (34) (33) (61) (52) (45) Ebitda margin % 26.0% 23.0% 26.1% 22.4% 26.4%
Other - - - - - Depreciation (1) (3) (1) (2) (2)
Operat ing C F 33 55 47 69 88 Ebita 38 38 60 53 67
Capex (1) (4) (6) (6) (7) Ebita margin % 25.2% 21.1% 25.7% 21.7% 25.6%
Free cash flow 32 51 42 63 81 Amortisation (1) (0) (2) (2) (2)
Acquisitions (16) (117) (52) (23) - Ebit 37 37 57 50 65
Other (2) (6) - - - Ebit margin % 24.4% 21.0% 24.7% 20.7% 24.7%
Invest ing C F (19) (126) (58) (29) (7) Net interest (3) (3) (3) (5) (6)
Equity 67 - - - - Pre-tax profit 34 34 54 45 58
Debt (57) 81 22 23 - Tax (11) (10) (13) (11) (15)
Dividends (10) (10) (19) (22) (24) C o re net pro f it 23 24 41 34 44
Other 1 5 - - -
F inancing C F 1 76 3 1 (24)
N et cash f lo w 15 5 (8) 41 57
Opening cash balance 4 5 20 25 17
Exchange rates fluctuations - - - - -
C lo sing cash balance 20 25 17 58 115
Taking share Slater & Gordon - BUY
16 December 2014 [email protected] 21
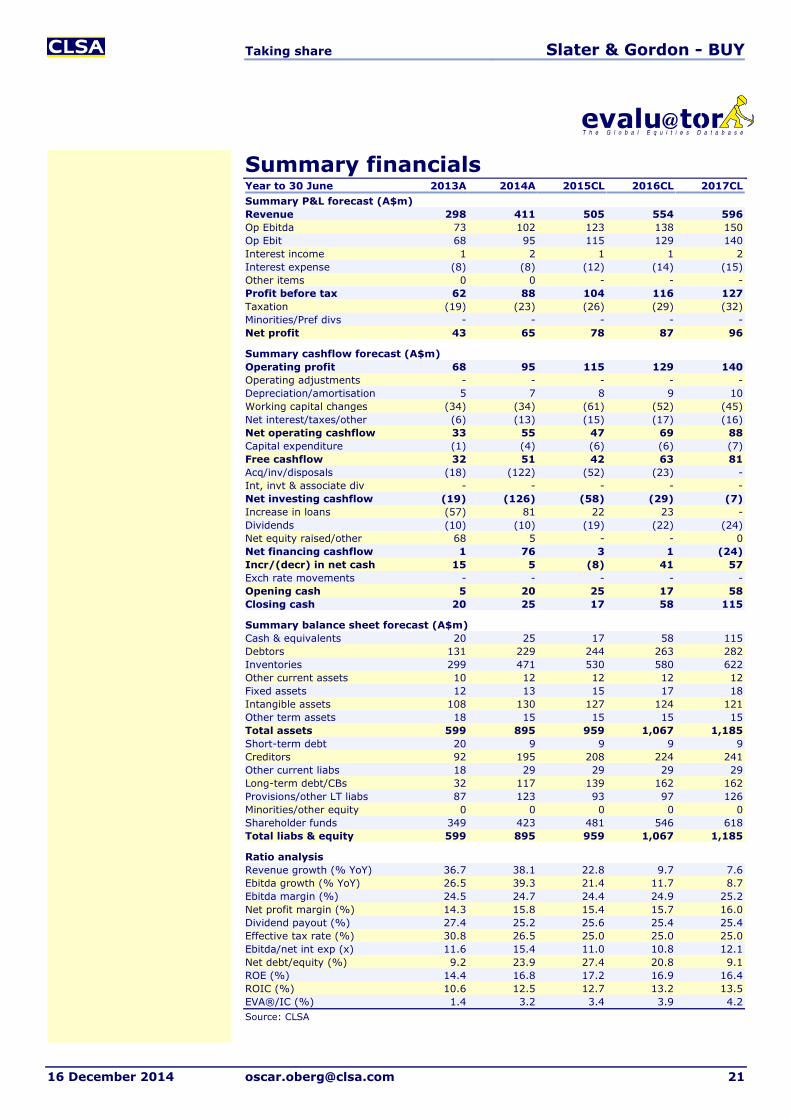
Summary financials Year to 30 June 2013A 2014A 2015CL 2016CL 2017CLSummary P&L forecast (A$m) Revenue 298 411 505 554 596Op Ebitda 73 102 123 138 150Op Ebit 68 95 115 129 140Interest income 1 2 1 1 2Interest expense (8) (8) (12) (14) (15)Other items 0 0 - - -Profit before tax 62 88 104 116 127Taxation (19) (23) (26) (29) (32)Minorities/Pref divs - - - - -Net profit 43 65 78 87 96
Summary cashflow forecast (A$m) Operating profit 68 95 115 129 140Operating adjustments - - - - -Depreciation/amortisation 5 7 8 9 10Working capital changes (34) (34) (61) (52) (45)Net interest/taxes/other (6) (13) (15) (17) (16)Net operating cashflow 33 55 47 69 88Capital expenditure (1) (4) (6) (6) (7)Free cashflow 32 51 42 63 81Acq/inv/disposals (18) (122) (52) (23) -Int, invt & associate div - - - - -Net investing cashflow (19) (126) (58) (29) (7)Increase in loans (57) 81 22 23 -Dividends (10) (10) (19) (22) (24)Net equity raised/other 68 5 - - 0Net financing cashflow 1 76 3 1 (24)Incr/(decr) in net cash 15 5 (8) 41 57Exch rate movements - - - - -Opening cash 5 20 25 17 58Closing cash 20 25 17 58 115
Summary balance sheet forecast (A$m) Cash & equivalents 20 25 17 58 115Debtors 131 229 244 263 282Inventories 299 471 530 580 622Other current assets 10 12 12 12 12Fixed assets 12 13 15 17 18Intangible assets 108 130 127 124 121Other term assets 18 15 15 15 15Total assets 599 895 959 1,067 1,185Short-term debt 20 9 9 9 9Creditors 92 195 208 224 241Other current liabs 18 29 29 29 29Long-term debt/CBs 32 117 139 162 162Provisions/other LT liabs 87 123 93 97 126Minorities/other equity 0 0 0 0 0Shareholder funds 349 423 481 546 618Total liabs & equity 599 895 959 1,067 1,185
Ratio analysis Revenue growth (% YoY) 36.7 38.1 22.8 9.7 7.6Ebitda growth (% YoY) 26.5 39.3 21.4 11.7 8.7Ebitda margin (%) 24.5 24.7 24.4 24.9 25.2Net profit margin (%) 14.3 15.8 15.4 15.7 16.0Dividend payout (%) 27.4 25.2 25.6 25.4 25.4Effective tax rate (%) 30.8 26.5 25.0 25.0 25.0Ebitda/net int exp (x) 11.6 15.4 11.0 10.8 12.1Net debt/equity (%) 9.2 23.9 27.4 20.8 9.1ROE (%) 14.4 16.8 17.2 16.9 16.4ROIC (%) 10.6 12.5 12.7 13.2 13.5EVA®/IC (%) 1.4 3.2 3.4 3.9 4.2Source: CLSA
Taking share Slater & Gordon - BUY
16 December 2014 [email protected] 22
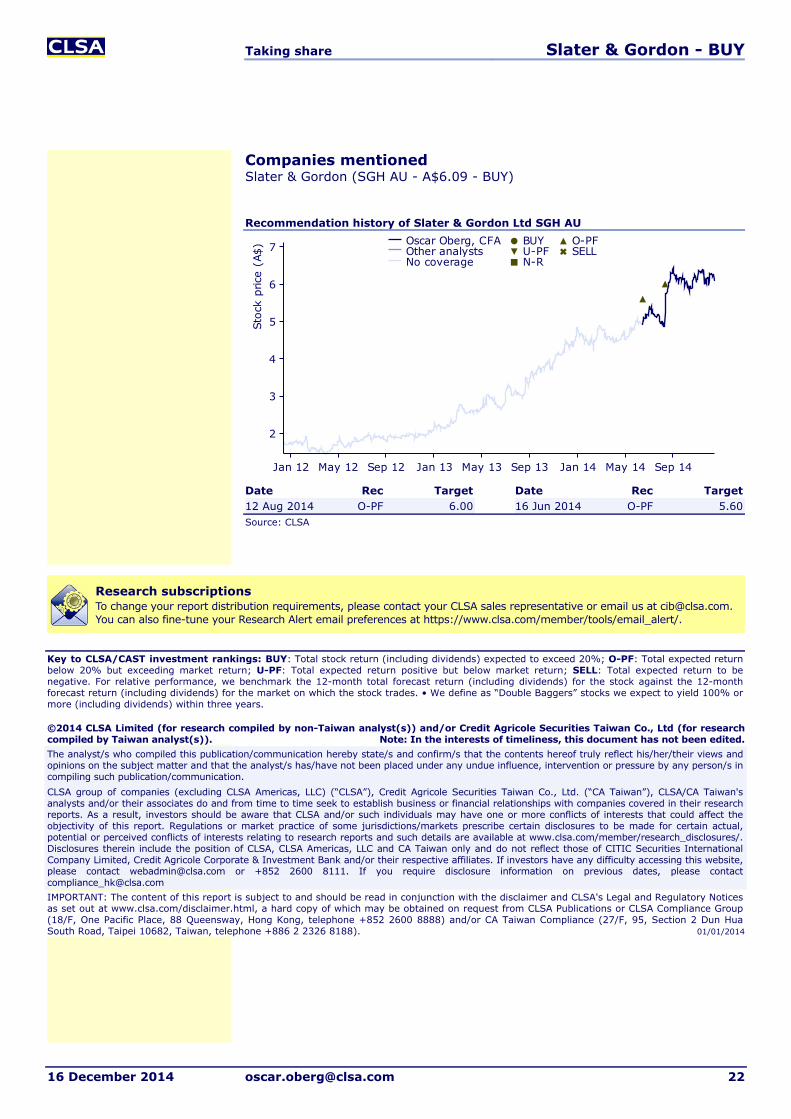
Companies mentioned Slater & Gordon (SGH AU - A$6.09 - BUY)
Recommendation history of Slater & Gordon Ltd SGH AU
Date Rec Target Date Rec Target12 Aug 2014 O-PF 6.00 16 Jun 2014 O-PF 5.60Source: CLSA
Research subscriptions To change your report distribution requirements, please contact your CLSA sales representative or email us at [email protected]. You can also fine-tune your Research Alert email preferences at https://www.clsa.com/member/tools/email_alert/.
Key to CLSA/CAST investment rankings: BUY: Total stock return (including dividends) expected to exceed 20%; O-PF: Total expected return below 20% but exceeding market return; U-PF: Total expected return positive but below market return; SELL: Total expected return to be negative. For relative performance, we benchmark the 12-month total forecast return (including dividends) for the stock against the 12-month forecast return (including dividends) for the market on which the stock trades. • We define as “Double Baggers” stocks we expect to yield 100% or more (including dividends) within three years. ©2014 CLSA Limited (for research compiled by non-Taiwan analyst(s)) and/or Credit Agricole Securities Taiwan Co., Ltd (for research compiled by Taiwan analyst(s)). Note: In the interests of timeliness, this document has not been edited. The analyst/s who compiled this publication/communication hereby state/s and confirm/s that the contents hereof truly reflect his/her/their views and opinions on the subject matter and that the analyst/s has/have not been placed under any undue influence, intervention or pressure by any person/s in compiling such publication/communication. CLSA group of companies (excluding CLSA Americas, LLC) (“CLSA”), Credit Agricole Securities Taiwan Co., Ltd. (“CA Taiwan”), CLSA/CA Taiwan's analysts and/or their associates do and from time to time seek to establish business or financial relationships with companies covered in their research reports. As a result, investors should be aware that CLSA and/or such individuals may have one or more conflicts of interests that could affect the objectivity of this report. Regulations or market practice of some jurisdictions/markets prescribe certain disclosures to be made for certain actual, potential or perceived conflicts of interests relating to research reports and such details are available at www.clsa.com/member/research_disclosures/. Disclosures therein include the position of CLSA, CLSA Americas, LLC and CA Taiwan only and do not reflect those of CITIC Securities International Company Limited, Credit Agricole Corporate & Investment Bank and/or their respective affiliates. If investors have any difficulty accessing this website, please contact [email protected] or +852 2600 8111. If you require disclosure information on previous dates, please contact [email protected] IMPORTANT: The content of this report is subject to and should be read in conjunction with the disclaimer and CLSA's Legal and Regulatory Notices as set out at www.clsa.com/disclaimer.html, a hard copy of which may be obtained on request from CLSA Publications or CLSA Compliance Group (18/F, One Pacific Place, 88 Queensway, Hong Kong, telephone +852 2600 8888) and/or CA Taiwan Compliance (27/F, 95, Section 2 Dun Hua South Road, Taipei 10682, Taiwan, telephone +886 2 2326 8188). 01/01/2014
2
3
4
5
6
7St
ock
pric
e (A
$)
Jan 12 May 12 Sep 12 Jan 13 May 13 Sep 13 Jan 14 May 14 Sep 14
Oscar Oberg, CFAOther analystsNo coverage
BUYU-PFN-R
O-PFSELL