
Skin cancer Detection by Temperature Variation Analysis575866/FULLTEXT01.pdf · i Skin cancer...
56
i Skin cancer Detection by Temperature Variation Analysis Ahmed M. Nasr Moustafa Master of Science Thesis in Medical Engineering Stockholm 2012
Transcript of Skin cancer Detection by Temperature Variation Analysis575866/FULLTEXT01.pdf · i Skin cancer...

i
Skin cancer Detection by Temperature Variation
Analysis
Ahmed M . Nas r Mou s t a f a
Master of Science Thesis in Medical Engineering Stockholm 2012

ii

iii
This master thesis project was performed in collaboration with Karolinska Institutet (KI)
Supervisor at [KI]: Moustapha Hassan
Skin cancer Detection by Temperature Variation Analysis
Hudcancer Detektering av temperaturvariation Analys
A h m e d M . N a s r M o u s t a f a
Master of Science Thesis in Medical Engineering Advanced level (second cycle), 30 credits
Supervisor at KTH: Hamed Hamid Muhammed Examiner: Kaj Lindecrantz
School of Technology and Health TRITA-STH. EX 2012:98
Royal Institute of Technology KTH STH
SE-141 86 Flemingsberg, Sweden http://www.kth.se/sth

iv
v
Abstract
In the medical field new technologies are incorporated for the sole purpose to enhance the quality of life for patients and even for the normal persons. Infrared technology is one of the technologies that has some applications in both the medical and biological fields. In this work, the thermal infrared (IR) measurement is used to investigate its potential in skin cancer detection. IR enjoys a non-invasive and non-contact advantages as well as favorable cost, apparently. It is also very well developed regarding the technological and methodological aspects. IR radiation, per se, is an electromagnetic radiation that all objects emit when their temperature is above the absolute zero. Human body is not different. The IR range extends, ideally, to cover wavelengths from 800 nanometer to few hundreds micrometer. Cancer, in modern life, has grown tangibly due to many factors apparently such life expectancies increase, personal habits, and ultraviolet radiation (UV) exposures among others. Moreover, the significant enhancement of technologies has helped identifying more types of cancers than before. The purpose of this work is to investigate further another method and application of IR technology not yet matured in detection of skin cancer to enhance detection ability that is accompanied with higher level of safety.
An extensive research project was designed to use two laboratory animals injected with cancer cells subcutaneously and two IR radiation sensors able to detect wavelengths in the range 8 – 14 μm which proved to be a favorable range to measure the temperature of the skin. Data collection performed using two lab animals as subjects that formed a double blind investigation process. An analysis of the observations was conducted both in qualitative as well as quantitative approaches. The analysis and discussion revealed the potential of the thermal IR radiation in detecting skin cancer existence. The thesis was supported with significant evidence and achieved its target. Furthermore, it was clear that the functional nature of thermal IR detection constitutes another advantage for this method that can be used in the future to develop an objective and automated method for detection of skin cancer in a straight forward and cost effective manner.

vi
Contents
1. Basics of Skin Cancer 1
1.1 Introduction 1
1.2 The Skin 2
1.2.1 The Epidermis 2
1.2.2 The Dermis 3
1.2.3 The Subcutaneous Layer 4
1.3 Skin Cancer 4
1.3.1 How to Detect Melanoma 7
1.3.2 Skin cancer treatment 13
1.3.3 Risk Factors for Skin Cancer 14
2. Review of Infrared Radiation 16
2.1 Introduction 16
2.1.1 Historical Snapshot 17
2.2 Fundamental Physics Concepts 18
2.2.1 IR sensors 18
2.2.2 IR Radiometry 21
2.2.3 Black body & Gray body 22
2.2.4 Emissivity 24

vii
3. Methods and Experimental setup 26
3.1 Introduction 26
3.2 Motivation 26
3.3 Materials 29
3.3.1 IR Sensor 29
3.3.2 Lab animal 30
3.3.3 Cancer cells 30
3.3.4 The experiment 30
4. Results and analysis 33
4.1 Introduction 33
4.2 Qualitative analysis 34
4.3 Quantitative Analysis 37
4.3.1 Student t-test 37
4.3.2 One-way ANOVA 41
5. Discussion and Conclusion 45
5.1 Introduction 45
5.2 Discussion
5.3 Conclusion 47
5.4 Future work 47
References 48
1
Chapter 1 Basics of Skin Cancer 1.1 Introduction Probably the best definition of cancer is likely to contain an indication to an abnormal growth of cells due to changes in gene expression causing loss of control exerted normally on human cells. This leads to profound effect on cell characteristics such as proliferation rate, size, shape, ..etc. It is even possible that the cancerous cells invade other tissues in the neighborhood of their origin or at large distance from them [4]. It is also historically evident that cancer did not originate in modern world. Examination of remains from ancient Egypt mummies showed evidence of bone cancer as well as breast cancer. This proves that cancer existed thousands of years ago in human beings life [1]. As a result the search for detection, diagnosis, and treatment, has never stopped. Maybe cancer in modern life has grown tangibly due to many factors such as life expectancies increase, person habits, and ultraviolet (UV) exposure among others. Moreover, the significant enhancement of technologies has helped identifying more types of cancers than before [7]. As a consequence cancer has become one of the biggest concerns in today's healthcare society [1]. The word cancer originated seemingly in ancient Greece few hundreds years BC. It was physician Hippocrates who used the word "karkinoma" to describe the spread of cancer into other tissues like crabs which is an animal known to exist on coasts in many countries. Karkinoma became "carcinoma" which is now used to describe cancers especially in the epithelium i.e. outer lining of tissues and organs [1]. Some types of cancer can actually kill a human being. Other types can affect vital organs or cause unbearable pain, for example. Nevertheless, the worst types can spread and invade other tissues and create bigger problems to patients. In addition, there exist some cancer types which are not lethal at all and might not produce any symptoms or side effects at least for a significant period of time. This has lead to classification of cancer into two main categories malignant and benign. The difference between both categories is due to their ability to spread or metastasize to remote tissues and organs. Malignant cancer can effectively invade and destroy their neighboring tissues contrary to benign type. Usually, malignant cancer spreads to remote tissues and organs through blood stream or lymphatic system. On the other hand, benign cancer is more localized but it can affect their environment noticeable through pressure on neighboring nerves or blood vessels for example. It can also secrete chemical compounds which may affect neighboring tissues normal function. In most cases however, benign cancer has less growth rate and is less life threatening than malignant type. Therefore, malignant cancer is more aggressive and hence more difficult to treat.

2
The main cause of cancer is not known for certain in most cases. Often cancer is associated with heredity or environmental factors and lifestyle. For example excessive exposure to sun light with naked skin can increase chances of skin cancer due to effect of UV radiation that can easily interact with DNA and cause significant transformations and changes. It is also not unusual for smoking to lead to lung cancer. Moreover, certain geographic areas have been indicated to record higher rates of cancer cases such as nuclear accidents site Chernobel and Heroshima for example. Higher percentages of carcinogenic elements such as arsenic within food and water has also been associated with higher risk of cancer in Bangladesh for example [2]. 1.2 The Skin The skin is a vital organ for the human body. Man cannot live comfortably without skin covering the whole body. It is also the largest organ of the body, which can make out one-third of a normal person’s total body weight [1]. The skin is responsible for many biological functions as well as its inherent protection function. Below is a short list for the most prominent functions of skin:
1. It acts as a strong barrier protection against external surroundings and environment. This includes rain, wind, sun radiation, ..etc.
2. It serves immunological protection against microorganisms such as viruses, and bacteria. This significantly reduces infections and malicious diseases. When the skin is ruptured it is evident that it can lead to exposure to all of those harmful factors.
3. It performs thermoregulation function of entire human' organs cannot be performed without skin. It is a temperature insulating and control effectively heat loss by the body.
4. It performed metabolism of vital nutrients for the body such as vitamin D3 (cholecalciferol) [1].
5. It also has sensory function. It contains sensory nerves endings that can detect texture, motion, position, ..etc when in contact with outer environment.
The skin is mainly divided into three layers: the epidermis, dermis, and hypodermis. The outermost layer is the epidermis. The innermost layer is the subcutaneous layer also called hypodermis. The dermis is the middle layer that is sandwiched between both the epidermis and hypodermis. All three layers take role in the functions performed by the skin according to their respective order and construction. 1.2.1 The Epidermis The epidermis is 0.1 mm (approximately) thick and contains no blood vessels [1]. It is subdivided into four parts that lie one beneath the other: the stratum basale (basal layer), the stratum spinosum (spinous or prickle-cell layer), the stratum granulosum (granular layer), and the uppermost stratum corneum (surface layer). This last layer is

3
Stratum corneum
Stratum lucidium
Sweat pore
Hair shaft
Nerve ending
Stratum spinosum Arrector Muscle
Stratum granulosum
Stratum basale Epidermis
Meissner'scorpuscule
Sebaceous gland Dermis
Sweat gland
Hair follicle
Papilla of hair Subcutis
Vein & Artery Pacinian corpuscle Figure 1.1 A cross section shows the different layers and structures of the skin [1]. the one that is in direct contact with the environment. Figure 1.1 [1] portrays a cross-section in skin and anatomy of the most important structures. Figure 1.2 [1] shows a magnified micrograph of typical skin epidermis layer. The epidermis, in darker shade, contains four types of cells: keratinocytes, melanocytes, Merkel cells, and Langerhans cells. Of special importance are melanocytes cells. They are located in the basal part of the epidermis. These cells produce the pigment melanin, which is the substance responsible for skin color. It also has a fundamental protection function against UV radiation from the outside environment especially from the sun. This reduces harmful effect of direct exposure to UV radiation which might lead to skin cancer. 1.2.2 The Dermis The dermis is the thickest sub-layer of the skin. Thickness, however vary noticeably according to the area that skin covers and might also differ from male and female as well as thickness depends on age. This sub-layer exists under the epidermis directly. It supplies the epidermis and itself with nutrients and oxygen carried by the blood. The dermis many useful structures such as blood vessels, sensory nerve endings, hair follicles, and sweat glands. This sub layer also give the skin it strength and elasticity. It contains two distinct regions: the papillary dermis and the reticular dermis.
4
Figure 1.2 Photomicrograph of normal human skin, magnified 312.5 times[1]. 1.2.3 The Subcutaneous Layer This sub-layer lies under the dermis in the skin. It contains fat-filled adipose cells. This layer exerts control on heat conservation for the human body and preserves fat which is one of the primary sources of energy to muscles.
1.3 Skin Cancer Millions of skin cancer cases are recorded every year around the world [2]. One might expect that since the skin is the largest organ that this is only reasonable! It is probably the most common cancer that can be developed in a human being. On the other hand, not all skin cancers are created equal. Skin cancer is a type of epithelial tissue cancer. It can be both benign and malignant. Since skin has access to both nearby lymphatic system as well as blood system, malignant types can produce metastasis to the whole body and become extremely lethal. Actually, it is these metastases that can cause most deaths from skin cancer. Melanoma is the most aggressive type of skin cancer and is considered to be highly malignant and can be extremely fatal. Naturally, cancerous cells suffer also from uncontrolled growth rate and frequently exceed that of normal tissue [4]. Moreover, the cancerous cells themselves develop non-regular shape that distinguishes them from normal skin cells. The cancer cells use chemical substances known as growth

5
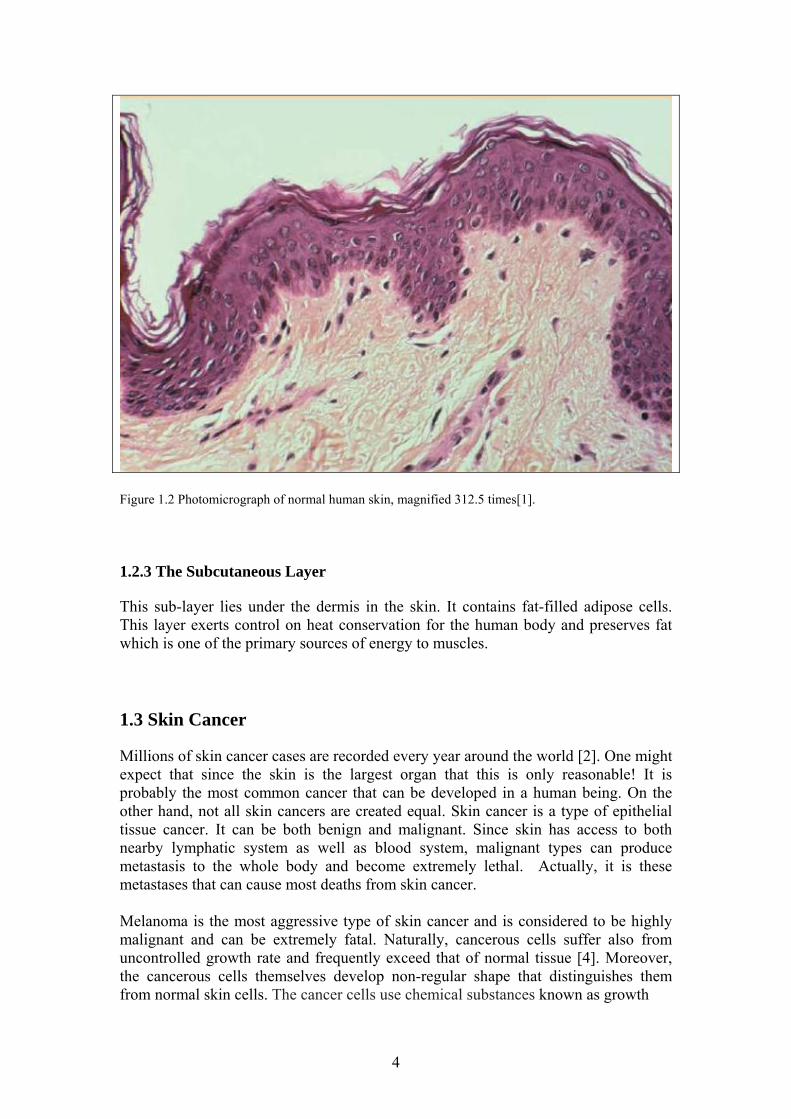
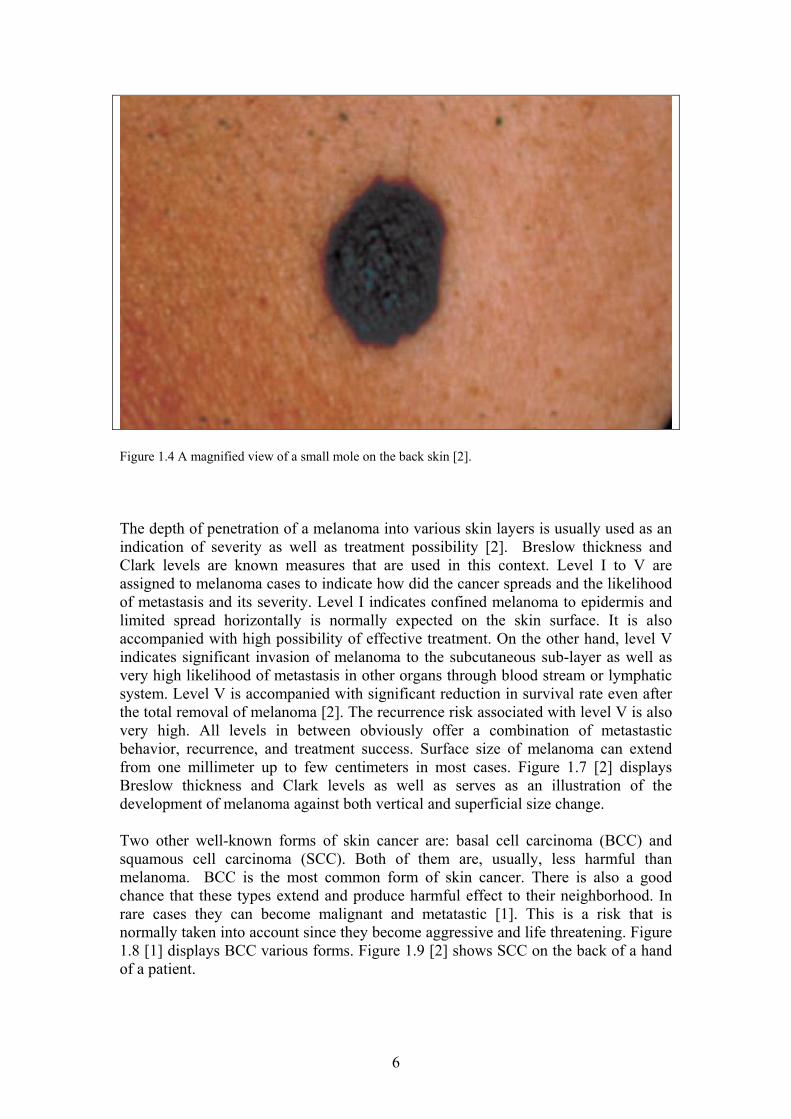
Figure 1.3 shows illustration of uncontrolled growth, metastasis as well as angiogenesis for skin cancer [1]. factors to promote the formation blood vessels to supply the cells themselves with enough nutrition and oxygen. This process is termed angiogenesis [3]. Figure 1.3 [1] shows a simplified drawing for the mentioned characteristics for skin cancer. The original spot that the cancer was created is usually called primary and any metastasis to other parts of the body is referred to as secondary. Melanoma has also been associated with skin moles. These are gathering of melanocytes in the skin epidermis. These are benign in most cases. Due to exposure to UV radiation they can develop genetic mutation and from a melanoma focus. They start slowly to spread horizontally in the epidermis and continue to extend upwards often referred to as in-situ [1]. After sufficient time they can spread vertically to lower layers of the skin and possibly metastasizes. Figure 1.4 [2] shows a magnified view of a mole. Figure 1.5 [1] displays few shapes of normal moles 1a to 1e. Note that there are few differences among them that can be visually seen. However they are benign. Figure 1.6 [1], on the other hand, shows melanoma moles. Note that similarity to normal moles in spite of some irregularities in border and uneven pigmentation.
6
Figure 1.4 A magnified view of a small mole on the back skin [2]. The depth of penetration of a melanoma into various skin layers is usually used as an indication of severity as well as treatment possibility [2]. Breslow thickness and Clark levels are known measures that are used in this context. Level I to V are assigned to melanoma cases to indicate how did the cancer spreads and the likelihood of metastasis and its severity. Level I indicates confined melanoma to epidermis and limited spread horizontally is normally expected on the skin surface. It is also accompanied with high possibility of effective treatment. On the other hand, level V indicates significant invasion of melanoma to the subcutaneous sub-layer as well as very high likelihood of metastasis in other organs through blood stream or lymphatic system. Level V is accompanied with significant reduction in survival rate even after the total removal of melanoma [2]. The recurrence risk associated with level V is also very high. All levels in between obviously offer a combination of metastastic behavior, recurrence, and treatment success. Surface size of melanoma can extend from one millimeter up to few centimeters in most cases. Figure 1.7 [2] displays Breslow thickness and Clark levels as well as serves as an illustration of the development of melanoma against both vertical and superficial size change. Two other well-known forms of skin cancer are: basal cell carcinoma (BCC) and squamous cell carcinoma (SCC). Both of them are, usually, less harmful than melanoma. BCC is the most common form of skin cancer. There is also a good chance that these types extend and produce harmful effect to their neighborhood. In rare cases they can become malignant and metatastic [1]. This is a risk that is normally taken into account since they become aggressive and life threatening. Figure 1.8 [1] displays BCC various forms. Figure 1.9 [2] shows SCC on the back of a hand of a patient.

7
Figure 1.5 illustration of normal moles in various shapes [1] It is also known that skin cancer might not be inevitable and it can be preventable in many cases. Once the suitable technology is available, it is supposed be detected much easier than many other cancers since location is superficial and full accessibility is not a big problem. Since skin cancer is likely to be caused by excessive exposure to ultraviolet rays from the sun. This fact presumably facilitates simple and easy prevention by using long nontransparent clothes and avoiding direct sun exposure as much as possible, for example. However, cases of skin cancer have sharply increased in recent years [1]. 1.3.1 How to Detect Melanoma May be the most common method of melanoma is the visual and manual method. Therefore normally an oncologist will look for superficial skin characteristics that resemble know melanoma or non-melanoma forms. These characteristics are referred to as ABCD method [1]:
8
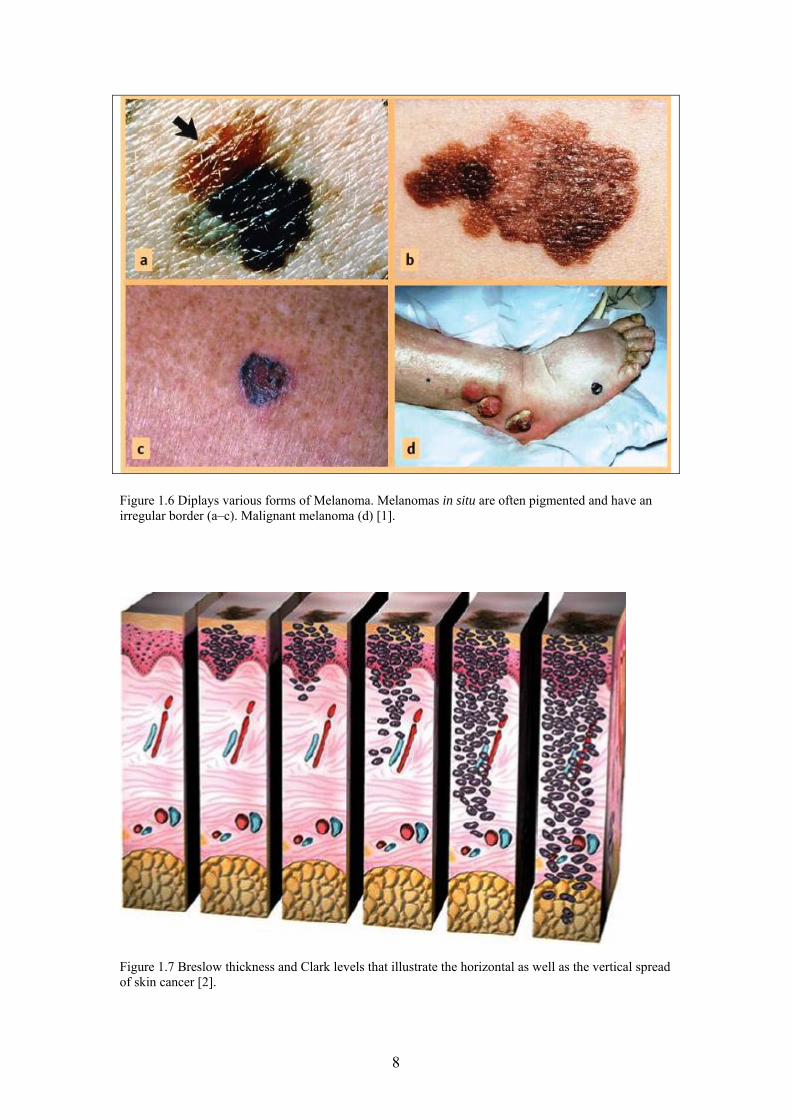
Figure 1.6 Diplays various forms of Melanoma. Melanomas in situ are often pigmented and have an irregular border (a–c). Malignant melanoma (d) [1].
Figure 1.7 Breslow thickness and Clark levels that illustrate the horizontal as well as the vertical spread of skin cancer [2].
9
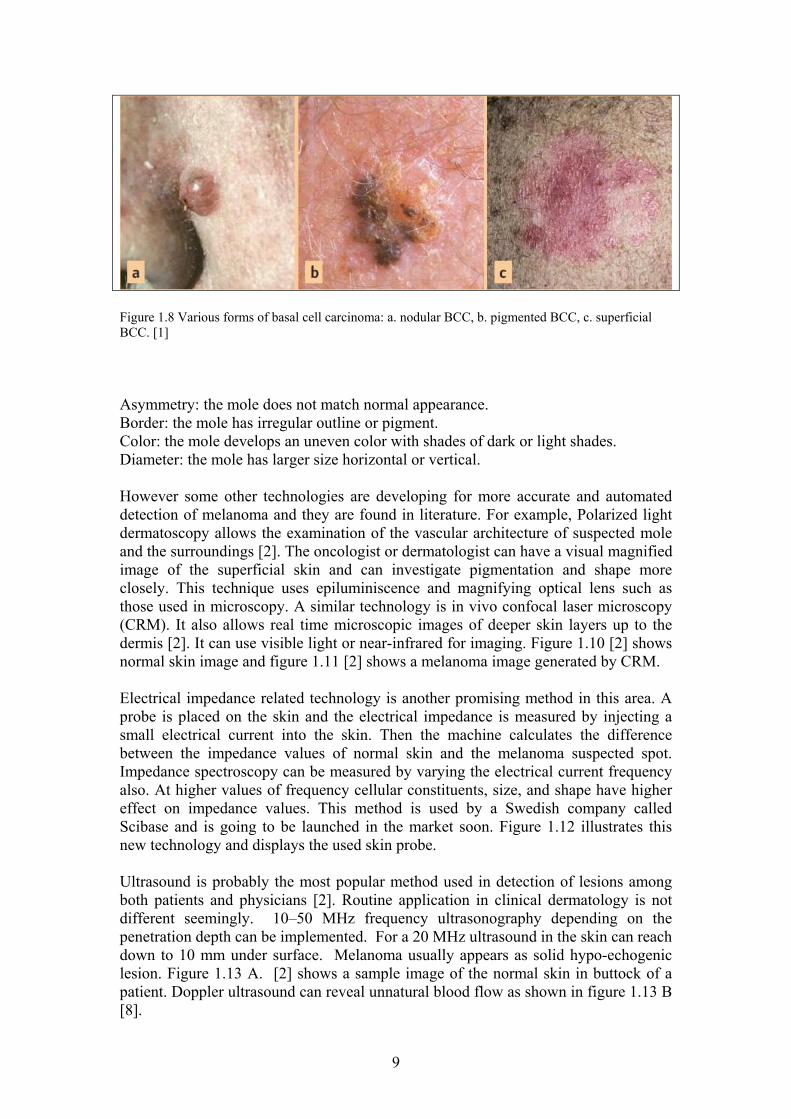
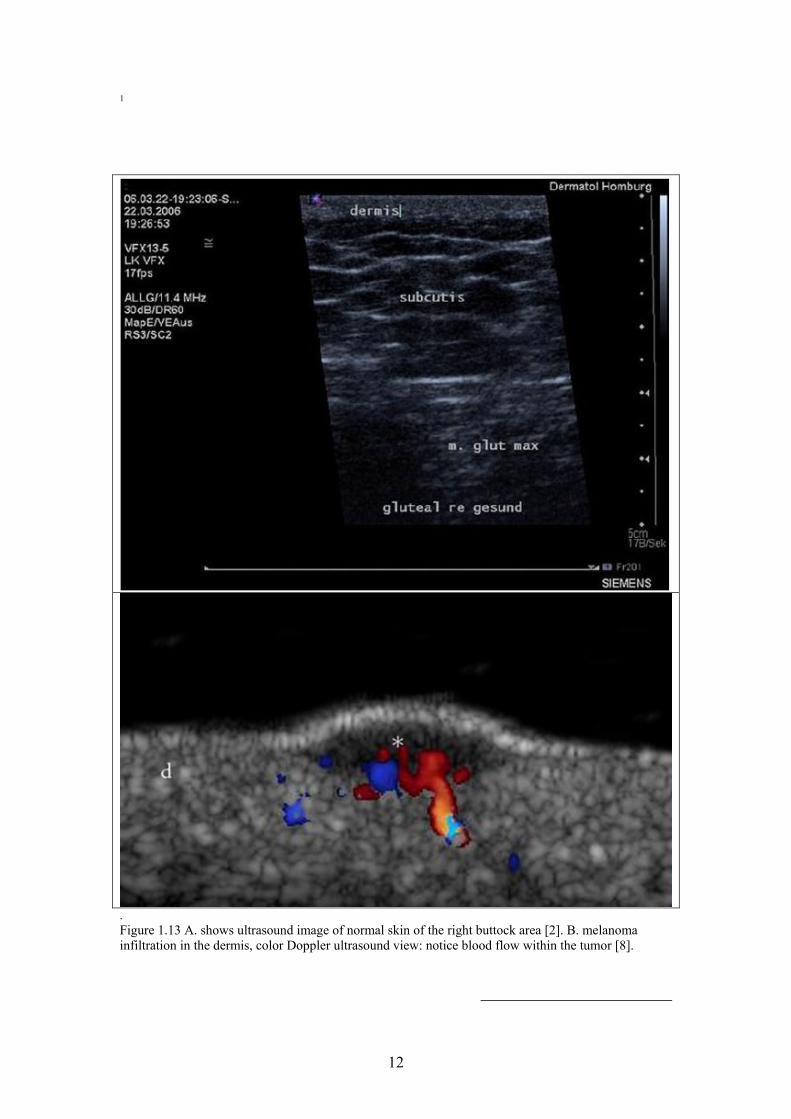
Figure 1.8 Various forms of basal cell carcinoma: a. nodular BCC, b. pigmented BCC, c. superficial BCC. [1] Asymmetry: the mole does not match normal appearance. Border: the mole has irregular outline or pigment. Color: the mole develops an uneven color with shades of dark or light shades. Diameter: the mole has larger size horizontal or vertical. However some other technologies are developing for more accurate and automated detection of melanoma and they are found in literature. For example, Polarized light dermatoscopy allows the examination of the vascular architecture of suspected mole and the surroundings [2]. The oncologist or dermatologist can have a visual magnified image of the superficial skin and can investigate pigmentation and shape more closely. This technique uses epiluminiscence and magnifying optical lens such as those used in microscopy. A similar technology is in vivo confocal laser microscopy (CRM). It also allows real time microscopic images of deeper skin layers up to the dermis [2]. It can use visible light or near-infrared for imaging. Figure 1.10 [2] shows normal skin image and figure 1.11 [2] shows a melanoma image generated by CRM. Electrical impedance related technology is another promising method in this area. A probe is placed on the skin and the electrical impedance is measured by injecting a small electrical current into the skin. Then the machine calculates the difference between the impedance values of normal skin and the melanoma suspected spot. Impedance spectroscopy can be measured by varying the electrical current frequency also. At higher values of frequency cellular constituents, size, and shape have higher effect on impedance values. This method is used by a Swedish company called Scibase and is going to be launched in the market soon. Figure 1.12 illustrates this new technology and displays the used skin probe. Ultrasound is probably the most popular method used in detection of lesions among both patients and physicians [2]. Routine application in clinical dermatology is not different seemingly. 10–50 MHz frequency ultrasonography depending on the penetration depth can be implemented. For a 20 MHz ultrasound in the skin can reach down to 10 mm under surface. Melanoma usually appears as solid hypo-echogenic lesion. Figure 1.13 A. [2] shows a sample image of the normal skin in buttock of a patient. Doppler ultrasound can reveal unnatural blood flow as shown in figure 1.13 B [8].

10
Figure 1.9 shows an SCC on the left hand of a patient [2].
Figure 1.10 displays an In vivo RCM of normal skin. In confocal images, granular cells A. are regularly seen at depths of 10 to 15 μm. The dark oval areas correspond to nuclei within the bright cytoplasm. Spinous keratinocytes B. are seen at 20 to 100 μm below the stratum corneum [2].
11
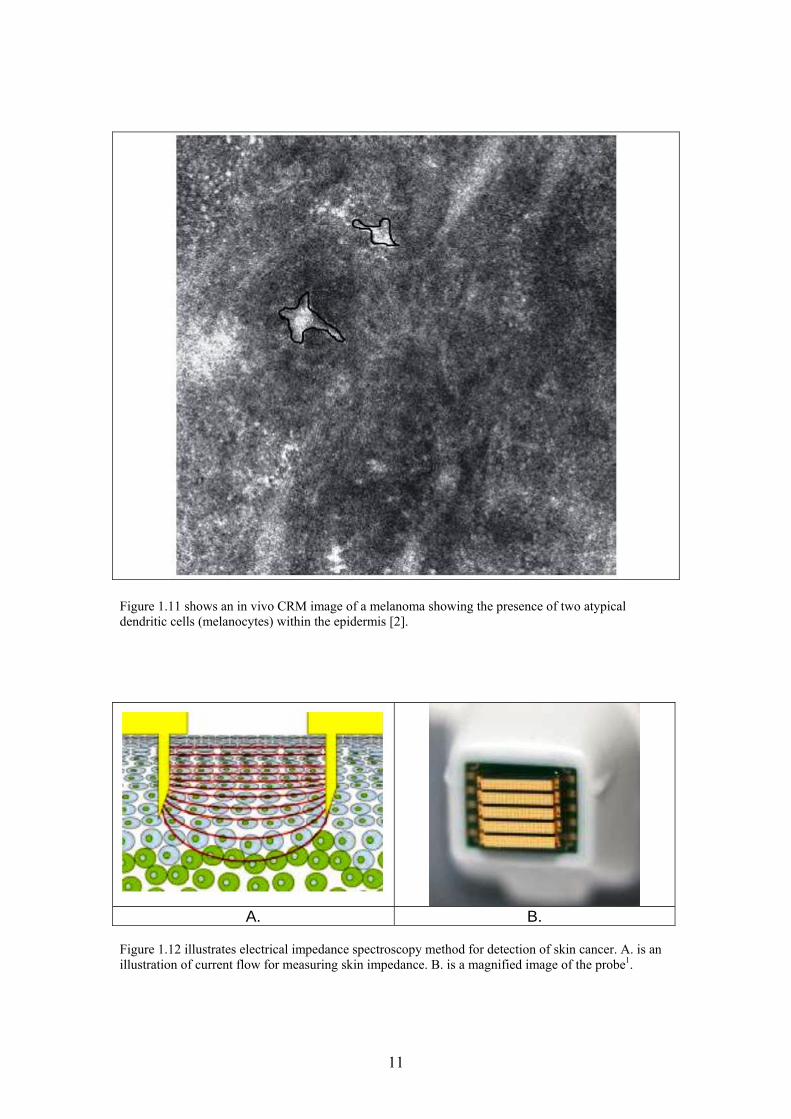
Figure 1.11 shows an in vivo CRM image of a melanoma showing the presence of two atypical dendritic cells (melanocytes) within the epidermis [2].
A. B.
Figure 1.12 illustrates electrical impedance spectroscopy method for detection of skin cancer. A. is an illustration of current flow for measuring skin impedance. B. is a magnified image of the probe1.
12
1
. Figure 1.13 A. shows ultrasound image of normal skin of the right buttock area [2]. B. melanoma infiltration in the dermis, color Doppler ultrasound view: notice blood flow within the tumor [8].

13
Figure 1.14 shows how radiocolloid is injected to four quadrants of the lesion in the intradermal plane [2]. Figure 1.14 [2] shows radiocolloid method of detection of cancer and displays the uptake in the scalp where the primary skin melanoma is and two lymph nodes, one in the right parotid gland and the other in the upper neck.
1.3.2 Skin cancer treatment It is recommended to perform an excisional biopsy and remove the suspected region. This might not be easy in areas near the face or the eyes for example. However this is the most straight forward technique to remove the full node [2]. It might be preferred to remove first and check later in certain cases. Figures 1.15 and 1.16 [2] show two cases of full surgical removal of the affected spots. Early detection and diagnosis always serve to reduce both risk and ramifications. Another method of treatment is cryosurgery [2]. It involves depressing the temperature of the targeted tissue below its
cold resistance threshold (~ -50 ◦C). This is done locally on the cancer spot and serves
to destroy all the cancerous cells in the area. A third preferred method is photodynamic therapy (PDT). It involves the administration of a photosensitizing agent, administered either topically or systemically. Then a laser light source is used to activate the agents and destroy target suspected cells in the skin [2]. Finally Chemotherapy and radiation therapy are also common methods of treatment that are used according to the case of skin cancer and shows effective treatment.

14
Figure 1.15 illustrates dissection and removal of an upper neck lymph node that was affected by metatasis [2].
Figure 1.16 shows excision is performed manually with a scalpel and the full area removed from the skin surface as deep as the full cancer volume has extended both vertically and horizontally [2]. 1.3.3 Risk Factors for Skin Cancer This section outlines major factors that have been associated with patients having higher likelihood of developing skin cancer [1]:
a. Ultraviolet rays’ exposure usually from the sun rays. It is largely thought to be main cause of skin cancer especially with the constant increase in skin cancer cases. It has been suggested that UVB causes BCC and SCC, while UVA is thought to cause melanoma. This is done mostly by harmful alteration in the DNA. X-rays can also increase a person’s susceptibility to skin cancer as well as other types of ionizing radiation.
b. Ethnicity most risk for skin cancer has been recorded in Caucasians European descent persons. The color of a person’s skin is therefore associated with likelihood of developing skin cancer and must be warned against.
c. Genetics inherited mutation in a gene that is especially if controlling cell division or cell death increases susceptible to developing cancer.
15
d. Geographical Location higher risk close to the equator for example of developing skin cancer is largely due to the higher UV radiation levels.
e. Personal Habits such as exposure to sunlight for long periods of time and smoking for example forms higher risk of developing skin cancer.
f. Age as young people have more sensitive skin than adults. This combined with other factors such as habits or location.
g. Immunosuppressive drugs used to prevent organ rejection in organ transplantation transplant recipients, are at a higher risk of developing skin cancer.
h. Virus infections, such as HPV is mentioned to increase risk for developing skin cancer.

16
Chapter 2 Review of Infrared Radiation 2.1 Introduction
Infrared (IR) radiation is a part of the electromagnetic spectrum that lies directly after the visible range. IR wave length range extends, generally, from around 800 µm up to 1 mm as shown in figure 2.1 [8, 9]. It can enjoy naturally both the characteristics of electromagnetic wave nature as well as being formed out of photons. One more aspect that is almost always accompanying infrared is its association with thermal activity. Actually, all objects emit electromagnetic radiation once their temperature is above the absolute zero temperature viz. 0 K (equivalent to -273 °C). Furthermore, the radiated electromagnetic objects cover a broad spectrum of wavelengths. The spectrum varies also in magnitude of radiated at each wavelength. Therefore it can be true that many objects emit visible electromagnetic radiation (λ = 380 - 780 nm) but it is extremely weak and human eye cannot detect it!
Figure 2.1 displays infrared spectrum location relevant to the electromagnetic wave spectrum. The IR radiation also enjoys the possibility of non-contact and non-invasive measurement techniques that allow remote sensing and monitoring. Although the atmosphere can absorb and attenuate severely IR radiation at certain wavelengths, it still offers trivial attenuation to other IR radiation wavelengths. Figure 2.2 [8] shows a sample of the attenuation suffered by IR spectrum in the range of λ = 1 – 15 µm which is a favorable range in many applications. It is worth mentioning that the sole reason for this attenuation of IR radiation in atmosphere is water vapor (H2O) and carbon dioxide (CO2). Nevertheless, not all IR radiation wavelengths are classified equally. There exists a classification used to specify certain ranges of IR wavelengths.

17
Figure 2.2 illustration of a typical transmission (τ) curves in atmosphere in summer of Central Europe. Note that 10 m and 100 m propagation path curves are included [8]. Near infrared (NIR) extends from 0.78 to 3 µm, mid infrared (MIR) from 3 to 6 µm, far infrared (FIR) from 6 to 40 µm, and ultra-far infrared (UFIR) from 40 to 1000 µm [8, 10]. Hence an object can emit a spectrum that includes all these classes rather than a monochromatic radiation. 2.1.1 Historical Snapshot [9] In 1800 the extensive work of Sir Frederick William Herschel (1738 – 1822) has put IR radiation ability to produce thermal effect into the spot of light it deserves. Since that time infrared radiation received more attention in the physics and technology world. To shed some light on a few of Nobel Prize work done: may be one cannot miss the work of Wilhelm Wien (1864 – 1928) which led to Nobel Prize in physics in 1911. Recently it was John C. Mather and George F. Smoot who was awarded Nobel Prize in physics jointly in 2006 for their work on blackbody radiation in astrophysics that might help to understand the big bang. In this context Nobel Prize winner in 1918 Max Planck (1858 – 1947) whose work led to the description of black body radiation cannot go unnoticed also.
18
2.2 Fundamental Physics Concepts
2.2.1 IR sensors
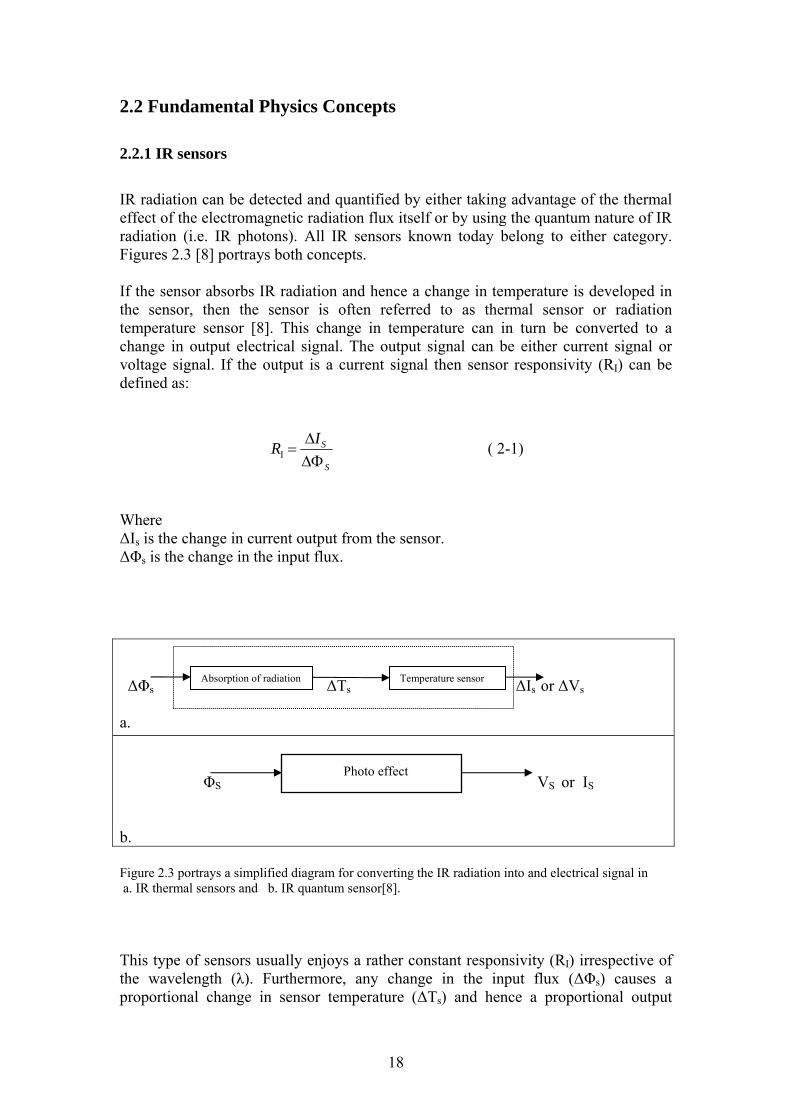
IR radiation can be detected and quantified by either taking advantage of the thermal effect of the electromagnetic radiation flux itself or by using the quantum nature of IR radiation (i.e. IR photons). All IR sensors known today belong to either category. Figures 2.3 [8] portrays both concepts. If the sensor absorbs IR radiation and hence a change in temperature is developed in the sensor, then the sensor is often referred to as thermal sensor or radiation temperature sensor [8]. This change in temperature can in turn be converted to a change in output electrical signal. The output signal can be either current signal or voltage signal. If the output is a current signal then sensor responsivity (RI) can be defined as:
S
SIR
I ( 2-1)
Where ΔIs is the change in current output from the sensor. ΔΦs is the change in the input flux. ΔΦs ΔTs ΔIs or ΔVs a.
ΦS VS or IS b. Figure 2.3 portrays a simplified diagram for converting the IR radiation into and electrical signal in a. IR thermal sensors and b. IR quantum sensor[8]. This type of sensors usually enjoys a rather constant responsivity (RI) irrespective of the wavelength (λ). Furthermore, any change in the input flux (ΔΦs) causes a proportional change in sensor temperature (ΔTs) and hence a proportional output
Absorption of radiation sensorTemperature
Photo effect
19
change in the currents (ΔIs). This leads to simple detection and linear characteristics. On the other hand, the signal to noise ratio (SNR) of the sensor is expressed as a parameter called specific detectivity (D*) [8, 11]. It is also proportional to the sensor responsivity as follows:
n
SI i
ARD * (2-2)
Where As is the sensor surface area. in is the effective noise current. It is also worth mentioning that the frequency range extends up to several hundred Hz [8]. The most common types of thermal IR sensors are [8-12, 14]:
a. Thermocouple This is one of the classic and popular concepts in converting thermal radiation into electrical voltage. This is called the Seebeck effect. It is based on electrical potential that is generated when two different materials (metals or semiconductors) to form a junction at one end. When the junction suffers from thermal radiation, a voltage difference is generated at the open ends. It is robust, simple, inexpensive, and compact. Moreover, the dynamic range can be extremely large and extends to high temperatures. It also enjoy a rather fast response time also.
b. Thermopile This type is composed of several thermocouples connected together. The connection is in series to increase the output electric potential. All junctions of the thermocouples are oriented such that they are not far away from the measurement spot to reduce differences of thermal radiation received by each. The total output hence is a true indication of the amount of the IR thermal flux that falls on the thermopile. The modern technology has helped to fabricate extremely compact thermopiles from technologies such as CMOS. However the main concept is still the same i.e. based on Seebeck thermo-emf principle. Nevertheless, it offers a better responsivity. Accordingly resposivity increases as the number of thermocouples used increases.
c. Pyroelectrics This type uses spontaneous polarization that some materials exhibit due to their crystalline structure under the influence of thermal stress. The thermal stress affects the electric dipole moment generated in the sensor and renders it useful for measuring of the IR flux. Pyroelectric materials are, however, considered a subclass of piezoelectric dielectrics. Pyorelectic sensors can equally well operate in both current mode and voltage mode. They can easily be integrated with their corresponding signal amplifiers and readout electronic circuit into a single chip. Matrix of sensors can also be fabricated for IR

20
imaging. Moreover, the main detection process depends on the change of flux over time (i.e. time derivative).
d. Bolometer A change in the internal resistance of a bolometer is caused by a change in IR radiation flux that falls on it. This is due to the temperature coefficient of the bolometer resistance which determines how the resistance would change as result in the received IR radiation flux. Hence a change in the voltage drop across the bolometer can be converted to a signal representing the IR radiation flux. A bolometer is usually made of a metal or a semiconductor material. In metals an increase in temperature due to absorption of IR radiation flux causes an increase in the resistance. This leads to the fact that a metallic bolometer has a positive temperature coefficient. On the other hand, a semiconductor bolometer, usually, is based on a negative temperature coefficient. Therefore, an increase in temperature due to an incoming IR radiation flux causes a decrease in resistance. Bolometer IR radiation detector type enjoys stability and ease of integration. Bolometers, nonetheless, require electrical power continuously provided externally to them to perform their function. Microbolometer exists as an array for IR imaging purposes used in some industrial applications.
The other category IR sensors are photon detectors also called quantum detectors. This type is, normally, characterized by wavelength dependent parameters. The responsivity can be defined as:
ch
eIR
S
SI (2-3)
Where η is the quantum efficiency of the sensor. e is the electron charge. h is Planck constant. c is the speed of light. This indicates a linear increase of responsivity with wavelength (λ). In reality, as wavelength (λ) increase the energy of the photon decreases leading to less signal detection. Therefore, the responsivity drops sharply after a certain peak and hence reaches almost zero at cutoff wavelength (λc) [8, 9]. The dependence on λ is shown in figure 2.4 [8]. This leads to a restriction on the wavelength range for a quantum IR sensor. Nonetheless, this type is appealing to IR radiation detection since it relies on the quantum flux that is received [9]. Therefore, the incident IR photons can be detected individually in a manner similar to photon counting. On the other hand, cooling to very low temperatures can significantly enhance signal to noise ratio (SNR) and hence the specific detectivity (D*) of this category of sensors. This category is mainly manufactured using semiconductor materials.

21
Figure 2.4 shows dependence of responsivity on the wavelength (λ) for quantum IR sensors both in ideal and real response [8]. 2.2.2 IR Radiometry An object that emits IR radiation to the surroundings can be characterized by the exitance (M) which is the flux (Φ) emitted by a unit area of the object surface (A):
dA
dM
(2-4)
This should include the entire spectrum and is measured as watt per square meter (W/m2). On the other hand, if an IR radiation falls onto a sensor the amount received per unit area is called irradiance (E) as follows:
dA
dE
(2-5)
Where dA is the normal surface area to the direction of IR radiation. Both exitance (M) and irradiance (E) are measures of the total contribution of all IR flux that includes all wavelengths in that radiation. This clearly emphasizes the wide spectrum of IR radiation that usually contains a narrow or broad spectrum of wavelengths depending on the temperature of the object that is being tested. It is also worth mentioning that not all the power spectrum is uniformly distributed. The power spectrum peaks at certain wavelength where most of the power is concentrated. This is illustrated in figure 2.5. This reflects also the dependence of all radiometric parameters on temperature (T) and hence wavelength (λ) of the object.

22
Figure 2.5 portrays a typical IR radiation spectrum from an object at an arbitrary temperature (T). 2.2.3 Black body & Gray body
The black body (BB) is the ideal case of an object that emits IR radiation. Nevertheless, black body enjoys other properties that make it a perfect emitter as well as absorber for IR radiation. Below is a short list of the most important properties of BB [9]:
1. It absorbs all IR radiation that hits its surface irrespective of the wavelength. 2. It emits the maximum energy flux at any given temperature than any other
object. This means that all objects emit less energy than a BB at any temperature at any arbitrary wavelength.
3. It emits omnidirectional regardless of its temperature. This makes BB as a standard when IR radiation is concerned. According to Max Planck equation the exitance at an arbitrary wavelength (λ) and temperature (T) is given by:
d
e
hcdTM
kT
hc
1
125
2
(2-6)
23
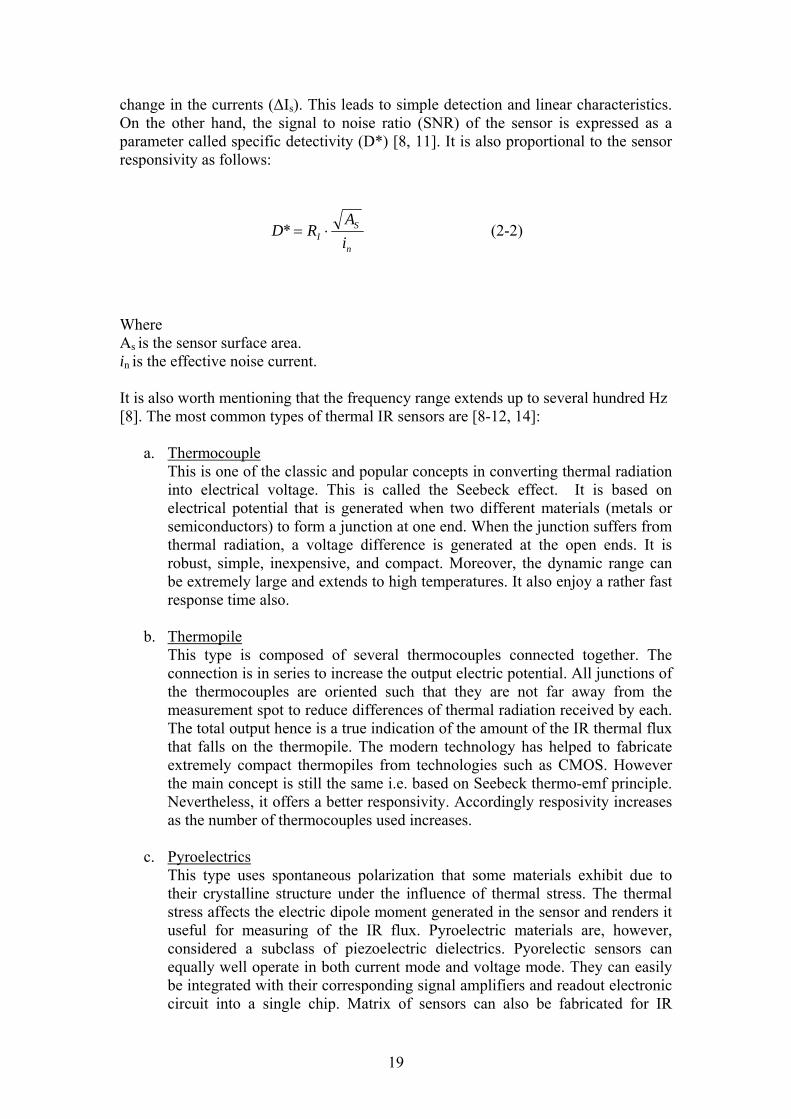
Where k is Boltzman constant. h is Planck’s constant . Therefore, the peak emission exitance will occur at λp (see figure 2.5) that satisfy the condition:
0
d
dMp
This leads to:
T · λp = 2897.8 μm K (2-7) This is also often referred to as Wein’s displacement law. By using the above formulas it becomes possible to plot BB IR radiation spectrum at any arbitrary temperature. Figure 2.6 [8] illustrates several plots of the exitance of a BB at corresponding temperatures. Note that as temperature increases λp shifts to lower values but the BB peak exitance value increase significantly in the mean while. It is worthwhile to mention that the Sun has a nominal temperature in the vicinity of 6000 °C and hence has a λp around 480 μm i.e. in the visible range of the electromagnetic spectrum. An even closer look to the figure 2.6 reveals that the λp
values have a logarithmic relationship (note the dotted line). In figure 2.7 [9] another form of the IR radiation spectrum from a BB on a semi-log portrays this fact (λp) values has a linear relation in this situation). Other objects that are not BB are usually referred to as gray bodies (GB). It follows very similar curves of IR spectral exitance depending on their characteristics but will be lower than those of BB as mentioned earlier. A gray body (GB) has an important parameter that measures this difference and it is called emissivity (will be dealt with later in this text). Therefore the emissivity of a BB is unity and any GB will have a lower than unity emissivity. Another important law that governs BB radiation is the Stefan-Boltzman law. The formula relates the total exitance of a BB as related to temperature as follows:
M(T) = σ · T4 (2-8)
Where σ is Stefan-Boltzman constant (5.67X 10⁻¹² W m-2 k-4).

24
Figure 2.6 a typical BB IR radiation spectrum at arbitrary temperatures [8]. 2.2.4 Emissivity As mentioned earlier, a BB is an ideal case of an object used as a standard and for calibration purposes. The actual case is referred to as gray body (GB). The gray body (GB) usually follows the same emission criteria except that it is lower by a percentage called emissivity. The proper definition of emissivity (ε) is, therefore, the ratio of the amount of radiation from a GB to that of the BB at the same temperature. In other words is 0 ≤ ε ≤ 1. Emissivity is also constant for most objects i.e. GBs. It is also sufficient to mention that emissivity holds true even for absorption of IR radiation. There are however other parameters that can affect emissivity (other than the temperature and the wavelength) [9]. The material type is, nevertheless, the dominating parameter in determining emissivity of the object. Some materials types such as metals are known to exhibit low emissivity values such as metals, while others have higher emissivity values such as glass. Object’s surface structure can also affect emissivity for the same material type significantly. Metals, for example, can enjoy much higher values of emissivity if their surface is polished vs. those objects that exhibit roughened surface [9]. Chemical modification of the surface can also enhance emissivity of the object noticeably [9]. Other parameters might also be of effect depending on the nature of the application.

25
Figure 2.7 another illustration of a typical BB IR radiation spectrum at arbitrary temperatures on a semi-log scale [9].
26
Chapter 3
Methods and Experimental setup
3.1 Introduction
The previous two chapters were intended to explain the problem and the scientific basis for the method used to offer a solution through literature review of a group of references on the subject. Skin cancer is spreading only to increase the number of cases by the minute. Nonetheless, it is still visually diagnosed (to a large extent) by the dermatologist, for example. The diagnosis method currently applied depends on qualitative description as a primary basis. The quantification and automation of the diagnosis process is still none mature as recorded by many references used in this thesis project [9 - 14]. Melanoma which is a deadly form of the skin cancer is also metastastic to a high degree and affects other organs in the human body. This metastastic form can, by definition, convert to another form of cancer nearly anywhere in the human body only to increase the suffering of the patient.
On the other hand, in its early stages skin cancer danger can be neutralized rather much easier and simpler than in its late stage (which can be highly fatal). Using natural thermal IR radiation emitted from the human skin to detect variation in pattern or distribution is yet to be matured into this interesting area of diagnosis. Although measuring thermal variation has been known to man a long time ago as one primitive technique to sense human body function, it has not been developed into the quantified diagnosis of human illnesses and dysfunctions. Therefore the goal of this research thesis was to investigate the possibility and appropriateness of measuring thermal IR radiation emitted from the skin of a laboratory animal (mouse) as a primary step in this direction. The aim was to detect variation that could exist between thermal IR radiations, and hence temperature, that normal skin emits under healthy conditions and that which is emitted from a cancerous spot on the skin. The evidence that would be obtained in such case should indicate the possibility of using thermal IR radiation in early diagnosis of skin cancer.
3.2 Motivation
As mentioned in chapter two, it is expected that all objects that exhibit a temperature above the absolute zero (i.e. 0 K) emits IR radiation spectrum that covers a broad spectrum and variable strengths. Human body is always above absolute zero and hence it emits natural IR radiation. Figures 2.6 and 2.7 portray a simple illustration of thermal IR radiation emitted from a black body (BB). Moreover, human skin can be safely approximated as a BB surface

27
Figure 3.1 shows a closer look to black body radiation function (Wλ) vs. wavelength (λ) at temperature that matches human body [14].
as was mention in chapter two. It is also expected that normal human body temperature is around 37 °C. Figure 3.1 [14] shows a curve of that specific temperature in terms of black body radiation function (Wλ). Black body radiation function is literally the spectrum of power per unit area emitted by a BB surface in the wavelength interval between λ and λ+dλ [14]. Therefore, the IR radiation from a human body is expected to exhibit a peek around 10 μm wavelengths. This can be confirmed with Wein’s displacement law (2-7) and justifies measuring IR radiation at this peak. In addition, figure 3.2 [11] illustrates another curve form IR emissivity expected relative to the various spectrum wavelengths at various temperature of a BB. It is shown that in the 8 – 14 μm spectrum range approximately 40% of the emitted IR radiation exist in comparison to the whole spectrum range at temperature 37 °C. Looking also at figure 2.2, it becomes even more evident that in the 8 – 14 μm spectrum range IR radiation exhibits nearly a constant 100% transmittance through the atmosphere. This suggests another advantage in this specific wavelength range to measure human skin IR radiation with minimum absorption by the surrounding atmosphere between the measuring device and the skin surface. It is also helpful to keep this technique, in general, non-contact and non- invasive.

28
Figure 3.2 illustrates IR emissivity of a black body (BB) and variations expected relative to the various spectrum wave lengths at various temperatures of BB [11].
It was also mentioned in chapter 1 that cancer in human tissues is expected to generate different thermal IR radiation than what normal tissues emit. This is due to the fact that cancer cells exhibit a higher metabolic rate as well as higher division rate. Nevertheless, it seems that angiogenesis is also strongly affecting the generation of thermal IR radiation in cancerous tissues also. In addition, skin cancer is normally superficial to the skin which makes it vulnerable to direct measurement and accessible. Hence, the suspected area can be identified visually and targeted by the measuring device. That was another factor in favor of using an IR sensor directly aimed at the suspected region to collect IR radiation emitted specifically from that spot. Another sensor was, in the meantime, directed towards a healthy region of the skin in the neighborhood. This served better to facilitate detecting the difference between a healthy region of the skin and a cancerous area should this difference exist almost concurrently.
29
a. b.
c. d.
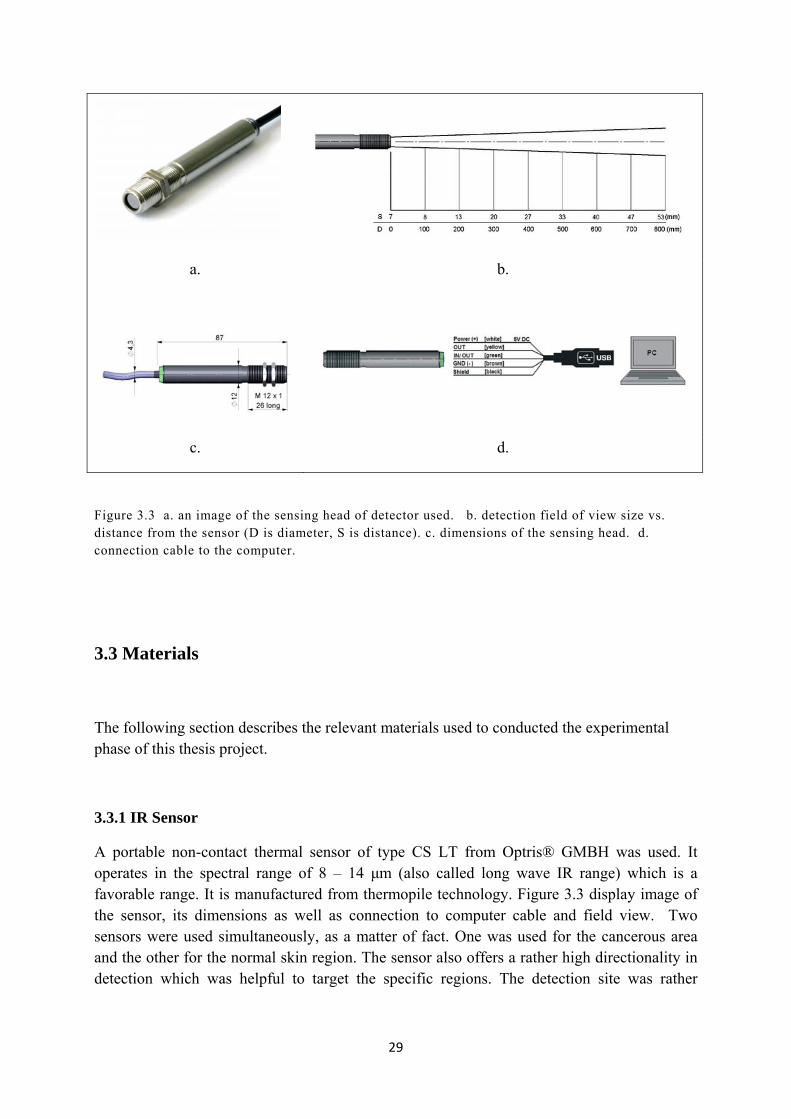
Figure 3.3 a. an image of the sensing head of detector used. b. detection field of view size vs. distance from the sensor (D is diameter, S is distance). c. dimensions of the sensing head. d. connection cable to the computer.
3.3 Materials
The following section describes the relevant materials used to conducted the experimental phase of this thesis project.
3.3.1 IR Sensor
A portable non-contact thermal sensor of type CS LT from Optris® GMBH was used. It operates in the spectral range of 8 – 14 μm (also called long wave IR range) which is a favorable range. It is manufactured from thermopile technology. Figure 3.3 display image of the sensor, its dimensions as well as connection to computer cable and field view. Two sensors were used simultaneously, as a matter of fact. One was used for the cancerous area and the other for the normal skin region. The sensor also offers a rather high directionality in detection which was helpful to target the specific regions. The detection site was rather narrow

30
IR sensor Computer
Cancer spot on skin
Holder
Lab animal (mouse)
Figure 3.4 portrays the experimental setup and data collection phase for one lab animal. One sensor is shown that targets cancer measurement.
narrow to allow targeting the whole cancer spot. The sensor had also a specific cable to connect to the computer and a software program to display and store the measurement.
3.3.2 Lab animal
A rodent (type of lab mouse) served as the lab animal under investigation. It is common in lab experiments regarding cancer research and was available. The size of animal was about 12 cm. The animal was used for in vivo measurement of thermal IR radiation from skin surface. The animal offered an easy and versatile experiment subject. The necessary ethical permission was obtained. All animal care and handling were performed by the laboratory supervisor. Two animals of identical type were implemented in the experimental phase of this research project to serve as double blind approach as much as possible.
3.3.3 Cancer cells
The preparation of cancer cells that were injected in both animals was handled at the Kaolinska Institutet where the experiments took place. Cancer cells were injected under the skin of both animals. Sufficient time was allowed for both animals to develop the tumor and to make sure no side effects or counter measures from the immunity system of either animal would trigger unfavorable events. All preparation and injecting of cancer cells were performed by authorized and trained personnel at the laboratory.
3.3.4 The experiment
The orientation of the experiment is shown in figure 3.4. The lab animals were totally handled by the lab’s professional supervisor. This included all preparation of the experiment and data
31
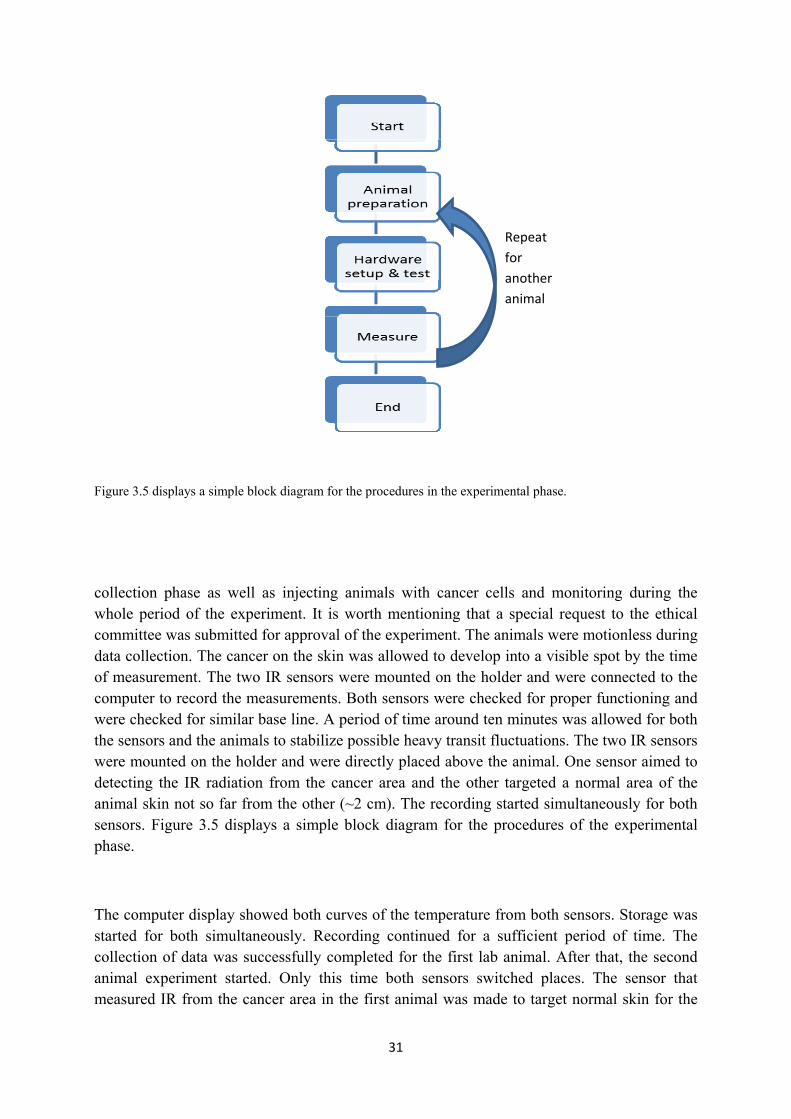
Figure 3.5 displays a simple block diagram for the procedures in the experimental phase.
collection phase as well as injecting animals with cancer cells and monitoring during the whole period of the experiment. It is worth mentioning that a special request to the ethical committee was submitted for approval of the experiment. The animals were motionless during data collection. The cancer on the skin was allowed to develop into a visible spot by the time of measurement. The two IR sensors were mounted on the holder and were connected to the computer to record the measurements. Both sensors were checked for proper functioning and were checked for similar base line. A period of time around ten minutes was allowed for both the sensors and the animals to stabilize possible heavy transit fluctuations. The two IR sensors were mounted on the holder and were directly placed above the animal. One sensor aimed to detecting the IR radiation from the cancer area and the other targeted a normal area of the animal skin not so far from the other (~2 cm). The recording started simultaneously for both sensors. Figure 3.5 displays a simple block diagram for the procedures of the experimental phase.
The computer display showed both curves of the temperature from both sensors. Storage was started for both simultaneously. Recording continued for a sufficient period of time. The collection of data was successfully completed for the first lab animal. After that, the second animal experiment started. Only this time both sensors switched places. The sensor that measured IR from the cancer area in the first animal was made to target normal skin for the
Repeat
for
another
animal

32
second animal and vice versa. This was believed to achieve a high degree of double blind measurement. The same measurement was performed for the second animal as well. This concluded data collection phase. A safety gear was provided by the laboratory supervisor to be used during the experiment. The lab supervisor was also present the whole period of data collection. All safety precautions were followed as was instructed.

33
Chapter 4
Results and analysis
4.1 Introduction
During the data collection phase all measurements were recorded by the computer software that was provided with the sensors. The tabulated results showed the time and the temperature recorded. The software could record a thousand measurements per second. The duration of the measurement was confined to approximately one to two minutes for each animal for both sensors. The extracted observations were captured from the file and tabulated for further analysis. Figure 4.1 displays a short form obtained from one animal with one sensor of the cancer given as an example. The file was of DAT type and was generated by the software that accompanied the sensors. Other factors listed on the file corresponds to industrial adjustments for compensating for the distance of measurement, ambient conditions, the emissivity,..etc and were irrelevant to the experiment.
Only temperature and time data were extracted for further analysis. For both animals the tabulated temperatures were arranged to form a rather synchronous sequence for even more appropriate comparison. Transient data especially those recorded at the beginning where excluded. It was decided that towards the end of the recordings was safer and better choice for comparisons purposes. This is due to the fact that the ending of recording for both animals occurred rather simultaneously for both sensors. Therefore it was assumed that the measurements at the end of measurements can be truly synchronized.
The subsequent analysis concentrated on comparing the measurements from both sensors to detect the difference between the cancerous and healthy areas should they have existed. This happened for both animals. In case of apparent differences existed between both areas (i.e. cancer and normal); would it be acceptable to make an inference on these differences that is supported by significant evidence to have originated from true temperature variations (and hence IR radiation)? This must be true for both animals. For this purpose the raw data was tested using two statistical tests the student t-test and the ANOVA test. But first a qualitative analysis summary is given.

34
Figure 4.1 displays a short form obtained from one animal for one sensor of the cancer given as an example.
4.2 Qualitative analysis
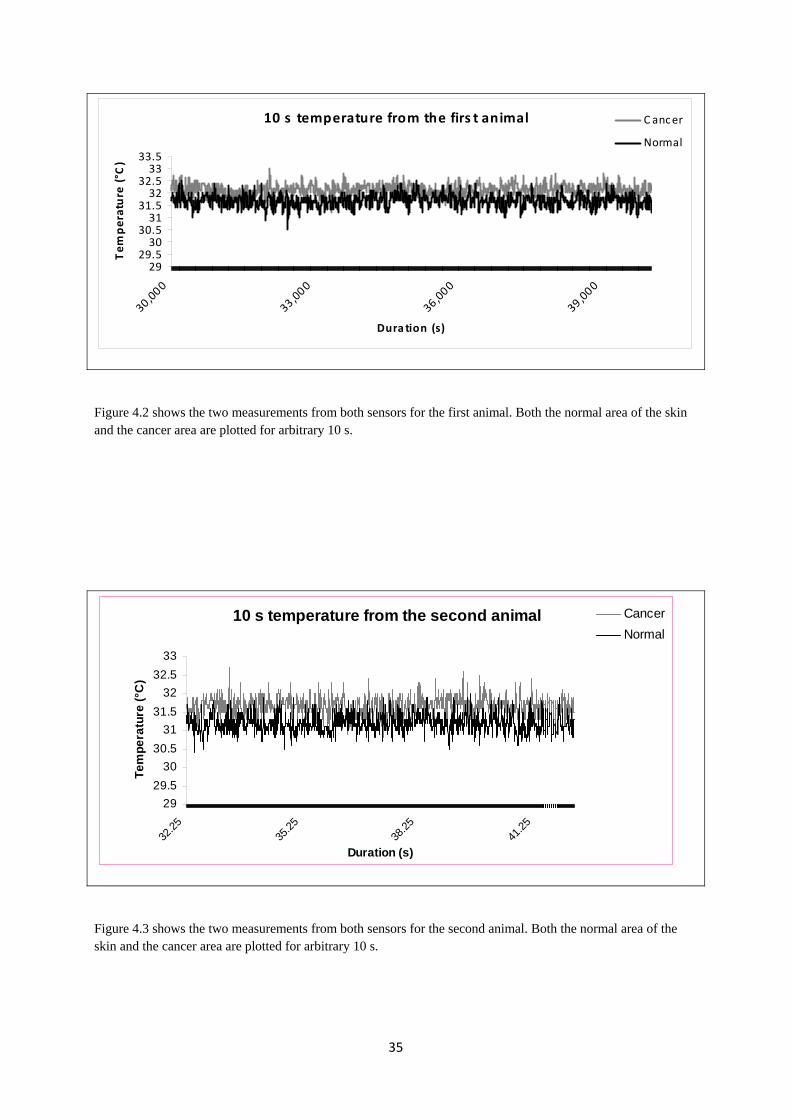
Maybe the most appropriate check was to plot the temperature measurement variation through time first. This gave a sound preliminary understanding of the apparent differences between both the cancer area and healthy normal skin of the animal and served also to indicate roughly if they are sufficient. Figure 4.2 shows the two measurements from sensors obtained from the first animal. A representative 10 s duration is shown for both sensors simultaneously. It was apparent that the cancer region temperature measurements were slightly higher than the normal skin measurements. This indicated that the assumption of different temperature (and hence IR radiation) between the cancer area on the skin and the healthy area has gained positive evidence from a qualitative point of view.
On the other hand, figure 4.3 displays a similar plot of both sensors measurements for the second animal. A pronounced difference appears to exist also between the cancer area temperature and that of the normal healthy skin area of the animal. This has gained little more positive evidence in the second animal case. In the two cases the cancer area was noticed to be higher in temperature. This went well with the expectations and preliminary assessment done before the beginning of the experimental phase.
35
10 s temperature from the firs t animal
2929.530
30.531
31.532
32.533
33.5
30,000
33,000
36,000
39,000
Dura tion (s)
Temperature (°C
)C ancer
Normal
Figure 4.2 shows the two measurements from both sensors for the first animal. Both the normal area of the skin and the cancer area are plotted for arbitrary 10 s.
10 s temperature from the second animal
29
29.5
30
30.5
31
31.5
32
32.5
33
32.2
535
.25
38.2
541
.25
Duration (s)
Te
mp
era
ture
(°C
)
Cancer
Normal
Figure 4.3 shows the two measurements from both sensors for the second animal. Both the normal area of the skin and the cancer area are plotted for arbitrary 10 s.
36
First animal
0
1000
2000
3000
4000
5000
6000
3030
.430
.831
.231
.6 3232
.432
.833
.233
.6 34
Temperature (°C)
Fre
quen
cy
Cancer
Normal
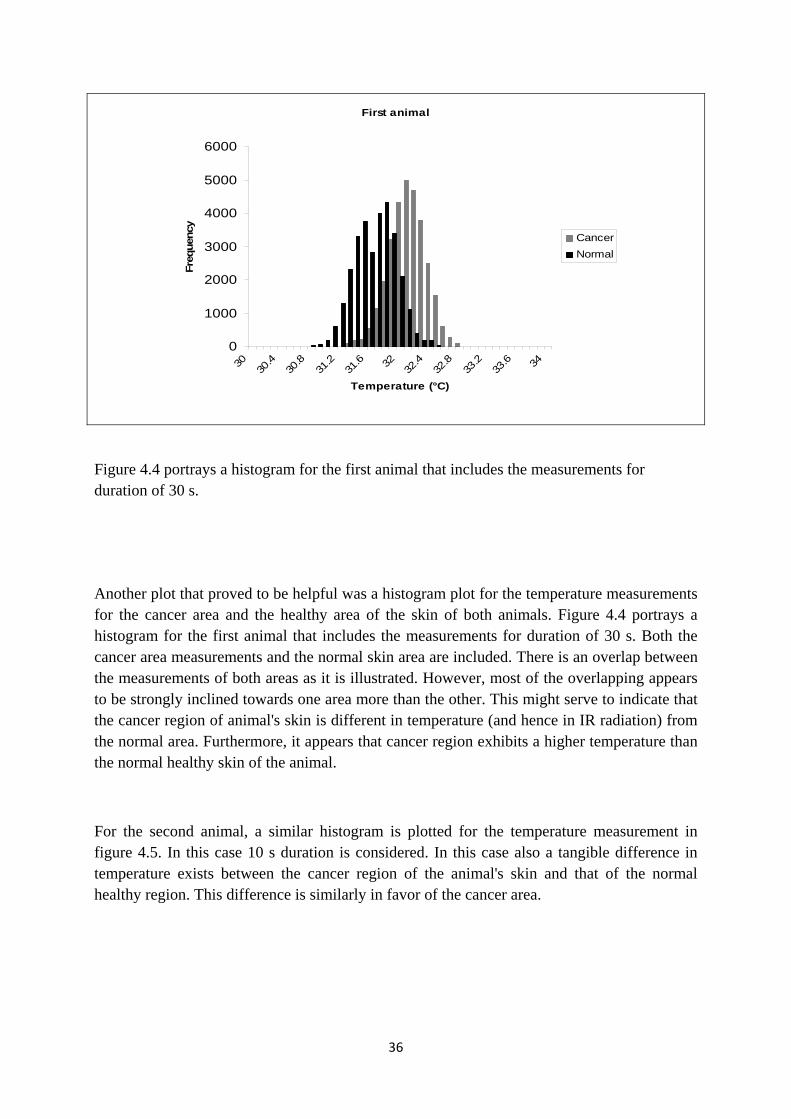
Figure 4.4 portrays a histogram for the first animal that includes the measurements for duration of 30 s.
Another plot that proved to be helpful was a histogram plot for the temperature measurements for the cancer area and the healthy area of the skin of both animals. Figure 4.4 portrays a histogram for the first animal that includes the measurements for duration of 30 s. Both the cancer area measurements and the normal skin area are included. There is an overlap between the measurements of both areas as it is illustrated. However, most of the overlapping appears to be strongly inclined towards one area more than the other. This might serve to indicate that the cancer region of animal's skin is different in temperature (and hence in IR radiation) from the normal area. Furthermore, it appears that cancer region exhibits a higher temperature than the normal healthy skin of the animal.
For the second animal, a similar histogram is plotted for the temperature measurement in figure 4.5. In this case 10 s duration is considered. In this case also a tangible difference in temperature exists between the cancer region of the animal's skin and that of the normal healthy region. This difference is similarly in favor of the cancer area.

37
Second animal
0
500
1000
1500
2000
2500
3030
.430
.831
.231
.6 3232
.432
.833
.233
.6 34
Temperature (°C)
Fre
qu
ency
Cancer
Normal
Figure 4.5 portrays a histogram for the first animal that includes the measurements for duration of 10 s.
4.3 Quantitative Analysis
In this section measurements obtained from the experimental phase is tested further for possible differences that can indicate whether there was a sufficient difference in the measurements between cancer and normal areas of the skin. Qualitatively, an apparent variation was noticed. Whether this was significant or not had to be scrutinized by appropriate statistics tools. First this was done by student t-test. Then one way ANOVA was applied to back up the inference (hopefully) obtained from the t-test.
4.3.1 Student t-test
This statistical test is primary devised to check if there exists a significant difference between two groups of measurements, for example. The apparent variation might not be of significant meaning and could have been generated by randomness or by errors in measurements. The main hypothesis was that no significant difference existed between measurements from the cancer and normal skin areas. The t-test was then use to try and obtain sufficient statistical evidence to reject the main hypothesis in favor of an alternate hypothesis (which was that the

38
difference between measurements was likely to come from true variations in measurements and not due to chance). Therefore this test was implemented in more than one way as follows:
1. A 30 s duration of temperature measurements from each region (i.e. cancer and normal skin) for each animal were tested for the significance of variation between both groups.
2. A 10 s duration temperature measurements from each region for each animal were similarly passed to student t-test.
3. A 1 s duration measurements were also tested from cancer area against corresponding measurements from normal health skin region
The measurements from the other animal were treated in the same manner. Temperature measurements from both the cancer area and the normal healthy area were passed through the t-test. Tables 4.1 to 4.3 illustrate a sample of the result of the test for first animal and tables 4.4 to 4.6 show corresponding result sample from the second animal. All results showed evidence of real variation between temperature measurements (and hence IR radiation) from the cancer against normal skin areas. Furthermore, this variation was found out to be statistically significant and could not have been generated by random error. This can be seen to a confidence much better than 0.05 level (p value), which is sufficient for most purposes. The performed t-test indicated also that the temperature measurements obtained from the cancer area was reliably higher than those obtained from the normal healthy skin. Hence the main hypothesis was rejected and more positive evidence in favor of an actual difference in temperature between cancer region and normal region of the skin based on measuring thermal IR radiation.
It is worth mentioning that even the 1 s duration showed significant difference in temperature measurements between cancer and normal healthy skin areas. This indicates that fast measurement process (which is unusual in thermal IR radiation) might be sufficient to extract significant difference also.

39
Table 4.1 lists the result of t-test when applied to temperature measurements form the first animal when using 30s duration of measurements.
t-Test: Two-Sample Assuming Unequal Variances
ANIMAL 1 Cancer Normal Mean 32.01305333 31.4958 Variance 0.060434958 0.084246502 Observations 30000 30000 Hypothesized Mean Difference 0 df 58416 t Stat 235.5361024 P(T<=t) one-tail < 0.01 t Critical one-tail 1.644879713 P(T<=t) two-tail < 0.01 t Critical two-tail 1.960004539
Table 4.2 lists two selected results of t-test when applied to temperature measurements form the first animal when using 10 s duration of measurements.
t-Test: Two-Sample Assuming Unequal Variances
ANIMAL 1 Cancer Normal Mean 32.11733 31.70104 Variance 0.048681539 0.056577 Observations 10000 10000 Hypothesized Mean Difference 0 Df 19886 t Stat 128.3122687 P(T<=t) one-tail < 0.01 t Critical one-tail 1.644930256 P(T<=t) two-tail < 0.01 t Critical two-tail 1.960083229
.
t-Test: Two-Sample Assuming Unequal Variances
ANIMAL 1 Cancer Normal Mean 32.11733 31.31378 Variance 0.048681539 0.056473759 Observations 10000 10000 Hypothesized Mean Difference 0 Df 19889 t Stat 247.7977312 P(T<=t) one-tail < 0.01 t Critical one-tail 1.644930245 P(T<=t) two-tail < 0.01 t Critical two-tail 1.960083211
40
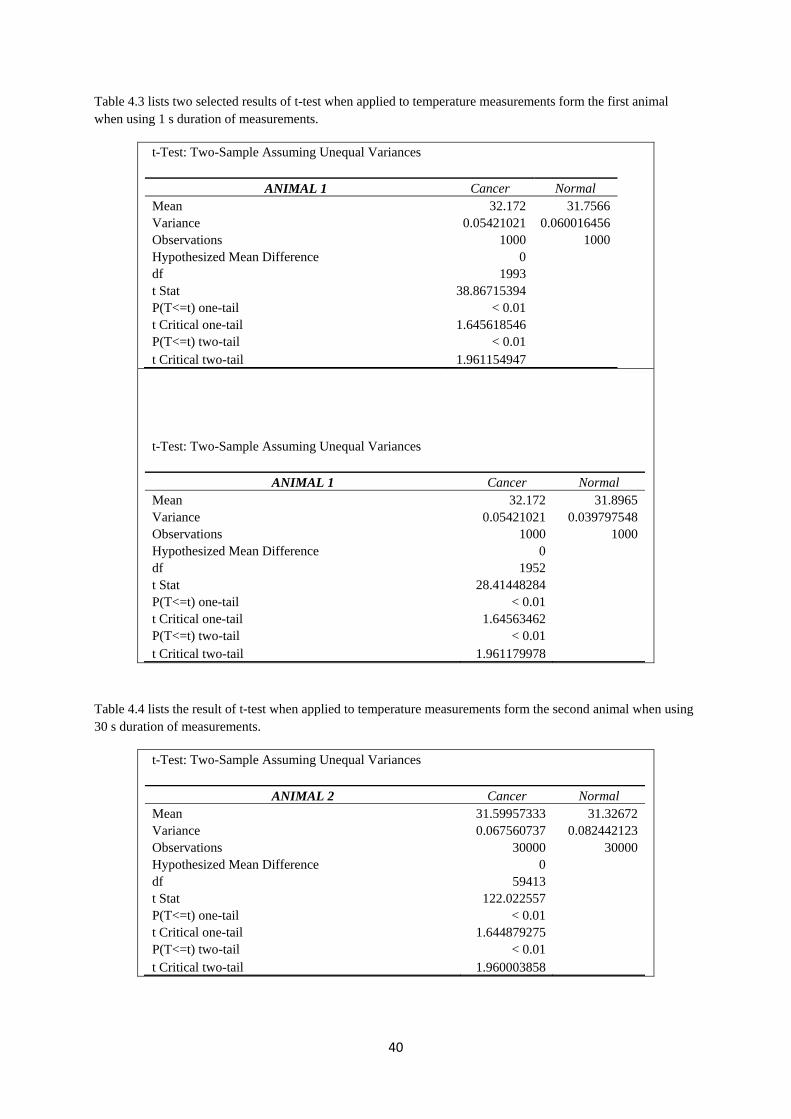
Table 4.3 lists two selected results of t-test when applied to temperature measurements form the first animal when using 1 s duration of measurements.
t-Test: Two-Sample Assuming Unequal Variances
ANIMAL 1 Cancer Normal Mean 32.172 31.7566 Variance 0.05421021 0.060016456 Observations 1000 1000 Hypothesized Mean Difference 0 df 1993 t Stat 38.86715394 P(T<=t) one-tail < 0.01 t Critical one-tail 1.645618546 P(T<=t) two-tail < 0.01 t Critical two-tail 1.961154947
t-Test: Two-Sample Assuming Unequal Variances
ANIMAL 1 Cancer Normal Mean 32.172 31.8965 Variance 0.05421021 0.039797548 Observations 1000 1000 Hypothesized Mean Difference 0 df 1952 t Stat 28.41448284 P(T<=t) one-tail < 0.01 t Critical one-tail 1.64563462 P(T<=t) two-tail < 0.01 t Critical two-tail 1.961179978
Table 4.4 lists the result of t-test when applied to temperature measurements form the second animal when using 30 s duration of measurements.
t-Test: Two-Sample Assuming Unequal Variances
ANIMAL 2 Cancer Normal Mean 31.59957333 31.32672 Variance 0.067560737 0.082442123 Observations 30000 30000 Hypothesized Mean Difference 0 df 59413 t Stat 122.022557 P(T<=t) one-tail < 0.01 t Critical one-tail 1.644879275 P(T<=t) two-tail < 0.01 t Critical two-tail 1.960003858
41
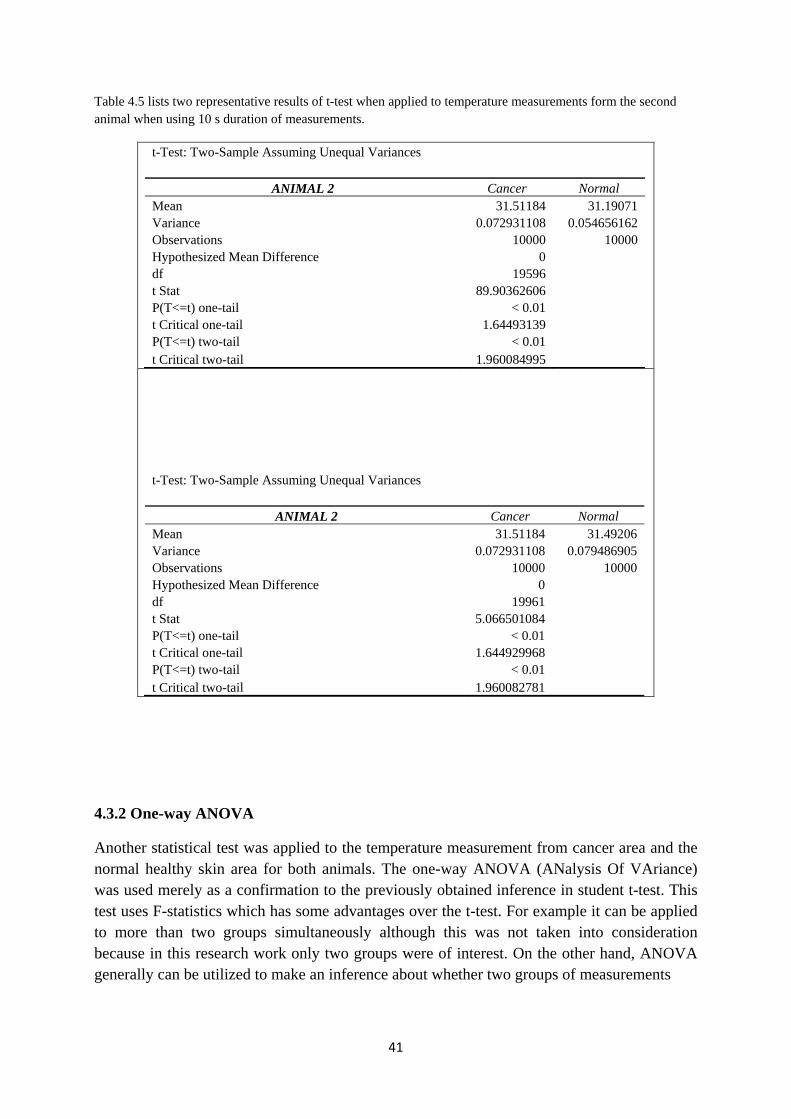
Table 4.5 lists two representative results of t-test when applied to temperature measurements form the second animal when using 10 s duration of measurements.
t-Test: Two-Sample Assuming Unequal Variances
ANIMAL 2 Cancer Normal Mean 31.51184 31.19071 Variance 0.072931108 0.054656162 Observations 10000 10000 Hypothesized Mean Difference 0 df 19596 t Stat 89.90362606 P(T<=t) one-tail < 0.01 t Critical one-tail 1.64493139 P(T<=t) two-tail < 0.01 t Critical two-tail 1.960084995
t-Test: Two-Sample Assuming Unequal Variances
ANIMAL 2 Cancer Normal Mean 31.51184 31.49206 Variance 0.072931108 0.079486905 Observations 10000 10000 Hypothesized Mean Difference 0 df 19961 t Stat 5.066501084 P(T<=t) one-tail < 0.01 t Critical one-tail 1.644929968 P(T<=t) two-tail < 0.01 t Critical two-tail 1.960082781
4.3.2 One-way ANOVA
Another statistical test was applied to the temperature measurement from cancer area and the normal healthy skin area for both animals. The one-way ANOVA (ANalysis Of VAriance) was used merely as a confirmation to the previously obtained inference in student t-test. This test uses F-statistics which has some advantages over the t-test. For example it can be applied to more than two groups simultaneously although this was not taken into consideration because in this research work only two groups were of interest. On the other hand, ANOVA generally can be utilized to make an inference about whether two groups of measurements

42
Table 4.6 lists two representative results of t-test when applied to temperature measurements form the second animal when using 1 s duration of measurements.
t-Test: Two-Sample Assuming Unequal Variances
ANIMAL 2 Cancer Normal Mean 31.5985 31.1734 Variance 0.041289039 0.053586026 Observations 1000 1000 Hypothesized Mean Difference 0 df 1965 t Stat 43.64304677 P(T<=t) one-tail < 0.01 t Critical one-tail 1.64562945 P(T<=t) two-tail < 0.01 t Critical two-tail 1.961171928
t-Test: Two-Sample Assuming Unequal Variances
ANIMAL 2 Cancer Normal Mean 31.6537 31.1734 Variance 0.048594905 0.053586026 Observations 1000 1000 Hypothesized Mean Difference 0 df 1993 t Stat 47.51466363 P(T<=t) one-tail < 0.01 t Critical one-tail 1.645618546 P(T<=t) two-tail < 0.01 t Critical two-tail 1.961154947
have an actual difference between them that could have not originated from mere chance. Nevertheless, ANOVA cannot state any information explicitly about the nature of this difference (only that difference exists to a statistical significant level).
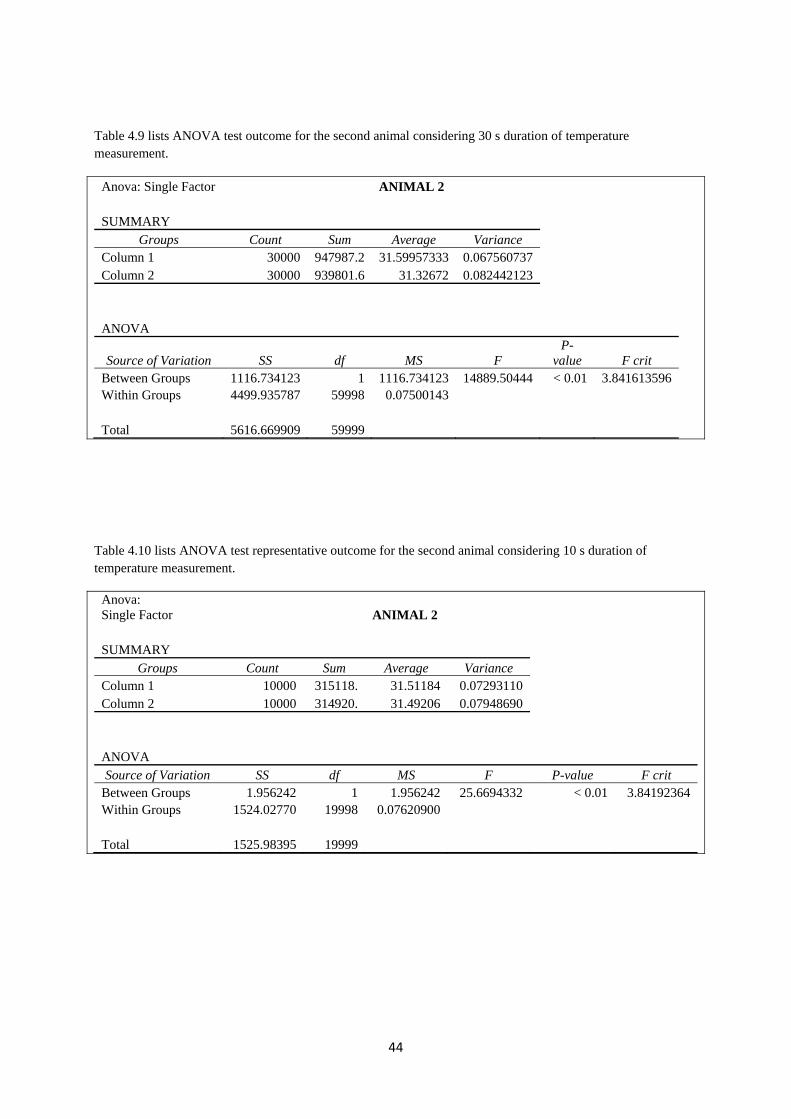
The implementation occurred for both 30 s duration of measurements and the 10 s duration. Tables 4.7 to 4.10 show representative results of the ANOVA test applied to the same temperature measurements that were used in the t-test for both animals. The apparent difference between temperature measurements (and hence IR radiation) from cancer area of the skin and normal healthy skin has been shown to exhibit statistical significance level much better than 0.05 (p value). Therefore, measurement difference between cancer and normal health could not have resulted from chance or error. It was rather due to actual difference between the measurements.

43
Table 4.7 lists ANOVA test outcome for the first animal considering 30 s duration of temperature measurement.
Anova: Single Factor ANIMAL 1 SUMMARY
Groups Count Sum Average Variance Cancer 30000 960391.6 32.01305333 0.060434958 Normal 30000 944874 31.4958 0.084246502 ANOVA Source of Variation SS df MS F P-value F crit Between Groups 4013.265163 1 4013.265163 55477.25557 < 0.01 3.841614 Within Groups 4340.299115 59998 0.07234073 Total 8353.564277 59999
Table 4.8 lists ANOVA test of a representative outcome for the first animal considering 10 s duration of temperature measurement.
Anova: Single Factor ANIMAL 1 SUMMARY
Groups Count Sum Average Variance Cancer 10000 319123.1 31.91231 0.06328179 Normal 10000 317010.4 31.70104 0.05657657 ANOVA
Source of Variation SS df MS F P-
value F crit Between Groups 223.175064 1 223.1750645 3723.97969 < 0.01 3.84192364 Within Groups 1198.46382 19998 0.059929184 Total 1421.63888 19999
44
Table 4.9 lists ANOVA test outcome for the second animal considering 30 s duration of temperature measurement.
Anova: Single Factor ANIMAL 2 SUMMARY
Groups Count Sum Average Variance Column 1 30000 947987.2 31.59957333 0.067560737 Column 2 30000 939801.6 31.32672 0.082442123 ANOVA
Source of Variation SS df MS F P-
value F crit Between Groups 1116.734123 1 1116.734123 14889.50444 < 0.01 3.841613596 Within Groups 4499.935787 59998 0.07500143 Total 5616.669909 59999
Table 4.10 lists ANOVA test representative outcome for the second animal considering 10 s duration of temperature measurement.
Anova: Single Factor ANIMAL 2 SUMMARY
Groups Count Sum Average Variance Column 1 10000 315118. 31.51184 0.07293110 Column 2 10000 314920. 31.49206 0.07948690 ANOVA Source of Variation SS df MS F P-value F crit
Between Groups 1.956242 1 1.956242 25.6694332 < 0.01 3.84192364 Within Groups 1524.02770 19998 0.07620900 Total 1525.98395 19999

45
Chapter 5
Discussion and Conclusion
5.1 Introduction
The aim of this research project was to know if the thermal IR radiation can be utilized to detect skin cancer, especially melanoma type. For this purpose an experiment was conducted using two lab animals and two IR radiation sensors. The experimental setup was designed so as to achieve a form of double blind approach. This served well to guarantee less error and gave strength to the outcome and hence the analysis as well as conclusions. Chapter 4 listed the results and observations that were obtained along with both qualitative and quantitative analysis for these observations. In this chapter the summary and discussion of these results and analysis are given as well as the conclusion and possible future work.
5.2 Discussion
The results shown in chapter 4 served well the main thesis. It displayed a justified possibility of using thermal IR radiation normally emitted from the skin to reveal skin cancer regions. This was illustrated using both qualitative analysis and quantitative analysis of the results. Both analyses have given positive contribution to support positively the main thesis of this research work. Moreover, all analyses served to strengthen each other in the same direction that supports further investigation of this particular method in skin cancer detection. It might be true that the skin cancer has no objective automated method of detection so far. Diagnosis of skin cancer still occurs largely by visual qualitative investigation of suspected areas of the skin. The high number of cases registered each year is estimated by millions in the whole world. This mandates increasing the efficacy and speed of diagnosis by devising automated methods for screening and detection. Skin cancer has around 5% deadly melanoma cases. Further complications can also lead to discomfort for the patient to say the least. This puts extra weight on research works that shed the light on potential methods that can be utilized for such cancer.
The qualitative analysis has confirmed the apparent difference between temperature measurements between skin cancer area and normal healthy skin that occurred in both animals. This was illustrated by simultaneous plotting of temperature variations through time in both skin cancer area and healthy skin area. It was apparent that the
46
fluctuations in each recording were also noticeable. However, the difference of both measurements was unmistaken. Only 10 s duration was shown to fit the width without sacrificing clarity of the plot. Temperature measured from skin cancer area is nearly always higher than that of the normal skin area. This shows significance to the functional nature of thermal IR radiation measurement from the human skin. Temperature of the skin relates heavily to the underling blood vessels as well as the metabolic rate in the corresponding area. Both of these factors suffer noticeable increase in areas of skin cancer due to uncontrollable and higher proliferation and metabolic rates as well as angiogenesis that are almost always accompany cancer.
Another type of plot that was implemented was a histogram of the temperature measurements recorded for 30 s for both the skin cancer area and normal skin area for one animal. This was shown for second animal for 10 s duration only. Both histograms showed similar outlook. The higher temperature from the cancer area of skin was shown clearly. However, due to fluctuations in measurement the temperature measurements overlapped in both histograms. This indicated that qualitative analysis might not be sufficient alone to justify the potential of temperature (and hence IR radiation). Nevertheless, it was possible to indicate the apparent difference between temperature measurements in favor of cancer area of the skin. The significance of this difference was handled better by the quantitative analysis of the observations.
After that a quantitative analysis was conducted to illustrate whether the higher temperature measured from a cancer area was statistically significant or it could have only been resulted by chance (or even random error)? Moreover, would this difference be reliable in detecting skin cancer with an acceptable sensitivity? For this purpose two different well-known statistical tests were used. First the student t-test was carried out to investigate the significance of the difference between the temperature measurements obtained from cancer skin and normal healthy skin areas in both laboratory animals. This was done using 30, 10, and 1 s duration of measurements that were rather simultaneous. All conducted t-test led to the inference towards the high significance of differences in the temperature measurements between cancer and normal skin. Furthermore, the higher temperature of cancer area was significant to a level much better than 0.05 level (p value).
One way ANOVA test was then used to put extra positive weight on the significance of difference of temperature measurements (and hence IR radiation). The ANOVA test indicated also an actual difference of temperature between cancer and normal skin. Although it could not indicate if temperature of cancer skin area is higher than that normal skin area, it strengthened the inference obtained previously form the t-test. Therefore, the qualitative and quantitative analysis to the observation from the

47
experimental phase of this research project pointed into the same direction regarding the potential of thermal IR radiation in skin cancer detection.
5.3 Conclusion
The nature of skin cancer was illustrated to cause sufficient difference in thermal IR radiation. This is due mainly to change in the functional nature of the cancer area. This change was detected using thermal IR radiation measurement in the wavelength range 8-14 μm. The cancer area was clearly higher in temperature by roughly 0.3 – 0.5 °C estimated form the mean value. Both the qualitative and quantitative statistical analysis of the observations showed sufficient evidence of the potential of thermal IR radiation to detect cancer area on the skin which would agree with the thesis quite well.
5.4 Future work
Despite the fact that this research work has fulfilled the main thesis, it opened the door to new questions on how to best use thermal IR radiation variations in the future to optimize an objective and automated method to detect skin cancer. This must be done with more thorough investigation and research that extends an appropriate period of time. In addition, sufficient funding needs to be allocated to such ambitious research to facilitate acquiring better measurement technology (possibly of quantum detection type), renting better research facility, run an extensive investigation, ..etc. More experiments on the animals to determine the time threshold of detection success of skin cancer would also be highly desirable and useful. After all, skin cancer can easily be treated and cured if detected in earlier stages.
Converting the measurement process into imaging method has been done successfully in many industrial applications of thermal IR at high temperatures. A true opportunity for doing the same in medical applications has been reported on scattered publications and web sites. However, IR imaging is not yet accepted as a true screening or diagnosis method for skin cancer. This constitutes a huge potential for this area that encourages further investigations.

48
References
[1] Po-Lin So, Skin cancer, Infobase Publishing, 2008. [2] Keyvan Nouri, skin cancer. Mcgrawhill, 2008. [3] Dieter Marmé, Tumor Angiogenesis, 2008. [4] Raymond W. Ruddon, CANCER BIOLOGY, Oxford University Press, Inc., 2007. [5] R.F. Schmidt and G. Thews et al.,Human physiology, Springer-Verlag 1989. [6] Anna Sunds, “Nya behandlingar bromsas av regler”, Biotech Sweden, Nr 7-2012, pp. 14-15. [7] www.cancerfonden.se [8] Helmut Budzier & Gerald Gerlach, Thermal infrared sensors: theory, optimization, and practice, John Wiley & Sons Ltd, 2011 [9] Michael Vollmer and Klaus-Peter Möllmann, Infrared Thermal Imaging: Fundamentals, Research and Applications, WILEY-VCH Verlag GmbH & Co. KGaA, 2010. [10] Nicholas A. Diakides & Joseph D. Bronzino (eds), Medical infrared imaging, CRC press, 2008. [11] R. A. Smith, F. E. Jones, and R. P. Chasmar, The detection and measurement of infra-red radiation, Oxford press, 1968. [12] S. J. BLUNDELL & K. M. BLUNDELL, CONCEPTS IN THERMAL PHYSICS, Oxford University Press Inc., 2006. [13] R. K. Hobbie & B. J. Roth, Intermediate Physics for Medicine and Biology, Springer Science+Business Media, LLC, 2007 . [14] A. Guilhan, Application of Pyrometry and IR-Thermography to High Surface Temperature Measurements, Defense Technical Information Center Compilation Part Notice ADPO10751, 1999
Extra reading
1. R. King & M. Robin, Cancer Biology, Pearson Education Limited, 2006. 2. B. Lahiri, S. Bagavathiappan,T. Jayakumar, John Philip, Medical applications
of infrared thermography: A review, Infrared Physics & Technology, vol 55, 2012 , pp 221 –235.
3. Tuan Vo-Dinh (ed), Biomedical Photonics Handbook, CRC Press, 2003. 4. John G. Webster (ed), Encyclopedia of medical devices & instrumentation
John Wiley & Sons, Inc , 2006. 5. J. Bronzino (ed), Medical devices and systems, Taylor & Francis Group, LLC,
2006. 6. J. Flores-Sahagun, J. Vargas , F. Mulinari-Brenner, Analysis and diagnosis of
basal cell carcinoma (BCC) via infrared imaging, Infrared Physics & Technology, 54/2011, 367–378.
7. G. Schaefera, M. Závišekb, T. Nakashimac, , Thermography based breast cancer analysis using statistical features and fuzzy classification, Pattern Recognition 47/2009, 1133 – 1137.

49
Acknowledgment
I am grateful to all persons who helped me to put this thesis project in its final form and
those who did not help …
You have made me more determined to complete my work... Thank you... !


