Skill Sheets
23
© Harcourt Education Ltd 2003 Catalyst 1 This worksheet may have been altered from the original on the CD-ROM. Sheet 1 of 1 Microscopes are very delicate pieces of equipment. They are easy to break and expensive to mend! You must be very careful when using one. Make sure you carry it around properly and never touch the glass of the lenses. Looking at your slides Looking closer 7 To look at cells in more detail you need to use a higher magnification. Turn the lenses until the middle lens is pointing down at the stage. 8 Turn the fine focusing knob to get a clear picture. 1 Skill sheet 1 Using a microscope light goes into your eye eyepiece lens clip to hold slide in place on the stage mirror or light source (depends on type of microscope) objective lenses of different strengths (make things look bigger) stage focusing knobs 1 Turn the lenses so that the shortest lens (one with the lowest number) is pointing down at the stage. 4 Before you look down the microscope, move the lens nearest the slide down until it is just above the slide. 5 Look down the eyepiece and slowly turn the focusing knob so that the lens moves away from the slide. 2 Place your slide on the stage. Hold it in place with the metal clips. 3 Arrange the lamp/mirror so that light shines up through the hole in the stage. 6 Carefully focus until you get a clear picture. Take care! If you hit the thin glass slides when you focus the microscope they will break. Never use a microscope where the Sun’s rays could reflect off the mirror. !
description
Skill Sheet
Transcript of Skill Sheets

© Harcourt Education Ltd 2003 Catalyst 1This worksheet may have been altered from the original on the CD-ROM. Sheet 1 of 1
Microscopes are very delicate pieces of equipment. They are easy tobreak and expensive to mend! You must be very careful when usingone. Make sure you carry it around properly and never touch theglass of the lenses.
Looking at your slides
Looking closer
7 To look at cells in more detail you need to use a highermagnification. Turn the lenses until the middle lens is pointingdown at the stage.
8 Turn the fine focusing knob to get a clear picture.
1 Skill sheet 1Using a microscope
light goes intoyour eye
eyepiecelens
clip to hold slidein place on thestage
mirror or light source(depends on type ofmicroscope)
objective lenses of differentstrengths (makethings look bigger)
stage
focusingknobs
1 Turn the lenses so that the shortest lens (one with the lowest number) is pointing down at the stage.
4 Before you look down the microscope, move the lens nearest the slide down until it is just above the slide.
5 Look down the eyepiece and slowly turn the focusing knob so that the lens moves away from the slide.
2 Place your slide on the stage. Hold it in place with the metal clips.
3 Arrange the lamp/mirror so that light shines up through the hole in the stage.
6 Carefully focus until you get a clear picture.
Take care! Ifyou hit the
thin glass slideswhen you focus themicroscope they willbreak.
Never use amicroscope wherethe Sun’s rays couldreflect off the mirror.
!

© Harcourt Education Ltd 2003 Catalyst 1This worksheet may have been altered from the original on the CD-ROM. Sheet 1 of 1
A magnifying glass makes small things look larger. It magnifiesthings. The magnifying glass in the picture makes things look twiceas large. A one penny coin is 2 cm across, so through the magnifyingglass it will look 4 cm across.
The magnification is ‘times 2’. We write this as �2. Magnifying by 2is the same as multiplying the size by 2.
2 cm � 2 � 4 cm
Microscopes work in the same way. They magnify things more than amagnifying glass does. How well you can see things through amicroscope depends on how large it makes them look. This dependson the magnification of the microscope lenses.
1 Look closely at the eyepiece lens or the objective lens. You shouldbe able to see a number like �10 on it. This is the magnificationit gives. A magnification of �10 means the lens makes thingslook 10 times larger.
2 Look again at both lenses and write down the magnification ofeach lens. They may be different.
3 Now multiply the two numbers together. For example:
eyepiece lens x10
objective lens x4
10 x 4 = 40
The number 40 is the total magnification of the microscope’slenses. You can write it as �40.
The objective lens makes things 4 times larger and then theeyepiece lens makes them 10 times larger again, making 40 times larger in total.
2 Skill sheet 2Magnification
�10
1
1

© Harcourt Education Ltd 2003 Catalyst 1This worksheet may have been altered from the original on the CD-ROM. Sheet 1 of 1
A microscope makes small things look much larger. It magnifiesthings. How well you can see things through a microscope dependson how large it makes them look. This depends on themagnification of the microscope lenses.
1 Look closely at the eyepiece lens or the objective lens. You shouldbe able to see a number like �10 on it. This is the magnificationit gives. A magnification of �10 means it makes things look 10 times larger.
2 Look again at both lenses and write down the magnification ofeach lens. They may be different.
3 Now multiply the two numbers together. For example:
eyepiece lens x10
objective lens x4
10 x 4 = 40
The number 40 is the total magnification of the microscope’slenses. You can write it as �40.
The objective lens makes things 4 times larger and then theeyepiece lens makes them 10 times larger again, making 40 times larger in total.
4 Look again at the objective lens. This can usually be changed togive different magnifications. Often there are three lenses.
A microscope may have three objective lenses: �4, �10 and �40.
With an eyepiece lens of �10 you get a total magnification of�40, �100 and �400.
5 If a cell was 0.1 mm wide and you looked through a microscopewith a total magnification of �40, the cell would look 4 mm widethrough the microscope.
6 It is possible to measure the size of objects under the microscopeby measuring the size of the field of view. This is the diameter ofwhat you can see at a particular magnification.
Place a slide with a scale on it (like a tiny ruler) under themicroscope and focus on it. Count up how many divisions youcan see. This is how wide the field of view is.
If each division was equal to 0.2 mm and you could see 6 divisions then the field of view would be 1.2 mm wide.
Remember: The field of view is different at differentmagnifications. The more you magnify something, the less of ityou can see in the same area.
3 Skill sheet 3Microscope magnification
�10
�10
�4

© Harcourt Education Ltd 2003 Catalyst 1This worksheet may have been altered from the original on the CD-ROM. Sheet 1 of 1
The World Wide Web (Internet) is a very useful source of information, but to make sureyou get only the information you really want you must ask yourself these questions beforeyou start:
One of the best ways is by using a search engine. Choose the one that works best for you and keep its address in your favourites folder.
Describe the information you want really carefully. Think of at least three words that will describe what you are looking for. For example, ifyou want to find out about the atmosphere on Mars try the wordsMars, planet and atmosphere.
A search engine will display the names of any websites or pages containing any of the words that you have used for your search. But you will only want pages containing all the words you have listed.
There may be a menu that allows you to specify what you want itto match.
Otherwise use the word ‘and’. So you would use Mars and planet and atmosphere to make surethe search engine looked for all the words.
Anyone can put information onto the Internet so you need to be careful about what you choose to read. A page written by NASA will be very reliable for information aboutplanets but might be too complicated. NASA For Kids would besimpler to understand.
Sometimes people put information that is silly or incorrect on their web pages. Youshould always try to avoid sites with the words ‘alternative’, ‘alt’ or ‘unofficial’ in theiraddress. Remember, you must choose the sites with care and do not believe everythingyou read on the Internet!
Never use information in your work that you do not understand. Always read the information carefully and then answer yourquestion in your own words. Copying someone else’s work couldland you in a lot of trouble, and not only with your teacher!
Always remember to ‘surf’ sensibly and safely. Never give your e-mail address or passwordto anybody on the Internet without first checking with your teacher.
4 Skill sheet 4Web searches
● Yahooligans!● Yahoo!● Alta Vista● HotBot● Google
Wherecan I find the
information I amlooking for?
How can Imake sure thesearch engine
finds what I amlooking for?
How can Imake sure thesearch engineunderstands
me?
Howcan I use theinformation I
get?
Whatshould I do withthe information?
Select a search method: Intelligent default An extract phrase match Matches on all words (AND) Matches on any word (OR)

© Harcourt Education Ltd 2003 Catalyst 1This worksheet may have been altered from the original on the CD-ROM. Sheet 1 of 1
Choosing the right type of chart or graph
Ask yourself, ‘What is the input variable?’
If it is a number that can have any value …like 1.2, 4.8, 7.9, 16.8
… then you want a line graph.
If it is has values …like red, green, blue
or tall, medium, shortor January, March, April
… then you want a bar chart.
Which way round?
That is easy! The input variable (the thing you change) goes along the bottom and the outcome variable (the thing you measure) goes up the side.
Bar charts look like this: Line graphs look like this:
Lines of best fit
When you are drawing a line graph do not join the crosses. Instead, look for the pattern.The line of best fit should show the pattern. The pattern can be a straight line or a curve.
The pattern looks like a The pattern looks like a curve:straight line:
5 Skill sheet 5Drawing charts and graphs
Remember● give the graph a title● label the axes● if there are units, put
them on the axes● make sure each point
is in exactly the rightplace
Variables likethis are continuous
variables.
Variables likethis are discontinuous
variables.
1
2
3
4
5
6
red blue green black other
Nu
mb
er o
f ca
rs
Colour
×
×
×
×
×1
2
3
4
5
6
252015105Time in days
Len
gth
of
roo
t in
cm
××
×
×
×1
2
3
4
5
6
252015105Time in days
Len
gth
of
roo
t in
cm
1
2
3
4
5
6
252015105Time in days
Len
gth
of
roo
t in
cm
×××
×
×

© Harcourt Education Ltd 2003 Catalyst 1This worksheet may have been altered from the original on the CD-ROM. Sheet 1 of 1
Bar charts
Using the bar chart you can tell that:● there are 6 red cars, 2 blue cars, 4 green cars,
3 black cars and 5 cars of other colours● that there are 20 cars altogether (by adding up all
the bars).
Line graphs
If there is a pattern to the line graph, then there is a relationshipbetween the input variable and the outcome variable.
Using graph A you can tell that:● as the time increases, the distance increases● the straight line slopes upwards● the slope of the line stays the same● when the time increases by 5 s, the distance
always increases by about 10 m.
Using graph B you can tell that:● as the time increases, the distance increases● the curve slopes upwards● the slope increases as the time increases● at the beginning, when the time increases by 5 s
the distance increases by about 2.5 m● at the end, when the time increases by 5 s the
distance increases by about 20 m.
Using graph C you can tell that:● as the time increases, the speed decreases● the straight line slopes downwards● the slope of the line stays the same● when time increases by 5 s, the speed
always decreases by about 10 m/s.
Using graph D you can tell that:● as the volume increases, the pressure decreases● the curve slopes downwards● the slope decreases as the volume increases● at the beginning, when the volume increases by
5 m3 the pressure decreases by about 20 Pa● at the end, when the volume increases by 5 m3
the pressure decreases by 2 Pa.
6 Skill sheet 6Interpreting graphs
1
2
3
4
5
6
red blue green black other
Nu
mb
er o
f ca
rs
Colour
×
×
××
×
×0
10
20
30
40
50
60 A
0 5 10 15 20 25
Time in seconds
Dis
tan
ce i
n m
etre
sB
×
×
×
××
×0
10
20
30
40
50
60
0 5 10 15 20 25
Time in seconds
Dis
tan
ce i
n m
etre
s
C
×
×
×
×
×
×
0
10
20
30
40
50
60
0 5 10 15 20 25
Spee
d i
n m
/s
Time in seconds
D
××
×
×
×
0
10
20
30
0 5 10 15 20 25
Pre
ssu
re i
n P
a
Volume in m3
×
40
× ×

© Harcourt Education Ltd 2003 Catalyst 1This worksheet may have been altered from the original on the CD-ROM. Sheet 1 of 1
What makes good results?
There are several things that help make good results. Taking enoughreadings in an investigation, taking your readings to a suitable number ofdecimal points, and using good measuring instruments will all help you getreliable, precise and accurate results. Let’s look at each of these things inmore detail.
Reliable results
Your teacher has probably suggested sometimes that you should repeatyour experiment a few times to get several readings for each value of theinput variable.
For example, if you are pulling shoes with weights in them to investigatefriction, you might pull the shoe five times for each weight and record theforce reading.
Then you need to take an average of all five readings to get an averagereading, by adding them up and dividing by the number of readings. Any value becomes more reliable, the more readings are taken for it.
Precise results
Whenever you are taking readings, you need to decide how precisely to read the measuring scale. This means to how many decimal points to take a reading. There are two things to consider here: how precise to be and what is most suitable for the thing you are measuring.
Jane’s readings are more precise, but John’s readings are precise enough for foot size.
Accurate results
When you use measuring instruments, you need to make sure they work well. If you use a forcemeter that has been overstretched, it will always have a reading on it, even when there is no weight on it. The forcemeter in the diagram will always give a reading that is one newton more than the actual weight.
To be accurate, your instruments must work well. You should check they work and if necessary adjust any instruments to zero if possible.
7 Skill sheet 7Good results
I’mtaking my readingsof foot length to thenearest centimetre.
I’mtaking mine to thenearest millimetre.
10
8
6
4
2
0
9
7
5
3
1
N
As you cansee, to get good
results you need totake reliable, precise
and accuratemeasurements.
1st reading 2nd reading 3rd reading 4th reading 5th reading Average
10 N 11 N 10 N 12 N 13 N 11 N

© Harcourt Education Ltd 2003 Catalyst 1This worksheet may have been altered from the original on the CD-ROM. Sheet 1 of 1
What are variables?
When you do an investigation there are usually many factors to considerwhich may affect your results. These factors are called variables. Someexamples are time, distance, speed, weight, mass, different metals or acids.
In science you need to make sure that your investigation looks at just twovariables at a time, so you can see how they affect each other. Below are fivesteps to help you decide what variables you are going to work with in aninvestigation.
1 Name all the variablesImagine you decided to investigate shoe soles and friction. What are all thevariables that might affect the friction of shoe soles? They are:
2 Decide what you are going to investigate
The next thing is to decide which of these variables you are going toinvestigate. You need to choose just two variables.For example, you could look at how the weight of the shoe affects the forceyou pull it with to make it move.
3 Decide what you are going to changeNow you need to decide which of the two variables you are going tochange. This is the input variable (or independent variable).In the example, you would choose to change the weight of the shoe byputting weights in it, such as 100 g, 200 g, 300 g, etc.
4 Decide what you are going to measureThe other variable is the one you are going to measure. This is the outcomevariable (or dependent variable).In the example, you would measure the force you need to pull the shoewith at each weight, using a forcemeter.
5 Decide what you are going to keep the sameFinally, you need to keep all the other variables the same if you can, to makesure the investigation is a fair test. This means that you need to decide onvalues for all them.
In the example, you would need to use the same surface all the time, thesame slope and not introduce any lubricant such as water. You need toinclude these values in your plan.
8 Skill sheet 8Variables
● weight of the shoe ● the type of surface the shoe is in contact with● surface area of the shoe ● the lubricant, such as water, between the sole and● the slope the shoe is on the surface
● the force with which you pull the shoe.

© Harcourt Education Ltd 2003 Catalyst 1This worksheet may have been altered from the original on the CD-ROM. Sheet 1 of 1
Class 7Z is very noisy and careless. They never listen to whatthe teacher says. Here is a picture of them in the lab.
Make a table like the one below.
1 Identify the different safety hazards there are in this lab. Thereare at least 17 of them to find. Write them in the left-handcolumn of your table.
2 Explain why each action is a hazard in the middle column.3 Explain what they should do to make it safe in the right-hand
column.
9 Skill sheet 9Safety in the lab
Hazard Why is it dangerous?What should bedone instead?

© Harcourt Education Ltd 2003 Catalyst 1This worksheet may have been altered from the original on the CD-ROM. Sheet 1 of 1
10 Skill sheet 10Hazard symbols
Symbol Stands for
Highlyflammable
Catches fireeasily
Ethanol Keep away from flames
Corrosive May destroyliving tissues(e.g. skin andeyes) oncontact
Sodiumhydroxide
Wear eye protectionDo not swallow or spillon skinWash off skin immediatelyWipe up spills
Toxic Poisonous – can causedeath eitherby swallowing,breathing inor absorptionthrough theskin
Cyanide You will not be using anytoxic chemicals!
Harmful May havehealth risk ifbreathed in,taken internallyor absorbedthrough theskin
Petrol Wear eye protectionDo not swallow or spillon skinWash off skin immediatelyWipe up spills
Irritant Not corrosivebut can causereddening orblistering ofskin
Bleach Wear eye protectionDo not swallow or spillon skinWash off skin immediatelyWipe up spills
Oxidising Providesoxygen whichallows othermaterials toburn morefiercely
Liquidoxygen
Keep away fromflammable materials
Meaning Example Safety precautions

© Harcourt Education Ltd 2003 Catalyst 1This worksheet may have been altered from the original on the CD-ROM. Sheet 1 of 1
You should carry out a risk assessment on any activity you plan.Use your risk assessment to decide what safety precautions should be taken, then writethem down.Show your safety precautions to your teacher before you begin.
1 Does everyone in your group follow the safety rules?
Check that everyone in your group understands the safety rules.
Check that everyone in your group has agreed to follow the safety rules.
2 Are you using chemicals?
Check that the chemicals are suitable for pupils of your age.
Look at the hazard symbols on the chemicals. Decide on and record suitablesafety precautions.
Agree to wear eye protection.
Agree to wash off any chemical that comes in contact with your skin.
Agree to wipe up any spills that occur. Report spills to your teacher.
Check with your teacher how to dispose of the chemicals.
Agree to wash your hands after handling chemicals.
3 Are you heating anything?
Agree to wear eye protection.
Decide how to hold the object to be heated (tongs, test tube holder or tripod).
Think about how to heat chemicals (for example, do not point the open end ofboiling tubes and test tubes at yourself or others).
Make sure there is a heatproof mat for hot objects.
Check all heated objects have cooled before touching.
Plan to report all burns to your teacher and follow the first aid advice you are given.
4 Are you cutting anything?
Agree to treat sharp edges with respect.
Agree to report any cuts to your teacher.
5 Using equipment
Make sure you understand how to use the equipment and ask if you are not sure.
Plan to arrange the equipment safely on your table.
Agree to report all breakages immediately.
11 Skill sheet 11Risk assessment

© Harcourt Education Ltd 2003 Catalyst 1This worksheet may have been altered from the original on the CD-ROM. Sheet 1 of 1
© Harcourt Education Ltd 2003 Catalyst 1This worksheet may have been altered from the original on the CD-ROM. Sheet 1 of 1
The Bunsen burner is attached to a gas supply by rubber tubing.
The gas is lit using a match or a splint .
1 Place the Bunsen burner onto a heatproof mat.
2 Attach the rubber tubing firmly onto a gas tap.
3 Close the air hole completely.
4 Put on your eye protection.
5 Light a splint.
6 Turn on the gas tap.● Quickly light the gas with the splint.● Once a flame appears from the Bunsen burner, move
your hand away quickly.
7 Turn the collar to get the correct flame for the experiment.
8 Always leave the air hole closed when you walk away from theBunsen burner.
12 Skill sheet 12Lighting a Bunsen burner
Wear eye protection.
barrel
air holecollar
base gas in
The Bunsen burner is attached to a gas supply by rubber tubing.
The gas is lit using a match or a splint .
1 Place the Bunsen burner onto a heatproof mat.
2 Attach the rubber tubing firmly onto a gas tap.
3 Close the air hole completely.
4 Put on your eye protection.
5 Light a splint.
6 Turn on the gas tap.● Quickly light the gas with the splint.● Once a flame appears from the Bunsen burner, move
your hand away quickly.
7 Turn the collar to get the correct flame for the experiment.
8 Always leave the air hole closed when you walk away from theBunsen burner.
Lighting a Bunsen burner
Wear eye protection.
barrel
air holecollar
base gas in
12 Skill sheet 12
�

© Harcourt Education Ltd 2003 Catalyst 1This worksheet may have been altered from the original on the CD-ROM. Sheet 1 of 1
Different flames are needed to heat different types of substances.
The diagram below shows which flame should be used for heating solid substances and liquids with a Bunsen burner.
The diagram also shows the flame which must be left on when the Bunsen burner is not being used. This flame is called the safety flame. It looks yellow.
If the flame is too big, adjust the gas at the gas tap.
Heating solids
When you are heating solids in test tubes:● hold the test tube with a test tube holder near the
top of the tube● heat at an angle as shown in the diagram● do not point the tube towards anybody● heat the tube for a short amount of time and check
to see if anything is happening● keep heating a little longer each time and keep on checking.
Heating liquids
When you are heating liquids in boiling tubes:● fill the boiling tube no more than a third full● use a boiling tube holder or clamp the tube● heat at an angle as shown in the diagram● do not point the tube towards anybody● watch the liquid carefully and if it starts to boil remove the tube from the flame.
13 Skill sheet 13Heating substances
yellowflame
air holeclosed
This is known as a safetyflame and must notbe used for heating
substances.
This flame can be usedfor heating most substances
and it is always used forheating liquids.
This is the hottest flameand is used to heat solids.
The hottest part of theflame is just above the
blue cone.
very palepurple flame
air holehalf open
roaringflame
blue cone
air holefully open
Wear eye protection.

© Harcourt Education Ltd 2003 Catalyst 1This worksheet may have been altered from the original on the CD-ROM. Sheet 1 of 2
14 Skill sheet 14Laboratory equipment
Name ofapparatus
beaker
test tube
filter funneland filter paper paper
funnel
tripod
gauze
Drawing Diagram
paper
funnel

© Harcourt Education Ltd 2003 Catalyst 1This worksheet may have been altered from the original on the CD-ROM. Sheet 2 of 2
Name ofapparatus
mat
Bunsen burner
teat pipette
measuringcylinder
spatula
Drawing Diagram
heat
14 Skill sheet 14Laboratory equipment (continued)
© Harcourt Education Ltd 2003 Catalyst 1This worksheet may have been altered from the original on the CD-ROM. Sheet 1 of 1
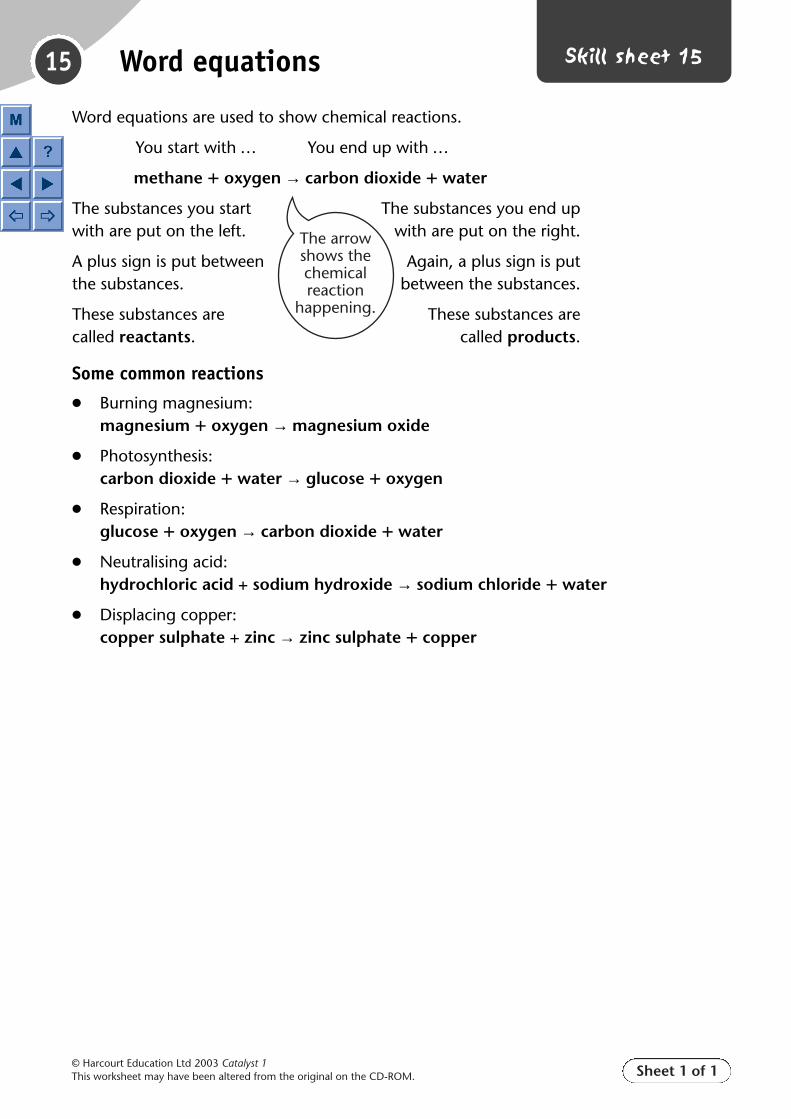
15 Skill sheet 15Word equations
Word equations are used to show chemical reactions.
You start with … You end up with …
methane � oxygen → carbon dioxide � water
The substances you start The substances you end upwith are put on the left. with are put on the right.
A plus sign is put between Again, a plus sign is putthe substances. between the substances.
These substances are These substances arecalled reactants. called products.
Some common reactions
● Burning magnesium:magnesium � oxygen → magnesium oxide
● Photosynthesis:carbon dioxide � water → glucose � oxygen
● Respiration:glucose � oxygen → carbon dioxide � water
● Neutralising acid:hydrochloric acid + sodium hydroxide → sodium chloride � water
● Displacing copper:copper sulphate + zinc → zinc sulphate � copper
The arrowshows thechemicalreaction
happening.

© Harcourt Education Ltd 2003 Catalyst 1This worksheet may have been altered from the original on the CD-ROM. Sheet 1 of 1
Stored energy is shown using a box.
The words in the box tell you:● where the energy is being stored● what type of energy is being stored.
Energy being transferred is written on an arrow.
The arrow tells you:● where the energy is coming from and where it is going.
The words tell you:● what type of energy is being transferred.
Devices that transfer energy but do not store it are shownbetween arrows. Sometimes the energy is changed from one type toanother in a device.
Energy transfer diagrams can branch. They can show morethan one energy transfer.
This energy transfer diagram shows:● energy being transferred into a tree during photosynthesis● the tree storing the energy● the energy being released during burning.
16 Skill sheet 16Energy transfer diagrams
Strain energyin a stretchedelastic band
Chemicalenergy in
the battery
Gravitationalenergy in the
skydiver
light energy
electrical energy
movement (kinetic) energy
sound energy
heat (thermal) energy
electrical energycooker
heat (thermal) energy
light energySun
heat (thermal) energy
light energy
Chemicalenergyin tree

© Harcourt Education Ltd 2003 Catalyst 1This worksheet may have been altered from the original on the CD-ROM. Sheet 1 of 1
How to connect it
An ammeter is used to measure the current through a circuit in amps. To measure the current through a circuit you must include the meter so that the current will flow through it.
Here is a circuit with a lamp, a battery and a switch.
How to read it
There are two types of ammeter you might use – digital and analogue.
Digital meters have a digital number display, so they are easy to read. But when you are using one, you must make sure you have switched it to the right scale.
Look at these scales and readings.A reads 65.2 � 100 � 6520 amps because the dial is set to 100.
Analogue meters have a pointer. You have to decide what each mark on the scale means, then decide where the needle is pointing.Look at these scales and readings.
17 Skill sheet 17Reading an ammeter
� �
the current flows from� to � inside the ammeter.If you connect it the wrong wayround there will be a – sign here.
��
RETEMM
A
� �
0.1
+0.09
110
10010A
A
mA
RETEMM
A
� �
0.1
0065.20
110100
10A
A
mA
RETEMM
A
� �
0.1
0000.48
110100
10A
A
mA
3210
4 5 67
Amps
321
0
4 5 67
8
Amps
1
20
Amps
1
20
Amps
Here is the same circuit with the ammeter connected tomeasure the current through the circuit.
A reads ........................... B reads ...........................
C reads ........................... D reads ........................... E reads ........................... F reads ...........................

© Harcourt Education Ltd 2003 Catalyst 1This worksheet may have been altered from the original on the CD-ROM. Sheet 1 of 1
Reading information from a graph pointIn the same way as you plot graph points, you can read information from agraph point which is already plotted for you – the process is just reversed.
Reading information between and beyond graph pointsIt is possible to read information from a graph that has not come directlyfrom measurements in an investigation. This can be between two points orbeyond the points plotted on a graph. Such information is part of thepattern or relationship between the input variable and the output variable.
Here are two examples.
This is how you can predict values that are bigger than those measured inan investigation.
18 Skill sheet 18Reading from graphs
● Start at the point you want to read, marked with a cross on the line.
● Read down the grid to the axis along the bottom and read off the value from the scale (input variable). Write the value down.
● Read across the grid to the axis up the side and read off the value from the scale (outcome variable). Write the value down.
In this graph, the graph point shows that when the time is 10 seconds the distance is 20 metres.
0
10
20
30
40
50
60
0 5 10 15 20 25Time in seconds
Dis
tan
ce i
n m
etre
s
● Start from a point on the line (between two crosses) for which you want the information.
● Read down the grid to the axis along the bottom and read off the value from the scale (input variable). Write the value down.
● Read across the grid to the axis up the side and read off the value from the scale (outcome variable). Write the value down.
In this graph, the line shows that when the time is 8 seconds the distance is 15 metres.
0
10
20
30
40
50
60
0 5 10 15 20 25Time in seconds
Dis
tan
ce i
n m
etre
s
● Continue the graph line at the same angle as it is plotted but with a dashed line.
● Choose a point on the dashed line whose value you want to know.
● Read off the input and outcome values as above.In this graph, the dashed line shows that when the time is 30 seconds the distance would be 60 metres.
0
10
20
30
40
50
60
70
80
0 5 10 15 20 25 30 35
Time in seconds
Dis
tan
ce i
n m
etre
s

© Harcourt Education Ltd 2003 Catalyst 1This worksheet may have been altered from the original on the CD-ROM. Sheet 1 of 1
Be an excellent researcher
When you use any resources, such as books, CD-ROMs and theInternet, you will often find a lot more detail than you were lookingfor. You don’t have to use it all. In fact, it is better to use lessinformation but use a small amount of research properly.
Try not to write down things that you don’t understand. Ask for helpif you need it. Look for something else you do understand on thesame subject. Most importantly, write in your own words theinformation you are presenting from your research.
The topic I am researching is …
19 Skill sheet 19Writing frame: Research
Questions I need Answers Extra details Sourceto answer are ...

© Harcourt Education Ltd 2003 Catalyst 1This worksheet may have been altered from the original on the CD-ROM. Sheet 1 of 1
Title …
The aim of this activity is to …
I am trying to find out …
What I think will happen is …
I think this will happen because …
I am going to need …
For safety reasons, I will …
I will set up my equipment like this …(attach any diagrams of lab equipment)
Fair testing is important, so the things I will keep the same are …
During the activity, I will look for …
I will count …
I will measure …
The number of measurements I will take is …
I will repeat my experiment to …
20 Skill sheet 20Writing frame: Plan aninvestigation

© Harcourt Education Ltd 2003 Catalyst 1This worksheet may have been altered from the original on the CD-ROM. Sheet 1 of 1
Title …
Obtaining evidence
The aim of this activity was to …
Firstly, I …
Then, I …
My reason for doing this was …
Finally, I …
Presenting the results(attach your tables and graphs)
Considering the evidence
I have found out …
What I thought would happen was …
If I compare my results with my prediction, I can see that …
My graph shows that …
This is because …
Evaluating
I found it easy to …
Although, it was hard to …
My results …
A more accurate way of doing this experiment would be …
If I had more time, I would …
21 Skill sheet 21Writing frame: Report aninvestigation

© Harcourt Education Ltd 2003 Catalyst 1This worksheet may have been altered from the original on the CD-ROM. Sheet 1 of 1
Title …
We think that …
The arguments for are …
Our research shows that …
On the other hand …
The information supporting this can be found …
We have seen that …
The evidence clearly points to the conclusion that …
22 Skill sheet 22Writing frame: Debate