Ski Club de Besse · SKI CLUB DE BESSE Dossier Sponsoring 2008-2009 Section Ski Nordique ...

STATENS KÄRNKRAFTINSPEKTIONSwedish Nuclear Power Inspectorate
STATENS KÄRNKRAFTINSPEKTIONSwedish Nuclear Power Inspectorate
ISSN 1104-1374ISRN SKI-R--97/5--SE
February 1997
Summary
SKI Report 97:5

SKI Report 97:5
Deep Repository Performance Assessment Project
Summary
February 1997

NORSTEDTS TRYCKERI AB Stockholm 1997

PREFACE
The Swedish Industry program for deep geological disposal of spent nuclear fuel and high-level radioactive waste is now in the early stages of the site selection process, with feasibility studies underway in 5 to 10 municipalities. According to the Swedish Nuclear Fuel and Waste Management Co., SKB (SKB RD&D Programme, 1995}, the ongoing siting process involves selection of two sites for surface-based investigations by around the year 1998, and submission of a licence application for detailed underground investigations and for commencement of construction of a deep repository, at one of these sites, in the first years the next century.
In preparation for upcoming reviews of licence applications, the Swedish Nuclear Power Inspectorate, SKI, has developed an independent expertise for conducting performance assessments. The foundation for SKI's capability was laid in SKI's previous performanceassessmentexercise, Project-90, published in 1991. SITE-94, which commenced in 1992, builds on the methodology developed in Project-90, but is focused on further development in specific areas, such as handling of site-specific data and analysis of systems and scenarios. The developments in SITE-94 have provided SKI with expertise and analysis tools that, with limited updating, can be applied as a regulatory tool in SKI's future work. This report summarises the results of the four-year SITE-94 programme.
The work with SITE-94 has involved staff members of the Office of Nuclear Waste at SKI, led by the office head, Soren Norrby, and a number of Swedish and foreign consultants. The SKI project group consisted of:
Johan Andersson 1
Bjom Dverstorp Fritz Kautsky Christina Lilja Rolf Sjoblom2
Benny Sundstrom Oivind Toverud Stig Wingefors
1) now at QuantiSci
(project manager 1992-1995; scenarios) (project manager 1995-1997; hydrogeology, data management) (geology, rock mechanics) (near-field radionuclide release and transport, canister) (canister) (far-field radionuclide transport, graphics) (disposal concept) (geochemistry, radionuclide chemistry, bentonite)
2) now at AF Energi Stockholm
For the project, a steering committee (within SKI) and an advisory expert group were formed. The members of the expert group were Mick Apted, Neil Chapman (QuantiSci) and Ghislain deMarsily (Universite de Paris).
A large number of external consultants, as cited throughout this report, have contributed to the successful completion of the project Karin Pers (Kemakta) assisted with near-field radionuclide release and transport calculations at SKI. The final report was written by the SKI project group, assisted by Neil Chapman and Joel Geier (Golder Associates/Clearwater Hardrock Consulting). Technical reviews of the manuscript by Timo Vieno (Technical Research Center of Finland) and Philip Maul (QuantiSci) helped greatly in the final editing of the report.
/ jom Dverstorp1 Project Manager


CONTENTS Page
1 INTRODUCTION 1
1.1 OBJECTIVES 1
L2 PRESENTATION OF SITE~94 2
2 THE PERFORMANCE ASSESSMENT METHODOLOGY 3
3 THE SITE AND THE DISPOSAL CONCEPT 11
4 SYSTEM DESCRIPTION: GEOLOGICAL EVALUATION OF THE ASPO SITE 15
4.1 GEOLOGICAL STRUCTURE MODEL 15
4.2 HYDROGEOLOGICAL MODELS 22 4.2.1 Regional Hydrogeological Setting 22 4.2.2 Uncertainties in the Site Characterisation Data 23 4.2.3 Simple Scoping Calculations 24 4.2.4 Qualitative Assessment of the SITE-94 Structural Model 24 4.2.5 Two Hydrogeological Models of Aspo 26
4.3 GEOCHEMICAL MODEL 29
4.4 ROCK MECHANICAL MODEL 31
5 SYSTEM DESCRIPTION: THE ENGINEERED BARRIER SYSTEM 35
5.1 THE CANISTER 35
5.2 THE BENTONITE BUFFER 36
5.3 BACKFILLS AND SEALS 36
6 SCENARIO IDENTIFICATION 39
6.1 PROCEDURE FOR GENERATING SCENARIOS 39
6.2 THE CENTRAL SCENARIO 41
7 MODELLING: EVOI .. UTION OF THE GEOSPHERE 43
7.1 FAR-FIELD ROCK MECHANICAL MODELLING 43
7.2 GROUNDWATER FLOW MODELLING 44
7.3 GEOCHEMICAL MODELLING 49

11
8 MODELLING: EVOLUTION OF THE NEAR-FIELD 51
8.1 NEAR-FIELD ROCK MODELLING 51 8.1.1 Mechanical Evolution 51 8.1.2 Hydrogeological Evolution 52 8.1.3 Geochemical Evolution 53
8.2 BUFFER, BACKFILL AND SEAL EVOLUTION 54
8.3 CANISTER EVOLUTION 54 8.3.1 Canister Failure 54 8.3.2 Chemical Conditions Inside a Failed Canister 55
8.4 DISSOLUTION OF THE FUEL 56
8.5 CHEMISTRY AND BEHAVIOUR OF RELEASED RADIONUCLIDES 56
9 MODELLING: RADIONUCLIDE TRANSPORT AND RELEASE 59
9.1 MOBILISATION AND RELEASE FROM THE NEAR-FIELD 59
9.2 TRANSPORT IN THE FAR-FIELD ROCK 61
9.3 NEAR AND FAR-FIELD SCOPING CALCULATIONS 61
9.4 RELEASES TO THE BIOSPHERE 62
10 CONSEQUENCE ANALYSIS: FORMULATING THE CALCULATION CASES 63
10.1 CLEARING HOUSE VARIANTS FOR THE REFERENCE CASE 63
10.2 COMBINJNG VARIANTS INTO REFERENCE CASE CALCULATION CASES 64
10.3 VARIANTS AND CASES FOR THE CENTRAL SCENARIO 64
11 CONSEQUENCE ANALYSIS: RESULTS 67
11.1 REFERENCE CASE 67
11.2 CENTRAL SCENARIO 77
11.3 THE FULL REPOSITORY: MULTIPLE CANISTER FAILURES 79
12 CONCLUSIONS 81
12.1 IMPLICATIONS FOR SAFETY ASSESSMENT 81 12.1.1 System Understanding 81 12.1.2 Key Aspects of Barrier Performance 81
12.2 IMPLICATIONS FOR SKI 84
APPENDIX! 87


I I I I I I I I I I I I I I I I I I I I I I I I I I I I I I I I I I I I I I I
I I I I I I I I I I I I I I I I I I I I
I I I I I I I I I I
I I I I I
I I
I I I I
I

1
1 INTRODUCTION SITE-94 is a comprehensive performance assessment exercise for a hypothetical repository for spent nuclear fuel at a real site in Sweden. It has been carried out to assist the Swedish Nuclear Power Inspectorate (SKI) in building its capabilities and extending its experience in performance assessment (P A) so that it will be in a better position to evaluate regulatory safety submissions on repository siting and design which it expects to be placed before it in the near future.
The project has run for three years, from August 1992 to 1995, with the final integration and reporting taking place during 1996. It follows closely upon Project-90, a PA exercise with broadly similar aims to develop expertise and knowledge, which was completed and published in 1991. Project-90 laid the foundations within SKI for carrying out independent PAs of spent fuel disposaL SITE-94 has built upon this base to further develop the capability and tools to enable SKI (the regulatory agency) to review fully the proposals for a deep repository which are expected to be made by the Swedish Nuclear Fuel and Waste Management Company, SKB (the implementor, or disposal agency).
The P A exercise is aimed primarily at one aspect of the upcoming, site selection stage of repository development, where comparisons of different sites must be made and choices justified on the basis of evaluation of geological observations from surface-based activities such as mapping and borehole drilling. Consequently, SITE-94 pays much attention to assimilating geological information into a structured P A methodology and to assessing the inherent uncertainties in the whole P A process. It does not address broader site selection issues.
To achieve the link between site data and PA, SITE-94 uses the complete spectrum of geological data available from a real site, Aspo, in south-central Sweden and introduces into this a small, hypothetical repository and engineered barrier system, the designs for which are essentially little changed from the well-known 1983 'KBS-3' proposals. The data from Aspo arose as a result of the development by SKB of the Hard Rock Laboratory at the site and, in this respect, they do not represent exactly the type of information that might be available from a potential repository site investigation programme. However, they are regarded as being closely analogous in scope, quantity and quality. SKI has reinterpreted much of the information made available to it by courtesy of SKB.
It should be noted that there is no intention to build such a repository at Aspo and that it is not the objective of SITE-94 to evaluate quantitatively the radiological safety of either the disposal concept itself or of a repository at a site such as Aspo.
1.1 OBJECTIVES
Apart from building skills within SKI and facilitating the provision of advice to SKB, three main objectives act as the focus for SITE-94:
'" Determination of how site-specific data can be assimilated into a P A and how the uncertainties inherent in site characterisation can affect the results of P A. This

2
involves improving the traceability of site-specific information management, the testing of means for handling data and conceptual model uncertainty and the integration of geological, hydrogeological and geochemical data into the PA in a consistent fashion.
" The development and testing of a P A methodology which adopts a rigorous systems approach which can be used to develop scenarios of system evolution and tackle associated uncertainties. The approach allows traceability of information, decisions and P A activities in a way that can eventually be used as a basis for P A quality assurance. Four types of uncertainty are identified in the project and the P A methodology is designed to address each individually:
system uncertainty scenario uncertainty conceptual model uncertainty parameter uncertainty
.. Identification and analysis of mechanisms which influence the integrity of waste canisters and their consequent lifetimes and failure rates, the importance of which was highlighted by the Project-90 study.
1.2 PRESENTATION OF SITE-94
The project is reported in an extensive main report and a series of topical reports on specific items of work. The main report, of which this is the Summary, is a detailed and comprehensive presentation of all the work carried out in the project and is effectively a 'stand-alone' document In this respect, it acts as the only presentation of some areas of the project, such as the principal P A consequence analyses. This summary presents, in outline, the main logical strand of the project It does not cover many of the additional threads and arguments developed within the main report.
The PA methodology, partly developed in the project, defines four main sectors of work, or analysis levels, whose application in a P A for an actual repository proposal would be largely sequential, with iterations to allow feedback from scoping calculations and sensitivity studies:
" System Identification or Definition " Scenario Identification • Modelling the Repository Evolution .. Consequence Analysis.
Within SITE-94, the four analysis levels were, in fact, worked upon in parallel, although both the main report and this summary are presented using this structure as a logical progression, as would be the case when a P A is done for the first time. The underlying P A methodology upon which this structure is based is described first.

3
2 THE PERFORMANCE ASSESSMENT METHODOLOGY
The PA methodology is based upon the 'systems approach' whereby the boundary and contents of the repository, geosphere and biosphere components of the 'disposal system' are clearly identified and the features, events and processes which control its evolution are linked and managed within the P A in a logical and orderly fashion. One aim of this approach is to provide a transparent and traceable means of recording all PA activities, decisions and uncertainties so that the analyses and results of the assessment can be further developed or evaluated in the future and be repeated or modified as a result of new data, better understanding or different PA objectives. Once set up, any future assessment of a similar concept which uses this methodology can be repeated with considerably less effort.
Analysis Level! involves system identification or definition. First, it is necessary to set a clear system boundary, otherwise it becomes necessary to model processes on a global, even cosmic scale (e.g. orbital forcing of the Earth's climate) within the PA itself. In SITE-94 this boundary is set at the interface between the geosphere and biosphere. Within the Process System so defined are the repository and the engineered barriers and all the processes affecting radionuclide transport through the rock. The system boundaries do not always coincide with those of the models used to explore system behaviour, as many of these only examine sub-sets of the system and the modellers must choose their own boundaries within the system. Outside the system are all biosphere processes implicated in potential radiation exposures, all natural tectonic and climatic forces driving the behaviour of the system and all influences of people on the system. The biosphere is managed in the assessment by treating it as a variable receptor for releases from the disposal system. Natural and anthropogenic mechanisms which might drive system evolution are treated as external forces and are used to construct scenarios, as discussed below.
The Process System (which was originally defined in Project-90) is represented in SITE-94 by means of a Process Influence Diagram (PID) which contains all relevant features, events and processes (FEPs) which could affect the behaviour of a repository, identified during an extensive FEP audit carried out at the start of the project and based on a study of all available international FEP lists (see Figure 2.1 ). FEPs either fall within the process system or are classed as external FEPs (EFEPs) which lie outside the system but can act upon it. The PID comprises boxes, representing FEPs ( 161 in total in the general version of the diagram) and influences, shown as lines connecting FEP boxes (668 in all) and representing the interaction of one FEP with another.

Figure 2.1 A section of the SITE-94 Process Influence Diagram (PID), showing FEPs and influences.
• IL =<6
• IL =6
IL =8
• IL =10
• IL = 10, EFEPs

5
The development of the PID allows the application of a method for treatment of the first type of uncertainty mentioned above; system uncertainty, which reflects the fact that the nature and content of the system in terms of PEPs, their influences the relative importance of these, is only partially known. A methodology is presented which allows expert judgement on the importance of FEPs and influences in an assessment to be classified quantitatively. This allows the production of different levels of the PID, reflecting different degrees of confidence ('importance levels') in the extent to which they can be used to analyse and describe the system. Each level of the PID has the same structure, but FEPs and influences will be progressively omitted with increasing importance level of the PID. Different levels of the complete PID might be appropriate to suit different P A objectives.
Analysis Level2 of the P A methodology involves scenario identification. Having defined the system and the FEPs which it contains and those which are outside the system (EFEPs), the next step is to identify ways in which it might evolve with time after repository closure. Initially, a Design Basis was established, whereby certain potential properties or states of the system were incorporated in the initial system description. These included an allowance for early canister failure and an assumption of immediate resaturation of the bentonite buffer. Other aspects of design, which might be evaluated in a regulatory submission, include potential deviations of the system from the design basis. These are not analysed in SITE-94.
Armed with the system description and the design basis assumptions, the next stage is to define a Reference Case which will be used as the backbone of most of the subsequent consequence analysis. The Reference Case addresses what might be called the 'internal' evolution of the system, unaffected by EFEPs which modify system boundary conditions. It is not regarded as a scenario in its own right, as this evolution of the system, unmodified by time dependent external processes, is clearly not a likely 'future' for the system. By means of a set of variants it is used to explore conceptual model uncertainty (in the way that processes within the system might be described) and parameter uncertainty which also includes an assessment of variability in properties. The Reference Case description is founded on the comprehensive PID described earlier.
Among the EFEPs outside the process system are various obvious groupings. One of these includes FEPs associated with future climate change. Unlike other EFEPs, which may or may not influence the system (events simply may not happen), climate change is inevitable. Although the exact nature and timing of this change is uncertain, there is sufficient consensus as to general trends to be able to construct a broadly credible picture of the future climate of Sweden. In SITE-94, this is used to construct a time sequence of states of the surface environment at Aspo over a period of 130 ka which can be used as the basis for time-dependent modelling of a Central Scenario. This is built upon the Reference Case description, superimposing the impacts of the given climate sequence, which involves repeated periods of glaciation, sea-level change and permafrost. In the systems analysis approach used, the Central Scenario is also represented by its own PID; essentially that for the Reference Case, with climate associated EFEPs attached to it and their impacts propagated through it.
The remaining EFEPs are then evaluated, screened, grouped and converted into a set of Supplementary Scenarios whose impacts can be superimposed on the Central Scenario at various times in the future in order to evaluate potential radiological consequences.

6
SITE-94 gave much consideration to the meaning and application of these scenarios, debating the value of probabilistic treatment and the way in which the consequence results should be viewed. In the event, these Supplementary Scenarios were not analysed quantitatively in the project, but an argument was developed viewing them separately from the mainstream consequence analysis of the Reference Case and 'inevitable' Central Scenario. The view was taken that they should be regarded as illustrations to assist decision makers, and that comparison of their results with regulatory targets should only be done with circumspection. It is anticipated that more consideration will be given to this issue in the future.
The process of generating the various scenarios described above and accounting for all the EFEPs identified in various combinations and applied at various times, forms a mechanism for addressing the fourth type of uncertainty mentioned earlier, scenario uncertainty. A broad enough group of Supplementary Scenarios allows the main impacts on the system in terms of the envelope of possible futures to be tested in a 'top-down' or 'outside-in' fashion. Originally, SITE-94 also intended to evaluate the inverse approach, whereby possible future states of the system would be generated from within and the possible causes for these states identified in terms of external events; a form of 'bottom-up' or 'inside-out' analysis. However, in the event, this was not carried out within the project.
Analysis Level 3 of the P A methodology concerns development of models for the behaviour of the different parts of the repository system and modelling their future evolution. Given the existence of both conceptual model and parameter uncertainty, as well as system uncertainty, the modelling would clearly have to cope with a variety of ways of addressing the same issues and processes and use variants which reflect data variability and uncertainty. This involves data management and selection and the evaluation of alternatives in many technical areas, all of which involves decision making. A formal procedure was required for incorporating all of the knowledge and information included in the PID into the modelling. SITE-94 has thus developed the Assessment Model Flowchart concept. The AMF is a graphical relational database which contains information sources, models and Clearing Houses (see Figure 2.2). The latter are groups of individuals charged with carrying out specific areas of modelling; say in geochemistry or ground water flow. The AMF shows graphically the information flows that take place during the modelling work and identifies clearly the requirements for interactions among the different disciplines and modelling groups working on the P A. All of the PEPs and influences in the PID are mapped onto the AMF which ensures that some group is charged with the responsibility of addressing every issue in system evolution.
Analysis Level 4 of the P A methodology involves carrying out the actual consequence analysis calculations. This is based upon variants and calculation cases for the Reference Case and the Central Scenario, with the Reference Case being used largely to explore system, conceptual model and parameter uncertainty and the Central Scenario being used (in conjunction with the Supplementary Scenarios) to explore scenario uncertainty. Thus, most of the consequence analysis is focussed on Reference Case variants. Again, the AMF features centrally in the consequence analyses, being used to identify the necessary information flows and, within the Clearing Houses, to define the strategy for developing calculation cases. In this way, the AMF and its components act as an important Quality Assurance tool in SITE-94.

7
Within the four analysis levels in the P A, versions of the PID and the AMF have to be prepared which are specific to each scenario. Thus, the basic versions of each apply to the Reference Case, there is another for the Central Scenario and, in principle, one for each Supplementary Scenario, although, as noted earlier, these were not analysed within the project.
It is important to ensure that the main types of uncertainty present at each analysis level are identified and that the uncertainties are then propagated through the assessment. The various uncertainties arising at each analysis level of SITE-94 are shown in Figure 2.3.

8
Figure 2.2 A section of the SITE-94 Assessment Model Flowchart, showing Clearing Houses, Data Sources, Models and information transfer links.

9

10
Analysis levels Principal Uncertainties ........,
System Identification Level ® Completeness .... • Strength of Influences
System Boundaries and PlD - • Structure & Content • Boundaries
'~ ' V
Scenario Identification Level • Completeness
EFEPs and Scenario ""' • Combination of EFEPs - • Probability of Occurrence Screening and Selection • Times & Frequencies of Occurrence ,,
'~ Modelling Level
-""' • Alternative Conceptual Models
Model Selection for - e Verification
Performance Assessment • Validation
' r ' ~ Consequence Analysis Level • Parameter Values "" Parameter Selection - • Parameter Distributions
• Spatial Variability
Figure 2.3 Schematic illustration of the identification and propagation of uncertainties through the four analysis levels of SITE-94.

11
3 THE SITE AND THE DISPOSAL CONCEPT
The disposal system analysed is the well-known model presented by SKB in 1983 as the KBS-3 concept. Spent-fuel from the 12 nuclear power reactors in Sweden up to an assumed phase-out date of 2010, is taken to amount to about 6800 tonnes of uranium, assuming a relatively high bum-up rate. In the KBS-3 concept, as further developed by SKB, this fuel will be placed in copper-steel canisters, each containing about 1600 kg of initial heavy metal. The outer copper container provides corrosion resistance and the inner steel container provides mechanical strength. At the time of completion of SITE-94 there were still many outstanding issues regarding the final specification of the canister. In the site analysis for Aspo, discussed later, the hypothetical repository modelled in SITE-94 is geologically limited in size such that it has a maximum content of about 400 canisters, rather than the estimated 4300 from the full nuclear power programme. The consequence analyses for SITE-94 are restricted to analysing releases from a single canister because, given the development stage of the canister, it was not considered meaningful to provide estimates of the number of failed canisters at any particular time in the future.
The waste canisters are disposed of in individual deposition boreholes drilled from the floors of tunnels in the repository, which is situated at about 500 m depth in granitic basement rocks. Canisters are surrounded by highly-compacted bentonite, whose principal functions are to provide mechanical protection to the containers, act as a barrier to reduce groundwater flow around them and ensure that the transport of corrodents into the container and radionuclides out from the container is dominated by a slow process of diffusion.
The repository tunnels are backfilled with a sand-bentonite or bentonite-crushed rock mixture and concrete or bentonite seals are emplaced strategically in tunnels and shafts.
For the purposes of SITE-94 the hypothetical repository described above is assumed to be situated beneath the small, elevation (13 m) island of Aspo, close to the Oskarshamn nuclear power station on the east coast of Sweden, about 330 km south of Stockholm (Figure 3.1). The reason for the selection of this site is the large amount of geological site characterisation data available as a result of the development of the Aspo Hard Rock Laboratory (HRL) by SKB. Given the objectives of SITE-94, this database provides an essential starting point for evaluating how to assimilate site data into a performance assessment.
Although much information now exists on the geology of Aspo from direct underground observations in the HRL excavations, none of this is used in SITE-94. In order to be as closely analogous as possible to the data available in a site-selection stage, only 'surfacebased' infomtation (i.e. including boreholes from the surface) from the early (1986-1990) phases of investigation are used. During this preliminary stage of site selection, geological data from a site would be used to define a specific location for the potential repository, plan the layout of the repository facilities and provide a basis for a preliminary, site-specific P A. It should be noted that the latter objective was not one of those underlying the HRL site investigations and that the requirements of the HRL may have led to concentration of investigations on specific features of the site. Nevertheless, the data obtained are considered closely analogous to those expected from future investigations of a potential repository site bySKB.

12
w
* Figure 3.1 The location of Aspo island on the south east coast of Sweden. The inset map also shows a projection to the surface of the access tunnel and excavations for SKB's Hard Rock Laboratory (SKB, 1996).
The database available to SKI, by courtesy of SKB, is extensive, and includes the results from remote sensing, regional and local scale geophysics, geological mapping at regional and local scales, comprehensive core logging, hydrogeological and hydrochemical data from 14 deep boreholes and many shallow boreholes on Aspo and some boreholes on A vro and the mainland, in situ stress measurements and laboratory geomechanical tests. The hydrogeological data include the results of single hole and crosshole hydraulic tests and a 3D convergent tracer test. An initial task in SITE-94 was to carry out a critical review of the hydrogeological data in order to identify uncertainties and potential sources of error arising from the measurement techniques used.
The geological data available for the Aspo site resided largely in the GEOT AB database held by SKB. In addition, SITE-94 makes use of a certain amount of generic data where no sitespecific information is available. The need to incorporate some generic data is considered to be an inevitable aspect of any assessment Use of the GEOT AB database has enabled SKI to make useful comments on the way in which data are recorded, the types of data recorded and on data associations, with respect to their eventual utility in a P A, particularly from the quality assurance perspective. These observations concern documentation, recording of positional information, the value obtained from different geochemical sampling procedures, geological nomenclature and geological logging procedures. Part of the data evaluation in SITE-94 included the complete re-evaluation of borehole hydraulic test data. A conclusion of the data evaluation is that, unless careful thought is given to the way in which data are obtained and recorded, they may be difficult to use in a subsequent P A and may give rise to unnecessary uncertainties in the assessment. A consequence of this is the potential underutilisation of information which has been difficult and expensive to obtain.

13
One should note that SKB's surface-based investigations of Aspo were focussed on the construction of a research facility, not an actual repository. Furthermore, because the data were gathered mainly in the period 1986-1990, some of the data that were available to SITE-94 are not representative of SKB's current site characterisation capabilities.


15
4 SYSTEM DESCRIPTION: GEOLOGICAL EVALUATION OF THE ASPO SITE
Evaluating all the aspects of site geology, hydrogeology and geochemistry so that they could be modelled and incorporated in the P A in an appropriate manner occupied the largest part of the effort in SITE-94 and addressed the principal objective of the project.
The approach taken to this major exercise was to have four groups of investigators working in parallel on the main sets of site characterisation data:
" geological structure • hydrogeology • geochemistry • rock mechanics.
Each group evaluated the data in detail and produced one or more models of that aspect of the site which could be used to explain present-day conditions and predict future evolution. For some features and processes, alternative conceptual models had to be developed and these then had to be fitted to or calibrated with the data. The consistency of these various models was then checked across the groups. Such consistency checks are an essential part of a site evaluation and a full PA would require further iterations between different investigators and model developers than was possible in SITE-94.
4.1 GEOLOGICAL STRUCTURE MODEL
The geological structure model is intended to provide the basic geological framework for the understanding of the site features and properties. In both the PA and siting design work for a potential repository, a common baseline geological model will be required for every aspect of development work. The model was built using surface and borehole geological data, using only primary, unprocessed (uninterpreted) information as far as possible. In the event, most data were found to exist in the database only in processed form.
The model building approach involved three steps:
• Literature studies to determine the types of structure likely to be encountered.
• Definition of structural setting at regional (35 x 25 km), subregional (10 x 12 km) and local (2 x 2 km) scales and production of 2D structure and fracture models.
.. Detailed 3D model development for the local scale (2 x 2 x 1 km deep), which includes the whole of Aspo island. This is the ultimate objective of the study and comprises the baseline model mentioned above.
The bedrock in the region of Aspo comprises metasediments, metavolcanics and granitoids, intruded by granites and other igneous intrusions which all form part of the TransScandinavian Igneous Belt, a suite of rocks between 1650-1810 M a old. Aspo island itself is dominantly formed of foliated granitoids (76% of borehole core length), intruded by aplite dykes (15% ), which are hydrogeologically significant features, with greenstones

16
6375
1530 1550
Smaland g raniles , TlB
Alleraled fine -grained, D intermediate, ig neous
rocks, Tl8
Greenslone <melabasalll, TIB
Svecokarelian rocks, - aneiss in the south and
melasedimenl and graniloids in the north .
Baltic Sea
0
N
5km
N
t ~ Topographic con:~~ tour intervals, 5 m '-roo
Figure 4.1 The geology and topography of the Aspo area.

17
forming the remaining 9% of the rock. The two main granitoid rocks are the Sma.land granite and the Aspo diorite. Figure 4.1 shows the geology and topography of the Aspo area.
An important activity in production of the models involved lineament and fracture mapping and the definition of seven fracture families (based on fracture style and orientation) and intervening rock blocks. This was assisted by the development of a thorough understanding of the geological history of the area. As is usual in such detailed exercises, the analysis led to re-interpretation of the existing geological map of the area.
Production of the 3D local-scale model (see Figure 4.2) involved combining the 2D structural maps with sub-surface information into a database which correlates 52 identified fracture zones with 40 observational parameters. Criteria had to be set up in order to control how data were interpolated or extrapolated into regions where there are no observations. At a potential repository site, this detailed model would be verified by the collection of additional data in further boreholes and in excavations. With the exception of a simple, but successful comparison with 'unused' vertical seismic profile data, this has not been done in SITE-94, but it is intended to carry out such an exercise in the future, using data from the HRL.

18
~ ~ "' ~ "' g 0 SKI model 0 0 8 0 0
8500 8500
Fracture zones at Aspb surface
u Asp<:; contour at surface
8000 8000
7500
N 7000 7000
6500 +'-------"--""'T-----"-.L---"""'1'---"'---"---U.......,,.-"'---'--"------=,._+ 6500 0 § § § g ~
500m
SKI model Fracture zones 1-52
Fracture zones viewed from south-west , 30" above the horizon
Figure 4.2 The 2D local scale structural map of Asp6 produced in SITE-94 and the 3D local scale model developed from it and the various sources of underground data.

19
It is recognised that different groups of interpreters are likely to produce models which diverge in some aspects. A close correlation between the models produced by different experts would indicate a high level of confidence in the basic modeL Significant differences would indicate issues which need to be further evaluated. SITE~94 made a comparison of the model produced by SKI's own expert group and two existing models, produced by SKB prior to construction of the HRL and by SKN, the former National Board for Spent Nuclear Fuel (Figure 4.3). The use of interactive 3D geological visualisation software proved to be a powerful way of evaluating the three models.
Comparison of structural models of Aspo
SKI SKB SKN NE trending fracture zones
ENE trending fracture zones
NNW tr·ending fracture zones
I~
Figure 4.3 Comparison of the SKI SITE-94, SKB and SKN structural models of AspiJ.

20
The main structural features of the site correspond within each of the models, although the level of internal detail in some of the larger structures varies, as does the width with which they are represented. Owing to the more intensive use of 3D visualisation techniques, the SKI model was able to include a much greater number of fractures. Where differences exist, they are due to different terminologies used to describe and include features and the different methodologies applied in the interpretation, especially in the means of extrapolating data.
Discussion of the differences between interpretations leads into the aspects of model uncertainty represented in the structural model description of the site. The uncertainties evaluated in SITE-94 were those associated with geometry (structure orientations) and volume (spatial location of structures). Parameter uncertainty is represented in the variable descriptions and level of detail, from one part of the site to another, fracture size, internal structure and infillings. Two tests were carried out to evaluate the approximations by which uncertainty is introduced into the model; comparison of the 3D structural model with mapped sections of crushed rock and with indications of ground water flow in fractures. The SITE-94 structural model uses the presence of zones of crushed rock, identified by geological and geophysical means, as a key input. Since 34% of groundwater inflows are not associated with such zones, the hydrogeological model, if based solely on this baseline, would not include a large proportion of hydraulically significant features.
A further test was aimed at determining whether the system of boreholes could introduce bias into the model by failing to detect certain sets of fractures with particular orientations. It was concluded that the boreholes do detect preferentially certain groups of fractures whilst sampling others rather poorly. Sub-vertical fractures are well-known to be easily missed in boreholes from the surface, but even within this group of fractures, there was a further preference to sample some orientations better than others.
A final part of the structural modelling involved fitting the hypothetical repository into the available rock volume beneath Aspo, as indicated by the 3D model configuration. Two possible rock volumes were identified where it would be possible to site a reduced size repository, comprising parallel disposal tunnels situated on the same level at 500 m depth and two shafts, separated by 100 m from the repository and 300 m apart. Tunnel orientation was predicated on being parallel to the maximum principal stress direction. The low hydraulic gradient was not influential in repository layout.
The repository layout chosen is bounded by six fracture zones, with a further ten running through it, one of which is >10 m wide (Figure 4.4). With no 'respect distance' between disposal tunnels and the bounding fracture zones, it is possible to locate about 380 waste containers in the repository. If a 10 m respect distance is used, only 160 containers could be emplaced. Using the 100 m respect distance suggested in the KBS-3 study of SKB would preclude Aspo from being a repository site. Because the SKB and SKN structural models contain less fractures, it would be possible to place a slightly larger repository within their confines.

21
7100
7300
?200
7000
6900
7600
?400
SKI model Zones affecting the repository layout <-500 ml
jj~~~
~:':'~'::' Deposition drift with canister positions
J { Asp!S contour Tooo ~/ at surface
N
1 250m
Figure 4.4 Location and layout of the SITE-94 hypothetical repository based on the structural model, showing a 3D view of the location with respect to the island and the plan at the -500m level.

22
The above discussion highlights an important siting issue. Aspo is a relatively highly fractured site and, although suitable for a HRL, it is unsuitable for a repository if current respect distance guidelines are applied. However, these are acknowledged to be conceptual and arbitrary in nature and there is clearly a need for considering more appropriate constraints and guidelines based on a better quantitative evaluation of the impact of respect distance on the results of a detailed P A
The results of the structural model development work were used in SITE-94 to develop a set of recommendations for site characterisation programme design and data management.
4.2 HYDROGEOLOGICAL MODELS
The hydrogeological evaluation of Aspo was aimed at developing both a general understanding of ground water flow at the site and at developing quantitative models which are consistent with the site data and which can be used for predicting future hydrogeological conditions for the P A work. Model development involved both calibration of models with data and validation against other infonnation to ensure consistency with knowledge of the site. Although it is important to ensure the models developed are consistent with rock mechanical data (see later), no work was perfonned to incorporate the influence of rock mechanics on the hydrogeology.
The approach adopted to evaluating the large quantity of data available involved the following steps:
" Assessment of the hydrological setting and regional hydrogeological modelling.
Assessment of uncertainties in the site characterisation data.
Simple scoping calculations on key aspects of system behaviour.
Qualitative hydrogeological assessment of the SITE-94 structural model, including an integrated interpretation of all relevant site data.
Development and interpretation of alternative quantitative hydrogeological models.
These steps are outlined below.
4.2.1 Regional Hydrogeological Setting
The low-relief, fractured bedrock of Aspo is situated in a coastal location and has average annual recharge of about 185 mm, mostly as snow melt In common with most low-lying areas of crystalline bedrock in Scandinavia, the water table is practically coincident with the surface. The shallow surrounding waters of the Baltic Sea are not thought to have any hydrological impact on groundwaters beneath the island and there is a shallow freshwater lens present on Aspo.

23
The coastal region around Aspo is the location for major discharges, via transmissive fracture zones, of deep groundwaters from a regional flow pattern which involves recharge in the south Swedish highlands. These discharges are thought to occur largely in the immediate offshore zone, but it is possible that some may occur on Aspo itself and whether the island is a regional discharge area or a local recharge area is not certain. However, old brines from deep regional fluxes in the shield rocks are found at shallow depths in the area and there is ample hydrochemical evidence of the regional discharge character of the area in several deep boreholes.
The site has been subject to a complex history of repeated ice cover and marine incursions over the last million years or so. Each change in surface conditions has brought modifications to the shallow and, to some extent, the deeper groundwaters at Aspo. In general, the deepest waters are shield brines mixed with various proportions of meteoric waters recharged further inland, whilst the shallower waters show evidence of some subglacial recharge content, although being dominated by recent local recharge.
There is no evidence of natural, well-defined local boundaries to flow in the area and groundwater flow is considered to be part of a larger regional pattern. Consequently the first 2D regional model erected looked at a very large scale; a 10 km deep section running from Norway, across Sweden, to the southern shores of the Baltic Sea in Poland. The flow of a variable density groundwater and the transport of solutes were modelled using the SUTRA code, taking account of variations in fluid density and viscosity due to temperature, pressure and concentration gradients and the effect of topographic gradients and fluid-density imbalances. This model simulated the formation of deep shield brines and illustrated the long-distance nature of regional flows in the shield, together with the tendency for discharge at the coast.
A 2D semi-regional to local scale (7 x 1.6 km) model of flow was constructed, containing six of the main vertical fracture zones and a further three as variants, one of which looked at the presence of a high conductivity sub-horizontal fracture at a depth of 600 m. The model suggests strong local control on recharge and discharge by both local topography and the vertical fractures, with discharge of waters that pass through the repository volume occurring via fracture zones cropping out in the strait to the SE of Aspo. Fluxes at greater depth are near horizontal and controlled by the regional flow pattern. The high conductivity sub-horizontal zone has little impact on discharges.
The regional simulations suggest that the depth of penetration of the local flow system into the deeper, regional flux depends on permeability anisotropy. The repository may intercept waters from both flow regimes, or mixtures of the two. The dominance of upwards flow and regional discharge in the site area is a common finding of each simulation and variant, although the more localised the scale of the model, the steeper and, hence, shorter are the predicted flowpaths from the repository.
4.2.2 Uncertainties in the Site Characterisation Data
A complete re-evaluation of the transient flow data from packer tests in the Aspo boreholes was carried out in order to estimate uncertainties which arise from different assumptions made in alternative interpretations of such tests. The basis of the evaluation was a corn-

24
parison between classical test interpretations made by SKB and the use of the Barker Generalised Radial Flow (GRF) model. It was found that the two approaches give hydraulic conductivity values which vary by several orders of magnitude, with the GRF model giving the higher values.
A second assessment of uncertainties involved a multivariate analysis of hydraulic conductivity (K) data for boreholes to evaluate the statistical correlation with fracturing and other borehole geophysical logging parameters. The extent to which hydraulic conductivity values could be simulated on a site scale using surrogate parameters drawn from these correlations was also considered. Spatial autocorrelation of all variables is very weak and the ability of geophysical parameters to predict K is poor. Only one successful correlation exercise was carried out, using small-scale (3 m borehole length tests) data and this simply highlighted the overwhelming importance of fracturing (represented by fracture log and the presence of aplites and other rock-type discontinuities) in controlling K. This finding supports the later use of a Discrete Feature Model as the mainstay of the detailed, site scale hydrogeological modelling (see Section 4.2.5).
4.2.3 Simple Scoping Calculations
A 1-D evaluation of flow, using simple assumptions on flow-field structure and boundary conditions, was used to identify critical factors for determining groundwater flow and transport parameters. The connectivity and spatial structure of K are key uncertainties in determining flow, and the pore geometry within conductive fractures is a key uncertainty in determining radionuclide transport. This finding was an important motivation for evaluating site hydrogeology using alternative conceptual models. The results of this simple assessment are returned to later in this summary.
4.2.4 Qualitative Assessment of the SITE6 94 Structural Model
A useful qualitative picture of groundwaters in the upper kilometre of rock at Aspo was built up by the integrated consideration of a wide variety of hydrogeological, structural and geochemical data, pieced together with the aid of a 3D geological visualisation package. This involved the following steps:
• incorporation of the structural model described earlier into the visualisation system
• evaluation of the structural model in terms of its ability to describe flow zone locations at depth and paths of pressure propagation
" comparison of the structural model with the subsurface distribution of geochemical water types to determine whether the structures explain the location of distinct bodies of water or chemically uniform flowpaths.
The early use of hydro geological and geochemical data to build the structural model was avoided so as to allow these data to be used as an independent check on the structural model.

25
119 flow locations in boreholes were correlated with geophysical logs, rock type and zones of fracturing/crushing. Good correlations were found with natural gamma, single-point resistivity, borehole radar and sonic logs and with crush zones aplites. Correlations with crushed zones in other rock types and with fracture density are present but weaker. There is no significant correlation with rock type and flow structures are thus uniformly distributed throughout the rock types. Two thirds of flow occurs in crushed zones, with the remainder occurring in discrete fractures.
Statistical tests were set up to check the spatial correlation of flow indications in boreholes with structures in the model. Of the 52 structures in the SITE-94 structural model, seven show no indications of flow, and a further 11 are not intersected by boreholes. However, 54% of flow indications are not explained by the structures in the model. The results are thus considered neither to confirm nor contradict the correctness of the structural model. A similar test using pressure propagation pathways from cross-hole hydraulic tests gave much better spatial correlations between the sparse number of pathways identified and the structures in the model, with 30 structures found to transmit pressure.
The hydrochemical evaluation (Section 4.3) identified five water types present beneath Aspo, based on their chemical and isotopic characteristics, reflecting mixtures of the deepsourced discharge, meteoric, glacial and seawater recharge origins described earlier. No single structures separate large regions of one type of water from another and the distribution of waters can only be explained by the participation of many structures in flow. Within any given borehole, individual structures appear to contain different water types, but this does not extrapolate into 3D and any structure can contain more than one type of water, meaning that flow is non-uniform or segregated within individual structures.
Overall, the flow system beneath Aspo appears to be complex, not dominated by any particular structure, with groundwater movement occurring in hydraulically well-connected structures which respond in a planar fashion to changes in groundwater head. There is evidence of neither uniforrn flow within any structure, nor of long-distance flow pathways within a given structure. Although much of the flow regime can be explained by the structural model, it is important to realise that over half of the flow does not correlate with the model. This means that the site characterisation methodology, techniques or scale of observations were unable to detect, or simply missed, many flowing structures. However, it is recognised that any attempt to characterise such a volume of rock would inevitably be incomplete.
The principal conclusions at this stage of the evaluation are thus that the stmcture model contains a considerable number of structures which make up ground water flow paths, there is significant uncertainty regarding which of these actually account for flow and there is a significant amount of flow which cannot be explained by features in the structure model. A detailed flow model would thus need to include flow paths below the scale of the structures identified and this was addressed by formulating two conceptually different approaches, involving a Discrete Feature Model and a Stochastic Continuum Model, described below.

26
4.2.5 Two Hydrogeological Models of Aspo
Two types of hydrogeological model of Aspo were constructed:
1. Discrete Feature Site Model 2. Stochastic Continuum Site Model
The integrated Discrete Feature Site Model incorporates a separate Discrete Fracture Network (DFN) model of the repository block at its centre.
The Discrete Feature Model is a 5 x 5 x 1 km representation of conductive structures at Aspo as a collection of discrete, planar, transmissive features which interconnect to form a 3D network (Figure 4.5). Hydraulic head and flow within the network is governed by the 2D flow equation within each structure and by continuity of head and conservation of mass at feature intersections. Transport is governed by conservation of mass and perfect mixing at intersections and is modelled using the advection-dispersion equation.
Figure 4.5 Domain of the SITE-94 Discrete Feature model in a 5 x 5 x 1 km block. The dips of the fracture zones are schematic. The island of Asp6 can be seen at the centre of the domain.

27
The features used in the model include single fractures, fracture zones, directional conductivity of the rock mass and the excavation damaged zone (EDZ) around repository tunnels. The model was constructed deterministically from the SITE-94 structural model, using both semi-regional structures and the site scale structures in the 2 x 2 x 1 km region of the detailed structural model. 127 borehole sections are included in the model, which is calibrated with infiltration rates, observed head distributions and drawdowns in cross-hole tests (Figure 4.6).
OWG0161
Horizontal section through vicinity of the repository (Z = -495 m)
"" eso Oil)
Hydraulic Head in Cross Sections
greater than 7 m 6to7m 5 to 6 m 4 to 5 m 3 to 4 m 2 to 3 m 1 to 2 m 0 to 1 m less than 0 m, or hydraulically isolated
Darcy Velocity through Cross Section Horizontal section (Z = -495 m)
I Magnitude of vector:
--·--· 3x1 o-9 m/s -9
! _ ___... 1 x1 0 m/s
-10
/ 3x10 m/s
I -10 ,/ 1x10 m/s
Vertical component:
more than169m/s
"E 10-10 to 10-9m/s
~ 10-11 to 1d"10 m/s g. less than 10-11m/s
Figure 4.6 Results of the Discrete Feature modelling, showing hydraulic heads in .fracture zones along two vertical and one horizontal cross sections (and a local horizontal section around the hypothetical repository zone), together with Darcy velocities within fractures in the plane of the horizontal section.

28
An integrated Discrete Feature Model is constructed by nesting a smaller ( 450 x 320 x 80m) DFN model of the repository block within the larger-scale model just described (Figure 4.7). This stochastic DFN model has two variants representing the two dominant rock types at Aspo, the Smaland granite and the Aspo diorite.
The Stochastic Continuum Site Model treats the rock as an equivalent porous continuum which is completely hydraulically connected. It generates conditioned stochastic realisations of the 3D hydraulic conductivity field using only K values interpreted from borehole packer tests and the model is not calibrated on any other site data. The model, which simulates a smaller block ofrock than the Discrete Feature Site Model (500 x 700 x 600 m) is used to estimate effective hydraulic parameters, including near and far-field Darcy velocities and far-field dispersion. Unlike the Discrete Feature Model, it is conditioned to represent directly the actual location and values of K measured in the field and it consequently captures important characteristics of hydraulic cross-hole tests.
Figure 4. 7 Schematic illustration of the integrated Discrete Feature model used for P A purposes, with a nested Discrete Fracture Network model of individual fractures at the canister deposition hole scale.

29
An important property of a stochastic continuum model is the spatial correlation of the hydraulic conductivity. As stated earlier, statistical tests along boreholes did not reveal any significant spatial correlations, but such an analysis could be flawed if the main correlations occur along the plane of the fractures. The statistical tests applied would be insensitive to such features, despite their significance for the potential formation of interconnected flowpaths. In order to account for these uncertainties, different correlation structures were applied using the indicator simulation method, where some assumed long-range correlation in 2D for high conductivity values (thus mimicking 'fracture zones') and others assumed isotropic and relatively short correlation distances.
4.3 GEOCHEMICAL MODEL
Evaluation of the geochemical characteristics of the site is based on data on rock mineralogy, groundwater chemistry and fracture surface coatings which, together allow a model of rock-water interactions to be constructed. Because transport properties of the Aspo rocks were not investigated as part of the site characterisation for the HRL, data on porosity and matrix diffusivity have to be estimated, although redox capacity data for the bulk rock were available.
Both groundwater chemistry and radionuclide transport are controlled, in the first instance, by interaction with fracture surface coatings. In this context, hematite, illite/srnectite clays, goethite, pyrite and calcite are among the important mineral and amorphous species present in the fractures. Both goethite and calcite are strongly correlated with groundwater flow zones. Goethite occurs in conductive zones down to at least 1000 m, possibly indicating deep penetration of oxidising glacial waters. Hematite is less strongly correlated with flow and is, in any case, thought to have an ancient hydrothermal origin, rather than being caused by changes in groundwater recharge chemistry.
The groundwater chemical data have been used to define five water types
recent waters, waters with close to 5 g/1 chloride, 'deep waters', glacial meltwaters, 'sea water imprint' waters.
The distinction between these water types are illustrated in Figure 4.8. The water types were discussed in Section 4.2.4 in terms of their correlation with the structural model of the site. The model confirms that the Aspo area is a region characterised by discharges of deepsourced saline waters with recharge of modern dilute waters only penetrating to depths of about 100 m. There are both 'seawater' and 'glacial' water imprints on the deeper waters. The shallow, recent waters are predominantly NaHC03 type. Salinity increases with depth, with the waters changing to Na-Ca-Cl types and eventually to Ca-Na-Cl types.
None of the groundwaters contains dissolved oxygen and they are generally suiphidic in nature, being close to saturation or oversaturated with respect to amorphous iron sulphide and amorphous uranium dioxide. Measured Eh values at repository depth are generally near to -300 mV with calculated values based on sulphate-sulphide being about -250 mV.

-6
-7 -
-8
••
A
___..---- HAS13 (0-100, SPT, No. 3)
~-- KAS06 (389-406 , SPT)
{_y--HAS02 (0-44, Nos. 1,2) HAS06, 0-40 , No. 2) • --._ I KAS06 (439-602, SPT)
-9
-' * · - KAS06 (304-377 , SPT)
! -10 v
~ ~* (No. 1) ----- KAS06 (204-277 , SPT)
----- , KAS04 (440-481 , CCC)
~ -11 ' * * ~ KAS02 (530-535, CCC)
-13
-14
-15
-16
* *•
*
*o· / 0 0 §
rno 0
* * * 0 - KAS03 (453-480,SPT)
~ '--...._ KAS02 (202-215, CCC)
\ KAS03 (248-251 , SPT)
0 KAS03 (196-223 , SPT)
~ KAS03 (129-134, CCC)
*
-17 ~-'-~--~-'-~--L-...J--L--~-'-~--L-...J-_j 0 2 4 6 10 12 14
-60 -
-70
-80 -
:! :::;; ..: ~ -90 ~ 0
"' -100
-110
-120
CHLORIDE CONCENTRATION , IN GRAMS PER LITER
GMWL I • C I • -' ·· 15D = 8 x "o + 10------- .,.
I
(No. 1)
I 6
/ o
/• I
~/ ·\~ / ·-\\ .,
t1* f ~ 8 ~
*/ :1~;18 *' ~~~~ I - - - -• ~ ~ ~ (f) :. ~~~~
f~ " KAS06 (204-277 , SPT)
,a """' KLX01 (680-702, No. 3)
d KAS02 (314-319, CCC) 1 0
j1
-------15D = 8 x 1511o + 2
I -1 30 L....<......_L..L~--"--'---'----'---'-~--'---'--L--'----'
-18 -16 -14 -12 -10 -8 -6
6 180 , IN PER MIL
30
-50
-60
-70
...J :i -80
..: w Q.
~ -90
ci "'
-100
-110
-120
-130
HAS06 (0-40, No. 2) B + _/ HAS02 (0-44, No. 1)
t 1_/ / HAS02 (0-44, No. 2)
+ ·~HAS13 (0-100, SPT, No. 3)
/ * (No . 1)
• / ~ KAS06 (389-406, SPT)
• ' - KAS06 (439-602 , SPT)
~ KAS06 (304-377 , SPT)
• / KAV01 (556-?) :et * *
0
•* * *
/ / KAS06 (204-277 , SPT)
/ KAS04 (440-481, CCC)
/ * * * * *
. ' ::::~t;,Jj 0 "'"'"'' ~ '\'\ .... r:~"' ~ ... <:! vv ~<i>' 0 ·" 'b"j .,., -.: '!i "'" r:>"'' ""' o,<:i ~ ~ <! -\' .._<:! ~
I!? ..9" "'" "' *-"' <:1 a,'?> "'"> v' .~ ft' 'b'O ,"'-'<> *' ~ ~ .,~ "'
*''!" "''!; "'"' .;J ~ ~ *' "'"' ~
-140 o'--'--2-'---'---'-4---'--...J6'---'---'-~--1..~.o __ ~..J12 __ ..__J14
CHLORIDE CONCENTRATION , IN GRAMS PER LITER
EXPLANATION
Water groups:
* Recent 0 5 grams per !iter chloride
* Deep o Glacial melt
• Seawater imprint
• Baltic
Abreviations:
CCC Complete chemical characterization
SPT Sampled during pumping test
GMWL Global meteoric water line
Figure 4.8 Plots of oxygen-18 and deuterium as function of chloride for groundwater samples from boreholes at Aspo. The markers indicate the different groundwater types identified in SITE-94 (for further details see SITE-94 main report).

31
Sulphides, Fe(ll)-rich silicates and dissolved organic carbon are responsible for these low Eh values.
Geochemical simulation modelling using thermodynamic rock-water interaction codes indicates that chlorite and goethite are currently important reactive solids in the groundwater system.
4.4 ROCK MECHANICAL MODEL
The mechanical stability of the repository host rocks over long periods of time into the future, in particular the behaviour of fractures, is closely linked to groundwater flow and radionuclide transport. A sound rock mechanical model of the current state of the site and its past evolution is thus an important aspect of site evaluation, upon which to build models of future behaviour.
SITE-94 established two rock mechanical models, one at a 'far-field' scale of the whole of Aspo island, the other at a near-field scale of a single tunnel and deposition hole.
Far-field Scale Model: The far-field scale model (4 x 4 x 4 km) is based on the SITE-94 structural model described earlier, although only 23 of the 52 fracture zones are included owing to computational constraints (Figure 4.9). It consists of an assemblage of rigid or deformable rock blocks whose boundaries constitute fracture zones which can be assigned various deformation characteristics. The model contains an inner cubic region of 1.5 km edge which contains the repository. Heat transport by conduction can be included in the model analysis.
The stress boundary conditions are obtained from in situ stress measurements from three boreholes at Aspo, the same data being used to orient the hypothetical repository tunnels. In order to prepare the model for looking at future evolution of the site, it is first run to allow the defined geometry to consolidate under the weight of the rock.
Near-Field (Repository Scale) Model: This model has to consider a detailed resolution of fracture geometry at the tunnel-deposition hole scale. Two models were set up: a 3D simulation of the fractures using the DFN hydrogeology model described above (Figure 4.1 0) and a 2D model which can handle failure of intact rock. The 3D model (25 x 25 x 18 m, with an inner cubic region of 7.5 m side) has applied stresses corresponding to 500 m depth and is evaluated using the 3-DEC code. The 2D model uses the boundary element method to evaluate fracture propagation owing to increased loads, such as might occur in future glaciations.

32
a)
b)
Figure 4. 9 The far-field scale rock mechanical model based on a reduced version of the S/TE-94 structural model, showing the 23 fracture zones included. The outer block is a 4 km cube and the inner block is a 1.5 km cube.

Figure 4.10 One of the 3-DEC rock mechanical models of the near-field which uses the fracture distribution from the Discrete Fracture Network hydrogeological model.
w w

35
5 SYSTEM DESCRIPTION: l'HE ENGINEERED BARRIER SYS1.,EM
The engineered barrier system (EBS) in the SITE-94 hypothetical repository comprises the waste canisters, the bentonite buffer around them and the shafts and tunnels of the repository and their various backfill and seal materials.
Unlike the other main system component, the site far-field conditions, which required a considerable amount of interpretation (as described in Section 4) before they could be used in the predictive PA of SITE-94, the EBS properties are, to a large extent, generic and constitute 'givens' at this stage of the project. Whilst the project involved new work on evaluating the future behaviour of components of the EBS, STI'E-94 used existing data on their design and properties.
5.1 THE CANISTER
The advanced cold-process canister design comprises an outer copper container to resist corrosion and an inner steel container for mechanical support. The canister has to function as a container and partial radiation shield at the waste encapsulation facility and during transport to the repository, as well as having a key role in reducing radionuclide releases after repository closure. Technical development work on the canister is still in progress and work remains to be carried out on issues such as full-scale testing of manufacturing and sealing procedures, defect testing and localised corrosion modelling.
Fabrication and welding procedures for the inner steel container are standard and wellunderstood, although the laser beam welding process may induce localised embrittlement which would require heat treatment. Final closure of the outer copper canister by electron beam welding under vacuum introduces uncertainties concerning the uniformity of weld properties in single canisters and statistically, across all canisters produced. These uncertainties will need to be quantified (e.g. using ultrasonic and radiographic characterisation of welds) and managed in the encapsulation QA procedures. An additional source of uncertainty is the eventual grain size distribution in the copper after fabrication, which will affect mechanical strength and corrosion behaviour, as well as impacting quality control procedures.
After emplacement in the repository, the elevated hydrostatic pressures which occur after resaturation of the EBS will cause the outer copper container to creep onto the inner steel canister until the gap is essentially eliminated and load is transferred onto the steel. Thereafter, the main control on the lifetime of a canister will be the mechanism of copper corrosion and the corrosion rate. The SITE-94 analysis looked at uniform and pitting copper corrosion behaviour under chemical conditions typical of various groundwaters, evaluating variable redox, chloride and sulphide environments. Under oxidising and high-chloride conditions it is possible that no solid corrosion phases will form on the canister surface and corrosion can be expected to be uniform. Under reducing conditions, in the presence of reduced sulphur species, a sulphide layer may form. Whilst this is not a protective layer (as it allows electron transfer and passage of copper cations) it does promote generally uniform corrosion. However, the potential for growth of copper sulphide 'whiskers' within and out
36
of this layer needs further analysis as this could lead to pitting of the copper. The potential for localised failure will be controlled, to a large extent, by the nature and distribution of defects in the copper. Since neither manufacturing nor quality control procedures were established at the time of SITE-94, no quantitative conclusions on this issue were possible.
It should be noted that, in the Design Basis for SITE-94, the single canister considered is assumed to have an undetected manufacturing defect comprising a circular hole 5 mm2 in area, through the copper. This would lead to galvanic corrosion of the intact steel inner container, limited by the supply of reducible species at the copper surface.
5.2 THE BENTONITE BUFFER
The buffer comprises highly compacted Volclay MX-80, with a 75% Na-montmorillonite content, 15% quartz and 6% feldspar. Impurities comprise carbonates, pyrite and organic carbon. On resaturation the clay swells to occupy any void space in and adjacent to the canister deposition holes as well as the residual pore space in the bentonite left by the dry compaction process. Transport through the re-hydrated material is dominated by diffusion, with possible minor influence of non-Darcy flow such as thennal- or concentration-osmotic effects. SITE-94 did not evaluate any of the practical engineering aspects of bentonite emplacement, resaturation or sweiiing.
Estimates of the hydraulic conductivity of the rehydrated bentonite range from 1 o-13 to 10-16 m/s, the higher values obtained using high-pressure f1ow apparatus, the lower using ultracentrifuge methods which are thought to give more reliable results. SITE-94 evaluated different approaches to measuring the effective diffusivities of radionuclides in bentonite and concluded that a number of conceptual uncertainties surround this issue. For example, the process of surface diffusion may be an artefact of the data-fitting procedures whereby effective diffusion coefficients are derived by combining absolute diffusivities for intact material with Kd-values for disaggregated materiaL Consequently, it was concluded that transport parameters for diffusion through bentonite should be chosen conservatively. Similar uncertainties are attached to sorption data for bentonites and the possibility was identified of intact material Kd-values being up to two orders of magnitude lower than those measured on disaggregated material. These uncertainties were factored into the later P A work.
5.3 BACKFILLS AND SEALS
SITE-94 did not analyse issues concerning excavation, reinforcement and grouting techniques, backfill materials, plugs and seals. There is, however, a short discussion on these issues.
The nature and extent of the EDZ in various parts of the repository and whether it will influence flow in the near-field to such an extent that remediation would be required and the scale and nature of geochemical changes introduced locally by structural concrete, reinforcement and cement grouting were identified as uncertainties. These would need

37
eventually to be quantified on a site-specific basis when detailed designs and underground construction data were available.
A number of safety related issues surround the use of bentonite, bentonite-sand, bentonitecrushed rock and concrete backfills, plugs and seals. These include time-dependent interactions of the backfiH with the EDZ and of the buffer in deposition holes with the lower density backfill, the development of pore-water chemistry in crushed rock-bentonite mixtures, hydraulic properties of seal interfaces, seal and plug responses to glacialloadings and the required period of performance of seals in the overall P A context.
It is possible to translate some of these uncertainties directly into the P A (e.g. as scenarios examining the impact of unsealed or poorly sealed shafts) but others require further research on their scale and effects in order to quantify their potential PA impacts.


39
6 SCENARIO IDENTIFICATION
The main group of consequence analyses canied out in SITE-94 concern the Reference Case (see Section 2), which represents a hypothetical situation of 'internal' evolution of the Process system with no changes in the external influences and, thus, the assumption of time-invariant boundary conditions to the Process System. However, the P A also needs to take account of the time dependence and impacts of EFEPs on the Process System, by the construction of scenarios.
Uncertainty regarding scenarios for the future evolution of the disposal system centres on uncertainty about the EFEPs; have all the EFEPs been identified (the 'completeness' problem), are the impacts of EFEPs on the system boundary understood and, where relevant, is the probability of occurrence of the EFEP quantifiable in a way that can be incorporated sensibly into the PA process? The scenario identification procedure adopted in SITE-94 endeavoured to address each of these uncertainties.
The definition of scenario adopted in SITE-94 is based on the earliest work on scenarios (outside the nuclear industry), dating back to the 1960s. Important aspects of the SKI interpretation of scenario development and use are that:
• scenarios are not predictive devices, but are means of stimulating and disciplining the imagination so as to provide an organised way of illustrating possible future behaviour of the system and defining how such behaviour might arise
• any given 'future' state of the system is part of an infinite set of possible futures and it is not appropriate to assign conditional probabilities to any scenario within a set selected for analysis; whilst it may be possible to estimate the probability of an event and build a scenario upon this event, a fully probabilistic treatment of a comprehensive scenario set is not considered meaningfuL
6.1 PROCEDURE FOR GENERATING SCENARIOS
A procedure for generating scenarios was developed within SITE-94, although it was only fully applied to the Central Scenario.
The first task was to carry out a comprehensive audit of all known EFEPs. This resulted in the identification of 81 EFEPs and was a product of the overall FEP audit described earlier in Section 2. The next step was to reduce this to a manageable number of scenarios for analysis.
• First, all EFEPs were removed which related to deviations from the repository Design Basis (e.g. improperly emplaced buffer) as this was defined as being outside the scope of the SITE-94 assessment, although these issues will eventually need to be assessed.

40
" It was decided to take full account of predicted climate changes in Sweden over approximately the next 100 000 years. All EFEPs which concerned climate change were thus swept up in the Central Scenario.
" The remaining Ef"EPs were then screened on the basis of two additional criteria. First, no analysis of human intrusion into the repository is carried out in SITE-94. This is considered to be fundamentally different in nature from all other impacts normally assessed in PA and a separate position on the philosophy of considering human intrusion in a regulatory context needs to be developed. Second, EFEPs which have no relevance to the Aspo site, have negligible identifiable impact, or are related to biosphere uncertainties (not analysed in SITE-94) were removed.
.. Finally, the EFEPs remaining after screening were lumped into groups which are closely similar or related in nature. A process of reduction led to four groups of lumped EFEPs which were linked in all combinations and a set of 8 'interesting' and illustrative Supplementary Scenarios selected from among these combinations. These were considered to represent a broad range of alternative futures for the system and allow reasonably comprehensive exploration and illustration of the uncertainties attributable to scenario identification.
The scenarios identified concerned the following:
• The Central Scenario (climate change: cooling) • Alternative (warm, wet) climate evolution • Tectonically induced seismicity • Large mine or water well in the vicinity of the repository • Inadequate shaft seal .. Liquid waste injection into a fracture zone near the repository .. Liquid waste injection into a poorly sealed shaft combined with local well/mine
pumping • Human impacts on the surface and on groundwater recharge • Mining impacts on the surface and on groundwater recharge
In analysing these scenarios, the EFEPs of which they are composed are applied to the Central Scenario PID and impacts are traced through the PID in terms of changes in importance levels of FEP links. By this means, a new PID is produced, specific to the scenario and, subsequently individual Arv.IFs which reflect new or additional modelling requirements to handle the scenario analysis. This exercise is supported by a written description of each scenario which uses expert opinion to identify critical times and time sequences of impact of the EFEPs on the Central Scenario time line.
The scenario methodology used is considered to be a reasonable approach to the difficult problem of evaluating what are, mathematically, huge numbers of combinations of EFEPs. This has been achieved partly by absorbing many 'would be' EFEPs into the Process System in the first place, partly by adopting a particular assessment philosophy (e.g. on design basis and on human intrusion) and partly by setting a clear objective of not looking for mathematical completeness but having a sensible system which allows intelligent interrogation of the PID using expert opinion. The chances of missing an obscure but important combination of EFEPs may always remain, but this will be minimised by

41
repeated application of the approach in future assessments, possibly by diverse groups of experts.
Although the methodology is fully developed, in the event, only the Central Scenario is analysed in SITE-94. This is described, in outline, below.
6.2 THE CENTRAL SCENARIO
The Central Scenario (CS) describes the impact on repository system evolution of what consensus views would accept as a plausible sequence of climatic events. It is built by combining:
.. a deterministic description of the likely climate state at Aspo over the next 130 000 years, based on a climate evolution model for Sweden (which evaluates ice build-up and retreat) and, in turn, for the northern hemisphere, using consensus views on orbital climate forcing factors.
a description of the likely nature of the surface environment in the site area at each stage of the climate sequence selected
.. quantitative information on how these changes might affect the disposal system.
The CS description identifies seven broad states of the Aspo site over the next 130 000 years (see Figure 1), including extensive periods of permafrost development and two periods of coverage by thick (1000-2000 m) ice sheets, peaking at about 60 and 110 ka AP. For a short period at about 75 ka AP the site will be covered by the Baltic Sea. The progressive cooling of climate suggests the first permafrost will appear at the site in about 10 ka time and, over the next 130 ka there will only be one short period at about 80 ka when the site is not covered by permafrost, ice or the sea and has a state similar to that of today.
A detailed description the state of the site and of the anticipated climate-driven processes and their impacts on the repository system was developed and impacts on the Reference Case PID identified at the primary 'target' FEPs of surface water chemistry, flow boundary conditions and far-field temperature. The CS also has potential impacts on system geometry which need to be included in the P A.
Quantitative estimates of the time-dependent changes along the 130 ka CS time line were made for about a dozen groups of parameters, including ice sheet properties, ground water recharge origins, volumes and chemistry, mechanical stress and hydraulic gradients. A revised version of the PID was then produced, specific to the CS, and this was used to identify quantitative models and to construct the consequence analysis calculation cases discussed later. However, the AMF was not formally up-dated for the Central Scenario.

42
Glacial 0 Periilacial 40 Glacial 80 Glacial 120 I I I : L:::J L
(!) Local and Eustatic Possible damming of the > Baltic 0 Sea Level and ..0 <ti- glacio-isostacy c -m .Cm .!:?m m'- Eustatic sea Io..
level ____.,.. (J) lsostatic (J) (j)
D response c-
~ ~~gE £ Ice Thickness
~ :E 1-
(fJ Permafrost Thickness (fJ
-10g~ ~ v· m.....-.. CE ..!~<::-.2 .!: 1- -300
Saline Water in the Baltic Ill
--~ • ii! • -20 0 20 40 60 80 100 120 Time (ka)
Figure 6.1 The SITE-94 climate change Central Scenario, illustrating projected conditions at the Aspo site over the next 120 ka and the last 20 ka. It can be seen that, after about 5000 years, there is only a short period (around 80 ka into future) when the site might have conditions similar to those of the present day, otherwise it is affected by pennafrost, ice, or water cover.

43
7 MODELLING: EVOLUTION OF THE GEOSPHERE
Having established the system description, the Reference Case and the scenarios (only the Central Scenario) to be analysed, the next step in SITE-94 was to evaluate how the site will evolve over the timescale of the assessment. This quantitative modelling concerns rock mechanical, thermal, hydrogeological and geochemical evolution of the site. Modelling of the hydrogeological and geochemical conditions produced a number of 'variant cases' using different combinations of parameter values; a 'zero variant' for each of the two topics, plus additional cases. At the subsequent consequence analysis stage, which evaluates radionuclide transport, these variants are evaluated separately, as well as being integrated into combined cases (see Section 1 0).
7.1 FAR~ FIELD ROCK MECHANICAL MODELLING
Thermo-mechanical analyses were performed to look at the combined effect of repositoryderived heat and ice load during the CS. This analysis thus effectively uses Reference Case present day conditions to evaluate the first 1000 years or so when repository heating is most significant and then switches to the CS description to incorporate later cooling and ice load effects. Two slightly overlapping sets of calculations were performed:
" coupled temperature and rock mechanical response to repository heat and mechanical load of the ice
" temperature evolution of the system during the CS, incorporating repository heating, geothermal heating and climatic changes to surface temperatures,
The objectives of the modelling are to quantify the stress changes and displacements in the rock due to thermomechanical impacts and to evaluate whether permafrost will affect the repository itself.
Peak thermal stresses occur after about 200 years when horizontal stresses increase preferentially and new fractures can start to propagate through certain regions of intact rock where the ratio of minimum to maximum stresses is less than 0.25. Shear displacement of up to a few centimetres can occur in fracture zones but is likely to be taken up as smaller movements along many sub-fractures. The main mode of deformation is fracture zone closure (although opening occurs at some locations). For Reference Case conditions it is concluded that there is little reason to assume any repository-induced faulting, but rock permeability will change around the repository. The analysis was not set up to predict the magnitude of this change.
Under Central Scenario conditions it is concluded that the repository (at 500 m depth) will never freeze (Figure 7.1 ), although no conclusions are drawn about mechanical impacts of permafrost on near-surface shaft backfill and seals. During glaciation, the peak vertical stress in the repository rock increases by a factor of 3, from 10 to 30 MPa, although the risk of global fracture propagation due to this load is small. Shear deformations of several centimetres are likely to occur along fault and fracture zones, the stability of tunnels may

44
be affected and intact rock may fail as a result of stress concentrations. The impact of excavation, heating and repeated glaciation will be to subject the rock to several loading/unloading paths which will cause weakness, particularly at excavation corners and fracture intersections. These findings which have implications for repository design will require further work, involving fully coupled thermo-hydro-mechanical modelling.
8 g N
~ 8 N
8 g
8 8
8 0 "'
Permafrost Depth
(i) two ice sheets )
(ii) one ice sheet (c.60ka) with repository
(iii) warmer-based ice
(i) two ice sheets without repository
8 0 ~~~--~----~--~----~~~~~----~--~--~~~~~~
-120.00 -100.00 -80.00 -60.00 -40.00 -20.00 0.00 20.00 40.00 60.00 80.00 100.00 120.00
Time in 1000 years
Figure 7.1 Calculated permafrost thicknesses at Asp6 for the duration of the Central Scenario, for different models of ice sheet properties and with or without the heating effect of the repository.
7.2 GROUNDWATER FLOW MODELLING
Analysis of groundwater flow under Reference Case conditions uses both the simple evaluation of site hydrogeology and transport and the two alternative conceptual hydrogeological models described in Section 4 and ranges in scale from regional (1500 km) to detailed (1 0-20 m). The Reference Case analysis is thus used to explore the impacts of conceptual model and parameter uncertainty. Further exploration of uncertainties is carried out by having variants within each of the hydrogeological site models used, with a total of over 30 variant cases being analysed with the Discrete Feature and the Stochastic

45
Continuum models. The CS is analysed principally using time-dependent, regional evaluations of flow.
Reference Case Analysis: A key objective of the groundwater flow modelling is to derive transport parameters for the subsequent consequence analysis. This is carried out using the Discrete Feature and the Stochastic Continuum models, by:
• solving the steady-state flow field for each model realisation • sampling near-field parameters at a single canister scale • particle tracking from each canister site in the repository in order to address spatial
variability of properties • interpretation of each calculated canister release curve in terms of an equivalent
1-D homogeneous porous medium to give effective far-field transport parameters for input to the CRYSTAL consequence analysis code (see Section 9.2).
The second two steps are illustrated in more detail in Figure 7 .2. In addition to deriving the basic range of transport parameter values for consequence analysis, the flow modelling also identified two important composite hydrogeological parameters which prove very useful as performance indicators for far-field transport. Cross-plotting of these two parameters at a later stage of the P A allows the simple definition of a parameter space which covers the full range of possible transport behaviour of the far-field and from which consequence analysis variants can be selected to give the coverage necessary to address parameter uncertainty. The two parameters are:
• F m ratio (F) = flow wetted surface area per volume of rock X transport pathlength/Darcy velocity
.. Peclet No. (Pe) = groundwater velocity x transport pathlength/longitudinal dispersion coefficient
Estimation of the flow wetted surface area, 3y, thus became an important aspect of the ground water flow modelling. The explicit representation of fractures and fracture zones in the Discrete Feature model, including two simple models of parallel plate fractures, made it possible to evaluate 3y, together with the Darcy velocity, directly from the particle tracking calculations. This ensures that the estimated flow wetted surface is consistent with the flow field analysed. In addition, several independent data analyses and models were employed for evaluation of flow wetted surface, including detailed fracture network models (V APFRAC and DISCFRAC), simple seeping calculations based on a range of conceptual models of pore structure in conductive features and a geochemical model based on 222Rn production. The independent estimates of the flow wetted surface area were used to calculate F-ratio for the Stochastic Continuum model.

46
4) Far-field transport qf.P DLJ.P arf.P (/Jf.P L parameters for CRYSTAL t
uff DL.ff
c + 3) Fitting ID transport equation
2) Residence time c t
distribution + other output parameters
1) Particle tracking • • If
§ ..
' .,. ill ••
in 30 hydrogeological site models
.... r -_,....
1 ........._ / ..C ,
I I I I I I
I '-.....('-/ I/ I
~ l/Jff
arff L
t l/Jff
t
Geosphere
Repository
Figure 7.2 Steps in the procedure for abstracting effective flow and transport properties from the 3D hydrogeological site models, for input to the consequence analysis calculations. u/J is the fluid velocity, q/J the Darcy velocity, D Lff the longitudinal dispersion coefficient, a,ff the flow wetted surface area per volume of rock, <Pffthe porosity and the subscript ff indicates a far-field parameter.

47
Groundwater flow at Aspo is highly heterogeneous and detailed site-scale models consistently predict travel times from the repository to the surface ranging from a few years to more than 10 ka, reflecting a high degree of spatial variability of flow within the far-field rock. This is an intrinsic site property rather than an uncertainty in site characterisation information. Explicit representation of this variability in the Discrete Feature and the Stochastic Continuum models allowed quantitative estimation of transport parameters. The calculated F-ratio, which is a measure of the retardation capacity of the rock, can vary by several orders of magnitude depending on the 'release point' in the repository. The F-ratio proves a useful way of ranking uncertainties in the groundwater flow modelling. The order of importance of these uncertainties is:
• spatial distribution of pore structure and transmissivity within transmissive features
assumptions on the distribution and spatial correlation of hydraulic conductivity
effective semi-regional model boundary conditions and uncertainties in structural model (e.g. fracture zone numbers and locations).
In a site characterisation programme for a potential repository, tracer tests at a variety of scales could provide useful data to address the most significant of these uncertainties, combined with detailed studies of single transmissive features to evaluate the relationship between hydraulic conductivity, porosity and flow wetted surface.
In addition, spatial variability in the near-field fracture network leads to uncertainty in the numbers of canisters which are hydraulically connected to site-scale structures in the Discrete Feature model (but obviously not in the Stochastic Continuum model, emphasising a conceptual uncertainty in the analysis). Further work in this area could lead to an active approach for identifying distinct volumes of rock with statistically different probabilities of deposition holes being intersected by flowing and non-flowing fractures, based on sitespecific fracture data. For sites similar to Aspo, spatial variability between canister sites will be one of the dominant aspects of hydrogeological impacts on P A results.
The simple evaluation and the detailed models give varying predictions of F-ratio (see Figure 7 .3), with an apparently much greater resolution of the detailed model. The simple scoping calculations of flow and transport provide a means of checking the reasonableness of the detailed models, which build on several conceptual assumptions that are hard to verify using the available site data. Despite the conceptual differences between the Discrete Feature model and the Stochastic Continuum model, they predict similar retention properties and spatial variability of the geosphere when all parameter uncertainties are taken into account. Figure 7.4 illustrates the total prediction uncertainty, including spatial variability, of the F-ratio and Peel et number for the Discrete Feature model and its variants. Each data point in the figure represents the far-field retention properties associated with release from a particular canister position. lllustrating the results for each conceptual model and model variant, separately in this type of diagram, makes it possible to map different types of uncertainty and spatial variability, in terms of their impact on radionuclide transport, in a structured way (see Section 9.3).

48
Simple evaluation
• • • DF (base case LO)
- DF (base case HI)
DF (SK!O.LVNFO/BCO/HI)
DF (SKIOD/NFO/BCO/LO)
1010 1012 1014 1016 1018
F-ratio (s/m)
Figure 7.3 Different ranges of farjield F-ratio (spatial variability) estimated by the different hydrogeological models; the simple evaluation and the lOth, median and 90th percentile of the Discrete Feature (DF) model. LO and HI are porosity variants and the two lower lines are variants which gave the lowest and highest median F-ratio.
10 5
10 4
10 3
10 2
10 l
10 0
10 -1
. .. . • ,..lll. ...
. .
. . . . .. . . . ..
. . . .. . ..
. .
. . . ...
10-2+-----~----~----~----~----~ 10 10 10 1l 10 12 10 13 10 14 10 15
F-ratio (s/m)
Figure 7.4 The total prediction uncertainty in F-ratio and Peclet number for all the Discrete Feature model variants. Each point represents the result from a single canister release point calculation.

49
The estimated F-ratios represent averages of the spatially varying Darcy velocity and flow wetted surface area along the flow paths from a canister to the biosphere. If there is a high degree of variability in either parameter, the use of constant (effective) derived parameter values for calculating radionuclide transport is a source of additional uncertainty.
The multiple conceptual model approach applied to the Reference Case was found to be an effective means of quantifying the relative importance of parameter and conceptual model uncertainties, particularly where a specific type of parameter uncertainty cannot be addressed by a single model. In addition, it was found that, as any given model is unable to use all the available site characterisation data, this complementary approach provides an important means of eliminating bias in site data interpretation.
Groundwater flow in the Central Scenario: The regional scale modelling used to evaluate flow during the CS time sequence of surface environmental conditions predicts changes in discharge area location, alteration of flow directions and moderate changes of flow magnitude. Under permafrost conditions, fluxes at repository depth remain similar to present day conditions but pathlengths are increased as discharge areas are sealed. As a warm-based ice sheet advances, the regional model indicates that basal meltwaters may infiltrate to depths of several kilometres, with flow rates increased by about an order of magnitude and the progressive southeastwards movement of discharge areas away from Aspo ahead of the ice front. Oxygenated waters can reach repository depths over this period, which may last several thousands of years. The onset of glacial retreat triggers a switch to local discharge conditions as groundwater stored in the rock under higher basal pressure conditions is released. For short periods, as the ice margin passes across the site, more extreme flows are predicted. Certain combinations of events (e.g. the presence of an ice-dammed lake discharging down a scoured, enhanced transmissivity fracture zone which has recently been unloaded) are considered unlikely, but could give rise to high short-term fluxes at repository depth.
7.3 GEOCHEMICAL MODELLING
The requirement of the geochemical modelling is to define ranges of geochemical conditions for input to the PA of EBS stability and the prediction of radionuclide behaviour in the far-field. No significant changes to bulk rock or fracture mineralogy are predicted for Reference Case conditions, whereas CS conditions will affect fracture mineralogy. Similarly, Reference Case hydrochemistry (in terms of the distribution of water types) would remain constant but would clearly be affected by CS flow perturbations. Thus, for the Reference Case, a medium salinity, reducing water was selected for the 'zero variant', reflecting conditions at 500 m depth.
For the Central Scenario two variants were developed, a high salinity reducing and a low salinity, weakly oxidising variant. The high salinity variant reflects the unlikely condition, at about 70 ka AP, of deep saline waters moving upwards as the ice margin from the main phase of glaciation recedes across the site. The low salinity variant is used to evaluate the impact of sub-ice recharge of basal meltwaters. For some calculations, highly oxidising conditions are assumed. The geochemical impact of oxidising waters recharging the repository rock volume under CS conditions was modelled using a quasi-stationary state approximation to coupled mass transport and water-rock interaction. If the reactions are

50
assumed to be instantaneous, the rate of ingress of an oxidation front into fractures is strongly retarded. However, the paucity of reliable kinetic data on mineral oxidation and the fact that many fracture zones may have already been oxidised by deep ingress of such waters undermines this simple conclusion and it is suggested that more work is required in this area.

51
8 MODELLING: EVOLUTION OF THE NEARFIELD
As with the far-field, the objectives of modelling the evolution of the near-field are to provide input data to consequence analysis calculations. The evaluation considers the evolution of the following components of the near-field, under Reference Case and CS conditions:
.. Near-field rock Mechanical evolution Hydrogeological behaviour Geochemical evolution
• Buffer, backfill and seals • Canister integrity and internal chemistry • Fuel Dissolution " Chemistry and behaviour of released radionuclides
8.1 NEAR-FIELD ROCK MODELLING
8.1.1 Mechanical Evolution
Both the 2D and 3D models described in Section 4.4 were used to evaluate the impacts of excavation, bentonite swelling pressure and thermal loading on fracture propagation and coalescence, fracture shear and displacement and intact rock stability. The 3-DEC code, plus a special boundary element code developed for SITE-94, were used for the 3D analyses, which used fracture networks consistent with those evaluated in the hydrogeological analysis to evaluate the behaviour of a single deposition hole and the adjacent tunnel.
Reference Case: Excavation causes major redistribution of stresses with the development of yield zones and some localised rock failure. Fractures intersecting the tunnel close (maximum 0.14 mm), whilst those in the tunnel walls open very slightly (maximum 0.02 mm), affecting hydraulic conductivity. There is slight shear displacement ( -1 mm). Bentonite swelling has minor effects on rock mass stability and there is no significant fracture movement. Thermal loading causes high stresses and additional yielding, with maximum shear displacements of -0.5 mm. All fractures close. After cooling there is unrecoverable shear displacement along inclined joints and some fractures re-open. Major fracture propagation and coalescence are predicted, which produces longer fractures and would thus increase connectivity and give rise to remnant changes in hydraulic conductivity.
Central scenario: The analysis simulates the impacts of an overburden of 2200 m of ice on the site. The 2D model predicts enhanced fracture propagation along a 60° dip plane for the most extreme stress cases which may trigger shear rupture or faulting in this direction. The 3D model suggests intact rock failure to occur in tunnel and deposition hole walls, with

52
a similar volume of rock affected to that of the thermal load case. An unrecoverable increase in shear displacement (maximum 0.33 mm; but proportional to fracture length modelled) occurs along fractures, which also tend to close under load and re-open postglacially. These shear displacements have negligible effect on the stability of tunnels and deposition holes. Fracture coalescence may occur over large areas of the rock and may lead to minor faulting or trigger movement of existing faults.
Generally, peak thermal loading and glaciation reduce the mechanical aperture of fractures by -0.4 mm, which will reduce water flow into the tunnel and increase fracture shear strength, but may also lead to stress concentrations in intact rock. On cooling and glacial unloading, intact rock contraction will cause some fractures to re-open and water pathways will change. Both heating and glaciation lead to changes in water flow rates and patterns around canisters.
8.1.2 Hydrogeological Evolution
Reference Case: Groundwater flow parameters for the near-field consequence analysis modelling (fracture spacing, mean transport aperture and Darcy velocity) are derived by sampling predicted steady-state flows for each realisation of the Discrete Feature model. In the base case analysis only 33% of the canister deposition holes are predicted to be intersected by groundwater flow in fractures ('flowing sites') although 43% of the sites are fractured. Darcy velocity is the most sensitive parameter with respect to uncertainties. Although near-field fluxes are influenced by some of the far-field (boundary condition) flow variants used, they are not significantly affected in most cases. The Stochastic Continuum model is only used to predict Darcy velocities, which are evaluated for each canister deposition hole location for each realisation of the hydraulic conductivity field. About 2 orders of magnitude spatial variability in Darcy velocity is predicted and, as with the Discrete Feature model, there is only a weak correlation with far-field Darcy velocity. A key feature of the near-field analysis is the high degree of spatial variability in flow, which is again considered to be a feature of the site rather than an uncertainty in the site characterisation data. Figure 8.1 illustrates the estimated ranges of near-field Darcy velocity for the simple evaluation and for the detailed models. One should note that the Darcy velocities for the Discrete Feature model represent the 33% of the flowing sites in that model, whereas the Darcy velocities for the Stochastic Continuum model represent all canister sites.
Central Scenario: The Discrete Feature model predicts only about an order of magnitude increase in mean Darcy velocity under CS conditions and no change in their spatial variability. However, SITE-94 has not incorporated the mechanical effects described above into the near-field flow estimations. The more dramatic, but low probability changes in flow described in Section 7.2 are also not included in the SITE-94 evaluation.

53
4, "' " a "' " "" Simple evaluation
• • • S.C. (NEW-D!P80)
.. • 11 S.C. (base case)
• • • S.C. (LNG-DIP80)
13 El -o D.F. (SKNO/NFO/BCO)
D El El D.F. (base case)
13 1:3 EJ D.F. (SKIO/NFOB/BCO)
H.l -6 10 -S 10 -1! 10 -J 10 "2 10 -l 100 10 1 102
q nf (m/year)
Figure 8.1 Estimated range (spatial variability) in near-field Darcy velocity for the simple hydrogeological evaluation model and for the Discrete Feature (DF) and Stochastic Continuum (SC) models. The points are the lOth, median and 90th percentiles. The Base Case for each of the two detailed models is shown, together with the variants which gave the highest and lowest median values.
8.1.3 Geochemical Evolution
Reference Case: Chemical disturbances caused by excavation were not evaluated in detail, but considered to have little long-term impact on geochemical performance of the nearfield. However, the extent and reversibility of oxidation of the rock requires more analysis than was carried out in SITE-94. Modelled thermochemical impacts of repository heat production identified a decrease in calcite solubility, which may lead to calcite deposition and reduction in fracture transmissivity, and a lesser effect from increased silica solubility. These impacts were conservatively ignored in the PA consequence analyses. In addition, no new work was conducted in SITE-94 on the impacts of EBS degradation products on the near-field rock and fractures (e.g. impacts of impurities in the bentonite, colloids generated by the bentonite, metal corrosion products and concrete/cement porewaters).
Central Scenario: The hydrochemical variants (see Section 7.3) applied to the far-field rock were also applied to the near-field rock. In modelling the integrated behaviour of the porewaters in the EBS, these waters were used as input to a closed system model, described later.

54
8.2 BUFFER, BACK:FILL AND SEAL EVOLUTION
SITE-94 carried out no specific analysis of backfills and seals, but compiled the potentially significant issues that would need to be considered in a full safety assessment Similarly, new work has only been carried out on one aspect of buffer evolution; chemical alteration by interaction with near-field groundwaters.
Chemical evolution of buffer properties may affect the physical properties of the bentonite and its capacity to control solute transport by diffusion, as well as modifying the chemical behaviour of radionuclides as they pass through the buffer. lllitisation of the smectite clay as a result of ingress of calcium from groundwaters, or as a result of heating, is considered to be minor, even after -100 ka. Equilibration of MX-80 bentonite with the near-field zero variant groundwater was simulated with a dosed-system reaction path model which enabled bentonite porewater compositions to be calculated for ambient temperatures (15 °C) and elevated temperatures resulting from heating by the waste (80°C). It was assumed that redox conditions are controlled by the rock-water interactions (additional analyses looked at fixed oxygen partial pressures to simulate the effect of oxidising groundwaters or alpha radiolysis). Eh and pH are buffered to relatively reducing, alkaline conditions (-250 to -330 mV and 7.7 to 9.3, respectively) compared to the incident groundwaters. Initially, under oxidising conditions, pyrite oxidation lowers pH to 3.5, but hydrolysis of smectite produces an equilibrium value in the mildly alkaline range. Dissolved carbonate concentrations are limited by calcium solubility equilibrium with calcite and interaction with smectite but they are an order of magnitude higher than in the incident groundwaters. This affects radionuclide speciation in the buffer. Similarly, sulphate concentration increase in the porewaters by several orders of magnitude.
The three salinity variants for near-field groundwaters have little effect on bentonite-water interactions, as chloride concentrations are unaffected. Both fluoride and phosphate concentrations are limited by the high calcium concentrations and by solubility control by fluorapatite.
8.3 CANISTER EVOLUTION
At present, owing to the relatively untried state of the industrial scale fabrication and testing programme, there is insufficient information available to derive estimates of canister failure rates as the EBS evolves. SITE-94 has thus postulated failure rates based on a review of the potential mechanisms involved and on new corrosion calculations using the CAMEO code.
8.3.1 Canister Failure
Reference Case: A uniform mechanical load of up to 10 MPa builds up on the canister as the buffer swells. Non-uniform loads may be experienced owing to preferential localised swelling, but these have not been analysed, although it is believed that these will lead to differential creep and localised thinning of the copper. Stresses may concentrate in the vicinity of defects and a small fraction of containers may fail in the interval 1000 to 50 ka. Similarly, non-uniformity of resaturation of the repository as a whole may lead to a small

55
number of containers being exposed to larger amounts of residual oxygen. However, most of the residual oxygen in the EBS will be consumed by reaction with the rock and with pyrite in the buffer. Thereafter, copper corrosion is controlled by diffusive mass transfer of any remaining oxygen or sulphide (under reducing conditions; from the groundwater as well as from pyrite in the bentonite) through the bentonite to the canister surface and the transport of corrosion products (e.g copper chloride under oxidising conditions) away from the surface. The CAMEO code predicts failure times of the outer copper canister as a result of general corrosion which are -107 years or greater. If dissolved sulphate (present at up to 1000 times higher concentration than sulphide in the Aspo near-field waters) diffuses through the buffer and is microbially reduced, predicted failure times for the copper canister decrease to -104 years. At present there is no suitable model available for non-uniform (e.g. whisker growth and defect-controlled) corrosion. Once the outer copper container fails, SITE-94 makes the conservative assumption that the inner steel container fails after 1000 years. No common cause failure mechanisms have been identified for canister failure under Reference Case conditions.
Central Scenario: Mechanical/hydrostatic loading due to ice overburden may be as high as 30 MPa, approaching the failure load for the canisters, whose eventual specifications will need to take this into account. When extremely oxidising conditions are sustained at the canister surface, then failure times of -104 years are calculated by CAMEO. However, it is not likely that such conditions could both penetrate through the buffer to the canister surface and be sustained for a sufficient length of time, given the transience of the hydraulic driving mechanisms as the ice-front passes over the repository.
Based on the above analysis it is considered a reasonable assumption that a few of the containers will fail within 100 ka after closure. The SITE-94 consequence analysis thus looks at three failure times; 1000 years, 10 ka and 100 ka. As the estimation of the actual numbers of containers which may fail at any given time is still considered highly speculative given the paucity of quantitative information, the consequences of multiple canister failures are not addressed in SITE-94.
8.3.2 Chemical Conditions Inside a Failed Canister
The closed system reaction path model used to evaluate bentonite-groundwater reactions was then extended to equilibrate the calculated bentonite porewaters with the steel canister, at the two chosen temperatures of 15 and 80°C in order to look at 'outside-in' effects on canister porewater chemistry. Copper and its corrosion products are not included in the calculations. It is assumed that corrosion proceeds at a low, steady-state value until all the metallic iron is converted to magnetite and that the porewater chemistry is then controlled by a slow approach to equilibrium with magnetite. In mildly reducing to oxidising conditions, magnetite converts progressively to iron oxyhydroxide, then goethite and, finally, hematite. The model looks at two cases which do and do not allow hematite to form.
The results of the modelling suggest that waters already equilibrated with bentonite under reducing conditions are close to equilibrium with magnetite and in equilibrium with magnetite alteration phases under strongly oxidising conditions. Solution compositions generated by magnetite-water interactions differ considerably if hematite is assumed to be a possible reaction product and they would be controlled by a stable assemblage of
56
magnetite, pyrite and hematite and would be strongly reducing ( -500 m V) and alkaline (ph= 12). Calculations were made on radiolytic oxidant production inside the container but these indicate that the reducing potential of the container and its corrosion products will dominate and maintain overall reducing conditions within the failed If the reducing potential of the canister and the fuel are set conservatively to zero, then it is calculated that a redox (oxidation) f:ront would begin to fonn in the bentonite immediately after canister failure and will move quickly (within about 400 years) through the buffer (given a canister failure after 1000 years). It will then slow considerably and only migrate about one metre into the rock over a period of about one million years.
The calculations of canister porewater chemistry allow a number of geochemical variants to be defined for conditions within the canister which are then used to calculate the solubilities and speciation of radionuclides at source, once they have been released from the dissolving fueL It is concluded that there are still conceptual uncertainties remaining in the geochemical models of near-field chemistry which may be as significant to the overall PA as the uncertainties in site properties.
8.4 DISSOLUTION OF THE FUEL
It is believed that radionuclides will be released from the fuel at a rate congruent with the radio lytic oxidative dissolution of the U02 fuel matrix to higher oxides, with the exception of certain radionuclides which congregate in the cladding gap (Cs, I) or at grain boundaries (Cs, I, Sb, Mo, Tc, Sr), Although, as noted above, bulk porewater conditions in the canister are reducing, the fuel surface is locally oxidising and fuel dissolution depends on a number of rate dependent processes: oxidant production, transport of oxidant away from the surface, fuel oxidation, other oxidant consuming reactions, transport of oxidised uranium from the surface and transport of other reactants. SITE-94 assumes that the rate of fuel matrix conversion corresponds to the oxidant production rate, conservatively assumes that all of this oxidant reacts with the fuel and uses a simple model in which U02 transforms to U30 8 and H20 2 is the sole oxidant
8.5 CHEMISTRY AND BEHAVIOUR OF RELEASED RA.DIONUCLIDES
Solubility and speciation: Armed with the hydrochemical information on groundwater chemistry and porewater chemistry in various regions of the EBS and in the far-field variant waters it is possible to use thermodynamic models to estimate the solubility and speciation of dissolved radionuclides along their migration pathway, A source of uncertainty lies inadequacies in the thermodynamic database in terms of availability, accuracy or consistency of data for solubility controlling solid phases and for aqueous species.
The closed system reaction path model described previously, which reacts near-field groundwater first with bentonite, then with iron canister corrosion products and, finally, with the spent fuel, was used to provide the basic ranges of porewater compositions and indications of solubility controlling phases for a total of nine variant cases reflecting different regions and states of the EBS. The models simulated both Reference Case and

57
Central Scenario conditions, oxidising and reducing conditions, the two selected temperatures and also explored conceptual model uncertainty in terms of solubility controlling phases and whether these are amorphous or crystalline. Following these calculations, values were provided for each radionuclide, for both reducing and oxidising conditions, for:
• the solubility controlling solid • the solubility range of the radionuclide (mol/1) • the aqueous species present at >10 mol%.
The solubilities of the most soluble phases among those possible are used as a conservative upper bound. These calculated solubilities were compared with experimentally derived values for relevant near-field conditions. Good, or conservative agreement between calculated and experimental data were obtained for Am, Np, Pu, Tc, Th and U. In the absence of experimental data (Ni, Se, Sn, Sr, Zr and Ra), expert judgement was used, based on the known geochemical behaviour of stable isotopes in analogous conditions. Where no thermodynamic or geochemical data were available (Pd, Ce, Sm, etc ), literature values were used. Near-field Cs and I concentrations were assumed to be unlimited by solubility constraints. The recommended values were then used in the subsequent consequence analysis calculations of radionuclide transport.
Sorption: The distribution coefficients used in SITE-94 are taken from a literature review of rock types relevant to the Aspo site and for bentonite in non-saline waters under both oxidising and reducing conditions. A surface sorption model for Np (V) was also tested and it was concluded that the conventional Kd-value selected for oxidising conditions falls within the range of modelling results.


59
9 MODELLING: RADIONUCLIDE TRANSPORT AND RELEASE
The information compiled from the far-field and near-field modelling is next integrated into radionuclide mobilisation and transport calculations and the resultant releases to the biosphere are estimated. SITE-94 uses the CALIBRE code to calculate releases from the EBS and near-field rock and the CRYSTAL code to calculate far-field transport. A simple biosphere model is then used to convert releases to doses.
9.1 MOBILISATION AND RELEASE FROM THE NEAR-FIELD
The CALIBRE code (Figure 9.1) simulates gap release, grain boundary release and matrix release of radionuclides from the fuel and the release of activation products from the corrosion of Zircaloy cladding and other metal parts and transport in the canister, buffer and near-field rock. It is assumed that 10% of Cs, I and C and 1% of Tc are available for gap release and that 100% of Sr, the remaining Cs, I and C and 10% of Tc are available for grain boundary release. Matrix release is assumed to be congruent with oxidative dissolution of the fuel and radionuclides are transported away or accumulate within the canister as a result of solubility limitation. The total concentration of a radionuclide within the near-field is partitioned into the amount dissolved in porewaters, the amount sorbed on bentonite or rock and the amount precipitated. SITE-94 has not evaluated sorption onto fuel or canister corrosion products and for most cases physical containment by the canister walls was disregarded. Dissolution of the fuel begins at the time of canister failure, although decay and ingrowth are calculated from the time of canister deposition.
Transport in the canister and bentonite are assumed to take place by diffusion and transport in the near-field rock by advection and diffusion, with no dispersion owing to the small size of the region modelled. A special case of release from a pinhole has also been modelled. Transport in the near-field rock is by diffusion through the porous matrix of the rock mass and by advection and diffusion along uniformly spaced plane-parallel fractures perpendicular to the sides of the canister. Channelling (and the consequent fracture wetted surface) area is included in the transport calculations, thus influencing the impact of matrix diffusion into the rock mass. The CALIBRE code also models the effect of redox state on transport through the near-field, calculating first the transport of oxidants outwards from the fuel and the time evolution of redox state in each part of the near-field, then calculating the effect on solubility and sorption properties of each radionuclide.

SPENT FUEL MATRIX
60
.:...r.......,._.,.,.,.......~,.._. .... < > .... ·~-....- CRYSTALLINE ROCK
Cladding
Figure 9.1 Schematic illustration of the components modelled by the CAliBRE near-field consequence analysis code.

61
9.2 TRANSPORT IN THE FAR~FIELD ROCK
Transport away from the near-field through the fractured rock mass of the far-field is modelled as a process of advection and longitudinal dispersion in flowing groundwater, with diffusion into the rock matrix and sorption onto pore surfaces. The potential transport of radionuclides in colloidal form is not evaluated in SITE-94. The CRYSTAL code is used to calculate far-field transport in one dimension, through a set of parallel fractures, which is clearly a considerable simplification of the true ground water flow field discussed earlier. As with the near-field rock, the flow wetted surface area is included in the analysis, having the effect of restricting the impact of matrix diffusion. SITE-94 only takes account of sorption onto the pore surfaces in the rock matrix, not onto fracture surfaces.
9.3 NEAR AND FAR-FIELD SCOPING CALCULATIONS
Before embarking on the main consequence analysis calculations, some simple scoping calculations were made using CALIBRE and CRYSTAL so as to test the overall sensitivities of the system to assumptions and parameters used. This helped to set up a more structured set of consequence calculations. For example, it was found that releases from the far-field were insensitive to parameter values above or below certain ranges (e.g of Darcy velocity).
It was also possible to use CALIBRE to scope the effects of release occurring to the tunnel above the canister deposition hole, rather than into a fracture. It was found that unrealistically high groundwater fluxes were needed in the excavation damaged zone of the tunnel in order to maintain the zero-concentration boundary condition at the top of the deposition hole buffer which was assumed in the model. The position of the pin-hole in the canister with respect to the fractures in the near-field rock was also evaluated and found to have no effect over the first 10 ka after disposal, the period at which pinhole releases are most likely to be important. It was thus decided only to evaluate a single pinhole release case in the consequence analyses.
Far-field scoping calculations concentrated on the impacts of the F-ratio and the Peclet number on calculated releases. It was found that these two parameters alone could be used to characterise radionuclide transport through the rock and that peak releases could be readily described as a simple function ofF-ratio and Pe (see Figure 9.2). F-ratio is the dominant parameter, with low values (small flow wetted surface area and high Darcy velocity) giving high releases.

0
-2
4
-6
10
62
Log peak release rate (Moles/year,canister)
14 -1,0
Log F-ratio (s/m) Log Pec!et-number
Figure 9.2 Dependence of peak release rate from the far-field on F-ratio and Peclet number. The dominant effect of the F-ratio is clear.
9.4 RELEASES TO THE BIOSPHERE
The Swedish Radiation Protection Institute (SSI) developed a simple biosphere model for SITE-94 which involves evaluating radionuclide releases and consequent annual individual radiation doses to people for the Reference Case (a non-evolving biosphere) and the Central Scenario, which involves land-rise and drying-out of the shallow waters around Aspo in the immediate future and a model for a closed Baltic Sea in the remote future. The biosphere receptors considered for the Reference Case are a well on Aspo island which provides drinking and irrigation water (10 000 m3/year) for a population of about 100 people and the bay of Borholmsfjard, the shallow brackish waters which surround Aspo, where radionuclides either sorb on sediments (with no dose consequences) or accumulate in fish, with consequent radiation doses to people who eat them. In the simplified treatment of the CS, the well recipient does not exist after 50 ka, owing to ice cover or a climate considered too cold for habitation. The contaminated sediments of the Borholmsfjard become accessible for agricultural use after about 1000 years as a result of land rise but, after 50 ka, this pathway is also removed from the calculations. After 100 ka, all the radionuclides released from the repository are assumed to have collected in the Baltic Sea and its sediments.
Although useful insights were gained on dose pathways, it was found that for both the Reference Case and the CS the drinking water pathway dominates doses for most radionuclides. Calculations using this pathway were thus employed in the consequence analyses, as they constitute a conservative indicator of impacts, even though the pathway would be unrealistic for much of the time period of the CS.

63
10 CONSEQUENCE ANALYSIS: FORMULATING THE CALCULATION CASES
The modelling described in the previous three sections was carried out within various Clearing Houses (see Section 2), each of which provided information and parameter values for making the final selection of calculations for the P A consequence analysis. Information arrived from each Clearing House in the form of a 'zero variant' and two sets of 'variants,' one for the Reference Case and one for the CS, which had been set up to explore aspects of the particular discipline of the Clearing House (e.g. groundwater flow). These Clearing House variants then had to be combined in various ways to form integrated calculation cases.
10.1 CLEARING HOUSE VARIANTS FOR THE REFERENCE CASE
It was important to have a sensible procedure to reduce the number of variants and cases which needed to be analysed to a manageable group, whilst still endeavouring to cover the full envelope of parameter space. Within the Clearing Houses, this was achieved by exploring correlations of parameters, using the results of the sensitivity analyses described in Section and identifying overlapping variants which give rise to similar sets of input parameter values. At the stage of combining inputs from Clearing Houses, correlations between Clearing House variants were taken into account and it was decided to restrict all analyses of conceptual model uncertainty, parameter uncertainty and parameter variability to calculation cases based on the Reference Case. Various other guidelines were used to produce a representative and illustrative set of calculation cases, although the limitations of this reduction approach were well recognised.
The widest set of variants arose from the Hydrogeology Clearing House. Here, the Zero Variant was chosen to be based on the Discrete Feature Model. Twenty five near-field variants were designed to address uncertainty and variability in flux, flow wetted surface area, fracture aperture and fracture spacing, with some variants addressing 'extreme' combinations of Darcy velocity and fracture wetted surface area. Far-field variants were selected to cover the most extreme regions of F-ratio-Pe number space, as well as regularly spaced intermediate regions and a total of 44 further variants was produced. The Stochastic Continuum Model was also used to explore conceptual model uncertainty, and a further 135 variants were defined, based upon combining low, medium and high values of Darcy velocity, dispersion coefficient and flow wetted surface area. Fifty-nine integrated variants which combine near and far-field variants were then selected to cover conceptual uncertainties and spatial variability for these two models, plus some additional variants to cover the highest Darcy velocities estimated by the simple hydrogeological evaluation model of the site.
The Geochemistry Clearing House produced variants reflecting different redox conditions, including the propagation of a redox front, different temperatures ar1d different radionuclide solubility limits, which correlate with redox state. Sorption variants were also correlated

64
with redox state and addressed uncertainty in Kct-va1ues by using a set which had all been reduced by a factor of three. In the far-field, where solubility limits and redox fronts are not considered, the geochemistry variants focus on two redox states and two sets of sorption values. The integrated near and far-field variants are correlated in terms of a uniform redox state.
A variant was developed for a case where the bentonite buffer loses its plasticity and cracks, thus providing a direct connection between canister and near-field rock. No variants were produced to evaluate uncertainty or variability in the physical properties of the EBS or in the diffusivity, density or porosity of the rock as little or no site-specific data were available.
The zero variant canister failure time is 1000 years, but a further three variants assumed complete failure at 10 ka and 100 ka and initial pinhole failure of the copper canister at the time of deposition, followed by complete failure after 1000 years.
As discussed in Section 9.4, there are no biosphere variants in the consequence analyses; all the calculation cases assume a drinking water pathway and it is conservatively assumed that the entire radionuclide flux through the far-field enters the well; in other words, the well does not simply sample a plume of contaminated water.
10.2 COMBINING VARIANTS INTO REFERENCE CASE CALCULATION CASES
After internal reductions within each Clearing House, 42 hydrogeology, 7 geochemistry and 4 canister variants remained to be analysed and the remaining Clearing Houses only produced zero variants. Each variant was combined with the zero variant from the other Clearing houses to produce a set of 35 near-field calculation cases and 29 integrated nearfield/far-field calculation cases.
10.3 VARIANTS AND CASES FOR THE CENTRAL SCENARIO
The analysis of CS conditions includes a time sequence description of variations in groundwater flow, geochemistry, rock stresses and surface environment and the variants and cases are designed to focus on these changes in system conditions, rather than exploring issues of conceptual and parameter uncertainty and variability, which were addressed by the Reference Case. A set of variants combining flow and geochemistry was set up to cover five periods over the next 100 ka. These combined groundwater fluxes up to ten times greater than those at the present day and oxidising or reducing groundwaters of low and high salinity with low and high organic contents. No attempt was made to estimate the likelihood of glacial loading leading to canister failures and the Reference Case Zero Variant case of failure at 1000 years was also used for the CS. Only one integrated near and far-field case was set up, combining the near-field base case flow and chemistry variant for each time period (which gives the highest release from the near-field) with a Reference Case Zero Variant far-field with an order of magnitude increase in Darcy velocity. Only the 55-70 ka glaciation period is analysed.

65
It was recognised that a thorough analysis of the CS would require further development of the SITE-94 consequence analysis codes so that they could handle time dependency of geometry, properties and boundary conditions in at least two dimensions. This was not possible during the project, and the CS calculation cases are thus regarded as rather limited. However, some scoping calculations of release and transport in a time-varying far-field were made in 2D using the LAPLACE-2D code to illustrate some of the anticipated impacts of CS conditions.


67
11 CONSEQUENCE ANALYSIS: RESULTS
Results are presented as fluxes of radionuclides from the near-field and the far-field in Bq/year and are for releases from a single canister. Far-field fluxes are converted to individual dose rates (Sv/year per canister) using the drinking water well pathway on Aspo. Near-field fluxes (into the geosphere) are also converted to individual doses in the same way but, since these do not represent actual releases to the biosphere, they are called intermediate dose rate potentials (IDPs).
Owing to the preliminary style of the biosphere model it is stressed that the doses presented should not be regarded as predictions of actual impacts, for comparison with the developing regulatory targets. Rather, they are intended as simple performance measures to put releases for different cases into perspective.
11.1 REFERENCE CASE
Figure 11.1 shows the flux of radionuclides from the near-field for the Zero Variant Case and Figure 11.2 shows this flux converted to IDPs. The natural decay series radionuclides are strongly sorbed in the bentonite and near-field rock, although Pa and Th are less well retarded than the others. The elements Pu, Np, U and Am all reach their solubility limits. Iodine dominates the IDPs for the first 20 ka until 226Ra takes over, producing the peak IDP at about 200 ka. Figure 11.3 shows the fate of 1291, 99Tc and the 4N actinide decay chain radionuclides at three different times after canister failure, in terms of their location (remaining in the near-field EBS and rock or having migrated into the far-field) or whether they have decayed. It can be seen that most of the '»re inventory never leaves the near-field and decays in situ, most of the 4N actinides never leave the near-field but have not decayed after 1 Ma and most of the 12'1leaves the near-field within a few tens of thousands of years.
Analysis of the near-field hydrogeological variants showed that:
• A wide range of Darcy velocities results in maximum releases which only vary by about two orders of magnitude. Releases are not a linear function of Darcy velocity.
• At low flow rates diffusion in the rock matrix and in the fracture dominates transport, with the exception of 36Cl, whose peak release shows no dependence on water flow rate, and 12'1, which shows less dependence than do the sorbing radionuclides.
The maximum fluxes in variants which address all of the variability and uncertainties in the Discrete Feature model vary within a range of about two orders of magnitude. The Stochastic Continuum model gives slightly lower releases owing to the lower water fluxes it predicts.
" Varying the flow wetted surface area has vittually no impact on near-field releases other than at very low Darcy velocities, where the effect is still small.

..::-~ c ~ ..: CO Q)
~ o-cc -X ::J
LL
10 6 ~----
10 5
10 4
10 3
10 2
10 3
/ . .
Total
... . ~ :-. , .-;. ........... _. 1-
. ·-, :,.....· I -·
---'
Ni-59 ...
;...: ,.. /
/
' ' ' ' ' - - - "' - Th-230 ' -....... -·. .. ·.
' ..... ' ' ' ' ' ' ' ' . '
·-. Pd-107 ' - -",--
• • .Sn-126 · I"' .. . I
'/,' ··Nb-94 I ,.. / ' .· /
/ ' " ·. " ..... -:1~ - ~~-239 "~ - U-234 . -· -
10 4 10 5 10 6
Time (years)
Figure 11.1 Flux from the near-fieldfor the near field Zero Variant Case ofthe Reference Case.
0\ 00

1 o-5 -----
Ra-226
1 o-6
Th-230 "C'
:§ c r3
Th-229----..... -ro 1 o-7 Q)
...... ......
...... ~ >
...... / en - Pa-231
a.. 0
................. -......................... .
1 o-8
Pu-242 - ---......
/ .· I / .· Cm-24 . -' / .· ...... / / /
7 ~ -- _ Np-237
/
1 o-9 • ,. 103 --------------------~~~~~~ 10 4 10 5
10 6
Time (years)
Figure 11.2 Intermediate Dose Potentialsfor releases from the near-jieldfor the near field Zero Variant Case ofthe Reference Case.
0\ \0

70
104 yr 105 yr 106 yr 104 yr 105 yr 106 yr ~---..---,~--.------ -.---.-----.,---.. ---..----n
0,9
0,8
0,7
0,6
0,5
0,4
0,3
0,2
0,1
0 4N 1-129 Tc-99
Figure 11.3 Mass balance (moles, normalised to initial inventory) at three times after canister failure for the 4N actinide chain, 129
/ and 99Tcfor the Zero Variant Case for the Reference Case. The shading indicates amounts present in different regions at each time.
Analysis of the near-field geochemical variants showed that:
• Oxidising conditions throughout the near-field lead to substantial increases in releases of several key radionuclides whose solubilities increase and/or whose sorption decreases. w.rc releases increase by more than four orders of magnitude, 237Np by more than three. When a redox front is simulated a few metres out into the near-field rock, these two radionuclides precipitate in the fracture and releases diminish substantially, although still being much higher than in the Zero Variant Case. The precipitates at the front then act as a source for 237Np daughter radionuclides, whose fluxes increase over other cases.
• Increased temperature has limited impacts on releases, giving increases of a factor of <5 (10-20 for U) for most radionuclides whose solubilities increase. Cases which explore variability and uncertainty in sorption have similarly limited impacts.
Cases which looked at a degraded bentonite buffer showed marked increases in releases and much earlier breakthrough times. The peak IDP for 12~ is two or three orders of magnitude higher and there is a larger contribution to the IDP from short-lived radionuclides, emphasising the importance of the buffer in the overall disposal system. A later canister failure time (10 ka) reduces the release of short-lived radionuclides and halves the flux of 12~ owing to the decreased rate of fuel dissolution (later failure gives longer duration matrix release) which affects the amount of 1291 released from the grain boundaries. Even later

71
failure (1 00 ka) causes several radionuclides to decay in the canister e4c and shorter lived isotopes of Pu, Am and Cm).
In all the near-field calculations, 12~ dominates early releases, with 226Ra and 23~ or 229Th dominating at later times. The range of peak IDPs from the single canister considered is around 10·7 to 104 Sv/year.
Figure 11 summarises some of the above findings by plotting peak near-field total IDPs against the times at which these peaks occur for a few selected near-field calculation cases. The principal radionuclide causing the peak IDP for each case is shown next to the points. Case A3 is the zero variant, cases A5 and 18 have high Darcy velocities (case A18 being the 'poor' near field with highest Darcy velocity and lowest flow wetted surface area), case A16 has unfavourable fracture properties (reduced fracture spacing), case El simulates oxidising conditions in the near-field, case B2 is for canister failure at 100 ka and case D 1, for a degraded buffer, shows the highest IDP.
e (Dominant radionuclide, near-field variant)
+ Zero variant (Ra-226, A3)
(Th-229, D1) 11
(Ra-226, A 18) e
(Np-237, E1) 8 (Th-230, AS) e
(Ra-226, A16)8
(Ra-226, A3) + (Ra-226, 82) liD
10 5 Time (years)
Figure 11.4 Total peak IDPs from the near-field for the Reference Case and the times at which they occur. The principal radionuclides responsible for the peak are shown by each point. See text for details.

72
Figures 11.5 and 11.6 show the fluxes and individual dose rates for radionuclides released from the geosphere to the biosphere for the Reference Case integrated near and fa:r~field Zero Variant Case. Comparing with Figures 11.1 and 11.2 shows the impact of the geosphere in reducing relea<;es from the near-field. It can be seen that the poorly sorbing 12~ and 36Cl are practically unaffected by passage through the rock, but the later near-field peak IDP from 226Ra and 230oyh is decreased to a biosphere dose several orders of magnitude lower. In fact, the geosphere has little retarding effect on radionuclides with Kd < 0.5 m3/kg but a substantial one on those with Kct > 1 m3/kg. In cases with a low F-ratio in the far-field (large Darcy velocity and small flow wetted surface area of fractures) the retarding effect of the geosphere diminishes considerably for all radionuclides; the converse also being true for high F-ratios. Thus, the geosphere can act as a good or a poor barrier to migration of a radionuclide, depending on the combination ofF-ratio and Kd.

"C' CD 1i) "2 ~
10 6
10 5
~ m CD 104
~ aJ .._..
~ u::
10 3 ·-
Total
Tc-99
Pd-1 07
10 6
Time (years)
Figure 11.5 Flux from thefar-fieldfor the integrated Zero Variant Case for the Reference Case. Note that the decay series nuclides have a flux <1 d Bqlyear, canister.
-l (.»

1 o-5
Total
1 o-6
'C' 1 o-7
~ ·c: ea 0 ~ 1 o-a ea Q)
<:-> ~
1 o-9 Q) / ro I / \ ~ ~ ~ -.!
+:.. L.;.
Q) UJ 0 1 o-1o Cl
1 o-11 Se-79
Time (years)
Figure 11.6 Dose rates for releases from thefar-fieldfor the integrated Zero Variant Case for the Reference Case.

75
Where both the near and far-field experience oxidising conditions (thus reducing the Kd-value for Np, Pu, Se, Tc and U) the far-field has almost no effect in reducing releases of these radionuclides from the near-field unless the F-ratio is medium to high in value. Even in these circumstances, 9~c and 237Np are largely unaffected and have high releases.
Figure 11.7 summarises some of the integrated near and far-field calculation cases in the same way as was done in Figure 11.4 for the near-field. The two clusters of points to the lower left and upper right illustrate how, when the geosphere performs well, 1291 tends to dominate the peak release, which occurs at times generally <100 ka. When the geosphere performs poorly, 226Ra and 237Np tend to dominate peak releases, which occur after 100 ka. The combination of the 'poor' near-field (case A18) with similarly 'poor' far-field conditions (FF37 and 41) can be seen to give the highest releases. If oxidising near-field conditions (El) are attached to a 'poor' far-field, releases then become dominated by 237Np rather than 226Ra. Case FF4 illustrates the effect of having favourable far-field hydrogeological conditions (a high F-ratio) and FF15 shows the effect of the highest F-ratio value used in reducing peak dose and pushing peak release time for 1291 out beyond 100 ka, compared to the Zero Variant.
(!) (/)
0 "'0
~ 10'6 (!)
a. ru -0
1--
e {Do m in an! radionuclide, near-field variant+ far-field variant) + Zero variant (1-129. A3+FFO)
e(Ra-226, A18+FF41)
e (Ra-226, A 18+FF37) : (Np-237, E1+FF41)
(Np-237, E1+FF37)
(Np-237, E1+FFO)II e(Np-237, E1+FF4)
(Ra-226, A3+FF41)8
(1-129, A3+FFO) + e(!-129,A18+FF4)
10 5
Time (years}
IlD (1-129, A3+FF15)
Figure 11.7 Total peak dose rates from the far-field for the Reference Case and the times at which they occur. The principal radionuclides responsible for the peak are shown by each point. See text for details.
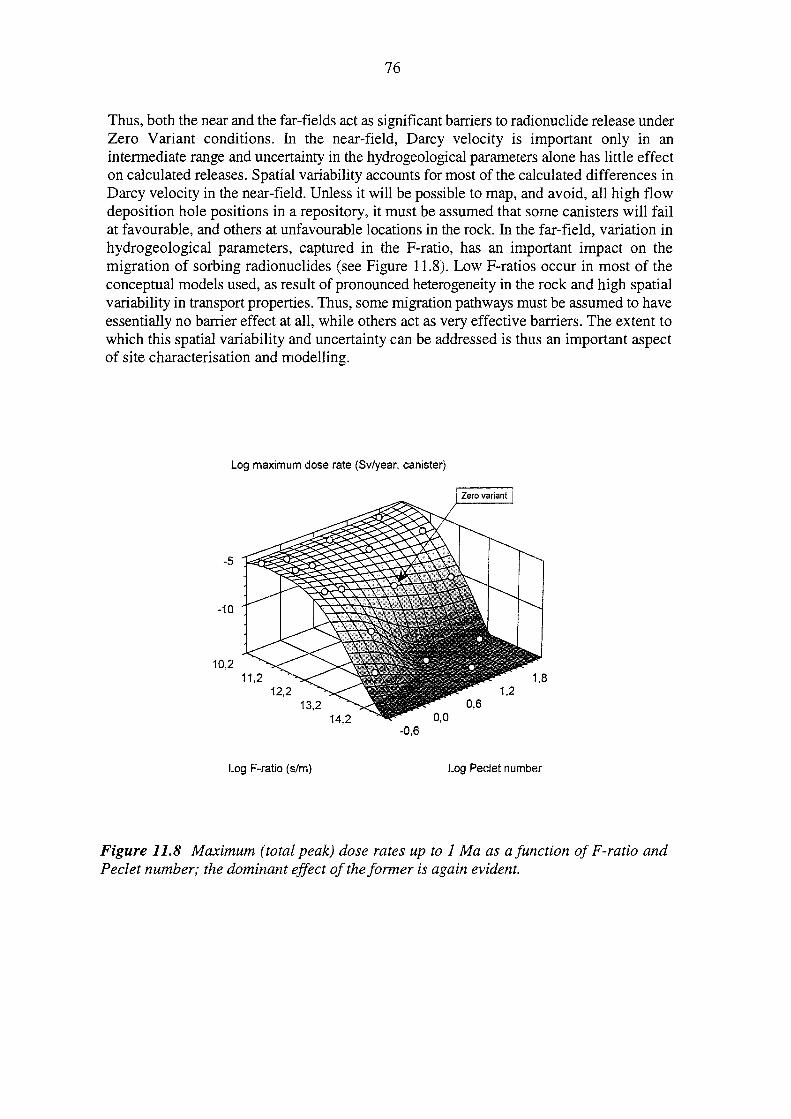
76
Thus, both the near and the far-fields act as significant barriers to radionuclide release under Zero Variant conditions. In the near-field, Darcy velocity is important only in an intermediate range and uncertainty in the hydrogeological parameters alone has little effect on calculated releases. Spatial variability accounts for most of the calculated differences Darcy velocity in the near-field. Unless it will be possible to map, and avoid, all high flow deposition hole positions in a repository, it must be assumed that some canisters will fail at favourable, and others at unfavourable locations in the rock. In the far-field, variation in hydrogeological parameters, captured in the F-ratio, has an important impact on the migration of sorbing radionuclides (see Figure 11.8). Low F-ratios occur in most of the conceptual models used, as result of pronounced heterogeneity in the rock and high spatial variability in transport properties. Thus, some migration pathways must be assumed to have essentially no barrier effect at all, while others act as very effective barriers. The extent to which this spatial variability and uncertainty can be addressed is thus an important aspect of site characterisation and modelling.
Log maximum dose rate (Sv/year, canister)
-5
-iO
10,2
-0,6
Log F-ratio (s/m) Log Peclet number
Figure 11.8 Maximum (total peak) dose rates up to 1 Ma as a function ofF-ratio and Peclet number; the dominant effect of the fanner is again evident.

77
11.2 CENTRAL SCENARIO
The near-field calculations for the CS were designed to illustrate the impact of changing water flow and redox conditions during a glaciation, with one case assuming that oxidising conditions extend all the way into the waste and the other that only the near-field rock and bentonite are oxidised. The calculations examined a sub-set of radionuclides (129I, 9'Tc and the actinide chains) for a period up to 100 ka which includes the first of the glaciations (55-70 ka) of the CS. Figure 11.9 shows the IDPs for the first (most conservative) of the two cases. The dominant radionuclides are the same as in the Reference Case and the largest differences from the Reference Case are seen to be in the behaviour of 99Tc and 237Np during the glaciation period, owing to their drastically increased solubilities and decreased sorption. Overall, the IDP of radionuclides in the CS glaciation is about a factor of two higher than in the Reference Case Zero Variant over the same time period, but not any higher than the peak IDP for the Reference Case (which occurs at about 200 ka). The actual releases of actinides during the glaciation period are about 300 times greater than in the Reference Case. Essentially the whole amount of 99Tc in the near-field is released by an intrusion of oxidising water occurring over the 15 ka period of the glaciation. A sudden intrusion of oxidising water has the potential to mobilise redox-sensitive radionuclides, even if it is only of short duration.
The integrated near and far-field calculations for the CS only looked at the glaciation period itself, assuming fully oxidising conditions in both near and far-field and using a clearly hypothetical drinking water recipient well simply to be able to compare doses to those of the Reference Case. The analysis shows that dose rates in this period increase by several orders of magnitude as a result of increased near-field releases, increased Darcy velocity and reduced far-field sorption. Although 226Ra continues to dominate doses in this period, there is also a substantial contribution from 9'Tc and 237Np.
The limitations of using non-time dependent consequence analysis codes to evaluate the CS was mentioned earlier. Exploratory modelling of the full 130 ka of the CS using LAPLACE-2D thus supplemented the work described above and assessed the behaviour of 129I and 79Se, the latter as a representative of average sorbing radionuclides, under different flow conditions (geochemical variations were not simulated). The objective was to explore variations in release to the surface during all the different climate states of the CS. The study identified periods when releases could be several orders of magnitude higher or lower than those assumed using fixed flow boundary conditions, including periods when the geosphere could be effectively 'flushed' of concentrations of radionuclides which had built up in earlier, pennafrost periods. It is clearly necessary to be cautious in predicting repository behaviour when the uncertainties introduced by time dependency are taken into account and it is acknowledged that SITE-94 has not propagated many of the potential impacts of climate change into the consequence analysis stage of P A.

1 o-5
10-6
"C' .sa .5Q
- :::::::TC-99 ~ I\ I \
Np-237
I
c: cu (.)
..: cu 10-7 Q)
<:-> en -c... 0 -· ....,.,. ..... ---
1 o-8 ~ \
./ \ -...:....
./ / --
\ --· \ ' U-234 ' " ..-"
' '\ _J 10-9 / / ....r ..-" -
10 4 Time (years) 10 5
Figure 11.9 Intermediate Dose Potentialsfor releases from the near-fieldfor one of the Central Scenario cases, based on a subset of radionuclides and focus sing on impacts of the first glacial period (see text for details).
-..J 00

79
11.3 THE FULL REPOSITORY: MULTIPLE CANISTER FAILURES
The whole of the consequence analysis has been presented as impacts for a single failed container of waste. Inspection of these results shows that in most of the Reference Case variants, many canisters would have to fail between 1000 years and 100 ka if the overall consequence is to approach the regulatory target criteria currently in place. The exact time distribution of failures is also of limited importance owing to the long periods over which releases take place. A repository would not perform well if several canisters failed under oxidising conditions at locations discharging into a low F-ratio far-field pathway. Only one or two failures are likely to be acceptable if a degraded buffer were to be combined with a low F-ratio far-field. Until there is a glaciation, such unfavourable conditions are judged to be very unlikely.


81
12 CONCLUSIONS
The principal conclusions of SITE-94 lie in two distinct areas; those having implications for safety assessment of the disposal concept analysed and those having implications for the way in which SKI will carry out its regulatory function in respect of site selection, system design and repository licensing.
12.1 IMPLICATIONS FOR SAFETY ASSESSMENT
The top-level technical findings concerning assessment of the safety of the KBS-3 disposal concept are grouped into those concerning unquantifiable aspects of our understanding of the disposal system and those concerning quantifiable aspects of barrier perfonnance in the disposal system.
12.1.1 System Understanding
The Process fufluence Diagram is thought to represent all of the relevant FEPs and links upon which system understanding is based and only moderate future revisions are likely to be needed. It would be valuable to have other groups of experts use the PID and attribute their own importance levels to processes in order to see how robust system understanding is to alternative perspectives. SITE-94 did not address all of the areas of system behaviour; specifically:
• SITE-94 only carried out a limited evaluation of EFEPs and no quantitative assessment of Supplementary Scenarios.
• A number of processes were not evaluated, even in the Reference Case: gas evolution, microbially mediated processes, colloids and the long-term physicochemical behaviour of bentonite receiving little attention.
• There was no formal mapping of the PID for the CS to an associated AMF, resulting in only patchy consequence analysis of selected aspects of the CS. This highlights the value of the PID and the AMF as auditing tools.
Clearly, work remains to be done in these areas.
12.1.2 Key Aspects of Barrier Performance
At the time of SITE-94, neither the design nor the quality assurance procedures for the EBS were in place, so many conclusions on EBS behaviour are provisional and the opportunity remains to tailor designs to cope with specific identified potential impacts.
EBS: Spent Fuel: The earlier the canister fails, the more rapid the dissolution of the fuel: failure at 1000 years leads to total dissolution in 15 ka, but failure at 100 ka leads to a total dissolution period of 360 ka. Considerable uncertainties exist in modelling the radiolytic

82
oxidative dissolution process and no fully coupled model of all the mechanisms involved is yet available. The solubility and precipitation/dissolution behaviour of radionuclides in the fuel and the remainder of the EBS has been treated conservatively in SITE-94. Where adverse conditions indicate unacceptable mobilisation using this approach, it would be appropriate to consider more realistic models using more tightly constrained data. This is important for time-dependent changes in porewater and groundwater chemistries and for some of the Supplementary Scenarios.
EBS: Canister: A very long canister lifetime (of the order of at least 100 ka) is advantageous in that it spreads the risk of multiple simultaneous failures, reduces the impact of short-lived radionuclides and contributes to reducing risks from long-lived species. Intermediate lifetimes have little or no incremental value over a short (c. 1000 year) lifetime. Lack of information on the behaviour and properties of real, full sized copper-steel canisters is hampering quantitative evaluation of their likely performance. There are still questions about the potential for common cause failures under glacial conditions and about both general and localised corrosion rates and mechanisms.
EBS: Buffer: Arguably the key component of the EBS, in that it contributes the bulk of the transport resistance of the entire disposal system once the canister is breached, provided it performs as designed. Variant analyses of a degraded buffer produce notably poor system performance. SITE-94 did not look at its long term mechanical evolution, interaction with the canister, gas migration through it or its response to changing hydrochemical and stress states in the near-field rock. In addition, uncertainties were identified in diffusivity and sorption data.
Geosphere: Understanding the Site: SITE-94 analysed all the available site data simultaneously. 3D modelling techniques proved very useful in handling and displaying the data and large-scale flow and hydrochemistry modelling provided a useful context for understanding the evolution of groundwater conditions at the site. A site model consistent with most data was produced but the links between datasets in the different 'disciplines' of site investigation is rather weak. Although a large amount of hydrogeological data exists, considerable uncertainties and lack of data do exist in terms of the hydraulic connectivity of different positions in the rock, and in terms of transport/retardation properties (F-ratios) along migration paths. No single modelling approach made use of all the data available to it. In addition, the data do not contain critical information for conclusive discrimination between alternative conceptual models, which must thus be retained as a measure of the envelope of conceptual uncertainty and propagated through the P A work.
Geosphere: Hydrogeology: The data density at the site is insufficient to characterise all the major groundwater transport structures and it is inevitable that some are not included in the site model. In addition, at a smaller scale, fracture intensities and connectivities are heterogeneous and both issues are addressed by using stochastic models and multiple variants of these models in the consequence analysis. Owing to the small-scale heterogeneity, site data may not be sufficient to ascertain the effects on hydraulic conductivity at a single canister, near-field scale: the modelling approaches show considerable spatial variability to exist This variability is a feature of the site which has to be accepted and is not necessarily an uncertainty which can be reduced by obtaining more data. For multiple canister failure models, information on spatial variability can be used directly in the PA, rather than being incorporated simply as parameter variability for flow around a single
83
canister. Thus, information on spatial variability may lead to a judgement on the number of 'good' canister locations and, consequently, on the acceptability of the site as a whole. The F-ratio, which also displays significant uncertainty and spatial variability between different release points, has proved to be a critical parameter allowing meaningful predictions to be made about the retention properties of the site.
Geosphere: Mechanical Behaviour: The deposition holes have been shown to remain mechanically stable under both Reference Case and CS conditions: predicted shear displacements along fractures under thermal and glacial loading are small and will have negligible impact on stability. However, the distribution of hydraulic conductivities in the near-field will change in a time dependent fashion as a result of excavation, heating and cooling and climate change impacts, affecting the location of potential migration paths although not the bulk rock permeability. There are several uncertainties associated with the rock mechanical analysis in SITE-94, for example concerning the conceptual models and the parameter values selected. Further, SITE-94 has not analysed hydraulic couplings with mechanical effects. Given the fundamental importance of a mechanically stable repository environment, there is a scope for further work in this area.
Geosphere: Geochemistry: A stable geochemical environment will persist for many thousands of years after repository closure but may be perturbed by climate change impacts, the most significant of which may be the intrusion of oxygenated water to depth during glacial retreat. Redox conditions in the near-field are of central importance in P A calculations, as radionuclide solubility and sorption can both be affected. The site characterisation, while providing much useful hydrochemical data, could have provided better information if designed with this objective at the forefront.
Radionuclide Migration: In the near-field, the overall repository performance will be determined, among other things, by the number of 'wet' and 'dry' canister deposition holes, a function of variability in flow properties. However, variability in flow wetted surface area and in fracture aperture and spacing in the near-field appear to have little impact on radionuclide migration from 'wet' holes. Uncertainties in sorption data are worth reducing as there may be significant positive impacts on estimates of the retention of weakly sorbing radionuclides in the EBS materials. The susceptibility of the near-field to oxygenated waters (in terms of its buffering behaviour) needs better understanding, as some radionuclides (99Tc especially) are readily mobilised by the penetration of oxidising conditions deep into the EBS. In the far-field, the regional discharge location of Aspo means that groundwater travel times tend to be short and poorly sorbed radionuclides are ineffectively retarded by the geosphere. The value of the geosphere in retarding other radionuclides is critically sensitive to uncertainties in the flow models, characterised in SITE-94 by the F-ratio in particular. Semi-stochastic flow models which can estimate the consequences of an incompletely characterised spatial variability in far-field flow are essential: their use at Aspo has shown that the effectiveness of the geosphere as a barrier to radionuclide migration will be highly variable, with some pathways having almost no barrier function and others being highly effective. Overall performance is thus critically dependent on the location of a failed canister with respect to these far-field migration paths.
Finally, two other uncertainties are attached to the SITE-94 analysis of radionuclide migration. First, although the process of matrix diffusion (and sorption) was represented in the assessment calculations, and no sorption was attributed to the fracture coatings, the

84
degree of conservativeness that this represents is not clear and better site specific data on the distribution of fracture coatings and matrix porosity with respect to flow wetted surface areas would assist in refining this. Second, it is recognised that transport and release under CS conditions is significantly enhanced and that episodic releases, changing biosphere receptors and 'knock-on' transient effects are possible, which would require a more sophisticated analysis than was carried out in SITE-94.
12.2 IMPLICATIONS FOR SKI
The SITE-94 project has permitted SKI to make some major technological advances in P A methodology, in the assimilation of real site data into a PA and in the treatment of uncertainties.
Prior to SITE-94, SKI had no experience of handling site data and the way in which 'raw' site characterisation data need to be interpreted and prepared for sensible incorporation into P A calculations has had to be developed from scratch: no other P A is known to have made such detailed and extensive use of site-specific data and addressed the uncertainties involved as comprehensively by means of alternative models and variant analyses. Lessons were learned in terms of what comprises useful information, how to store it, to manage it and to present it.
The systems approach PA methodology developed is unique in providing a comprehensive means of structuring and guiding P A, constructing scenarios, defining calculation cases and allowing properly controlled information management and documentation throughout. In this respect, it provides a firm foundation for a Quality Assurance programme relevant to evaluating safety assessment submissions. The PID and AMF methodology will thus be useful tools for structuring the review of future SKB assessments and submissions. However, it was not possible to test an of the methodology developed during SITE-94 and further work is required in this area before the approach is used in a regulatory context.
SKI has advanced its capabilities in reviewing P A by further training of SKI staff, development and testing of a PA toolkit and by setting up workable internal procedures to organise and implement such reviews. The structure of SITE-94 follows broadly that which SKI will use to present its evaluation of a formal PA submission from SKB, but is clearly lacking in much of the detail that will be necessary at that stage, reflecting the research nature of SITE-94.
The existence of the PIDs, associated databases and experiences in modelling alternative interpretations (especially in the field of hydrogeology) means that future SKI efforts can be focussed more on updating and review before the techniques are applied: it will not be necessary to repeat many of the SITE-94 exercises, even for a different site. At the close of Project-90, SKI noted that the earlier conclusion by the Government (following the review of KBS-3) that safe final disposal of spent nuclear fuel is feasible in Sweden remained valid. The work carried out in SITE-94 has identified nothing to alter this general conclusion. SKI remains confident that the KBS-3 disposal concept is a realistic main alternative for SKB's further research and development work. However, SKI notes that several important uncertainties still need to be resolved, both with respect to the long-term performance of the engineered barriers, particularly the canister and with respect to the

85
evolution of the geosphere. Recurrent up-dated Performance Assessments will play an important role in directing and integrating future research and technical development work. The final test will be in fitting the selected disposal concept to site specific properties and developing a fully integrated site-specific Performance Assessment for the selected site.
In light of the significant reviewing tasks that SKI will have to face relatively soon, SKI will primarily strive for the improvement in the methodologies developed and in carefully directed research into the more important uncertainties in system behaviour.


87
APPENDIX 1
SITE-94 BACKGROUND REPORTS
SKI Technical Report
93:23 Site characterization in fractured crystalline rock, A critical review of geohydraulic measurement methods Andersson, P., Andersson, J-E., Gustafsson, E., Nordqvist, R., and Voss, C.
93:25 Initial two dimensional groundwater flow calculations for SITE-94 Boghammar, A., and Grundfelt, B.
93:27 Scenario development FEP audit list preparation: Methodology and presentation Stenhouse, M., Chapman, N., and Sumerling, T.
SKI Report
94:6 Korrosion av kopparmaterial fOr inkapsling av radioaktivt avfall - En litteraturstudie (Corrosion of copper materials for encapsulation of radioactive waste- A literature study; in Swedish) Engman, U., and Hermansson, H-P.
95:12 User guide for CALIBRE, version 2 Worgan, K., and Robinson, P.
95:13 The CALIBRE source-term code: Technical documentation for version 2 Worgan, K., and Robinson, P.
95:26 Systems analysis, scenario construction and consequence analysis definition for SITE-94 Chapman, N., Andersson, J., Robinson, P., Skagius, K., Wene, C-0., Wiborgh, M., and Wingefors, S.
95:29 Some properties of copper and selected heavy metal sulfides, a limited literature review Herrnansson, H-P.
95:30 On the specific surface area parameter: a sensitivity study with a Discrete Fracture network model Nordqvist, W., Dverstorp, B., and Andersson, J.
95:40 Far-field rock mechanics modelling for nuclear waste disposal Hansson, H., Stephansson, 0., and Shen, B.

88
95:41 Rock mechanics modelling for the stability and safety of a nuclear waste repository. Executive summary Hansson, H., Shen, B., Stephansson, 0., and Jing, L.
95:42 The Central Scenario for SITE-94 King-Clayton, L., Chapman, N., Kautsky, F., Svensson, N-0., de Marsily, G., Ledoux E
95:44 The SKN conceptual model of Aspo Sundquist, U., and Torssander, P.
95:55 The CRYSTAL geosphere transport model: Technical documentation, version 2.1 Worgan, K., and Robinson, P.
95:56 User guide for CRYSTAL, version 1 Worgan, K.
95:73 Revised Pourbaix diagrams for copper at 5-150 oc Beverskog, B., and Puigdomenech, I.
96:2 Chemical and physical transport parameters for SITE-94 Andersson, K.
96:4 Generalized radial flow interpretation of well tests for the SITE-94 project Geier, J.E., Doe, T.W., Benabderrahman A., and Hassler, L.
96:5 Discrete-feature modelling of the Aspo site: 1. Discrete-fracture network models for the repository scale Geier, and Thomas, A.L.
96:6 Discrete-feature modelling of the Aspo site: 2. Development of the integrated sitescale model Geier, J.E.
96:7 Discrete-feature modelling of the Aspo site: 3. Predictions of hydrogeological parameters for performance assessment Geier, J.E.
96:8 Discrete-feature modelling of the Aspo site: 4. Source data and detailed analysis procedures Geier, J.E.
96:9 Stochastic Continuum hydrological model of Aspo Tsang, Y.W.
96: 10 Site-specific base data for the performance assessment Geier, J.E., Tiren, S., Dverstorp, B., and Glynn, P.

89
96: 11 Glaciation and regional ground-water flow in the Fennoscandian shield Provost, A., Voss, C, and Neuzil, C
96:12 Transport sensitivity studies for SITE-94: Time-dependent site-scale modelling of future glacial impact King-C1ayton, L., and Smith, P.
96: 13 Hydrogeology of Asp6 Island, Simpevarp, Sweden Voss, C., Tiren, S., and Glynn, P.
96: 14 Simple evaluation of ground water flux and radionuclide transport at Aspo Dverstorp, B., Geier, J., and Voss, C.
96:15 Preliminary analysis of geostatistical structure of Aspo borehole data Le Loc'h, G. and Osland, R.
96: 16 Development of a geological and structural model of Aspo, southeastern Sweden Tiren, S., Beckholmen, M., Voss, C., and Askling, P.
96:17 Near-field rock mechanical modelling for nuclear waste disposal Shen, B., and Stephansson, 0.
96:18 Modelling of rock fracture propagation for nuclear waste disposal Shen, B., and Stephansson, 0.
96:19 Comparison of the SKI, SKB and SKN geological and structural models of the Aspo area Tiren, S.
96:29 Geochemical characterization of Simpevarp ground waters near the Aspo Hard Rock Laboratory Glynn, P., and Voss,
96:30 Radionuclide solubilities for SITE-94 Arthur, R., and Apted, M.
96:31 Modelling of near-field chemistry for SITE-94 Arthur, R., and Apted, M.
96:32 Modelling of groundwater chemistry at .Aspo Hard Rock Laboratory Emren,A.
96:33 Mineralogy at the .Aspo site Andersson, K.
96:34 Adaption of mechanistic sorption models for performance assessment calculations Arthur,R.
90
96:35 Estimated rates of redox-front migration in granitic rocks Arthur, R.
96:36 SKI SITE-94, Deep repository perforn1ance assessment project
96:46 CAMEO: A model of mass-transport limited general corrosion of copper canisters Worgan, K., and Apted, M.
96:55 Korrosionsscenarier for koppar-jamkapseln vid slutfOrvar av anvant kambransle (Corrosion scenarios for the copper/iron canister at final disposal of spent nuclear fuel; in Swedish) Beverskog, B.
96:62 A biosphere model for use in SITE-94 Barrdahl, R.
97:5 SKI SITE-94, Deep repository performance assessment project, Summary
97:6 SKI SITE-94, Sakerhetsanalysprojekt for djupfOrvar i kristallint berg, Sarnmanfattning (Swedish summary)

STATENS KÄRNKRAFTINSPEKTIONSwedish Nuclear Power Inspectorate
STATENS KÄRNKRAFTINSPEKTIONSwedish Nuclear Power Inspectorate
ISSN 1104-1374ISRN SKI-R--97/5--SE
February 1997
Summary
SKI Report 97:5