SkewIT: Skew Index Test for detecting mis-assembled ... · SkewIT: Skew Index Test for detecting...
14
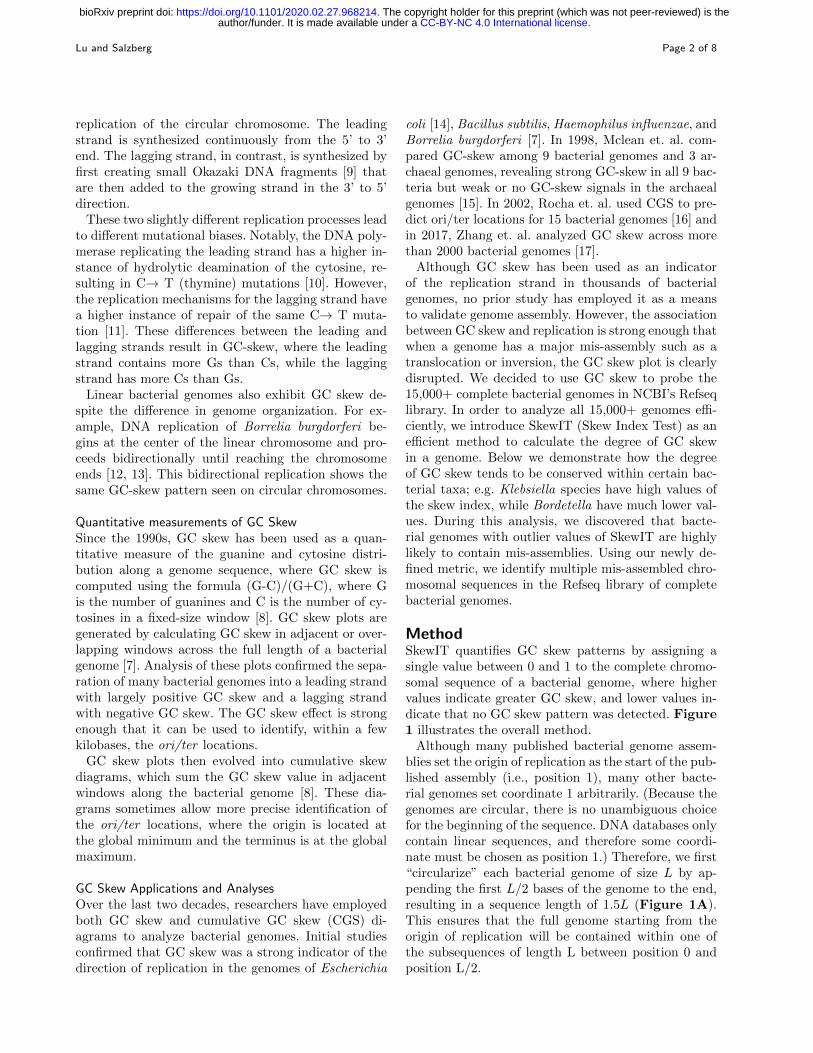
Lu and Salzberg RESEARCH SkewIT: Skew Index Test for detecting mis-assembled bacterial genomes Jennifer Lu 1,2* and Steven L Salzberg 1,2,3 Abstract GC skew is a phenomenon observed in many bacterial genomes, wherein the two replication strands of the same chromosome contain different proportions of guanine and cytosine nucleotides. Here we demonstrate that this phenomenon, which was first discovered in the mid-1990s, can be used today as an analysis tool for the 15,000+ complete bacterial genomes in NCBI’s Refseq library. In order to analyze all 15,000+ genomes, we introduce a new method, SkewIT (Skew Index Test), which calculates a single metric representing the degree of GC skew for a genome. Using this metric, we demonstrate how GC skew patterns are conserved within certain bacterial phyla, e.g. Firmicutes, but show different patterns in other phylogenetic groups such as Actinobacteria. We also discovered that outlier values of SkewIT highlight potential bacterial mis-assemblies. Using our newly defined metric, we identify multiple mis-assembled chromosomal sequences in NCBI’s Refseq library of complete bacterial genomes. Software Availability: SkewIT scripts for analysis of bacterial genomes are provided in the following repository: https://github.com/jenniferlu717/SkewIT. Keywords: GC Skew; genome assembly; Bacterial genomics Background Two of the largest and most widely-used nucleotide databases are GenBank [1], which has been a shared repository for more than 25 years (and which is mir- rored by the EMBL and DDBJ databases [1, 2]), and RefSeq, a curated subset of GenBank [2]. For se- quences to be entered into RefSeq, curators at NCBI perform both automated and manual checks to en- sure minimal contamination and high sequence quality. Despite these efforts, multiple studies have identified contamination in RefSeq and other publicly available genome databases [3, 4, 5, 6]. NCBI requires Refseq assemblies to have an appropriate genome length as compared to existing genomes from the same species, and it labels assemblies as “complete” if the genome exists in one contiguous sequence per chromosome, with no unplaced scaffolds and with all chromosomes present. However, NCBI does not perform additional checks, most of which would be computationally ex- pensive, to ensure that a genome sequence was as- sembled correctly. In this study, we propose a new * Correspondence: [email protected] 1 Department of Biomedical Engineering, Johns Hopkins University, 21218, Baltimore, United States 2 Center for Computational Biology, Whiting School of Engineering, Johns Hopkins University, 21218 Baltimore, United States Full list of author information is available at the end of the article method, SkewIT (Skew Index Test), for validating bac- terial genome assemblies based on the phenomenon of GC-skew. We applied this method to 15,067 complete bacterial genomes in RefSeq, identifying many poten- tial misassemblies as well as trends in GC-skew that are characteristic of some bacterial clades. Bacterial GC Skew GC skew is a non-homogeneous distribution of nu- cleotides in bacterial DNA strands first discovered in the mid-1990s [7, 8]. Although double-stranded DNA must contain precisely equal numbers of cytosine (C) and guanine (G) bases, the distribution of these nu- cleotides along a single strand in bacterial chromo- somes may be asymmetric. Analysis of many bacterial chromosomes has revealed two distinct compartments, one that is more G-rich and the other that is more C-rich. Most bacterial genomes are organized into single, cir- cular chromosomes. Replication of the circular chro- mosomes begins at a single point known as the origin of replication (ori ) and proceeds bidirectionally until reaching the replication terminus (ter ). Because the replication process only adds DNA nucleotides to the 3’ end of a DNA strand, it must use two slightly dif- ferent DNA synthesis methods to allow bidirectional . CC-BY-NC 4.0 International license author/funder. It is made available under a The copyright holder for this preprint (which was not peer-reviewed) is the . https://doi.org/10.1101/2020.02.27.968214 doi: bioRxiv preprint
Transcript of SkewIT: Skew Index Test for detecting mis-assembled ... · SkewIT: Skew Index Test for detecting...
Lu and Salzberg
RESEARCH
SkewIT: Skew Index Test for detectingmis-assembled bacterial genomesJennifer Lu1,2* and Steven L Salzberg1,2,3
Abstract
GC skew is a phenomenon observed in many bacterial genomes, wherein the two replication strands of thesame chromosome contain different proportions of guanine and cytosine nucleotides. Here we demonstrate thatthis phenomenon, which was first discovered in the mid-1990s, can be used today as an analysis tool for the15,000+ complete bacterial genomes in NCBI’s Refseq library. In order to analyze all 15,000+ genomes, weintroduce a new method, SkewIT (Skew Index Test), which calculates a single metric representing the degreeof GC skew for a genome. Using this metric, we demonstrate how GC skew patterns are conserved withincertain bacterial phyla, e.g. Firmicutes, but show different patterns in other phylogenetic groups such asActinobacteria. We also discovered that outlier values of SkewIT highlight potential bacterial mis-assemblies.Using our newly defined metric, we identify multiple mis-assembled chromosomal sequences in NCBI’s Refseqlibrary of complete bacterial genomes.
Software Availability: SkewIT scripts for analysis of bacterial genomes are provided in the followingrepository: https://github.com/jenniferlu717/SkewIT.
Keywords: GC Skew; genome assembly; Bacterial genomics
BackgroundTwo of the largest and most widely-used nucleotidedatabases are GenBank [1], which has been a sharedrepository for more than 25 years (and which is mir-rored by the EMBL and DDBJ databases [1, 2]),and RefSeq, a curated subset of GenBank [2]. For se-quences to be entered into RefSeq, curators at NCBIperform both automated and manual checks to en-sure minimal contamination and high sequence quality.Despite these efforts, multiple studies have identifiedcontamination in RefSeq and other publicly availablegenome databases [3, 4, 5, 6]. NCBI requires Refseqassemblies to have an appropriate genome length ascompared to existing genomes from the same species,and it labels assemblies as “complete” if the genomeexists in one contiguous sequence per chromosome,with no unplaced scaffolds and with all chromosomespresent. However, NCBI does not perform additionalchecks, most of which would be computationally ex-pensive, to ensure that a genome sequence was as-sembled correctly. In this study, we propose a new
*Correspondence: [email protected] of Biomedical Engineering, Johns Hopkins University, 21218,
Baltimore, United States2Center for Computational Biology, Whiting School of Engineering, Johns
Hopkins University, 21218 Baltimore, United States
Full list of author information is available at the end of the article
method, SkewIT (Skew Index Test), for validating bac-terial genome assemblies based on the phenomenon ofGC-skew. We applied this method to 15,067 completebacterial genomes in RefSeq, identifying many poten-tial misassemblies as well as trends in GC-skew thatare characteristic of some bacterial clades.
Bacterial GC SkewGC skew is a non-homogeneous distribution of nu-cleotides in bacterial DNA strands first discovered inthe mid-1990s [7, 8]. Although double-stranded DNAmust contain precisely equal numbers of cytosine (C)and guanine (G) bases, the distribution of these nu-cleotides along a single strand in bacterial chromo-somes may be asymmetric. Analysis of many bacterialchromosomes has revealed two distinct compartments,one that is more G-rich and the other that is moreC-rich.
Most bacterial genomes are organized into single, cir-cular chromosomes. Replication of the circular chro-mosomes begins at a single point known as the originof replication (ori) and proceeds bidirectionally untilreaching the replication terminus (ter). Because thereplication process only adds DNA nucleotides to the3’ end of a DNA strand, it must use two slightly dif-ferent DNA synthesis methods to allow bidirectional
.CC-BY-NC 4.0 International licenseauthor/funder. It is made available under aThe copyright holder for this preprint (which was not peer-reviewed) is the. https://doi.org/10.1101/2020.02.27.968214doi: bioRxiv preprint
Lu and Salzberg Page 2 of 8
replication of the circular chromosome. The leadingstrand is synthesized continuously from the 5’ to 3’end. The lagging strand, in contrast, is synthesized byfirst creating small Okazaki DNA fragments [9] thatare then added to the growing strand in the 3’ to 5’direction.
These two slightly different replication processes leadto different mutational biases. Notably, the DNA poly-merase replicating the leading strand has a higher in-stance of hydrolytic deamination of the cytosine, re-sulting in C→ T (thymine) mutations [10]. However,the replication mechanisms for the lagging strand havea higher instance of repair of the same C→ T muta-tion [11]. These differences between the leading andlagging strands result in GC-skew, where the leadingstrand contains more Gs than Cs, while the laggingstrand has more Cs than Gs.
Linear bacterial genomes also exhibit GC skew de-spite the difference in genome organization. For ex-ample, DNA replication of Borrelia burgdorferi be-gins at the center of the linear chromosome and pro-ceeds bidirectionally until reaching the chromosomeends [12, 13]. This bidirectional replication shows thesame GC-skew pattern seen on circular chromosomes.
Quantitative measurements of GC SkewSince the 1990s, GC skew has been used as a quan-titative measure of the guanine and cytosine distri-bution along a genome sequence, where GC skew iscomputed using the formula (G-C)/(G+C), where Gis the number of guanines and C is the number of cy-tosines in a fixed-size window [8]. GC skew plots aregenerated by calculating GC skew in adjacent or over-lapping windows across the full length of a bacterialgenome [7]. Analysis of these plots confirmed the sepa-ration of many bacterial genomes into a leading strandwith largely positive GC skew and a lagging strandwith negative GC skew. The GC skew effect is strongenough that it can be used to identify, within a fewkilobases, the ori/ter locations.
GC skew plots then evolved into cumulative skewdiagrams, which sum the GC skew value in adjacentwindows along the bacterial genome [8]. These dia-grams sometimes allow more precise identification ofthe ori/ter locations, where the origin is located atthe global minimum and the terminus is at the globalmaximum.
GC Skew Applications and AnalysesOver the last two decades, researchers have employedboth GC skew and cumulative GC skew (CGS) di-agrams to analyze bacterial genomes. Initial studiesconfirmed that GC skew was a strong indicator of thedirection of replication in the genomes of Escherichia
coli [14], Bacillus subtilis, Haemophilus influenzae, andBorrelia burgdorferi [7]. In 1998, Mclean et. al. com-pared GC-skew among 9 bacterial genomes and 3 ar-chaeal genomes, revealing strong GC-skew in all 9 bac-teria but weak or no GC-skew signals in the archaealgenomes [15]. In 2002, Rocha et. al. used CGS to pre-dict ori/ter locations for 15 bacterial genomes [16] andin 2017, Zhang et. al. analyzed GC skew across morethan 2000 bacterial genomes [17].
Although GC skew has been used as an indicatorof the replication strand in thousands of bacterialgenomes, no prior study has employed it as a meansto validate genome assembly. However, the associationbetween GC skew and replication is strong enough thatwhen a genome has a major mis-assembly such as atranslocation or inversion, the GC skew plot is clearlydisrupted. We decided to use GC skew to probe the15,000+ complete bacterial genomes in NCBI’s Refseqlibrary. In order to analyze all 15,000+ genomes effi-ciently, we introduce SkewIT (Skew Index Test) as anefficient method to calculate the degree of GC skewin a genome. Below we demonstrate how the degreeof GC skew tends to be conserved within certain bac-terial taxa; e.g. Klebsiella species have high values ofthe skew index, while Bordetella have much lower val-ues. During this analysis, we discovered that bacte-rial genomes with outlier values of SkewIT are highlylikely to contain mis-assemblies. Using our newly de-fined metric, we identify multiple mis-assembled chro-mosomal sequences in the Refseq library of completebacterial genomes.
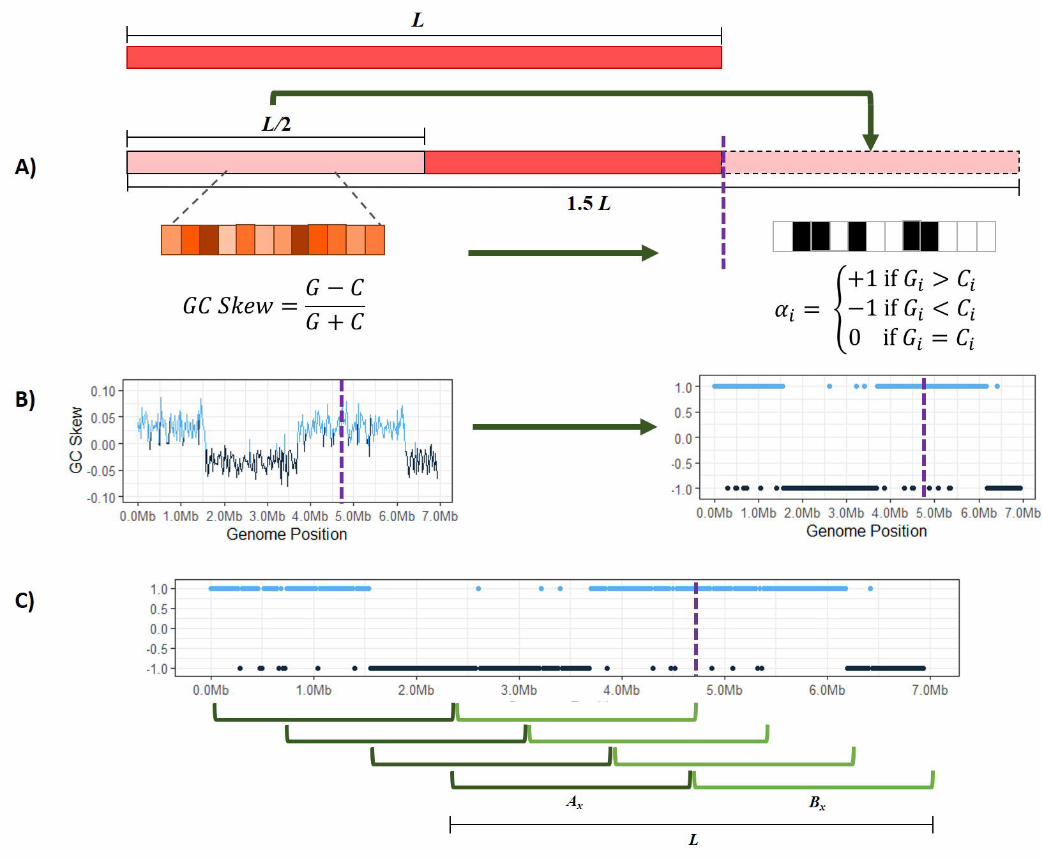
MethodSkewIT quantifies GC skew patterns by assigning asingle value between 0 and 1 to the complete chromo-somal sequence of a bacterial genome, where highervalues indicate greater GC skew, and lower values in-dicate that no GC skew pattern was detected. Figure1 illustrates the overall method.
Although many published bacterial genome assem-blies set the origin of replication as the start of the pub-lished assembly (i.e., position 1), many other bacte-rial genomes set coordinate 1 arbitrarily. (Because thegenomes are circular, there is no unambiguous choicefor the beginning of the sequence. DNA databases onlycontain linear sequences, and therefore some coordi-nate must be chosen as position 1.) Therefore, we first“circularize” each bacterial genome of size L by ap-pending the first L/2 bases of the genome to the end,resulting in a sequence length of 1.5L (Figure 1A).This ensures that the full genome starting from theorigin of replication will be contained within one ofthe subsequences of length L between position 0 andposition L/2.
.CC-BY-NC 4.0 International licenseauthor/funder. It is made available under aThe copyright holder for this preprint (which was not peer-reviewed) is the. https://doi.org/10.1101/2020.02.27.968214doi: bioRxiv preprint
Lu and Salzberg Page 3 of 8
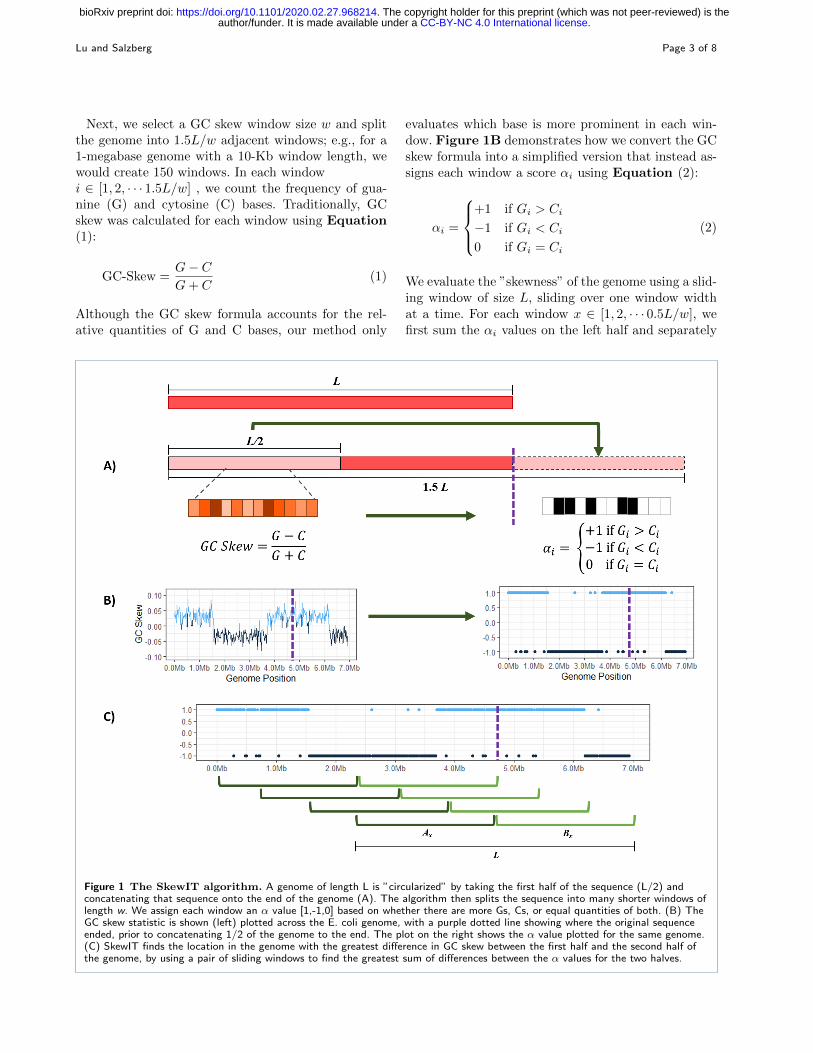
Next, we select a GC skew window size w and splitthe genome into 1.5L/w adjacent windows; e.g., for a1-megabase genome with a 10-Kb window length, wewould create 150 windows. In each windowi ∈ [1, 2, · · · 1.5L/w] , we count the frequency of gua-nine (G) and cytosine (C) bases. Traditionally, GCskew was calculated for each window using Equation(1):
GC-Skew =G− CG+ C
(1)
Although the GC skew formula accounts for the rel-ative quantities of G and C bases, our method only
evaluates which base is more prominent in each win-dow. Figure 1B demonstrates how we convert the GCskew formula into a simplified version that instead as-signs each window a score αi using Equation (2):
αi =
+1 if Gi > Ci
−1 if Gi < Ci
0 if Gi = Ci
(2)
We evaluate the ”skewness” of the genome using a slid-ing window of size L, sliding over one window widthat a time. For each window x ∈ [1, 2, · · · 0.5L/w], wefirst sum the αi values on the left half and separately
Figure 1 The SkewIT algorithm. A genome of length L is ”circularized” by taking the first half of the sequence (L/2) andconcatenating that sequence onto the end of the genome (A). The algorithm then splits the sequence into many shorter windows oflength w. We assign each window an α value [1,-1,0] based on whether there are more Gs, Cs, or equal quantities of both. (B) TheGC skew statistic is shown (left) plotted across the E. coli genome, with a purple dotted line showing where the original sequenceended, prior to concatenating 1/2 of the genome to the end. The plot on the right shows the α value plotted for the same genome.(C) SkewIT finds the location in the genome with the greatest difference in GC skew between the first half and the second half ofthe genome, by using a pair of sliding windows to find the greatest sum of differences between the α values for the two halves.
.CC-BY-NC 4.0 International licenseauthor/funder. It is made available under aThe copyright holder for this preprint (which was not peer-reviewed) is the. https://doi.org/10.1101/2020.02.27.968214doi: bioRxiv preprint
Lu and Salzberg Page 4 of 8
on the right half of the window (the genome). We cal-culate the absolute difference between the two sums,as shown in Equation (3) and Figure 1C:
|Ax −Bx| =
∣∣∣∣∣∣x+L/2w∑
i=x
αi −x+L/w∑
i=x+L/2w
αi
∣∣∣∣∣∣ (3)
Ax is the sum of the α values within the first half ofthe window, and Bx is the sum of the α values for thesecond half. For example, Equation (4) shows how wecalculate |A1 − B1|, the skewness for the first slidingwindow from a genome.
|A−B| =
∣∣∣∣∣∣L/2w∑i=1
αi −L/w∑
i=L/2w
αi
∣∣∣∣∣∣ (4)
Finally, we determine the maximum value of |Ax −Bx|, which gives us the window where the greatestdifference exists between the GC content of one half ofthe genome and the GC content of the other half. Inorder to be provide a consistent value between 0 and 1despite genome length L or window size w, we definethe skew index (SkewI) as the following normalizedvalue:
SkewI =w
Lmax|Ax −Bx| (5)
Results and DiscussionWe applied the SkewIT method using a window sizeof 20Kb to the complete bacterial genomes from NCBIRefSeq Release 97 (released on November 4, 2019).We only evaluated bacterial chromosomes that were> 50,000bp in length and excluded plasmids from thisanalysis. In total, we tested 15,067 genomes represent-ing 4,471 species and 1,148 genera. SupplementalTable 1 lists each genome with their SkewI values.The table also provides the main taxonomy assign-ments for each genome.
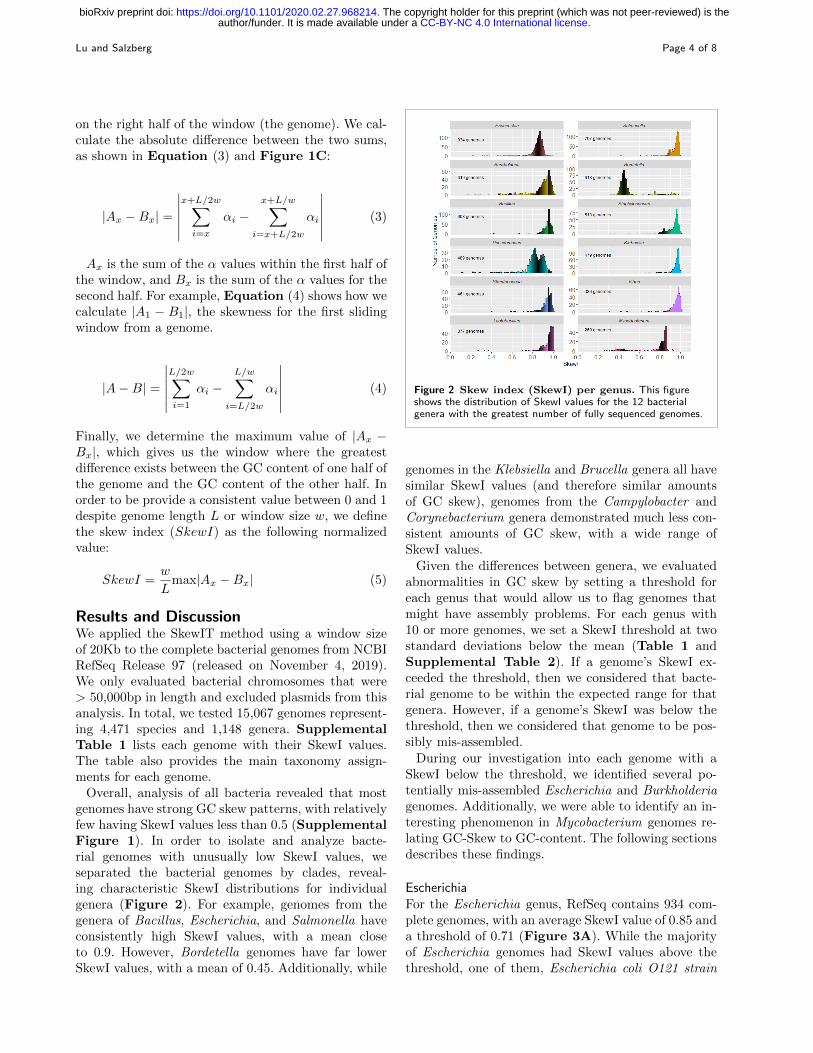
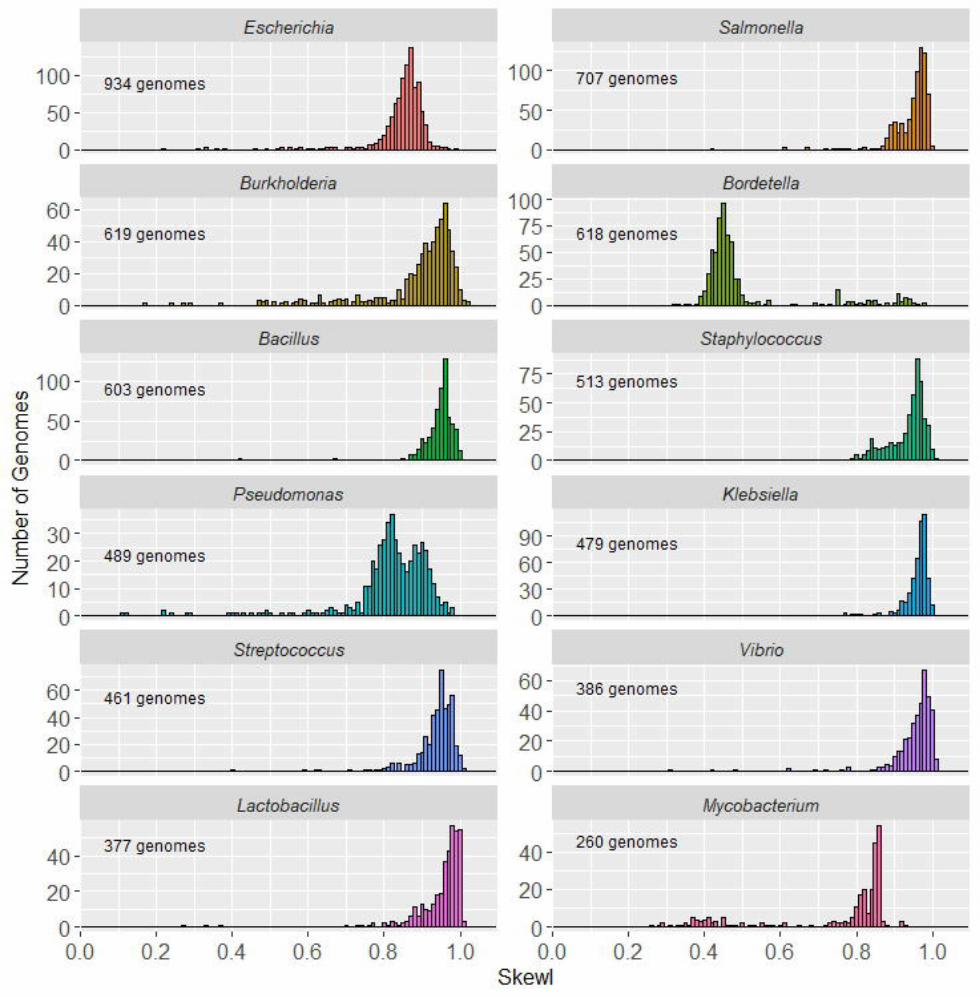
Overall, analysis of all bacteria revealed that mostgenomes have strong GC skew patterns, with relativelyfew having SkewI values less than 0.5 (SupplementalFigure 1). In order to isolate and analyze bacte-rial genomes with unusually low SkewI values, weseparated the bacterial genomes by clades, reveal-ing characteristic SkewI distributions for individualgenera (Figure 2). For example, genomes from thegenera of Bacillus, Escherichia, and Salmonella haveconsistently high SkewI values, with a mean closeto 0.9. However, Bordetella genomes have far lowerSkewI values, with a mean of 0.45. Additionally, while
Figure 2 Skew index (SkewI) per genus. This figureshows the distribution of SkewI values for the 12 bacterialgenera with the greatest number of fully sequenced genomes.
genomes in the Klebsiella and Brucella genera all havesimilar SkewI values (and therefore similar amountsof GC skew), genomes from the Campylobacter andCorynebacterium genera demonstrated much less con-sistent amounts of GC skew, with a wide range ofSkewI values.
Given the differences between genera, we evaluatedabnormalities in GC skew by setting a threshold foreach genus that would allow us to flag genomes thatmight have assembly problems. For each genus with10 or more genomes, we set a SkewI threshold at twostandard deviations below the mean (Table 1 andSupplemental Table 2). If a genome’s SkewI ex-ceeded the threshold, then we considered that bacte-rial genome to be within the expected range for thatgenera. However, if a genome’s SkewI was below thethreshold, then we considered that genome to be pos-sibly mis-assembled.
During our investigation into each genome with aSkewI below the threshold, we identified several po-tentially mis-assembled Escherichia and Burkholderiagenomes. Additionally, we were able to identify an in-teresting phenomenon in Mycobacterium genomes re-lating GC-Skew to GC-content. The following sectionsdescribes these findings.
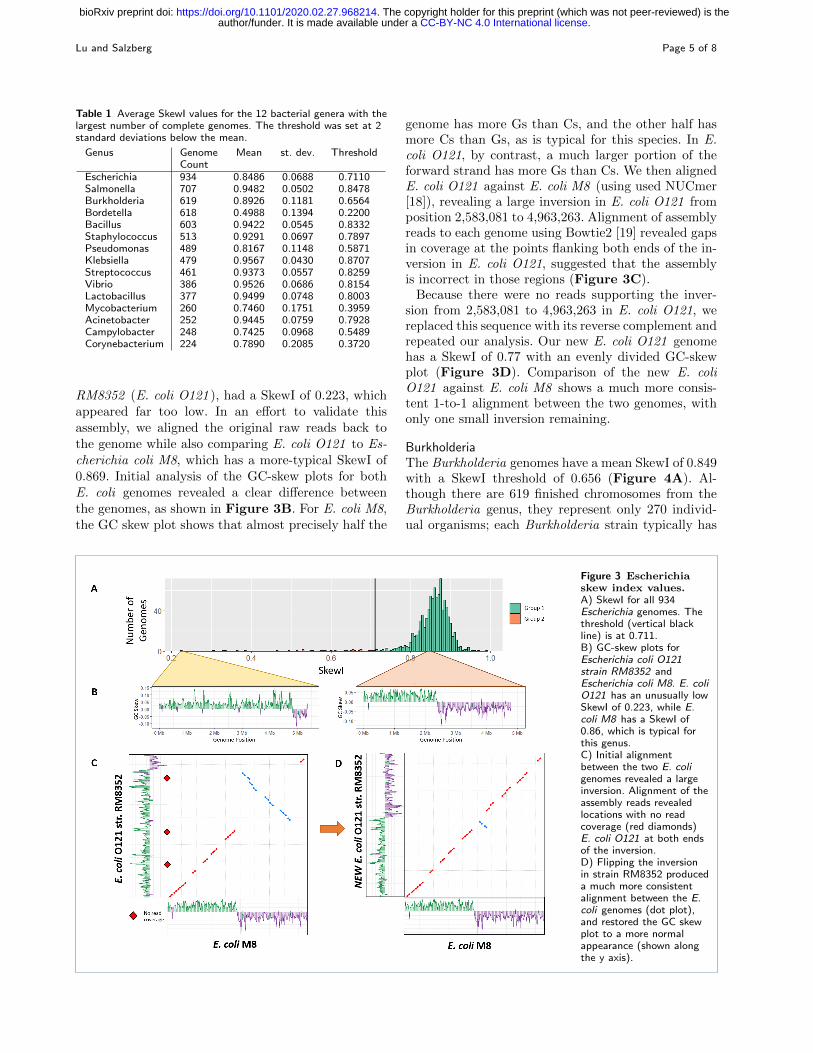
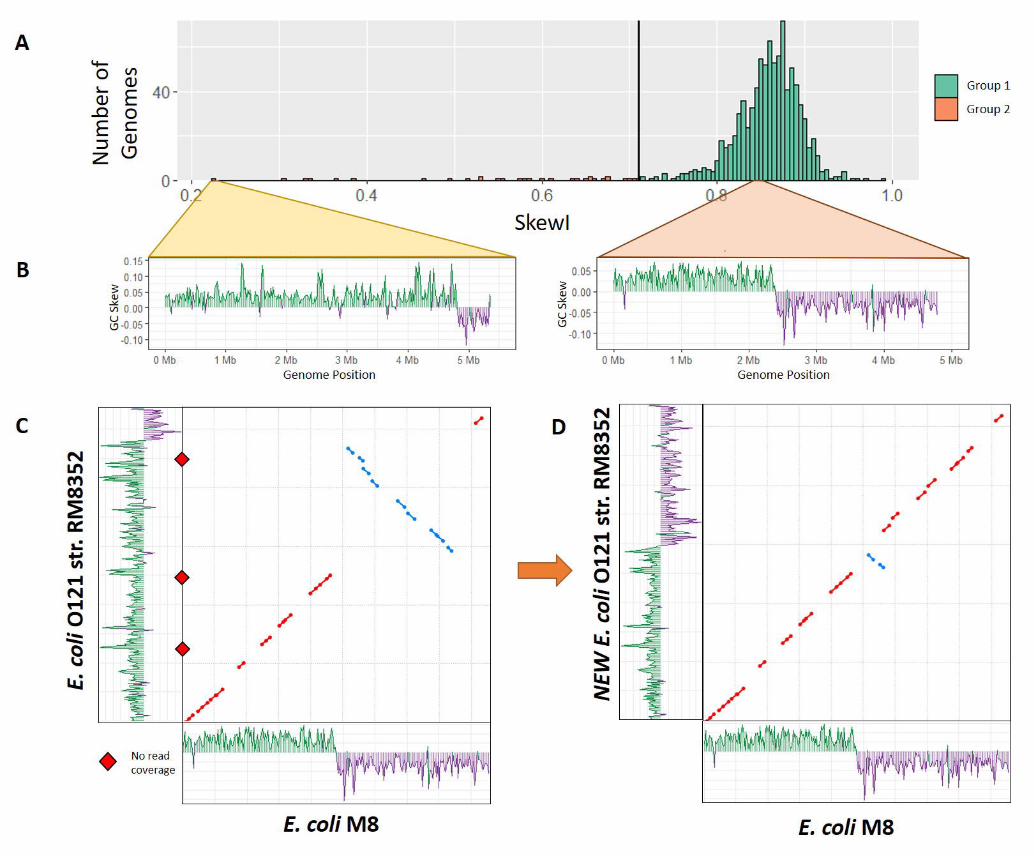
EscherichiaFor the Escherichia genus, RefSeq contains 934 com-plete genomes, with an average SkewI value of 0.85 anda threshold of 0.71 (Figure 3A). While the majorityof Escherichia genomes had SkewI values above thethreshold, one of them, Escherichia coli O121 strain
.CC-BY-NC 4.0 International licenseauthor/funder. It is made available under aThe copyright holder for this preprint (which was not peer-reviewed) is the. https://doi.org/10.1101/2020.02.27.968214doi: bioRxiv preprint
Lu and Salzberg Page 5 of 8
Table 1 Average SkewI values for the 12 bacterial genera with thelargest number of complete genomes. The threshold was set at 2standard deviations below the mean.
Genus GenomeCount
Mean st. dev. Threshold
Escherichia 934 0.8486 0.0688 0.7110Salmonella 707 0.9482 0.0502 0.8478Burkholderia 619 0.8926 0.1181 0.6564Bordetella 618 0.4988 0.1394 0.2200Bacillus 603 0.9422 0.0545 0.8332Staphylococcus 513 0.9291 0.0697 0.7897Pseudomonas 489 0.8167 0.1148 0.5871Klebsiella 479 0.9567 0.0430 0.8707Streptococcus 461 0.9373 0.0557 0.8259Vibrio 386 0.9526 0.0686 0.8154Lactobacillus 377 0.9499 0.0748 0.8003Mycobacterium 260 0.7460 0.1751 0.3959Acinetobacter 252 0.9445 0.0759 0.7928Campylobacter 248 0.7425 0.0968 0.5489Corynebacterium 224 0.7890 0.2085 0.3720
RM8352 (E. coli O121 ), had a SkewI of 0.223, whichappeared far too low. In an effort to validate thisassembly, we aligned the original raw reads back tothe genome while also comparing E. coli O121 to Es-cherichia coli M8, which has a more-typical SkewI of0.869. Initial analysis of the GC-skew plots for bothE. coli genomes revealed a clear difference betweenthe genomes, as shown in Figure 3B. For E. coli M8,the GC skew plot shows that almost precisely half the
genome has more Gs than Cs, and the other half hasmore Cs than Gs, as is typical for this species. In E.coli O121, by contrast, a much larger portion of theforward strand has more Gs than Cs. We then alignedE. coli O121 against E. coli M8 (using used NUCmer[18]), revealing a large inversion in E. coli O121 fromposition 2,583,081 to 4,963,263. Alignment of assemblyreads to each genome using Bowtie2 [19] revealed gapsin coverage at the points flanking both ends of the in-version in E. coli O121, suggested that the assemblyis incorrect in those regions (Figure 3C).
Because there were no reads supporting the inver-sion from 2,583,081 to 4,963,263 in E. coli O121, wereplaced this sequence with its reverse complement andrepeated our analysis. Our new E. coli O121 genomehas a SkewI of 0.77 with an evenly divided GC-skewplot (Figure 3D). Comparison of the new E. coliO121 against E. coli M8 shows a much more consis-tent 1-to-1 alignment between the two genomes, withonly one small inversion remaining.
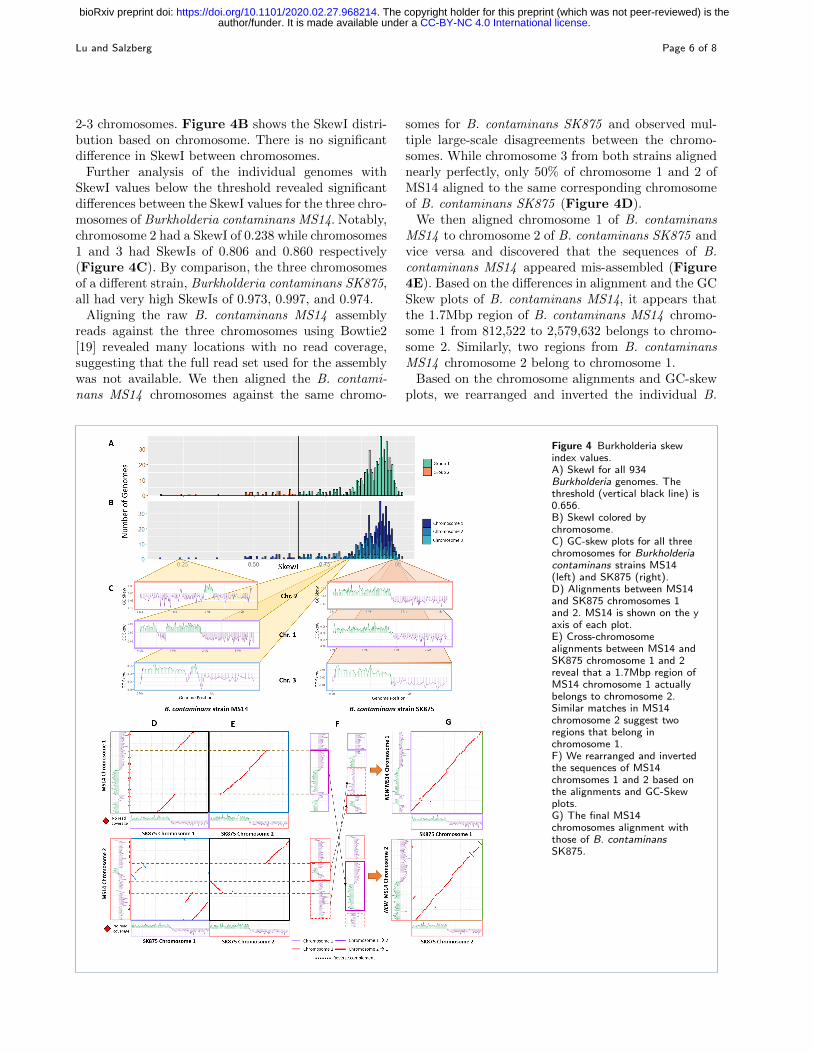
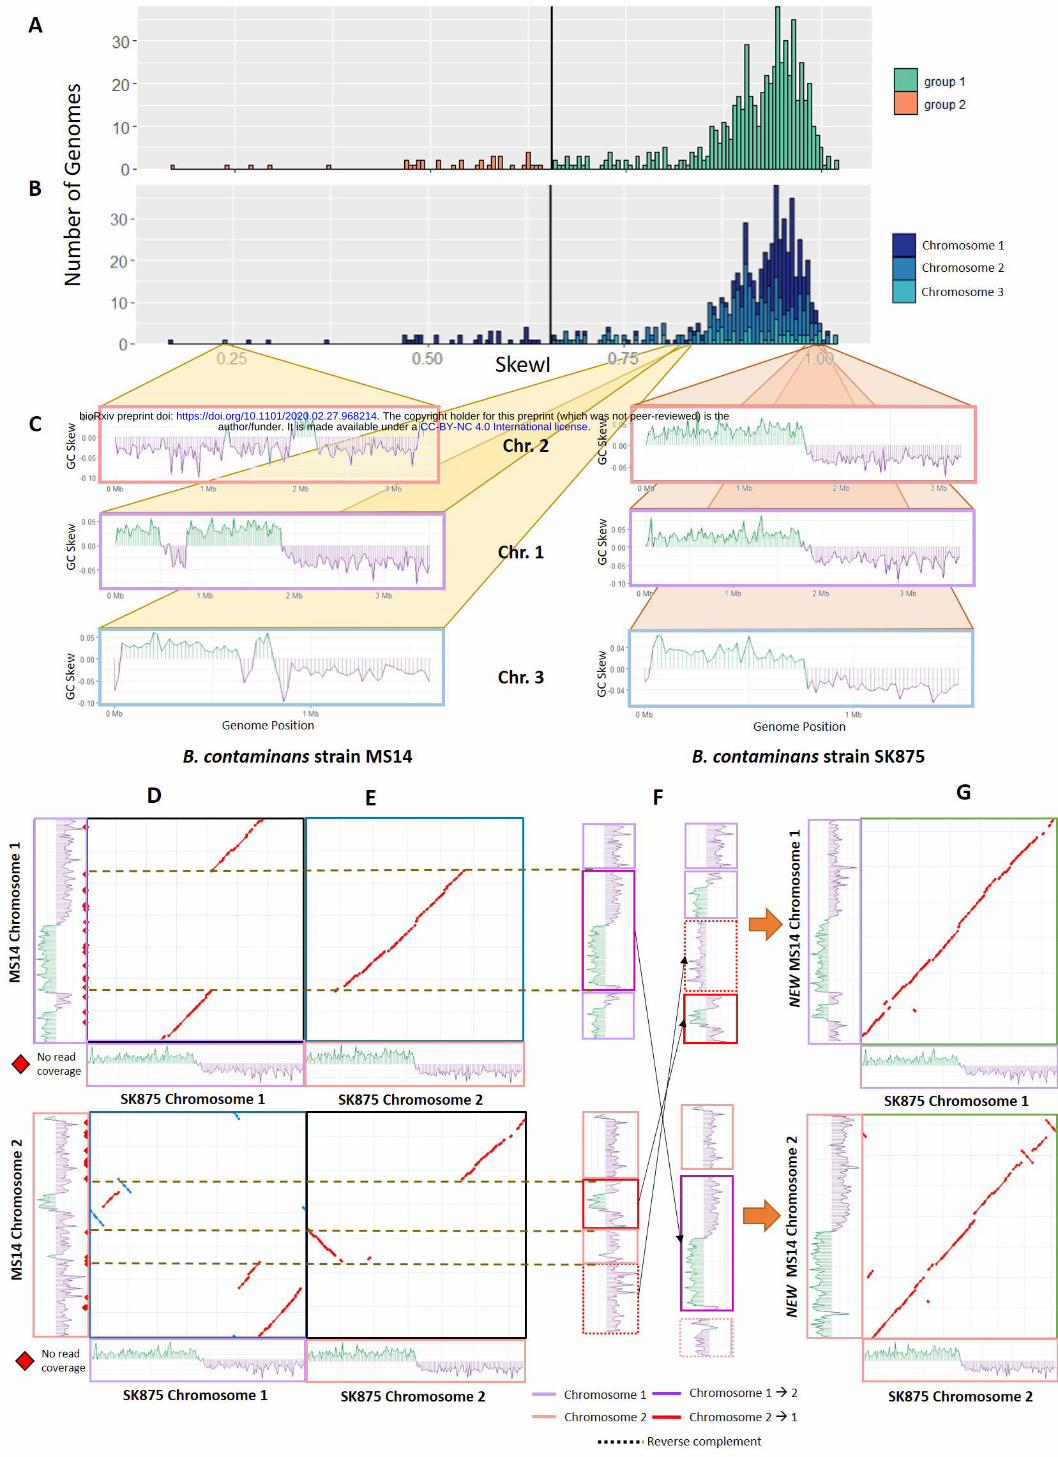
BurkholderiaThe Burkholderia genomes have a mean SkewI of 0.849with a SkewI threshold of 0.656 (Figure 4A). Al-though there are 619 finished chromosomes from theBurkholderia genus, they represent only 270 individ-ual organisms; each Burkholderia strain typically has
Figure 3 Escherichiaskew index values.A) SkewI for all 934Escherichia genomes. Thethreshold (vertical blackline) is at 0.711.B) GC-skew plots forEscherichia coli O121strain RM8352 andEscherichia coli M8. E. coliO121 has an unusually lowSkewI of 0.223, while E.coli M8 has a SkewI of0.86, which is typical forthis genus.C) Initial alignmentbetween the two E. coligenomes revealed a largeinversion. Alignment of theassembly reads revealedlocations with no readcoverage (red diamonds)E. coli O121 at both endsof the inversion.D) Flipping the inversionin strain RM8352 produceda much more consistentalignment between the E.coli genomes (dot plot),and restored the GC skewplot to a more normalappearance (shown alongthe y axis).
.CC-BY-NC 4.0 International licenseauthor/funder. It is made available under aThe copyright holder for this preprint (which was not peer-reviewed) is the. https://doi.org/10.1101/2020.02.27.968214doi: bioRxiv preprint
Lu and Salzberg Page 6 of 8
2-3 chromosomes. Figure 4B shows the SkewI distri-bution based on chromosome. There is no significantdifference in SkewI between chromosomes.
Further analysis of the individual genomes withSkewI values below the threshold revealed significantdifferences between the SkewI values for the three chro-mosomes of Burkholderia contaminans MS14. Notably,chromosome 2 had a SkewI of 0.238 while chromosomes1 and 3 had SkewIs of 0.806 and 0.860 respectively(Figure 4C). By comparison, the three chromosomesof a different strain, Burkholderia contaminans SK875,all had very high SkewIs of 0.973, 0.997, and 0.974.
Aligning the raw B. contaminans MS14 assemblyreads against the three chromosomes using Bowtie2[19] revealed many locations with no read coverage,suggesting that the full read set used for the assemblywas not available. We then aligned the B. contami-nans MS14 chromosomes against the same chromo-
somes for B. contaminans SK875 and observed mul-tiple large-scale disagreements between the chromo-somes. While chromosome 3 from both strains alignednearly perfectly, only 50% of chromosome 1 and 2 ofMS14 aligned to the same corresponding chromosomeof B. contaminans SK875 (Figure 4D).
We then aligned chromosome 1 of B. contaminansMS14 to chromosome 2 of B. contaminans SK875 andvice versa and discovered that the sequences of B.contaminans MS14 appeared mis-assembled (Figure4E). Based on the differences in alignment and the GCSkew plots of B. contaminans MS14, it appears thatthe 1.7Mbp region of B. contaminans MS14 chromo-some 1 from 812,522 to 2,579,632 belongs to chromo-some 2. Similarly, two regions from B. contaminansMS14 chromosome 2 belong to chromosome 1.
Based on the chromosome alignments and GC-skewplots, we rearranged and inverted the individual B.
Figure 4 Burkholderia skewindex values.A) SkewI for all 934Burkholderia genomes. Thethreshold (vertical black line) is0.656.B) SkewI colored bychromosome.C) GC-skew plots for all threechromosomes for Burkholderiacontaminans strains MS14(left) and SK875 (right).D) Alignments between MS14and SK875 chromosomes 1and 2. MS14 is shown on the yaxis of each plot.E) Cross-chromosomealignments between MS14 andSK875 chromosome 1 and 2reveal that a 1.7Mbp region ofMS14 chromosome 1 actuallybelongs to chromosome 2.Similar matches in MS14chromosome 2 suggest tworegions that belong inchromosome 1.F) We rearranged and invertedthe sequences of MS14chromsomes 1 and 2 based onthe alignments and GC-Skewplots.G) The final MS14chromosomes alignment withthose of B. contaminansSK875.
.CC-BY-NC 4.0 International licenseauthor/funder. It is made available under aThe copyright holder for this preprint (which was not peer-reviewed) is the. https://doi.org/10.1101/2020.02.27.968214doi: bioRxiv preprint
Lu and Salzberg Page 7 of 8
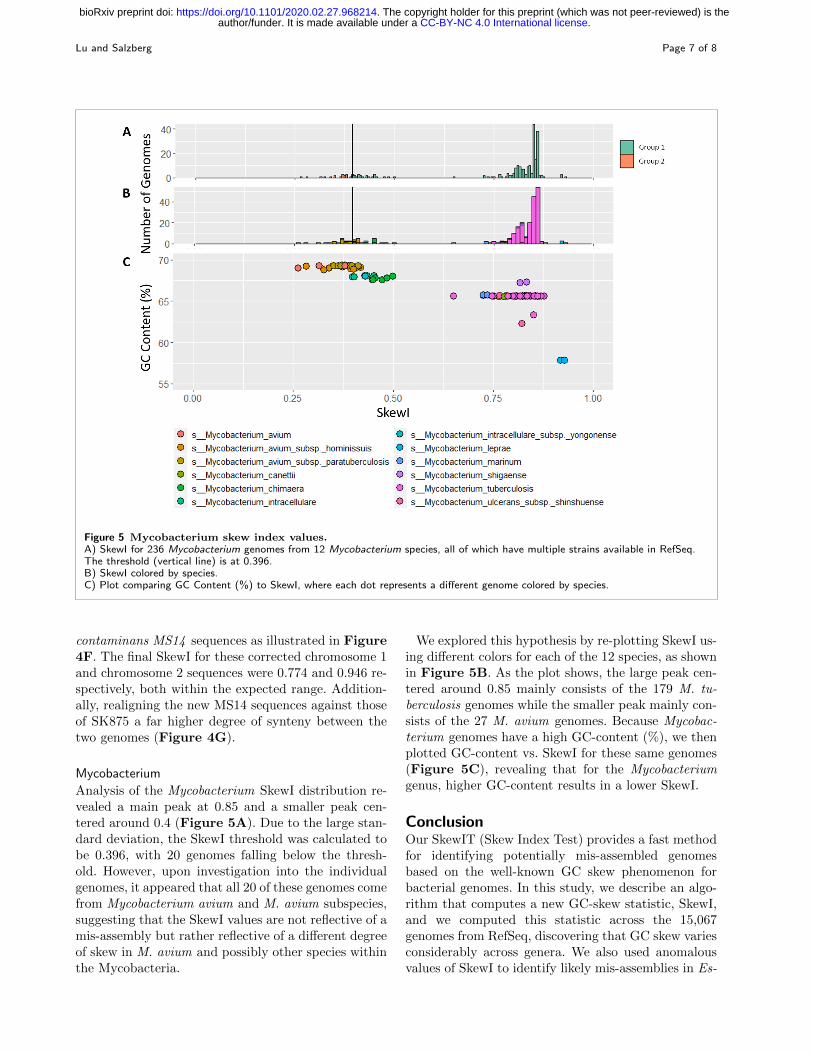
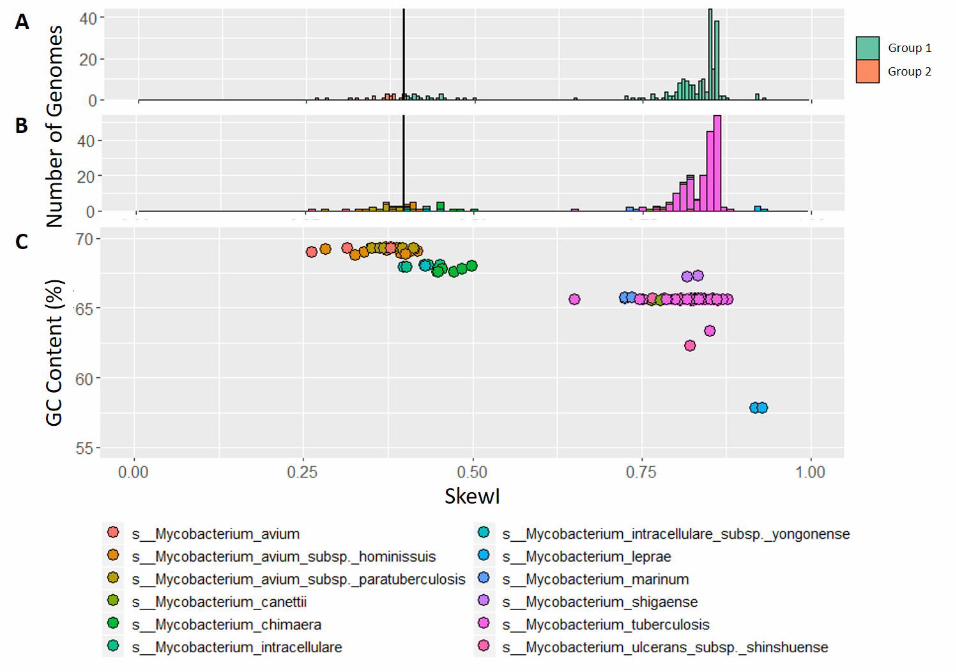
Figure 5 Mycobacterium skew index values.A) SkewI for 236 Mycobacterium genomes from 12 Mycobacterium species, all of which have multiple strains available in RefSeq.The threshold (vertical line) is at 0.396.B) SkewI colored by species.C) Plot comparing GC Content (%) to SkewI, where each dot represents a different genome colored by species.
contaminans MS14 sequences as illustrated in Figure4F. The final SkewI for these corrected chromosome 1and chromosome 2 sequences were 0.774 and 0.946 re-spectively, both within the expected range. Addition-ally, realigning the new MS14 sequences against thoseof SK875 a far higher degree of synteny between thetwo genomes (Figure 4G).
Mycobacterium
Analysis of the Mycobacterium SkewI distribution re-vealed a main peak at 0.85 and a smaller peak cen-tered around 0.4 (Figure 5A). Due to the large stan-dard deviation, the SkewI threshold was calculated tobe 0.396, with 20 genomes falling below the thresh-old. However, upon investigation into the individualgenomes, it appeared that all 20 of these genomes comefrom Mycobacterium avium and M. avium subspecies,suggesting that the SkewI values are not reflective of amis-assembly but rather reflective of a different degreeof skew in M. avium and possibly other species withinthe Mycobacteria.
We explored this hypothesis by re-plotting SkewI us-ing different colors for each of the 12 species, as shownin Figure 5B. As the plot shows, the large peak cen-tered around 0.85 mainly consists of the 179 M. tu-berculosis genomes while the smaller peak mainly con-sists of the 27 M. avium genomes. Because Mycobac-terium genomes have a high GC-content (%), we thenplotted GC-content vs. SkewI for these same genomes(Figure 5C), revealing that for the Mycobacteriumgenus, higher GC-content results in a lower SkewI.
ConclusionOur SkewIT (Skew Index Test) provides a fast methodfor identifying potentially mis-assembled genomesbased on the well-known GC skew phenomenon forbacterial genomes. In this study, we describe an algo-rithm that computes a new GC-skew statistic, SkewI,and we computed this statistic across the 15,067genomes from RefSeq, discovering that GC skew variesconsiderably across genera. We also used anomalousvalues of SkewI to identify likely mis-assemblies in Es-
.CC-BY-NC 4.0 International licenseauthor/funder. It is made available under aThe copyright holder for this preprint (which was not peer-reviewed) is the. https://doi.org/10.1101/2020.02.27.968214doi: bioRxiv preprint
Lu and Salzberg Page 8 of 8
cherichia coli O121 strain RM8352 and in two chromo-somes of Burkholderia contaminans MS14. We suggestthat researchers can validate future bacterial genomeassemblies by running SkewIT and comparing the re-sulting SkewI value to the thresholds in Supplemen-tal Table 2. Genomes with SkewI values lower thanthe expected threshold should be further validated bycomparison to closely-related genomes and by align-ment of the original reads to the genome.
Availability of data and materialsThe SkewIT github repository
(https://github.com/jenniferlu717/SkewIT) provides SkewIT scripts
for analysis of bacterial genomes and files containing SkewI values and
thresholds for RefSeq Release 97 bacterial genomes.
Competing interestsThe authors declare that they have no competing interests.
Author’s contributionsJL conceived and designed the experiments, performed the experiments,
analyzed the data, wrote the paper, prepared figures and/or tables,
performed the computation work, and wrote the paper.
SLS conceived and designed the experiments, analyzed the data, and wrote
the paper.
AcknowledgementsWe would like to thank Martin Steinegger for helpful comments and
feedback on the paper draft and figures. This work was supported in part
by NIH under grants R01-HG006677 and R35-GM130151 and by NSF
under grant IOS-1744309.
Author details1Department of Biomedical Engineering, Johns Hopkins University, 21218,
Baltimore, United States. 2Center for Computational Biology, Whiting
School of Engineering, Johns Hopkins University, 21218 Baltimore, United
States. 3Departments of Computer Science and Biostatistics, Johns
Hopkins University, 21218 Baltimore, United States.
References1. NCBI Resource Coordinators. Database resources of the National
Center for Biotechnology Information. Nucleic Acids Res. 2014
Jan;42(Database issue):D7–17.
2. O’Leary NA, Wright MW, Brister JR, Ciufo S, Haddad D, McVeigh R,
et al. Reference sequence (RefSeq) database at NCBI: current status,
taxonomic expansion, and functional annotation. Nucleic Acids Res.
2016 Jan;44(D1):D733–45.
3. Breitwieser FP, Pertea M, Zimin AV, Salzberg SL. Human
contamination in bacterial genomes has created thousands of spurious
proteins. Genome Res. 2019 Jun;29(6):954–960.
4. Longo MS, O’Neill MJ, O’Neill RJ. Abundant human DNA
contamination identified in non-primate genome databases. PLoS One.
2011 Feb;6(2):e16410.
5. Mukherjee S, Huntemann M, Ivanova N, Kyrpides NC, Pati A.
Large-scale contamination of microbial isolate genomes by Illumina
PhiX control. Stand Genomic Sci. 2015 Mar;10:18.
6. Kryukov K, Imanishi T. Human Contamination in Public Genome
Assemblies. PLoS One. 2016 Sep;11(9):e0162424.
7. Lobry JR. Asymmetric substitution patterns in the two DNA strands
of bacteria. Mol Biol Evol. 1996 May;13(5):660–665.
8. Grigoriev A. Analyzing genomes with cumulative skew diagrams.
Nucleic Acids Res. 1998 May;26(10):2286–2290.
9. Okazaki R, Okazaki T, Sakabe K, Sugimoto K, Sugino A. Mechanism
of DNA chain growth. I. Possible discontinuity and unusual secondary
structure of newly synthesized chains. Proc Natl Acad Sci U S A. 1968
Feb;59(2):598–605.
10. Bhagwat AS, Hao W, Townes JP, Lee H, Tang H, Foster PL.
Strand-biased cytosine deamination at the replication fork causes
cytosine to thymine mutations in Escherichia coli. Proc Natl Acad Sci
U S A. 2016 Feb;113(8):2176–2181.
11. Frank AC, Lobry JR. Asymmetric substitution patterns: a review of
possible underlying mutational or selective mechanisms. Gene. 1999
Sep;238(1):65–77.
12. Picardeau M, Lobry JR, Hinnebusch BJ. Physical mapping of an origin
of bidirectional replication at the centre of the Borrelia burgdorferi
linear chromosome. Mol Microbiol. 1999 Apr;32(2):437–445.
13. Fraser CM, Casjens S, Huang WM, Sutton GG, Clayton R, Lathigra R,
et al. Genomic sequence of a Lyme disease spirochaete, Borrelia
burgdorferi. Nature. 1997 Dec;390(6660):580–586.
14. Blattner FR, Plunkett G 3rd, Bloch CA, Perna NT, Burland V, Riley
M, et al. The complete genome sequence of Escherichia coli K-12.
Science. 1997 Sep;277(5331):1453–1462.
15. McLean MJ, Wolfe KH, Devine KM. Base composition skews,
replication orientation, and gene orientation in 12 prokaryote genomes.
J Mol Evol. 1998 Dec;47(6):691–696.
16. Rocha EP, Danchin A, Viari A. Universal replication biases in bacteria.
Mol Microbiol. 1999 Apr;32(1):11–16.
17. Zhang G, Gao F. Quantitative analysis of correlation between AT and
GC biases among bacterial genomes. PLoS One. 2017
Feb;12(2):e0171408.
18. Delcher AL, Phillippy A, Carlton J, Salzberg SL. Fast algorithms for
large-scale genome alignment and comparison. Nucleic Acids Res.
2002 Jun;30(11):2478–2483.
19. Langmead B, Salzberg SL. Fast gapped-read alignment with Bowtie 2.
Nat Methods. 2012 Mar;9(4):357–359.
Supplemental Figures
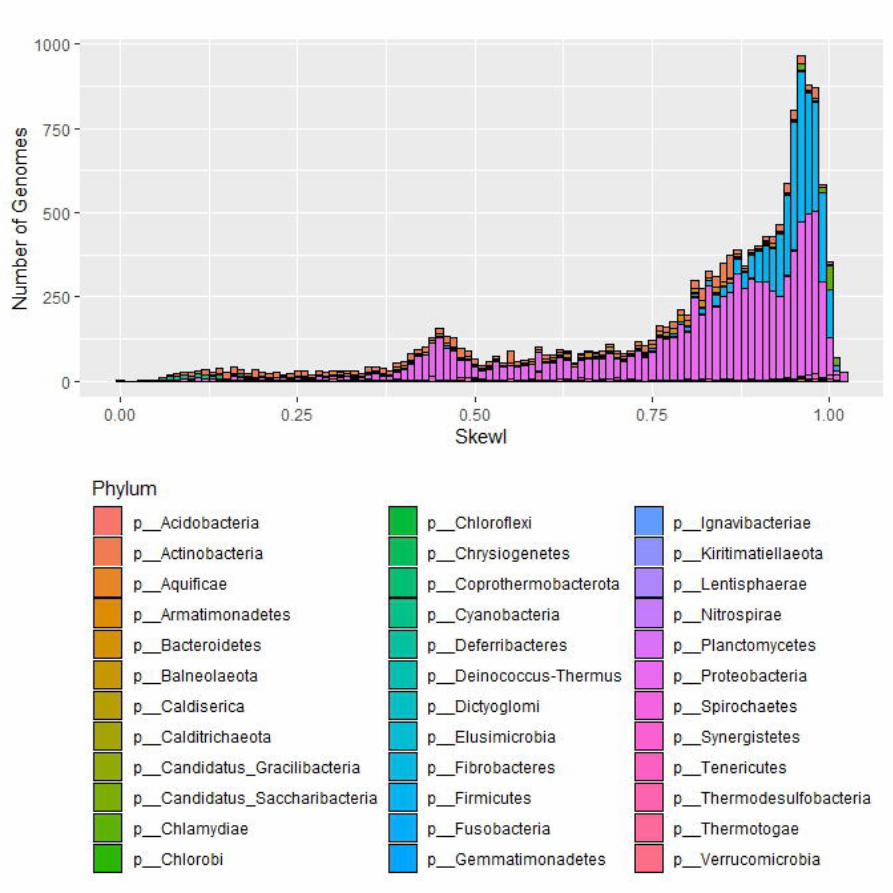
Supplemental Figure 1 SkewI for all 15,067 completebacterial RefSeq genomes.
Supplemental FilesSupplemental Table 1: Bacterial Genomes SkewIAll 15,067 bacterial genomes are listed along with their calculated SkewI
values. Additionally, this table lists the kingdom, phyla, class, order, family,
genus, and species names/NCBI taxonomy IDs for each genome.
Supplemental Table 2: SkewI Thresholds per genusFor all bacterial genera analyzed, we list the number of genomes, the
average SkewI, and the SkewI standard deviation. For any genus with more
than 10 genomes, we also include a threshold, which is 2 standard
deviations below the mean.
.CC-BY-NC 4.0 International licenseauthor/funder. It is made available under aThe copyright holder for this preprint (which was not peer-reviewed) is the. https://doi.org/10.1101/2020.02.27.968214doi: bioRxiv preprint
.CC-BY-NC 4.0 International licenseauthor/funder. It is made available under aThe copyright holder for this preprint (which was not peer-reviewed) is the. https://doi.org/10.1101/2020.02.27.968214doi: bioRxiv preprint
.CC-BY-NC 4.0 International licenseauthor/funder. It is made available under aThe copyright holder for this preprint (which was not peer-reviewed) is the. https://doi.org/10.1101/2020.02.27.968214doi: bioRxiv preprint
.CC-BY-NC 4.0 International licenseauthor/funder. It is made available under aThe copyright holder for this preprint (which was not peer-reviewed) is the. https://doi.org/10.1101/2020.02.27.968214doi: bioRxiv preprint
.CC-BY-NC 4.0 International licenseauthor/funder. It is made available under aThe copyright holder for this preprint (which was not peer-reviewed) is the. https://doi.org/10.1101/2020.02.27.968214doi: bioRxiv preprint
.CC-BY-NC 4.0 International licenseauthor/funder. It is made available under aThe copyright holder for this preprint (which was not peer-reviewed) is the. https://doi.org/10.1101/2020.02.27.968214doi: bioRxiv preprint
.CC-BY-NC 4.0 International licenseauthor/funder. It is made available under aThe copyright holder for this preprint (which was not peer-reviewed) is the. https://doi.org/10.1101/2020.02.27.968214doi: bioRxiv preprint