Skandiabanken Aktiebolag (publ) Interim Report … Skandiabanken Aktiebolag (publ) Interim Report...
29
Skandiabanken Aktiebolag (publ) Interim Report January−June 2015
Transcript of Skandiabanken Aktiebolag (publ) Interim Report … Skandiabanken Aktiebolag (publ) Interim Report...

Skandiabanken Aktiebolag (publ)Interim Report January−June 2015

1 Skandiabanken Aktiebolag (publ) Interim Report January−June 2015
Half-year summary
Skandia is one of Sweden’s largest, independent, customer-led banking and insurance groups. We have provided financial security to people for 160 years and have a strong tradition of pioneering spirit, product devel-opment and community involvement.
We create a richer life for people by helping them with solutions in savings, pensions and financial security, and by making it easier for them to make wise decisions about their personal economy. We have approximately 2.5 million customers in Sweden, Norway and Denmark, SEK 582 billion in managed assets, and approximately 2,600 employees. Read more at www.skandia.se.
Skandia includes, among other companies, the parent company Skandia Mutual Life Insurance Company (Skandia Mutual), Skandia Insurance Company Ltd (publ) (Skandia AB), and Skandiabanken Aktiebolag (publ) (Skandiabanken), with a branch in Norway.
Interested in becoming a customer or in contacting Skandia? Visit skandia.se or call Skandia customer service on 0771-55 55 00.
• Incomeforthefirsthalfof2015amountedtoSEK905million(866).
• Operatingprofitforthefirsthalfof2015wasSEK273million(307).
• Loanlossesduringthefirsthalfof2015totalledSEK-16million(-9).
• Lendingtothegeneralpublic,excludingloanstotheSwedishNationalDebtOffice,increasedbySEK6,399millionduringthefirsthalfoftheyear,toSEK99,737million(93,338).
• TotalliquidityamountedtoSEK24,012millionasper30June,comparedwithSEK20,337millionatthestartoftheyear.
• Thetotalcapitalratiowas14.5%asper30June,comparedwith14.2%atthestartoftheyear.
• Thebank’screditratingfromMoody’swasupgradedattheendofMaytoA2.
Financial calendar28 October Interim report Jan.–Sept. 2015

2 Skandiabanken Aktiebolag (publ) Interim Report January−June 2015
Thesecondquarterof2015markedacontinuationofSkandiabanken’sgrowthjourney.
Lendingcontinuedtogrowduringthequarter,andanimportantmilestoneintheBank’shistorywaspassedattheendofMay,whenlendingexceededSEK100billionforthefirsttime.Duringthesecondquarter,Moody’supgradedSkandiabanken’screditratingonenotch,toA2(negativeoutlook),whichcon-firmsourlowriskprofile.
TheSwedishoperationsarefacingprofitabilitychallenges.AtpresenttheBankisnotmeetingthedemandssetbytheowner,andasaresultareviewhasbeenlaunchedtoseehowprofitabilitycanbeimproved.ThechangeoveroftheSwedishbankplatformhasnowbeencompleted,enablingustobettermeetfuturecustomerneedsandoffernewandimprovedfunctionsatafasterpace.Unfortunately,theplatformchangehasgeneratedsomeproblemsthathaveaffectedcustomers.Majorfocushasbeenputonincreasingstabilityinboththenearandlongterm.
TheFinancialSupervisoryAuthority’srequirementthatallbanksbeginreport-ingtheiraverageinterestratesforhomemortgagestookeffectatthestartofJune.Weseeitasaveryfavourabledevelopmentthatourinitiativefromlastautumnhasnowbecomeastandardfortheentireindustry.Weembraceallmeasuresthatincreasetransparencyinthehomemortgagemarket,since
weknowthatitissomethingthatourcustomersvalueveryhighly.Thenext,naturalstepfortheindustryisnowtoopenlyreportthediscountsofferedtocustomersandhowtheyareset–somethingthatwealreadydoatSkandia-bankenandreceivemuchpraisefor.
TheInitialPublicOfferingforSkandiabankenNorwayisplannedtobecom-pletedduringthefourthquarterof2015.Aspartofthisprocess,SkandiahasappliedtotheNorwegianFinancialSupervisoryAuthorityforalicencetocon-ductbankingbusinessinNorway.Thelicencewasgrantedon29May.Duringthesecondhalfof2015,theBank’sprofitwasaffectedbycostsofSEK28millioninitemsaffectingcomparabilityassociatedwiththeworkontheInitialPublicOffering.
CEO’s message
Stockholm,August2015
ØyvindThomassenHead of Banking, Skandia

3 Skandiabanken Aktiebolag (publ) Interim Report January−June 2015
Financial review
Profit January–June 2015 compared with January–June 2014OperatingprofitbeforetaxdecreasedbySEK34million,toSEK273million(307).
EarningsfortheNorwegianoperationhaveremainedfavourablein2015,butarelowerthanayearearlierduetohighercostsassociatedwithworkintheInitialPublicOffering.
TheSwedishoperation’searningsfortheperiodwereweakandnegativelyaf-fectedbyalowernetinterestmarginandcostsforimplementationofthenewbankplatform.ToimproveprofitabilityoftheSwedishoperation,managementisworkingwithcostcontrolandonincreasingrevenue.
Geographical breakdown – profit for the periodSweden Norway Total
2015 2015 Elimination 2015SEK million Jan.-June Jan.-June Jan.-June Jan.-JuneNetinterestincome 265 496 — 761Netfeeandcommissionincome 52 84 — 136Netfinancialincome -7 -10 — -17Otheroperatingincome 58 0 -33 25Total operating income 368 570 -33 905Staffcosts -117 -95 — -212Otheradministrativeexpenses -219 -161 33 -347Depreciation/amortisation -13 -1 — -14Otheroperatingexpenses -24 -19 — -43Total expenses before loan losses -373 -276 33 -616Loanlosses -3 -13 — -16Operating profit -8 281 — 273Taxonprofitfortheperiod 1 -76 — -75Profit for the period -7 205 — 198
Significant eventsDuringtheperiodanunconditionalshareholdercontributionofSEK414million(256)wasreceivedtostrengthenthecapitalbase.
InJanuaryofthisyearSkandiaannounceditsplanstolisttheBank’sNor-wegianoperationontheOsloStockExchange.SkandiawillestablishtheNor-wegianoperationasawhollyownedsubsidiarywithanindependentbanking
licenceasaNorwegianbank.AttheendofMaytheNorwegianFinancialSuper-visoryAuthoritygrantedabankinglicencetothenewcompany.EstablishmentasanindependentNorwegianbankisanaturalstepintheprocesstowardsconductinganInitialPublicOffering,whichisexpectedtobeabletotakeplaceduringthefourthquarterof2015.TheaimoftheInitialPublicOfferingistofocusSkandia’sbankingbusinessintheSwedishmarketandcreategreateropportunitiesfortheNorwegianoperationtodevelopasstandalonebank.
Duringthefirstquarter,implementationofanewbankplatformwascarriedoutintheSwedishoperation.ThenewbankplatformispartofSkandia’soverallstrategytomeetcustomers’needs,offernewfunctionsandincreaseefficiency.
TheBoard’scompositionchangedduringtheperiod,whenChristerLöfdahltookhisseatasaregularboardmember.Hehassincepreviouslyservedasaboardmemberfortheparentcompany(SkandiaMutualLifeInsuranceCompany–“Skandia”).InearlyJuly,boardmembersPeterRydellandBjörnFernströmleftSkandiabanken’sboard.
IncomeSkandiabanken’snetinterestincomeincreasedbySEK72million,toSEK761million(688),comparedwiththecorrespondingperiodayearago.TheNor-wegianoperationaccountedfor66%ofthisincrease,withsharpgrowthinhomemortgagevolumeandcontinuedfavourablemargins.TheprevailinglevelofinterestratesinSwedencontinuestohaveanegativeimpactonnetinterestincome.DespitestrongvolumegrowthalsoinSweden,totallingapproximatelySEK3.8billionduringtheyeartodate,netinterestincomegrewbyonlySEK24millioncomparedwiththesameperiodayearago.
NetfeeandcommissionincomeincreasedbySEK21millionduringtheperiod,toSEK136million(116).Thisgrowthwasdrivenmainlybythestockmarkettrendintheearlypartoftheyearcombinedwithaninflowofcapitalforsecurities.
NetfinancialincomedecreasedbySEK52milliontoSEK-17million(35).Theloweroutcomeismainlyattributabletotheunrealisedmarketvalueofhedgesforfixed-interesthomemortgageloansintheSwedishoperation.Inaddition,repurchasesofissuedsecuritiestotallingNOK1.7billionintheNorwegianoperationhadanegativeimpactonnetfinancialincomebySEK9million.The

4 Skandiabanken Aktiebolag (publ) Interim Report January−June 2015
repurchaseswerecarriedoutinpreparationfortheforthcomingInitialPublicOffering.Therepurchaseshadapositiveimpactonnetinterestincome,how-ever.Thecorrespondingitemin2014pertainedmainlytoarealisedgainofapproximatelySEK30milliononthesaleofsharesinVISA,resultinginalargeyear-on-yeardeviation.
Operating income
SEK million2015
Jan.-June2014
Jan.-June Change, %Netinterestincome 761 688 11%Netfeeandcommissionincome 136 116 17%Netfinancialincome -17 35 -149%Otheroperatingincome 25 27 -7%Total operating income 905 866 5%
ExpensesExpensesincreasedduringthefirsthalfof2015toSEK616million(550).TheincreaseincostsintheSwedishoperationwasmainlyattributabletoduplicatecostsforthebankplatformandotherprojectcosts.TheduplicatecostsforthebankplatformareexplainedbythefactthatthelicencefortheoldplatformdoesnotexpireuntilSeptember2015.OwingtotheBank’sgrowthandthereturnofpreviouslyoutsourcedfunctions,staffcostshaverisen.Amortisationattributabletothenew,SwedishbankplatformwasbeguninMarch2015andamountedtoslightlymorethanSEK12millionatmid-year.
CostsfortheplannedInitialPublicOfferingduringtheyeararerecognisedintheNorwegianoperationandtotalledSEK28millionduringthefirsthalfof2015.
Expenses before loan losses
SEK million2015
Jan.-June2014
Jan.-June Change, %Staffcosts -212 -191 11%Otheradministrativeexpenses -347 -314 11%Depreciation -14 -1 1300%Otheroperatingexpenses -43 -44 -2%Total expenses before loan losses -616 -550 12%
Loan lossesNetloanlossesincreasedbySEK7milliontoSEK-16million(-9).LoanlossescontinuetobelowandpertainmainlytotheNorwegianoperation,whereunsecuredloansaccountforagreatershareoflendingtothegeneralpublicthaninSweden.
Impairedloans,net,increasedcomparedwiththecorrespondingperiodayearago,toSEK64million(43).
Financialreview
Assets 30/6/2015
Cash and cash equivalents 19%
Other 1%
Lending, SE 36%
Lending, NO 44%
Liabilities 30/6/2015
Issued securities 24%
Other 3%Equity 5%
Deposits, SE 29%
Deposits, NO 39%
Q22014
Q32014
Q42014
Q12015
Q22015
400
300
200
100
0
Net interest income, SE
SEK mNet interest income
Net interest income, NO
Cost/income ratio before loan losses
0.2
0
0.4
0.6
1.0
Cost/income ratio before loan losses
0.8
Cost/income ratio before loan losses, SECost/income ratio before loan losses, NO
Q22014
Q32014
Q42014
Q12015
Q22015

5 Skandiabanken Aktiebolag (publ) Interim Report January−June 2015
Loan losses and impaired loans
SEK million2015
Jan.-June2014
Jan.-June Change, %Loanlosses -16 -9 78%Impairedloans,net 64 43 49%Impairedloans,net,as%oflendingtothegeneralpublic 0.06% 0.05% 27%
Balance sheet, liquidity and managed assetsForthefirsttime,theBank’slendingtothegeneralpublicexceedsSEK100billion.Volumegrowthisbeinggeneratedmainlybylendingagainstsecurity.Lendingtothegeneralpublic,excludingloanstotheSwedishNationalDebtOffice,increasedbySEK6,399millionduringthefirsthalfoftheyear,toSEK99,737million(93,338).LoanstotheSwedishNationalDebtOfficeduringtheperiodamountedtoSEK657million(2,220).DepositsfromthegeneralpublicincreasedbySEK6,246millionandnowamounttoSEK85,764million(79,518).ThegrowthinvolumeintheSwedishoperationismainlyattributabletocus-todyaccountdeposits,whiletheBank’stransactionaccountshavealsogener-atedgrowth.IntheNorwegianoperation,aswell,thegreatestgrowthwasincustodyaccountdepositsatthesametimethatotheraccountsnotedaslightoutflowinfavourofahighercustomercashflowtomutualfundbusiness.
Duringthefirsthalfof2015thecreditratingagencyMoody’supgradedSkandia-banken’sratingfromA3/P-2toA2/P-1withanegativeoutlook.
FundsundermanagementinthebankingoperationsincreasedbySEK4,609millionduringthefirsthalfoftheyear,toSEK27,920million(23,211)atthecloseofthesecondquarter.Thenetinflowremainedpositiveduringthesecondquarter,butwasnotasgreatasduringthefirstquarterduetoturbulenceinthestockmarket.Thenetinflowincludescustomers’purchasesandsalesoffundunitsaswellastransfersofexistingfundholdingstoorfromSkandia-banken.
Skandiabanken’stotalliquidityamountedtoSEK24,012million(20,337),whichcorrespondsto28%(26%)oftotaldeposits.Totalliquidityconsistsofbal-anceswithcentralbanks,short-termlendingtocreditinstitutionsandliquid,fixed-incomesecuritiesthatcanbeconvertedtocashonshortnotice.Oftotalliquidity,SEK23,872million(20,212)qualifiesastheliquiditybufferinaccord-
ancewiththeSwedishFinancialSupervisoryAuthority’srulesformanagingliquidityrisk(FFFS2010:7).Thedeposit-to-loanratiowas86%(85%).
Skandiabanken’scapitalmarketfundingamountedtoSEK30,125million(28,007),correspondingto24%(24%)ofthebalancesheettotal.DuringthesecondquarterSkandiabankenfundeditsgrowththroughgreaterdepositsfromthegeneralpublicandissuesofcoveredbonds.
Balance sheet, liquidity and managed assets,30 June 2015 compared with 31 December 2014
SEK million2015
30 June2014
31 Dec. Change, %Balancesheettotal 125,352 115,107 9%
Lendingtothegeneralpublic¹ 100,394 95,558 5%of which, Sweden 44,591 42,358 5%of which, Norway 55,803 53,200 5%
Depositsfromthegeneralpublic 85,764 79,518 8%of which, Sweden 36,872 35,219 5%of which, Norway 48,892 44,299 10%
Externalborrowing 30,215 28,007 8%of which, Sweden 16,104 11,627 39%of which, Norway 14,111 16,380 -14%
Liquiditybuffer² 23,872 20,212 18%Totalliquidity³ 24,012 20,337 18%Deposit-to-loanratio⁴ 86% 85% 1%
Fundsundermanagement(NAV) 27,920 23,311 20%
¹IncludingplacementsofSEK657million(2,220)withtheSwedishNationalDebtOfficeandSEK70million(120)withSkandiaCapitalAB.
²InaccordancewiththeSwedishFinancialSupervisoryAuthority’srulesformanagingliquidityrisk(FFFS2010:7).
³BalanceswiththeCentralBankofSwedenandCentralBankofNorway,short-termlendinganddepositsto/fromcreditinstitutions,andfixed-incomesecuritiesclassifiedasavailable-for-sale(AFS)financialassets,excludingassetspledgedforborrowingfromtheCentralBankofSweden.
⁴ExcludingplacementsofSEK657million(2,220)withtheSwedishNationalDebtOffice.
Financialreview

6 Skandiabanken Aktiebolag (publ) Interim Report January−June 2015
Capital base and capital adequacyThetotalcapitalratioincreasedto14.5%(14.2%)comparedwiththelevelat31December2014.TheCommonEquityTier1capitalratioincreasedduringthesameperiodto12.5%(12.0%).
2015 30 June
2014 31 Dec.
Totalcapitalratio 14.5% 14.2%Tier1capitalratio¹ 12.5% 12.0%CommonEquityTier1capitalratio¹ 12.5% 12.0%Capitaladequacyrequirement,SEKmillion 3,542 3,333Totalrisk-weightedexposure,SEKmillion 44,281 41,667
¹TheBank’sCommonEquityTier1capitalconsistsofequitylessitemsthatmaynotbeincludedinthecapitalbase,suchasintangibleassetsanddeferredtaxassets,whicharedependentonfutureprofitability.TheBankdoesnothaveanyTier1capitalcontributions,whichentailsthatitsCommonEquityTier1capitalisequaltoitsTier1capital.
Risks, uncertainties and anticipated future performanceSkandiabankenconductsretailbankingbusinessinSwedenandNorway.Thebankoffersmainlylendingtoindividualsprimarilyintheformofhomemortgages,personalloans,carloans,accountlinesofcreditandcreditcardcredits,custodyaccountlending,anddeposits.Thebankalsooffersservicesforequitytrading,mutualfundsanddiscretionaryassetmanagement.Allbusinessactivityisexposedtorisk,andSkandiabanken’sgoalandpolicyistolimittheimpactoftheserisksontheresultofoperations.Skandiabanken’sriskappetiteislow,andallvolumegrowthisconductedundercontrolledandcognisantrisk-taking.Theriskmanagementthatisappliedaimstomaintainabalancebetweenriskandreturnstotheshareholder.Thisisconductedthrough,amongotherthings,theuseofvariousfinancialinstrumentstoreducefinancialriskandactiveriskmanagementintheformofmonitoring,continuousfollow-upandcontrol.
Skandiabankenisaffectedbythemacroeconomicclimateandcloselymonitorsdevelopmentsinitsexternaloperatingenvironment.TheeconomycontinuestostrengtheninSwedenatthesametimethatinflationremainslow.ThetrendintheBank’soperatingenvironmentalsoappearstobestrengthening,how-ever,theconsequencesoftheeventsinGreecearehardtodetermineandarecontributingtouncertaintyprimarilyintheeurozone,butalsoinSwedenandNorway.On1JulyofthisyeartheCentralBankofSwedendecidedtocutits
reporateby0.10percentagepointsto-0.35%.Thedecisionispartofanex-pansionarymonetarypolicyaimedataddressinguncertaintyinthesurround-ingenvironmentcombinedwithanambitiontoachievetheinflationtarget.InconnectionwiththeinterestratecuttheCentralBankofSwedenalsodecidedtoexpanditspurchasesofgovernmentbondsbySEK45billionbyyear-end.Atitsinterestratemeetingon17Juneofthisyear,theCentralBankofNorwaydecidedtocutitskeyrateby0.25percentagepointsto1.00%.ThisdecisionisgroundedintheperformanceofNorway’seconomy,whichhasbeenslightlyweakerthananticipated,alongwithaslightloweringoftheeconomicoutlook.TheCentralBankofNorwayhasindicatedthatfurthercutsmaybeforthcom-ingduringtheautumn.
On13September2015anewbufferrequirementwilltakeeffectinSweden,requiringinstitutionstoearmarkadditionalcapitalintheformofacounter-cyclicalbuffer.InSwedenthisbufferratewillinitiallyamountto1%ofrisk-weightedexposures,however,accordingtoadecisionbytheFinancialSuper-visoryAuthority,thisrequirementwillberaisedto1.5%witheffectfrom27June2016.
FollowingameetingofitsFinancialStabilityCouncilon15June,theFinancialSupervisoryAuthoritypresentedapaperoutliningitsviewsonthefuturestructureofthebanks’capitalrequirements.Thepapernotedthatahighleverageratiorequirementcouldimpactnegativelyonfinancialstabilityandthatthecapitalrequirementsmaybeincreasedconsiderablyoverthecomingyearsasaresultoftheongoingreviewofthebanks’riskweightingcalcula-tionsattheinternationallevel.SkandiabankeniscontinuouslyanalysingtheregulatoryinitiativespublishedinthisareabothinternallyandincooperationwithotherbankswithintheframeworkofactivitiesconductedbytheSwedishBankers’Association.
ForfurtherinformationabouttheBank’srisksandriskmanagement,seeNote37inthe2014AnnualReport.
DisputesSkandiabankenispartytoanumberofdisputes,thescopeofwhichistoberegardedasnormalinviewofthebusinessconducted.Mostofthedisputespertaintominoramountsandarejudgedtonothaveamaterialimpactonthecompany’sfinancialposition.
Financialreview

7 Skandiabanken Aktiebolag (publ) Interim Report January−June 2015
Key ratios
2015 2014 2015 2014 2014Q2 Q2 Jan.-June Jan.-June Full year
Return on equity, %¹ 4.37 9.25 6.98 10.31 8.74Cost/income ratio before loan losses² 0.78 0.67 0.68 0.63 0.65Total capital ratio, %³ 14.5 12.9 14.5 12.9 14.2Tier 1 capital ratio, %⁴ 12.5 10.6 12.5 10.6 12.0Provision level for impaired loans %⁵ 65.0 70.5 65.0 70.5 65.2Share of impaired loans, net, %⁶ 0.06 0.05 0.06 0.05 0.06Loan loss ratio, %⁷ 0.04 0.02 0.03 0.03 0.05Average number of employees 523 485 516 485 490
¹ Profit after tax in relation to average equity. Group contributions are excluded from the calculation.² Total costs before loan losses in relation to total operating income. ³ Capital base in relation to risk-weighted assets.⁴ Tier 1 capital in relation to risk-weighted assets.⁵ Provisions for loan losses in relation to impaired loans, gross.⁶ Impaired loans, net, in relation to total lending to the general public, excl. placements with the Swedish National Debt Office.⁷ Loan losses in relation to lending to the general public, excl. placements with the Swedish National Debt Office.

8 Skandiabanken Aktiebolag (publ) Interim Report January−June 2015
Income statement, quarterly
2015 2015 2014 2014 2014SEK million Q2 Q1 Q4 Q3 Q2Net interest income 389 372 362 368 354Fee and commission income 75 61 68 76 57Net financial income -14 -3 2 4 30Other operating income 14 11 15 9 12Total operating income 464 441 447 457 453
Staff costs -105 -107 -112 -104 -101Other operating expenses -258 -146 -226 -163 -202Total expenses before loan losses -363 -253 -338 -267 -303Profit before loan losses 101 188 109 190 150Loan losses, net -9 -7 -24 -8 -3Operating profit 92 181 85 182 147

9 Skandiabanken Aktiebolag (publ) Interim Report January−June 2015
Income statement
2015 2014 2015 2014 2014SEK million Note Q2 Q2 Jan.-June Jan.-June Full yearInterest income 3 702 823 1,435 1,597 3,186Interest expense 3 -313 -469 -674 -909 -1,768Fee and commission income 4 129 112 252 224 480Fee and commission expense 4 -54 -55 -116 -108 -220Net financial income 5 -14 30 -17 35 41Other operating income 14 12 25 27 51Total operating income 464 453 905 866 1,770General administrative expenses Staff costs -105 -101 -212 -191 -407 Other administrative expenses -223 -178 -347 -314 -661Depreciation, amortisation and impairment of property, plant and equipment, and intangible assets -12 -1 -14 -1 -2Other operating expenses -23 -23 -43 -44 -85Total expenses before loan losses -363 -303 -616 -550 -1,155Profit before loan losses 101 150 289 316 615Loan losses, net 6 -9 -3 -16 -9 -41Operating profit 92 147 273 307 574Appropriations, group contributions — — — — 5Profit before tax 92 147 273 307 579Tax on profit for the period -27 -43 -75 -85 -162Net profit for the period 65 104 198 222 417

10 Skandiabanken Aktiebolag (publ) Interim Report January−June 2015
Statement of comprehensive income
2015 2014 2015 2014 2014SEK million Q2 Q2 Jan.-June Jan.-June Full yearNet profit for the period 65 104 198 222 417
Other comprehensive incomeItems that cannot be reclassified to profit for the periodRevaluation of defined benefit pensions¹ -1 — -1 — -6Taxes attributable to revaluation of defined benefit pensions¹ 0 — 0 — 2
Items that have been reclassified or can be reclassified to profit for the periodAvailable-for-sale financial assets -38 -24 -46 -16 -21Tax attributable to available-for-sale financial assets 9 6 11 4 5Hedge of net investment 0 0 0 0 0Translation difference² -31 8 13 43 -37Tax attributable to translation difference 7 -2 -3 -10 8Total other comprehensive income after tax -54 -12 -26 21 -49
Comprehensive income for the period after tax 11 92 172 243 368
¹ Pertains to locally reported Norwegian pension plans.² Pertains to exchange rate differences that arise from translation of the Norwegian operation’s financial statements to the company’s reporting currency.

11 Skandiabanken Aktiebolag (publ) Interim Report January−June 2015
Balance sheet
SEK millionAssets Note 30/6/2015 31/12/2014 30/6/2014Cash and cash balances with central banks 626 636 606Eligible treasury bills, etc. 10,227 8,110 7,781Lending to credit institutions 3,127 1,252 3,801Lending to the general public 7 100,394 95,558 85,459Fair value of portfolio hedge of interest rate risk 150 184 150Bonds and other fixed-income securities 9,746 8,467 13,007Shares and participations, etc. 14 13 11Intangible assets 414 331 203Property, plant and equipment 5 4 4Current tax assets 12 10 —Deferred tax assets 28 17 21Other assets 465 329 646Prepaid expenses and accrued income 144 196 199Total assets 125,352 115,107 111,888
SEK millionLiabilities and provisions Note 30/6/2015 31/12/2014 30/6/2014Due to credit institutions 116 100 105Deposits and borrowing from the general public 85,764 79,518 82,037Issued securities, etc. 8 30,215 28,007 22,966Current tax liabilities 74 145 89Other liabilities 1,901 672 809Accrued expenses and deferred income 338 310 379Provisions for pensions 62 59 57Subordinated liabilities 900 900 900Total liabilities and provisions 119,370 109,711 107,342
Share capital 400 400 400Other reserves- Statutory reserve 81 81 81- Total fair value reserve -143 -121 -37Retained earnings 5,446 4,619 3,880Profit for the period 198 417 222Total equity 5,982 5,396 4,546Total liabilities, provisions and equity 125,352 115,107 111,888

12 Skandiabanken Aktiebolag (publ) Interim Report January−June 2015
Statement of changes in equity
Restricted equity Unrestricted equity Total fair value reserve¹ Defined
benefit pen- sion plans²SEK million Share capital
Statutory reserve
Fair value reserve
Translation reserve Total
Retained earnings Total equity
Opening equity 2014 400 81 45 -113 -68 8 3,626 4,047Profit for the period — — — — — — 222 222Other comprehensive income for the period — — -12 43 31 — -10 21Comprehensive income for the period — — -12 43 31 — 212 243Shareholder contribution received — — — — — — 256 256Closing equity, 30 June 2014 400 81 33 -70 -37 8 4,094 4,546
Opening equity 2014 400 81 45 -113 -68 8 3,626 4,047Profit for the year — — — — — — 417 417Other comprehensive income for the year — — -16 -37 -53 -4 8 -49Comprehensive income for the year — — -16 -37 -53 -4 425 368Shareholder contribution received — — — — — — 981 981Closing equity, 31 December 2014 400 81 29 -150 -121 4 5,032 5,396
Opening equity 2015 400 81 29 -150 -121 4 5,032 5,396Profit for the period — — — — — — 198 198Other comprehensive income for the period — — -35 13 -22 -1 -3 -26Comprehensive income for the period — — -35 13 -22 -1 195 172Shareholder contribution received — — — — — — 414 414Closing equity, 30 June 2015 400 81 -6 -137 -143 3 5,641 5,982
¹ The total fair value reserve includes unrealised gains/losses attributable to available-for-sale financial assets, hedge of net investment and translation difference. ² Pertains to locally reported Norwegian pension plans.

13 Skandiabanken Aktiebolag (publ) Interim Report January−June 2015
Cash flow statement
2015 2014 2014SEK million Jan.-June Jan.-June Full yearCash flow from operating activities 1,509 2,269 -915Cash flow from investing activities -47 -108 -236Cash flow from financing activities¹, ² 419 246 1,128Cash flow for the period 1,881 2,407 -23
Cash and cash equivalents at start of period 1,788 1,860 1,860Exchange rate differences in cash and cash equivalents -32 35 -49Cash flow for the period 1,881 2,407 -23Cash and cash equivalents at end of period 3,637 4,302 1,788
¹ No dividend was paid to the parent company Skandia Insurance Company Ltd (publ) in 2015 or 2014.² Group contributions rendered and received are classified as financing activities.
Cash and cash equivalents are defined as cash, clearing and settlement claims and liabilities, account balances in other banks and overnight loans with original terms of less than three days.

14 Skandiabanken Aktiebolag (publ) Interim Report January−June 2015
NotesAll amounts in SEK million, unless indicated otherwise.
Note 1 Accounting policies
The interim report for Skandiabanken Aktiebolag (publ) (“the Bank” or “Skandiabanken”) per-tains to the period 1 January–30 June 2015. Skandiabanken is domiciled in Stockholm, Sweden, with corporate identity number 516401-9738.
This interim report has been prepared in accordance with IAS 34 Interim Financial Reporting. The financial statements have been prepared in accordance with the Annual Accounts Act for Credit Institutions and Investment Firms (1995:1559) and the Financial Supervisory Authority’s regula-tions and general guidelines on annual reports of credit institutions and securities companies (FFFS 2008:25). Skandiabanken also applies recommendation RFR 2 Accounting for Legal Entities issued by the Swedish Financial Reporting Board (RFR). In accordance with these laws, instruc-tions, generation guidelines and recommendations, Skandiabanken applies so-called legally limited IFRS. This means that all International Financial Reporting Standards (IFRSs) endorsed by the EU as well as accompanying interpretations issued by the IFRS Interpretations Committee (IFRIC) are applied as far as possible within the framework of Swedish legislation and taking into account the connection between reporting and taxation.
Reporting of discontinued operations is not conducted in accordance with IFRS 5, as considera-tion is given to the layout format requirements in the Annual Accounts Act for Credit Institutions and Investment Firms. The corresponding information is provided in Note 2, Reporting of operat-ing segments.
The same accounting policies and calculation methods have been applied in the interim report as those described in the 2014 Annual Report, Note 1.
Changed accounting policies and changed presentationIn all essential respects, the accounting policies and calculations methods are unchanged compared with the 2014 Annual Report. Company management is of the opinion that new and amended standards and interpretations effective as from 2015 will not have any impact on Skandia banken’s financial statements.

15 Skandiabanken Aktiebolag (publ) Interim Report January−June 2015
Footnotes to segment reporting table¹ No impairment is recognised for tangible
assets or for property, plant and equip-ment.
² Positive level of loan losses in Sweden in 2014 as a result of the sale of written-off credits.
³ Internal income and expenses are included on the lines “Operating income”, “Net fee and commission income”, Other operating income”, “Staff costs” and “Other adminis-trative expenses”.
Note 2 Reporting of operating segmentsSweden Banking
NorwayBanking
Eliminations and recal-culations, Banking
Total Banking
SEK million 2015 2014 2015 2014 2015 2014 2015 2014Income statements Jan.-June Jan.-June Jan.-June Jan.-June Jan.-June Jan.-June Jan.-June Jan.-JuneNet interest income 265 240 496 448 — — 761 688Net fee and commission income 52 42 84 74 — — 136 116Net financial income -7 11 -10 24 0 — -17 35Other operating income 58 34 0 0 -33 -7 25 27Total operating income 368 327 570 546 -33 -7 905 866Staff costs -117 -102 -95 -89 — — -212 -191Other administrative expenses -219 -193 -161 -128 33 7 -347 -314Depreciation/amortisation of property, plant and equipment, and intangible assets¹ -13 0 -1 -1 — — -14 -1Other operating expenses -24 -25 -19 -19 — — -43 -44Total expenses before loan losses -373 -320 -276 -237 33 7 -616 -550Loan losses, net² -3 5 -13 -14 — — -16 -9Operating profit -8 12 281 295 — — 273 307Profit before tax -8 12 281 295 — — 273 307Tax on profit for the period 1 -5 -76 -80 — — -75 -85Net profit for the period -7 7 205 215 — — 198 222
External income 293 299 565 543 — — 858 842Internal income³ 42 21 5 3 — — 47 24Internal expenses³ -5 -3 -42 -21 — — -47 -24
COMPREHENSIVE INCOMENet profit for period -7 7 205 215 — — 198 222
Other comprehensive incomeItems that cannot be reclassified to profit for the periodRevaluation of defined benefit pensions — — -1 — — — -1 —Tax attributable to revaluation of defined benefit pensions — — 0 — — — 0 —Items that have been or can be reclassified to profit or loss for the yearChange in value of available-for-sale financial assets -42 -5 -4 -11 — — -46 -16Tax attributable to change in value of available-for-sale financial assets 10 1 1 3 — — 11 4Hedge of net investment 0 0 — — — — 0 0Translation difference — — — — 13 43 13 43Tax attributable to translation difference — — — — -3 -10 -3 -10Total other comprehensive income after tax -32 -4 -4 -8 10 33 -26 21
Comprehensive income for the period after tax -39 3 201 207 10 33 172 243
Notes

16 Skandiabanken Aktiebolag (publ) Interim Report January−June 2015
Sweden Banking
NorwayBanking
Eliminations and recalcula-tions, Banking
Total Banking
SEK billion 2015 2014 2014 2015 2014 2014 2015 2014 2014 2015 2014 2014Balance sheets 30 June 31 Dec. 30 June 30 June 31 Dec. 30 June 30 June 31 Dec. 30 June 30 June 31 Dec. 30 JuneAssetsLending to the general public¹ 44.6 42.4 34.2 55.8 53.2 51.3 — — — 100.4 95.6 85.5Other assets 14.1 8.8 13.5 12.0 11.2 13.4 -1.1 -0.5 -0.5 25.0 19.5 26.4Total assets 58.7 51.2 47.7 67.8 64.4 64.7 -1.1 -0.5 -0.5 125.4 115.1 111.9
LiabilitiesDeposits and borrowing from the general public 36.9 35.2 35.6 48.9 44.3 46.4 — — — 85.8 79.5 82.0Issued securities 16.1 11.6 8.1 14.1 16.4 14.9 — — — 30.2 28.0 23.0Other liabilities 3.0 1.8 1.8 1.5 0.9 1.0 -1.1 -0.5 -0.5 3.4 2.2 2.3Total liabilities 56.0 48.6 45.5 64.5 61.6 62.3 -1.1 -0.5 -0.5 119.4 109.7 107.3
Equity 2.7 2.6 2.2 3.3 2.8 2.4 — — — 6.0 5.4 4.6
Total liabilities and equity 58.7 51.2 47.7 67.8 64.4 64.7 -1.1 -0.5 -0.5 125.4 115.1 111.9
¹ Swedish banking operations, including placements of SEK 0.7 billion (2.2 and 0, respectively) with the Swedish National Debt Office and of SEK 0.1 billion (0.1 and 0, respectively) with Skandia Capital AB.
Key ratiosInvestment margin %¹ 0.98 1.05 1.03 1.53 1.52 1.47 — — — 1.28 1.31 1.27C/I ratio before loan losses² 1.01 0.98 0.98 0.48 0.45 0.35 — — — 0.68 0.65 0.63Loan loss ratio, %³, ⁴ 0.01 -0.01 -0.03 0.05 0.09 0.06 — — — 0.03 0.05 0.03Number of customers, thousands 451 452 451 380 378 380 — — — 831 830 831Average number of employees 301 289 287 215 201 198 — — — 516 490 485
Footnotes to segment reporting table¹ Net interest income as % of average volume (balance sheet total).² Expenses excl. loan losses in relation to operating income.³ Loan losses as % of opening balance of lending to the general public.⁴ Positive loan loss level in Sweden in 2014 as a result of the sale of loans.
Cont. Note 2, reporting of operating segments
Notes

17 Skandiabanken Aktiebolag (publ) Interim Report January−June 2015
Note 3 Net interest income2015 2014 2015 2014 2014
Q2 Q2 Jan.-June Jan.-June Full yearLending to credit institutions 13 8 21 18 12Lending to the general public 658 739 1,337 1,430 2,866Fixed-income securities 38 79 88 155 294Other 1 0 2 0 1Total interest income¹ 710 826 1,448 1,603 3,173
Due to credit institutions -18 -5 -28 -12 -1Deposits and borrowing from the general public -226 -352 -488 -690 -1,322Issued securities -74 -108 -164 -198 -404Subordinated liabilities -3 -5 -6 -10 -18Other 0 -2 -1 -5 -10Total interest expenses¹ -321 -472 -687 -915 -1,755Net interest income¹ 389 354 761 688 1,418
¹ The deviation in total interest income and interest expense compared with the income statement pertains to interest expenses attributable to hedge instruments, which in the note are transferred to interest income to provide a more accurate picture.
Note 4 Net fee and commission income2015 2014 2015 2014 2014
Q2 Q2 Jan.-June Jan.-June Full yearPayment intermediation fees 74 75 144 148 313Commissions on lending 0 1 0 1 1Commissions on deposits 1 0 1 0 1Commissions on securities 51 36 100 74 157Other commissions 3 0 7 1 8Total fee and commission income 129 112 252 224 480
Payment intermediation fees -27 -36 -64 -71 -140Commissions on securities -12 -8 -24 -19 -41Other commissions -15 -11 -28 -18 -39Total fee and commission expenses -54 -55 -116 -108 -220
Net fee and commission income 75 57 136 116 260
Notes

18 Skandiabanken Aktiebolag (publ) Interim Report January−June 2015
Note 5 Net financial income2015 2014 2015 2014 2014
Q2 Q2 Jan.-June Jan.-June Full yearFinancial assets at fair value classified as held for trading -1 30 0 30 32- Shares and participations and other equity instruments, change in value, etc. 0 30 0 30 33- Interest-bearing derivatives, change in value -1 0 0 0 -1 Available-for-sale financial assets 1 5 1 5 14- Fixed-income securities, realised gains/losses, etc. 1 5 1 5 14Repurchases of issued securities -9 0 -9 0 -3Hedge accounting¹ -4 -6 -8 -1 -1- Change in value of hedged item -44 38 -34 78 113- Change in value of hedge instrument 40 -44 26 -79 -114 Exchange rate movements -1 1 -1 1 -1 Total -14 30 -17 35 41
¹ Pertains to the outcome of hedge accounting of fair value of portfolio hedge of interest rate risk.
Note 6 Loan losses, net2015 2014 2015 2014 2014
Q2 Q2 Jan.-June Jan.-June Full yearSpecific provision for individually assessed loan receivablesThe period’s write-off of confirmed loan losses -1 -1 -1 -4 -4Reversal of provisions for probable loan losses in previous years that are reported as confirmed loan losses in the period’s accounts 0 1 2 5 4The period’s provision for probable loan losses -4 -3 -6 -9 -16Paid in from confirmed loan losses in previous years 0 7 0 8 8Reversal of provisions for probable loan losses which are no longer necessary 3 0 3 1 3Net expense for the period for individually assessed loan receivables -2 4 -2 1 -5
Portfolio provisions for loans individually assessed as not being impairedThe period’s change in provision for individually assessed loan receivables¹ 0 0 0 0 -2The period’s change in provision for collectively assessed homogenous groups of loan receivables¹ 1 -1 1 -1 0The period’s change in portfolio provisions for loans individually assessed as not being impaired 1 -1 1 -1 -2
Collectively assessed homogenous groups of loan receivables with limited value and similar credit riskThe period’s write-off of confirmed loan losses -7 -9 -14 -15 -31Paid in from confirmed loan losses in previous years 2 6 4 12 14Provision/reversal for collectively assessed homogenous groups of loan receivables -3 -3 -5 -6 -17Net expense for the period for collectively assessed homogeneous groups of loan receivables -8 -6 -15 -9 -34Net loan losses for the period -9 -3 -16 -9 -41
¹ The comparison figures for 2014 have been adjusted between lines.
Notes

19 Skandiabanken Aktiebolag (publ) Interim Report January−June 2015
Note 7 Lending to the general public30/6/2015 31/12/2014 30/6/2014
Amortised cost¹ 100,513 95,672 85,562Provision for impaired loans -119 -114 -103Total lending to the general public 100,394 95,558 85,459
Loan receivables broken down by geographic regionLoan receivables at amortised cost (before provision for loan losses)¹ 100,513 95,672 85,562 Sweden¹ 44,602 42,370 34,184 Norway 55,911 53,302 51,378Specific provisions for individually assessed loan receivables 25 25 20 Sweden 3 4 4 Norway 22 21 16Collective provisions for individually assessed loan receivables 9 8 8 Sweden 2 2 1 Norway 7 6 7Provisions for collectively assessed homogenous groups of loan receivables 85 81 75 Sweden 6 6 4 Norway 79 75 71Total provisions 119 114 103 Sweden 11 12 9 Norway 108 102 94
Loan receivables at amortised cost(after provisions for loan losses)¹ 100,394 95,558 85,459 Sweden¹ 44,591 42,358 34,175 Norway 55,803 53,200 51,284
Impaired loans (after provisions for probable loan losses) 64 60 103 Sweden 24 22 9 Norway 40 38 94
¹ Including placements of SEK 657 million (2,220 and 0, respectively) with the Swedish National Debt Office and of SEK 70 million (120 and 0, respectively) with Skandia Capital AB.
Note 8 Issued securities, etc.30/6/2015 31/12/2014 30/6/2014
Commercial paper 1,750 2,248 2,826Bond issues 5,410 6,012 4,113Covered bonds 23,055 19,747 16.027Total issued securities 30,215 28,007 22,966
Remaining maturity max. 1 year 5,031 4,636 5,665Remaining maturity longer than 1 year 25,184 23,371 17,301
Skandiabanken issues and repurchases own-issued debt instruments as part of the funding of its operations. Following is an account of such activities during the period:Issued during the period 8,900 21,547 10,085Repurchased -2,566 -1,938 331Matured -4,315 -8,282 -3,926Translation difference 189 -184 -388
Notes
20 Skandiabanken Aktiebolag (publ) Interim Report January−June 2015
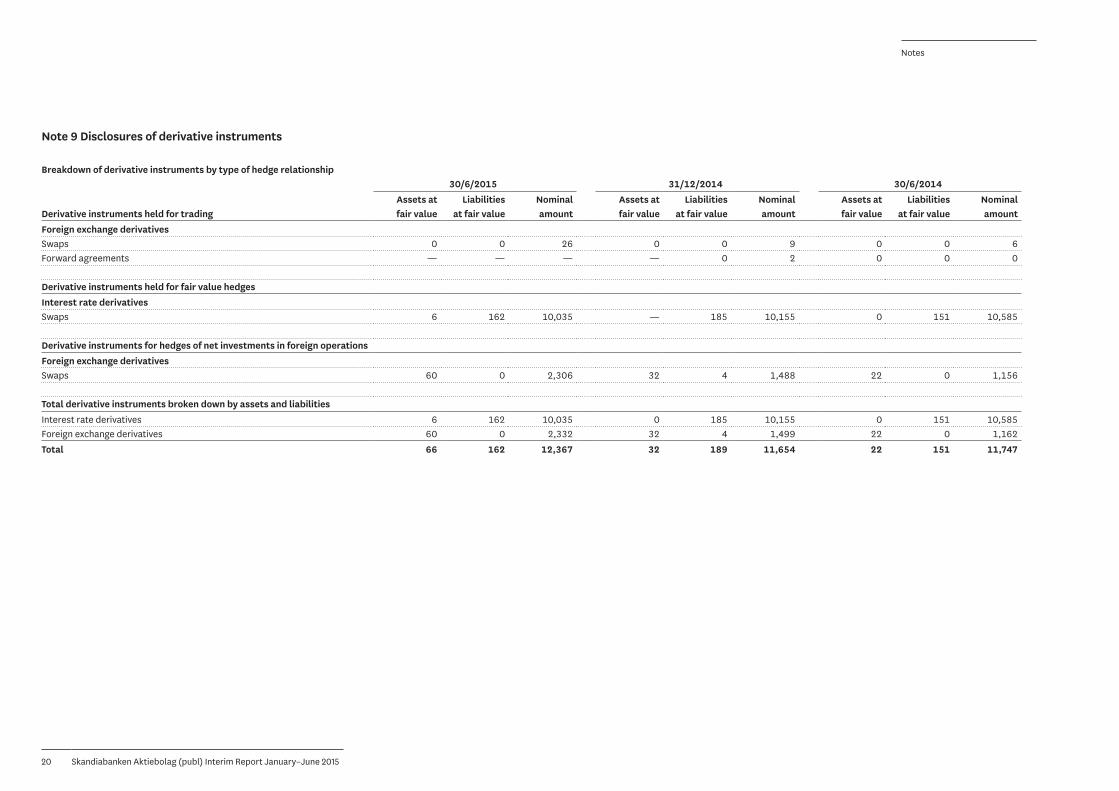
Note 9 Disclosures of derivative instruments
Breakdown of derivative instruments by type of hedge relationship30/6/2015 31/12/2014 30/6/2014
Assets at Liabilities Nominal Assets at Liabilities Nominal Assets at Liabilities NominalDerivative instruments held for trading fair value at fair value amount fair value at fair value amount fair value at fair value amountForeign exchange derivativesSwaps 0 0 26 0 0 9 0 0 6Forward agreements — — — — 0 2 0 0 0
Derivative instruments held for fair value hedgesInterest rate derivativesSwaps 6 162 10,035 — 185 10,155 0 151 10,585
Derivative instruments for hedges of net investments in foreign operationsForeign exchange derivativesSwaps 60 0 2,306 32 4 1,488 22 0 1,156
Total derivative instruments broken down by assets and liabilitiesInterest rate derivatives 6 162 10,035 0 185 10,155 0 151 10,585Foreign exchange derivatives 60 0 2,332 32 4 1,499 22 0 1,162Total 66 162 12,367 32 189 11,654 22 151 11,747
Notes

21 Skandiabanken Aktiebolag (publ) Interim Report January−June 2015
Note 10 Financial assets and liabilities that are offset or subject to netting agreements
Related agreements
Gross amount Offset Net amount on bal-
ance sheetMaster netting
agreementCollateral
received/pledged Net amount
Assets and li-abilities that are not
subject to netting agreements
Total on balance sheet
30/6/2015Derivatives 66 — 66 -65 — 1 — 66Assets 66 — 66 -65 — 1 — 66
Derivatives 162 — 162 -65 -95 2 — 162Liabilities 162 — 162 -65 -95 2 — 162
31/12/2014Derivatives 32 — 32 -32 — 0 — 32Assets 32 — 32 -32 — 0 — 32
Derivatives 189 — 189 -32 -157 0 — 189Liabilities 189 — 189 -32 -157 0 — 189
30/6/2014Derivatives 22 — 22 -22 — 0 — 22Assets 22 — 22 -22 — 0 — 22
Derivatives 151 — 151 -22 -66 63 — 151Liabilities 151 — 151 -22 -66 63 — 151
The table shows reported financial assets and liabilities that are presented net on the balance sheet or that have potential rights associated with legally binding master netting agreements or similar agreements, such as ISDA Master Agreements, along with related collateral. The net amount shows the exposure under normal business conditions both in the event of a suspension of payments or insolvency. Financial assets and liabilities are reported net on the balance sheet when Skandiabanken has a legal right to report transactions net, under normal business conditions and in the event of an insolvency, and there is an intention to make a net payment or realise the asset and make payment for the liability at the same time. Financial assets and liabilities that are subject to legally binding master netting agreements or similar agreements that are not presented net on the balance sheet are arrangements that ordinarily come into force in the event of an insolvency or suspension of pay-ments, but not under normal business conditions or arrangements in which Skandiabanken does not have the divest the instruments simultaneously. The Bank has not received or pledged assets that can be utilised without default of the counterparty.
Notes

22 Skandiabanken Aktiebolag (publ) Interim Report January−June 2015
Note 11 Related party disclosures
Disclosures regarding related parties pertain to dealings and transactions with Skandia Mutual Life Insurance Company, Skandia Insurance Company Ltd (publ) and other sister companies within the Skandia group. All transactions are carried out at market terms. Related parties to the group also include board members and senior executives of Skandiabanken, the Skandia group, and external companies in which senior executives have control.
Related party transactionsCustomary business transactions were carried out during the period between group companies in Skandia as a part of the outsourced operations. Lending, deposits and borrowing are priced at specific interest rates with a going-rate interest rate mark-up. During the first quarter of 2015 Skandiabanken received a capital contribution of SEK 414 million from the parent company Skandia Insurance Company Ltd (publ). Subordinated loans amount to SEK 900 million and pertain to loans from Skandia Mutual Life Insurance Company. During the second quarter of 2015 Skandia Mutual Life Insurance Company increased its lending to the Bank, and it amounts to approximately SEK 1,000 million as per 30 June 2015, compared with SEK 400 million at 1 January 2015.
Net interest income includes interest income from the interest rate compensation that arises when Skandiabanken provides favourable borrowing terms to Skandia employees. It also includes interest on the subordinated loans. Derivative transactions are handled, among other ways, through the group company Skandia Capital AB, and expenses and unrealised changes in the market value of hedge instruments are reported as interest expenses and net financial income.
Other income includes, among other things, fees for administration and compensation for services performed for other companies in the Skandia group. Costs for IT and premises, among other things, pertain to outsourced operations and are reported as Administrative expenses in the income statement.
Note 12 Pledged assets, contingent liabilities and other commitments30/6/2015 31/12/2014 30/6/2014
Assets pledged for own liabilities – mortgage loans 34,686 27,313 22,301Other pledged assets 7,406 7,779 5,981Commitments 33,750 27,958 27,988
Notes

23 Skandiabanken Aktiebolag (publ) Interim Report January−June 2015
Note 13 Measurement of financial assets and liabilities at fair value30/6/2015 31/12/2014 30/6/2014
Instruments with published price
quotations in an active market
Valuation tech-niques based
on observable market data
Instruments with published price
quotations in an active market
Valuation tech-niques based
on observable market data
Instruments with published price
quotations in an active market
Valuation tech-niques based
on observable market data
Assets Level 1 Level 2 Total Level 1 Level 2 Total Level 1 Level 2 Total Financial assets at fair value through profit or lossHeld for trading Shares and participations 1 0 1 0 1 1 — 1 1 Derivative instruments — 66 66 — 32 32 — 22 22Available-for-sale financial assets Eligible treasury bills, etc. — 10,227 10,227 — 8,110 8,110 — 7,781 7,781 Bonds and other fixed-income securities 3,502 6,244 9,746 2,889 5,578 8,467 3,084 9,922 13,006 Shares and participations — — — — — — — 10 10Total 3,503 16,537 20,040 2,889 13,721 16,610 3,084 17,736 20,820
LiabilitiesHeld for trading Other 1 — 1 0 — 0 3 — 3 Derivative instruments — 162 162 — 189 189 — 151 151Total 1 162 163 0 189 189 3 151 154
All financial assets and liabilities measured at fair value are classified in a fair value hierarchy that reflects observable prices or other inputs in the valuation techniques that are used. Prior to each quarter an assessment is made as to whether the valuations pertain to quoted prices that represent actual and regularly recurring transactions or not. Transfers between levels in the hierarchy may take place when there are indications that the market conditions, such as liquidity, have changed. No transfers were made during the first half of 2015.
Level 1 pertains to quoted prices that are readily available to numerous parties and represent actual and regularly recurring transactions. These include treasuries and other fixed-income securities that are actively traded. Level 2 pertains to valuation models that are based on observable market quotations and instruments that are valued at their quoted price, but where the market is considered to be less active. These include fixed-income securities and interest rate and foreign exchange derivatives, among other things. No assets or liabilities are valued at Level 3. The market quotations that are used for valuations in Level 1 and Level 2 consist of average daily closing buy and sell prices obtained from external sources. As part of the valuation process, a validation is performed of used prices. Should the market undergo a dramatic change – as a whole or with respect to certain assets or issuers – further reviews would be performed to ensure a correct valuation.
For a description of the various levels, see Note 1, Accounting policies, point 7, Financial instruments – classification and valuation, in the 2014 Annual Report.
Notes

24 Skandiabanken Aktiebolag (publ) Interim Report January−June 2015
Notes
Note 14 Capital adequacy analysis
Common Equity Tier 1 capital: Instruments and reserves 30/6/2015 31/12/2014 30/6/2014Equity instruments and accompanying share premium reserves 400 400 400Undistributed earnings 5,410 4,628 3,903Accumulated other comprehensive income -26 -49 21Net profit for the interim period after deducting predictable costs and dividends that have been verified by persons with an impartial position 198 417 222Common Equity Tier 1 capital before regulatory adjustments 5,982 5,396 4,546Additional value adjustments -20 -16 -21Intangible assets -414 -331 -203Deferred tax assets arising as a result of temporary differences -28 -17 -21Regulatory changes pertaining to unrealised gains — -29 -33Combined regulatory changes of Common Equity Tier 1 capital -462 -393 -278Common Equity Tier 1 capital 5,520 5,003 4,268
Tier 1 capital contribution: instruments — — —Tier 1 capital 5,520 5,003 4,268
Tier 2 capital: instruments and provisionsEquity instruments and accompanying share premium reserves 900 900 900Tier 2 capital before regulatory adjustments 900 900 900
Total regulatory adjustments of Tier 2 capital — — —Tier 2 capital 900 900 900
Total capital 6,420 5,903 5,168
Total risk-weighted exposure 44,281 41,667 40,179
Capital ratios and buffers 30/6/2015 31/12/2014 30/6/2014Common Equity Tier 1 capital 12.5% 12.0% 10.6%Tier 1 capital 12.5% 12.0% 10.6%Total capital 14.5% 14.2% 12.9%Institution-specific buffer requirement (Common Equity Tier 1 capital requirement according to Pillar I and buffer requirement) as a percentage of risk-weighted exposure amount¹ 7.6% 7.0% —Of which: capital conservation buffer requirement 2.5% 2.5% —Of which: countercyclical buffer requirement 0.6% — —Available Common Equity Tier 1 capital to be used as buffer as a percentage of risk-weighted exposure amount¹ 6.5% 6.0% —
Amounts below threshold valueDirect holdings of equity in units in the financial sector in which the institution does not have any material investment 12 12 10
Risk-weighted exposure amountsCredit risk 41,051 38,063 36,647Settlement risk 0 0 0Currency risk 164 545 212CVA risk 31 24 28Operational risk 3,035 3,035 3,292Total risk-weighted exposure 44,281 41,667 40,179
Capital base requirementCredit risk 3,284 3,045 2,932Settlement risk 0 0 0Currency risk 13 43 17CVA risk 2 2 2Operational risk 243 243 263Total minimum capital base requirement 3,542 3,333 3,214
¹ The revised interpretation of the buffer requirement and available Common Equity Tier 1 capital is presented for 2014.

25 Skandiabanken Aktiebolag (publ) Interim Report January−June 2015
Cont. Note 14 Capital adequacy analysis
Specification of capital base requirement for credit risks30/6/2015 31/12/2014 30/6/2014
Exposure classesRisk-weighted
assetsCapital base requirement
Risk-weighted assets
Capital base requirement
Risk-weighted assets
Capital base requirement
Exposures to governments and central banks — — — — — —Exposures to regional governments or local authorities 663 53 873 70 708 57Exposures to public sector entities — — — — — —Exposures to multilateral development banks — — — — — —Exposures to international organisations — — — — — —Exposure to institutions 264 21 253 20 1,543 123of which, counterparty risk 28 2 18 1 20 2Exposure to corporates 575 46 762 61 972 78Retail exposures 3,011 241 2,850 227 2,834 226Exposures secured by mortgages on immovable property 35,044 2,804 32,076 2,566 29,224 2,338of which, residential properties 35,044 2,804 32,076 2,566 29,224 2,338of which, commercial properties — — — — — —Exposures in default 193 15 145 12 131 11Exposures associated with particularly high risk — — — — — —Exposures in the form of covered bonds 899 72 721 58 929 74Securitisation positions — — — — — —Exposure to institutions and corporates with short-term credit ratings — — — — — —Exposures in the form of collective investment undertakings (CIUs) 187 15 98 8 72 6Equity exposures 13 1 12 1 10 1Other items 202 16 273 22 224 18Total 41,051 3,284 38,063 3,045 36,647 2,932
Notes

26 Skandiabanken Aktiebolag (publ) Interim Report January−June 2015
Cont. Note 14 Capital adequacy analysis
Notes
Applied rules and regulationsThe calculation of capital requirements is carried out in accordance with Regulation (EU) No. 575/2013 of the European Parliament and of the Council on prudential requirements for credit institutions and investment firms, the Act on Capital Buffers (2014:966), and the Financial Super-visory Authority’s regulations and general guidelines on regulatory requirements and capital buffers (FFFS 2014:12). The outcome pertains to calculations in accordance with the statutory minimum requirement for capital, referred to as Pillar I, for credit risk, settlement risk, market risk, operational risk and credit valuation adjustment (CVA) risk, and the capital requirement in accordance with the combined buffer requirement.
Disclosures in this note are provided in accordance with Regulation (EU) No. 575/2013 of theEuropean Parliament and of the Council, Commission Implementing Regulation (EU) No. 1423/2013 laying down technical standards with regard to disclosure of own funds for institu-tions according to Regulation (EU) No. 575/2013, the Financial Supervisory Authority’s regula-tions on regulatory requirements and capital buffers, and the Financial Supervisory Authority’s regulations and general guidelines regarding annual reports of credit institutions and securities firms (FFFS 2008:25). Detailed information about these rules and regulations is provided in a separate Pillar III report, see www.skandiabanken.se/kontakta-skandia/om-skandia/finansiell-info/Information om kapitaltäckning och riskhantering/2015/1506 Periodisk information – kapitaltäckning.
Skandiabanken applies the standardised approach in calculating the capital base requirement forcredit risk. This means that when using the standardised approach, 17 exposure classes are usedalong with a number of different risk weights within each of them. Credit risk is calculated for allasset items on and off the balance sheet that are not deducted from the capital base. Settlement risk pertains to the risk of a securities transaction not being finally settled and of a compensa-tion cost arising. A calculation is made of transactions in which the payment date has expired. The capital base requirement for currency risk amounts to 8% of the total net position in foreign currency. The capital base requirement for CVA risk is calculated in accordance with the stand-ardised approach and pertains to positions in OTC derivatives. The capital base requirement for operational risk is calculated in accordance with the basic indicator approach, which entails a capital base requirement equal to 15% of average operating income for the three most recent financial years. The capital base requirement for market risks in the trading account is calculated in accordance with the rules for credit risk. For Skandiabanken, the combined buffer requirement constitutes a requirement to maintain a capital conservation buffer of 2.5% and a counter cyclical buffer of 0.6% of the risk-weighted exposure. The countercyclical buffer requirement is a new requirement that took effect on 30 June 2015 and pertains to Norwegian exposures. For Swedish exposures, the countercyclical buffer requirement takes effect on 13 September 2015.
On 30 June 2015 the Bank’s internally assessed capital requirement was SEK 1,965 million, which has been calculated with the support of Economic Capital (EC) models. On 31 December 2014 the internally assessed capital requirement was SEK 1,706 million.
In accordance with a decision by the Financial Supervisory Authority, the Bank has obtained
Note 15 Events after the balance sheet date
On 3 July 2015 Björn Fernström and Peter Rydell left Skandiabanken’s board of directors.
permission to use its interim surplus in its calculation of the capital base, provided that the com-pany’s auditors can validate the surplus and that deductions for any dividends and foreseeable costs have been made in accordance with EU Regulation No. 575/2013 and that the calculation of these has been performed in accordance with Commission delegated Regulation (EU) No. 241/2014, supplementing Regulation (EU) No. 575/2013 with regard to regulatory technical standards for Own Funds requirements for institutions. Deloitte AB performed the review referred to above on 30 June 2015.
27 Skandiabanken Aktiebolag (publ) Interim Report January−June 2015
Signatures
The Board of Directors and CEO certify that the interim report gives a true and fair presentation of the company’s operations, position and result of operations, and describes significant risks and uncertainties that the company faces.
Stockholm, 5 August 2015
Niklas Midby Anne Ask Johanna Rolin Moreno Ann-Charlotte Stjerna Christer LöfdahlChairman of the Board
Bengt-Åke Fagerman Marek Rydén Lars-Göran Orrevall Øyvind Thomassen CEO
This interim report has not been reviewed by the company’s auditors.

Skandiabanken Aktiebolag (publ) S-106 55 Stockholm
Corporate identity number 516401-9738Domicile: Stockholm