SKAGEN’s Annual New Year’s Conference in Copenhagen SKAGEN ... · SKAGEN’s Annual New...
49
SKAGEN’s Annual New Year’s Conference in Copenhagen SKAGEN Global January 13, 2016
Transcript of SKAGEN’s Annual New Year’s Conference in Copenhagen SKAGEN ... · SKAGEN’s Annual New...
SKAGEN’s Annual New Year’s Conference in Copenhagen
SKAGEN Global
January 13, 2016

2
Agenda
2015 Fund Review
Investment Frameworks
2016 Outlook

3
We seek inspiration from the best
“Magnus Carlsen personifies the essence
of research, strategy and execution” – Arctic Securities
Sourc
e: w
ww
.dia
riodeavis
os.c
om

4
Investment Return
Return is the product of investment philosophy and execution
Investment
philosophy Execution

5
No change in investment philosophy
We stick to SKAGEN’s time-tested investment philosophy…
Active managers
Value-driven philosophy
Contrarian mindset
Bottom-up stock picking
High-conviction focus
Long-term investors
Common sense approach
…but we can improve execution
6
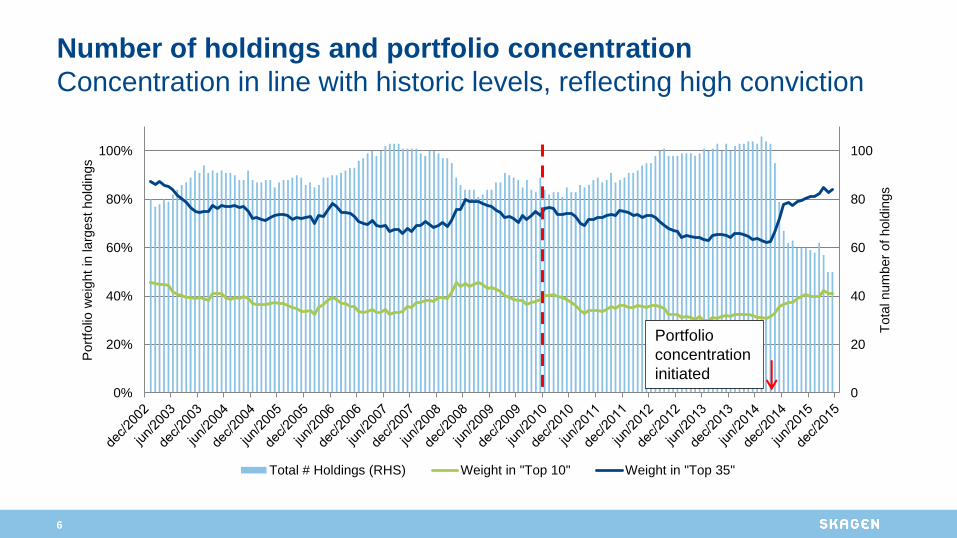
Number of holdings and portfolio concentration
Concentration in line with historic levels, reflecting high conviction
0
20
40
60
80
100
0%
20%
40%
60%
80%
100%
Tota
l num
ber
of
hold
ings
Port
folio
weig
ht
in larg
est
hold
ings
Total # Holdings (RHS) Weight in "Top 10" Weight in "Top 35"
Portfolio
concentration
initiated

7
Less deep-value, more quality-value in the portfolio
0
4
8
12
16
20
P/E Global P/E World Index
Harmonised average P/E and P/B for largest positions in portfolio versus the index (MSCI World prior to 1/1/2010, MSCI AC thereafter).
Source: MSCI and SKAGEN

8
SKAGEN Global has now implemented the promised changes
SKAGEN Global is now positioned with a more liquid, high-conviction
portfolio informed by risk-return considerations
Category Summer
2014 Target
Dec
2015 Comment
1. Number of holdings >100 50-60 49 ”Less is more”
2. Concentration (top-10) 30% 35-45% 41% In-line with historical level
3. Concentration (top-35) <65% 80-90% 84% High conviction focus
4. Liquidity Improved across the board
5. Position sizing Risk-reward key determinant
6. Risk management New tailored risk report (bi-weekly)
7. New ideas generation 17 new stocks added in 2015
8. Case documentation More rigorous requirements

9
Stock market performance by country in 2015
2015 market development in EUR (%)
-42-27
-18-18
-15-11-10
-9-6-6
-4-1
344
56
999
1111121212131314
1620
3243
SOUTH AFRICA
BRAZIL TURKEY
CZECH REPUBLIC
DENMARK HUNGARY
JAPAN
USA
AUSTRIA
FRANCE
FINLAND
MALAYSIA
CHINA
NORWAY MEXICO
THAILAND
INDIA
UK
SKAGEN Global A MSCI ACWI
NETHERLANDS
GERMANY
HONG KONG
SWEDEN
RUSSIA
TAIWAN
PORTUGAL
ITALY
KOREA
INDONESIA
SPAIN
POLAND

10
SKAGEN Global performance figures as per 31 Dec 2015 2015 scorecard: +15.4% absolute return, +0.1% relative return (in EUR)
Note: All returns beyond 12 months are annualised (geometric return)
* Inception date: 7 August 1997
** Benchmark index was MSCI World in NOK from 7 August 1997 to 31 December 2009 and MSCI All Country World Index from 1 January 2010 onwards
Return (EUR)
12,2%
-1,2%
8,9% 10,2%
7,9%
14,7%
8,1%
-2,7%
8,7%
14,9%
10,7%
4,0%
-5%
0%
5%
10%
15%
20%
Q4 6 months 2015 3 Year 5 Year Sinceinception
Fund Index

11
Company Weight Absolute Relative Selskap Weight Absolute Relative
General Electric 3.92% 1.64% 1.31% Banrisul 0.40% -0.54% -0.58%
AIG 5.59% 1.56% 0.85% KazMunaiGas 0.57% -0.49% -0.52%
Alphabet (Google) 0.85% 1.35% 1.10% State Bank of India 2.66% -0.48% -0.86%
Microsoft 2.55% 1.02% 0.66% Lundin Mining 1.79% -0.46% -0.72%
Samsung Electronics 6.37% 0.94% -0.04%
Norsk Hydro 1.30% -0.42% -0.55%
Citigroup 6.78% 0.91% -0.05%
Gap Inc 1.17% -0.41% -0.49%
Cheung Kong Holding 2.19% 0.84% 0.84% Afren Plc 0.02% -0.37% -0.38%
NN Group 2.03% 0.82% 0.82% Hyundai Motor 0.98% -0.34% -0.40%
Tyson Foods 1.15% 0.81% 0.81% EFG-Hermes 0.64% -0.30% -0.40%
Renault 0.47% 0.79% 0.79% First Pacific Co Ltd 0.61% -0.24% -0.30%
Main contributors to absolute performance in 2015
Largest positive contributors Largest negative contributors

12
Main contributors to relative performance in 2015 Relative return measured in NOK
TOP-5
BOTTOM-5

13
2015 sector attribution (relative return) Solid stock selection offset by substantial currency headwinds
Source: SKAGEN, MSCI. Returns used are measured in NOK, net of fees

14
A strong US dollar significantly weighed on the fund’s
performance in 2015
Source: SKAGEN, MSCI. Returns used are measured in NOK, net of fees

15
Largest holdings in SKAGEN Global as of 31 December 2015
Holding Price P/E P/E P/BV Price
size, % 2015e 2016e last target
AIG 7.4 62.0 14.5 12.1 0.8 90
CITIGROUP 5.8 51.8 9.5 9.0 0.7 75
SAMSUNG ELECTRONICS 5.5 1 091 000 7.8 7.8 0.9 1 500 000
ROCHE 4.2 276.4 19.6 18.0 13.8 380
GENERAL ELECTRIC 4.1 31.2 24.1 20.6 2.8 34
MERCK 3.4 52.8 14.8 14.1 3.2 76
DOLLAR GENERAL 3.1 71.9 18.3 16.0 3.9 94
CK HUTCHISON 2.7 104.6 11.5 10.6 1.0 140
KINGFISHER 2.7 329.5 15.5 14.1 1.3 450
G4S 2.5 225.5 15.2 13.8 4.7 403
Weighted top 10 41.4 13.0 12.0 1.3 39%
Weighted top 35 84.4 13.8 12.7 1.3 37%
MSCI AC World 16.5 14.9 1.9
16
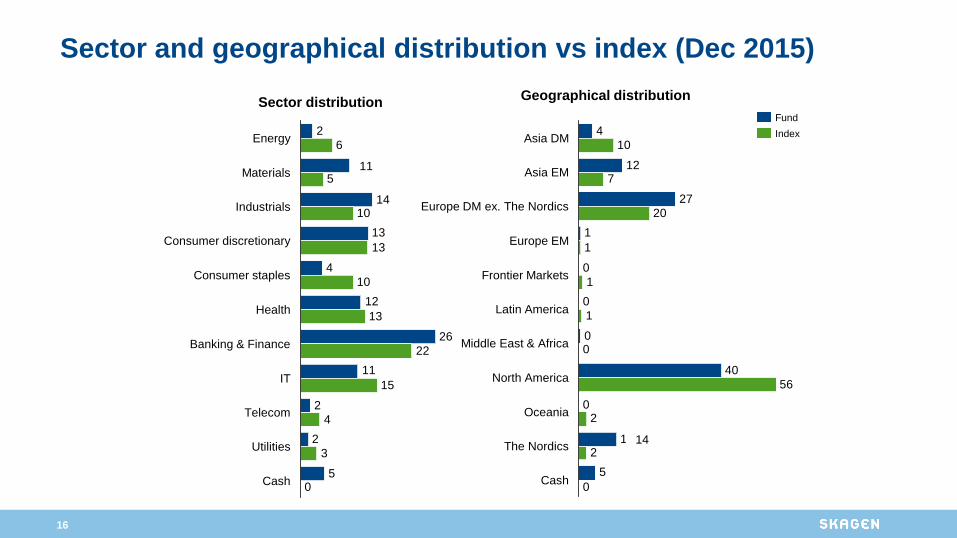
Sector and geographical distribution vs index (Dec 2015)
Sector distribution Geographical distribution
26
2
6
10
13
15
5
2
11
12
4
13
14
10
2
0
3
4
22
13
10
5
Cash
Health
Consumer staples
Consumer discretionary
Industrials
Utilities
Telecom
IT
Banking & Finance
Materials
Energy Index
Fund
40
11
10
20
1
56
5
0
0
0
0
1
27
12
4
0
2
2
0
1
1
7
Cash
The Nordics
Oceania
North America
Middle East & Africa
Latin America
Frontier Markets
Europe EM
Europe DM ex. The Nordics
Asia EM
Asia DM
14
11

17
High active share has always been a hallmark of SKAGEN
95% 94% 94% 94% 95% 92%
0%
20%
40%
60%
80%
100%
2010 2011 2012 2013 2014 2015
Portfolio Active Share

18
Agenda
Investment Frameworks
2016 Outlook
2015 Fund Review
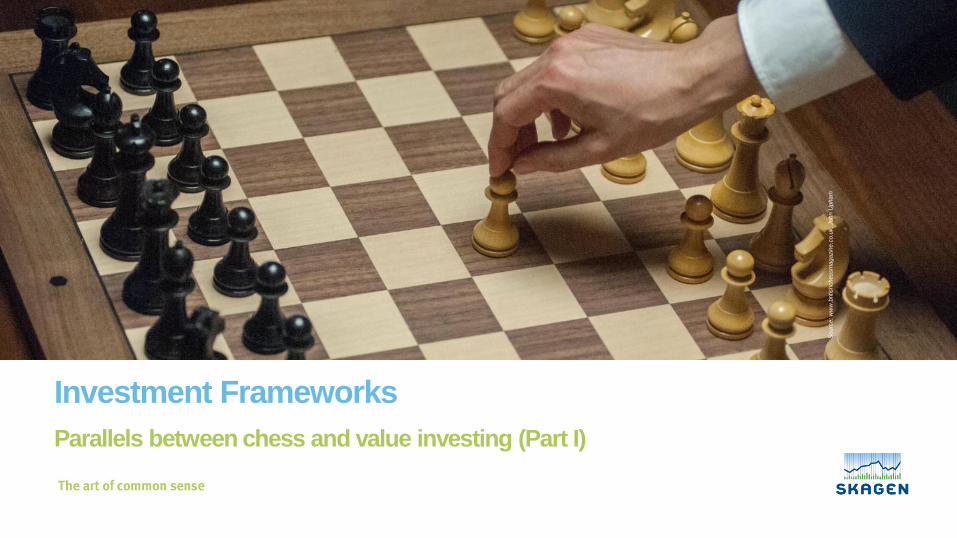
Investment Frameworks
Parallels between chess and value investing (Part I)
Sourc
e: w
ww
.britishchessm
agazin
e.c
o.u
k, J
ohn U
pham
20
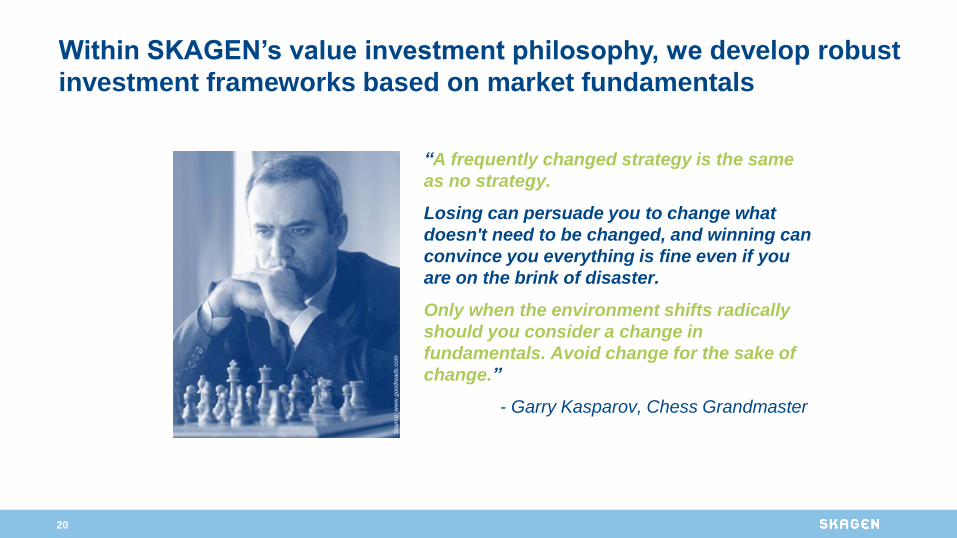
Within SKAGEN’s value investment philosophy, we develop robust
investment frameworks based on market fundamentals
Sourc
e: w
ww
.goodre
ads.c
om
“A frequently changed strategy is the same
as no strategy.
Losing can persuade you to change what
doesn't need to be changed, and winning can
convince you everything is fine even if you
are on the brink of disaster.
Only when the environment shifts radically
should you consider a change in
fundamentals. Avoid change for the sake of
change.”
- Garry Kasparov, Chess Grandmaster

21
Sicilian
Defence
Open
Sicilian
Dragon
Variation
In chess, a grandmaster’s overarching strategy includes a well-
defined framework for each situation that may plausibly arise

22
Sector
level
Similarly, we believe that value investing requires clearly
articulated frameworks to consistently achieve strong returns
Examples from SKAGEN Global
Consumer
Staples
Food
producers
Financials
Banks
Sub-sector
level
Stock
level

23
Let’s run through two examples
(insurance, infrastructure)
from our portfolio…

24
Simplified Case Study: Dutch insurers
10x 14x
6x
0
5
10
15
NNGroup
Peer 1 Peer 2
2015 P/E
49% 53%
46%
40%44%48%52%56%
NNGroup
Peer 1 Peer 2
2-yr fwd EPS growth
283% 202% 227%
0%
100%
200%
300%
NNGroup
Peer 1 Peer 2
2015 IGD Solvency
0,4x 0,6x
1,5x
0,0
1,0
2,0
NNGroup
Peer 1 Peer 2
2015 P/TNAV
Source: Company reports, Citi, HSBC

25
What we look for when investing in insurance companies
SKAGEN Global’s investment framework for Insurance
Topic Guideline
Solvency • Avoid insurers with poor and or
questionable solvency ratios
Underwriting • Avoid insurers who consistently deliver
sub-par combined ratio (but many
excuses)
Leverage • Limit exposure to insurers with average or
better-than-average balance sheets
Dividends • Dividends should at least be sustainable,
and preferably be growing at 5-10% p.a.
Regulation • Ensure that the relationship with local
regulator is strong and uncontroversial
Management • Favor management teams with a track
record of strong capital allocation and
hitting (or exceeding) financial targets
M&A • Avoid insurers who are highly acquisitive
(bolt-ons typically OK)
Valuation discipline secured thru SKAGEN’s philosophy
Sourc
e:
ww
w.t
heenerg
ycolle
ctive.c
om
Sourc
e:
ww
w.a
mzungo.c
om
Sourc
e:
ww
w.t
eam
win
sto
n.c
om

26
Does NN Group meet our insurance investment framework?
Topic Guideline NN
Group
Comment
Solvency • Avoid insurers with poor and or
questionable solvency ratios • NN Group is one of the best capitalized
insurers globally (Solvency II = 242%)
Underwriting • Avoid insurers who consistently deliver
sub-par COR (but many excuses) () • NN Group is a below-average underwriter
with ~100% COR, but 97% target by 2018
Leverage • Limit exposure to insurers with average or
better-than-average balance sheets • One of the healthiest B/S in the industry
(16% group debt leverage, 9% intangibles)
Dividends • Dividends should at least be sustainable,
and preferably growing at 5-10% p.a. • We assume >7% annual growth thru 2018
• Dividend well covered by cash generation
Regulation • Ensure that the relationship with local
regulator is strong and uncontroversial () • While the Dutch regulator (DNB) is the
harshest in Europe, NN Group’s relationship
with DNB appears to be good
Management • Favor management teams with a track
record of strong capital allocation and
hitting (or exceeding) financial targets
• Solid capital allocation track record
(buybacks ~6% of avg. 2015 mcap)
• Exceeded IPO cost reduction target
M&A • Avoid insurers who are highly acquisitive
(bolt-ons typically OK) • So far, NN Group has avoided large-scale
transactions

27
12-months total return (EUR)
NN Group
+36%
Peer 1
−13%
Peer 2
−68%
Source: Bloomberg

28
Our investment framework is designed to apply globally
12-months total return (EUR)
NN Group
+36%
Peer 1
−13%
Peer 2
−68%
Source: Bloomberg
AIG
+25%

29
Global Fund Manager Survey December 2015 (BAML)
Consensus significantly UW Utilities and Materials
Consensus significantly UW
Utilities and Materials

30
Infrastructure – A diverse and complex field where investors
need to be able to separate facts from fiction to succeed

31
What we look for when investing in utilities
SKAGEN Global’s investment framework for Utilities
Valuation discipline secured thru SKAGEN’s philosophy
Topic Guideline
Geography • In general, avoid emerging markets with high political risk due
to heavy fixed asset exposure
Jurisdiction • Favor countries/states with a track record of fair treatment of
utilities
Sub-sector • Prefer regulated electricity/gas/XMSN to merchant generation
and unhedged commodity plays
Leverage • Limit exposure to companies with average or better-than-
average balance sheets
Dividends • Dividends are a key component of utilities total return, but
must be sustainable even under stress scenarios
Regulation • Preferable entry point is just before or shortly after regulatory
framework finalized to provide high earnings visibility
M&A • Utilities intended to play a defensive role in the portfolio rarely
fill that function if management is acquisitive (=uncertainty)
Sourc
e:
ww
w.t
wik
imedia
.org
Sourc
e:
ww
w.b
lm.g
ov
Sourc
e:
ww
w.r
enew
cm
.com
32
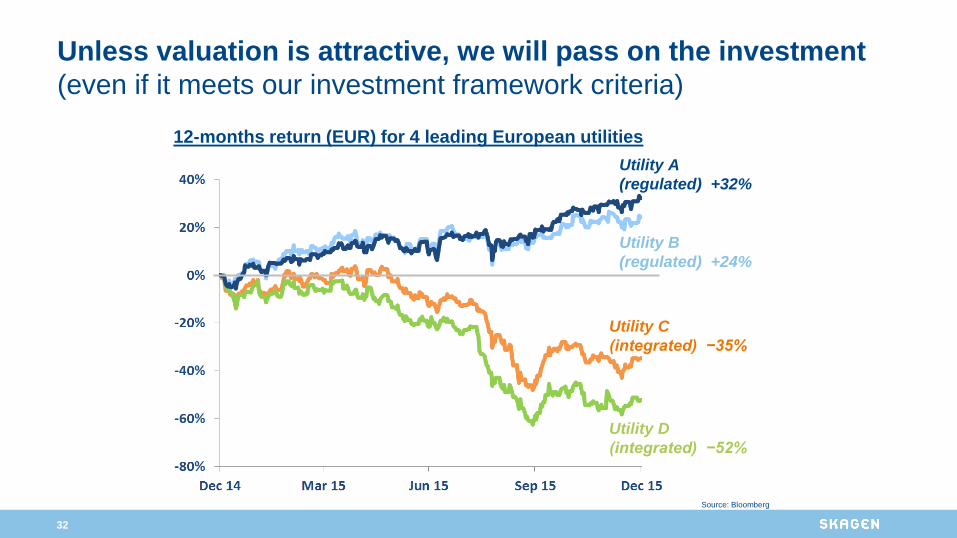
Unless valuation is attractive, we will pass on the investment
(even if it meets our investment framework criteria)
Utility C
(integrated) −35%
Utility D
(integrated) −52%
Utility A
(regulated) +32%
Utility B
(regulated) +24%
12-months return (EUR) for 4 leading European utilities
Source: Bloomberg
33
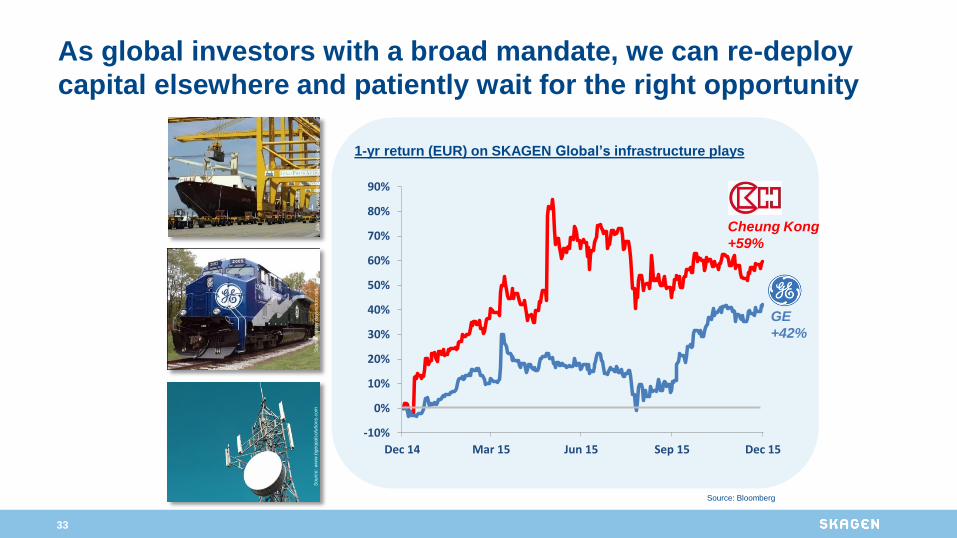
As global investors with a broad mandate, we can re-deploy
capital elsewhere and patiently wait for the right opportunity
1-yr return (EUR) on SKAGEN Global’s infrastructure plays
Sourc
e:
ww
w.b
geopals
olu
tions.c
om
Sourc
e:
ww
w.d
ayvecto
rs.n
et
S
ourc
e:
ww
w.c
onstr
uctionw
eekonlin
e.c
om
-10%
0%
10%
20%
30%
40%
50%
60%
70%
80%
90%
Dec 14 Mar 15 Jun 15 Sep 15 Dec 15
Cheung Kong
+59%
GE
+42%
Source: Bloomberg

34
Using an investment framework brings complementary
benefits beyond enhancing risk-adjusted returns
While we primarily seek to attain the best possible
risk-adjusted returns, we also want our results to be:
Consistent
Explainable
Repeatable

35
We believe in rigorous planning and effective execution
So
urc
e:
ww
w.2
4s
ata
.rs
“The strategist starts with a goal in
the distant future and works
backwards to the present.
A Grandmaster makes the best
moves because they are based on
what he wants the board to look
like ten or twenty moves in the
future.
This doesn't require the calculation
of countless twenty-move
variations. He evaluates where his
fortunes lie in the position and
establishes objectives.
Then he works out the step-by-step
moves to accomplish those aims.”
- Garry Kasparov

36
Agenda
Investment Frameworks
2016 Outlook
2015 Fund Review
37
“Stop trying to predict the
direction of the stock market,
the economy, interest rates, or
elections.”
- Warren Buffett
We are cognizant of macro conditions, but focus on companies

38
Our bottom-up selected portfolio offers global exposure to
many quality companies at attractive valuations
CAPITAL RETURN
FINANCIALS
SELF-HELP
STORIES
STRUCTURAL
WINNERS
Source: SKAGEN Global, December 2015

39
2016 is “The Year of the Monkey” in the Chinese zodiac If you do like everyone else, you become like everyone else
We continue to think differently and invest independently
Sourc
e: w
ww
.deim
ar.
co

Thank you

41
Appendix

42
Our high conviction holdings have generally done well since
inception…
Contribution to excess return by year
…but more recently the small positions have disappointed
-100 %
-80 %
-60 %
-40 %
-20 %
0 %
20 %
40 %
60 %
80 %
100 %
2002 2003 2004 2005 2006 2007 2008 2009 2010 2011 2012 2013 2014 2015
Top 35 Holdings Rest of Portfolio
Source: SKAGEN, MSCI. Returns used are measured in NOK, net of
fees

43
The global stock market is back at peak levels
MSCI World in USD since 1970

44
Undervalued
Unpopular
Under-
researched
Where we normally
go looking
What we want to buy
>90% of under-
researched and
unpopular equities
probably deserve
these epithets for
very good reasons
The 3 Us form the cornerstone of our investment approach
45
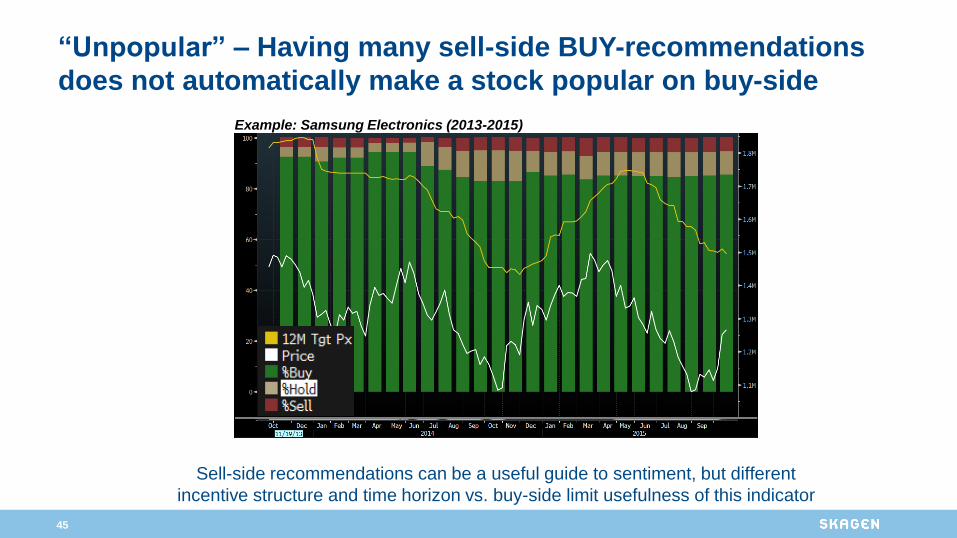
“Unpopular” – Having many sell-side BUY-recommendations
does not automatically make a stock popular on buy-side
Sell-side recommendations can be a useful guide to sentiment, but different
incentive structure and time horizon vs. buy-side limit usefulness of this indicator
Example: Samsung Electronics (2013-2015)

46
The term “Under-researched” implies that one or several
aspects of the investment case is misunderstood by the market
Five common reasons why
companies are “Under-researched” Portfolio examples
Analyst coverage lacking in terms of #
analysts, quality, publishing frequency
Research distorted by singular focus
on specific event/topic
Failure to capture long-term
attractiveness of business
Consensus thinking on key
assumptions is flawed
“Wrong sector” and/or “wrong
classification”

47
“Undervalued” – where and how do we differ? Optically cheap stocks may not be indicative of true value
• Discount to intrinsic value is an absolute criteria for an investment
Dogmatic
• Value can be found in many different guises
Pragmatic
• Events that will unlock the value within our investment horizon
Triggers

48
The 3Us apply when SKAGEN buys a new stock, then
gradually fade away as the investment case plays out
All 3Us rarely apply to existing holdings as one or more of the 3Us may
“disappear” as the equity story unfolds (only Undervalued always applies)
Unpopular
Under-researched
Undervalued
SKAGEN buys
SKAGEN sells
Unpopular
Under-researched
Undervalued
Unpopular
Under-researched
Undervalued
The 3U philosophy explained in practice

49
We are aligned with our clients
“Our clients are partners; the only aim is to give them the best
risk-adjusted return possible. If our clients do well, we do well.”
- Kristoffer Stensrud, SKAGEN Founder