Sizing Up the Numbers Market Size Business Size Market Share Revenue Projections.
29
Sizing Up the Sizing Up the Numbers Numbers Market Size Market Size Business Size Business Size Market Share Market Share Revenue Projections Revenue Projections
-
Upload
chrystal-higgins -
Category
Documents
-
view
223 -
download
1
Transcript of Sizing Up the Numbers Market Size Business Size Market Share Revenue Projections.

Sizing Up the Sizing Up the NumbersNumbers
Market SizeMarket Size
Business SizeBusiness Size
Market ShareMarket Share
Revenue ProjectionsRevenue Projections

Market Size?Market Size?
US Department of State US Department of State Ed.govEd.gov US News & World ReportUS News & World Report
(Ed.gov recommended) (Ed.gov recommended) Petersons.com-Petersons.com- 4,212 Total Undergraduate Colleges & 4,212 Total Undergraduate Colleges &
UniversitiesUniversities 2,986 Business2,986 Business 2,058 Education2,058 Education
Market SizeMarket Size
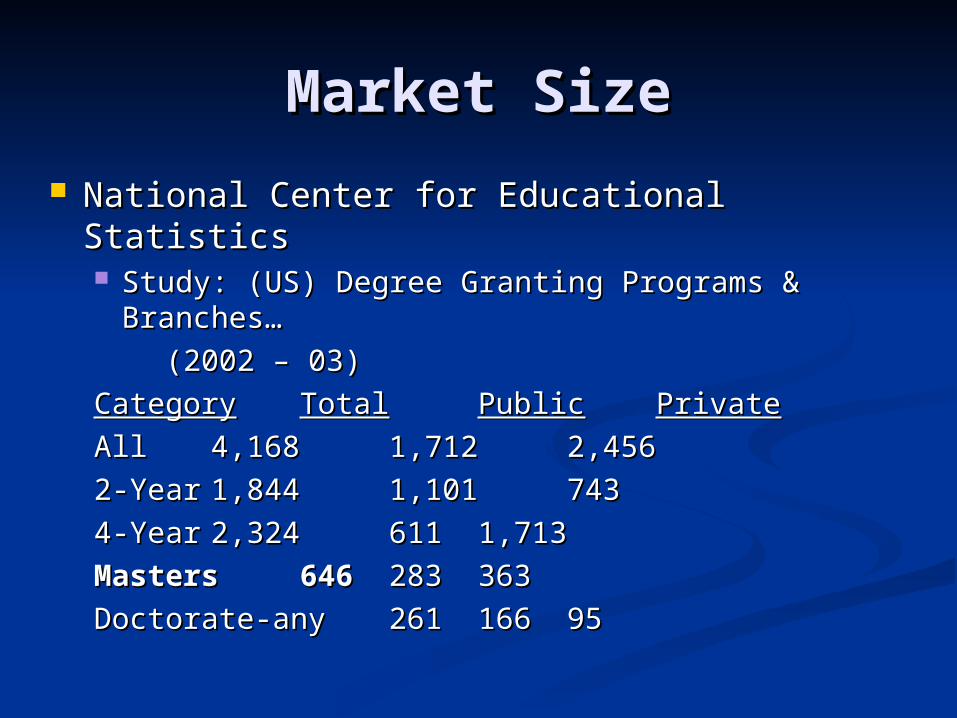
National Center for Educational StatisticsNational Center for Educational Statistics Study: (US) Degree Granting Programs & Study: (US) Degree Granting Programs &
Branches… Branches…
(2002 – 03)(2002 – 03)
CategoryCategory TotalTotal PublicPublic PrivatePrivate
AllAll 4,1684,168 1,7121,712 2,4562,456
2-Year2-Year 1,8441,844 1,1011,101 743743
4-Year4-Year 2,3242,324 611611 1,7131,713
MastersMasters 646646 283283 363363
Doctorate-anyDoctorate-any 261261 166166 9595
Market SizeMarket Size
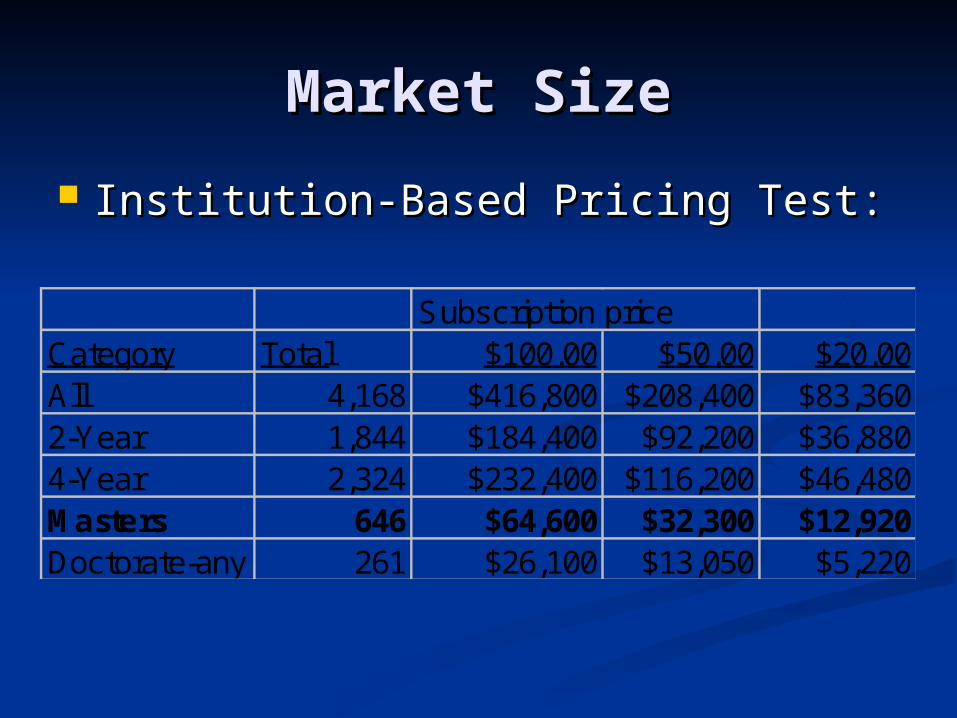
Institution-Based Pricing Test:Institution-Based Pricing Test:
Subscription priceCategory Total $100.00 $50.00 $20.00All 4,168 $416,800 $208,400 $83,3602-Year 1,844 $184,400 $92,200 $36,8804-Year 2,324 $232,400 $116,200 $46,480Masters 646 $64,600 $32,300 $12,920Doctorate-any 261 $26,100 $13,050 $5,220

Market SizeMarket Size Areas of study?Areas of study? US News & World Report – US News & World Report –
Americas Best Graduate Schools Americas Best Graduate Schools 2005:2005:
Areas of Study # of SchoolsBusiness 377Education 885Engineering 87Law 186Medicine 146Fine Arts 213Health Diciplines 1,816Library Science 48Public Affairs 253The Sciences 863Social Science & Humanities 132Total 5,006
Market SizeMarket Size
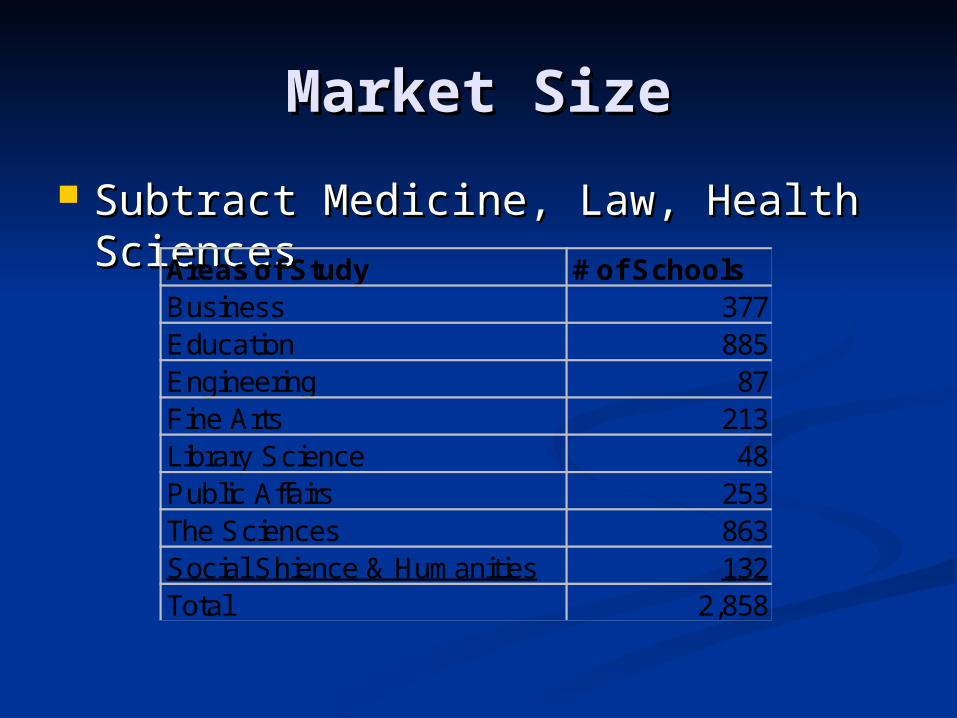
Subtract Medicine, Law, Health Subtract Medicine, Law, Health SciencesSciencesAreas of Study # of Schools
Business 377Education 885Engineering 87Fine Arts 213Library Science 48Public Affairs 253The Sciences 863Social Shience & Humanities 132Total 2,858
Market SizeMarket Size
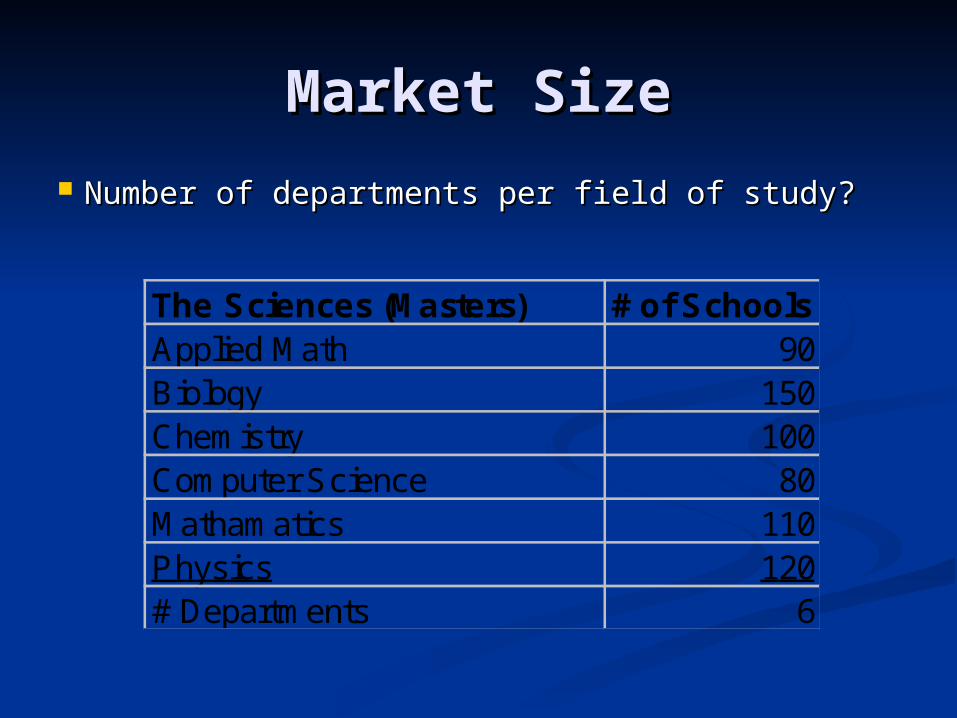
Number of departments per field of study?Number of departments per field of study?
The Sciences (Masters) # of SchoolsApplied Math 90Biology 150Chemistry 100Computer Science 80Mathamatics 110Physics 120# Departments 6
Market SizeMarket Size
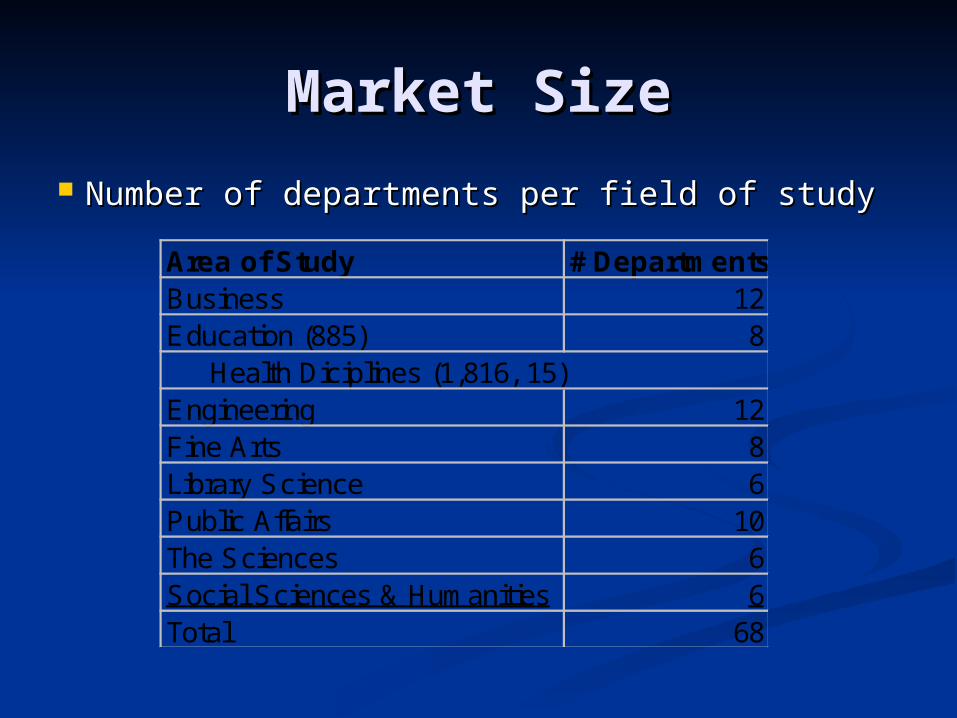
Number of departments per field of studyNumber of departments per field of study
Area of Study # DepartmentsBusiness 12Education (885) 8 Health Diciplines (1,816, 15)Engineering 12Fine Arts 8Library Science 6Public Affairs 10The Sciences 6Social Sciences & Humanities 6Total 68
Market SizeMarket Size
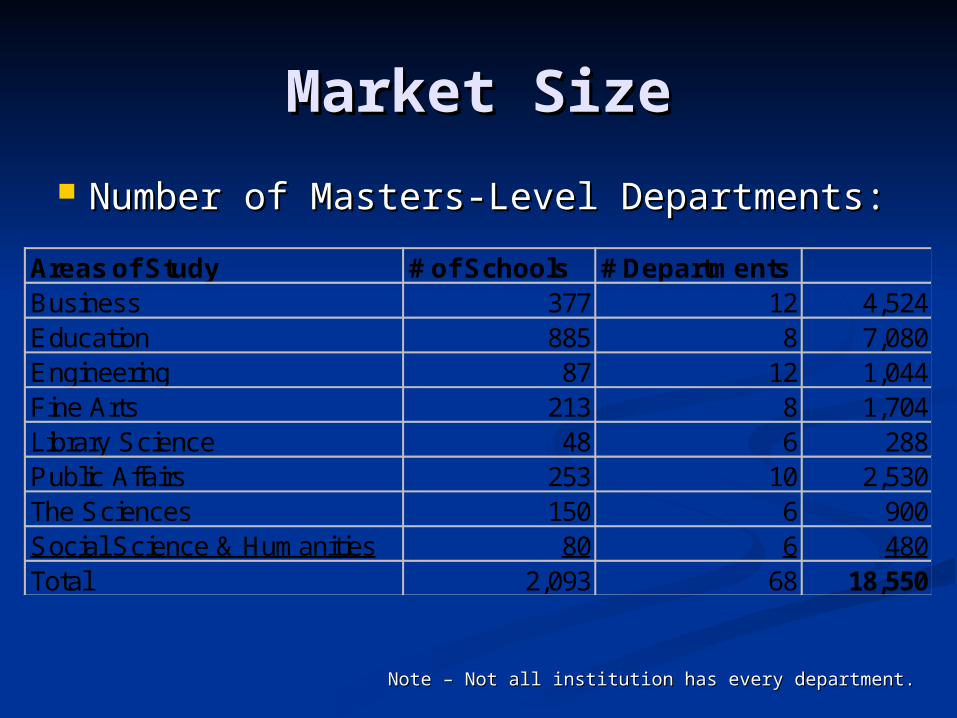
Number of Masters-Level Departments:Number of Masters-Level Departments:
Areas of Study # of Schools # DepartmentsBusiness 377 12 4,524Education 885 8 7,080Engineering 87 12 1,044Fine Arts 213 8 1,704Library Science 48 6 288Public Affairs 253 10 2,530The Sciences 150 6 900Social Science & Humanities 80 6 480Total 2,093 68 18,550
Note – Not all institution has every department.Note – Not all institution has every department.
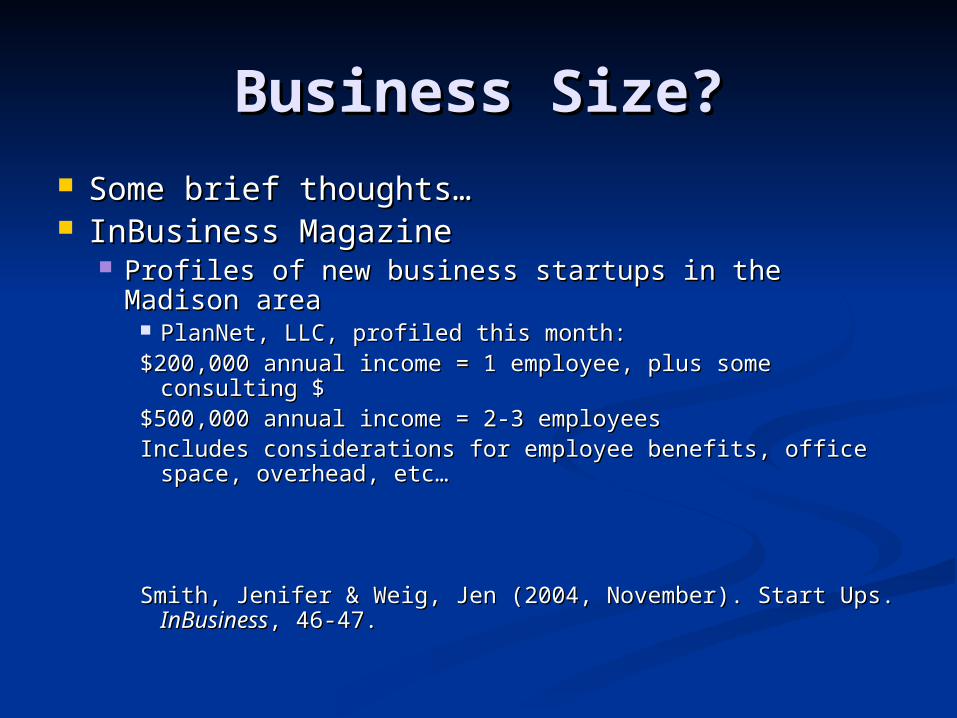
Business Size?Business Size? Some brief thoughts…Some brief thoughts… InBusiness MagazineInBusiness Magazine
Profiles of new business startups in the Madison Profiles of new business startups in the Madison areaarea
PlanNet, LLC, profiled this month:PlanNet, LLC, profiled this month:$200,000 annual income = 1 employee, plus some consulting $200,000 annual income = 1 employee, plus some consulting
$$$500,000 annual income = 2-3 employees$500,000 annual income = 2-3 employeesIncludes considerations for employee benefits, office space, Includes considerations for employee benefits, office space,
overhead, etc…overhead, etc…
Smith, Jenifer & Weig, Jen (2004, November). Start Ups. Smith, Jenifer & Weig, Jen (2004, November). Start Ups. InBusinessInBusiness, 46-47., 46-47.
Business Size?Business Size?
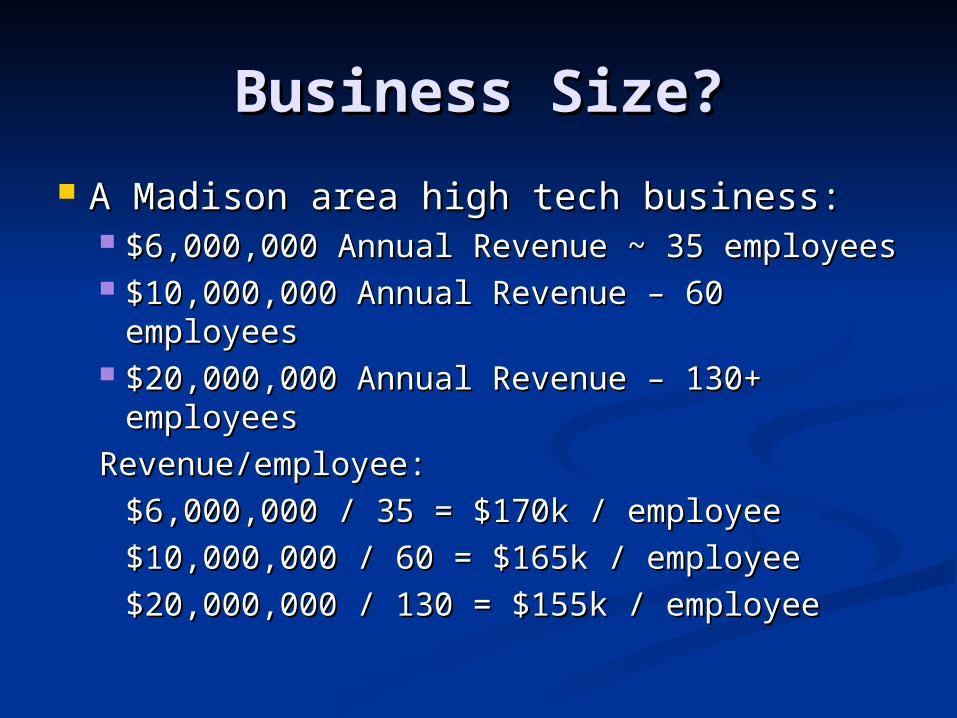
A Madison area high tech business:A Madison area high tech business: $6,000,000 Annual Revenue ~ 35 employees$6,000,000 Annual Revenue ~ 35 employees $10,000,000 Annual Revenue – 60 $10,000,000 Annual Revenue – 60
employeesemployees $20,000,000 Annual Revenue – 130+ $20,000,000 Annual Revenue – 130+
employeesemployees
Revenue/employee:Revenue/employee:
$6,000,000 / 35 = $170k / employee$6,000,000 / 35 = $170k / employee
$10,000,000 / 60 = $165k / employee$10,000,000 / 60 = $165k / employee
$20,000,000 / 130 = $155k / employee$20,000,000 / 130 = $155k / employee
Business SizeBusiness Size
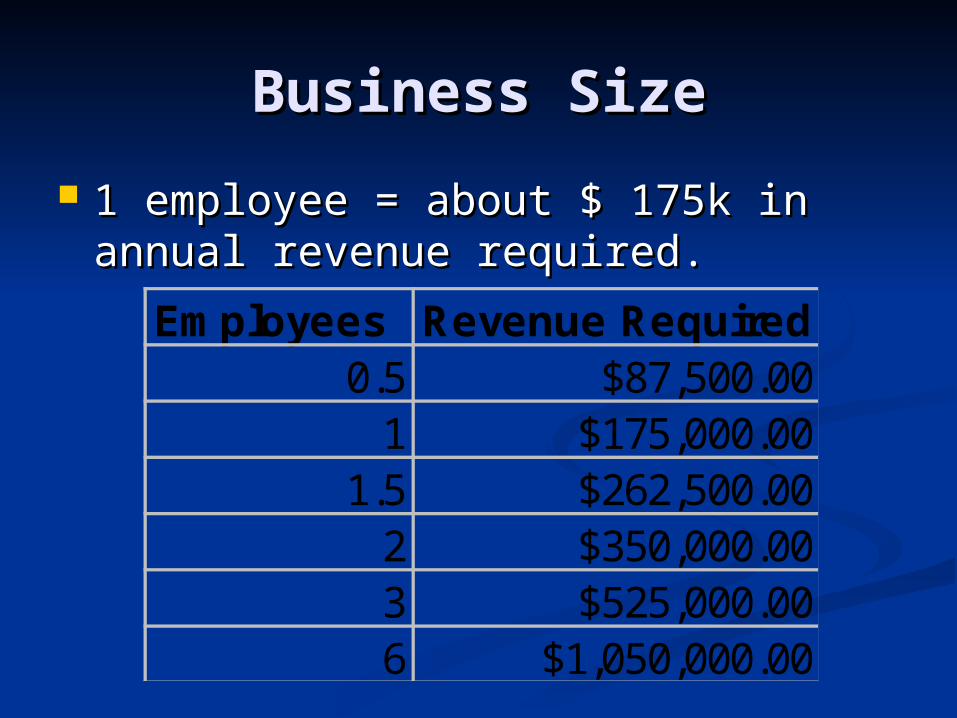
1 employee = about $ 175k in 1 employee = about $ 175k in annual revenue required.annual revenue required.
Employees Revenue Required0.5 $87,500.00
1 $175,000.001.5 $262,500.00
2 $350,000.003 $525,000.006 $1,050,000.00
Business SizeBusiness Size
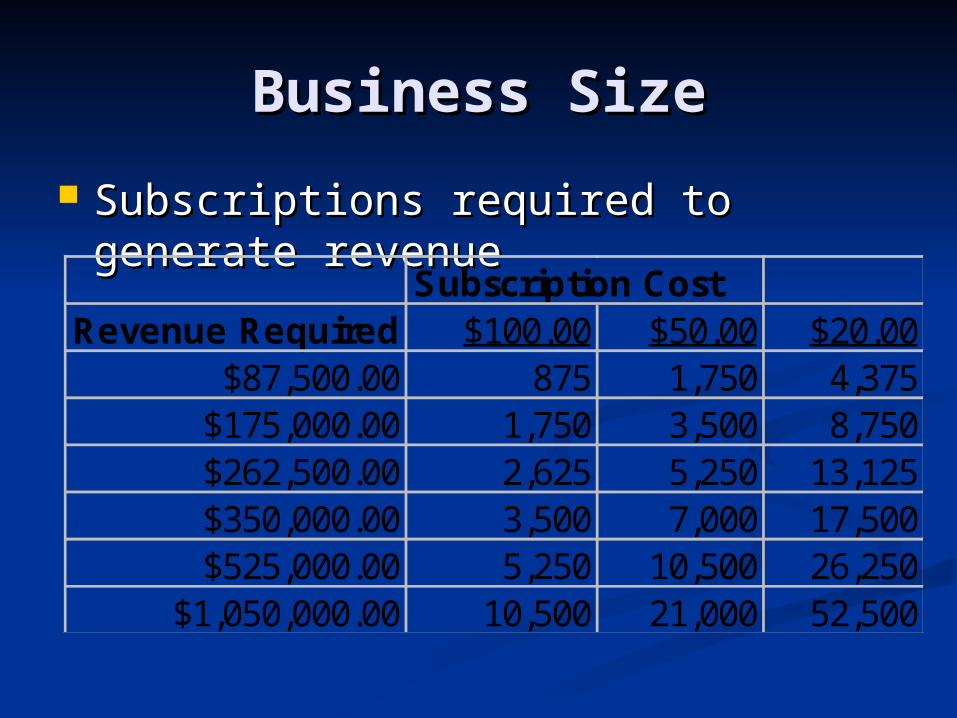
Subscriptions required to generate Subscriptions required to generate revenuerevenue
Subscription CostRevenue Required $100.00 $50.00 $20.00
$87,500.00 875 1,750 4,375$175,000.00 1,750 3,500 8,750$262,500.00 2,625 5,250 13,125$350,000.00 3,500 7,000 17,500$525,000.00 5,250 10,500 26,250
$1,050,000.00 10,500 21,000 52,500
Business SizeBusiness Size
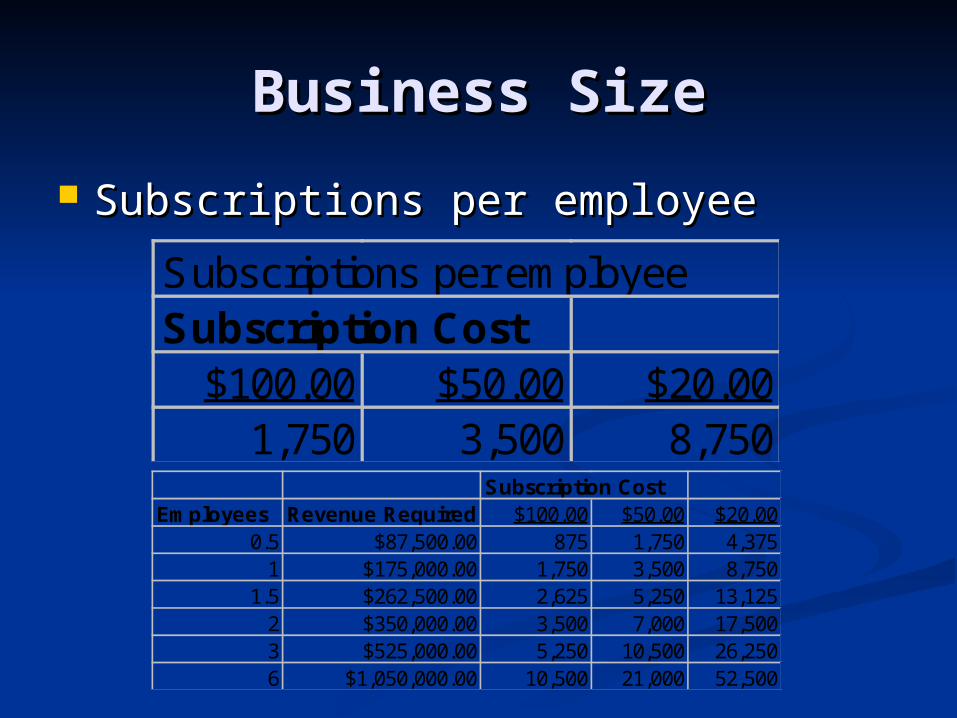
Subscriptions per employeeSubscriptions per employee
Subscription CostEmployees Revenue Required $100.00 $50.00 $20.00
0.5 $87,500.00 875 1,750 4,3751 $175,000.00 1,750 3,500 8,750
1.5 $262,500.00 2,625 5,250 13,1252 $350,000.00 3,500 7,000 17,5003 $525,000.00 5,250 10,500 26,2506 $1,050,000.00 10,500 21,000 52,500
Subscriptions per employeeSubscription Cost
$100.00 $50.00 $20.001,750 3,500 8,750
Market ShareMarket Share
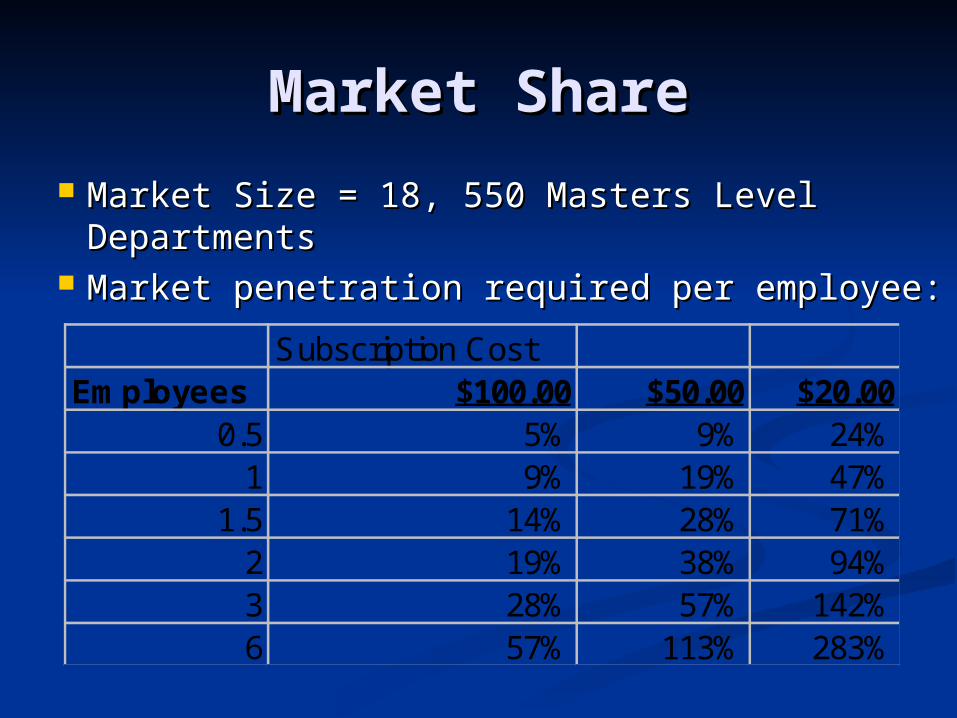
Market Size = 18, 550 Masters Level Market Size = 18, 550 Masters Level DepartmentsDepartments
Market penetration required per employee:Market penetration required per employee:Subscription Cost
Employees $100.00 $50.00 $20.000.5 5% 9% 24%
1 9% 19% 47%1.5 14% 28% 71%
2 19% 38% 94%3 28% 57% 142%6 57% 113% 283%
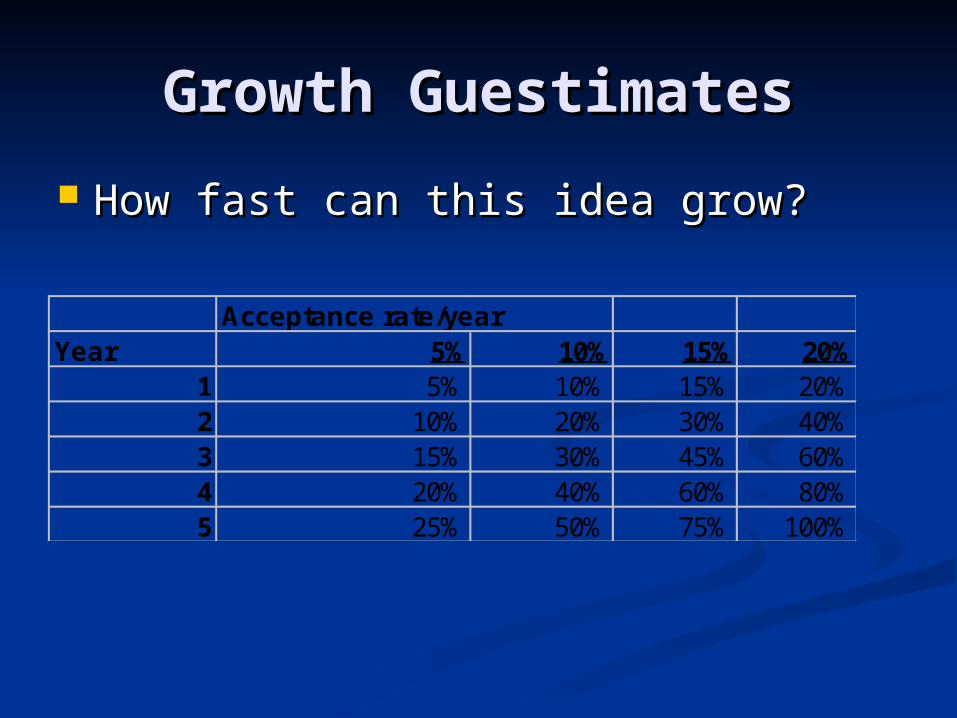
Growth GuestimatesGrowth Guestimates
How fast can this idea grow?How fast can this idea grow?
Acceptance rate/yearYear 5% 10% 15% 20%
1 5% 10% 15% 20%2 10% 20% 30% 40%3 15% 30% 45% 60%4 20% 40% 60% 80%5 25% 50% 75% 100%

Time to $ OneTime to $ One
11stst 6 Months 6 Months Work out technical aspects. Work out technical aspects. Begin obtaining journal info from 1-2 Begin obtaining journal info from 1-2
specific fields.specific fields. 22ndnd 6 Months 6 Months
Begin membership recruitment (no Begin membership recruitment (no fees)fees)
Start expanding fields in database to 1-2 Start expanding fields in database to 1-2 areas of study.areas of study.
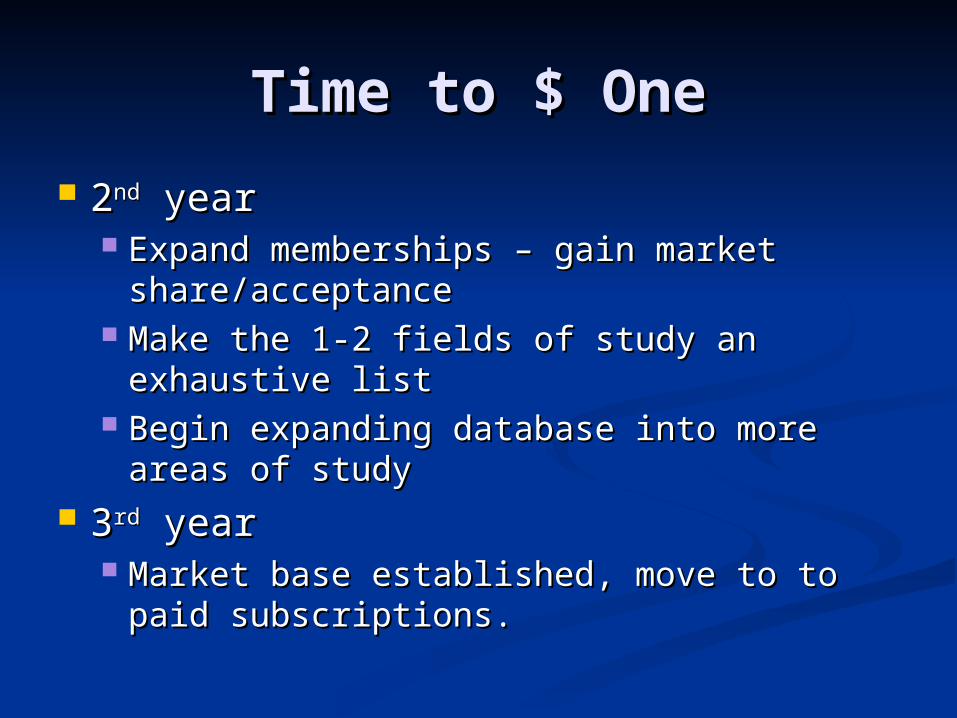
Time to $ OneTime to $ One
22ndnd year year Expand memberships – gain market Expand memberships – gain market
share/acceptanceshare/acceptance Make the 1-2 fields of study an exhaustive Make the 1-2 fields of study an exhaustive
listlist Begin expanding database into more areas Begin expanding database into more areas
of studyof study 33rdrd year year
Market base established, move to to paid Market base established, move to to paid subscriptions.subscriptions.
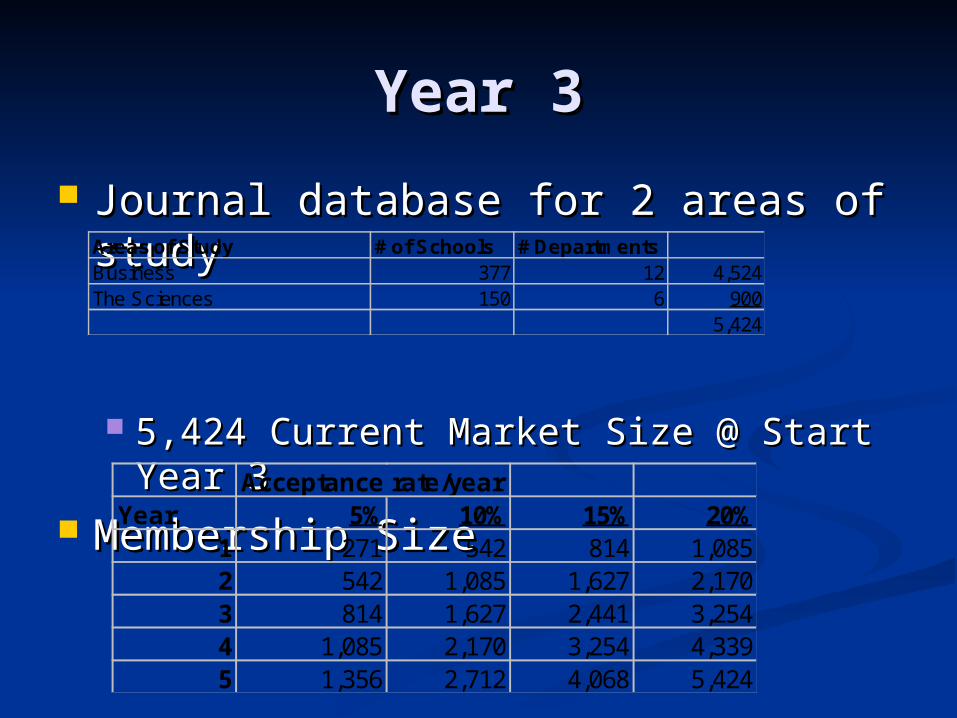
Year 3Year 3
Journal database for 2 areas of studyJournal database for 2 areas of study
5,424 Current Market Size @ Start Year 5,424 Current Market Size @ Start Year 33
Membership SizeMembership Size
Areas of Study # of Schools # DepartmentsBusiness 377 12 4,524The Sciences 150 6 900
5,424
Acceptance rate/yearYear 5% 10% 15% 20%
1 271 542 814 1,0852 542 1,085 1,627 2,1703 814 1,627 2,441 3,2544 1,085 2,170 3,254 4,3395 1,356 2,712 4,068 5,424
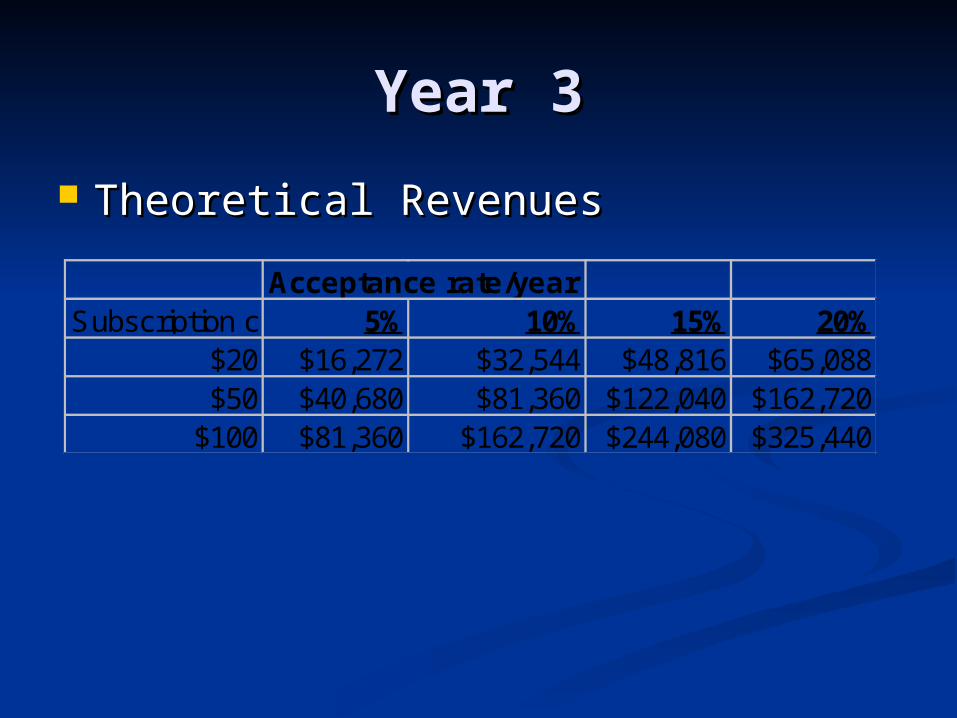
Year 3Year 3
Theoretical RevenuesTheoretical Revenues
Acceptance rate/yearSubscription cost 5% 10% 15% 20%
$20 $16,272 $32,544 $48,816 $65,088$50 $40,680 $81,360 $122,040 $162,720
$100 $81,360 $162,720 $244,080 $325,440
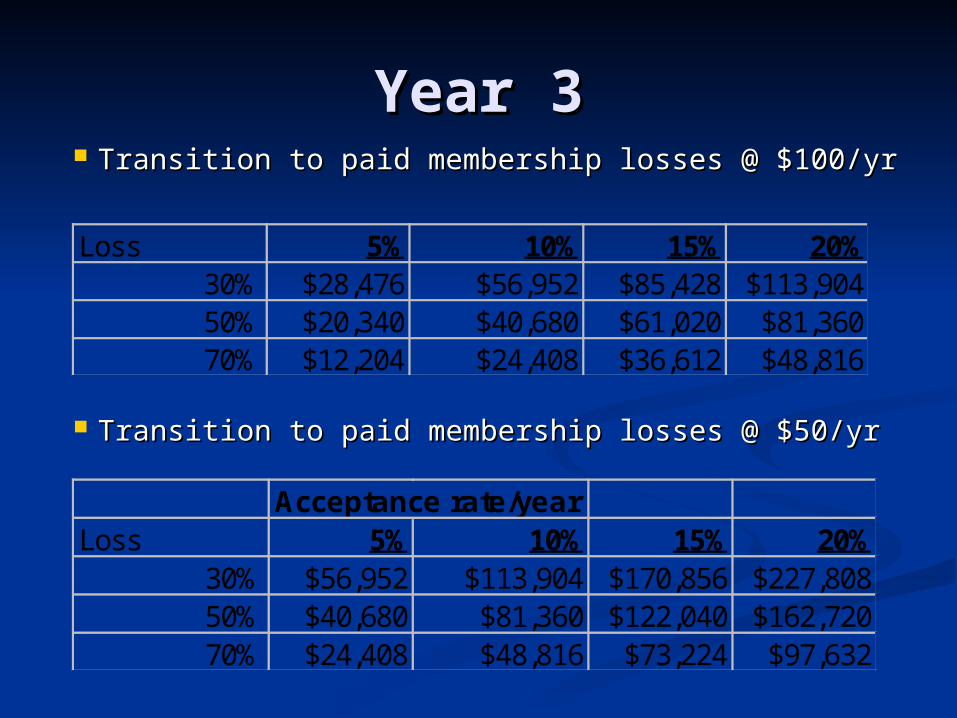
Year 3Year 3
Transition to paid membership losses @ $50/yrTransition to paid membership losses @ $50/yr
Transition to paid membership losses @ $100/yrTransition to paid membership losses @ $100/yr
Loss 5% 10% 15% 20%30% $28,476 $56,952 $85,428 $113,90450% $20,340 $40,680 $61,020 $81,36070% $12,204 $24,408 $36,612 $48,816
Acceptance rate/yearLoss 5% 10% 15% 20%
30% $56,952 $113,904 $170,856 $227,80850% $40,680 $81,360 $122,040 $162,72070% $24,408 $48,816 $73,224 $97,632
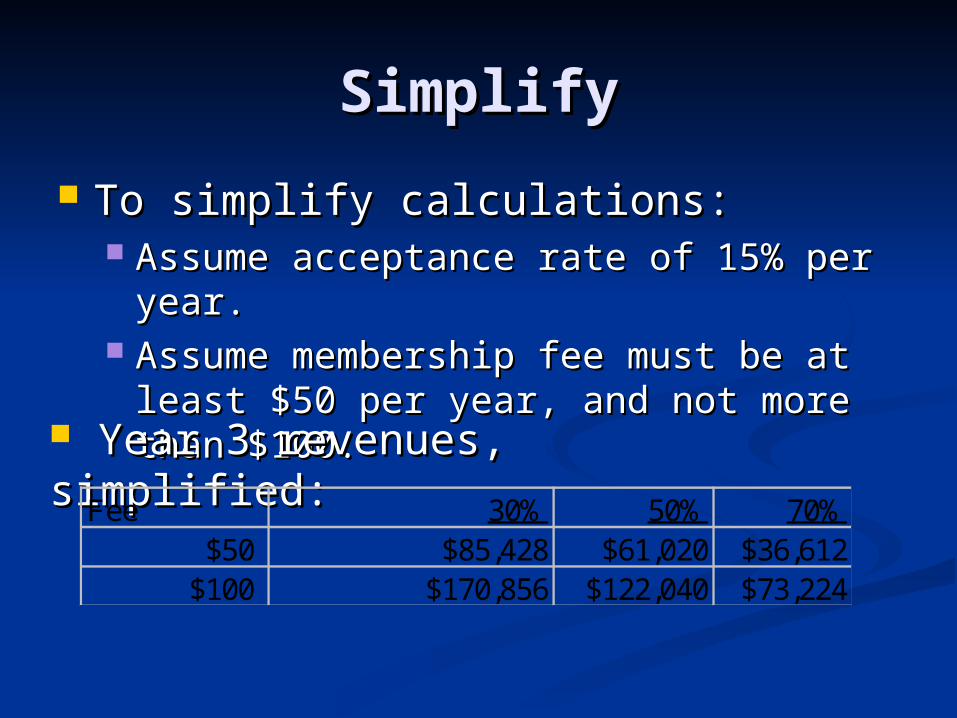
SimplifySimplify
To simplify calculations:To simplify calculations: Assume acceptance rate of 15% per Assume acceptance rate of 15% per
year.year. Assume membership fee must be at Assume membership fee must be at
least $50 per year, and not more than least $50 per year, and not more than $100.$100. Year 3 revenues, simplified:Year 3 revenues, simplified:
Fee 30% 50% 70%$50 $85,428 $61,020 $36,612
$100 $170,856 $122,040 $73,224

Market Size Growth Market Size Growth ProjectionsProjections
Year 3 Market Served Size = 5,424Year 3 Market Served Size = 5,424 Estimated Total Market Size = 18,550Estimated Total Market Size = 18,550 Market Expansion Growth Rate:Market Expansion Growth Rate:
Year Market Served % of Market Size0 0 0%3 5,424 29%
Assume 10% growth per year of Assume 10% growth per year of percent of total market served.percent of total market served.
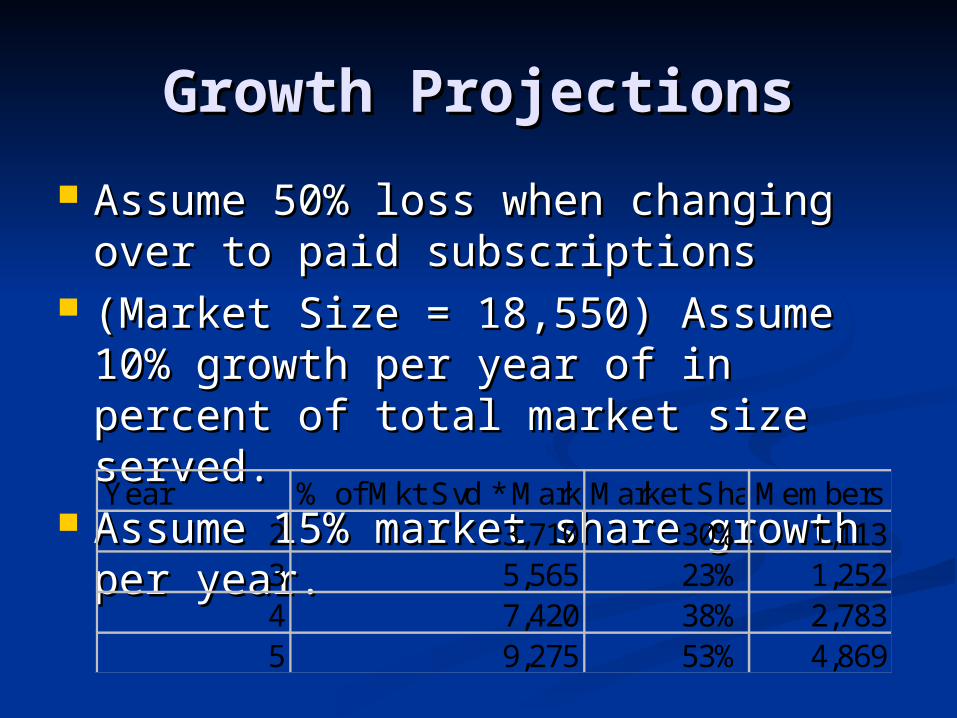
Growth ProjectionsGrowth Projections
Assume 50% loss when changing over Assume 50% loss when changing over to paid subscriptionsto paid subscriptions
(Market Size = 18,550) Assume 10% (Market Size = 18,550) Assume 10% growth per year of in percent of total growth per year of in percent of total market size served.market size served.
Assume 15% market share growth per Assume 15% market share growth per year.year.Year % of Mkt Svd * MarketMarket ShareMembers
2 3,710 30% 1,1133 5,565 23% 1,2524 7,420 38% 2,7835 9,275 53% 4,869
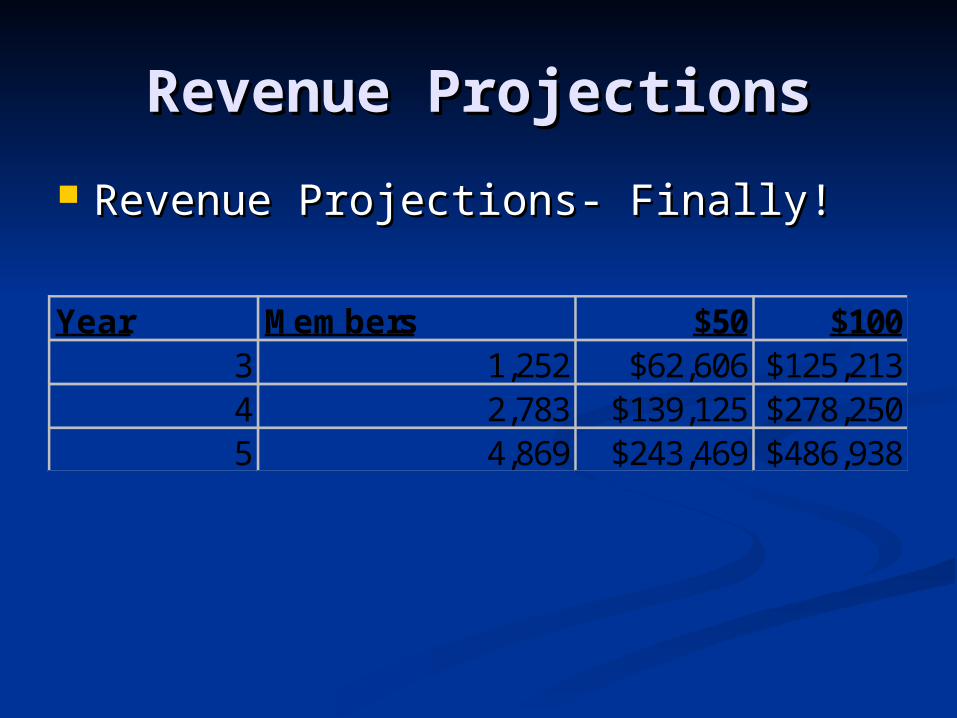
Revenue ProjectionsRevenue Projections
Revenue Projections- Finally!Revenue Projections- Finally!
Year Members $50 $1003 1,252 $62,606 $125,2134 2,783 $139,125 $278,2505 4,869 $243,469 $486,938
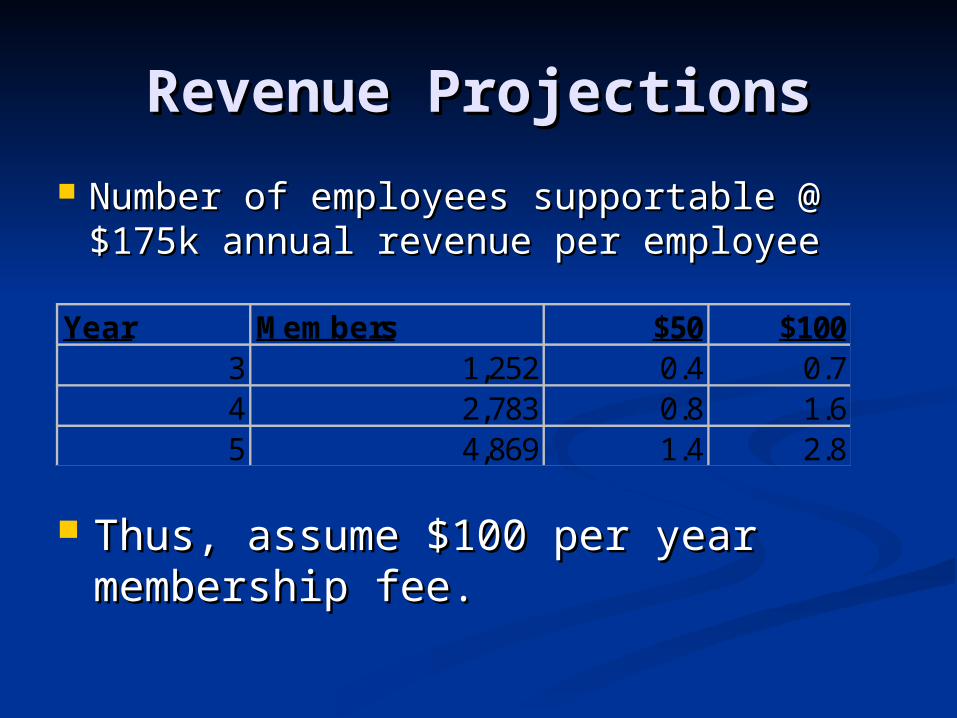
Revenue ProjectionsRevenue Projections
Number of employees supportable @ Number of employees supportable @ $175k annual revenue per employee$175k annual revenue per employee
Year Members $50 $1003 1,252 0.4 0.74 2,783 0.8 1.65 4,869 1.4 2.8
Thus, assume $100 per year Thus, assume $100 per year membership fee.membership fee.
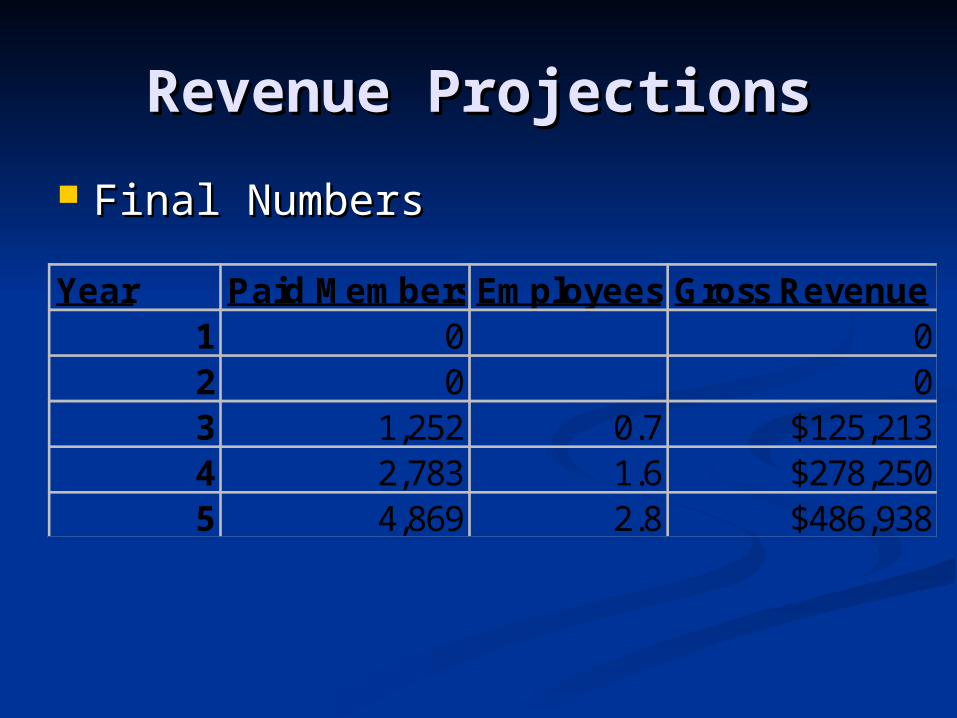
Revenue ProjectionsRevenue Projections
Final NumbersFinal Numbers
Year Paid MembershipsEmployees Gross Revenue1 0 02 0 03 1,252 0.7 $125,2134 2,783 1.6 $278,2505 4,869 2.8 $486,938
NotesNotes
Someone needs to run the business Someone needs to run the business for more than 2 years to get it up for more than 2 years to get it up and running.and running. They will expect to be paid in the future They will expect to be paid in the future
for such efforts.for such efforts. Perhaps delay hiring employees in years 4+ Perhaps delay hiring employees in years 4+
to help provide a return on time invested?to help provide a return on time invested? Year 5 estimated revenues = $486,938.Year 5 estimated revenues = $486,938.

Sizing Up the Numbers Sizing Up the Numbers ConclusionConclusion
Market SizeMarket Size Business SizeBusiness Size Market ShareMarket Share Revenue ProjectionsRevenue Projections