
Size Effect on the Ultimate Drying Shrinkage of Concrete ...
16
Introduction Experimental data Prediction models, design codes Finite element simulations Conclusions Acknowledgement Size Effect on the Ultimate Drying Shrinkage of Concrete – Modeling with Microprestress-solidification Theory Engineering Mechanics 2020 CZECH TECHNICAL UNIVERSITY IN PRAGUE Faculty of Civli Engineering Department of Mechanics Lenka Dohnalová, Petr Havlásek
Transcript of Size Effect on the Ultimate Drying Shrinkage of Concrete ...

IntroductionExperimental data
Prediction models, design codesFinite element simulations
ConclusionsAcknowledgement
Size Effect on the Ultimate Drying Shrinkageof Concrete – Modeling with
Microprestress-solidification Theory
Engineering Mechanics 2020
CZECH TECHNICAL UNIVERSITY IN PRAGUE
Faculty of Civli EngineeringDepartment of Mechanics
Lenka Dohnalová, Petr Havlásek
15. listopadu 2020

IntroductionExperimental data
Prediction models, design codesFinite element simulations
ConclusionsAcknowledgement
Motivation
(Z. Bažant, M. Jirásek: Creep and hygrothermaleffects in concrete structures, 2018)
the ultimate drying shrinkage ofstandard-size structural members isreached within several decades
extrapolation based on short-termmeasurements on standardlaboratory specimens presents anill-posed problem and can lead tolarge errors
final magnitude of shrinkage issize-dependent, thereforeknowledge of this size-effect isessential for correct transition fromvery small laboratory specimens toreal-size structural members
1 / 14
IntroductionExperimental data
Prediction models, design codesFinite element simulations
ConclusionsAcknowledgement
Basic structure of research
In the presented research the size-effect on the ultimate drying shrinkage wasassessed on the basis of:
experimental data from a freely available database, provided by theNorthwestern University (NU database), and data from literature
equations incorporated in the most frequently used prediction modelsand design codes
results obtained from coupled hygro-mechanical finite elementsimulations using an advanced constitutive model based on theMicroprestress-Solidification theory (MPS)
2 / 14
IntroductionExperimental data
Prediction models, design codesFinite element simulations
ConclusionsAcknowledgement
Size-effect determined from experimental data
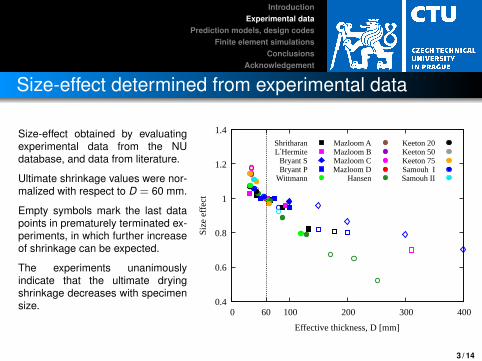
Size-effect obtained by evaluatingexperimental data from the NUdatabase, and data from literature.
Ultimate shrinkage values were nor-malized with respect to D = 60 mm.
Empty symbols mark the last datapoints in prematurely terminated ex-periments, in which further increaseof shrinkage can be expected.
The experiments unanimouslyindicate that the ultimate dryingshrinkage decreases with specimensize. 0.4
0.6
0.8
1
1.2
1.4
60 0 100 200 300 400
Siz
e ef
fect
Effective thickness, D [mm]
ShritharanL′Hermite
Bryant SBryant P
Wittmann
Mazloom AMazloom BMazloom CMazloom D
Hansen
Keeton 20Keeton 50Keeton 75Samouh ISamouh II
3 / 14

IntroductionExperimental data
Prediction models, design codesFinite element simulations
ConclusionsAcknowledgement
Analyzed prediction models and design codes
Prediction models:- B3 and B4 models- fib Model Code 2010
Design codes:
- Eurocode 2
- ACI 209.2R–08
Size-effect on drying shrinkage is considered in majority of the models (exceptfor fib Model Code 2010), however, the formulation differs among the models.
Each of the models uses a different equivalent size as a reference (for whichthe size-effect is equal to 1).
4 / 14

IntroductionExperimental data
Prediction models, design codesFinite element simulations
ConclusionsAcknowledgement
Size-effect according to prediction models
The fib Model Code 2010completely neglects thesize-effect on the ultimatedrying shrinkage.
The EC2 gives a recommen-dation only for members withD > 100 mm.
According to the B3 and B4models the size-effect is signi-ficant only for D ≤ 50 mm, forlarger specimens it completelyvanishes.
0.4
0.6
0.8
1
1.2
1.4
0 100 200 300 400 500
Siz
e ef
fect
Effective thickness, D [mm]
ACI coefficientACI factor
EC2B3/B4 model
5 / 14

IntroductionExperimental data
Prediction models, design codesFinite element simulations
ConclusionsAcknowledgement
Comparison of prediction models with experiments
For comparison with theexperimental data, the resultswere normalized against thereference size D = 60 mm.
Two alternatives of the ACI209 code provide the bestagreement with experiments.
0.4
0.6
0.8
1
1.2
1.4
60 0 100 200 300 400 500
Siz
e ef
fect
Effective thickness, D [mm]
ACI coefficientACI factor
EC2 option 1EC2 option 2B3/B4 model
6 / 14

IntroductionExperimental data
Prediction models, design codesFinite element simulations
ConclusionsAcknowledgement
Brief description of FE simulations
coupled finite element hygro-mechanical simulations were carried outusing the OOFEM package
humidity transport was described by the Bažant-Najjar constitutivemodel
an advanced model based on the Microprestress-Solidification theory(MPS) was used for solving mechanical problem
the size-effect on drying shrinkage was assessed for six differentalternatives of the MPS model
model parameters were calibrated on experimental data by Bryant andVadhanavikkit (1987)
7 / 14
IntroductionExperimental data
Prediction models, design codesFinite element simulations
ConclusionsAcknowledgement
Rheological scheme of the MPS model
σσ
ε
E0
E1
η1
E2
η2
EM
ηM
SS
S
S
CS
ksh αT
εa εv εf εsh εT
solidification
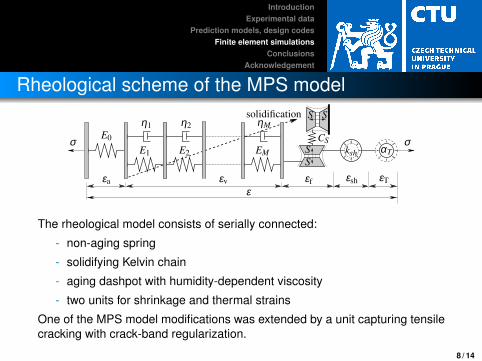
The rheological model consists of serially connected:
- non-aging spring
- solidifying Kelvin chain
- aging dashpot with humidity-dependent viscosity
- two units for shrinkage and thermal strains
One of the MPS model modifications was extended by a unit capturing tensilecracking with crack-band regularization.
8 / 14

IntroductionExperimental data
Prediction models, design codesFinite element simulations
ConclusionsAcknowledgement
MPS model
Simplified formulation of the governing equation for the viscosity η of the aging dashpot
η +1µs
∣∣∣∣ hh
∣∣∣∣ (µsη)p
p−1 =ψs
q4
where h is relative humidity,ψS is a humidity- and temperature-dependent factor,µS is a material parameter with the meaning of fluidity,p is a parameter determining the order of differential equation.
p = 2 ... original formulation – an opposite size-effect on drying creep
p =∞ ... modification 1 – eliminated size-effect on drying creep,
the differential equation becomes linear,
the µs parameter is replaced by a dimensionless factor k3
p = −1.5 ... modification 2 – correct size-effect on drying creep
9 / 14

IntroductionExperimental data
Prediction models, design codesFinite element simulations
ConclusionsAcknowledgement
MPS model
Two other modifications of the MPS model were created by adjustingthe parameter ksh, desribing relationship between rates of shrinkageand relative humidity.The constant value of this parameter used in the original formulationwas replaced by a time-dependent or a humidity-dependent function.
In the last investigated modification, the MPS model with p = ∞ wasextended by the possibility of tensile cracking. However, the influence ofthe formed cracks on humidity transport is not taken into account.
10 / 14

IntroductionExperimental data
Prediction models, design codesFinite element simulations
ConclusionsAcknowledgement
Calibration – basic creep
Calibration of basic creep datafor different times at loading t ′.
Data points correspond to theresults of Bryant’s experiment.
Basic creep parameters werecalibrated only once and thevalues were used for all modi-fications of the MPS model.
20
40
60
80
100
120
10 100 1000 10000
J b (
t) [
10-6
/MP
a]
Age of concrete, t [day]
t′ = 8 dayst′ = 14 dayst′ = 21 dayst′ = 28 dayst′ = 84 dayst′ = 182 days
11 / 14

IntroductionExperimental data
Prediction models, design codesFinite element simulations
ConclusionsAcknowledgement
Calibration – drying shrinkage and drying creepParameters related to the drying shrinkage and drying creep were recalibrated for eachmodification of the MPS model.
The figures show the calibration of the MPS model with eliminated size-effect on dryingcreep (p =∞).
0
100
200
300
400
500
600
700
800
10 100 1000 10000
Shr
inka
ge, ε
sh [×
10-6
]
Age of concrete, t [day]
P 100P 150P 200P 300P 400
0
50
100
150
200
10 100 1000 10000
J d (
t) [×
10-6
/MP
a]
Age of concrete, t [day]
P 100P 150P 200P 300P 400basic
12 / 14
IntroductionExperimental data
Prediction models, design codesFinite element simulations
ConclusionsAcknowledgement
Size-effect obtained from FEM simulations
0.8
0.9
1
1.1
60 0 100 200 300 400 500
Siz
e ef
fect
Effective thickness, D [mm]
MPS - original MPS - modif. 1MPS - modif. 2
0.8
0.9
1
1.1
60 0 100 200 300 400 500
Siz
e ef
fect
Effective thickness, D [mm]
MPS - modif. 1MPS - ksh time dep.MPS - ksh RH dep.MPS with cracking
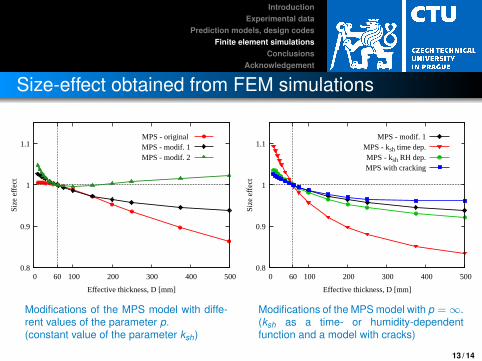
Modifications of the MPS model with diffe-rent values of the parameter p.(constant value of the parameter ksh)
Modifications of the MPS model with p =∞.(ksh as a time- or humidity-dependentfunction and a model with cracks)
13 / 14

IntroductionExperimental data
Prediction models, design codesFinite element simulations
ConclusionsAcknowledgement
Conclusions
the investigated experimental data support the presence of the size-effect on theultimate drying shrinkage, however its accurate evaluation is impossible due tolacking data, especially for larger elements
design codes and prediction models incorporate size-effect in different ways
the standards EC2 and ACI 209 provide good agreement with the experimentalresults, unfortunately the analyzed prediction models either almost (B3, B4) orcompletely (fib MC2010) neglect the size-effect on the ultimate drying shrinkage
the FEM simulations using MPS model give the best overall behavior withp =∞, even though the size-effect is significantly less pronounced compared tothe experimental results
the original MPS formulation (p=2) underestimates the size-effect for smallerspecimens
the MPS model with p =∞ can be improved if the original relationship betweenshrinkage and relative humidity is modified and the shrinkage constant kshbecomes a time-dependent function
14 / 14

IntroductionExperimental data
Prediction models, design codesFinite element simulations
ConclusionsAcknowledgement
Thank you for your attention
Financial support for this work was provided by the Czech Science Foundation(GA CR), project number 19-20666S (Shrinkage-induced deformations andmicrocracking in structural concrete - monitoring, modeling and identification).


![Prediction of autogenous shrinkage in concrete from ... · shrinkage increment follows the same point-wise law as the shrinkage due to external drying [21, 22]. However,modelsreflectingthisfact[6,23–30]require](https://static.fdocuments.us/doc/165x107/5e793775093ce1798b0543d7/prediction-of-autogenous-shrinkage-in-concrete-from-shrinkage-increment-follows.jpg)


